Embed Size (px)
Citation preview
July 2020: ISSUE 122
EV UPTAKE IN THE TRANSPORT FLEET: CONSUMER CHOICE, POLICY INCENTIVES AND CONSUMER-CENTRIC BUSINESS MODELS
CONTENTS
Introduction ...................................................................................................................................................................1
The need for sustainable and persistent incentives for electric vehicles......................................................................3
Scott Hardman and Daniel Sperling
Battery electric vehicles and customers beyond the final consumer ............................................................................6
Ahmad O. Al Khowaiter and Yasser M. Mufti
Driving forward the electric revolution: Considerations for policy .............................................................................. 11
George Beard
The role of incentives in reducing the total cost of ownership of electric vehicles in Delhi, India ..................................... 15
Mandar Patil and Akshima Ghate
Private e-mobility vs e-fleets: Fixing the public charging infrastructure paradox ...................................................... 19
Nicolò Daina
Exploring the adoption potential of electric vehicles and vehicle-to-grid in fleets ..................................................... 22
Toon Meelen and Brendan Doody
The electric car market in the time of coronavirus ..................................................................................................... 25
Pierpaolo Cazzola
EV uptake in the transport fleet – Consumer choice, policy incentives and consumer-centric business models ..... 28
Anupama Sen
List of References ...................................................................................................................................................... 34
1
July 2020: ISSUE 122
OXFORD ENERGY FORUM
INTRODUCTION
This issue of the Oxford Energy Forum follows on from OIES’s third transport workshop, held in Oxford in late 2019. The
workshop focused on three factors that are likely to influence the uptake of electric vehicles (EVs) in the transport fleet:
government policy incentives, consumer choice, and the need for consumer-centric business models.
EVs are still a nascent technology and rely heavily on government incentives. Governments have a range of instruments at their
disposal, from subsidizing EVs to taxing or banning internal-combustion-engine vehicles (ICEVs). These policies are not
equivalent in terms of effectiveness, efficiency, and public acceptability. For instance, consumers may prefer subsidies on EVs
to taxes on ICEVs, but subsidies are inefficient. Similarly, bans on ICEVs may be effective, but may not be publicly acceptable if
they limit consumer choice. This suggests that government incentives and policies to encourage EV uptake need to be designed
with careful consideration of the possible trade-offs between efficiency, effectiveness, and consumer preferences. Meanwhile,
consumer choices take into account not only government incentives but also their own preferences (e.g. for shared mobility or
car ownership) and constraints (e.g. budgets). Understanding the determinants of consumer choice is therefore crucial to
avoiding misalignments between the design of government incentives and consumer preferences. To be viable, transportation-
sector business models need to be consumer-centric – in other words, built around a deep understanding of customers’ needs,
preferences, and values and the contribution that each of these makes to the company’s profitability.
The eight articles in this issue debate different aspects of these fundamental trade-offs and their policy implications.
Scott Hardman and Daniel Sperling argue that there is a need for sustainable and persistent incentives for electric vehicles.
Unlike supply-side regulations, which tend to become more stringent over time, incentives tend to decrease in value over time,
as increasing sales make them more costly for governments. The authors argue that initially this does not appear to be
problematic, as research shows that government-funded programs are having their intended effect on the EV market. However,
government commitment to incentives is wavering because of the increasing cost burden, especially when plug-in EVs (PEVs)
constitute higher percentages of the new-vehicle market. Studies have found as many as 50 per cent of buyers in some markets
would not purchase a PEV without incentives. Thus, if incentives are phased out at a time when consumer adoption still
depends on them, the market is likely to shrink. The authors propose revenue-neutral ‘feebates’ – a combination of fees for
higher-emission vehicles and rebates for lower-emission vehicles – as a solution. They discuss the effectiveness of feebates in
shifting consumer preferences, arguing that feebates could continue to operate even in a 100 per cent battery EV (BEV) market.
Ahmad O. Al Khowaiter and Yasser M. Mufti argue that today’s EVs are designed primarily to satisfy regulatory policies for
reducing greenhouse gas emissions, and only secondarily to meet customer expectations. While these policies have generated
significant financial and capital investments in BEV technologies, they have not stimulated consumer demand commensurate to
these investments. To comply with regulations, automakers have to either significantly reduce the tailpipe emissions of their
ICEVs or introduce an EV model to offset tailpipe emissions and avoid monetary penalties. The authors argue that there is a
mismatch between regulations and consumer preferences. Further, the move to EVs is transferring ownership of a core
technology and competency of automakers – the engine – to the battery supplier, limiting the ability of automakers to take in-
house action to respond to consumer demand. The authors argue that to reach the level of EV sales set by regulators and
create a profitable product, EVs will have to come in a variety of models and classes, with a similar range to and price-
competitive with conventional vehicles, while encouraging consumer interest in the product. Incentives, subsidies, and
regulations alone will not sustain EV market share. With all of these factors considered, the uptake of EVs is not expected to
capture all of the automotive market by 2040 even in the most aggressive projections. Thus, the authors argue, investment in
improved ICEV technologies will continue to help reduce transport-sector greenhouse gas emissions.
George Beard draws on data for the UK to show that continuing growth in mild hybrid EV (MHEV) sales relative to BEVs reflects
continued support for conventional vehicles, as an MHEV cannot be driven with zero emissions at the tailpipe, and its battery
cannot be recharged by plugging in. The author unpacks some key factors influencing the uptake of EVs, drawing on evidence
from choice experiments. These factors include consumer attitudes towards purchasing EVs, which are based not just on
instrumental attributes such as cost, range, and reliability, but also on ‘hedonic’ and ‘symbolic’ attributes. Financial factors are a
key influence – particularly the upfront purchase price, even if the running costs are lower for an EV than for an ICEV, as most
consumers fail to accurately factor in the total cost of ownership (TCO) in their purchasing decisions. Actual and perceived
availability of charging infrastructure also influences adoption. The author infers that while these are barriers to EV adoption,
different consumers prioritize different barriers, and the market can be differentiated on this basis. The author presents a case
for taking a holistic, evidence-based approach to policymaking which considers not just the end goal of increasing consumer
adoption of EVs but also interim objectives that account for the heterogeneity of the EV market.
2
July 2020: ISSUE 122
OXFORD ENERGY FORUM
Akshima Ghate and Mandar Patil investigate the role of incentives on EV uptake among consumers in an emerging market –
India – which is making a move towards clean and sustainable transportation. The authors look at the impact of fiscal incentives
provided by the national and state governments in reducing the Total Cost of Ownership (TCO) of electric cars in Delhi, where
there are six categories of incentives for which an electric car user is eligible, depending on how the car is used. The authors
estimate the TCO (cumulative expenses incurred throughout the life of the vehicle) for four auto fuel technologies (electric,
diesel, petrol, and compressed natural gas) and four ‘use cases’ defined by ownership (individual or firm), registration (private or
commercial), financing (self-financing or loan) and driver (self-driven or paid driver). The article discusses whether EVs (with
and without incentives) are at cost parity with their ICEV counterparts. It demonstrates that the structure and types of incentives
for EV uptake play a crucial role in reducing the TCO of electric cars and helping them achieve cost parity with ICEV
counterparts in Delhi, the study area. It also shows that the electric car market in Delhi is much more attractive for commercial
cars, given their greater daily use. The article concludes that incentives will need to continue in order to encourage EV uptake in
India, but it also highlights a need for EV policies and incentive structures to evolve so that EV sales become self-sustaining,
eventually making it possible to gradually phase out incentives.
Nicolò Daina explores the argument around electric mobility freeing private drivers, who can park off-street at home and charge
overnight, from the need to visit a refuelling station, except during infrequent long trips. The provision of public charging
infrastructure in residential areas is intended to encourage car buyers to switch to EVs as (near) home overnight charging is a
strong consumer preference. However, this ideal vision hardly applies to residents of densely populated metropolitan areas
where a large share of private car drivers do not park their cars on private premises overnight. On the contrary, a
disproportionate focus on residential on-street charging infrastructure creates demand for a product that, while providing
significant benefits for society as a whole, generates marginal benefits to individual consumers. The author argues that this
focus fails to capitalize on the more responsive demand segment of commercial and public-service fleets, the economics of
which also stack up more favourably based on TCO. The author draws on survey evidence to argue that electrification aligns
with the strategic goals of organizations that operate fleets. However, significant barriers exist in terms of high purchase costs
and inadequate infrastructure. The author argues that public charging infrastructure should not be optimized for specific fleet
types. Instead, the author proposes a holistic approach in which the locations, types, and number of public charging stations are
optimally deployed to serve multiple EV use profiles over a specific area, maximizing the use of charging infrastructure by
servicing fleets that are already economically motivated to electrify.
Toon Meelen and Brendan Doody explore the potential for vehicle-to-grid (V2G) technologies for vehicle fleets. V2G is a system
that makes it possible for EV batteries to discharge back to the electricity grid, which is potentially useful for stabilizing the grid
and for integrating renewable energy sources such as solar and wind. Revenues generated with V2G services could also help
accelerate the transition towards electric mobility. The authors make three main points. First, fleets are a potentially useful
application context for V2G for multiple reasons – such as helping with peak shaving, frequency regulation, and renewable
energy storage. Second, the fleet market is highly variegated, based on attributes such as ownership structure, fleet size,
vehicle type, and industry type. Further variety is found in fleet management practices – such as purchasing, financing/leasing,
and day-to-day operations. Third, the fleet market has traditionally been dominated by small and medium enterprises, each of
which operates only a small number of vehicles. Their importance seems to be increasing further, which could pose a barrier for
V2G implementation, as small and medium enterprises face particular barriers in the uptake of sustainable innovations due to
financial capacity and investment constraints. The authors propose three policy strategies to stimulate EV and V2G use in
smaller fleets, which include a rethink of how certain sectors that use fleets are regulated and organized.
Pierpaolo Cazzola reviews the status of electric mobility during the coronavirus pandemic and argues that, although early data
for 2020 suggest that EVs will not be exempt from the impact of COVID-19 on the automotive market, fundamental drivers are
likely to keep the longer-term outlook for the EV market positive – if clean mobility remains a policy priority and economic
stimulus packages reflect the role of electric mobility as a driver of broader innovation. The author discusses a number of factors
which could lead to a short-term contraction of EV sales, possibly even in terms of market share, including delays in the
implementation of policies aiming at transport decarbonization, constraints on consumer borrowing, and prolonged low oil
prices. In the longer term, however, the outlook for EVs remains positive, due to persistent, self-reinforcing cost reductions in EV
production and synergies with government policies and priorities on climate change. The author states that policy should
therefore continue supporting the transition to electric mobility. In the near term, insurance will be important to ensure that a
range of different players – including large, established companies and small, innovative start-ups – continue to operate.
Stimulus packages that are currently in preparation could maintain, reinforce, or introduce measures that foster the transition. In
the longer term, the increased pressure on government revenues could mean that additional fiscal instruments (such as
bonus/malus schemes that tax vehicles based on their environmental performance, as well as distance-based charges for road
use) are adopted to raise revenues to finance the transition.
3
July 2020: ISSUE 122
OXFORD ENERGY FORUM
The issue ends with seven key takeaways from OIES’s third transport workshop, held in late 2019 on EV Uptake in the
Transport Fleet: Consumer Choice, Policy Incentives and Consumer-Centric Business Models, summarized by Anupama Sen.
First, a lack of policy coordination between national and local governments could slow the EV transition, as while national
governments set targets for EV penetration, much of the responsibility for their implementation ultimately falls to local authorities
that act as the main interface with stakeholders. Second, governments have favoured ‘carrots’ over ‘sticks’ when designing
incentives to promote EV uptake – but their targeting has differed in advanced and emerging economies. In advanced
economies with high levels of car ownership, governments provide upfront purchase and other incentives to private passenger
vehicle owners, whereas in emerging markets, incentives are targeted at transport modes that have higher shares in terms of
passenger kilometres. Third, timelines for EV incentive schemes need to be consistent with the minimum timelines required for
auto manufacturing supply chains to adapt. Incentive programmes typically lack long-term time frames, whereas the planning of
auto supply chains requires a minimum of three to five years. Fourth, interoperability of infrastructure is a key objective of
government EV policies but could conflict with business innovation: government policies aim for standardization, while private
companies may need to base their business models on specialization. Fifth, EV uptake policies need to take consumer choice
into account, while also promoting consumer education. Sixth, fleet-based business models provide an opportunity to rapidly
scale up EV use. This is partially due to favourable economics, but also because decisions on EV purchases for fleets made by
fleet managers are likely to be more rational than private EV purchase decisions. Finally, EV policies in advanced economies
need to adopt whole-systems approaches to mitigate externalities beyond the boundaries of their own societies.
THE NEED FOR SUSTAINABLE AND PERSISTENT INCENTIVES FOR ELECTRIC VEHICLES
Scott Hardman and Daniel Sperling
By the end of 2019, over 7.5 million battery electric vehicles (BEVs) and plug-in hybrid electric vehicles (PHEVs) had been sold
globally. The growth of sales is partially a result of government interventions, which typically take the form of supply-side
regulations or demand-side incentives.
Supply-side regulations
Supply-side regulations encourage or require automakers to sell more electric vehicles – in terms of either a percentage of
vehicles sold or the average emissions of vehicles sold. California’s Zero-Emission Vehicle Program, for example, requires
automakers to sell a certain number of zero-emission vehicles – which include BEVs, PHEVs, and hydrogen-fuel-cell vehicles –
with a credit-trading provision (California Air Resources Board, 2020). If automakers generate surplus credits by selling more
than the required number of zero-emission vehicles, they can sell credits to other automakers; and if they have a shortfall in
credits, they can buy credits from those with a surplus or pay a fine.
The European Union sets CO2 emissions standards for new passenger cars and vans. For 2021, this standard is set at an
average of 95g CO2 per km. Automakers are fined per gram of CO2 per km above this target. This regulation (Regulation (EU)
2019/631 of the European Parliament and of the Council) encourages sales of plug-in electric vehicles (PEVs, which include
both BEVs and PHEVs) by counting vehicles with less than 50 g CO2 per km as two vehicles. The same regulation sets targets
for BEV, PHEV, and hydrogen-fuel-cell vehicle sales of 15 per cent by 2025. Some national governments have more aggressive
targets (not yet codified in regulation), such as the United Kingdom, which has targeted 100 per cent PEV sales by 2035.
Demand-side incentives
While supply-side regulations focus on automakers, demand-side initiatives focus on consumers, providing incentives to buy
PEVs. These include financial incentives that discount the purchase price (e.g. the UK Plug-in Car Grant), provide post-
purchase rebates (e.g. the California Clean Vehicle Rebate), give tax credits after purchase (e.g. the United States Federal Tax
Credit), or exempt PEVs from sales tax (e.g. exemption from value-added tax in Norway).
Policymakers’ rationale for incentives is that they reduce the cost of PEVs and thus encourage consumers to buy them. Unlike
supply-side regulations, which tend to become more stringent over time, incentives tend to decrease in value over time, as
increasing sales impose a higher overall cost burden on the government.
Consumer response to incentives
Most academic studies have found that consumer incentives have an impact on electric vehicle sales (Hardman et al., 2017).
According to the research, rebates, tax credits, grants, and tax exemptions are all effective to varying degrees. Studies have

4
July 2020: ISSUE 122
OXFORD ENERGY FORUM
found as many as 50 per cent of buyers would not purchase a PEV without incentives. Initially this does not appear to be
problematic, as research is showing that government-funded programs are having their intended effect on the electric vehicle
market. However, the phase-out of incentives raises problems. If incentives are phased out at a time when consumer adoption
of PEVs is still dependent on incentives, the market would shrink.
Policymakers may be hoping that as the market for electric vehicles grows, fewer buyers will rely on incentives. However, a
recent study from California, one of the more developed PEV markets, showed that each year more consumers are relying on
incentives. Controlling for income and other sociodemographic variables, Jenn et al. (2020) found that PEV buyers in each
successive year from 2010 to 2016 were more likely to report that their purchase decision depended on incentives.
These results show that incentives are becoming more important, and not because lower-income buyers are beginning to
purchase the vehicles. The increase in importance is due to changes in buyers’ attitudes. Early buyers of electric vehicles were
enthusiastic early adopters or innovators who would have made the same purchase without a financial incentive; however, later
buyers have been more pragmatic and less willing to change their behaviour without incentives. While the increasing
importance of incentives was first reported in California, a similar trend is likely in other states and outside of the United States.
Removal of incentives
The increasing importance of incentives over time is problematic because governments’ commitment to incentives is wavering.
In the United States, a federal tax credit of up to $7,500 (£5,744) is available to PEV buyers, but it is limited to 200,000 credits
per automaker. Tesla and Chevrolet have reached this limit, so buyers of their vehicles no longer receive the tax credit.
The state of California recently reduced its BEV rebate from $2,500 to $2,000 (£1,915 to £1,531) and its PHEV rebate from
$1,500 to $1,000 (£1,171 to £780). Furthermore, eligibility for the rebate is becoming more limited as a result of income caps
and vehicle purchase price caps. The rebate has also been plagued with funding issues. Between 2011 and 2019 there were six
periods of 60 to 143 days each when funding was unavailable for incentives, meaning buyers cannot be certain of whether they
will actually receive an incentive.
Incentives are also being reduced in other markets. In the United Kingdom, the plug-in car grant no longer applies to PHEVs,
and the BEV rebate has been reduced from £5,000 to £3,000.
Some buyers will continue to purchase PEVs in the absence of incentives, especially those whose decisions were not
influenced by incentives, such as high-income early adopters. However, the removal of incentives may make a large proportion
of the population unwilling to purchase a PEV.
A sustainable incentive mechanism
Purchase incentives such as rebates or tax credits cannot continue indefinitely, because the cost burden to governments would
be too high, especially when PEVs’ percentage of the new-vehicle market increases. What is needed are incentives that can
persist without negatively impacting government budgets.
One such solution could be ‘feebates’, sometimes known as bonus-malus arrangements, in which a fee (or malus) is charged
on higher-emission vehicles and a rebate (or bonus) is paid for lower-emission vehicles. The fees pay for the rebates, creating a
revenue-neutral system.
Both France and Sweden have introduced feebates. Under France’s system, introduced in 2008, buyers of vehicles emitting
less than 20 g CO2/km (typically BEVs) received a rebate of €6,800 (£5,645), vehicles with 20-60 g CO2/km (typically PHEVs)
received a rebate of €1,100 (£913), and purchasers of vehicles with emissions of 120 g CO2/km or more paid an exponentially
increasing fee capped at €10,500 (£8,717). The French government’s goal has been for this feebate to be revenue neutral.
However, due to difficulties in anticipating consumer and automaker response to the regulation, changes were continually
needed to balance the feebate budget. In 2008–2010 the program resulted in a budget deficit; however, since 2011 the budget
has been balanced or has had a slight surplus (ICCT, 2018).
The more recently introduced system in Sweden is similar to that in France. Buyers are given a bonus of 60,000 Swedish kronor
(£4,746) for BEVs and 10,000 kronor (£791) for PHEVs, and buyers of conventional vehicles pay a fee (over a three-year
period) based on their CO2 emissions (Kong and Hardman, 2019).

5
July 2020: ISSUE 122
OXFORD ENERGY FORUM
Bonus-malus system in France, 2019 (negative numbers indicate rebates and positive numbers indicate fees)
Source: Kong and Hardman, 2019.
Feebates deliver many benefits. In addition to shifting preferences toward lower-emitting vehicles and being revenue neutral,
they make it politically and economically easier to continue strengthening vehicle CO2 and fuel economy standards. This is
because feebates are more equitable than other PEV incentives, which mostly benefit high-income households (because most
BEV and PHEV buyers have a high income). Feebates charge fees to the buyers of expensive less-efficient vehicles (also
purchased by higher-income households) and redistribute these fees to buyers of very low or zero emission vehicles (including
BEVs and PHEVs). Buyers of less expensive low emission (but not zero emission) vehicles which tend to be purchased by
lower- and middle-income households, do not receive a rebate but also do not pay a fee.
Feebates also benefit consumers by solving the problem of conservative consumer purchase behaviour – the tendency to resist
paying more for a more fuel-efficient vehicle, even though the buyer comes out ahead in the long term through large savings in
fuel payments. Finally, feebates ensure that incentives are available for BEVs and PHEVs for the long term, such that
government budgets do not need to be continually reassessed, and buyers have greater certainty of receiving an incentive.
Introducing feebates may be politically challenging in some regions, notably the United States, where vehicle purchase taxes
are tied to the vehicle purchase price and not the vehicle emissions. This makes introducing an incrementally increasing
emissions-based fee for conventional vehicles difficult. Second, existing BEV or PHEV rebates and tax credits are not delivered
at the point of purchase, so cannot function as the rebate part of a feebate. Third, vehicle taxes and PEV incentives are
administered by different government bodies. A feebate, depending on its design, would likely require entirely new legislation.
Some countries may have an easier path to introducing feebates than the United States. The United Kingdom, for example,
already has a vehicle tax (known as vehicle excise duty) that is paid at the point of sale and incrementally increases based on
vehicle emissions. A vehicle with emissions of 91–100 g CO2/km pays £130, and a vehicle with emissions of more than
255 g CO2/km pays £2,135. Second, the UK Plug-in Car Grant is applied at the point of sale. From a consumer perspective, the
UK vehicle tax and electric vehicle grant already looks like a feebate (though with lower fees). It is not budget neutral, however,
which is one reason the BEV grant has fallen from £5,000 to £3,000.
With a BEV market share of 1.6 per cent (the 2019 UK market share), the average vehicle tax payment for new cars would only
have needed to increase by £56 to fund the Plug-in Car Grant. Ideally more of the fees would be collected from more expensive
higher-emitting vehicles. The fee would increase over time as BEVs gain a higher market share, and, at the point where BEVs
have a very high market share, some BEV buyers may also need to pay a fee.
-8,000 €
-6,000 €
-4,000 €
-2,000 €
0 €
2,000 €
4,000 €
6,000 €
8,000 €
10,000 €
12,000 €
0 10 20 30 40 50 60 70 80 90 100 110 120 130 140 150 160 170 180 190 200
Vehicle emissions (gCO2/km)
6
July 2020: ISSUE 122
OXFORD ENERGY FORUM
Even in a 100 per cent BEV market, a feebate could still be used. BEV efficiency differs substantially between vehicle models;
the most efficient BEVs get up to 141 miles per gallon equivalent and the least efficient get 74, according to US government
sources (DOE and EPA 2020). With high BEV market shares, fees could be applied for less efficient BEVs and rebates for more
efficient ones.
Conclusions
The evidence is strong that consumers are conservative in shifting to BEVs and PHEVs. Yet governments need to rein in
funding of incentives for their purchase. To continue reducing the carbon footprint of vehicles (and increasing their efficiency),
substantial PEV incentives will continue to be needed. Feebates may be a necessary and practical way for policymakers to fund
incentives while limiting government expenditure.
BATTERY ELECTRIC VEHICLES AND CUSTOMERS BEYOND THE FINAL CONSUMER
Ahmad O. Al Khowaiter and Yasser M. Mufti
This past decade marked a pivotal transition for battery electric vehicles (EV): the number of EVs on the road increased from a
few hundred at the beginning of the decade to 5 million by the end. A vehicle class that was on few people’s radar only a
decade ago has become the major topic of conversation for every automaker.
Even with this precipitous rise of EV sales, few would argue that the increase in sales is a result of strong consumer demand. In
fact, this article argues that today’s EVs are designed to satisfy regulatory policies first and to meet customer expectations
second. These policies have successfully generated significant financial and capital investments in battery EV technologies;
however, policies have not stimulated consumer demand commensurate with these investments. Ultimately, this suggests a
severe mismatch between regulations and consumer sentiment towards the current EV. While some of the mismatch results
from a lack of consumer knowledge, other aspects are more substantial. Limited affordability, range anxiety, long charging
times, and lack of charging infrastructure are real and non-trivial concerns. The inability to respond to these concerns should be
worrisome for the industry and regulators.
Unlike conventional vehicles, many of the traits limiting EVs are beyond the scope of most automakers, thereby limiting their
ability to respond. Previously, an automaker could take actions to meet consumer demand in-house, but responsibilities for
lower cost and better performance batteries typically fall on battery suppliers. Correspondingly, EV production may also mean
that automakers must relinquish control over one of its major core competencies, engine technology, to battery makers. Over
time, the world will become more aware of EVs, batteries will be improved, and the automotive industry will adapt to new
business practices. In the meantime, for the coming decades, sales of internal combustion engine (ICE) vehicles will remain
significant, and further investment towards improving them will be prudent.
Policy as the primary driver of EV sales
Governments around the world are looking to reduce greenhouse gas (GHG) emissions to combat climate change; for many
developed nations, transport remains a major source of GHG emissions. As such, regulations aim to incentivize the production
of EVs by penalizing the tailpipe emissions of ICE vehicles and shifting tailpipe emissions upstream where, hopefully, carbon-
free electricity can be produced. To comply with these regulations, automakers would have to either reduce the tailpipe
emissions of their ICE vehicles significantly or introduce a subset of EVs to offset tailpipe emissions and avoid monetary
penalties.
Depending on the regulation of transport emissions, it has become increasingly difficult to meet future standards through
improvements of ICE vehicles alone. A major difficulty is the consumer’s preference to purchase ever larger and more powerful
vehicles. If we consider the U.S. Corporate Average Fuel Economy (CAFE) standards for passenger cars and light trucks as an
example, many original equipment manufacturer (OEM) fleets can meet their CAFE targets for model year (MY) 2017 vehicles.
As these targets become more stringent, by 2025 almost no traditional OEMs will be able to meet their targets with their existing
fleet without significant investments and powertrain changes.

7
July 2020: ISSUE 122
OXFORD ENERGY FORUM
Corporate Average Fuel Economy (miles per gallon) for Model Year 2017, compared to 2017 target and 2025 (projected)
targets, for major automakers selling vehicles in the United States
Most policies are technology neutral, which suggests that automakers are free to adopt a number of different vehicle
technologies – including EVs, plug-in-hybrid EVs, and fuel-cell vehicles or hybrid electric vehicles, to meet regulatory standards.
This flexibility has also made it more difficult for OEMs to determine the direction of their investment. However, the direction
became clearer when China approved the New Energy Vehicle (NEV) mandate policy as a part of the 13th Five year plan.
Under the plan, manufacturing of EVs became a key strategy under the Made in China 2025 initiative. Support from the Chinese
government hastened the production of EVs for global automakers, as China is fast becoming the world’s largest auto market.
Modelled after California’s Zero Emissions Vehicle (ZEV) standard, the NEV policy mandates 10 per cent zero-emission
vehicles by 2019 and 12 per cent by 2020, based on a credit system.
Globally, a number of monetary subsidies were also adapted to further incentivize EV growth. Policymakers expect that these
subsidies will help producers to build scale and reduce costs to become price-competitive with ICE vehicles. Early incentives
that offset cost of EVs by as much as 50 per cent bolstered a flurry of EV sales. The subsidy levels correlated well with EV sales
– for example, car sales dropped substantially as soon as subsidies were removed in India and returned with the news that
subsidies would be reinstated. Similar trends were observed in month-over-month sales in China as well.
But despite numerous hefty incentives to offset the cost of batteries, EV sales in 2019 were roughly 2 million or about
2.3 per cent of total light-duty vehicles sold worldwide (insideevs.com and ev-volumes.com). As subsidies waned in 2019, global
EV sales growth slowed substantially. The high elasticity of sales to subsidies implies that consumers are not yet ready to
accept EVs as their mobility solution at current price levels and with current product offerings.
Growing evidence now shows that EV subsidies have not been an effective tool to increase consumer preference, primarily due
to the improper distribution of subsidies. For example, a recent study published by the Treasury Inspector General for Tax
Administration (TIGTA) of the U.S. (https://www.treasury.gov/tigta/auditreports/2019reports/201930072fr.pdf) reported that
$1.44 billion in tax credits was paid to 239,422 claims through 2017 and another $7.5 billion is expected to be paid between
2018 and 2022. Of these claims, a total of 16,510 claims totalling $73.8 million was reported to have been awarded potentially
erroneously. This underscores the inability of these subsidies to target the proper customer group and to increase their
awareness of EVs.
Shifting control from carmakers to battery makers
For most automakers, much of today’s vehicle manufacturing is outsourced to suppliers; major automakers are still responsible
for the design, assembly, and manufacture of engine technologies, enabling cost efficiency without surrendering quality. For
conventional vehicles, core propriety technologies, including engines, are generally wholly owned and manufactured by the
automaker. For EV batteries, the ownership of core technologies has become more diffused and is not proprietary to the
automaker. The move to EVs is transferring ownership of a core technology, the engine, to the supplier with the battery. This
further constrains the ability of automakers to control their product mix to meet consumer and regulatory demand.
20
25
30
35
40
45
50
55
60
65
Daim
ler
FC
A
Fo
rd
GM
BM
W
Hyu
ndai
Kia
Nis
san
Honda
Ma
zda
To
yota
Su
baru
VW
Mitsubis
hi
Passenger cars
2017 2017 target 2025 target
20
25
30
35
40
45
50
55
60
65
GM
Fo
rd
FC
A
Daim
ler
To
yota
Nis
san
BM
W
VW
Kia
Honda
Hyu
ndai
Ma
zda
Su
baru
Mitsubis
hi
Light trucks
2017 2017 target 2025 target
8
July 2020: ISSUE 122
OXFORD ENERGY FORUM
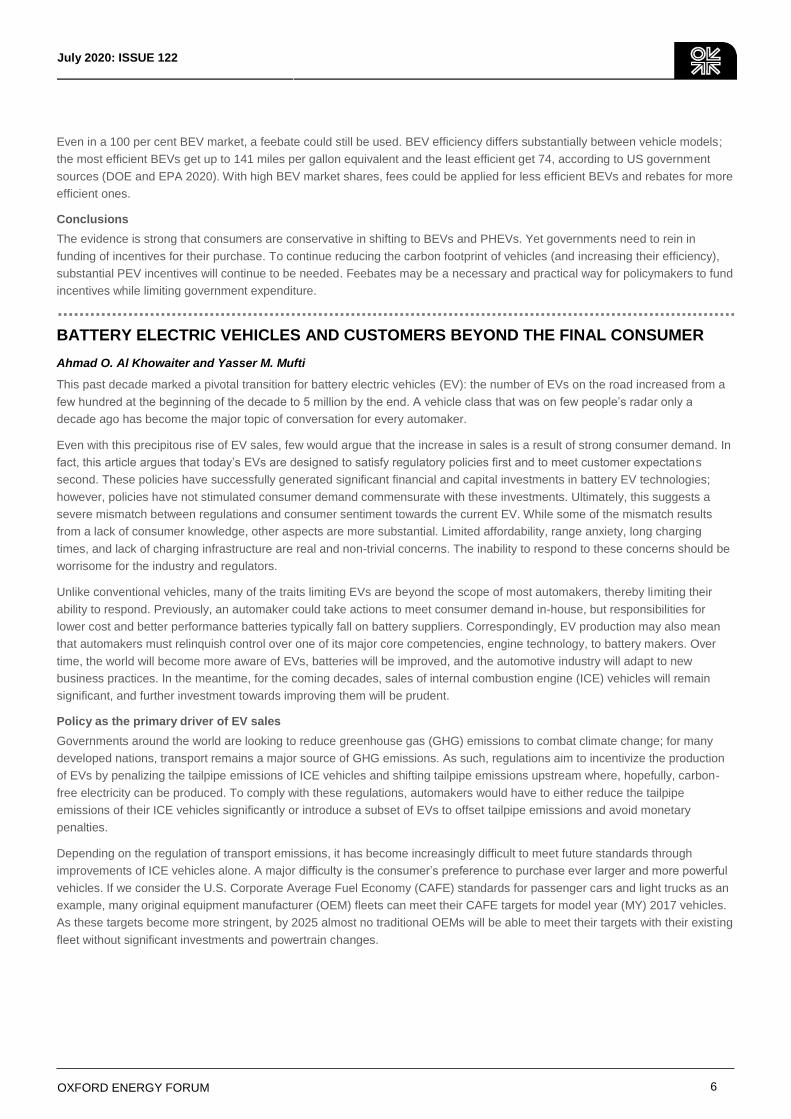
Manufacturing capacity (GWh) for Chinese and non-Chinese battery makers
In 2020, hundreds of major and minor battery suppliers exist around the world; China has the greatest number of battery
manufacturing facilities. An internal Saudi Aramco study on battery technology, based on publicly available information, found
that these suppliers have the capability of supplying up to 200 GWh today; by 2025, the announced production capacity will be
over 700 GWh. Major suppliers such as LG Chem, Panasonic, and CATL will make up over 40 per cent of this production
capacity. LG Chem, for example, one of the largest EV battery producers, has been supplying battery cells to multiple
international automakers, which is a typical OEM–supplier relationship. Unlike other suppliers, future advancements in battery
EVs will be made from innovations in material chemistry and cell manufacturing – core competencies of major battery suppliers.
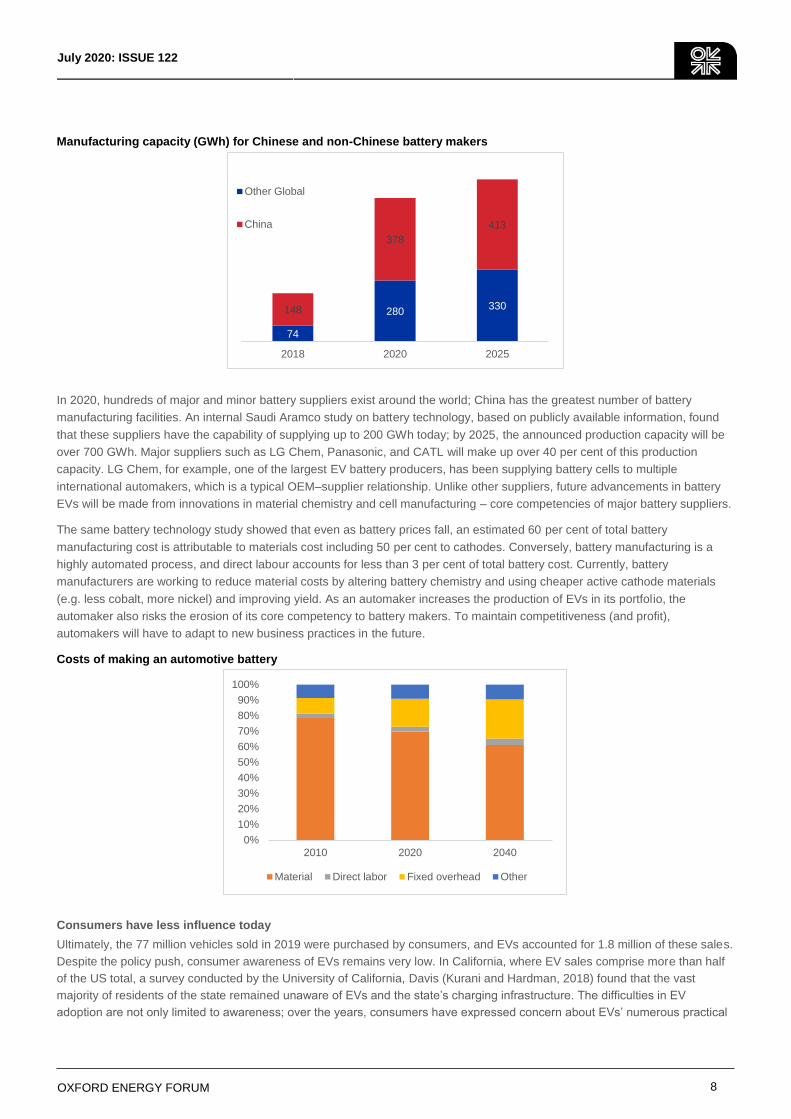
The same battery technology study showed that even as battery prices fall, an estimated 60 per cent of total battery
manufacturing cost is attributable to materials cost including 50 per cent to cathodes. Conversely, battery manufacturing is a
highly automated process, and direct labour accounts for less than 3 per cent of total battery cost. Currently, battery
manufacturers are working to reduce material costs by altering battery chemistry and using cheaper active cathode materials
(e.g. less cobalt, more nickel) and improving yield. As an automaker increases the production of EVs in its portfolio, the
automaker also risks the erosion of its core competency to battery makers. To maintain competitiveness (and profit),
automakers will have to adapt to new business practices in the future.
Costs of making an automotive battery
Consumers have less influence today
Ultimately, the 77 million vehicles sold in 2019 were purchased by consumers, and EVs accounted for 1.8 million of these sales.
Despite the policy push, consumer awareness of EVs remains very low. In California, where EV sales comprise more than half
of the US total, a survey conducted by the University of California, Davis (Kurani and Hardman, 2018) found that the vast
majority of residents of the state remained unaware of EVs and the state’s charging infrastructure. The difficulties in EV
adoption are not only limited to awareness; over the years, consumers have expressed concern about EVs’ numerous practical
74
280330148
378
413
2018 2020 2025
Other Global
China
0%
10%
20%
30%
40%
50%
60%
70%
80%
90%
100%
2010 2020 2040
Material Direct labor Fixed overhead Other

9
July 2020: ISSUE 122
OXFORD ENERGY FORUM
limitations, and many of the problems that have plagued EVs in the past still exist today: high cost, long charging time, limited
range, limited availability of vehicle classes, and limited charging infrastructure. Almost all these problems can be attributed to
the limitations of batteries.
While significant improvements have been made in the past decade, and prices have dropped, specifications for today’s
batteries are still insufficient. To achieve a level of success and profit comparable to conventional vehicles, automakers need to
make EVs that have cost parity, which the US Department of Energy, multiple consultants, and experts assume to be
approximately $100–125/kWh (Nykvist and Nilsson, 2015). Recent announcements from Tesla state that the Tesla battery cell
price should reach $100/kWh at the end of 2020, which is similar to our internal cost projections for volume EV manufacturers.
Our internal projections also show there is a significant difference between low volume battery producers and high-volume
producers. This price also neglects to show whether some smaller automakers can purchase the products low enough to reach
cost parity with conventional vehicles. Due to economies of scale, a high-volume producer such as Panasonic or Tesla, at about
15 GWh, can make a battery pack for $135/kWh, whereas a low-volume producer’s cost may be as high as $275/kWh. This cost
disparity will most likely shift production of batteries to a few large battery suppliers. Since the cost of the battery pack is a
function of kWh price ($/kWh) and pack size (kWh), even as the price of batteries falls on a $/kWh basis, the total cost of a
battery pack in a vehicle is unlikely to fall as automakers will likely shift to larger battery packs to increase performance of the
vehicle or produce a wider range of product offerings.
2019 battery pack costs for different-size producers ($/KWh)
Automakers will be pressured to make longer range and larger size vehicles to compete with conventional vehicles. The range
of conventional vehicles is primarily determined by their fuel economy and the size of the fuel tank. Likewise, Larger vehicles
can be made without sacrificing range because a larger fuel tank can be used for negligible cost increase. Conversely, for EVs,
the range and physical size of the vehicle is determined by the “size” of the battery. This “size” of the battery is, in-turn,
determined by the energy per unit weight or unit volume (fuel economy) coupled with the number of these units (fuel tank size).
To increase the range of an EV, an automaker can either increase the number of battery cells (or unit) of a vehicle or increase
the energy density within each battery cell. Ideally, fewer units, and thus less weight and volume, yield the most desirable
results. The Tesla Model 3 battery, with a range of 240 miles, weighs an impressive 478 kg; comparatively, the Chevy Bolt, with
a similar 256-mile range, is slightly modest at 440 kg. In theory, Tesla or GM could increase the number of battery cells to
achieve a desirable range or vehicle size. Designing and producing a profitable EV will be challenging, given that most vehicles
are constrained by cost; weight and physical size of the battery pack serve as important physical constraints as well.
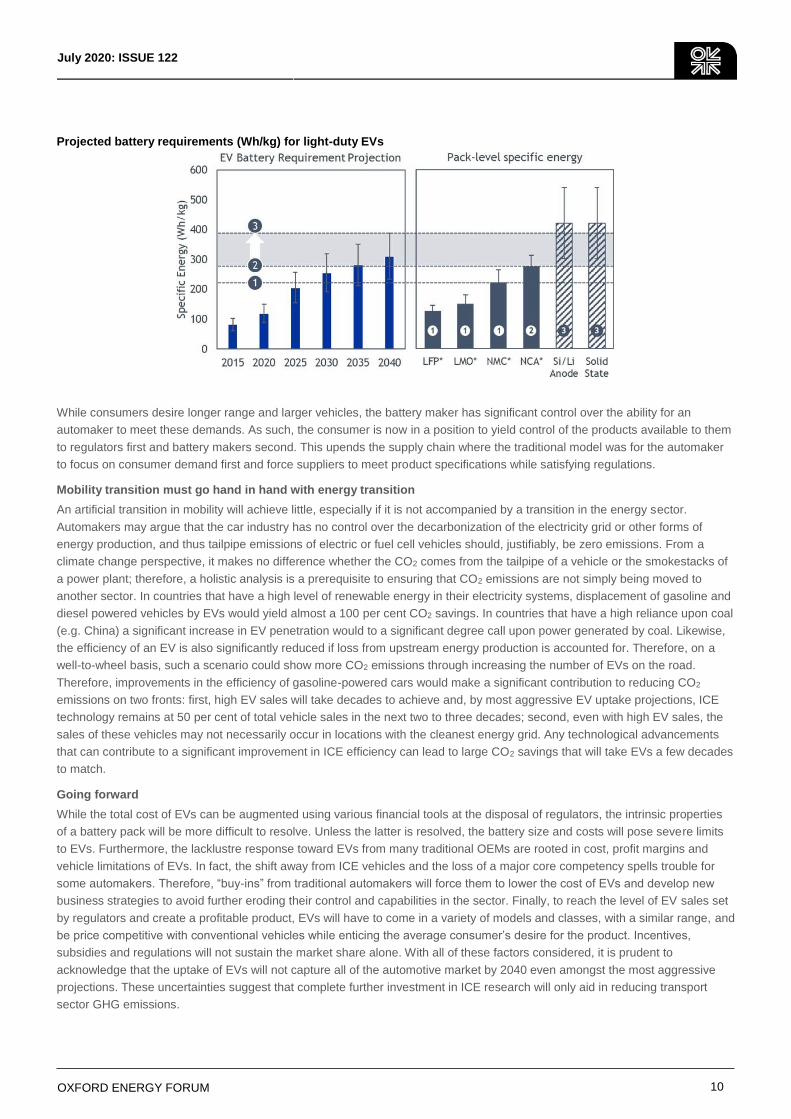
Our internal study found that LG Chem, CATL, and Panasonic have a battery energy density of 170 Wh/kg today; to reach a
vehicle range of 300 miles for large SUVs, these batteries will have to reach an energy density of over 300 Wh/kg. The practical
energy density of nickel-manganese-cobalt based lithium ion battery used by many major OEMs (Tesla uses nickel-cobalt-
aluminium) has a pack-level limit of 250 Wh/kg. By 2035, automakers will have to use some version of solid-state batteries or
lithium ion batteries with some amount of silicon in the anode to meet the size and range demand of larger vehicles.
$0
$50
$100
$150
$200
$250
$300
5 GWh 10 GWh 15 GWh 20 GWh
10
July 2020: ISSUE 122
OXFORD ENERGY FORUM
Projected battery requirements (Wh/kg) for light-duty EVs
While consumers desire longer range and larger vehicles, the battery maker has significant control over the ability for an
automaker to meet these demands. As such, the consumer is now in a position to yield control of the products available to them
to regulators first and battery makers second. This upends the supply chain where the traditional model was for the automaker
to focus on consumer demand first and force suppliers to meet product specifications while satisfying regulations.
Mobility transition must go hand in hand with energy transition
An artificial transition in mobility will achieve little, especially if it is not accompanied by a transition in the energy sector.
Automakers may argue that the car industry has no control over the decarbonization of the electricity grid or other forms of
energy production, and thus tailpipe emissions of electric or fuel cell vehicles should, justifiably, be zero emissions. From a
climate change perspective, it makes no difference whether the CO2 comes from the tailpipe of a vehicle or the smokestacks of
a power plant; therefore, a holistic analysis is a prerequisite to ensuring that CO2 emissions are not simply being moved to
another sector. In countries that have a high level of renewable energy in their electricity systems, displacement of gasoline and
diesel powered vehicles by EVs would yield almost a 100 per cent CO2 savings. In countries that have a high reliance upon coal
(e.g. China) a significant increase in EV penetration would to a significant degree call upon power generated by coal. Likewise,
the efficiency of an EV is also significantly reduced if loss from upstream energy production is accounted for. Therefore, on a
well-to-wheel basis, such a scenario could show more CO2 emissions through increasing the number of EVs on the road.
Therefore, improvements in the efficiency of gasoline-powered cars would make a significant contribution to reducing CO2
emissions on two fronts: first, high EV sales will take decades to achieve and, by most aggressive EV uptake projections, ICE
technology remains at 50 per cent of total vehicle sales in the next two to three decades; second, even with high EV sales, the
sales of these vehicles may not necessarily occur in locations with the cleanest energy grid. Any technological advancements
that can contribute to a significant improvement in ICE efficiency can lead to large CO2 savings that will take EVs a few decades
to match.
Going forward
While the total cost of EVs can be augmented using various financial tools at the disposal of regulators, the intrinsic properties
of a battery pack will be more difficult to resolve. Unless the latter is resolved, the battery size and costs will pose severe limits
to EVs. Furthermore, the lacklustre response toward EVs from many traditional OEMs are rooted in cost, profit margins and
vehicle limitations of EVs. In fact, the shift away from ICE vehicles and the loss of a major core competency spells trouble for
some automakers. Therefore, “buy-ins” from traditional automakers will force them to lower the cost of EVs and develop new
business strategies to avoid further eroding their control and capabilities in the sector. Finally, to reach the level of EV sales set
by regulators and create a profitable product, EVs will have to come in a variety of models and classes, with a similar range, and
be price competitive with conventional vehicles while enticing the average consumer’s desire for the product. Incentives,
subsidies and regulations will not sustain the market share alone. With all of these factors considered, it is prudent to
acknowledge that the uptake of EVs will not capture all of the automotive market by 2040 even amongst the most aggressive
projections. These uncertainties suggest that complete further investment in ICE research will only aid in reducing transport
sector GHG emissions.
11
July 2020: ISSUE 122
OXFORD ENERGY FORUM
DRIVING FORWARD THE ELECTRIC REVOLUTION: CONSIDERATIONS FOR POLICY
George Beard
In the first two quarters of 2020, sales of new vehicles were dramatically impacted by the COVID-19 global pandemic. According
to the Society of Motor Vehicle Manufacturers and Traders, sales of all vehicle types were 51 per cent lower in the period from
January to May 2020 compared with the equivalent timeframe in 2019 (SMMT, 2020). During this extraordinary period, sales of
electric vehicles actually increased, however; zero-emission battery electric vehicles (BEVs) grew 132 per cent, and plug-in
hybrid electric vehicles (PHEVs) grew 13 per cent. Whilst this is encouraging, the public health and economic climate across the
globe is unprecedented, and the long-term impacts on the automotive industry and consumer purchasing behaviours are not yet
known.
Looking at sales figures for 2018 and 2019 allows us to examine longer term trends and remove anomalies caused by COVID-
19. In 2019, overall sales of new vehicles fell by 2.4 per cent compared with 2018. This was largely accounted for by more than
160,000 fewer sales of diesel vehicles, a 21.8 per cent reduction compared with 2018 (SMMT, 2019). The story for electric
vehicles (EVs) was mixed: sales of zero-emission battery electric vehicles (BEVs) grew 144 per cent, but sales of plug-in hybrid
electric vehicles (PHEVs) fell by 17.8 per cent.
Sales of ‘mild hybrid’ diesel vehicles (a relatively new vehicle type), on the other hand, grew a staggering 740 per cent. Sales of
mild hybrid petrol variants also grew by 170 per cent. Together, mild hybrid diesel and petrol vehicles represented 2.5 per cent
of market share in 2019, up from just 0.6 per cent in 2018. In comparison, BEVs accounted for just 1.6 per cent of market share.
Mild hybrid power trains operate with an internal combustion engine and an electric motor. This enables fuel and emissions
savings, as the engine can switch off when stationary or travelling at low speeds, and energy can be recuperated into the
battery during coasting and braking. These benefits are similar to those of PHEVs, but crucially a mild hybrid electric vehicle
(MHEV) cannot be driven with zero emissions at the tailpipe, and its battery cannot be recharged by plugging in. For the
ordinary consumer, therefore, an MHEV provides the same fundamental owning and driving experience as a conventional
internal combustion engine vehicle (ICEV); both are refuelled at filling stations, and there is no need to worry about running out
of electric range or to figure out where to plug the vehicle into a charging point. In this sense, the rapid growth in MHEV sales in
2019 shows continued support for conventional vehicles which are principally powered by fossil fuels. Even more recent figures
during the COVID-19 crisis suggest sales of MHEV continue to increase (SMMT, 2020).
In other words, whilst continued positive growth in EVs is being seen, it remains that most consumers are still choosing the
conventional option. This article discusses the reasons for this and how policymakers can help to tip the balance and encourage
mass-market adoption of EVs in the UK.
Barriers to change
To promote change, it is first necessary to understand the factors that influence consumers’ car purchasing decisions. These
include consumer attitudes, financial and vehicle-related factors, and infrastructure.
Consumer attitudes
Fundamental to the goal of increased EV adoption is an assumption that consumers are willing to replace their conventional
vehicles with EVs. Consumers are not, however, purely rational agents who base their purchasing decisions solely on a
vehicle’s ‘instrumental’ attributes, such as cost, range, reliability, or recharging time (e.g. Graham-Rowe et al., 2012). Also
relevant are consumers’ perceptions of ‘hedonic’ attributes (the emotional experience of owning and using the vehicle) and
‘symbolic’ attributes (the extent to which the vehicle is congruous with one’s sense of self-identity) (Skippon and Garwood,
2011; Graham-Rowe et al., 2012).
Positive perceptions of EVs’ instrumental, hedonic, and symbolic attributes have been shown to be associated with a stronger
intention to purchase (Schuitema et al., 2013). For example, people who perceive BEV drivers to have characteristics much like
their own are more likely to consider owning a BEV (Skippon et al., 2016). In other cases, though, positive attitudes towards
EVs have been shown to be poor predictors of stated intention to adopt (Beard et al., 2019). Positive attitudes may not be
sufficient on their own to stimulate increased adoption, but their role should not be ignored (Schuitema et al., 2013; Skippon et
al., 2016).
12
July 2020: ISSUE 122
OXFORD ENERGY FORUM
Financial factors
The high purchase price of EVs is a commonly cited barrier to adoption (e.g. Brook Lyndhurst, 2015; Kinnear et al., 2017).
Among 200 mainstream consumers who took part in an EV trial, over 85 per cent rated purchase price as either very or
extremely important when considering purchase of a PHEV or BEV (Beard et al., 2019). Generally speaking, EVs are more
expensive than equivalent ICEV models, and this increased upfront cost is a barrier for consumers.
Reduced running costs compared with ICEVs, on the other hand, can be a motivator for adoption (Kinnear et al., 2017). A
choice experiment found that mainstream consumers were willing to pay £4.70 for every £1 saved per year as a result of
reduced costs of running an EV (Beard et al., 2019). This suggests that participants were willing to accept a higher initial upfront
cost if the payback time associated with running cost savings was 4.7 years. In reality, though, whilst the total cost of ownership
for EVs can be favourable compared to ICEVs, most consumers fail to accurately and reliably factor it in when making
purchasing decisions (Biresselioglu et al., 2018).
Data on depreciation rates for EVs is more limited than for ICEVs due to their relatively recent introduction to the market. Some
evidence shows EV depreciation rates can be substantial, and in some cases higher than equivalent ICEV models
(Biresselioglu et al., 2018). Significant negative relationships between vehicle depreciation rate and intention to adopt EVs have
been found (Beard et al., 2019). Here, doubling the perceived rate of depreciation from 40 per cent to 80 per cent of vehicle
value lost over three years led to a reduction in the proportion of study participants reporting they would be Iikely or very likely to
adopt in the next five years from about 70 per cent of the sample to about 5 per cent. This suggests that concerns about EV
depreciation rates can affect adoption.
Vehicle-related factors
The electric range of EVs is a critical barrier for consumers. In Beard et al.’s (2019) trial of EVs, 98 per cent of participants
reported that the electric range of BEVs was either very or extremely important when considering a future BEV purchase. The
electric range of PHEVs was also considered very or extremely important by 83 per cent of participants. Perceived importance
of range is negatively associated with likelihood to adopt a BEV, and the stated intention to adopt increased with increasing EV
range (Beard et al., 2019). When considering a BEV as the main car for the household, 50 per cent of participants said they
would have one with a range of 200 miles, whilst 90 per cent said they would choose a 300-mile BEV.
Recharging an EV takes considerably longer than refuelling an ICEV. Using a standard domestic 2.3 kW three-pin socket can
give a charge time of 15 hours or more. Shorter charge times (typically about 45–60 minutes for an 80 per cent charge) are
possible using a rapid (50 kW) charge point. Ultra-rapid (up to 350 kW) charge points also exist which can achieve shorter
charge durations (e.g. Ionity, 2020), but availability is currently low, and few EV models are compatible.
The long charge times for EVs can be an important barrier to adoption. For example, in the EV trial by Beard et al. (2019), over
60 per cent of study participants were willing to consider a BEV as the main household car if the charge time required to deliver
100 miles of driving was around two hours. About 90 per cent of participants said they would consider one if the charge time
was one hour.
Charging infrastructure
Actual and perceived availability of charging infrastructure also influences adoption. A recent review of the literature concluded
that it is most important to have charging infrastructure at home, followed by the workplace, and then public locations (Hardman
et al., 2018). In a recent choice experiment, participants were willing to pay £564 more for a BEV if there was access to
charging at work, £1,677 more if there was access to public charging, and £1,808 more if there was access to charging both at
work and in public places (Beard et al., 2019). This suggests that consumers place considerable value on the availability of
public charging infrastructure when considering whether to purchase a BEV. However, for PHEVs, the study identified no
statistically significant increase in willingness to pay with access to charging at work or in public, suggesting that availability of
charging infrastructure may have less impact on PHEV adoption.
Designing holistic policy
The relative importance of these multiple and varied barriers to adoption will also vary across the consumer population. Data
can be gathered to understand trends in consumers’ most commonly reported barriers. For example, a public attitudes tracker
administered to about 3,500 consumers by the UK Department for Transport (2019) identified the following top disadvantages of
EVs perceived by consumers:

13
July 2020: ISSUE 122
OXFORD ENERGY FORUM
1. ‘recharging – where/how to charge’ (reported by 41 per cent of the sample)
2. ‘battery: distance travelled on charge’ (38 per cent)
3. ‘not enough charging points’ (32 per cent)
4. ‘cost to buy’ (22 per cent)
5. ‘time taken to recharge’ (11 per cent).
This suggests priority areas for policy to target. However, consumers are not a single homogenous market. One consumer
segmentation model (Anable et al., 2011) used responses to attitudinal statements in a survey with 2,700 participants to classify
individuals into one of eight consumer segments. Each segment represented a combination of self-reported likelihood to adopt a
BEV or PHEV and different perceptions, anxieties, and importance attached to the symbolic, hedonic, and instrumental factors
of car ownership and use. Five key factors were identified which most strongly distinguished the segments:
1. identity – the degree to which individuals feel their identities fit those of ‘typical’ EV owners;
2. anxiety – the perceived suitability of EVs, in particular the driving range and the difficulty associated with plugging in to
charge;
3. parking – the perceived ease of parking and charging an EV at home;
4. willingness to pay a premium for an EV; and
5. symbolic values – individuals’ perceptions of the status and social acceptability associated with owning an EV.
This information suggests that there are diverse barriers to EV adoption and that different consumers weigh these barriers
differently. Thus, a holistic approach is likely to yield the most effective policy interventions. Broad interim policy objectives that
take this diversity into account can best serve the ultimate goal of accelerated EV adoption. Three such objectives are proposed
below.
Objective 1: Consumers have a good understanding of EVs, have positive attitudes towards them, and perceive them
as a good fit with their self-identity.
Raising awareness and understanding of new technologies is key, particularly in the early stages of adoption when use and
knowledge of the technology are not widespread. The ‘diffusion of innovations’ model (Rogers 2003) incorporates the concept of
relative advantage, where for a new technology to be adopted, consumers must perceive that it is superior to the technology it
will replace. For this to occur for EVs, consumers must have an accurate understanding of the vehicles themselves and of the
charging technologies required to power them. Rogers (2003) explained that increased awareness of new technologies can be
achieved through social diffusion, whereby the ‘innovators’ (who are first to adopt) act as sources of knowledge, awareness, and
positive attitudes, and subsequently pass on these attributes to the ‘early adopters’, who in turn diffuse information to the ‘early
majority’, and so on, until mass adoption by mainstream consumers is achieved.
Government and industry interventions which raise awareness and knowledge of EVs may facilitate or supplement the natural
social diffusion process in order to accelerate adoption. Awareness and understanding are a prerequisite for adoption, so
information should be clear and easy to access for consumers (Tietge et al., 2016). Policy measures known as ‘reoccurring
incentives’ can be a good way of increasing consumer awareness of EVs, for example (Tietge et al., 2016). These provide
various perks which consumers can benefit from during their day-to-day use of EVs, including access to bus or transit lanes,
free parking, exemptions from an annual road tax, free access to toll roads, free charging from public charge points, or
discounted access to alternative transport modes (e.g. public transport or hire cars). Whilst these principally benefit current EV
drivers, communication of the benefits to the wider population will help to raise awareness of EVs in non-EV drivers.
Whilst positive attitudes towards EVs are not necessarily a precursor to EV adoption, the role of consumer attitudes should also
not be ignored in the pursuit of mass-market adoption. Interventions which improve individuals’ attitudes towards EVs are likely
to help increase their social desirability and normalize them in society. Gaining experience with EVs can be an effective way of
influencing attitudes. In a trial of both BEVs and PHEVs, attitudes became more positive after consumers had experience with
both types of vehicles (Beard et al., 2019). The greatest positive shifts were seen in instrumental attitudes related to vehicle
performance, including acceleration and driving smoothness. Increasing experience with EVs will also help to improve
awareness and knowledge of how to use and charge EVs.
14
July 2020: ISSUE 122
OXFORD ENERGY FORUM
Reoccurring incentives may also help to make EV ownership a more attractive proposition for consumers. A range of
reoccurring incentives are available in international EV markets including Norway, the USA, Canada, and the Netherlands
(Hardman, 2017). Establishing precise impacts is difficult as these incentives are typically implemented in combination with
financial incentives and other market factors (Kinnear et al., 2017). In a review of the literature, Hardman (2017) found evidence
for a positive impact of bus lane access, parking incentives, toll road exemptions, and road or vehicle tax exemptions, but
impact varied between studies and between markets. No one incentive emerged as having the greatest impact on EV adoption.
This may be due to variations in consumers’ preferences, local environments, and travel habits. For example, the effectiveness
of providing EV drivers in the USA with access to high-occupancy-vehicle lanes depends on how close consumers live to such
lanes and whether they can use them regularly in their daily journeys (Hardman, 2017; Liao, Molin and van Wee, 2017).
Similarly, providing EV drivers with access to bus lanes may only be effective at incentivizing individuals who live in areas with
high traffic congestion (Bjerkan, Nørbech, and Nordtømme, 2016).
Objective 2: Consumers needs are met by the functionality of EVs and supporting charging infrastructure.
Clearly, vehicle functionality is a key factor in purchasing decisions. This includes attributes such as performance, reliability,
size, and payload, but particularly important for EVs are the driving range, charging time, and availability of charging
infrastructure. A clear policy objective here is to drive advancements in battery and vehicle technology to increase driving range
and reduce charging time (whilst also reducing cost). Policy development must also recognize the importance of focused
investment in charging infrastructure; for example, survey results from 20 countries suggested that installation of charging
infrastructure on motorways is essential for increasing EV market share (Lieven, 2015). Managing perceptions of these issues is
just as important as addressing the reality; that is, poor consumer perceptions about the availability of charging infrastructure,
for example, can negatively impact likelihood to adopt an EV, even if the actual availability of charging infrastructure is
adequate.
Objective 3: EVs are affordable for the majority of consumers.
Financial factors which influence likelihood to buy an EV include purchase price, running costs, and vehicle depreciation.
Consumers are most likely to be influenced by purchase price because this cost is clear and understandable. Consumers tend
to place greater weight on costs which affect them immediately, and less weight on costs which will affect them later, a bias
sometimes referred to as ‘temporal discounting’.
Key policy measures to address this barrier are financial purchase incentives, including grants administered at the point of sale,
exemptions from VAT and other purchase taxes, and post-purchase rebates. An assessment of the EV market in the UK,
Germany, France, the Netherlands, and Norway found that countries with higher financial incentives had higher EV market
share (Tietge et al., 2016). Of 35 studies reviewed in a recent analysis (Hardman et al., 2017), 32 found a positive effect of
purchase incentives on EV (and hybrid EV) adoption. Purchase incentives which provide upfront cost reductions, such as grants
or exemptions from purchase taxes, are more effective than rebates, which delay receipt until after the purchase. It is also
important that incentives are applied consistently and not removed prematurely, to promote a stable market for EVs and signal
long-term governmental support (Tietge et al., 2016; Hardman et al., 2017).
Thus, research has provided good evidence for the effectiveness of financial incentives, although the scale of the reported
impact varies widely, and it has not been possible to establish direct causal relationships (Kinnear et al., 2017). Comparisons of
the EV markets in the UK, France, and the Netherlands also shows that financial purchase incentives on their own are not
sufficient to drive adoption; historically, similar incentives have been offered yet growth in market share has differed
considerably (Tietge et al., 2016).
Closing remarks
In its Road to Zero strategy (Department for Transport, 2018), the UK government set out its vision for almost every car and van
to be zero emission by 2050, and to end the sale of conventional petrol and diesel cars and vans by 2040. At the time of writing,
a consultation was underway to assess whether to bring the latter target date forward to 2035 or even earlier (Department for
Transport and Office for Low Emission Vehicles, 2020). At the heart of these aims is the UK’s commitment to bring all
greenhouse gas emissions to net zero by 2050 (Department for Business, Energy & Industrial Strategy, 2019). Light-duty road
vehicles account for about 70 per cent of all transport emissions (Department for Business, Energy and Industrial Strategy,
2020), so transitioning to EVs, particularly zero-emission BEVs, can help to achieve the major reductions in CO2 emissions
needed to meet the net-zero target.

15
July 2020: ISSUE 122
OXFORD ENERGY FORUM
This article presents a case for taking a holistic, evidence-based approach to policymaking which considers not only the overall
goal of increasing adoption of EVs by consumers but also a set of complementary interim objectives. It proposes three broad
objectives, but other objectives could also be effective. The key point is to establish a framework which can enable holistic
interventions to be designed. It is not necessarily a requirement for all objectives to be met for any one policy measure to have
an impact. However, introducing a range of policy measures which target different objectives is recommended to effectively
drive adoption of EVs.
THE ROLE OF INCENTIVES IN REDUCING THE TOTAL COST OF OWNERSHIP OF ELECTRIC VEHICLES IN DELHI, INDIA
Mandar Patil and Akshima Ghate
In India’s transition towards clean and sustainable transportation, increased use of electric vehicles (EVs) is a crucial element.
One major barrier to achieving this goal is the vehicles’ high initial cost. India’s central and state governments have offered
multiple fiscal and non-fiscal incentives to make the economics of owning an EV more attractive.
In Delhi, the focus of this analysis, electric car buyers are eligible for one or more of the following six incentives, depending on
how the car is used:
Goods and services tax (GST) reduction – the GST, based on the ex-factory price of the car, is 5 per cent for electric
cars but 29–31 per cent for internal combustion engine (ICE) cars.
Exemption from road tax and registration charges – this exemption applies to all battery-enabled cars.
FAME (Faster Adoption and Manufacturing of Electric Vehicles) II – under this three-year incentive scheme
implemented by India’s central government, buyers of all commercially registered electric cars with an ex-factory price
below INR 1.5 million ($21,000) are eligible for a subsidy of INR 10,000 ($142) per unit of battery capacity of the vehicle.
Delhi state incentive – all electric cars registered in Delhi, irrespective of their use-case, receive a state government
subsidy of INR 150,000 ($2,131) upfront.
Income tax deduction – the central government provides an income tax deduction of INR 150,000 ($2,131) for up to
three years on the interest paid on loans taken to purchase an EV.
Tax collected at source – all the vehicles sold at an ex-showroom price of more than INR 1 million ($14,200) are
eligible for a rebate of 1 per cent of that price.
To assess the effectiveness of these incentives, we analysed their impact on the total cost of ownership (TCO) – defined by
Ellram (1995) as the price of a purchased good or service plus all other costs related to owning and using it – of EVs and
conventional vehicles in Delhi. The TCO of a vehicle can be interpreted as the expenses incurred by the user throughout the life
of the vehicle.
The analysis was carried out on car models that are comparable in terms of market segment and performance features in four
categories: electric, diesel, petrol, and Compressed Natural Gas (CNG). It considered a variety of use cases, defined by
ownership (individual/firm), registration type (private/commercial), financing (self-financed/loan), and driver type (self-driven/paid
driver). It estimated TCO for the different use cases and car types and examined whether electric cars (with and without
incentives) are at cost parity with their ICE counterparts.
The following assumptions were made:
The life span of each car was assumed to be 10 years or 300,000 km, whichever came first. Each car was assumed
to have a salvage value at the end of its life; for the electric cars, the salvage value of the battery was assumed
separately.
Vehicle fees and taxes – such as road tax, registration fee, parking fees, and commercial vehicle permits – were
assumed to be those in force in Delhi.
Car prices were taken from a market survey of auto dealers and validated during interviews with stakeholders.

16
July 2020: ISSUE 122
OXFORD ENERGY FORUM
Daily distance driven was assumed to be independent of the car’s fuel technology. All cars in private individual use
were assumed to be driven an average of 30 km per day throughout the life of the car. Cars in commercial use (taxis)
were assumed to travel 160 km per day.
Charging time: For electric cars, the driver/owner was assumed to charge the vehicle at any available opportunities
throughout the day (i.e. “opportunity-based” charging).
Fuel efficiency of all cars was assumed to be 75 per cent of the efficiency claimed in the vehicle specifications
provided by the Original Equipment Manufacturers.
Maintenance and battery replacement cost: Based on stakeholder interviews, the maintenance cost of the electric
cars was assumed to be one-third that of the ICE counterparts. The battery replacement cost was not included in the
maintenance cost of the electric car and was accounted as a separate cost. Replacement batteries in electric cars
were assumed to be of the same technical specifications (like range and capacity) as the original. The cost of the
battery was assumed to decline at a compound annual rate of 8 per cent.
Depreciation was calculated using a straight-line depreciation methodology.
Fuel price: The electricity tariff was assumed to be INR 7/kWh ($0.10/kWh) (based on the Delhi average) and to
decline at a compound annual rate of 3.5 per cent throughout the life of the car (based on the last two years’ trends).
The cost of diesel, petrol, and CNG was assumed to rise by a compound annual growth rate (CAGR) of 2.5 per cent
throughout the life of the vehicle (based on the last three years’ trends). The current average retail prices of diesel,
petrol, and CNG were taken as INR 66/litre, INR 72/litre, and INR 47/kg, respectively.
Parking expenses were assumed to be INR 50 ($0.71) per slot per day and to increase at a rate of 10 per cent
CAGR.
Loan interest rates were assumed (based on interviews with dealerships) to be 15 per cent per year for electric cars
and 10 per cent for ICE cars. Loans were assumed to be repaid in monthly instalments over three years.
Insurance premiums were assumed to be paid in yearly instalments; amounts were taken from market surveys and
expert interviews.
Place of purchase and operation was assumed to be Delhi.
In assessing TCO, costs were broadly categorized as capital expenses (capex) or operational expenses (opex) as follows:
capex – the cost of the car itself, any loan financing, and other upfront costs such as registration tax, road tax, and the
cost of charging infrastructure.
opex – the cost, throughout the life of the car, of fuel, parking, insurance, maintenance and repairs, battery
replacement for electric cars, certifications and permits (e.g. pollution-control certification and taxi permits), tolls, and
any costs associated with hiring a driver.
Expenditures were converted to cash flows, and Net Present Value analysis was conducted to calculate the TCO for each use
case, assuming a discounting rate of 6.75 per cent, which at the time of writing was the rate on 10-year Indian government
bonds and assumed to be an approximation of the “risk-free” rate in India.
The table below shows the results of the analysis for one use case: a car purchased for use as a taxi.
17
July 2020: ISSUE 122
OXFORD ENERGY FORUM
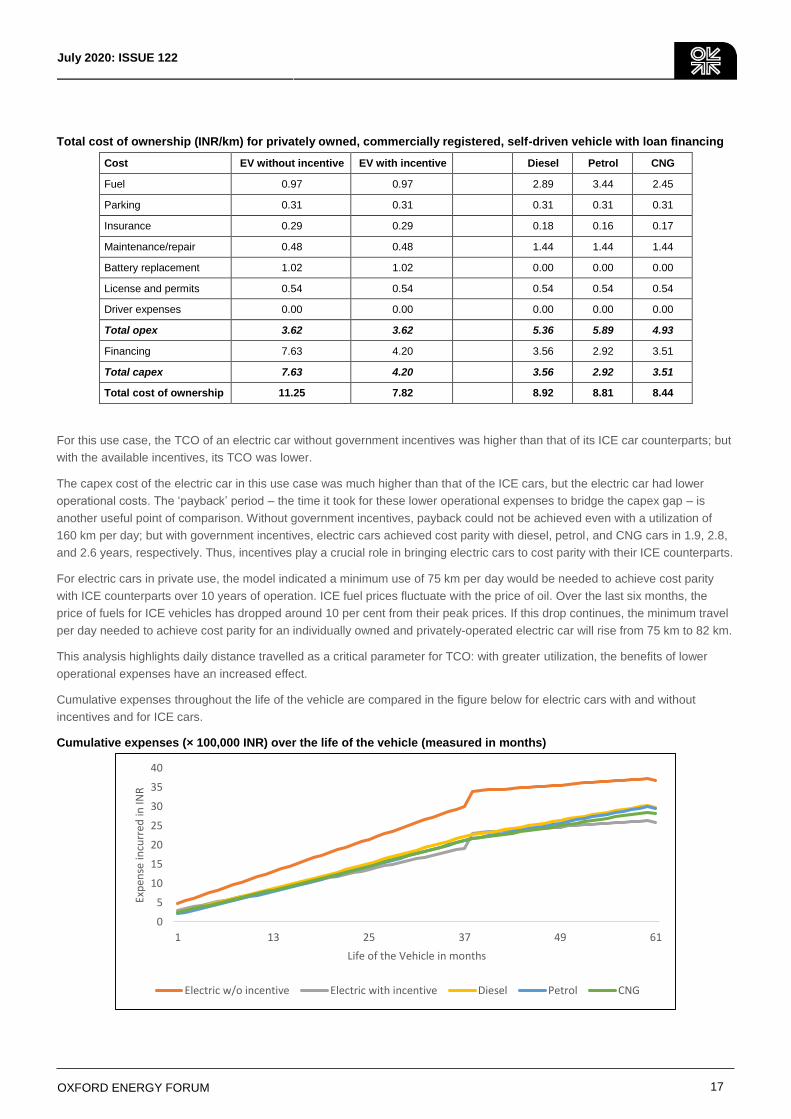
Total cost of ownership (INR/km) for privately owned, commercially registered, self-driven vehicle with loan financing
Cost EV without incentive EV with incentive Diesel Petrol CNG
Fuel 0.97 0.97 2.89 3.44 2.45
Parking 0.31 0.31 0.31 0.31 0.31
Insurance 0.29 0.29 0.18 0.16 0.17
Maintenance/repair 0.48 0.48 1.44 1.44 1.44
Battery replacement 1.02 1.02 0.00 0.00 0.00
License and permits 0.54 0.54 0.54 0.54 0.54
Driver expenses 0.00 0.00 0.00 0.00 0.00
Total opex 3.62 3.62 5.36 5.89 4.93
Financing 7.63 4.20 3.56 2.92 3.51
Total capex 7.63 4.20 3.56 2.92 3.51
Total cost of ownership 11.25 7.82 8.92 8.81 8.44
For this use case, the TCO of an electric car without government incentives was higher than that of its ICE car counterparts; but
with the available incentives, its TCO was lower.
The capex cost of the electric car in this use case was much higher than that of the ICE cars, but the electric car had lower
operational costs. The ‘payback’ period – the time it took for these lower operational expenses to bridge the capex gap – is
another useful point of comparison. Without government incentives, payback could not be achieved even with a utilization of
160 km per day; but with government incentives, electric cars achieved cost parity with diesel, petrol, and CNG cars in 1.9, 2.8,
and 2.6 years, respectively. Thus, incentives play a crucial role in bringing electric cars to cost parity with their ICE counterparts.
For electric cars in private use, the model indicated a minimum use of 75 km per day would be needed to achieve cost parity
with ICE counterparts over 10 years of operation. ICE fuel prices fluctuate with the price of oil. Over the last six months, the
price of fuels for ICE vehicles has dropped around 10 per cent from their peak prices. If this drop continues, the minimum travel
per day needed to achieve cost parity for an individually owned and privately-operated electric car will rise from 75 km to 82 km.
This analysis highlights daily distance travelled as a critical parameter for TCO: with greater utilization, the benefits of lower
operational expenses have an increased effect.
Cumulative expenses throughout the life of the vehicle are compared in the figure below for electric cars with and without
incentives and for ICE cars.
Cumulative expenses (× 100,000 INR) over the life of the vehicle (measured in months)
0
5
10
15
20
25
30
35
40
1 13 25 37 49 61
Exp
ense
incu
rred
in IN
R
Life of the Vehicle in months
Electric w/o incentive Electric with incentive Diesel Petrol CNG
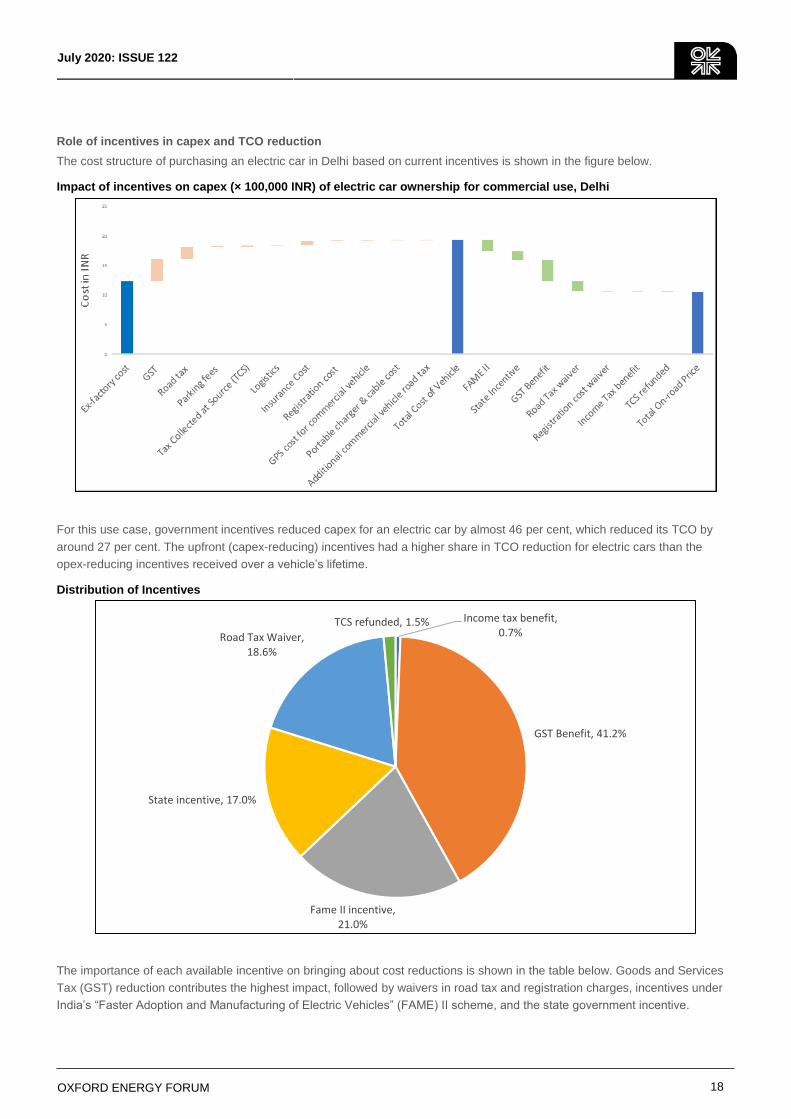
18
July 2020: ISSUE 122
OXFORD ENERGY FORUM
Role of incentives in capex and TCO reduction
The cost structure of purchasing an electric car in Delhi based on current incentives is shown in the figure below.
Impact of incentives on capex (× 100,000 INR) of electric car ownership for commercial use, Delhi
For this use case, government incentives reduced capex for an electric car by almost 46 per cent, which reduced its TCO by
around 27 per cent. The upfront (capex-reducing) incentives had a higher share in TCO reduction for electric cars than the
opex-reducing incentives received over a vehicle’s lifetime.
Distribution of Incentives
The importance of each available incentive on bringing about cost reductions is shown in the table below. Goods and Services
Tax (GST) reduction contributes the highest impact, followed by waivers in road tax and registration charges, incentives under
India’s “Faster Adoption and Manufacturing of Electric Vehicles” (FAME) II scheme, and the state government incentive.
Income tax benefit, 0.7%
GST Benefit, 41.2%
Fame II incentive, 21.0%
State incentive, 17.0%
Road Tax Waiver, 18.6%
TCS refunded, 1.5%
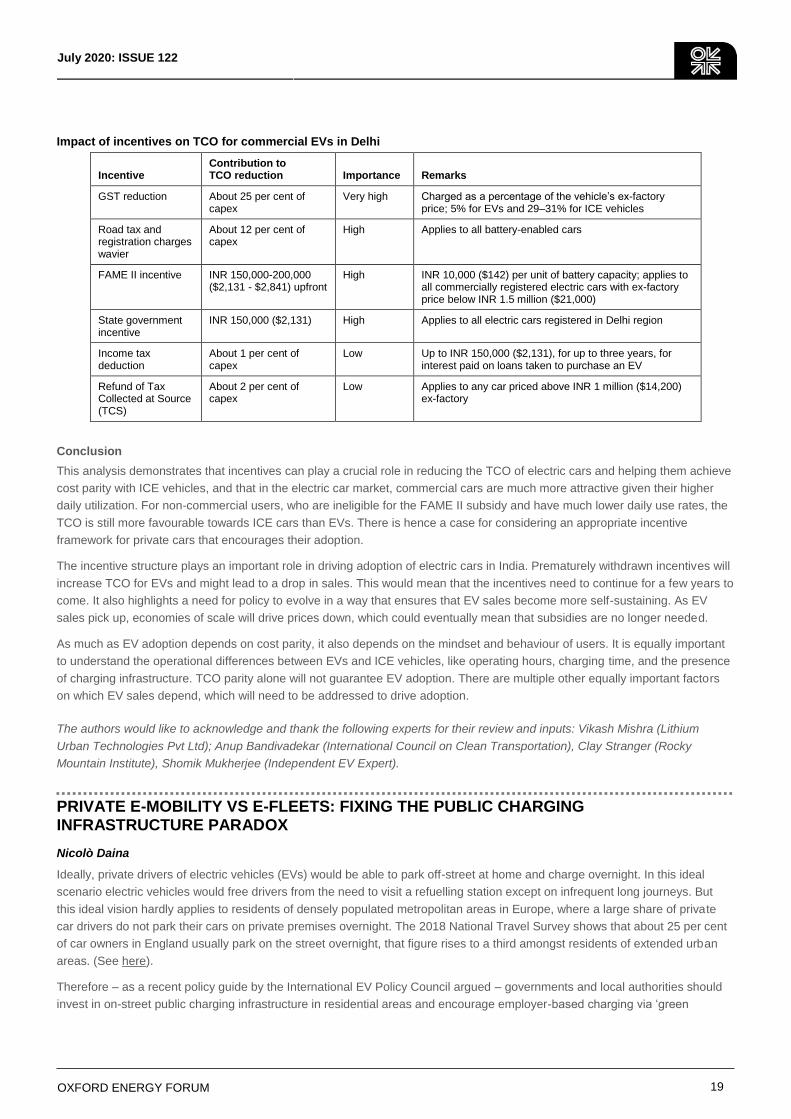
19
July 2020: ISSUE 122
OXFORD ENERGY FORUM
Impact of incentives on TCO for commercial EVs in Delhi
Incentive Contribution to TCO reduction Importance Remarks
GST reduction About 25 per cent of capex
Very high Charged as a percentage of the vehicle’s ex-factory price; 5% for EVs and 29–31% for ICE vehicles
Road tax and registration charges wavier
About 12 per cent of capex
High Applies to all battery-enabled cars
FAME II incentive INR 150,000-200,000 ($2,131 - $2,841) upfront
High INR 10,000 ($142) per unit of battery capacity; applies to all commercially registered electric cars with ex-factory price below INR 1.5 million ($21,000)
State government incentive
INR 150,000 ($2,131) High Applies to all electric cars registered in Delhi region
Income tax deduction
About 1 per cent of capex
Low Up to INR 150,000 ($2,131), for up to three years, for interest paid on loans taken to purchase an EV
Refund of Tax Collected at Source (TCS)
About 2 per cent of capex
Low Applies to any car priced above INR 1 million ($14,200) ex-factory
Conclusion
This analysis demonstrates that incentives can play a crucial role in reducing the TCO of electric cars and helping them achieve
cost parity with ICE vehicles, and that in the electric car market, commercial cars are much more attractive given their higher
daily utilization. For non-commercial users, who are ineligible for the FAME II subsidy and have much lower daily use rates, the
TCO is still more favourable towards ICE cars than EVs. There is hence a case for considering an appropriate incentive
framework for private cars that encourages their adoption.
The incentive structure plays an important role in driving adoption of electric cars in India. Prematurely withdrawn incentives will
increase TCO for EVs and might lead to a drop in sales. This would mean that the incentives need to continue for a few years to
come. It also highlights a need for policy to evolve in a way that ensures that EV sales become more self-sustaining. As EV
sales pick up, economies of scale will drive prices down, which could eventually mean that subsidies are no longer needed.
As much as EV adoption depends on cost parity, it also depends on the mindset and behaviour of users. It is equally important
to understand the operational differences between EVs and ICE vehicles, like operating hours, charging time, and the presence
of charging infrastructure. TCO parity alone will not guarantee EV adoption. There are multiple other equally important factors
on which EV sales depend, which will need to be addressed to drive adoption.
The authors would like to acknowledge and thank the following experts for their review and inputs: Vikash Mishra (Lithium
Urban Technologies Pvt Ltd); Anup Bandivadekar (International Council on Clean Transportation), Clay Stranger (Rocky
Mountain Institute), Shomik Mukherjee (Independent EV Expert).
PRIVATE E-MOBILITY VS E-FLEETS: FIXING THE PUBLIC CHARGING INFRASTRUCTURE PARADOX
Nicolò Daina
Ideally, private drivers of electric vehicles (EVs) would be able to park off-street at home and charge overnight. In this ideal
scenario electric vehicles would free drivers from the need to visit a refuelling station except on infrequent long journeys. But
this ideal vision hardly applies to residents of densely populated metropolitan areas in Europe, where a large share of private
car drivers do not park their cars on private premises overnight. The 2018 National Travel Survey shows that about 25 per cent
of car owners in England usually park on the street overnight, that figure rises to a third amongst residents of extended urban
areas. (See here).
Therefore – as a recent policy guide by the International EV Policy Council argued – governments and local authorities should
invest in on-street public charging infrastructure in residential areas and encourage employer-based charging via ‘green
20
July 2020: ISSUE 122
OXFORD ENERGY FORUM
business programs and air quality programs’(Hardman, S., et al. 2020, Exploring the Role of Cities in Electrifying Passenger
Transportation. Research Reports. UC Davis: Plug-In Hybrid & Electric Vehicle Research Center, available here). Provision of
public charging infrastructure in residential areas is intended to encourage prospective car buyers to switch to EVs, as home or
near-home overnight charging is preferred where possible.
A disproportionate focus on residential on-street charging infrastructure is, however, not unproblematic. First, in the years-long
transition to greater penetration of EVs in urban car stocks, an over-dimensioned on-street public charging infrastructure with
dedicated parking spaces in residential areas will waste space and reduce the parking space for conventional vehicle owners.
This competition for parking space is already causing conflicts and inducing illegal parking. Second, an oversupply of charging
infrastructure in the transition period would make public charging services economically unsustainable, meaning they would
continue to require public investment. These two issues are aspects of the chicken-and-egg problem that arises when demand
must be created for a product that, while providing significant benefits for society, generates marginal benefits for individual
consumers.
A third issue associated with a disproportionate focus on slow residential on-street public charging is that it fails to capitalize on
the potentially much more responsive demand segment of commercial and public services fleets. Fleet electrification makes
economic sense on a total cost of ownership (TCO) basis. However, the lack of adequate charging infrastructure at corporate
fleet depots is a primary concern for fleet managers. To significantly increase EVs in their fleets, organizations need, in most
cases, to upgrade the electrical capacity at their sites, which translates into significant investments and time-consuming
processes riddled with regulatory hurdles.
Government support for public charging infrastructure for fleets exists, but almost only in the form of rapid charging stations for
taxis. Strategies for deploying public charging infrastructure should be revisited to account for multiple use cases, including use
by a broad range of public and commercial fleets.
Fleet electrification
According to the International Energy Agency (IEA), EVs are still not competitive with their conventional counterparts based on
the purchase price without incentives (IEA, 2019, Global EV Outlook 2019, International Energy Agency, Paris, available here).
Purchase price is considered a major barrier for both private drivers and commercial fleets, but it gives only a partial view of this
cost comparison – TCO offers a more comprehensive view, as it combines capital cost with operational costs.
IEA’s analysis showed that TCO per km is lower for EVs than for conventional vehicles, but only for intensively utilized vehicles
– that is, those belonging to commercial or public services fleets. Therefore, based on TCO, electrification makes economic
sense for fleets. According to a 2018 joint study by United Parcel Service (UPS) and Greenbiz, fleet operators tend to agree
with this view (UPS and GreenBiz Group, 2018, Curve Ahead: The Future of Commercial Fleet Electrification, available here).
This study collected views from over 200 organizations, 46 per cent of which were large (that is, with revenues of $1 billion or
above). Of the large organizations interviewed, 64 per cent recognized that fleet electrification makes economic sense on a
TCO basis. UPS itself expects that over a working life of 20 to 25 years, the lower operating costs of EVs will ensure lower TCO
when compared to diesel trucks, as reported in the 2018 Harvard Business Review article ‘Inside UPS’s Electric Vehicle
Strategy’ (Winston, A., 2018, Inside UPS’s Electric Vehicle Strategy. Harvard Business Review. Boston, Harvard Business
Publishing).
Lower TCO by itself does not remove the high purchase price as a barrier to EV electrification. Ability to finance the initial capital
expenditure is still required. For smaller organizations with limited access to capital markets, government incentives and
financing mechanisms will still be needed to address the initial cost hurdle. Lower TCO can, however, open the way to smart
financing by energy service companies, which can operate with similar business models as those they apply in energy-efficiency
projects.
An additional factor weighing substantially in the economic case for fleet electrification is urban air quality regulation. The
combination of air quality and traffic congestion regulatory levers being pulled by local authorities means that it will be
increasingly costly for fleets to operate conventional vehicles in urban areas. In Central London, congestion charge and Ultra
Low Emission Zone (ULEZ) levies add up to a hefty toll, surpassing £20 a day for light-duty vehicles not conforming to ULEZ
standards. As the ULEZ is set to expand in October 2021, London businesses and public authorities operating large fleets view
it as a significant driver of a speedy increase in the penetration of EVs in their vehicle holdings.
21
July 2020: ISSUE 122
OXFORD ENERGY FORUM
Aside from the economic case, organizations are motivated to consider fleet electrification as a means to achieve internal
environmental-sustainability goals. A recent qualitative research study identified corporate social responsibility as a key driver
irrespective of whether vehicle acquisition decisions are taken in a centralized fashion or by ‘users-choosers’ (Skippon, S. and J.
Chappell, 2019, Fleets’ motivations for plug-in vehicle adoption and usage: U.K. case studies, Transportation Research Part D:
Transport and Environment 71: 67-84).
In 2019, a survey of 500 UK-based fleet managers was commissioned as part of E-FLEX, a co-innovation project intended to
demonstrate vehicle-to-grid technology for electric fleets (E-FLEX 2020, Moving towards more sustainable fleet management
with vehicle-to-grid systems, London, available here). Of the surveyed fleet managers, 79 per cent agreed that meeting
environmental and sustainability goals is amongst the key priorities they are tasked to ensure, which traditionally are topped by
safety and vehicle costs. Furthermore, 65 per cent of the interviewees agreed that introducing electric vehicles could help their
business as a whole meet sustainability targets. These findings broadly align with views from large organizations found in the
2018 UPS/Greenbiz study, which identified achieving sustainability goals as the most cited motivating factor for fleet
electrification.
Electrification aligns with the strategic goals of organizations that operate fleets and makes economic sense for them on a TCO
basis. However, significant barriers still exist. The most cited barriers include high purchase costs and inadequate infrastructure.
As pointed out earlier, the initial price barrier can be overcome by combining government incentives with smart financing. But
the inadequate charging infrastructure and electric capacity limits at depots may be much more difficult to address and as such
requires more attention from policymakers.
Charging infrastructure policies seem to require rebalancing. Instead of devoting the largest efforts to slow on-street charging
facilities for overnight residential charging, the deployment of public charging infrastructure should be more strategic and also
address the potential needs of public and commercial fleets with limited capacity at depots.
Inadequate charging infrastructure in fleets’ depots
Amongst the large organizations interviewed for the 2018 UPS/Greenbiz study, 44 per cent cited inadequate charging
infrastructure at their facilities as a barrier to electrification. Of fleet managers participating in the 2019 E-FLEX study, 30
per cent said that their businesses have ‘inadequate infrastructure to cope with the introduction of EVs’. This concern is not, in
this author’s experience, a pretext to justify slow progress in fleet electrification. On the contrary, it a significant practical barrier.
The author is involved in a study intended to identify suitable charging infrastructure pathways to enable a London borough
council to fully electrify in response to the 2021 extension of the ULEZ. The council fleet manager’s main concerns are the
inadequacy of the depot’s electrical capacity and the procedural complexities and investment required to upgrade it.
To maximize the number of EVs that can be charged at a single depot, smart-charging management strategies can be put into
effect. Indeed, smart charging can not only reduce the requirement for infrastructure upgrades but also help to further reduce
the energy costs for fleet operations if the energy is supplied under time-of-day tariffs. Furthermore, smart charging, vehicle-to-
grid, and behind-the-meter services can help to reduce the overall energy costs of depots and potentially generate additional
revenues, as the E-FLEX co-innovation project was set up to demonstrate.
However, for large fleets, smart charging may not be sufficient, and infrastructure upgrades may be too costly to achieve full
electrification. Public charging infrastructure may offer an option for off-site charging of fleets that have limited potential to
develop adequate charging infrastructure at their own facilities.
A multi-user public charging strategy
The provision of public charging infrastructure for commercial and public service fleets should not be limited to the deployment
of rapid charging stations, as has been the case for electric taxis or ride-hailing fleets. Indeed, public charging infrastructure
should not be optimized for specific fleet types. Instead, a holistic approach should be adopted in which the locations, types, and
number of public charging stations serve multiple EV use profiles. Such an approach would maximize the use of charging
infrastructure by servicing fleets that are already motivated and have economic reasons to electrify, without excluding current
and future private EV owners.
The effective costs and benefits of this next-generation public charging infrastructure strategy would need to be evaluated
through desktop studies and demonstrations. Both the practice and the academic literature have largely focused on user-
specific charging infrastructure strategies, so the evidence base for multi-user public charging still needs to be built.
22
July 2020: ISSUE 122
OXFORD ENERGY FORUM
Government-sponsored co-innovation projects involving businesses, public authorities, and transport researchers seem the
appropriate mechanism to carry out such an evaluation and generate transferable blueprints that can be adopted for upscaling
the strategy.
Could a holistic design of public charging networks and smart operations management be created to jointly meet the demand
from diverse organizational fleets and residential users? Could this approach fuel a more rapid transition to EVs in a demand
segment far more ready to electrify than private drivers? Could this alternative path be a faster route to economically
sustainable public charging services, through increased utilization rates? These questions need to be addressed quickly, to
devise accelerated pathways for urban transportation electrification.
EXPLORING THE ADOPTION POTENTIAL OF ELECTRIC VEHICLES AND VEHICLE-TO-GRID IN FLEETS
Toon Meelen and Brendan Doody
Introduction
Carbon dioxide (CO2) emissions from transport have continued to increase despite reductions in other economic sectors. Road
transport is responsible for 19 per cent of European CO2 emissions (EEA, 2019a). The use of electric vehicles (EVs) can help to
reduce CO2 emissions. Vehicle-to-grid (V2G) is a system in which EV batteries return electricity to the grid as needed. This is
potentially useful for stabilizing the grid and integrating renewable energy sources such as solar and wind. Revenues generated
with V2G services could help accelerate the transition towards electric mobility.
Vehicle fleets operated by businesses, government agencies and other organisations are considered a useful context in which
to potentially deploy V2G technology. Despite this, existing studies of V2G have not engaged in-depth with developments in the
fleet market and research on EV adoption has focused primarily on private consumers and paid limited attention to fleets.
At least 50 per cent of new passenger vehicles in Europe are registered by companies, this equates to approximately 8 million
vehicles per year (ACEA, 2019a; EEA, 2019b). Additionally, over 2 million new light goods vehicles (LGVs) were registered in
2019 in Europe (ACEA, 2019b). Although the exact size of the fleet market remains unknown due to definitional issues, it is
clear it will be important in making the transport sector more sustainable.
The remainder of this article makes three points:
1. There are various reasons why fleets are a potentially useful application context for V2G.
2. An understanding of the heterogeneity of the fleet market is needed for successful upscaling of V2G in fleets.
3. An increase in the number of small and medium-sized enterprises (SMEs) in the fleet market could complicate a
transition to EVs and V2G.
Synergies between vehicle-to-grid technologies and fleets
V2G can become an important part of the energy system by allowing for controllable ‘bi-directional electrical energy flow
between a vehicle and the electrical grid’ (Briones et al., 2012, p. 5). In this two-way system, the battery of an EV is charged
from the grid and, if required, the electricity stored in the battery is discharged back into the grid. The main benefits of V2G are
(Briones et al., 2012):
Helping with ‘peak shaving’ and providing grid services such as ‘frequency regulation’ – electricity companies now
have special ‘peaking plants’ to help manage high electricity demand. Having these dedicated plants is costly and
environmentally unsustainable. Assuming that other grid services such as inertia can also be accounted for, these
plants could be replaced by V2G electricity from EV batteries when demand is high. ‘Frequency regulation’ refers to the
ongoing fine-tuning of the frequency of the grid, to which V2G vehicles can contribute by withdrawing and providing
energy.
Renewable energy storage – the amount of energy produced from solar and wind varies and is relatively unpredictable.
V2G can be used to store energy when production is high and feed it back to the grid when it is needed.

23
July 2020: ISSUE 122
OXFORD ENERGY FORUM
V2G could accordingly contribute to a transition to more sustainable and reliable sources of energy and enable cost savings for
grid operators and energy suppliers. Fleet managers and drivers may also benefit financially from the use of their vehicles for
V2G services. Financial benefits may take a number of forms, including reduced energy tariffs and payments for guaranteed
storage capacity at specific locations or times and/or export of electricity into the grid. At present, there is uncertainty about the
effect V2G might have on battery longevity. Multiple trial projects are ongoing around the world to estimate the effects of V2G
use on battery degradation. Depending on the results, owners might also be compensated for possible resale value lost due to
degradation. This is one example of the multiple technical, regulatory, and operational challenges that need to be overcome for
V2G benefits to be realized.
Fleets are often seen as suitable for V2G services for a number of reasons. First, they have scale-related advantages: the
purchase of multiple V2G chargers and vehicles could provide cost savings. A fleet with a substantial number of centrally
managed V2G vehicles is also more likely to meet capacity requirements for providing electricity back to the grid.
Second, there are operational advantages. The controlled environment of a fleet makes it possible to closely monitor V2G
implementation. Fleets also often use telematics software that could be used for combined planning of routes and V2G
charging.
Third, and related, the space-time patterns of fleet use fit well with V2G. Fleet vehicles tend to be used on fixed and limited
schedules. Moreover, they can be stored collectively at depots, facilitating infrastructure installation. The following case study
illustrates the implementation of V2G in a delivery fleet.
Case study: Incorporating V2G into a delivery company’s operations
Some organisations we interviewed as part of the V2GO (Vehicle-to-grid Oxford) project (TSU, 2018) were already starting to
consider how they might implement V2G. One manager noted how he has multiple electric delivery vehicles on his fleet which
arrive back at the depot between 4 and 6 p.m. with about half the battery capacity remaining. The vehicles are then charged
using a smart charging system. An analysis carried out by the firm’s smart charging supplier revealed that the vehicles were
fully recharged by 10 p.m. Thus, the vehicles were charging during the evening, when demand for electricity is highest because
most people return home from work. Given the timing of existing operations and the capacity remaining in the batteries, this
organisation could potentially participate in V2G services. In this scenario, remaining battery capacity would flow into the grid
during the evening peak, helping with peak shaving and reducing demand. The vehicles could then start recharging after
midnight, when demand and energy prices are lowest, and still be fully charged and ready for operation again in the morning.
Variety in the fleet market and fleet management practices
As shown above, there certainly seems to be a fit between certain fleets and V2G applications. The variegated nature of the
fleet market and the diversity of fleet management practices create challenges for upscaling of V2G beyond initial test fleets.
Reliable data on the market is notoriously hard to obtain because of registration problems and the lack of a commonly accepted
definition of what constitutes a fleet. While recognising these limitations, a broad segmentation of the UK fleet market can be
delineated.
The first criterion on which to segment the UK fleet market is ownership structure. In an industry survey of 3,313 fleet managers
in Europe, 45 per cent of UK respondents indicated that they bought their vehicles, 20 per cent had a financial lease, and
33 per cent had an operational lease (CSA, 2018).
Fleet size is another segmentation criterion. There are a few large fleets, such as those operated by the Royal Mail and British
Gas, but as experts interviewed as part of V2GO stressed there is also a very ‘long tail’ with many SMEs operating only a
handful of vehicles.
Considering vehicle type, a distinction can be made between passenger vehicles, LGVs (light goods vehicles) (<3.5 tonnes),
and heavy goods vehicles (HGVs) (3.5 tonnes). Of commercial vehicles, 52.6 percent are passenger vehicles, 34.7 per cent
LGVs, and 9.6 per cent HGVs (DfT, 2018a, 2018b, 2018c).
We can also segment according to the industry in which the vehicle is used. Some data is available for LGVs (vans), in which
the importance of the construction sector stands out (see Table 1).

24
July 2020: ISSUE 122
OXFORD ENERGY FORUM
Table 1. Estimated number and distribution of vans by sector, 2017
Rank Sector Total vans
% of van fleet
1 Construction (new work, repair and maintenance)
587,438 32.1
2 Transport and storage 281,370 15.4
3 Manufacturing 209,133 11.4
4 Wholesale, retail, repair of vehicles 207,023 11.3
5 Agriculture, forestry and fishing 94,906 5.2
6 Other service activities 86,392 4.7
7 Information and communication 62,779 3.4
Source: FTA, 2018, p. 21.
Ownership structure, fleet size, vehicle type, and industry are all likely to influence the use of EVs and V2G. For example, the
number of electric passenger vehicles is currently growing rapidly from a low base, but growth is markedly slower for vans. Of
new LGVs registered in the UK in December 2019, 97 per cent were diesel (SMMT, 2019a).
Further variety is found in fleet management practices – i.e. the different activities involved in operating a vehicle fleet. Over the
course of a fleet cycle, typical fleet management activities are purchasing, financing/leasing, day-to-day operations (e.g. driver
checks, driver support, fuel management, insurance, repair and maintenance), and remarketing and reselling of the vehicle.
Many organisations now outsource some or all aspects of the operation and management of their fleet, largely due to issues of
cost and legal compliance. The number of employees exclusively dedicated to managing vehicles has declined as these
responsibilities have been reallocated to leasing and fleet management companies.
In many organisations, fleet vehicles are the second largest expense after payroll (Venson, 2018). The ‘fleet manager’,
particularly in smaller companies, is often the director or someone from the financial or human resources department who has
limited time allocated to the task of fleet management. This likely has implications for the implementation of EV and V2G in
fleets, as discussed in the next section.
Small and medium enterprises in the fleet market
Traditionally, the fleet market has been dominated by SMEs, each with only a few vehicles. Their importance seems to be
increasing further, which could pose a barrier for V2G implementation. The number of businesses in the UK has grown
considerably, particularly due to a rise in the number of small businesses and self-employed people. Self-employment increased
by 34 per cent between 2008 and 2017 (IPSE, 2017). This increase seems particularly pronounced in sectors with an important
contribution to transport, such as construction and delivery.
In the delivery sector, firms have increasingly adopted a ‘gig-based’ approach in which drivers are self-employed contractors,
many of whom use their own cars and vans. Large firms have also encouraged people to start their own small delivery
businesses (Field, 2019). These sectoral changes have had an effect on fleet statistics. After the financial crisis of 2008, the
number of privately registered vans overtook the number of vans registered by companies. The large majority of these privately
registered vans are in use by self-employed people and SMEs (SMMT, 2019b).
Small businesses face particular barriers to the uptake of sustainability innovations such as EVs and V2G (Demeulenaere,
2019). They tend to have less financial capacity to take risks with new technologies and less ability to invest, for example in
charging infrastructure. SMEs also lack the ability that larger firms have to trial EVs and V2G in vehicles with specific tasks,
particularly those that require less mileage per day.
The absence of a dedicated fleet manager in smaller firms can also form a barrier to EV and V2G use. EVs and, in particular,
V2G are perceived as complex, and it takes time and resources to assess the potential for implementation within an
organization. Moreover, with the increasing number of self-employed drivers, fewer vehicles are stored in depots, as people
take their vehicles home at night. Consequently, the cost and coordination advantages of large-scale V2G installations in depots
could only be realized to a more limited extent.

25
July 2020: ISSUE 122
OXFORD ENERGY FORUM
At least three policy strategies can be employed to stimulate EV and V2G use in smaller fleets:
1. Dedicated intermediary organizations can facilitate knowledge sharing on innovations (an approach that has often
been used in the past); SME-specific subsidies could also be provided.
2. Leasing companies, which increasingly take on fleet management roles and advise on long-term fleet strategies, can
help to promote EV and V2G. Some UK leasing companies already seem to take a proactive approach facilitating EV
use among their clients.
3. A fundamental rethink about what social, economic and environmental impacts the increasing fragmentation of various
sectors might have should it continue unabated. For example, the delivery sector’s increasing reliance on self-
employed individuals and small firms operating at low margins – could suggest changes to the ways in which those
sectors are regulated and organized. This could yield new opportunities for transition towards sustainable innovations
such as EV and V2G.
Conclusion
Vehicle fleets are key for reducing CO2 emissions in transport. V2G technology may become an important part of energy and
mobility systems of the future. By potentially providing additional revenues, V2G may encourage fleet managers to start or
increase the use of EVs within their organization. This could further facilitate the transition to EVs, which appears to be slowly
gaining momentum in the fleet market.
Large depot-based fleets seem highly suitable for V2G. To encourage the uptake of V2G in other parts of the fleet market, it is
important to take into account the variety in the market and in fleet management practices. Barriers to upscaling might arise due
to the increasing number of SMEs in the market, since these organisations are likely to experience more difficulties in adopting
and implementing these technologies. Strategies to stimulate EV and V2G in sectors with many small firms include knowledge
sharing intermediaries, a facilitating role for lease companies, and a more fundamental rethink of the way the sector is
organized and regulated.
THE ELECTRIC CAR MARKET IN THE TIME OF CORONAVIRUS
Pierpaolo Cazzola
The number of electric vehicles (EVs) on the world’s roads continued to grow in 2019. Early data for 2020 show that they will not
be exempt from the impact of COVID-19 on the automotive market. But the persistence of fundamental drivers suggests that the
longer-term outlook for the EV market is likely to remain positive ─ if clean mobility remains a policy priority and economic
stimulus packages reflect the role of e-mobility as a driver of broader innovation.
Consumers have adopted electric cars at a rapidly accelerating pace since the mid-2010s. By the end of 2019, the global
electric car fleet exceeded 7.2 million units, up more than 40 per cent from the previous year. Worldwide sales of EVs in 2019
totalled 2.1 million units, above the record 2018 total.
Global electric car stock, 2010–2019
Data sources: CAAM, 2020a; EAFO, 2020; DOE EERE, 2020; Pontes, 2020; EV-Volumes, 2020; MarkLines, 2020d; Kane, 2020; IEA, 2019.
0
1
2
3
4
5
6
7
8
2010 2011 2012 2013 2014 2015 2016 2017 2018 2019
Mill
ion
s PHEV
BEV
Others
Korea
Japan
North America
Europe
China
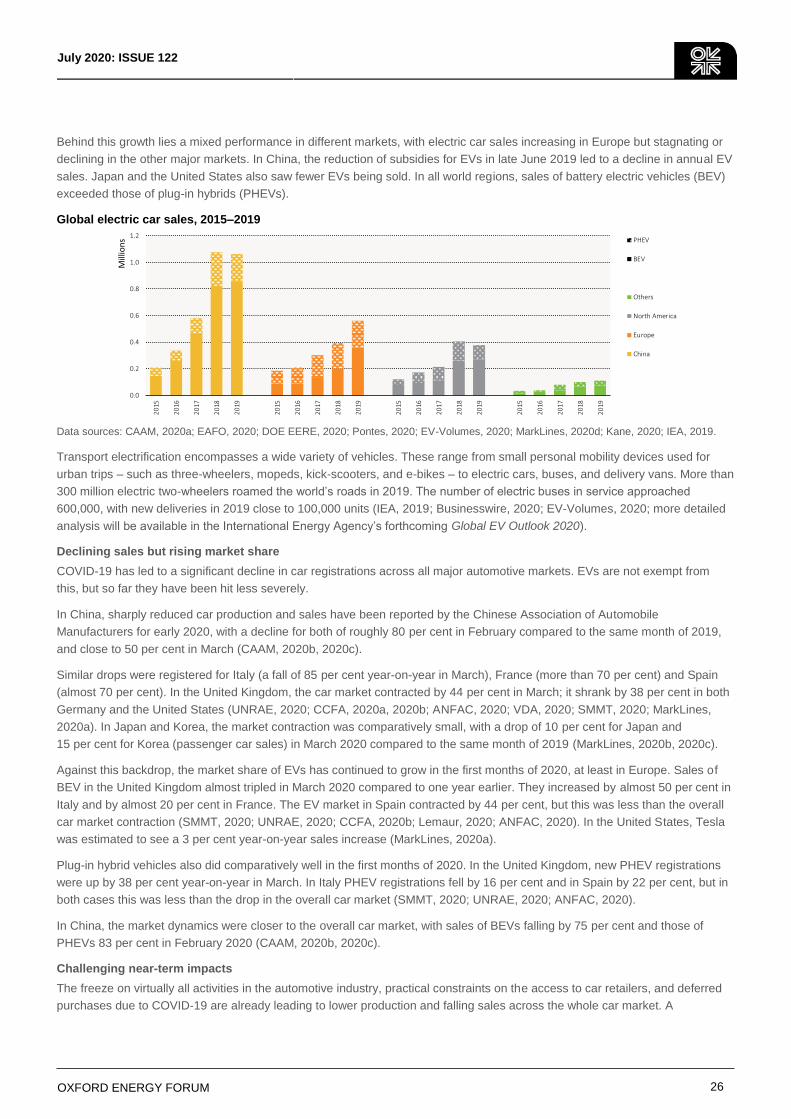
26
July 2020: ISSUE 122
OXFORD ENERGY FORUM
Behind this growth lies a mixed performance in different markets, with electric car sales increasing in Europe but stagnating or
declining in the other major markets. In China, the reduction of subsidies for EVs in late June 2019 led to a decline in annual EV
sales. Japan and the United States also saw fewer EVs being sold. In all world regions, sales of battery electric vehicles (BEV)
exceeded those of plug-in hybrids (PHEVs).
Global electric car sales, 2015–2019
Data sources: CAAM, 2020a; EAFO, 2020; DOE EERE, 2020; Pontes, 2020; EV-Volumes, 2020; MarkLines, 2020d; Kane, 2020; IEA, 2019.
Transport electrification encompasses a wide variety of vehicles. These range from small personal mobility devices used for
urban trips – such as three-wheelers, mopeds, kick-scooters, and e-bikes – to electric cars, buses, and delivery vans. More than
300 million electric two-wheelers roamed the world’s roads in 2019. The number of electric buses in service approached
600,000, with new deliveries in 2019 close to 100,000 units (IEA, 2019; Businesswire, 2020; EV-Volumes, 2020; more detailed
analysis will be available in the International Energy Agency’s forthcoming Global EV Outlook 2020).
Declining sales but rising market share
COVID-19 has led to a significant decline in car registrations across all major automotive markets. EVs are not exempt from
this, but so far they have been hit less severely.
In China, sharply reduced car production and sales have been reported by the Chinese Association of Automobile
Manufacturers for early 2020, with a decline for both of roughly 80 per cent in February compared to the same month of 2019,
and close to 50 per cent in March (CAAM, 2020b, 2020c).
Similar drops were registered for Italy (a fall of 85 per cent year-on-year in March), France (more than 70 per cent) and Spain
(almost 70 per cent). In the United Kingdom, the car market contracted by 44 per cent in March; it shrank by 38 per cent in both
Germany and the United States (UNRAE, 2020; CCFA, 2020a, 2020b; ANFAC, 2020; VDA, 2020; SMMT, 2020; MarkLines,
2020a). In Japan and Korea, the market contraction was comparatively small, with a drop of 10 per cent for Japan and
15 per cent for Korea (passenger car sales) in March 2020 compared to the same month of 2019 (MarkLines, 2020b, 2020c).
Against this backdrop, the market share of EVs has continued to grow in the first months of 2020, at least in Europe. Sales of
BEV in the United Kingdom almost tripled in March 2020 compared to one year earlier. They increased by almost 50 per cent in
Italy and by almost 20 per cent in France. The EV market in Spain contracted by 44 per cent, but this was less than the overall
car market contraction (SMMT, 2020; UNRAE, 2020; CCFA, 2020b; Lemaur, 2020; ANFAC, 2020). In the United States, Tesla
was estimated to see a 3 per cent year-on-year sales increase (MarkLines, 2020a).
Plug-in hybrid vehicles also did comparatively well in the first months of 2020. In the United Kingdom, new PHEV registrations
were up by 38 per cent year-on-year in March. In Italy PHEV registrations fell by 16 per cent and in Spain by 22 per cent, but in
both cases this was less than the drop in the overall car market (SMMT, 2020; UNRAE, 2020; ANFAC, 2020).
In China, the market dynamics were closer to the overall car market, with sales of BEVs falling by 75 per cent and those of
PHEVs 83 per cent in February 2020 (CAAM, 2020b, 2020c).
Challenging near-term impacts
The freeze on virtually all activities in the automotive industry, practical constraints on the access to car retailers, and deferred
purchases due to COVID-19 are already leading to lower production and falling sales across the whole car market. A
0.0
0.2
0.4
0.6
0.8
1.0
1.2
20
15
20
16
20
17
20
18
20
19
20
15
20
16
20
17
20
18
20
19
20
15
20
16
20
17
20
18
20
19
20
15
20
16
20
17
20
18
20
19
Mill
ion
s PHEV
BEV
Others
North America
Europe
China
27
July 2020: ISSUE 122
OXFORD ENERGY FORUM
contraction is also inevitable for EV sales in the short run, possibly even in terms of market shares. A number of factors could
contribute to such a development:
The implementation of regulations and policies aiming at transport decarbonization may be delayed. This was
suggested by European car industry associations in a letter to the European Commission on 25 March, while a
coalition of companies, cities, and civil society organizations opposed the move in a letter dated 16 April (ACEA et al.,
2020; AVERE et al., 2020).
There may be greater constraints on consumer borrowing, and this may hamper EV sales due to higher-than-average
purchase prices. This effect may be limited for EVs because they tend to fall into the premium market segments where
capital-constrained customers are fewer. For two-wheelers, it may be mitigated by the wide variety of models and
purchase prices, especially in China. For buses, this may make it more difficult to justify loans on the basis of lifetime
cost savings.
The recent fall in oil prices following the worldwide introduction of mobility restrictions (aggravated by a supply shock)
has lowered the total cost of driving vehicles using petroleum fuels, which makes EVs less attractive.
Car manufacturers may decide to delay or reduce investments that they had lined up to diversify the offer of EV models
and meet the preferences of a broader range of consumers.
Encouraging longer-term outlook
On the other hand, a number of factors suggest the longer-term outlook for the EV market can remain positive over the next
decade and beyond:
Opportunities for self-reinforcing cost reductions in EV production will persist. These result from the increasing scale of
battery production as well as battery technology improvements and will make it easier for BEVs and PHEVs to
compete with vehicles using internal combustion engines in terms of total cost of ownership (IEA, 2018, 2019).
Governments around the world are expressing strong determination to protect citizens and businesses from the
negative economic impacts of COVID-19, and to provide an economic stimulus to reverse the forced slowdown, and
major financial institutions like the International Monetary Fund are calling for even more global action (Wemer, 2020).
The interest in, and need for, policy action on priority objectives – such as mitigating climate change, improving local
air quality, improving economic productivity, and fostering industrial development – will continue. This is demonstrated
by growing political attention – especially among EU officials (see Piccard and Timmermans, 2020; Shultz, 2020), but
also increasingly in the United States (see Baker et al., 2020) – for the orientation of stimulus packages towards a
recovery that not only provides income and jobs, but also has broader goals, integrates strong climate and biodiversity
action, and builds resilience. These priorities require support for innovation, including industrial progress in the EV and
battery value chains (IEA, 2020a).
Oil prices will progressively increase from their current levels as the global economy recovers from the COVID-19
shock, even if they could remain lower than before the pandemic, at least until the medium term (Tagliapietra, 2020).
Implications of COVID-19 for future e-mobility policy
Like other sectors of the economy, electric mobility requires rapid government interventions to handle the immediate economic
impacts of COVID-19. A specific characteristic of e-mobility is that these interventions concern a variety of stakeholders. These
range from large, established corporations such as car manufacturers, public utilities, and energy companies to small but often
fast-growing companies without stable and substantial cash flows.
In the near term, sticking to policy requirements on clean mobility would help to reduce risks for investments in e-mobility that
have already been made. Derogations or delays and modifications of policy targets would offer advantages for stakeholders that
have not yet taken action. Should derogations or delays be allowed, they should include guarantees that the requirements will
be met in due course.
Economic stimulus packages geared towards decarbonizing transport would benefit e-mobility and could help strengthen the
pace of economic recovery over time. This is because e-mobility, like other energy-efficiency improvements, can improve
economic productivity by reducing the cost of travel, starting with high-mileage vehicles (IEA, 2020b). E-mobility can also be a

28
July 2020: ISSUE 122
OXFORD ENERGY FORUM
driver of innovation, due to its importance as a stimulus for progress in battery technology, which has wider implications for the
clean-energy transition and, more broadly, the growth-enhancing impacts of self-reinforcing innovations.
Increased public debt as a result of stimulus programmes will likely mean that in the mid to long term, policies will need to help
recover government revenues, and not just fulfil policy goals like economic development and clean mobility. This may increase
interest in taxing carbon-intensive fuels, implementing bonus/malus schemes that tax vehicles based on their environmental
performance, and introducing distance-based charges for road use that are well suited to managing a decline of fuel tax
revenues resulting from the decarbonization of transport (OECD, 2019; IEA, 2019).
Conclusions
Recent data on electric mobility developments show that EV numbers continued to rise in 2019, despite mixed performances
across major markets. Early data from 2020 indicate that COVID-19 has hit the EV market much like it has the automotive
market as a whole. Near-term developments induced by the pandemic and the subsequent lockdown suggest that a contraction
is inevitable for EV sales in the short run, possibly even in terms of market share.
Despite this inevitable hit, which is likely to delay EV deployment in terms of its share of the global vehicle stock, the
fundamental drivers of electric mobility remain in place. First among these is the self-reinforcing capacity of cost reductions in
EV production resulting from scale increase in battery production and increased investments already made in battery technology
development. Second is the centrality of EVs as a driver of positive spillovers for the clean energy transition and economy
(which will require increased reliance on electricity storage), thanks to the improved economic productivity that accompanies
energy efficiency.
Policy should therefore continue to support the transition to e-mobility. In the near term, it will be important to ensure that a
range of different players, including large established companies and small innovative start-ups, continue to operate. Stimulus
packages that are currently in preparation should then maintain, reinforce, or introduce measures that foster the e-mobility
transition. In the longer term, the pressure on government revenues could mean that additional fiscal instruments will have to be
adopted to raise revenues to finance the transition.
[This article is based on a policy brief for The International Transport Forum].
EV UPTAKE IN THE TRANSPORT FLEET – CONSUMER CHOICE, POLICY INCENTIVES AND CONSUMER-CENTRIC BUSINESS MODELS
Anupama Sen
The third Oxford Institute for Energy Studies workshop on the impact of disruptive change in the transport sector, held in
October 2019, focused on electric vehicles (EVs). This article summarizes its key takeaways. The full version is available here.
1. Lack of policy coordination between national and local governments could slow the EV transition.
National EV targets are set by national governments and guided by multilateral institutions and international agreements.
Ultimately, however, local authorities are responsible for implementing the targets and interacting with the local residents and
businesses who must adapt to change. The pace of the EV transition is set largely at the local level, so efficient coordination
between national and local levels is imperative. However, local authorities face some barriers to coordination.
First, the needs and preferences of local residents and businesses often temper initial expectations on a policy’s pace or extent.
For example, the planned boundaries of low-emission zones sometimes need to be altered to take into account local business
requirements.
Second, funding of EV initiatives requires better coordination. For instance, the UK’s Road to Zero strategy provides grants for
promoting EV uptake. Yet until recently, local authorities could draw directly on only one scheme, the On-Street Residential
Charge Point scheme, which provided only 75 per cent of required funding. (Funding under the scheme has now increased.)
Fiscal incentives also need coordination. For example, tax incentives for company-owned EVs in the UK were set to be reduced
in 2020, although company fleets are a key driver of EV penetration.
29
July 2020: ISSUE 122
OXFORD ENERGY FORUM
A third barrier relates to EV charging infrastructure, on which there are varying views on the role of local authorities. One
preference is for local authorities to partner with third parties (e.g. private companies) on this – for instance, a scheme is being
trialled in the UK where local district council car parks are offered as overnight charging hubs for residents who do not have off-
road parking. Scalability can be a challenge to public–private partnerships, as local authorities can best administer small or
medium-scale projects and may prioritize areas with the most potential to catalyse change, while private developers may not
find such areas attractive from a business perspective.
Fourth, national EV goals may conflict with local priorities such as reducing traffic congestion. For example, EV promotion could
incentivize greater private vehicle uptake and undermine efforts to promote public transportation. Some local authorities have
worked to align national and local priorities – for example, the UK’s Workplace Charging Levy will utilise funds from parking
charges levied on company parking spots in city locations to improve local public transportation.
Finally, local authorities are often a complex mix of city and district institutions with different yet related policy remits. But rapid
EV uptake requires a coordinated approach which is also aligned with other aspects of local infrastructure planning and
environmental management, as well as the behaviour of local residents and businesses.
2. Governments have favoured ‘carrots’ over ‘sticks’ when designing incentives to promote EV uptake – but their
targeting has differed in advanced and emerging economies.
Governments worldwide have favoured incentives for consumer EV uptake rather than bans on internal-combustion-engine
vehicles (ICEVs). But advanced and emerging economies have differed in three areas: their approach to incentives, the
incentives’ effectiveness, and their longer-term sustainability.
Approach
The types of incentives and the consumer base they target have varied in advanced and emerging economies. Governments in
advanced economies such as the Nordic countries, the UK, and France have set dates for ending sales of new petrol and diesel
vehicles, and have provided upfront incentives aimed at making EVs (or zero emission alternatives) the ‘natural vehicle of
choice’ for private passenger vehicle owners. For example, in California, which is considered one of the more advanced EV
markets, a US-wide $7,500 tax credit for an EV is supplemented by a state ‘clean vehicle rebate’ of $1,500 for a plug-in hybrid
EV or $2,500 for a battery EV, as well as non-fiscal incentives such as exclusive vehicle lane access for EV owners.
In contrast, India, an emerging economy, has targeted incentives at two- and three-wheeler vehicles, taxis, and buses – all of
which provide ‘last mile connectivity’ – rather than at private passenger vehicles, as the focus is to promote shared EVs, and
modes that have high shares in terms of passenger kilometres carried. Incentives are primarily aimed at bringing down the
capital costs of EVs, through federal and state tax exemptions and upfront purchase incentives. Delhi has had the highest tax
exemption for EVs, up to nearly 30 per cent on the ex-factory price – funded at least partly by Delhi’s Air Ambience Fund, which
is derived from a tax on diesel. These measures are supported by other non-fiscal incentives, such as special ‘green’ license
plates, a waiving of commercial permit requirements (e.g. for electric taxis or other commercial transport) and road taxes, and
tax deductions on loans for EVs.
Effectiveness
In advanced economies, incentives may have contributed to income-based inequities in EV ownership, as they do not target the
low- and middle-income consumers who would most need the incentive to consider buying an EV. For instance, a survey of EV
consumers in California concluded that high-income households which are a smaller proportion of consumers, accounted for a
larger proportion of EV purchases relative to middle-income households. While high-income households could access all EV
incentives, they did not consider the incentives essential to their purchase decision.
In contrast, in emerging economies, for example India, incentives are targeted to modes of transport which log the most
passenger kilometres and in which new models can be quickly introduced with the requisite charging infrastructure – two- and
three-wheeler vehicles and buses. There is also an upper cap on the price of EVs eligible for subsidies, to ensure that resources
are not disproportionately allocated to wealthier private owners.
Sustainability
In terms of the sustainability of incentives, advanced and emerging economies face the same issue: EV sales tend to spike
towards the end of the incentive period and then drop sharply, indicating that the market depends heavily on incentives. For
example, California’s Clean Vehicle Rebate has to be continually funded from the general budget, and gaps in funding have
30
July 2020: ISSUE 122
OXFORD ENERGY FORUM
diminished its longer-term effectiveness. Policymakers in many countries are considering exit strategies for EV subsidies, as
incentives cannot be guaranteed in perpetuity given political constraints.
When planning the phaseout of incentives, it is important to ask what threshold would trigger long-term, self-sustaining growth in
the EV market. In the absence of a clear answer (which may differ for different markets), one policy option being explored by
researchers and academics, used in France and Sweden, is the ‘feebate’ – fees for high-emissions vehicles, which fund
rebates for low-emission vehicles. As more EVs are sold, higher fees are imposed on ICEVs to meet the rising cost of rebates.
These fees have to be continuously balanced with the rebates, and thus adjusted upward each year as more EVs are sold and
higher fees need to be imposed on ICEVs.
In emerging markets like India, where feebates are difficult to implement, incentives are used to strengthen local supply chains.
For instance, EV manufacturers have to use local content equivalent to around 50 per cent of the factory price to qualify for
fiscal incentives. In China, there is a policy effort to shift the subsidies provided for EV purchases, towards infrastructure
charging service providers.
3. Timelines for EV incentive schemes need to be consistent with the minimum timelines required for auto
manufacturing supply chains to adapt.
Auto manufacturers (original equipment manufacturers or OEMs) are at the heart of the EV transition – they must meet
increasingly strict standards for fuel efficiency and emissions while developing the technological powertrain necessary to meet
governments’ EV targets, and also meeting the needs and expectations of consumers. As emissions targets have tended to be
technology-neutral, OEMs have developed a range of EV technologies for different customers, expecting that the market will
determine which models are continued. More affordable models (e.g. the Hyundai Kona) tend to be over-subscribed, leading to
long waiting periods for delivery.
Given global climate change mitigation goals, regulatory standards have moved faster than consumers’ buying habits – so
incentives are important in promoting EV uptake. OEM supply chains require at least three years to repurpose existing
technologies and possibly longer to develop new technologies. But incentive timelines are sometimes inconsistent with this
reality. In many countries, EV purchases spike near the end of an incentive scheme and then drop. There is a need for greater
coordination between these two timelines, to allow the industry enough time to bring models onto the market.
Manufacturing supply chains for two- and three-wheelers (e.g. in India) appear to be the exception, with models reaching the
market much more quickly after an incentive scheme is announced. However, the introduction of local-content criteria for
incentives, alongside other regulations, could prove a barrier to increasing EV uptake. In India, where the auto industry has had
to invest heavily to prepare to leapfrog from Euro 4 to Euro 6 efficiency standards, the addition of local content requirements has
led to demands for greater long-term consistency on incentive policies.
4. Interoperability is a key objective of government policies to promote EV uptake, but could also slow innovation
around new business models.
A key element of consumer-centric EV policy is making charging infrastructure widely and easily accessible. Many government
EV policies envision interoperability between EV charging networks – such that drivers would have unconstrained access to
charging in different areas. However, some emerging industry players are developing business models around innovations that
are specific to their companies. While governments may aim for standardization, private initiatives may at least initially require
specialization.
For instance, in many jurisdictions, charge-points and smart-charging operators use proprietary equipment, such as technology
that enables EVs to deliver electricity to the grid. Services can be provided by these EV ‘aggregators’ locally (on-site, to fleet
owners/operators), or at the network level if there is congestion, or at the transmission system level to help balance the grid. EV
aggregators also partner with retail electricity suppliers (e.g. in the UK, California, and France) to allow EV owners to take
advantage of cheaper charging tariffs from these suppliers at specific times of the day or night.
Another version of this model is for aggregators to facilitate the participation of EVs in the frequency regulation market, payment
for which would help lower the cost of ownership. In a sense, these models reduce the need for large, grid-scale storage, and
potentially minimize the need for grid reinforcements by making better use of local resources.
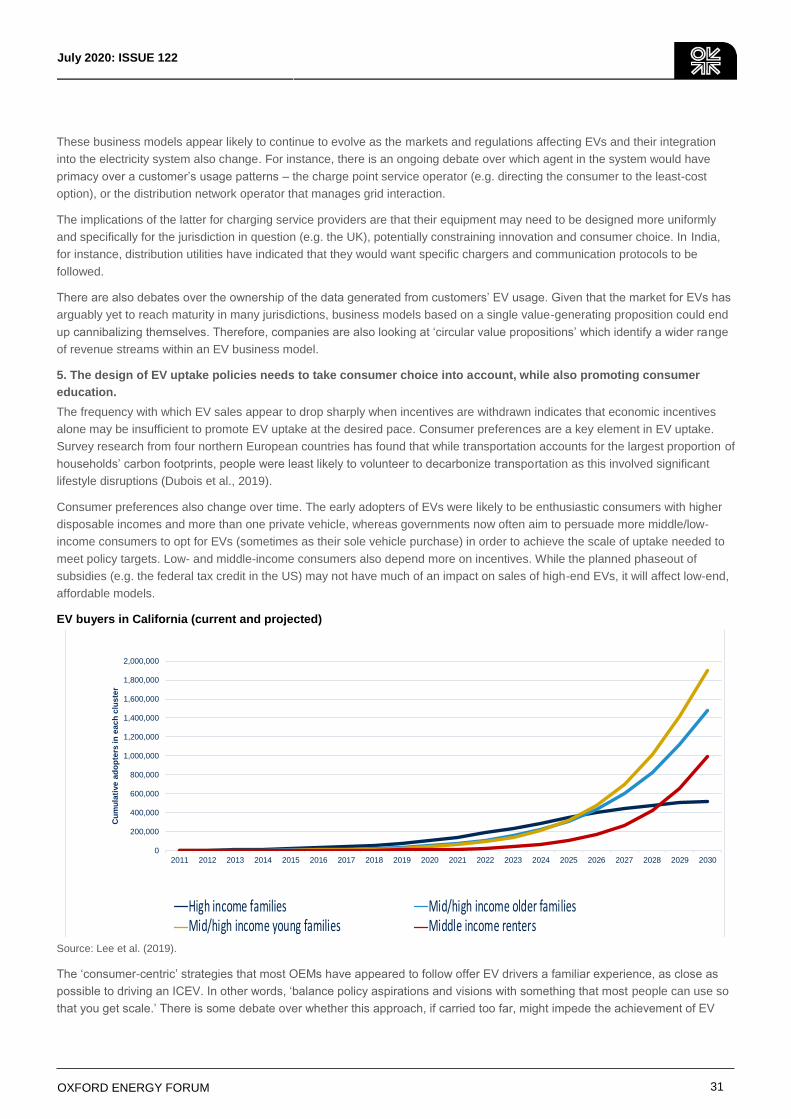
31
July 2020: ISSUE 122
OXFORD ENERGY FORUM
These business models appear likely to continue to evolve as the markets and regulations affecting EVs and their integration
into the electricity system also change. For instance, there is an ongoing debate over which agent in the system would have
primacy over a customer’s usage patterns – the charge point service operator (e.g. directing the consumer to the least-cost
option), or the distribution network operator that manages grid interaction.
The implications of the latter for charging service providers are that their equipment may need to be designed more uniformly
and specifically for the jurisdiction in question (e.g. the UK), potentially constraining innovation and consumer choice. In India,
for instance, distribution utilities have indicated that they would want specific chargers and communication protocols to be
followed.
There are also debates over the ownership of the data generated from customers’ EV usage. Given that the market for EVs has
arguably yet to reach maturity in many jurisdictions, business models based on a single value-generating proposition could end
up cannibalizing themselves. Therefore, companies are also looking at ‘circular value propositions’ which identify a wider range
of revenue streams within an EV business model.
5. The design of EV uptake policies needs to take consumer choice into account, while also promoting consumer
education.
The frequency with which EV sales appear to drop sharply when incentives are withdrawn indicates that economic incentives
alone may be insufficient to promote EV uptake at the desired pace. Consumer preferences are a key element in EV uptake.
Survey research from four northern European countries has found that while transportation accounts for the largest proportion of
households’ carbon footprints, people were least likely to volunteer to decarbonize transportation as this involved significant
lifestyle disruptions (Dubois et al., 2019).
Consumer preferences also change over time. The early adopters of EVs were likely to be enthusiastic consumers with higher
disposable incomes and more than one private vehicle, whereas governments now often aim to persuade more middle/low-
income consumers to opt for EVs (sometimes as their sole vehicle purchase) in order to achieve the scale of uptake needed to
meet policy targets. Low- and middle-income consumers also depend more on incentives. While the planned phaseout of
subsidies (e.g. the federal tax credit in the US) may not have much of an impact on sales of high-end EVs, it will affect low-end,
affordable models.
EV buyers in California (current and projected)
Source: Lee et al. (2019).
The ‘consumer-centric’ strategies that most OEMs have appeared to follow offer EV drivers a familiar experience, as close as
possible to driving an ICEV. In other words, ‘balance policy aspirations and visions with something that most people can use so
that you get scale.’ There is some debate over whether this approach, if carried too far, might impede the achievement of EV
0
200,000
400,000
600,000
800,000
1,000,000
1,200,000
1,400,000
1,600,000
1,800,000
2,000,000
2011 2012 2013 2014 2015 2016 2017 2018 2019 2020 2021 2022 2023 2024 2025 2026 2027 2028 2029 2030
Cu
mu
lati
ve
ad
op
ters
in
ea
ch
clu
ste
r
0%
10%
20%
30%
40%
50%
60%
70%
2011 2012 2013 2014 2015 2016 2017
Pro
po
rtio
n o
f e
ach
clu
ste
r
Year
Year-to-year cluster size
High income families Mid/high income older familiesMid/high income young families Middle income renters
32
July 2020: ISSUE 122
OXFORD ENERGY FORUM
targets, as it prompts false comparisons. Comparisons with ICEVs over specific metrics such as range risk missing the point
and expose a lack of knowledge of EV technologies and usability. Consumers tend to ‘buy much more than they need’ – for
example, wanting an EV with a longer range even though their daily commute is quite short. The longer range requires a larger
battery, which adds to the cost of an EV, which could act as a disincentive to purchase.
Range expectations can be managed in other ways – for instance, through policies supporting better consumer education.
China’s New Electric Vehicle policy reportedly has a consumer education component. Dealerships also need to be trained to
provide accurate information to consumers, particularly to assuage any concerns around ‘a new technology with a potentially
unknown residual value’. In China, new EV manufacturers (such as Nio) have focused heavily on marketing and after-sales
services – offering buyers a lifestyle experience based on an upmarket club membership which includes managing the charging
of the car through a network of battery-swapping stations with quick turnaround times. Arguably, such models have yet to
achieve full profitability.
As climate change mitigation deadlines grow nearer, will governments enact policies which override consumer choice? Past
attempts to use policy to push consumers into making environmentally desirable choices have provoked public opposition – not
least because the larger objectives may not have been communicated clearly.
Another way to improve the alignment between EV policy targets and consumer preferences may be to ‘bind consumer
decisions within certain scripted technology’, which effectively moves consumers towards making more environmentally
sustainable decisions about car purchases. For example, care could be taken to prevent rebound effects (such as EV buyers
over-consuming other high-carbon products or services). In other words, policies could be designed to provide constrained
choices within the boundaries of sustainability.
6. Fleet-based business models provide an opportunity to rapidly scale up EVs in an economy.
In the UK, data from auto trading websites tends to show that the demand for second-hand EVs significantly exceeds the
number of units available for sale. The sale of EVs to high-income consumers is one way to make them available to the wider
population, by catalysing the development of infrastructure and markets and eventually making second-hand EVs available.
An alternative, potentially faster route to increasing EV uptake is through commercial vehicle fleets, which can take advantage
of economies of scale. These EVs, too, will eventually be replaced and released into the second-hand EV market.
Fleet EV purchases may be made for other than economic reasons, for instance as part of a corporate social responsibility
program. Commercial EV purchases are likely to be made by fleet managers or their equivalents, and are therefore likely to be
more economically rational than purchases by private individuals.
The economics of fleets and their contribution to rapid EV uptake vary across different markets. For example, roughly 50 per
cent of all cars sold in the UK are fleet vehicles, so this market has a higher potential to impact the EV market. In India, a self-
sustaining business case for a commercial taxi in a fleet may require its use to exceed 100 km a day.
A fleet can be defined as all vehicles employed within a business, irrespective of ownership structure. Fleets vary substantially
depending on the size of the business. Smaller firms are unlikely to have dedicated fleet managers or to actively engage in EV
purchases; mid-sized firms tend to carry out total-cost-of-ownership analysis to assess the economic viability of EVs in their
fleets; and large firms (e.g. logistics providers) tend to think more strategically about EV acquisition, engage in longer-term
scenario modelling, and participate actively in EV trials, especially as they may be affected by low-emission zones in the cities
where they operate. Larger firms also tend to renew their fleets in much shorter time periods (around three to five years) than
smaller firms, and ideally, the alignment of EV incentives and targets for uptake with these turnover periods would boost the
market for second-hand (and more affordable) electric vehicles.
EV uptake by smaller firms could also be boosted by intermediaries – for example, companies leasing EVs to smaller firms
instead of the latter making direct purchases.
Fleet-based approaches could thus help increase EV uptake, but they also face barriers. One barrier is the difficulty of
incentivizing EV uptake in ‘grey fleets’ – employees’ private cars used to conduct business activities (especially in smaller firms).
A second barrier is the presence of requirements for some incentives that put them out of the reach of smaller businesses. For
example, some grants require a business to buy an EV with a battery pack good for 100 miles, which makes the upfront cost
prohibitively expensive regardless of the grant size, and is arguably unnecessary, particularly for fleets providing last-mile
33
July 2020: ISSUE 122
OXFORD ENERGY FORUM
deliveries where journeys average tens rather than hundreds of miles. A significant barrier to scaling up EVs in the second-hand
market is the effect of battery degradation on the residual value of second-hand EVs. With advancements in battery technology,
this is becoming less of a problem, but it may still be a concern for potential buyers of second-hand EVs, and the industry needs
to do more to provide clear information about battery life to consumers.
7. EV uptake policies in advanced economies need to adopt ‘whole systems’ or ‘circular’ approaches to mitigate
externalities beyond the boundaries of their own societies.
An emerging issue in relation to the EV transition is the pressing need to incorporate equity and social justice within it, as
societies among the advanced economies continue to decarbonise. Research has shown that a singular focus on the
decarbonisation of transportation within a society via promoting EV uptake can sometimes create negative externalities. One
example of this is evident in the effect of incentives on EV uptake among high versus low income consumers and arguably the
creation of an ‘elitism’ in transport, privileging one form of transport over others. Rebound effects from ‘consumer-centric’
business models are another example of an externality – when consumers purchase an EV, they may offset the reduction that it
brings about in their carbon footprints through increasing other types of carbon consumption. Research on household attitudes
and behaviour towards decarbonization in selected European countries shows that people were least likely to tolerate more
aggressive reductions – the more revolutionary or meaningful the action (i.e. giving up a car), the less likely a household was to
prefer it (Sovacool et al., 2019).
Externalities can also occur beyond the boundaries of a decarbonizing society in advanced economies – for instance, recent
research on ‘whole energy systems justice’ has shown that Western Europe is decarbonizing precisely because a lot of the
social and environmental costs can be pushed onto other, largely lesser-developed, countries (Sovacool et al., 2019). The
social justice aspect of the EV transition relates therefore not just to the EV per se, but to all stages across the life-cycle of its
production and use, from the extraction of minerals and procurement of materials for battery production, to waste disposal and
recycling.1 Given the disconnect between policies to enable a rapid transition to EVs and the pace of change and adaptation in
consumer behaviour, research suggests that building multiscalar policy mixes in a number of areas (i.e. not just transport, but
also energy, food, buildings, and appliances, among other things) may be necessary– in other words, sustained and
coordinated policy mixes rather than just single policies.
1 An oft-cited example of this angle of the debate is the adverse consequences of rapidly rising demand for lithium and cobalt in on the working conditions of mining workers of the Democratic Republic of Congo – although this is also likely to be exacerbated by poor governance and economic institutions within the country.
34
July 2020: ISSUE 122
OXFORD ENERGY FORUM
LIST OF REFERENCES
The Need for Sustainable and Persistent Incentives for Electric Vehicles, Scott Hardman and Daniel Sperling
California Air Resources Board, 2020, Zero-Emission Vehicle Program, https://ww2.arb.ca.gov/our-work/programs/zero-
emission-vehicle-program.
DOE (US Department of Energy) and EPA (US Environmental Protection Agency). (2020). ‘2020 Tesla Model 3’,
FuelEconomy.gov,
https://www.fueleconomy.gov/feg/PowerSearch.do?action=noform&path=1&year1=2020&year2=2020&make=Tesla&baseMode
l=Model%203&srchtyp=ymm.
DOE (US Department of Energy) and EPA (US Environmental Protection Agency). (2020). ‘Compare side by side’,
FuelEconomy.gov, https://www.fueleconomy.gov/feg/Find.do?action=sbs&id=41393.
Hardman, S., Chandan, A., Tal, G. and Turrentine, T. (2017). ‘The effectiveness of financial purchase incentives for battery
electric vehicles – A review of the evidence’, Renewable and Sustainable Energy Reviews, 80C, pp. 1100–1111
Jenn, A., Lee, J.H., Hardman, S., and Tal, G. (2020). ‘An in-depth examination of electric vehicle incentives: Consumer
heterogeneity and changing response over time’, Transportation Research Part A: Policy and Practice, 132, pp. 97–109.
Yang, Z. (2018). Practical Lessons in Vehicle Efficiency Policy: The 10-Year Evolution of France's CO2-Based Bonus-Malus
(Feebate) System. ICCT. https://theicct.org/blog/staff/practical-lessons-vehicle-efficiency-policy-10-year-evolution-frances-co2-
based-bonus.
Kong, N., and Hardman, S. (2019). Electric Vehicle Incentives in 13 Leading Electric Vehicle Markets, Research Report UCD-
ITS-RR-19-04, Plug-in Hybrid & Electric Vehicle Research Center, Institute of Transportation Studies, University of California,
Davis, https://escholarship.org/content/qt0fm3x5bh/qt0fm3x5bh.pdf.
Battery Electric Vehicles and Customers Beyond the Final Consumer, Ahmad O. Al Khowaiter and Yasser M. Mufti
Gross, E., and Moody, J. (2019). Insights into Future Mobility: A Report from the Mobility of the Future Study, Cambridge, MA:
Massachusetts Institute of Technology, https://energy.mit.edu/wp-content/uploads/2019/11/Insights-into-Future-Mobility.pdf
Henze, V. (2019). Battery Pack Prices Fall As Market Ramps Up With Market Average At $156/kWh in 2019, BloombergNEF.
Inspector General for Tax Administration. (2019). Millions of Dollars in Potentially Erroneous Qualified Plug-In Electric Drive
Motor Vehicle Credits Continue to Be Claimed Using Ineligible Vehicles, Washington, DC: US Treasury,
https://www.treasury.gov/tigta/auditreports/2019reports/201930072fr.pdf.
Kurani, K., and Hardman, S. (2018). ‘Automakers and policymakers may be on a path to electric vehicles; consumers aren’t’,
Greenlight Blog, Institute of Transportation Studies, University of California, Davis, https://its.ucdavis.edu/blog-post/automakers-
policymakers-on-path-to-electric-vehicles-consumers-are-not/.
Nykvist, B., and Nilsson, M. (2015, March). ‘Rapidly falling costs of battery packs for electric vehicles’, Nature Climate Change,
5, pp. 329–332.
Driving Forward the Electric Revolution: Considerations for Policy, George Beard
Anable, J., Kinnear, N., Hutchins, R., Delmonte, E., and Skippon, S. (2011). ‘Consumer segmentation and demographic
patterns’, TRL Published Project Report PPR769, Transport Research Laboratory, Crowthorne, UK.
Beard, G., Durrell, L., Kent, J., Skippon, S., Kinnear, N., Al-Katib, H., Dodson, T., Stewart, A., and Anable, J. (2019).
‘Deliverable D5.2 – Consumer uptake trial report: Mainstream consumers’ attitudes and willingness to adopt BEVs and PHEVs,
Consumers, Vehicles and Energy Integration project’, TRL Published Project Report PPR899, Transport Research Laboratory,
Crowthorne, UK.
Biresselioglu, M. E., Kaplan, M. D., and Yilmaz, B. K. (2018). ‘Electric mobility in Europe: A comprehensive review of motivators
and barriers in decision making processes’, Transportation Research Part A: Policy and Practice, 109, 1–13.

35
July 2020: ISSUE 122
OXFORD ENERGY FORUM
Bjerkan, K. Y., Nørbech, T. E., and Nordtømme, M. E. (2016). ‘Incentives for promoting battery electric vehicle (BEV) adoption
in Norway’, Transportation Research Part D: Transport and Environment, 43, 169–180.
Brook Lyndhurst (2015). Uptake of Ultra-low Emission Vehicles in the UK: A Rapid Evidence Assessment for the Department for
Transport, London: Department for Transport.
Department for Business, Energy and Industrial Strategy and The Rt Hon Chris Skidmore MP. (2019). ‘UK becomes first major
economy to pass net zero emissions law’, https://www.gov.uk/government/news/uk-becomes-first-major-economy-to-pass-net-
zero-emissions-law.
Department for Business, Energy and Industrial Strategy. (2020). ‘Final UK greenhouse gas emissions national statistics’,
https://www.gov.uk/government/collections/final-uk-greenhouse-gas-emissions-national-statistics
Department for Transport. (2018). The Road to Zero: Next Steps towards Cleaner Road Transport and Delivering Our Industrial
Strategy, https://assets.publishing.service.gov.uk/government/uploads/system/uploads/attachment_data/file/739460/road-to-
zero.pdf.
Department for Transport. (2019). Transport and Technology: Public Attitudes Tracker, Wave 3 Summary Report,
https://assets.publishing.service.gov.uk/government/uploads/system/uploads/attachment_data/file/803347/transport-and-
transport-technology-public-attitudes-tracker-wave-3-report.pdf.
Department for Transport and Office for Low Emission Vehicles. (2020). ‘Open consultation: Consulting on ending the sale of
new petrol, diesel and hybrid cars and vans’, https://www.gov.uk/government/consultations/consulting-on-ending-the-sale-of-
new-petrol-diesel-and-hybrid-cars-and-vans.
Graham-Rowe, E., Gardner, B., Abraham, C., Skippon, S., Dittmar, H., Hutchins, R., and Stannard, J. (2012). ‘Mainstream
consumers driving plug-in battery-electric and plug-in hybrid electric cars: A qualitative analysis of responses and evaluations’,
Transportation Research Part A: Policy and Practice, 46, 140–153.
Hardman, S. (2017). Reoccurring and Indirect Incentives for Plug-In Electric Vehicles – A Review of the Evidence, Davis, CA:
Plug-in Hybrid and Electric Vehicle Research Center, Institute of Transportation Studies, University of California, Davis.
Hardman, S., Chandan, A., Tal, G. and Turrentine, T. (2017). ‘The effectiveness of financial purchase incentives for battery
electric vehicles – A review of the evidence’, Renewable and Sustainable Energy Reviews, 80, 1100-1111.
Hardman, S., Jenn, A., Tal, G., Axsen, J., Beard, G., Daina, N. and Plötz, P. (2018). ‘A review of consumer preferences of and
interactions with electric vehicle charging infrastructure’, Transportation Research Part D: Transport and Environment, 62, 508–
523.
Ionity – The Power of 350 kW. (2020). Viewed 1st March 2020, https://ionity.eu/en/design-and-tech.html
Kinnear, N., Anable, J., Delmonte, E., Tailor, A., and Skippon, S. (2017). ‘D2.1 Consumer attitudes and behaviours report’, TRL
Published Project Report PPR839, Transport Research Laboratory, Crowthorne, UK.
Liao, F., Molin, E., and van Wee, B. (2017). ‘Consumer preferences for electric vehicles: A literature review’, Transport Reviews,
37(3), 252–275, doi: 10.1080/01441647.2016.1230794.
Lieven, T. (2015). ‘Policy measures to promote electric mobility – A global perspective’, Transportation Research Part A: Policy
and Practice, 82, 78–93.
Rogers, E. M. (2003). Diffusion of Innovations (5th ed.), New York: Free Press.
Schuitema, G., Anable, J., Skippon, S., and Kinnear, N. (2013). ‘The role of instrumental, hedonic and symbolic attributes in the
intention to adopt electric vehicles’, Transportation Research Part A: Policy and Practice, 48, 39–49.
Skippon, S. M., Kinnear, N., Lloyd, L., and Stannard, J. (2016). ‘How experience of use influences mass-market drivers’
willingness to consider a battery electric vehicle: A randomised controlled trial’, Transportation Research Part A: Policy and
Practice, 92, 26–42.
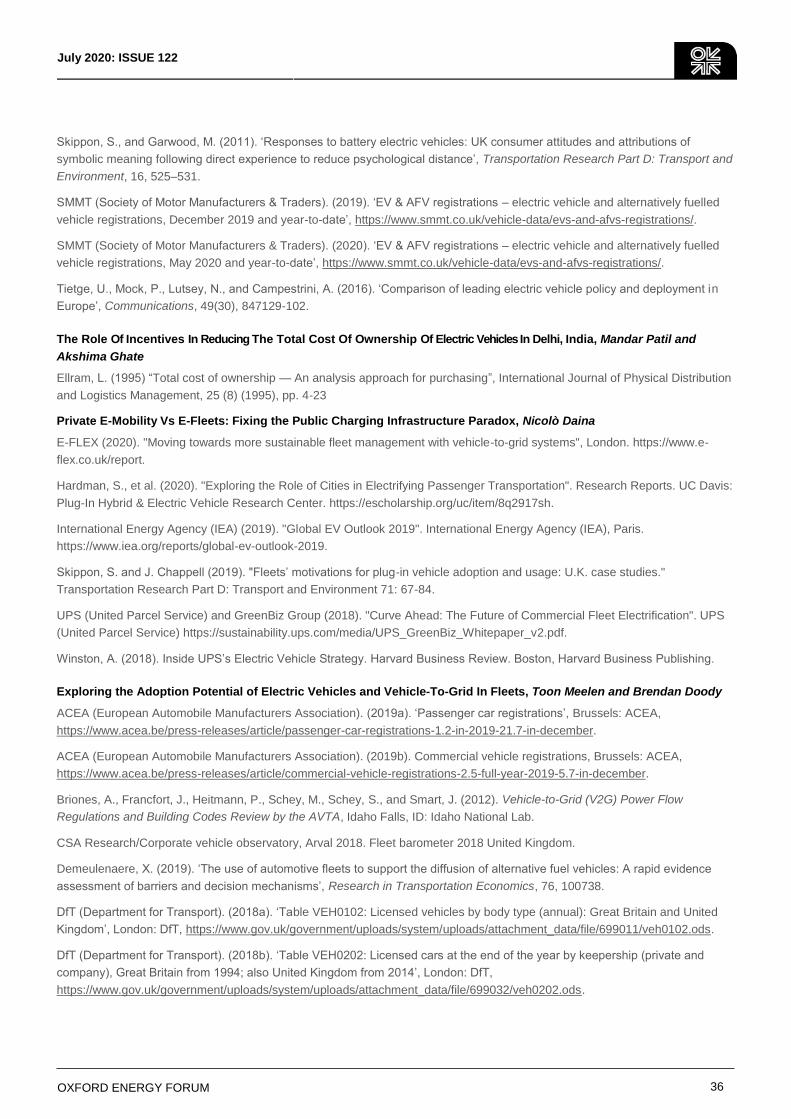
36
July 2020: ISSUE 122
OXFORD ENERGY FORUM
Skippon, S., and Garwood, M. (2011). ‘Responses to battery electric vehicles: UK consumer attitudes and attributions of
symbolic meaning following direct experience to reduce psychological distance’, Transportation Research Part D: Transport and
Environment, 16, 525–531.
SMMT (Society of Motor Manufacturers & Traders). (2019). ‘EV & AFV registrations – electric vehicle and alternatively fuelled
vehicle registrations, December 2019 and year-to-date’, https://www.smmt.co.uk/vehicle-data/evs-and-afvs-registrations/.
SMMT (Society of Motor Manufacturers & Traders). (2020). ‘EV & AFV registrations – electric vehicle and alternatively fuelled
vehicle registrations, May 2020 and year-to-date’, https://www.smmt.co.uk/vehicle-data/evs-and-afvs-registrations/.
Tietge, U., Mock, P., Lutsey, N., and Campestrini, A. (2016). ‘Comparison of leading electric vehicle policy and deployment in
Europe’, Communications, 49(30), 847129-102.
The Role Of Incentives In Reducing The Total Cost Of Ownership Of Electric Vehicles In Delhi, India, Mandar Patil and
Akshima Ghate
Ellram, L. (1995) “Total cost of ownership — An analysis approach for purchasing”, International Journal of Physical Distribution
and Logistics Management, 25 (8) (1995), pp. 4-23
Private E-Mobility Vs E-Fleets: Fixing the Public Charging Infrastructure Paradox, Nicolò Daina
E-FLEX (2020). "Moving towards more sustainable fleet management with vehicle-to-grid systems", London. https://www.e-
flex.co.uk/report.
Hardman, S., et al. (2020). "Exploring the Role of Cities in Electrifying Passenger Transportation". Research Reports. UC Davis:
Plug-In Hybrid & Electric Vehicle Research Center. https://escholarship.org/uc/item/8q2917sh.
International Energy Agency (IEA) (2019). "Global EV Outlook 2019". International Energy Agency (IEA), Paris.
https://www.iea.org/reports/global-ev-outlook-2019.
Skippon, S. and J. Chappell (2019). "Fleets’ motivations for plug-in vehicle adoption and usage: U.K. case studies."
Transportation Research Part D: Transport and Environment 71: 67-84.
UPS (United Parcel Service) and GreenBiz Group (2018). "Curve Ahead: The Future of Commercial Fleet Electrification". UPS
(United Parcel Service) https://sustainability.ups.com/media/UPS_GreenBiz_Whitepaper_v2.pdf.
Winston, A. (2018). Inside UPS’s Electric Vehicle Strategy. Harvard Business Review. Boston, Harvard Business Publishing.
Exploring the Adoption Potential of Electric Vehicles and Vehicle-To-Grid In Fleets, Toon Meelen and Brendan Doody
ACEA (European Automobile Manufacturers Association). (2019a). ‘Passenger car registrations’, Brussels: ACEA,
https://www.acea.be/press-releases/article/passenger-car-registrations-1.2-in-2019-21.7-in-december.
ACEA (European Automobile Manufacturers Association). (2019b). Commercial vehicle registrations, Brussels: ACEA,
https://www.acea.be/press-releases/article/commercial-vehicle-registrations-2.5-full-year-2019-5.7-in-december.
Briones, A., Francfort, J., Heitmann, P., Schey, M., Schey, S., and Smart, J. (2012). Vehicle-to-Grid (V2G) Power Flow
Regulations and Building Codes Review by the AVTA, Idaho Falls, ID: Idaho National Lab.
CSA Research/Corporate vehicle observatory, Arval 2018. Fleet barometer 2018 United Kingdom.
Demeulenaere, X. (2019). ‘The use of automotive fleets to support the diffusion of alternative fuel vehicles: A rapid evidence
assessment of barriers and decision mechanisms’, Research in Transportation Economics, 76, 100738.
DfT (Department for Transport). (2018a). ‘Table VEH0102: Licensed vehicles by body type (annual): Great Britain and United
Kingdom’, London: DfT, https://www.gov.uk/government/uploads/system/uploads/attachment_data/file/699011/veh0102.ods.
DfT (Department for Transport). (2018b). ‘Table VEH0202: Licensed cars at the end of the year by keepership (private and
company), Great Britain from 1994; also United Kingdom from 2014’, London: DfT,
https://www.gov.uk/government/uploads/system/uploads/attachment_data/file/699032/veh0202.ods.
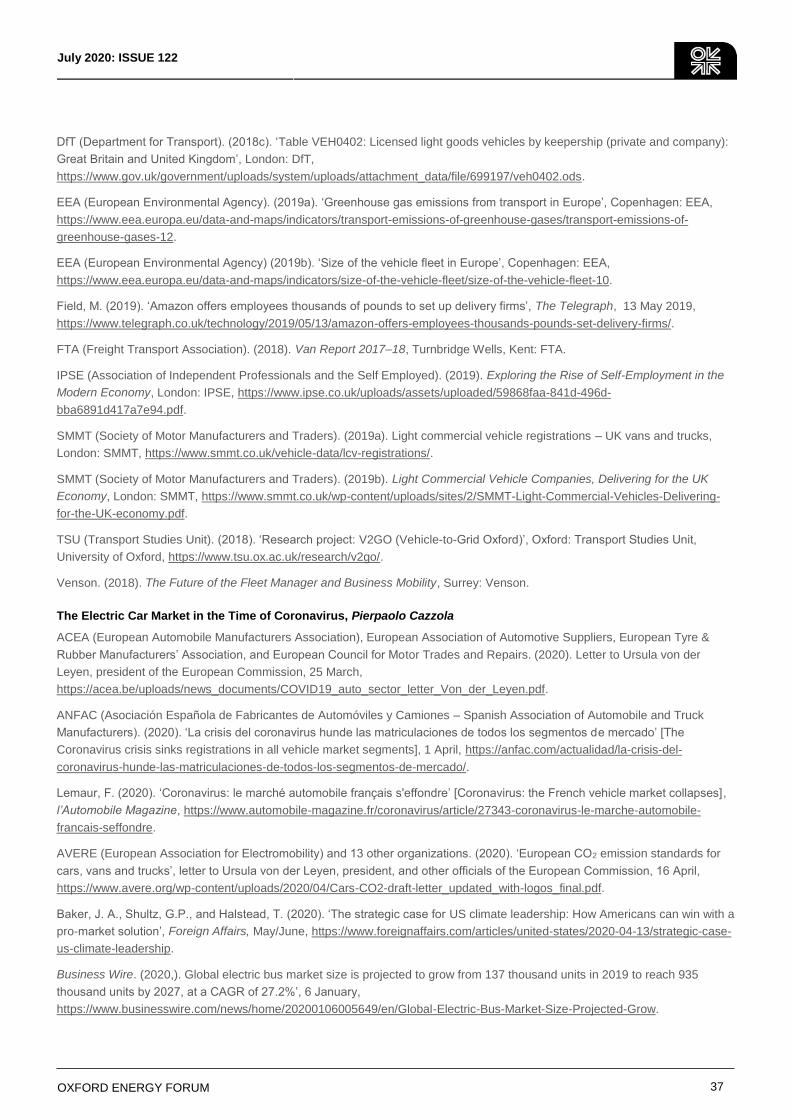
37
July 2020: ISSUE 122
OXFORD ENERGY FORUM
DfT (Department for Transport). (2018c). ‘Table VEH0402: Licensed light goods vehicles by keepership (private and company):
Great Britain and United Kingdom’, London: DfT,
https://www.gov.uk/government/uploads/system/uploads/attachment_data/file/699197/veh0402.ods.
EEA (European Environmental Agency). (2019a). ‘Greenhouse gas emissions from transport in Europe’, Copenhagen: EEA,
https://www.eea.europa.eu/data-and-maps/indicators/transport-emissions-of-greenhouse-gases/transport-emissions-of-
greenhouse-gases-12.
EEA (European Environmental Agency) (2019b). ‘Size of the vehicle fleet in Europe’, Copenhagen: EEA,
https://www.eea.europa.eu/data-and-maps/indicators/size-of-the-vehicle-fleet/size-of-the-vehicle-fleet-10.
Field, M. (2019). ‘Amazon offers employees thousands of pounds to set up delivery firms’, The Telegraph, 13 May 2019,
https://www.telegraph.co.uk/technology/2019/05/13/amazon-offers-employees-thousands-pounds-set-delivery-firms/.
FTA (Freight Transport Association). (2018). Van Report 2017–18, Turnbridge Wells, Kent: FTA.
IPSE (Association of Independent Professionals and the Self Employed). (2019). Exploring the Rise of Self-Employment in the
Modern Economy, London: IPSE, https://www.ipse.co.uk/uploads/assets/uploaded/59868faa-841d-496d-
bba6891d417a7e94.pdf.
SMMT (Society of Motor Manufacturers and Traders). (2019a). Light commercial vehicle registrations – UK vans and trucks,
London: SMMT, https://www.smmt.co.uk/vehicle-data/lcv-registrations/.
SMMT (Society of Motor Manufacturers and Traders). (2019b). Light Commercial Vehicle Companies, Delivering for the UK
Economy, London: SMMT, https://www.smmt.co.uk/wp-content/uploads/sites/2/SMMT-Light-Commercial-Vehicles-Delivering-
for-the-UK-economy.pdf.
TSU (Transport Studies Unit). (2018). ‘Research project: V2GO (Vehicle-to-Grid Oxford)’, Oxford: Transport Studies Unit,
University of Oxford, https://www.tsu.ox.ac.uk/research/v2go/.
Venson. (2018). The Future of the Fleet Manager and Business Mobility, Surrey: Venson.
The Electric Car Market in the Time of Coronavirus, Pierpaolo Cazzola
ACEA (European Automobile Manufacturers Association), European Association of Automotive Suppliers, European Tyre &
Rubber Manufacturers’ Association, and European Council for Motor Trades and Repairs. (2020). Letter to Ursula von der
Leyen, president of the European Commission, 25 March,
https://acea.be/uploads/news_documents/COVID19_auto_sector_letter_Von_der_Leyen.pdf.
ANFAC (Asociación Española de Fabricantes de Automóviles y Camiones – Spanish Association of Automobile and Truck
Manufacturers). (2020). ‘La crisis del coronavirus hunde las matriculaciones de todos los segmentos de mercado’ [The
Coronavirus crisis sinks registrations in all vehicle market segments], 1 April, https://anfac.com/actualidad/la-crisis-del-
coronavirus-hunde-las-matriculaciones-de-todos-los-segmentos-de-mercado/.
Lemaur, F. (2020). ‘Coronavirus: le marché automobile français s'effondre’ [Coronavirus: the French vehicle market collapses],
l’Automobile Magazine, https://www.automobile-magazine.fr/coronavirus/article/27343-coronavirus-le-marche-automobile-
francais-seffondre.
AVERE (European Association for Electromobility) and 13 other organizations. (2020). ‘European CO2 emission standards for
cars, vans and trucks’, letter to Ursula von der Leyen, president, and other officials of the European Commission, 16 April,
https://www.avere.org/wp-content/uploads/2020/04/Cars-CO2-draft-letter_updated_with-logos_final.pdf.
Baker, J. A., Shultz, G.P., and Halstead, T. (2020). ‘The strategic case for US climate leadership: How Americans can win with a
pro-market solution’, Foreign Affairs, May/June, https://www.foreignaffairs.com/articles/united-states/2020-04-13/strategic-case-
us-climate-leadership.
Business Wire. (2020,). Global electric bus market size is projected to grow from 137 thousand units in 2019 to reach 935
thousand units by 2027, at a CAGR of 27.2%’, 6 January,
https://www.businesswire.com/news/home/20200106005649/en/Global-Electric-Bus-Market-Size-Projected-Grow.
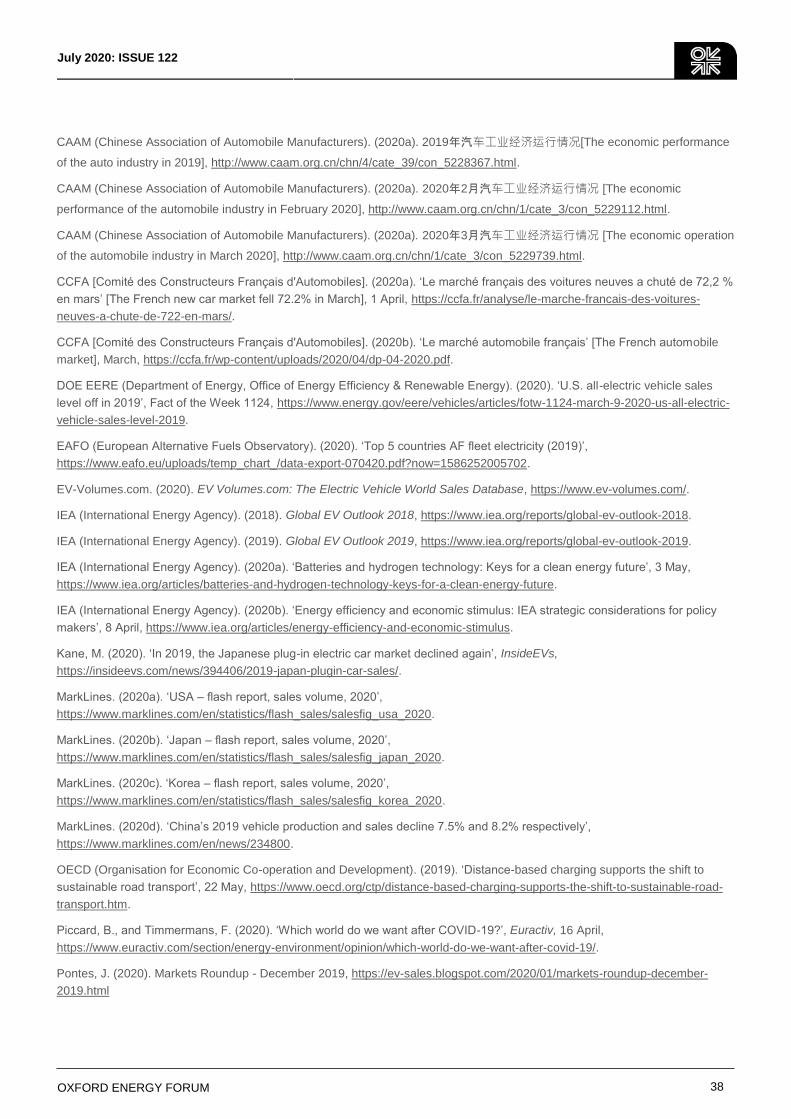
38
July 2020: ISSUE 122
OXFORD ENERGY FORUM
CAAM (Chinese Association of Automobile Manufacturers). (2020a). 2019年汽车工业经济运行情况[The economic performance
of the auto industry in 2019], http://www.caam.org.cn/chn/4/cate_39/con_5228367.html.
CAAM (Chinese Association of Automobile Manufacturers). (2020a). 2020年2月汽车工业经济运行情况 [The economic
performance of the automobile industry in February 2020], http://www.caam.org.cn/chn/1/cate_3/con_5229112.html.
CAAM (Chinese Association of Automobile Manufacturers). (2020a). 2020年3月汽车工业经济运行情况 [The economic operation
of the automobile industry in March 2020], http://www.caam.org.cn/chn/1/cate_3/con_5229739.html.
CCFA [Comité des Constructeurs Français d'Automobiles]. (2020a). ‘Le marché français des voitures neuves a chuté de 72,2 %
en mars’ [The French new car market fell 72.2% in March], 1 April, https://ccfa.fr/analyse/le-marche-francais-des-voitures-
neuves-a-chute-de-722-en-mars/.
CCFA [Comité des Constructeurs Français d'Automobiles]. (2020b). ‘Le marché automobile français’ [The French automobile
market], March, https://ccfa.fr/wp-content/uploads/2020/04/dp-04-2020.pdf.
DOE EERE (Department of Energy, Office of Energy Efficiency & Renewable Energy). (2020). ‘U.S. all-electric vehicle sales
level off in 2019’, Fact of the Week 1124, https://www.energy.gov/eere/vehicles/articles/fotw-1124-march-9-2020-us-all-electric-
vehicle-sales-level-2019.
EAFO (European Alternative Fuels Observatory). (2020). ‘Top 5 countries AF fleet electricity (2019)’,
https://www.eafo.eu/uploads/temp_chart_/data-export-070420.pdf?now=1586252005702.
EV-Volumes.com. (2020). EV Volumes.com: The Electric Vehicle World Sales Database, https://www.ev-volumes.com/.
IEA (International Energy Agency). (2018). Global EV Outlook 2018, https://www.iea.org/reports/global-ev-outlook-2018.
IEA (International Energy Agency). (2019). Global EV Outlook 2019, https://www.iea.org/reports/global-ev-outlook-2019.
IEA (International Energy Agency). (2020a). ‘Batteries and hydrogen technology: Keys for a clean energy future’, 3 May,
https://www.iea.org/articles/batteries-and-hydrogen-technology-keys-for-a-clean-energy-future.
IEA (International Energy Agency). (2020b). ‘Energy efficiency and economic stimulus: IEA strategic considerations for policy
makers’, 8 April, https://www.iea.org/articles/energy-efficiency-and-economic-stimulus.
Kane, M. (2020). ‘In 2019, the Japanese plug-in electric car market declined again’, InsideEVs,
https://insideevs.com/news/394406/2019-japan-plugin-car-sales/.
MarkLines. (2020a). ‘USA – flash report, sales volume, 2020’,
https://www.marklines.com/en/statistics/flash_sales/salesfig_usa_2020.
MarkLines. (2020b). ‘Japan – flash report, sales volume, 2020’,
https://www.marklines.com/en/statistics/flash_sales/salesfig_japan_2020.
MarkLines. (2020c). ‘Korea – flash report, sales volume, 2020’,
https://www.marklines.com/en/statistics/flash_sales/salesfig_korea_2020.
MarkLines. (2020d). ‘China’s 2019 vehicle production and sales decline 7.5% and 8.2% respectively’,
https://www.marklines.com/en/news/234800.
OECD (Organisation for Economic Co-operation and Development). (2019). ‘Distance-based charging supports the shift to
sustainable road transport’, 22 May, https://www.oecd.org/ctp/distance-based-charging-supports-the-shift-to-sustainable-road-
transport.htm.
Piccard, B., and Timmermans, F. (2020). ‘Which world do we want after COVID-19?’, Euractiv, 16 April,
https://www.euractiv.com/section/energy-environment/opinion/which-world-do-we-want-after-covid-19/.
Pontes, J. (2020). Markets Roundup - December 2019, https://ev-sales.blogspot.com/2020/01/markets-roundup-december-
2019.html
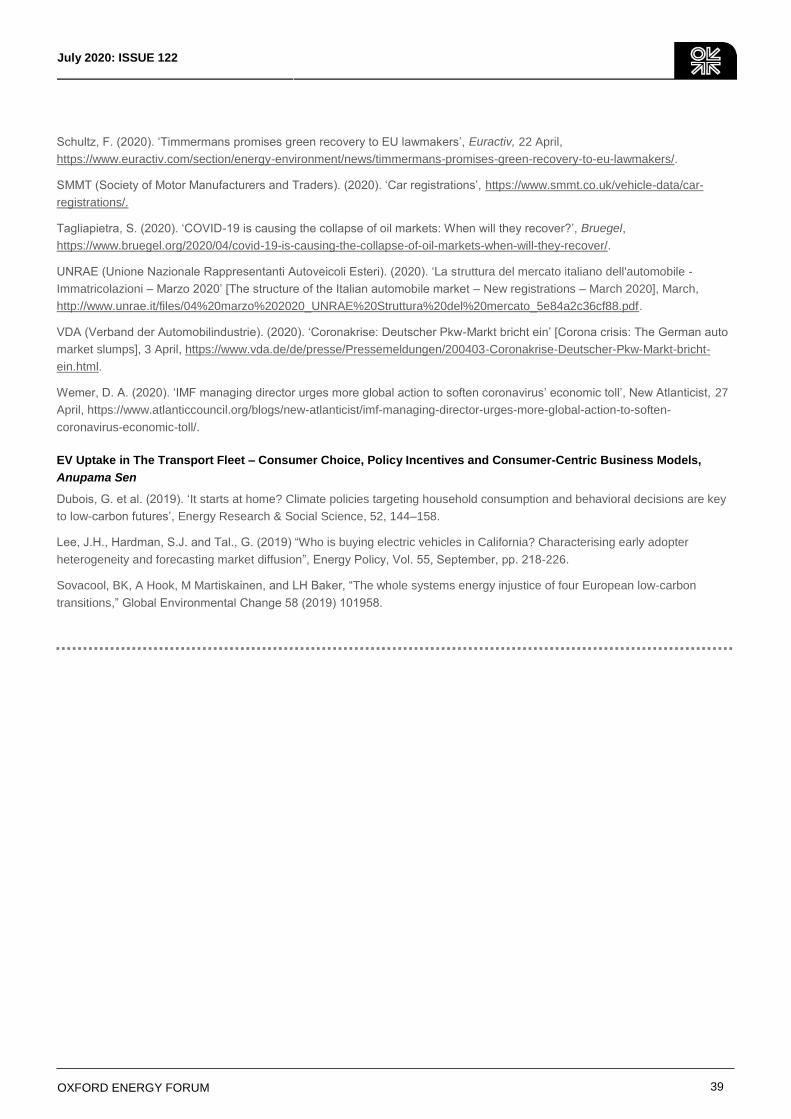
39
July 2020: ISSUE 122
OXFORD ENERGY FORUM
Schultz, F. (2020). ‘Timmermans promises green recovery to EU lawmakers’, Euractiv, 22 April,
https://www.euractiv.com/section/energy-environment/news/timmermans-promises-green-recovery-to-eu-lawmakers/.
SMMT (Society of Motor Manufacturers and Traders). (2020). ‘Car registrations’, https://www.smmt.co.uk/vehicle-data/car-
registrations/.
Tagliapietra, S. (2020). ‘COVID-19 is causing the collapse of oil markets: When will they recover?’, Bruegel,
https://www.bruegel.org/2020/04/covid-19-is-causing-the-collapse-of-oil-markets-when-will-they-recover/.
UNRAE (Unione Nazionale Rappresentanti Autoveicoli Esteri). (2020). ‘La struttura del mercato italiano dell'automobile -
Immatricolazioni – Marzo 2020’ [The structure of the Italian automobile market – New registrations – March 2020], March,
http://www.unrae.it/files/04%20marzo%202020_UNRAE%20Struttura%20del%20mercato_5e84a2c36cf88.pdf.
VDA (Verband der Automobilindustrie). (2020). ‘Coronakrise: Deutscher Pkw-Markt bricht ein’ [Corona crisis: The German auto
market slumps], 3 April, https://www.vda.de/de/presse/Pressemeldungen/200403-Coronakrise-Deutscher-Pkw-Markt-bricht-
ein.html.
Wemer, D. A. (2020). ‘IMF managing director urges more global action to soften coronavirus’ economic toll’, New Atlanticist, 27
April, https://www.atlanticcouncil.org/blogs/new-atlanticist/imf-managing-director-urges-more-global-action-to-soften-
coronavirus-economic-toll/.
EV Uptake in The Transport Fleet – Consumer Choice, Policy Incentives and Consumer-Centric Business Models,
Anupama Sen
Dubois, G. et al. (2019). ‘It starts at home? Climate policies targeting household consumption and behavioral decisions are key
to low-carbon futures’, Energy Research & Social Science, 52, 144–158.
Lee, J.H., Hardman, S.J. and Tal., G. (2019) “Who is buying electric vehicles in California? Characterising early adopter
heterogeneity and forecasting market diffusion”, Energy Policy, Vol. 55, September, pp. 218-226.
Sovacool, BK, A Hook, M Martiskainen, and LH Baker, “The whole systems energy injustice of four European low-carbon
transitions,” Global Environmental Change 58 (2019) 101958.

40
July 2020: ISSUE 122
OXFORD ENERGY FORUM
CONTRIBUTORS TO THIS ISSUE
Ahmad O. Al Khowaiter is Chief Technology Officer at Saudi Aramco
George Beard is Head of ULEV Consumer Research at the Transport Research Laboratory, UK
Pierpaolo Cazzola is Advisor on Energy, Technology & Environmental Sustainability at the International Transport Forum
Nicolò Daina is a Research Fellow at the Urban Systems Lab and at the Centre for Transport Studies at Imperial College
London
Brendan Doody is Research Associate in Urban Mobility at the Transport Studies Unit, University of Oxford
Bassam Fattouh is Director, Oxford Institute for Energy Studies and Editor of the Oxford Energy Forum
Akshima Ghate is a Principal at RMI India
Scott Hardman is a Professional Researcher in the Plug-in Hybrid & Electric Vehicle Research Center at the Institute of
Transportation Studies at the University of California Davis
Toon Meelen is Research Associate in Innovation and Mobility at the Transport Studies Unit, University of Oxford
Yasser M. Mufti is Vice President, Strategy & Market Analysis at Saudi Aramco
Mandar Patil is a Senior Associate at RMI India
Rahmat Poudineh is a Senior Research Fellow and Director of Research of the Oxford Institute for Energy Studies Electricity
Research Programme, and a Co-Editor on this issue of the Oxford Energy Forum
Anupama Sen is a Senior Research Fellow and Executive Director of the Oxford Institute for Energy Studies Electricity
Research Programme, and a Co-Editor on this issue of the Oxford Energy Forum
Daniel Sperling is Professor of Civil Engineering and Environmental Science and Policy, and founding Director of the Institute
of Transportation Studies at the University of California, Davis
The views expressed here are those of the authors. They do not necessarily represent the views of the Oxford Institute for
Energy Studies or any of its Members nor the position of the present or previous employer, or funding body, of any of the
authors.