Embed Size (px)
Citation preview
www.gov.uk/defra
EV0530 Evaluation of the Waste Reward and
Recognition Scheme: Emerging findings
An Interim report by Brook Lyndhurst
December 2013
ii
© Crown copyright 2013
You may re-use this information (not including logos) free of charge in any format or
medium, under the terms of the Open Government Licence. To view this licence, visit
www.nationalarchives.gov.uk/doc/open-government-licence/ or write to the Information
Policy Team, The National Archives, Kew, London TW9 4DU, or e-mail:
This document/publication is also available on our website at:
http://randd.defra.gov.uk/ (then type “EV0530” into the search facility)
https://www.gov.uk/household-reward-and-recognition-scheme-guidance-for-local-authorities
Any enquiries regarding this document/publication should be sent to us at:
Waste Strategy and Regulation Team Defra Zone 2B Nobel House 17 Smith Square London SW1P 3JR Email: [email protected]
Published by the Department for Environment, Food and Rural Affairs.
Suggested citation for this report: Giorgi, S., Thacker, C. and Bain, J. Brook Lyndhurst (2013). Evaluation of the Waste Reward and Recognition Scheme: Emerging findings. Interim report. A report to the Department for Environment, Food and Rural Affairs. Defra, London. This research was commissioned and funded by Defra. The views expressed reflect the research findings and the authors’ interpretation; they do not necessarily reflect Defra policy or opinions.
This report has been produced by Brook Lyndhurst Ltd under/as part of a contract placed by Defra. Any views expressed in it are not necessarily those of Defra. Brook Lyndhurst warrants that all reasonable skill and care has been used in preparing this report. Notwithstanding this warranty, Brook Lyndhurst shall not be under any liability for loss of profit, business, revenues or any special indirect or consequential damage of any nature whatsoever or loss of anticipated saving or for any increased costs sustained by the client or his or her servants or agents arising in any way whether directly or indirectly as a result of reliance on this report or of any error or defect in this report.
iii
Contents Contents ............................................................................................................................ iii Executive summary ........................................................................................................... 1
1. Introduction ................................................................................................................. 2
1.1 Policy landscape and current state of affairs .......................................................... 2
1.2 Defra’s Reward and Recognition Scheme .............................................................. 4
1.3 Evaluating the Reward and Recognition Scheme ................................................... 5
1.4 Data limitations and this report ............................................................................... 6
2 Overview of findings .................................................................................................. 8
2.1 Introducing the eight schemes ................................................................................ 8
2.2 Participants and behaviour at a glance ................................................................. 10
2.3 Tonnages and costs at a glance ........................................................................... 12
3 Case studies ............................................................................................................. 14
3.1 Aire Valley Recycling (AVR) ................................................................................. 14
3.2 Bath and North East Somerset (BathNES) ........................................................... 17
3.3 Birmingham City Council (BCC) ............................................................................ 20
3.4 Gloucestershire Waste Partnership ...................................................................... 24
3.5 Norfolk County Council (NCC) .............................................................................. 27
3.6 National Union of Students (NUS) ........................................................................ 30
3.7 Preen Community Interest Company (Preen) ....................................................... 34
3.8 Westminster City Council (WCC) .......................................................................... 36
4 Emerging findings and lessons ............................................................................... 38
4.1 Tonnages and cost effectiveness ......................................................................... 38
4.2 Behaviour and attitudes ........................................................................................ 43
4.3 Barriers, challenges and risks ............................................................................... 46
4.4 Emerging lessons for future schemes ................................................................... 48
5 Next steps ................................................................................................................. 51
Acknowledgement:
Defra and the research team at Brook Lyndhurst would like to thank all scheme staff at
Aire Valley Recycling, Bath and North East Somerset, Birmingham City Council,
Gloucestershire Waste Partnership, Norfolk County Council, National Union of Students,
Preen Community Interest Company and Westminster City Council for their hard work and
cooperation in providing all the data and explanations which made the analysis and
drafting of this interim report possible.
EV0530 Evaluation of the Waste Reward and Recognition | An interim report Chapter 1 | Introduction
1
Executive summary
Changing householder behaviour is key in going further and faster in terms of driving up recycling rates and
reducing the amount of waste for disposal – recognising and rewarding the right behaviour can have a part to
play in delivering this change.
Defra’s Reward and Recognition Scheme tests out how positive waste behaviour is affected through different
kinds of reward and recognition schemes and what factors help or hinder such schemes in achieving this
behaviour change. It is an opportunity and a safe-space to learn about what works and what does not work
when delivering and evaluating these types of schemes. Up to £2 million was made available for three Spending
Review years to 28 schemes. This support package was made available to pilots led by local authorities and civil
society organisations. The programme supports an eclectic group of schemes looking at innovative ways of
tackling issues around food waste, recycling, re-use and waste prevention and reduction. Defra commissioned
Brook Lyndhurst as the schemes’ and programme’s research and evaluation partner.
This interim report looks at eight schemes which by summer 2013 had been assessed and offers a stock-take of
emerging lessons based on this small, diverse sample, to share the schemes’ experiences with those setting up
schemes now or considering doing so in future. The eight schemes assessed to date are diverse in terms of
behaviours and audience targeted. With regard to behaviours: increasing on-the-go recycling, increasing
purchases of reuse items and increasing participation in household dry recycling collections all feature. The
target audiences of these eight schemes also vary, covering: students, passersby on busy streets, low recycling
households and reuse shop visitors.
Reward and recognition schemes cannot be seen as a ‘quick fix’. They require careful consideration, time and
investment, especially if they are not only meant to be successful, but also to demonstrate their success and
impact. The common challenges encountered by the schemes were related to knowing what would work with
their target audience, communications, choosing appropriate rewards, operational issues, project management
and working with delivery partners. At this interim stage it is not possible to list the factors that help to deliver a
successful scheme. It would appear, however, that unless certain preconditions are in place the schemes stand
little chance of demonstrating success. The preconditions that ought to be considered are:
Stable, simple, easily accessible and effective service provision;
Clear information and strong communications tapping into different channels;
In-depth knowledge of target audience;
Tailored and regular recognition and feedback of service-use;
Ability to demonstrate impact and attribution of rewards; and
Tailored assessment and careful selection of reward delivery mechanism.
Across the schemes, improvements in recycling and reuse tended to be linked to better services and promotion
rather than being attributable directly to the rewards. Rewards and recognition have the potential to validate,
reinforce and, possibly, improve a pre-existing behaviour rather than act as a catalyst for new behaviours.
Schemes made participants feel that recycling and reuse was ‘the right thing to do’ and showed participants
‘that their efforts were appreciated’. For some it also acted as a reminder that more things could be recycled
and reused which links back to the importance of on-going feedback and communications.
The diversity of schemes, different monitoring and evaluation approaches, and data quality and limitations make
scheme comparisons difficult. Therefore, it is not advisable to draw definitive results and conclusions - especially
with regard to the sustainability and cost effectiveness of schemes. When further schemes have been assessed it
is hoped that firmer conclusions can be drawn. In the meantime, readers are particularly encouraged to read the
case studies in full that may be relevant to inform their own local scheme.
EV0530 Evaluation of the Waste Reward and Recognition | An interim report Chapter 1 | Introduction
2
1. Introduction
1.1 Policy landscape and current state of affairs The Coalition Government’s programme made a commitment stating:
“We will work towards a ‘zero waste economy’,
encourage councils to pay people to recycle, and
work to reduce littering.”1
Moving towards a ‘zero waste economy’ implies a society where resources are fully valued in monetary and
environmental terms. This means respecting the waste hierarchy and reducing, reusing and recycling all that can
be.
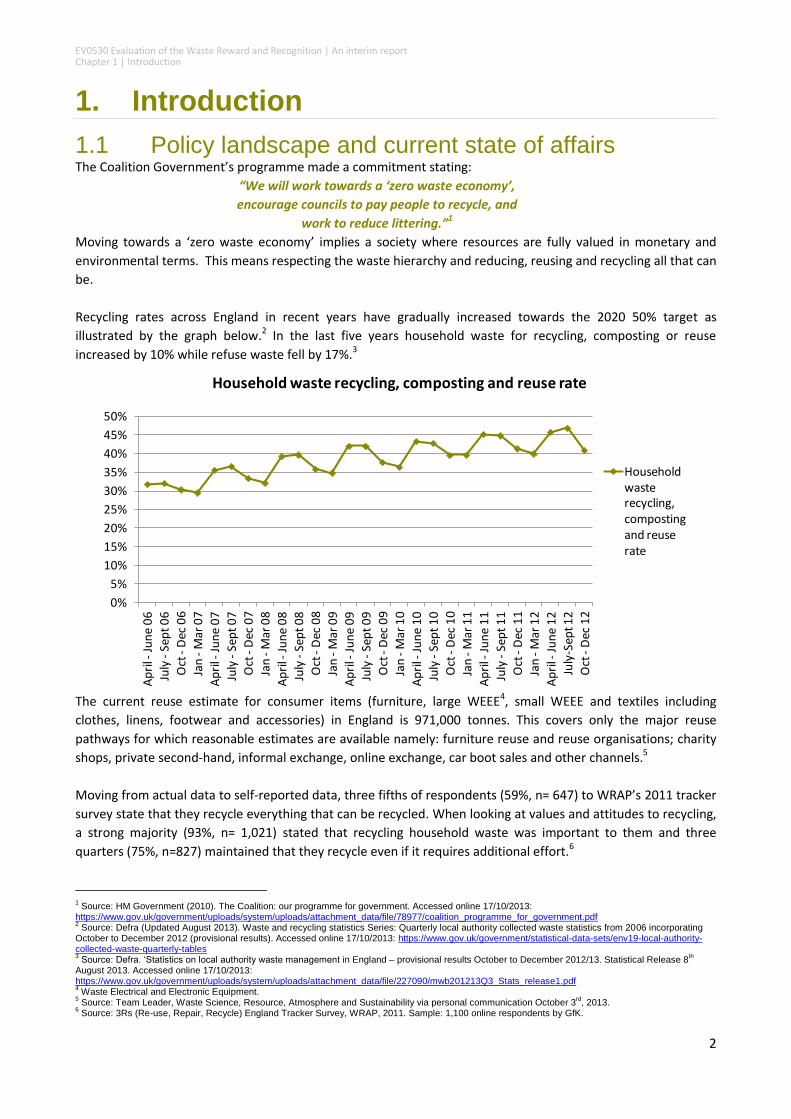
Recycling rates across England in recent years have gradually increased towards the 2020 50% target as
illustrated by the graph below.2 In the last five years household waste for recycling, composting or reuse
increased by 10% while refuse waste fell by 17%.3
The current reuse estimate for consumer items (furniture, large WEEE4, small WEEE and textiles including
clothes, linens, footwear and accessories) in England is 971,000 tonnes. This covers only the major reuse
pathways for which reasonable estimates are available namely: furniture reuse and reuse organisations; charity
shops, private second-hand, informal exchange, online exchange, car boot sales and other channels.5
Moving from actual data to self-reported data, three fifths of respondents (59%, n= 647) to WRAP’s 2011 tracker
survey state that they recycle everything that can be recycled. When looking at values and attitudes to recycling,
a strong majority (93%, n= 1,021) stated that recycling household waste was important to them and three
quarters (75%, n=827) maintained that they recycle even if it requires additional effort.6
1 Source: HM Government (2010). The Coalition: our programme for government. Accessed online 17/10/2013:
https://www.gov.uk/government/uploads/system/uploads/attachment_data/file/78977/coalition_programme_for_government.pdf 2 Source: Defra (Updated August 2013). Waste and recycling statistics Series: Quarterly local authority collected waste statistics from 2006 incorporating
October to December 2012 (provisional results). Accessed online 17/10/2013: https://www.gov.uk/government/statistical-data-sets/env19-local-authority-collected-waste-quarterly-tables 3 Source: Defra. ‘Statistics on local authority waste management in England – provisional results October to December 2012/13. Statistical Release 8
th
August 2013. Accessed online 17/10/2013: https://www.gov.uk/government/uploads/system/uploads/attachment_data/file/227090/mwb201213Q3_Stats_release1.pdf 4 Waste Electrical and Electronic Equipment.
5 Source: Team Leader, Waste Science, Resource, Atmosphere and Sustainability via personal communication October 3
rd, 2013.
6 Source: 3Rs (Re-use, Repair, Recycle) England Tracker Survey, WRAP, 2011. Sample: 1,100 online respondents by GfK.
0%
5%
10%
15%
20%
25%
30%
35%
40%
45%
50%
Ap
ril -
Jun
e 0
6
July
-Se
pt
06
Oct
-D
ec 0
6
Jan
-M
ar 0
7
Ap
ril -
Jun
e 0
7
July
-Se
pt
07
Oct
-D
ec 0
7
Jan
-M
ar 0
8
Ap
ril -
Jun
e 0
8
July
-Se
pt
08
Oct
-D
ec 0
8
Jan
-M
ar 0
9
Ap
ril -
Jun
e 0
9
July
-Se
pt
09
Oct
-D
ec 0
9
Jan
-M
ar 1
0
Ap
ril -
Jun
e 1
0
July
-Se
pt
10
Oct
-D
ec 1
0
Jan
-M
ar 1
1
Ap
ril -
Jun
e 1
1
July
-Se
pt
11
Oct
-D
ec 1
1
Jan
-M
ar 1
2
Ap
ril -
Jun
e 1
2
July
-Sep
t 12
Oct
-D
ec 1
2
Household waste recycling, composting and reuse rate
Household waste recycling, composting and reuse rate
EV0530 Evaluation of the Waste Reward and Recognition | An interim report Chapter 1 | Introduction
3
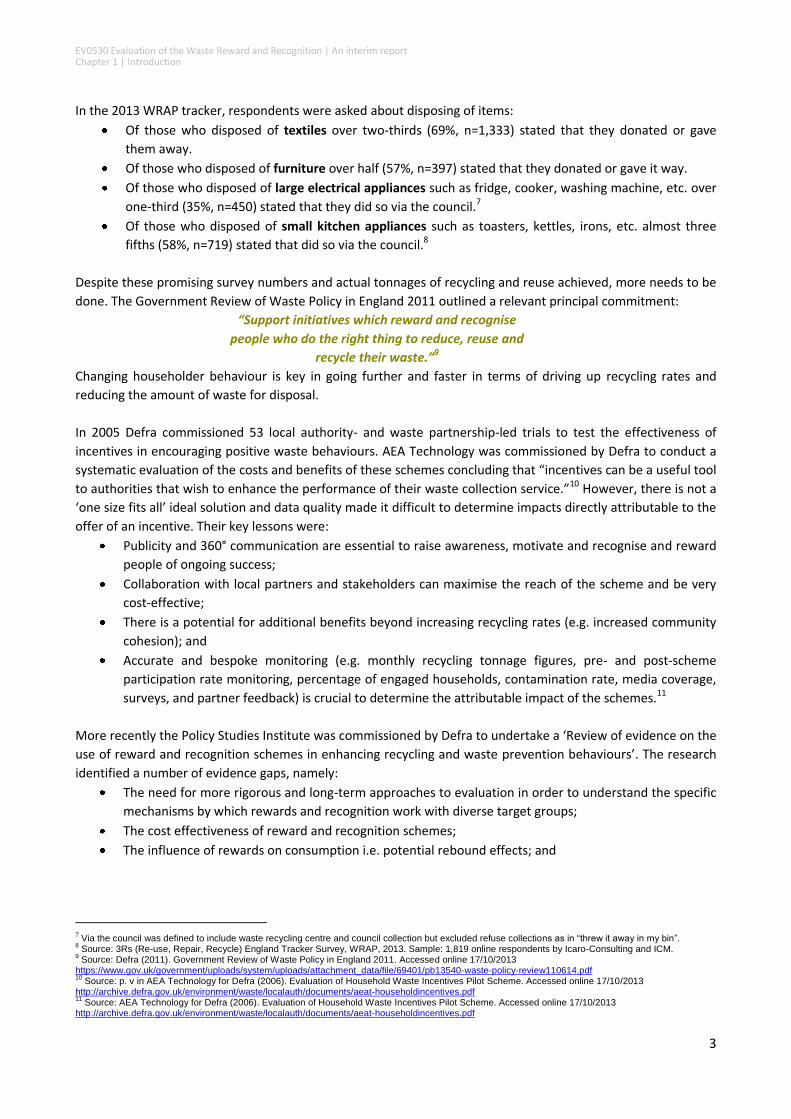
In the 2013 WRAP tracker, respondents were asked about disposing of items:
Of those who disposed of textiles over two-thirds (69%, n=1,333) stated that they donated or gave
them away.
Of those who disposed of furniture over half (57%, n=397) stated that they donated or gave it way.
Of those who disposed of large electrical appliances such as fridge, cooker, washing machine, etc. over
one-third (35%, n=450) stated that they did so via the council.7
Of those who disposed of small kitchen appliances such as toasters, kettles, irons, etc. almost three
fifths (58%, n=719) stated that did so via the council.8
Despite these promising survey numbers and actual tonnages of recycling and reuse achieved, more needs to be
done. The Government Review of Waste Policy in England 2011 outlined a relevant principal commitment:
“Support initiatives which reward and recognise
people who do the right thing to reduce, reuse and
recycle their waste.”9
Changing householder behaviour is key in going further and faster in terms of driving up recycling rates and
reducing the amount of waste for disposal.
In 2005 Defra commissioned 53 local authority- and waste partnership-led trials to test the effectiveness of
incentives in encouraging positive waste behaviours. AEA Technology was commissioned by Defra to conduct a
systematic evaluation of the costs and benefits of these schemes concluding that “incentives can be a useful tool
to authorities that wish to enhance the performance of their waste collection service.”10 However, there is not a
‘one size fits all’ ideal solution and data quality made it difficult to determine impacts directly attributable to the
offer of an incentive. Their key lessons were:
Publicity and 360° communication are essential to raise awareness, motivate and recognise and reward
people of ongoing success;
Collaboration with local partners and stakeholders can maximise the reach of the scheme and be very
cost-effective;
There is a potential for additional benefits beyond increasing recycling rates (e.g. increased community
cohesion); and
Accurate and bespoke monitoring (e.g. monthly recycling tonnage figures, pre- and post-scheme
participation rate monitoring, percentage of engaged households, contamination rate, media coverage,
surveys, and partner feedback) is crucial to determine the attributable impact of the schemes.11
More recently the Policy Studies Institute was commissioned by Defra to undertake a ‘Review of evidence on the
use of reward and recognition schemes in enhancing recycling and waste prevention behaviours’. The research
identified a number of evidence gaps, namely:
The need for more rigorous and long-term approaches to evaluation in order to understand the specific
mechanisms by which rewards and recognition work with diverse target groups;
The cost effectiveness of reward and recognition schemes;
The influence of rewards on consumption i.e. potential rebound effects; and
7 Via the council was defined to include waste recycling centre and council collection but excluded refuse collections as in “threw it away in my bin”.
8 Source: 3Rs (Re-use, Repair, Recycle) England Tracker Survey, WRAP, 2013. Sample: 1,819 online respondents by Icaro-Consulting and ICM.
9 Source: Defra (2011). Government Review of Waste Policy in England 2011. Accessed online 17/10/2013
https://www.gov.uk/government/uploads/system/uploads/attachment_data/file/69401/pb13540-waste-policy-review110614.pdf 10
Source: p. v in AEA Technology for Defra (2006). Evaluation of Household Waste Incentives Pilot Scheme. Accessed online 17/10/2013 http://archive.defra.gov.uk/environment/waste/localauth/documents/aeat-householdincentives.pdf 11
Source: AEA Technology for Defra (2006). Evaluation of Household Waste Incentives Pilot Scheme. Accessed online 17/10/2013 http://archive.defra.gov.uk/environment/waste/localauth/documents/aeat-householdincentives.pdf
EV0530 Evaluation of the Waste Reward and Recognition | An interim report Chapter 1 | Introduction
4
The long-term effects of rewards and recognition on behaviour and an understanding of the additional
measures needed to sustain behaviour change.12
WRAP have also undertaken work with local authorities on incentive schemes looking at increasing waste
prevention, reuse and recycling (e.g. London Borough of Bexley’s London Green Points Incentive Scheme.)13
Given the work to date and the challenge ahead of delivering a ‘zero waste economy’ there was an appetite to
trial and test new ways of encouraging pro-environmental behaviours. Specifically there was a need to explore
how rewarding and recognising people for doing the right thing can encourage positive waste behaviour.
1.2 Defra’s Reward and Recognition Scheme The Government believes that it is better to reward householders for doing the right thing with their waste than
to penalise them for doing the wrong thing. With this in mind and as part of the Waste Review, Defra launched
the Reward and Recognition Scheme in June 2011. This scheme aimed to investigate a range of approaches for
rewarding and recognising people for adopting positive behaviours towards managing their waste. Applicants
were encouraged to develop schemes relating to food waste, recycling, re-use, waste prevention and reduction.
Up to £2 million was made available for three Spending Review years from 2011/2012 to 2013/2014. This
support package was made available to pilots led by local authorities and civil society organisations.
Defra’s Reward and Recognition Scheme tests out how positive waste behaviour change is affected through
different kinds of reward and recognition. The programme is an opportunity and a safe-space to learn about
what works and what does not work when delivering and evaluating these types of schemes. The main intent
behind the programme is to explore and learn from innovative schemes trialling reward and recognition
techniques to encourage positive waste behaviours (e.g. more and better recycling and reuse).
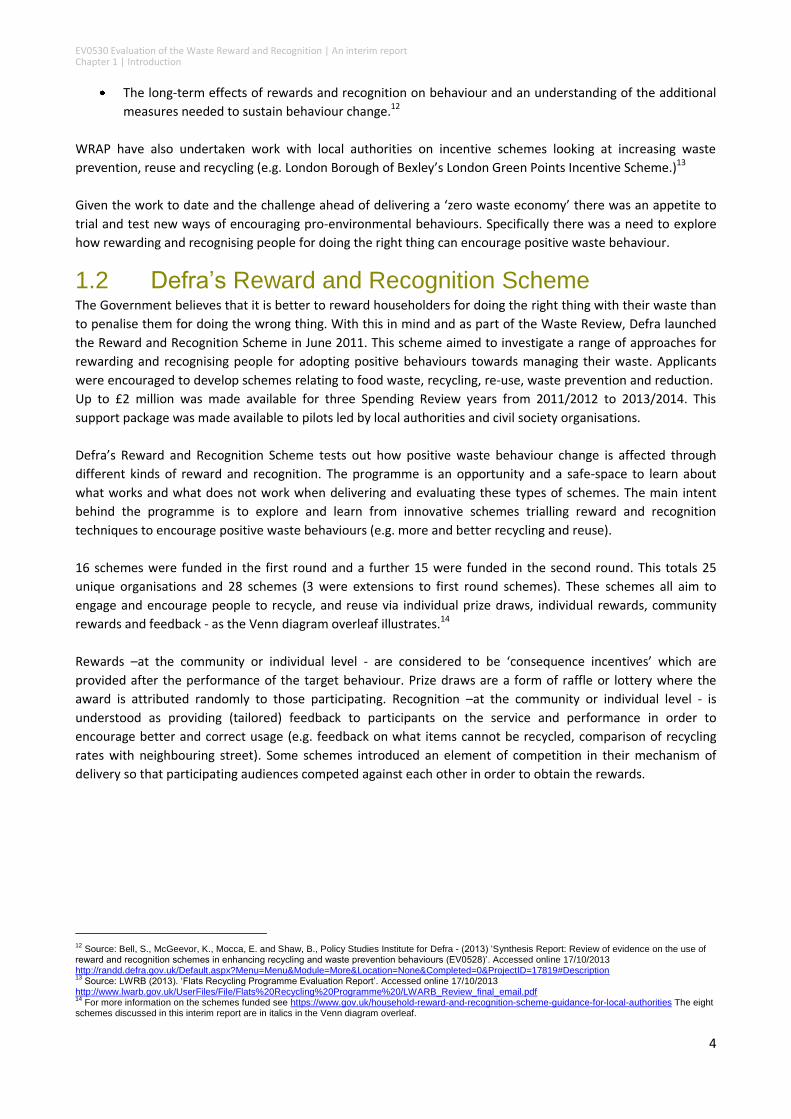
16 schemes were funded in the first round and a further 15 were funded in the second round. This totals 25
unique organisations and 28 schemes (3 were extensions to first round schemes). These schemes all aim to
engage and encourage people to recycle, and reuse via individual prize draws, individual rewards, community
rewards and feedback - as the Venn diagram overleaf illustrates.14
Rewards –at the community or individual level - are considered to be ‘consequence incentives’ which are
provided after the performance of the target behaviour. Prize draws are a form of raffle or lottery where the
award is attributed randomly to those participating. Recognition –at the community or individual level - is
understood as providing (tailored) feedback to participants on the service and performance in order to
encourage better and correct usage (e.g. feedback on what items cannot be recycled, comparison of recycling
rates with neighbouring street). Some schemes introduced an element of competition in their mechanism of
delivery so that participating audiences competed against each other in order to obtain the rewards.
12
Source: Bell, S., McGeevor, K., Mocca, E. and Shaw, B., Policy Studies Institute for Defra - (2013) ‘Synthesis Report: Review of evidence on the use of reward and recognition schemes in enhancing recycling and waste prevention behaviours (EV0528)’. Accessed online 17/10/2013 http://randd.defra.gov.uk/Default.aspx?Menu=Menu&Module=More&Location=None&Completed=0&ProjectID=17819#Description 13
Source: LWRB (2013). ‘Flats Recycling Programme Evaluation Report’. Accessed online 17/10/2013 http://www.lwarb.gov.uk/UserFiles/File/Flats%20Recycling%20Programme%20/LWARB_Review_final_email.pdf 14
For more information on the schemes funded see https://www.gov.uk/household-reward-and-recognition-scheme-guidance-for-local-authorities The eight schemes discussed in this interim report are in italics in the Venn diagram overleaf.
EV0530 Evaluation of the Waste Reward and Recognition | An interim report Chapter 1 | Introduction
5
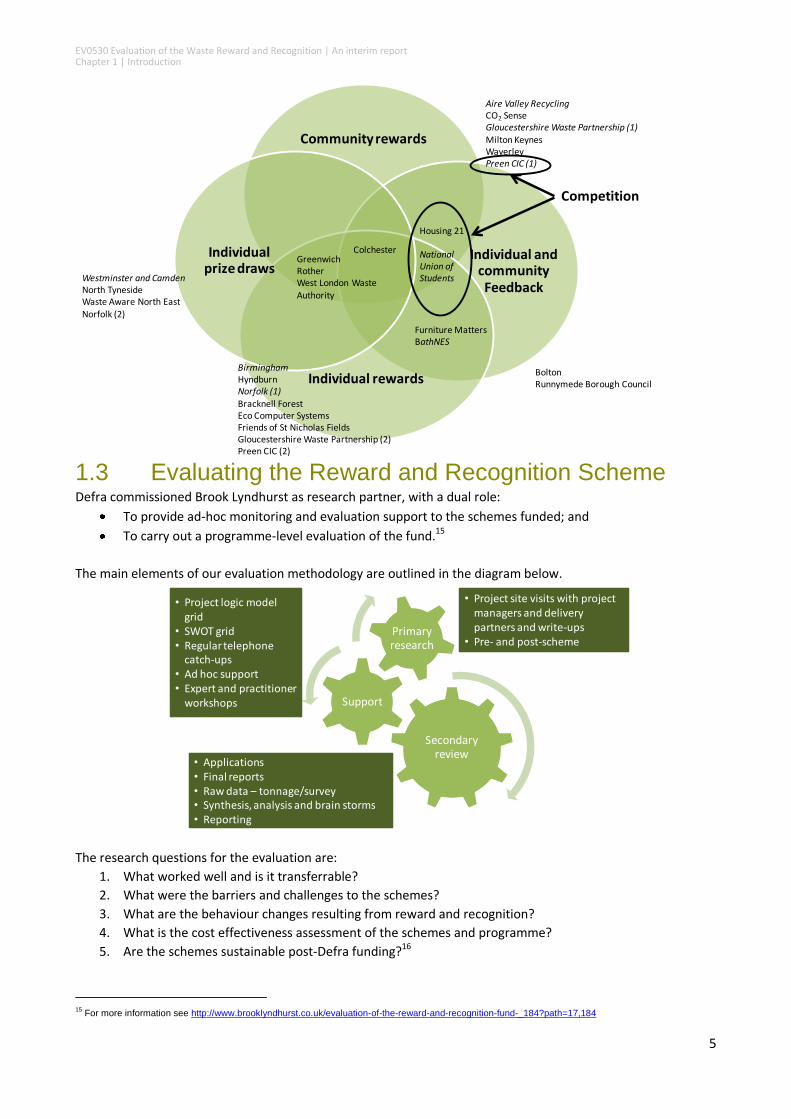
1.3 Evaluating the Reward and Recognition Scheme Defra commissioned Brook Lyndhurst as research partner, with a dual role:
To provide ad-hoc monitoring and evaluation support to the schemes funded; and
To carry out a programme-level evaluation of the fund.15
The main elements of our evaluation methodology are outlined in the diagram below.
The research questions for the evaluation are:
1. What worked well and is it transferrable?
2. What were the barriers and challenges to the schemes?
3. What are the behaviour changes resulting from reward and recognition?
4. What is the cost effectiveness assessment of the schemes and programme?
5. Are the schemes sustainable post-Defra funding?16
15
For more information see http://www.brooklyndhurst.co.uk/evaluation-of-the-reward-and-recognition-fund-_184?path=17,184
Community rewards
Individual and community Feedback
Individual rewards
Individual prize draws
Aire Valley RecyclingCO2 SenseGloucestershire Waste Partnership (1)Milton KeynesWaverleyPreen CIC (1)
BirminghamHyndburnNorfolk (1)Bracknell Forest Eco Computer SystemsFriends of St Nicholas FieldsGloucestershire Waste Partnership (2)Preen CIC (2)
BoltonRunnymede Borough Council
Westminster and CamdenNorth TynesideWaste Aware North East
Norfolk (2)
Furniture MattersBathNES
GreenwichRotherWest London Waste Authority
Colchester
Housing 21
National Union of Students
Competition
Secondary review
Support
Primary research
• Applications• Final reports• Raw data – tonnage/survey• Synthesis, analysis and brain storms• Reporting
• Project site visits with project managers and delivery partners and write-ups
• Pre- and post-scheme
• Project logic model grid
• SWOT grid• Regular telephone
catch-ups• Ad hoc support• Expert and practitioner
workshops
EV0530 Evaluation of the Waste Reward and Recognition | An interim report Chapter 1 | Introduction
6
Though our evaluation methodology and framework draws from HM Treasury’s Magenta Handbook, the
evaluation is not intended to be a systematic impact assessment as understood by the Magenta Handbook or
the Government Social Research standards. The evaluation was intended to provide evaluation and monitoring
support to schemes and to attempt better comparability of data at a programme-level.
1.4 Data limitations and this report This report presents the initial findings from eight of the schemes that had finished and reported to Defra as of
summer 2013. The purpose of this report is to present the overview results of these schemes and discuss the
emerging lessons around reward and recognition.
Beyond the literature mentioned in section 1.1 it is not the intent of this interim report to address the behaviour
change theory which is being tested by the programme and the individual schemes. For a more complete
discussion of the theory that informed the thinking behind this pilot see, for example, the work of Defra on pro-
environmental behaviours, Andrew Darnton, MINDSPACE and Elizabeth Shove.17
The primary audience for this report is local authorities, especially those considering reward and recognition
schemes as a way of increasing recycling and reuse (for example, beneficiaries of the Department for
Communities and Local Government’s Weekly Collection Support Scheme).
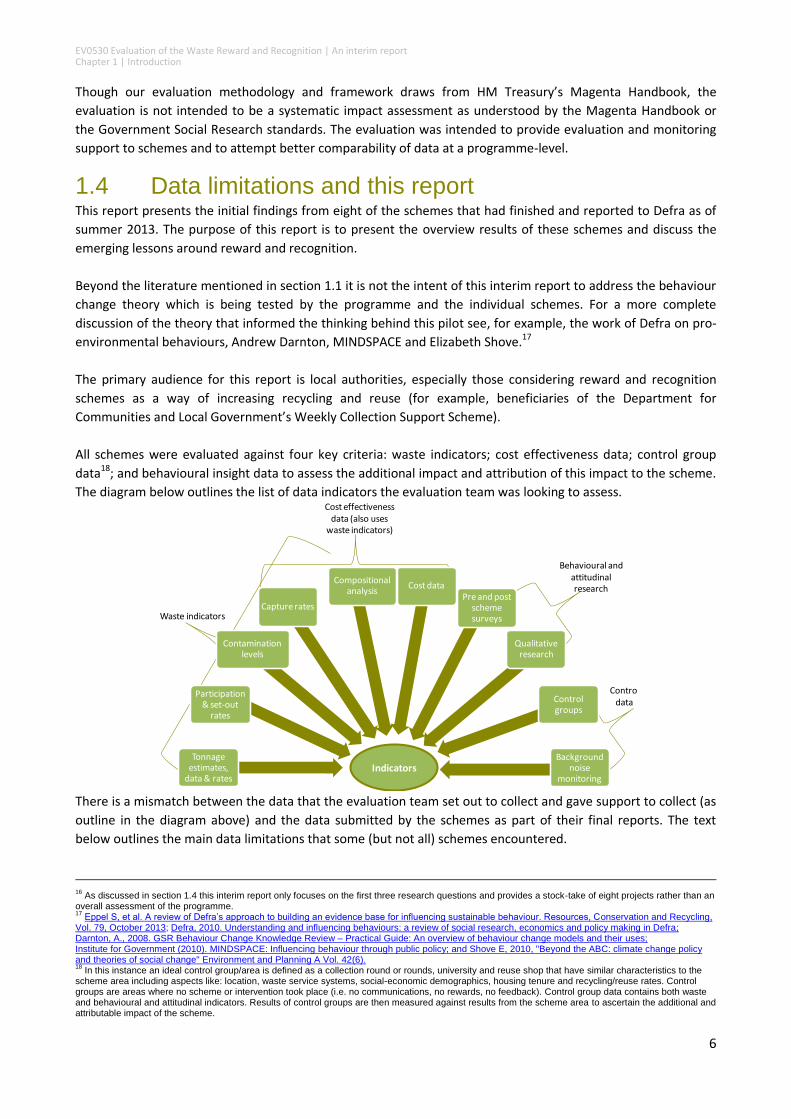
All schemes were evaluated against four key criteria: waste indicators; cost effectiveness data; control group
data18; and behavioural insight data to assess the additional impact and attribution of this impact to the scheme.
The diagram below outlines the list of data indicators the evaluation team was looking to assess.
There is a mismatch between the data that the evaluation team set out to collect and gave support to collect (as
outline in the diagram above) and the data submitted by the schemes as part of their final reports. The text
below outlines the main data limitations that some (but not all) schemes encountered.
16
As discussed in section 1.4 this interim report only focuses on the first three research questions and provides a stock-take of eight projects rather than an overall assessment of the programme. 17
Eppel S, et al. A review of Defra’s approach to building an evidence base for influencing sustainable behaviour. Resources, Conservation and Recycling, Vol. 79, October 2013; Defra, 2010. Understanding and influencing behaviours: a review of social research, economics and policy making in Defra; Darnton, A., 2008. GSR Behaviour Change Knowledge Review – Practical Guide: An overview of behaviour change models and their uses; Institute for Government (2010). MINDSPACE: Influencing behaviour through public policy; and Shove E, 2010, "Beyond the ABC: climate change policy and theories of social change" Environment and Planning A Vol. 42(6). 18
In this instance an ideal control group/area is defined as a collection round or rounds, university and reuse shop that have similar characteristics to the scheme area including aspects like: location, waste service systems, social-economic demographics, housing tenure and recycling/reuse rates. Control groups are areas where no scheme or intervention took place (i.e. no communications, no rewards, no feedback). Control group data contains both waste and behavioural and attitudinal indicators. Results of control groups are then measured against results from the scheme area to ascertain the additional and attributable impact of the scheme.
Waste indicators
Behavioural and attitudinal research
Control data
Cost effectiveness data (also uses
waste indicators)
IndicatorsTonnage
estimates, data & rates
Participation & set-out
rates
Contaminationlevels
Capture rates
Compositional analysis
Cost dataPre and post
scheme surveys
Qualitative research
Control groups
Background noise
monitoring
EV0530 Evaluation of the Waste Reward and Recognition | An interim report Chapter 1 | Introduction
7
Main data limitations that some schemes encountered included:
Lack of high quality comparable waste and behavioural insight data across the eight schemes (e.g. use of
estimates not weights);
Limited or missing control group data both for waste and behavioural insight;
Lack of a matched-sample from pre- to post- monitoring for waste and behavioural insight;
Lack of comparable time-series data over a long period of time for pre-scheme tonnage data;
Lack of progress reported against original targets set in funding application;
Waste data not collected following WRAP’s Monitoring and Evaluation Guidance (e.g. participation
rates, timing of pre- and post-scheme monitoring, short monitoring periods);
Missing data points or unexplainable anomalies in tonnage and participation rate data;
Self-selecting/bias/predisposed/captive survey samples;
Needing to rely on self reported changes in behaviour and attitude;
Missing pre- or post-scheme data;
Different categorisations of costs; and
Small sample sizes – sample sizes of less than 50 respondents for behavioural insight data have been
excluded from analysis.
Data limitations regarding a specific type of data (e.g. tonnage, costs, survey, etc) or a specific scheme are
discussed in the relevant chapters.
In attempt to alleviate the data limitations, the research team undertook a thorough investigation of topline
reported results, identified issues and where possible addressed them directly with the scheme. After this phase
of data quality checking, a more forensic assessment of the raw data (where available) followed. In this phase
the research team spotted, investigated and, where possible, rectified, data anomalies and errors. The final
phase of data checking consisted of a sense-check of calculations and methods used. Where feasible the
research team harmonised the data to make it comparable and standardised the data across the eight scheme
(e.g. including non-responses in percentages for survey results, adopting same calculation for tonnage change
with data series). As with any data checking process there comes a point where the data checking effort has
diminishing returns in terms of outcomes. This factor along with lack of time and resources means that certain
anomalies in the scheme’s data persist. With regards to the survey data the research team conducted some
additional statistical analysis to assess the comparability of the results.
It is important to recognise that this report represents a stock-take of eight schemes rather than a systematic
review of all 28 schemes, therefore, emerging findings and lessons learned need to be viewed in this context.
Final results and lessons may change when analysing data from all the schemes. This report focuses on the first
three research questions stated above (section 1.3). The reader should not attempt to draw definitive
conclusions from the results presented, especially around cost effectiveness and sustainability. The intent of
this interim report is not to provide answers but to outline emerging insights against the research questions.
The structure of the report is as follows:
Overview of findings (chapter 2) – this chapter acts as a summary of the results to date looking at
tonnages and costs, and audience and behaviour across all eight schemes;
Case studies (chapter 3) – this chapter is formed of a two to four page, standalone case study of each of
the eight schemes looking at how the scheme came about, scheme delivery, and impacts and outcomes;
Lessons and insights (chapter 4) – a concluding chapter discussing key insights, lessons and take-out
messages to date around the relevant research questions; and
Next steps (chapter 5) – this chapter outlines the timeline for the evaluation and remaining schemes.
EV0530 Evaluation of the Waste Reward and Recognition | An interim report Chapter 2 | Overview of findings
8
2 Overview of findings
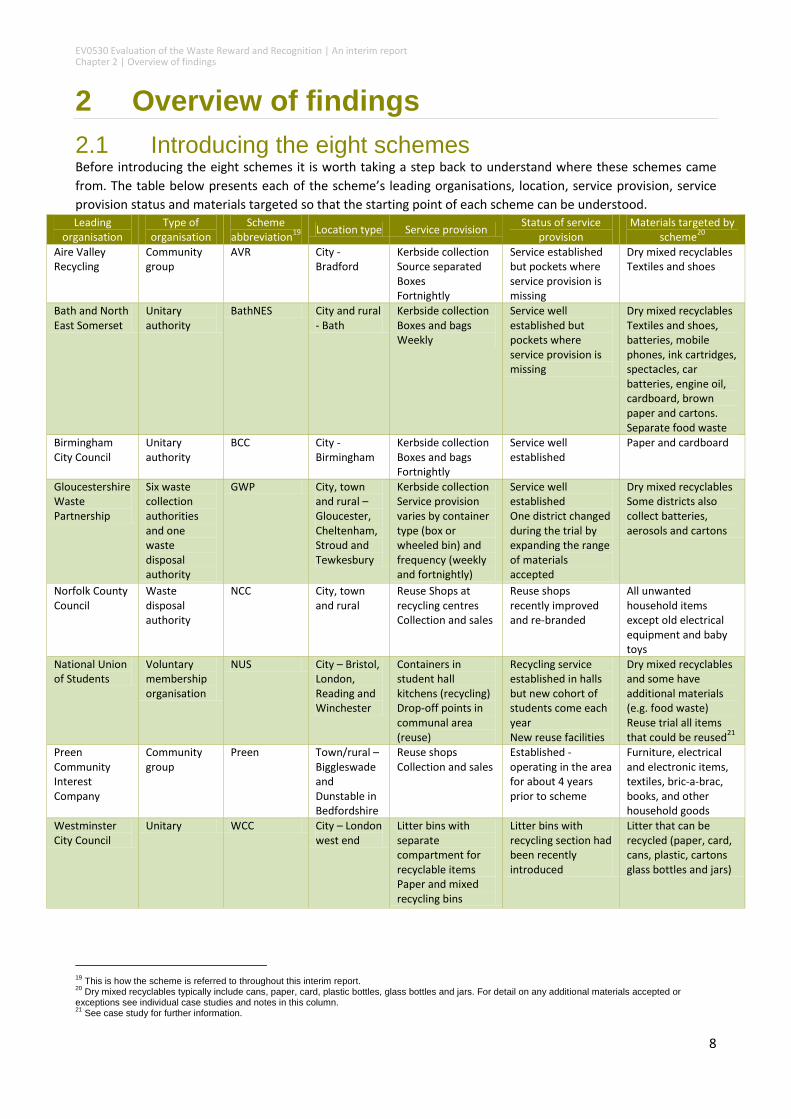
2.1 Introducing the eight schemes Before introducing the eight schemes it is worth taking a step back to understand where these schemes came
from. The table below presents each of the scheme’s leading organisations, location, service provision, service
provision status and materials targeted so that the starting point of each scheme can be understood. Leading
organisation Type of
organisation Scheme
abbreviation19
Location type Service provision
Status of service provision
Materials targeted by scheme
20
Aire Valley Recycling
Community group
AVR City - Bradford
Kerbside collection Source separated Boxes Fortnightly
Service established but pockets where service provision is missing
Dry mixed recyclables Textiles and shoes
Bath and North East Somerset
Unitary authority
BathNES City and rural - Bath
Kerbside collection Boxes and bags Weekly
Service well established but pockets where service provision is missing
Dry mixed recyclables Textiles and shoes, batteries, mobile phones, ink cartridges, spectacles, car batteries, engine oil, cardboard, brown paper and cartons. Separate food waste
Birmingham City Council
Unitary authority
BCC City - Birmingham
Kerbside collection Boxes and bags Fortnightly
Service well established
Paper and cardboard
Gloucestershire Waste Partnership
Six waste collection authorities and one waste disposal authority
GWP City, town and rural –Gloucester, Cheltenham, Stroud and Tewkesbury
Kerbside collection Service provision varies by container type (box or wheeled bin) and frequency (weekly and fortnightly)
Service well established One district changed during the trial by expanding the range of materials accepted
Dry mixed recyclables Some districts also collect batteries, aerosols and cartons
Norfolk County Council
Waste disposal authority
NCC City, town and rural
Reuse Shops at recycling centres Collection and sales
Reuse shops recently improved and re-branded
All unwanted household items except old electrical equipment and baby toys
National Union of Students
Voluntary membership organisation
NUS City – Bristol, London, Reading and Winchester
Containers in student hall kitchens (recycling) Drop-off points in communal area (reuse)
Recycling service established in halls but new cohort of students come each year New reuse facilities
Dry mixed recyclables and some have additional materials (e.g. food waste) Reuse trial all items that could be reused
21
Preen Community Interest Company
Community group
Preen Town/rural – Biggleswade and Dunstable in Bedfordshire
Reuse shops Collection and sales
Established - operating in the area for about 4 years prior to scheme
Furniture, electrical and electronic items, textiles, bric-a-brac, books, and other household goods
Westminster City Council
Unitary WCC City – London west end
Litter bins with separate compartment for recyclable items Paper and mixed recycling bins
Litter bins with recycling section had been recently introduced
Litter that can be recycled (paper, card, cans, plastic, cartons glass bottles and jars)
19
This is how the scheme is referred to throughout this interim report. 20
Dry mixed recyclables typically include cans, paper, card, plastic bottles, glass bottles and jars. For detail on any additional materials accepted or exceptions see individual case studies and notes in this column. 21
See case study for further information.
EV0530 Evaluation of the Waste Reward and Recognition | An interim report Chapter 2 | Overview of findings
9
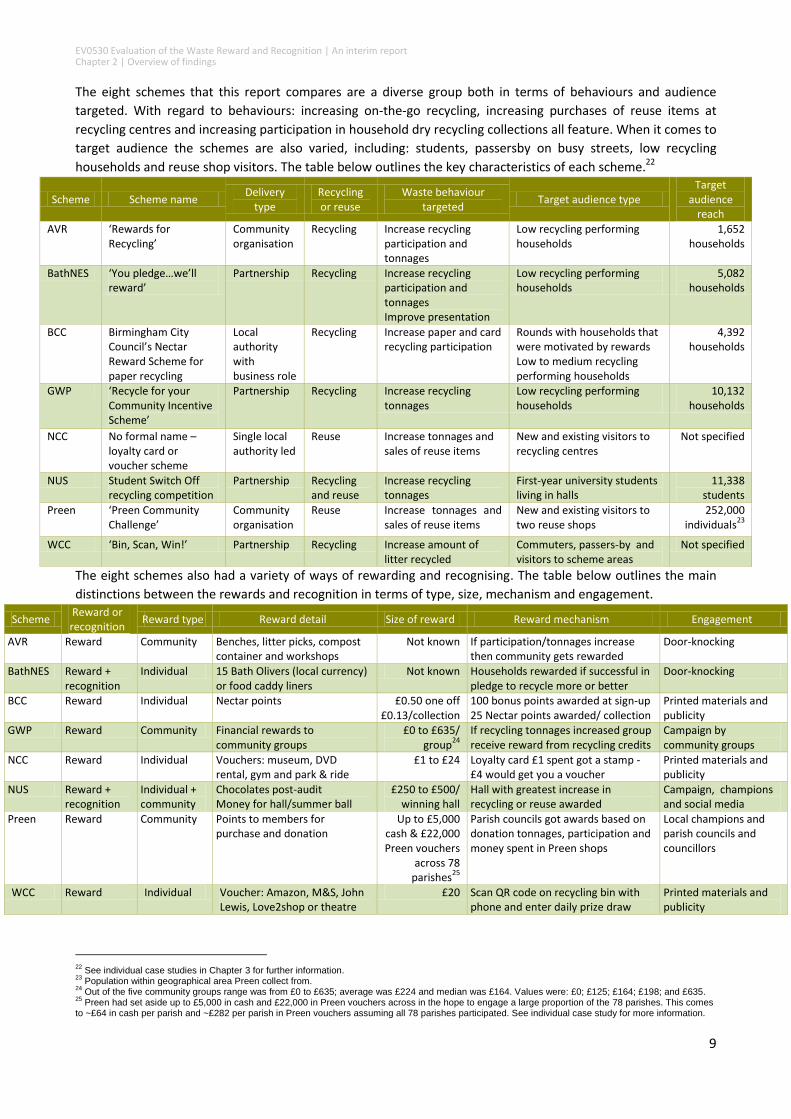
The eight schemes that this report compares are a diverse group both in terms of behaviours and audience
targeted. With regard to behaviours: increasing on-the-go recycling, increasing purchases of reuse items at
recycling centres and increasing participation in household dry recycling collections all feature. When it comes to
target audience the schemes are also varied, including: students, passersby on busy streets, low recycling
households and reuse shop visitors. The table below outlines the key characteristics of each scheme.22
Scheme Scheme name Delivery
type Recycling or reuse
Waste behaviour targeted
Target audience type Target
audience reach
AVR ‘Rewards for Recycling’
Community organisation
Recycling Increase recycling participation and tonnages
Low recycling performing households
1,652 households
BathNES ‘You pledge…we’ll reward’
Partnership Recycling Increase recycling participation and tonnages Improve presentation
Low recycling performing households
5,082 households
BCC Birmingham City Council’s Nectar Reward Scheme for paper recycling
Local authority with business role
Recycling Increase paper and card recycling participation
Rounds with households that were motivated by rewards Low to medium recycling performing households
4,392 households
GWP ‘Recycle for your Community Incentive Scheme’
Partnership Recycling Increase recycling tonnages
Low recycling performing households
10,132 households
NCC No formal name – loyalty card or voucher scheme
Single local authority led
Reuse Increase tonnages and sales of reuse items
New and existing visitors to recycling centres
Not specified
NUS Student Switch Off recycling competition
Partnership Recycling and reuse
Increase recycling tonnages
First-year university students living in halls
11,338 students
Preen ‘Preen Community Challenge’
Community organisation
Reuse Increase tonnages and sales of reuse items
New and existing visitors to two reuse shops
252,000 individuals
23
WCC ‘Bin, Scan, Win!’ Partnership Recycling Increase amount of litter recycled
Commuters, passers-by and visitors to scheme areas
Not specified
The eight schemes also had a variety of ways of rewarding and recognising. The table below outlines the main
distinctions between the rewards and recognition in terms of type, size, mechanism and engagement.
Scheme Reward or recognition
Reward type Reward detail Size of reward Reward mechanism Engagement
AVR Reward Community Benches, litter picks, compost container and workshops
Not known If participation/tonnages increase then community gets rewarded
Door-knocking
BathNES Reward + recognition
Individual 15 Bath Olivers (local currency) or food caddy liners
Not known Households rewarded if successful in pledge to recycle more or better
Door-knocking
BCC Reward Individual Nectar points £0.50 one off £0.13/collection
100 bonus points awarded at sign-up 25 Nectar points awarded/ collection
Printed materials and publicity
GWP Reward Community Financial rewards to community groups
£0 to £635/ group
24
If recycling tonnages increased group receive reward from recycling credits
Campaign by community groups
NCC Reward Individual Vouchers: museum, DVD rental, gym and park & ride
£1 to £24 Loyalty card £1 spent got a stamp - £4 would get you a voucher
Printed materials and publicity
NUS Reward + recognition
Individual + community
Chocolates post-audit Money for hall/summer ball
£250 to £500/ winning hall
Hall with greatest increase in recycling or reuse awarded
Campaign, champions and social media
Preen Reward Community Points to members for purchase and donation
Up to £5,000 cash & £22,000 Preen vouchers
across 78 parishes
25
Parish councils got awards based on donation tonnages, participation and money spent in Preen shops
Local champions and parish councils and councillors
WCC Reward Individual Voucher: Amazon, M&S, John Lewis, Love2shop or theatre
£20 Scan QR code on recycling bin with phone and enter daily prize draw
Printed materials and publicity
22
See individual case studies in Chapter 3 for further information. 23
Population within geographical area Preen collect from. 24
Out of the five community groups range was from £0 to £635; average was £224 and median was £164. Values were: £0; £125; £164; £198; and £635. 25
Preen had set aside up to £5,000 in cash and £22,000 in Preen vouchers across in the hope to engage a large proportion of the 78 parishes. This comes to ~£64 in cash per parish and ~£282 per parish in Preen vouchers assuming all 78 parishes participated. See individual case study for more information.
EV0530 Evaluation of the Waste Reward and Recognition | An interim report Chapter 2 | Overview of findings
10
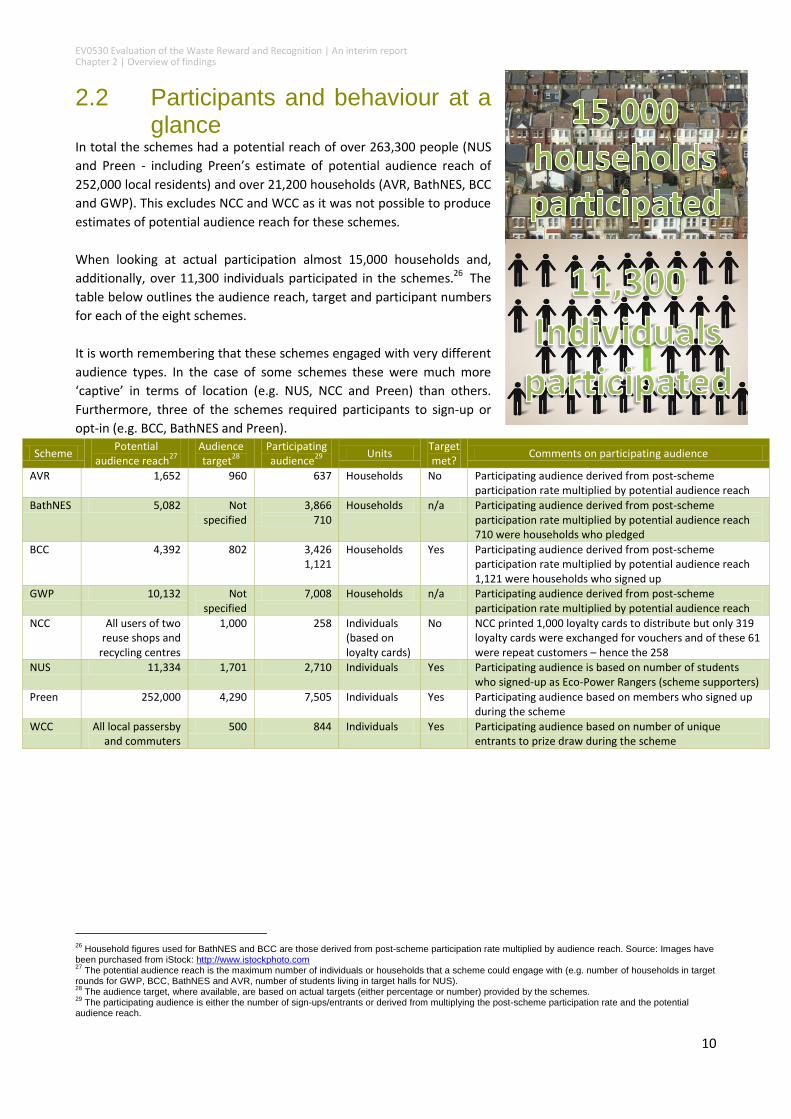
2.2 Participants and behaviour at a glance
In total the schemes had a potential reach of over 263,300 people (NUS
and Preen - including Preen’s estimate of potential audience reach of
252,000 local residents) and over 21,200 households (AVR, BathNES, BCC
and GWP). This excludes NCC and WCC as it was not possible to produce
estimates of potential audience reach for these schemes.
When looking at actual participation almost 15,000 households and,
additionally, over 11,300 individuals participated in the schemes.26 The
table below outlines the audience reach, target and participant numbers
for each of the eight schemes.
It is worth remembering that these schemes engaged with very different
audience types. In the case of some schemes these were much more
‘captive’ in terms of location (e.g. NUS, NCC and Preen) than others.
Furthermore, three of the schemes required participants to sign-up or
opt-in (e.g. BCC, BathNES and Preen).
Scheme Potential
audience reach27
Audience target
28
Participating audience
29
Units Target met?
Comments on participating audience
AVR 1,652 960 637 Households No Participating audience derived from post-scheme participation rate multiplied by potential audience reach
BathNES 5,082 Not specified
3,866 710
Households n/a Participating audience derived from post-scheme participation rate multiplied by potential audience reach 710 were households who pledged
BCC 4,392 802 3,426 1,121
Households Yes Participating audience derived from post-scheme participation rate multiplied by potential audience reach 1,121 were households who signed up
GWP 10,132 Not specified
7,008 Households n/a Participating audience derived from post-scheme participation rate multiplied by potential audience reach
NCC All users of two reuse shops and
recycling centres
1,000 258 Individuals (based on loyalty cards)
No NCC printed 1,000 loyalty cards to distribute but only 319 loyalty cards were exchanged for vouchers and of these 61 were repeat customers – hence the 258
NUS 11,334 1,701 2,710 Individuals Yes Participating audience is based on number of students who signed-up as Eco-Power Rangers (scheme supporters)
Preen 252,000 4,290 7,505 Individuals Yes Participating audience based on members who signed up during the scheme
WCC All local passersby and commuters
500 844 Individuals Yes Participating audience based on number of unique entrants to prize draw during the scheme
26
Household figures used for BathNES and BCC are those derived from post-scheme participation rate multiplied by audience reach. Source: Images have been purchased from iStock: http://www.istockphoto.com 27
The potential audience reach is the maximum number of individuals or households that a scheme could engage with (e.g. number of households in target rounds for GWP, BCC, BathNES and AVR, number of students living in target halls for NUS). 28
The audience target, where available, are based on actual targets (either percentage or number) provided by the schemes. 29
The participating audience is either the number of sign-ups/entrants or derived from multiplying the post-scheme participation rate and the potential audience reach.

EV0530 Evaluation of the Waste Reward and Recognition | An interim report Chapter 2 | Overview of findings
11
When it comes to changes in behaviour, as reported in the post-scheme surveys, most respondents stated that
the scheme has not made a difference to how they recycle/reuse. Across the six schemes’ surveys between 16%
(n=31) and 46% (n=136) of respondents stated that they already recycled/reused and the scheme has given
them ‘extra encouragement’ to do so.30 The graph below compares the four most frequently given answer
options to this question.31
The research team used Pearson’s chi-squared test and standardised residuals to investigate whether the
differences between the schemes with regards to a specific survey question were significant. More detail of the
tests can be found in section 4.2.
After running these tests the following can be stated across the schemes:32
BCC and WCC respondents are more likely to have claimed that the scheme gave them extra
encouragement to recycle. This may be linked to the individual nature of their rewards.
NUS respondents are more likely to have claimed that they already recycled and that the scheme did
not make a difference to how they recycle compared to other scheme respondents. This may suggest
that some students were already in the habit of recycling before the scheme.
AVR and Preen respondents were less likely to be aware of the scheme but started to recycle/reuse or
recycle/reuse more for other reasons.
For a more detailed discussion of behaviours see section 4.2.
30
This question was not asked in NCC post-scheme survey and only asked in the online post-scheme survey for BathNES which achieved only 33 responses – so only the remaining six schemes are included in the analysis. In the survey analysis, NUS responses exclude London School of Economics as they offered a reuse scheme and had different questions in their survey. 31
It is worth noting that BCC, Preen and WCC asked these questions to those who had signed-up to their scheme which may reflect a more pre-disposed audience. Also some schemes added their own answer options to the question, these and ‘no response’ are also not shown in the graph. AVR, BCC, Preen and WCC asked this question of all respondents, while GWP only asked it of those who had heard of scheme. NUS had a routing anomaly in their results so it has been rebased on all respondents to survey. 32
It is worth noting that only the top four answers given to the question have been included in the statistical testing.
0% 10% 20% 30% 40% 50% 60% 70%
I wasn’t aware of the scheme but I started to recycle/reuse and/or recycle/reuse more for other
reasons
I started recycling/reusing because of the scheme and will carry on
I already recycled/reused and it has given me extra encouragement to recycle/reuse
I already recycled/reused and it hasn’t made a difference to how I recycle/reuse
Top four answers: Which of the statements below best describes you and the Rewards and Recognition Scheme?
WCC(Base=135)
GWP(Base=128)
Preen(Base=169)
NUS(Base=913)
BCC(Base=294)
AVR(Base=200)
EV0530 Evaluation of the Waste Reward and Recognition | An interim report Chapter 2 | Overview of findings
12
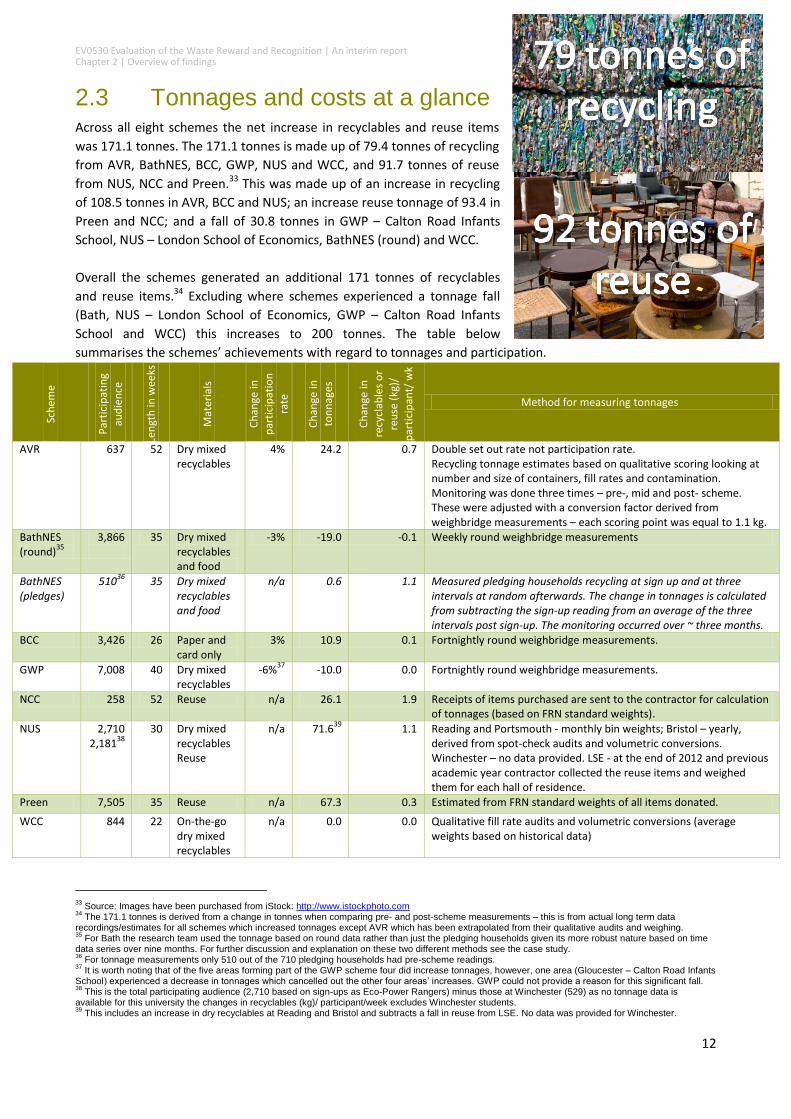
2.3 Tonnages and costs at a glance Across all eight schemes the net increase in recyclables and reuse items
was 171.1 tonnes. The 171.1 tonnes is made up of 79.4 tonnes of recycling
from AVR, BathNES, BCC, GWP, NUS and WCC, and 91.7 tonnes of reuse
from NUS, NCC and Preen.33 This was made up of an increase in recycling
of 108.5 tonnes in AVR, BCC and NUS; an increase reuse tonnage of 93.4 in
Preen and NCC; and a fall of 30.8 tonnes in GWP – Calton Road Infants
School, NUS – London School of Economics, BathNES (round) and WCC.
Overall the schemes generated an additional 171 tonnes of recyclables
and reuse items.34 Excluding where schemes experienced a tonnage fall
(Bath, NUS – London School of Economics, GWP – Calton Road Infants
School and WCC) this increases to 200 tonnes. The table below
summarises the schemes’ achievements with regard to tonnages and participation.
Sch
eme
Par
tici
pat
ing
aud
ien
ce
Len
gth
in w
eeks
Mat
eria
ls
Ch
ange
in
par
tici
pat
ion
rate
Ch
ange
in
ton
nag
es
Ch
ange
in
recy
clab
les
or
reu
se (
kg)/
par
tici
pan
t/ w
k Method for measuring tonnages
AVR 637 52 Dry mixed recyclables
4% 24.2 0.7 Double set out rate not participation rate. Recycling tonnage estimates based on qualitative scoring looking at number and size of containers, fill rates and contamination. Monitoring was done three times – pre-, mid and post- scheme. These were adjusted with a conversion factor derived from weighbridge measurements – each scoring point was equal to 1.1 kg.
BathNES (round)
35
3,866
35 Dry mixed recyclables and food
-3% -19.0 -0.1 Weekly round weighbridge measurements
BathNES (pledges)
51036
35 Dry mixed recyclables and food
n/a 0.6 1.1 Measured pledging households recycling at sign up and at three intervals at random afterwards. The change in tonnages is calculated from subtracting the sign-up reading from an average of the three intervals post sign-up. The monitoring occurred over ~ three months.
BCC 3,426 26 Paper and card only
3% 10.9 0.1 Fortnightly round weighbridge measurements.
GWP 7,008 40 Dry mixed recyclables
-6%37
-10.0 0.0 Fortnightly round weighbridge measurements.
NCC 258 52 Reuse n/a 26.1 1.9 Receipts of items purchased are sent to the contractor for calculation of tonnages (based on FRN standard weights).
NUS 2,710 2,181
38
30 Dry mixed recyclables Reuse
n/a 71.639
1.1 Reading and Portsmouth - monthly bin weights; Bristol – yearly, derived from spot-check audits and volumetric conversions. Winchester – no data provided. LSE - at the end of 2012 and previous academic year contractor collected the reuse items and weighed them for each hall of residence.
Preen 7,505 35 Reuse n/a 67.3 0.3 Estimated from FRN standard weights of all items donated.
WCC 844 22 On-the-go dry mixed recyclables
n/a 0.0 0.0 Qualitative fill rate audits and volumetric conversions (average weights based on historical data)
33
Source: Images have been purchased from iStock: http://www.istockphoto.com 34
The 171.1 tonnes is derived from a change in tonnes when comparing pre- and post-scheme measurements – this is from actual long term data recordings/estimates for all schemes which increased tonnages except AVR which has been extrapolated from their qualitative audits and weighing. 35
For Bath the research team used the tonnage based on round data rather than just the pledging households given its more robust nature based on time data series over nine months. For further discussion and explanation on these two different methods see the case study. 36
For tonnage measurements only 510 out of the 710 pledging households had pre-scheme readings. 37
It is worth noting that of the five areas forming part of the GWP scheme four did increase tonnages, however, one area (Gloucester – Calton Road Infants School) experienced a decrease in tonnages which cancelled out the other four areas’ increases. GWP could not provide a reason for this significant fall. 38
This is the total participating audience (2,710 based on sign-ups as Eco-Power Rangers) minus those at Winchester (529) as no tonnage data is available for this university the changes in recyclables (kg)/ participant/week excludes Winchester students. 39
This includes an increase in dry recyclables at Reading and Bristol and subtracts a fall in reuse from LSE. No data was provided for Winchester.
EV0530 Evaluation of the Waste Reward and Recognition | An interim report Chapter 2 | Overview of findings
13
£0
£20,000
£40,000
£60,000
£80,000
£100,000
£120,000Value of volunteers
Value of partnership & stakeholder collaborations
Value of in-kind contributions
Opportunity costs
Capital items
Rewards/ prizes
Revenue costs
Communications
Monitoring & evaluation costs
Level of Defra funding
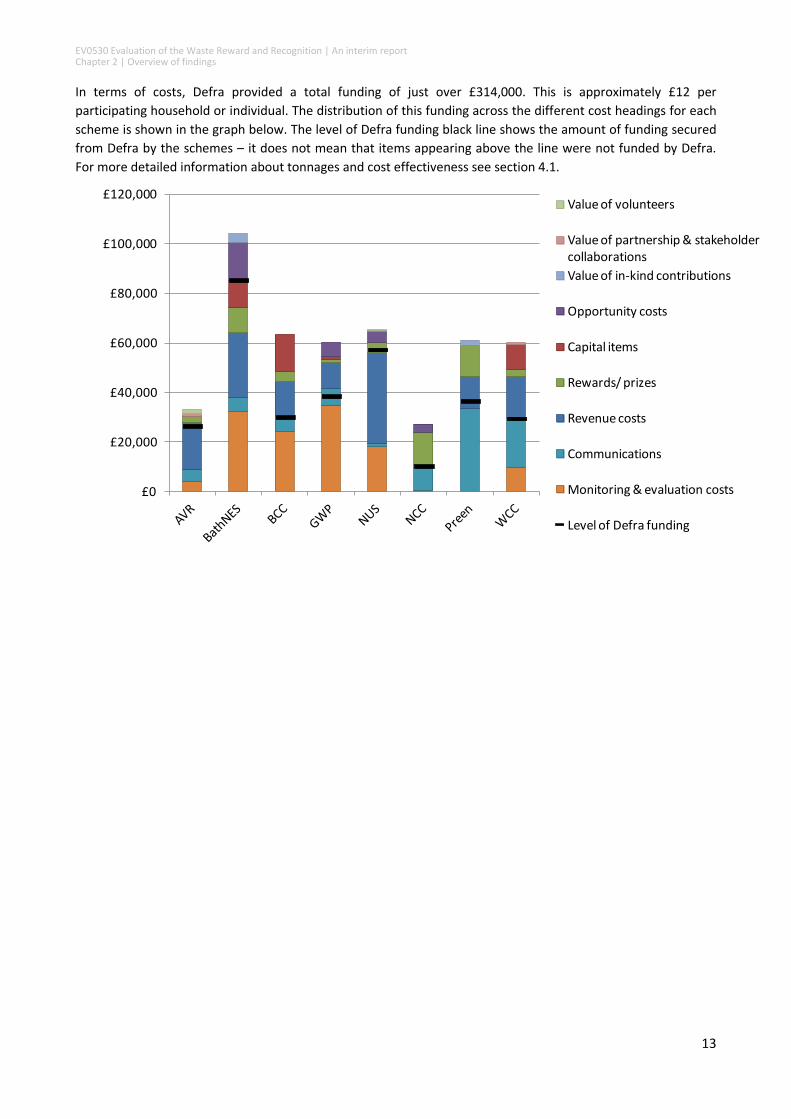
In terms of costs, Defra provided a total funding of just over £314,000. This is approximately £12 per
participating household or individual. The distribution of this funding across the different cost headings for each
scheme is shown in the graph below. The level of Defra funding black line shows the amount of funding secured
from Defra by the schemes – it does not mean that items appearing above the line were not funded by Defra.
For more detailed information about tonnages and cost effectiveness see section 4.1.
EV0530 Evaluation of the Waste Reward and Recognition | An interim report for Defra Chapter 3 |Case studies
14
3 Case studies
3.1 Aire Valley Recycling (AVR)
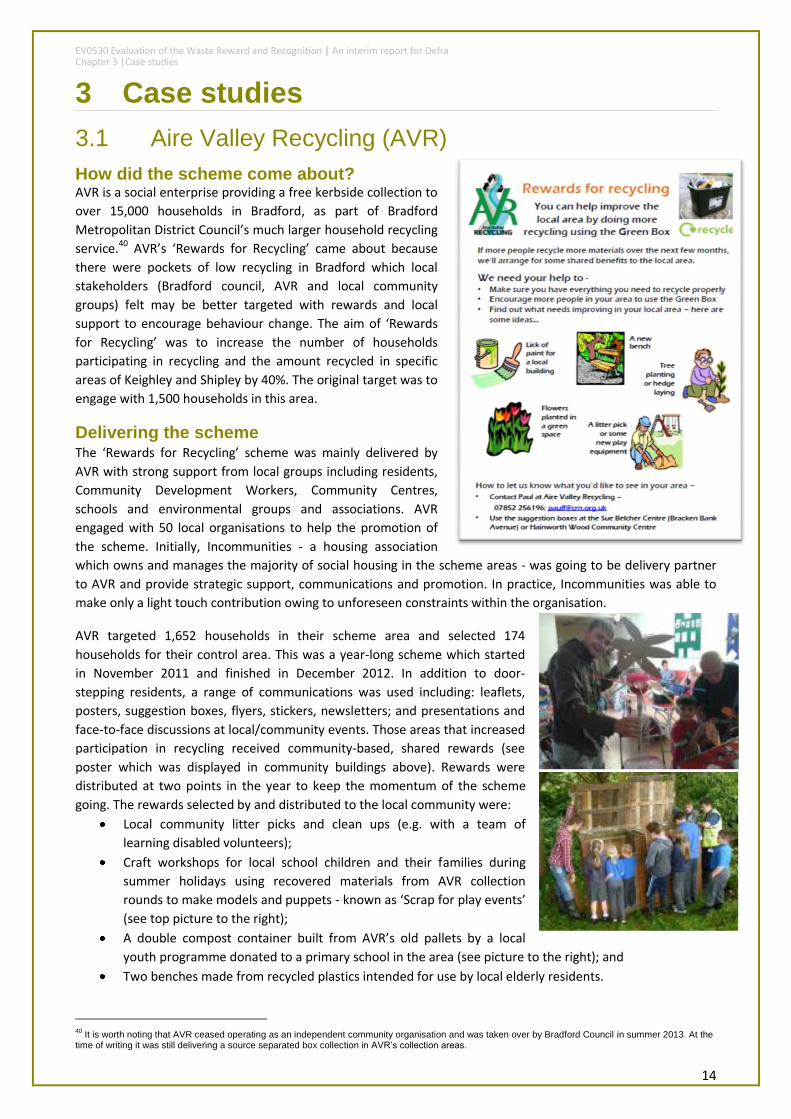
How did the scheme come about? AVR is a social enterprise providing a free kerbside collection to
over 15,000 households in Bradford, as part of Bradford
Metropolitan District Council’s much larger household recycling
service.40 AVR’s ‘Rewards for Recycling’ came about because
there were pockets of low recycling in Bradford which local
stakeholders (Bradford council, AVR and local community
groups) felt may be better targeted with rewards and local
support to encourage behaviour change. The aim of ‘Rewards
for Recycling’ was to increase the number of households
participating in recycling and the amount recycled in specific
areas of Keighley and Shipley by 40%. The original target was to
engage with 1,500 households in this area.
Delivering the scheme
The ‘Rewards for Recycling’ scheme was mainly delivered by
AVR with strong support from local groups including residents,
Community Development Workers, Community Centres,
schools and environmental groups and associations. AVR
engaged with 50 local organisations to help the promotion of
the scheme. Initially, Incommunities - a housing association
which owns and manages the majority of social housing in the scheme areas - was going to be delivery partner
to AVR and provide strategic support, communications and promotion. In practice, Incommunities was able to
make only a light touch contribution owing to unforeseen constraints within the organisation.
AVR targeted 1,652 households in their scheme area and selected 174
households for their control area. This was a year-long scheme which started
in November 2011 and finished in December 2012. In addition to door-
stepping residents, a range of communications was used including: leaflets,
posters, suggestion boxes, flyers, stickers, newsletters; and presentations and
face-to-face discussions at local/community events. Those areas that increased
participation in recycling received community-based, shared rewards (see
poster which was displayed in community buildings above). Rewards were
distributed at two points in the year to keep the momentum of the scheme
going. The rewards selected by and distributed to the local community were:
Local community litter picks and clean ups (e.g. with a team of
learning disabled volunteers);
Craft workshops for local school children and their families during
summer holidays using recovered materials from AVR collection
rounds to make models and puppets - known as ‘Scrap for play events’
(see top picture to the right);
A double compost container built from AVR’s old pallets by a local
youth programme donated to a primary school in the area (see picture to the right); and
Two benches made from recycled plastics intended for use by local elderly residents.
40
It is worth noting that AVR ceased operating as an independent community organisation and was taken over by Bradford Council in summer 2013. At the time of writing it was still delivering a source separated box collection in AVR’s collection areas.
EV0530 Evaluation of the Waste Reward and Recognition | An interim report for Defra Chapter 3 |Case studies
15
0.0
0.2
0.4
0.6
0.8
1.0
1.2
Scheme rounds (base = 1,652 hh)
Control (base = 174 hh)
kg
/hh
/wk
Estimated weight of recyclables
Pre-schemeNov/Dec 2011
InterimMay/July 2012
Post-schemeNov 2012
35%
22%
40%
26%
39%
28%
0%
5%
10%
15%
20%
25%
30%
35%
40%
45%
Scheme rounds (base = 1,652 hh)
Control (base = 174 hh)
Set-out rates
Pre-schemeNov/Dec 2011
InterimMay/July 2012
Post-schemeNov 2012
In order to assess the effectiveness of the scheme and to attribute the rewards, a range of monitoring and
evaluation activities took place:
Establishing a control area;
Pre-scheme, interim and post-scheme set out rate monitoring over two consecutive collection rounds
for scheme and control areas;
Pre-scheme, interim and post-scheme monitoring of tonnage estimates of recyclates41 by household for
scheme and control areas;
Pre-scheme attitudinal and behavioural survey via door-stepping in scheme (n= 439) and control areas
(n= 50);
Post-scheme attitudinal and behavioural survey delivered by post in scheme (n= 200) and control areas
(n=25); and
Two discussion groups with local participants in the AVR schemes.
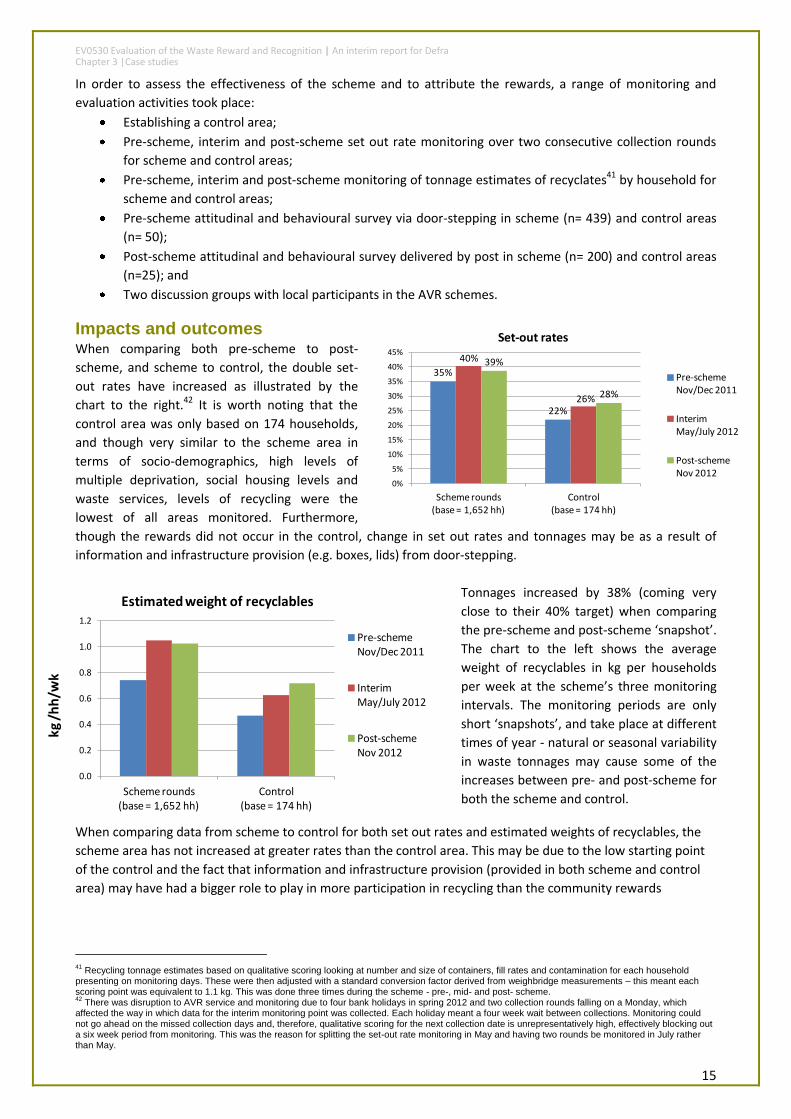
Impacts and outcomes When comparing both pre-scheme to post-
scheme, and scheme to control, the double set-
out rates have increased as illustrated by the
chart to the right.42 It is worth noting that the
control area was only based on 174 households,
and though very similar to the scheme area in
terms of socio-demographics, high levels of
multiple deprivation, social housing levels and
waste services, levels of recycling were the
lowest of all areas monitored. Furthermore,
though the rewards did not occur in the control, change in set out rates and tonnages may be as a result of
information and infrastructure provision (e.g. boxes, lids) from door-stepping.
Tonnages increased by 38% (coming very
close to their 40% target) when comparing
the pre-scheme and post-scheme ‘snapshot’.
The chart to the left shows the average
weight of recyclables in kg per households
per week at the scheme’s three monitoring
intervals. The monitoring periods are only
short ‘snapshots’, and take place at different
times of year - natural or seasonal variability
in waste tonnages may cause some of the
increases between pre- and post-scheme for
both the scheme and control.
When comparing data from scheme to control for both set out rates and estimated weights of recyclables, the
scheme area has not increased at greater rates than the control area. This may be due to the low starting point
of the control and the fact that information and infrastructure provision (provided in both scheme and control
area) may have had a bigger role to play in more participation in recycling than the community rewards
41
Recycling tonnage estimates based on qualitative scoring looking at number and size of containers, fill rates and contamination for each household presenting on monitoring days. These were then adjusted with a standard conversion factor derived from weighbridge measurements – this meant each scoring point was equivalent to 1.1 kg. This was done three times during the scheme - pre-, mid- and post- scheme. 42
There was disruption to AVR service and monitoring due to four bank holidays in spring 2012 and two collection rounds falling on a Monday, which affected the way in which data for the interim monitoring point was collected. Each holiday meant a four week wait between collections. Monitoring could not go ahead on the missed collection days and, therefore, qualitative scoring for the next collection date is unrepresentatively high, effectively blocking out a six week period from monitoring. This was the reason for splitting the set-out rate monitoring in May and having two rounds be monitored in July rather than May.
EV0530 Evaluation of the Waste Reward and Recognition | An interim report for Defra Chapter 3 |Case studies
16
“It needs to be community rewards because we’re all living in this community and we all share it.” Bracken Bank resident
£108
£19,034
£2,725
£4,727
£4,039
£728
£1,783Capital items
Revenue costs
Rewards/ prizes
Communications
Monitoring & evaluation costs
Value of partnership & stakeholder collaborations
Value of volunteers
(provided only in scheme area). Lack of longitudinal historic data makes it difficult to know how different
recycling levels in the scheme and control area were previously.
AVR managed to increase access to and ease of recycling for their target audience. At the post-scheme postal
survey stage in the scheme area only 12% (n=24) stated they did not have an AVR box (compared to 31% n=137
at the pre-scheme door-stepping survey), and 24% (n=48) stated that they recycled all or some of their
household items using avenues other than AVR (compared to 36% (n=156) at the pre-scheme door-stepping
survey). Two in five (42%, n=84) respondents claimed that they recycled more often than before when
compared to ten months ago and three in ten (30%, n=59) respondents stated they recycled a bigger proportion
of materials than before. Two in five (43%, n= 86), however, also stated that the scheme made no difference as
they already recycled and a quarter (24%, n=47) stated they increased their recycling for other reasons.
The scheme had low levels of recognition – when asked in the post-
scheme survey only a third (33%, n=65) of respondents said they
had heard of it. This may largely be explained by the lack of a clear
scheme name, branding and strap line to make the scheme more
memorable for participants and local residents. The scheme did not
have a consistent public facing name. This lack of identity meant
that discussion group participants also did not necessarily associate
the rewards with the scheme or AVR generally.
Focus group findings revealed that the rewards were well received and that
there seemed to be a preference for community rewards over individual
rewards. There may be, however, a self-selection bias in the sample from those
recruited to come to the discussion groups and/or from those actively
participating in the scheme (i.e. non recyclers may be less likely to take part in
community activities and respond to community rewards).
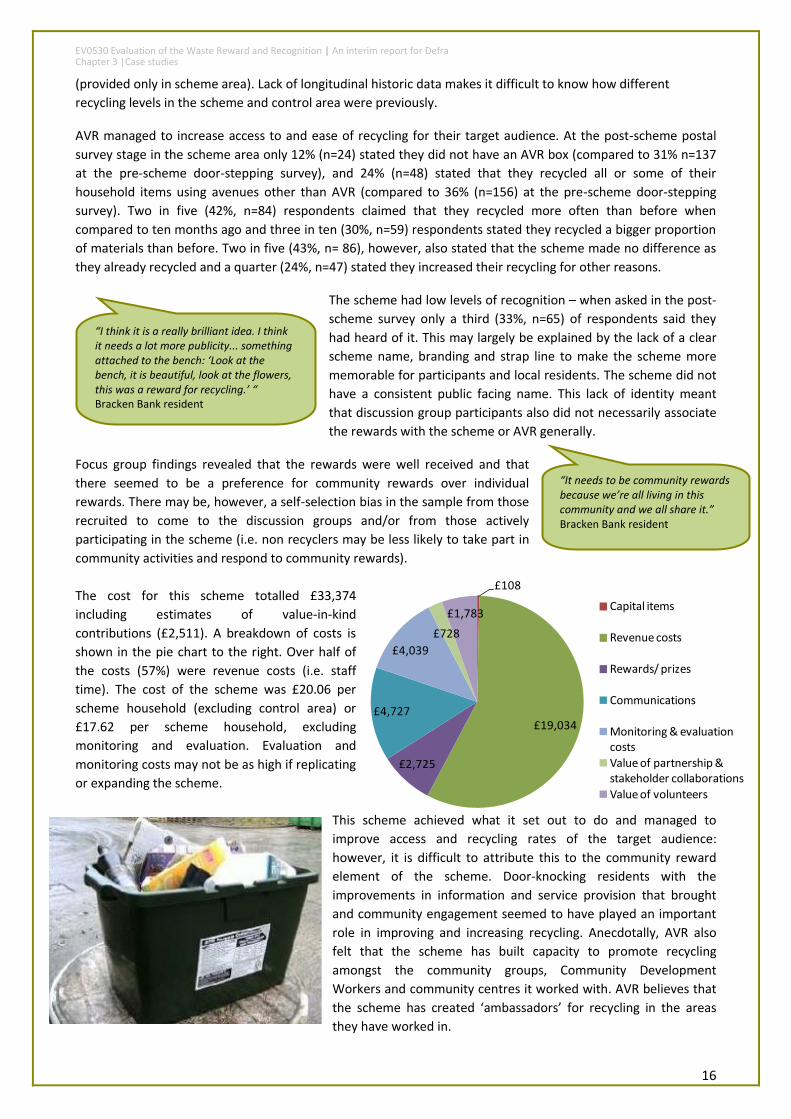
The cost for this scheme totalled £33,374
including estimates of value-in-kind
contributions (£2,511). A breakdown of costs is
shown in the pie chart to the right. Over half of
the costs (57%) were revenue costs (i.e. staff
time). The cost of the scheme was £20.06 per
scheme household (excluding control area) or
£17.62 per scheme household, excluding
monitoring and evaluation. Evaluation and
monitoring costs may not be as high if replicating
or expanding the scheme.
This scheme achieved what it set out to do and managed to
improve access and recycling rates of the target audience:
however, it is difficult to attribute this to the community reward
element of the scheme. Door-knocking residents with the
improvements in information and service provision that brought
and community engagement seemed to have played an important
role in improving and increasing recycling. Anecdotally, AVR also
felt that the scheme has built capacity to promote recycling
amongst the community groups, Community Development
Workers and community centres it worked with. AVR believes that
the scheme has created ‘ambassadors’ for recycling in the areas
they have worked in.
“I think it is a really brilliant idea. I think it needs a lot more publicity... something attached to the bench: ‘Look at the bench, it is beautiful, look at the flowers, this was a reward for recycling.’ “ Bracken Bank resident
EV0530 Evaluation of the Waste Reward and Recognition | An interim report for Defra Chapter 3 |Case studies
17
3.2 Bath and North East Somerset (BathNES)
How did the scheme come about? BathNES is a unitary authority that offers residents a weekly collection of black sack refuse and recycling. A
recycling box is provided for the collection of 16 materials (e.g. paper, cans, glass bottles and jars, foil, textiles,
shoes, etc) with a separate blue bag for cardboard, brown paper and drinks cartons. Food waste collections are
also provided using a kitchen caddy and lockable outside container.
The aims of the scheme were to increase overall tonnages in recycling collected; increase the number of
households participating in the service; and reduce the impact poor presentation of waste had on services like
neighbourhood cleaning, enforcement and missed collections. Three objectives were determined to measure
the overall impact of the scheme:
Deliver a recycling reward and recognition pilot scheme to 5,000 properties;
Increase overall recycling tonnages at 5,000 properties by
20% on average; and
Increase the number of households participating in food
waste and cardboard recycling collections at 5,000
properties by 20% on average.
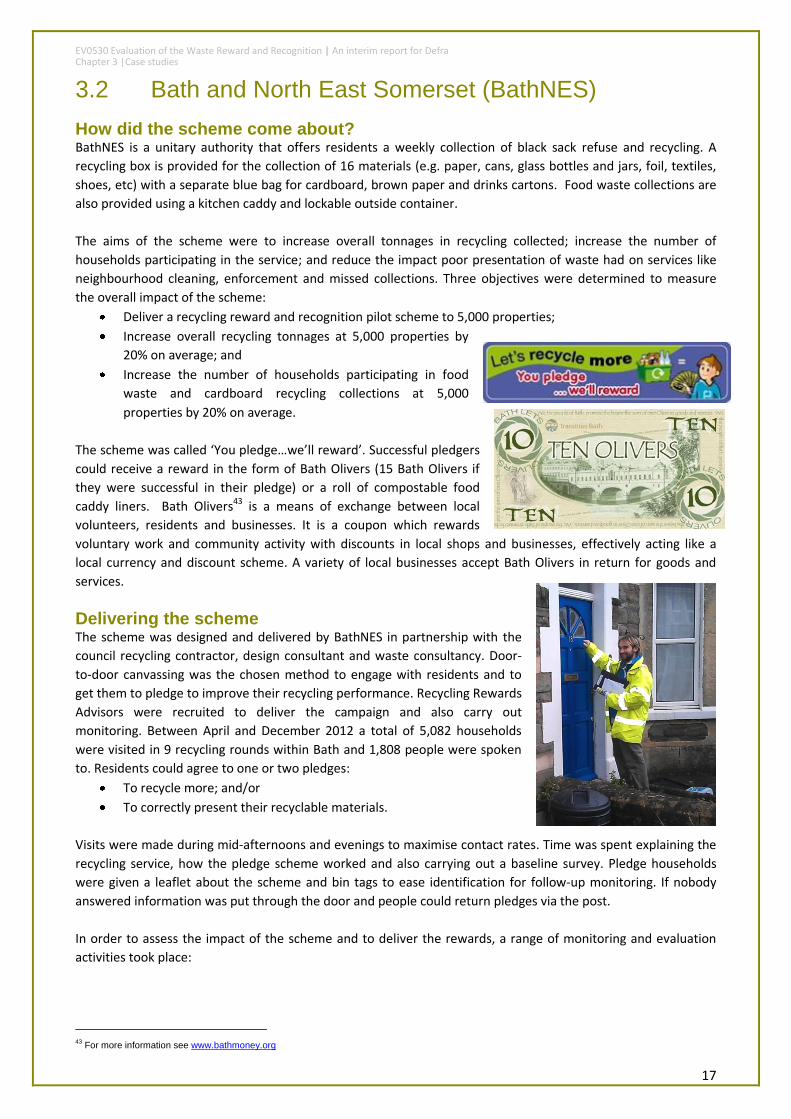
The scheme was called ‘You pledge…we’ll reward’. Successful pledgers
could receive a reward in the form of Bath Olivers (15 Bath Olivers if
they were successful in their pledge) or a roll of compostable food
caddy liners. Bath Olivers43 is a means of exchange between local
volunteers, residents and businesses. It is a coupon which rewards
voluntary work and community activity with discounts in local shops and businesses, effectively acting like a
local currency and discount scheme. A variety of local businesses accept Bath Olivers in return for goods and
services.
Delivering the scheme
The scheme was designed and delivered by BathNES in partnership with the
council recycling contractor, design consultant and waste consultancy. Door-
to-door canvassing was the chosen method to engage with residents and to
get them to pledge to improve their recycling performance. Recycling Rewards
Advisors were recruited to deliver the campaign and also carry out
monitoring. Between April and December 2012 a total of 5,082 households
were visited in 9 recycling rounds within Bath and 1,808 people were spoken
to. Residents could agree to one or two pledges:
To recycle more; and/or
To correctly present their recyclable materials.
Visits were made during mid-afternoons and evenings to maximise contact rates. Time was spent explaining the
recycling service, how the pledge scheme worked and also carrying out a baseline survey. Pledge households
were given a leaflet about the scheme and bin tags to ease identification for follow-up monitoring. If nobody
answered information was put through the door and people could return pledges via the post.
In order to assess the impact of the scheme and to deliver the rewards, a range of monitoring and evaluation
activities took place:
43
For more information see www.bathmoney.org

EV0530 Evaluation of the Waste Reward and Recognition | An interim report for Defra Chapter 3 |Case studies
18
0
1
2
3
4
5
6
Scheme rounds (base = 5,864 hh)
Control (base = 1,169 hh)
kg
/hh
/wk
Weight of recyclables (including food waste)
Pre-schemeApr-Dec 2011
Scheme periodApr-Dec 2012
0
100
200
300
400
500
600
700
800
900
1000
Scheme rounds (base = 5,864 hh)
Control (base = 1,169 hh)
Ton
na
ges
Total recycling tonnages (including food waste)
Pre-schemeApr-Dec 2011
Scheme periodApr-Dec 2012
Participation monitoring in all pledge rounds and the control rounds44 before the scheme and after
pledges had been made;
Weighing of recycling waste for pledge households45 during sign-up and at three randomly selected days
over the following three months;
Collection of recycling tonnage data by rounds; and
Attitudinal and behavioural surveys at sign-up (n=930) and when rewards were distributed to pledging
households either face-to-face or via feedback forms (n=293).46
Impacts and outcomes A total of 710 households made pledges (14% of households visited), 413 households were rewarded for
recycling more and 622 households were rewarded for presenting their recycling waste correctly.
For the 510 households that had pre- and post- scheme measurement of their recyclables (200 did not have pre-
scheme measurements47) the increase in recycling tonnage was 10% (approximately an additional 0.6 tonnes of
recycling when comparing sign-up weight to post-reward weight).48 Such an increase may suggest a positive
impact of the scheme on individual households who pledged.
Looking at collection tonnage data for the whole scheme area, there was a 13.2% increase in recycling from pre-
to post-scheme ‘snapshot’ weekly totals in the pledge rounds. However, a similar increase of 12.6% was noted in
the control rounds. This ‘snapshot’ methodology takes the average weekly weights across three collection weeks
prior to the scheme and the average weekly weights across three collection weeks at the end of the scheme. The
last three collection weeks were the last three weeks of December which may have seen irregular collection
services and atypical quantities of recycling due to seasonal variations. Furthermore when weighbridge
measurements were missing, averages from weeks before and after the missing data point were used to
determine the data point based on the trend.49
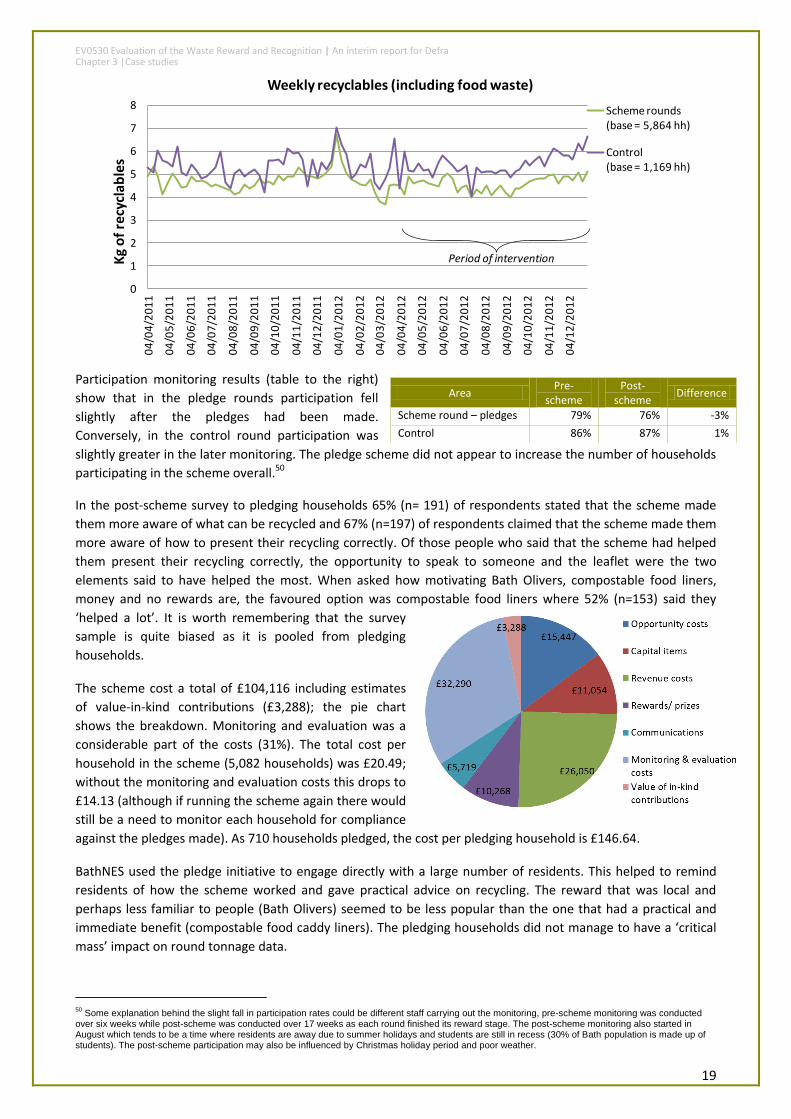
When looking at a data series of tonnages over the lifetime of the scheme, the scheme area did not have an
increase in recycling tonnages compared to the control rounds as illustrated by the charts below. The
percentage change for recycling tonnages for the scheme rounds was a decrease of -1.9% and for the control
rounds an increase of 1.5%. This contrasts with the ‘snapshot’ methodology above which gives a ~13% increase
in both scheme and control. In either case the 20% target figure was not reached. The difficulties of taking
‘snapshots’ when measuring rounds can be seen by the graph overleaf which illustrates how much round
tonnage data vary.
44
The control area was made up of two rounds covering 1,004 households. 45
During sign up householders agreed for their recycling waste to be measured and this was done shortly after they had been contacted. 46
A separate online survey was administered as well but only received 33 responses. 47
The lack of baseline data for 200 properties is because these households did not present any recycling materials in the pre-scheme monitoring period (i.e. within a week after pledging). There could be a number of reasons such as not having any recycling to present, being on holiday or forgetting, amongst others. However, these households were removed as the effect of not having any baseline data was that any recycling monitored and weighed in the scheme would have been a 100% improvement, which was not necessarily valid. 48
It is worth noting that BathNES measured pledging households recycling in each round at sign up and at three intervals at random afterwards. The percentage increase is calculated based on subtracting the sign-up reading from an average of the three intervals post sign-up divided by the sign-up reading. 49
The periods between pre- and post-scheme for rounds ranged between four to eight months, whereas the periods between pre- and post-scheme for weighing of pledging households was at most three months - this may explain why the increase shown is not as great.
EV0530 Evaluation of the Waste Reward and Recognition | An interim report for Defra Chapter 3 |Case studies
19
Participation monitoring results (table to the right)
show that in the pledge rounds participation fell
slightly after the pledges had been made.
Conversely, in the control round participation was
slightly greater in the later monitoring. The pledge scheme did not appear to increase the number of households
participating in the scheme overall.50
In the post-scheme survey to pledging households 65% (n= 191) of respondents stated that the scheme made
them more aware of what can be recycled and 67% (n=197) of respondents claimed that the scheme made them
more aware of how to present their recycling correctly. Of those people who said that the scheme had helped
them present their recycling correctly, the opportunity to speak to someone and the leaflet were the two
elements said to have helped the most. When asked how motivating Bath Olivers, compostable food liners,
money and no rewards are, the favoured option was compostable food liners where 52% (n=153) said they
‘helped a lot’. It is worth remembering that the survey
sample is quite biased as it is pooled from pledging
households.
The scheme cost a total of £104,116 including estimates
of value-in-kind contributions (£3,288); the pie chart
shows the breakdown. Monitoring and evaluation was a
considerable part of the costs (31%). The total cost per
household in the scheme (5,082 households) was £20.49;
without the monitoring and evaluation costs this drops to
£14.13 (although if running the scheme again there would
still be a need to monitor each household for compliance
against the pledges made). As 710 households pledged, the cost per pledging household is £146.64.
BathNES used the pledge initiative to engage directly with a large number of residents. This helped to remind
residents of how the scheme worked and gave practical advice on recycling. The reward that was local and
perhaps less familiar to people (Bath Olivers) seemed to be less popular than the one that had a practical and
immediate benefit (compostable food caddy liners). The pledging households did not manage to have a ‘critical
mass’ impact on round tonnage data.
50
Some explanation behind the slight fall in participation rates could be different staff carrying out the monitoring, pre-scheme monitoring was conducted over six weeks while post-scheme was conducted over 17 weeks as each round finished its reward stage. The post-scheme monitoring also started in August which tends to be a time where residents are away due to summer holidays and students are still in recess (30% of Bath population is made up of students). The post-scheme participation may also be influenced by Christmas holiday period and poor weather.
0
1
2
3
4
5
6
7
8
04
/04
/20
11
04
/05
/20
11
04
/06
/20
11
04
/07
/20
11
04
/08
/20
11
04
/09
/20
11
04
/10
/20
11
04
/11
/20
11
04
/12
/20
11
04
/01
/20
12
04
/02
/20
12
04
/03
/20
12
04
/04
/20
12
04
/05
/20
12
04
/06
/20
12
04
/07
/20
12
04
/08
/20
12
04
/09
/20
12
04
/10
/20
12
04
/11
/20
12
04
/12
/20
12
Kg
of
recy
cla
ble
s
Weekly recyclables (including food waste)
Scheme rounds (base = 5,864 hh)
Control (base = 1,169 hh)
Period of intervention
Area Pre-
scheme Post-
scheme Difference
Scheme round – pledges 79% 76% -3%
Control 86% 87% 1%
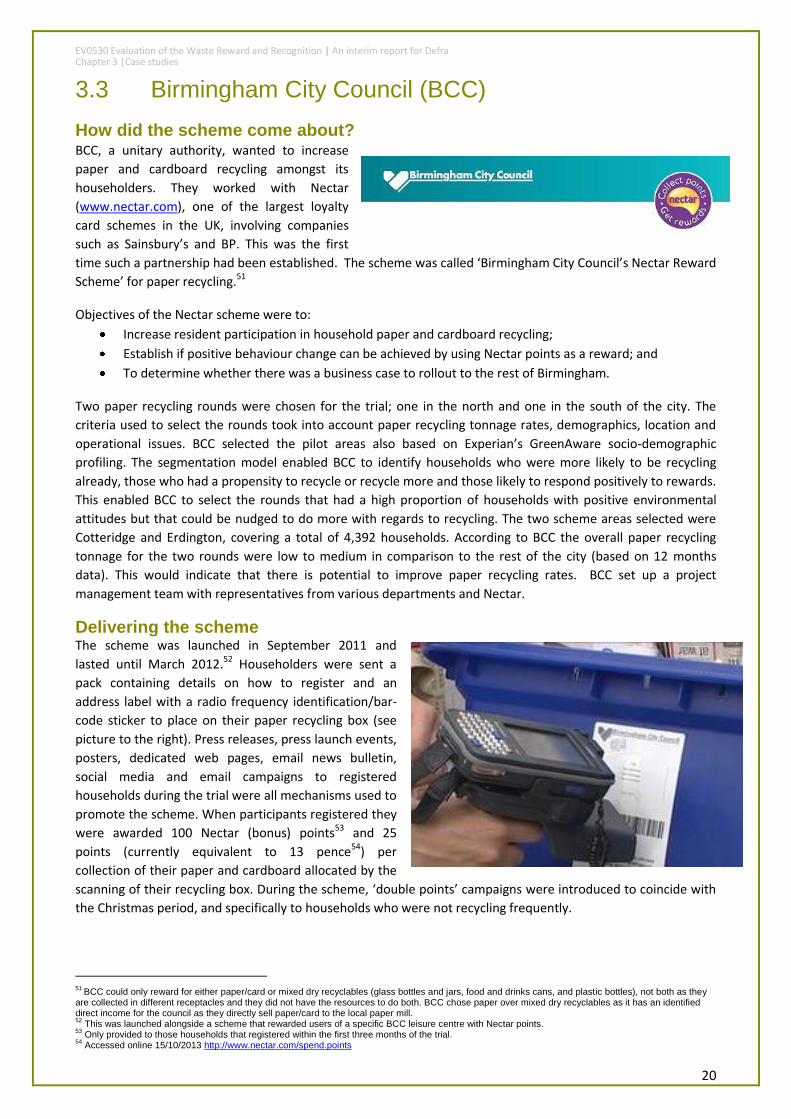
EV0530 Evaluation of the Waste Reward and Recognition | An interim report for Defra Chapter 3 |Case studies
20
3.3 Birmingham City Council (BCC)
How did the scheme come about? BCC, a unitary authority, wanted to increase
paper and cardboard recycling amongst its
householders. They worked with Nectar
(www.nectar.com), one of the largest loyalty
card schemes in the UK, involving companies
such as Sainsbury’s and BP. This was the first
time such a partnership had been established. The scheme was called ‘Birmingham City Council’s Nectar Reward
Scheme’ for paper recycling.51
Objectives of the Nectar scheme were to:
Increase resident participation in household paper and cardboard recycling;
Establish if positive behaviour change can be achieved by using Nectar points as a reward; and
To determine whether there was a business case to rollout to the rest of Birmingham.
Two paper recycling rounds were chosen for the trial; one in the north and one in the south of the city. The
criteria used to select the rounds took into account paper recycling tonnage rates, demographics, location and
operational issues. BCC selected the pilot areas also based on Experian’s GreenAware socio-demographic
profiling. The segmentation model enabled BCC to identify households who were more likely to be recycling
already, those who had a propensity to recycle or recycle more and those likely to respond positively to rewards.
This enabled BCC to select the rounds that had a high proportion of households with positive environmental
attitudes but that could be nudged to do more with regards to recycling. The two scheme areas selected were
Cotteridge and Erdington, covering a total of 4,392 households. According to BCC the overall paper recycling
tonnage for the two rounds were low to medium in comparison to the rest of the city (based on 12 months
data). This would indicate that there is potential to improve paper recycling rates. BCC set up a project
management team with representatives from various departments and Nectar.
Delivering the scheme The scheme was launched in September 2011 and
lasted until March 2012.52 Householders were sent a
pack containing details on how to register and an
address label with a radio frequency identification/bar-
code sticker to place on their paper recycling box (see
picture to the right). Press releases, press launch events,
posters, dedicated web pages, email news bulletin,
social media and email campaigns to registered
households during the trial were all mechanisms used to
promote the scheme. When participants registered they
were awarded 100 Nectar (bonus) points53 and 25
points (currently equivalent to 13 pence54) per
collection of their paper and cardboard allocated by the
scanning of their recycling box. During the scheme, ‘double points’ campaigns were introduced to coincide with
the Christmas period, and specifically to households who were not recycling frequently.
51
BCC could only reward for either paper/card or mixed dry recyclables (glass bottles and jars, food and drinks cans, and plastic bottles), not both as they are collected in different receptacles and they did not have the resources to do both. BCC chose paper over mixed dry recyclables as it has an identified direct income for the council as they directly sell paper/card to the local paper mill. 52
This was launched alongside a scheme that rewarded users of a specific BCC leisure centre with Nectar points. 53
Only provided to those households that registered within the first three months of the trial. 54
Accessed online 15/10/2013 http://www.nectar.com/spend.points

EV0530 Evaluation of the Waste Reward and Recognition | An interim report for Defra Chapter 3 |Case studies
21
0
1
1
2
2
3
Scheme rounds (base = 4,392 hh)
Control - rest of Birmingham (base = 415,689 hh)
kg/h
h/w
k
Paper and card recycling Sept 10-Mar 11
Apr 11-Aug 11
Scheme periodSept 11-Mar 12
In order to assess the impact of the scheme and to reward points, the following monitoring and evaluation
activities took place:
Records were kept of the recycling round tonnage data both for the scheme areas and the rest of
Birmingham which acted as their control area;
Participation monitoring was carried out before, mid and after the scheme;
A post-scheme online attitudinal and behavioural survey was conducted with participants (n= 294);
A post-scheme telephone survey was also conducted with 68 participants and 34 non-participants; and
Two discussion groups were carried out with residents55 and one amongst the project team.
Impacts and outcomes Over a quarter of households (26%, n=1,121) signed up to the scheme. The graph below shows the paper
tonnage data for the two trial rounds during the period of the scheme. It shows that there is variability in the
round weights56 with no obvious upward trend as a result of the Nectar scheme.
The totals for kg/household/week for paper
collected over different six month periods are
shown in the bar chart to the right for the
scheme area and the rest of Birmingham. The
chart shows that more paper and cardboard
were collected in the scheme areas during the
trial compared to the equivalent six month
period in the year before (an increase of 5%),
while there was a fall for the rest of
Birmingham (-3%).
When looking at participation monitoring very slightly more households were participating in paper recycling by
the end of the scheme - 78% (July 2012) compared to the 75% established before the launch of the scheme
(April 2011). Participation was measured as 74% at the mid scheme point. As all these measurements are very
close it is difficult to attribute any increase to the scheme.
From the on-line survey only a handful of respondents (2%, n=6) stated that ‘I started recycling because of the
Nectar scheme and will carry on’. Half (50%, n=146) of the respondents stated that ‘I already recycled and it
hasn't made a difference to how much I recycle’. Encouragement was, however, given to approximately half of
55
Attended by 13 scheme participants and three non-participants. 56
BCC queried the high tonnage for the Erdington round in November for anomalies in data or collection and there being no explanation to discount it decided to include it in the results. Its inclusion does not dramatically change the average tonnage. In early February the round configuration for Cotteridge changed so there are two data points missing.
0
2
4
6
8
10
12
14
16
Sep-11 Oct-11 Nov-11 Dec-11 Jan-12 Feb-12
Ton
nes
Average paper tonnes per fortnight Erdington(base = 2,299 hh)
Cotteridge (base = 2,093 hh)
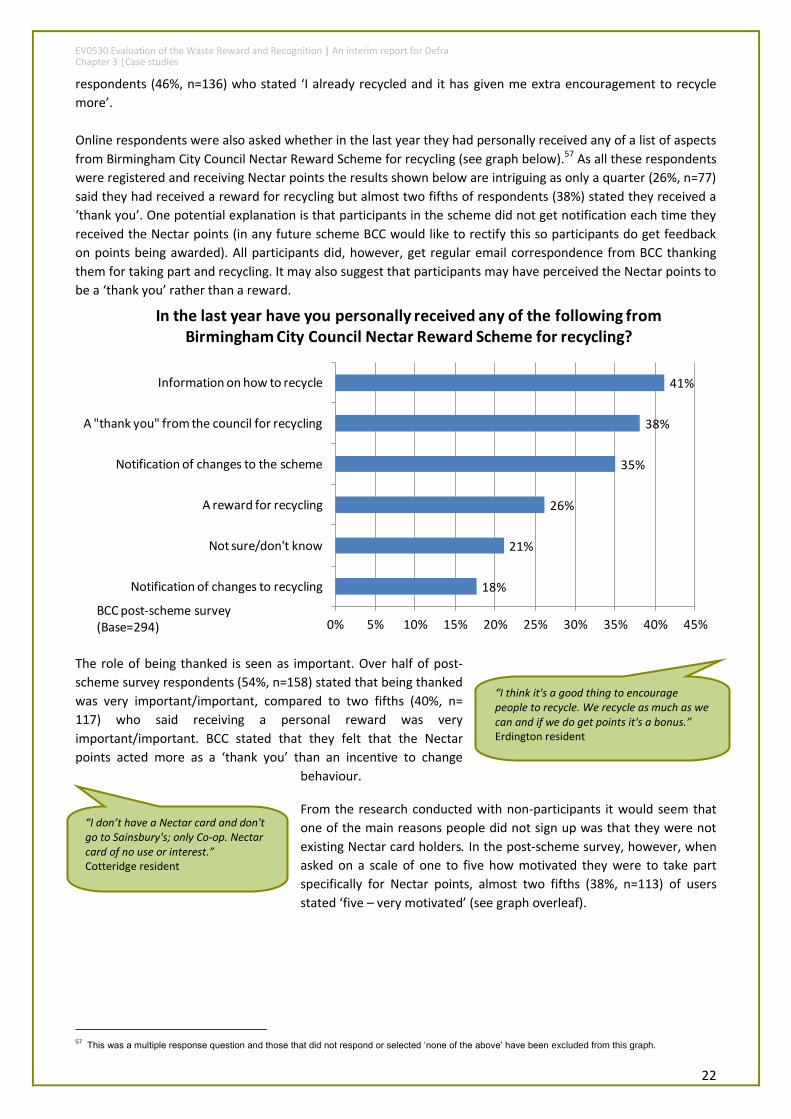
EV0530 Evaluation of the Waste Reward and Recognition | An interim report for Defra Chapter 3 |Case studies
22
“I think it's a good thing to encourage people to recycle. We recycle as much as we can and if we do get points it's a bonus.” Erdington resident
“I don’t have a Nectar card and don't go to Sainsbury's; only Co-op. Nectar card of no use or interest.” Cotteridge resident
respondents (46%, n=136) who stated ‘I already recycled and it has given me extra encouragement to recycle
more’.
Online respondents were also asked whether in the last year they had personally received any of a list of aspects
from Birmingham City Council Nectar Reward Scheme for recycling (see graph below).57 As all these respondents
were registered and receiving Nectar points the results shown below are intriguing as only a quarter (26%, n=77)
said they had received a reward for recycling but almost two fifths of respondents (38%) stated they received a
‘thank you’. One potential explanation is that participants in the scheme did not get notification each time they
received the Nectar points (in any future scheme BCC would like to rectify this so participants do get feedback
on points being awarded). All participants did, however, get regular email correspondence from BCC thanking
them for taking part and recycling. It may also suggest that participants may have perceived the Nectar points to
be a ‘thank you’ rather than a reward.
The role of being thanked is seen as important. Over half of post-
scheme survey respondents (54%, n=158) stated that being thanked
was very important/important, compared to two fifths (40%, n=
117) who said receiving a personal reward was very
important/important. BCC stated that they felt that the Nectar
points acted more as a ‘thank you’ than an incentive to change
behaviour.
From the research conducted with non-participants it would seem that
one of the main reasons people did not sign up was that they were not
existing Nectar card holders. In the post-scheme survey, however, when
asked on a scale of one to five how motivated they were to take part
specifically for Nectar points, almost two fifths (38%, n=113) of users
stated ‘five – very motivated’ (see graph overleaf).
57
This was a multiple response question and those that did not respond or selected ‘none of the above’ have been excluded from this graph.
18%
21%
26%
35%
38%
41%
0% 5% 10% 15% 20% 25% 30% 35% 40% 45%
Notification of changes to recycling
Not sure/don't know
A reward for recycling
Notification of changes to the scheme
A "thank you" from the council for recycling
Information on how to recycle
In the last year have you personally received any of the following from Birmingham City Council Nectar Reward Scheme for recycling?
BCC post-scheme survey(Base=294)
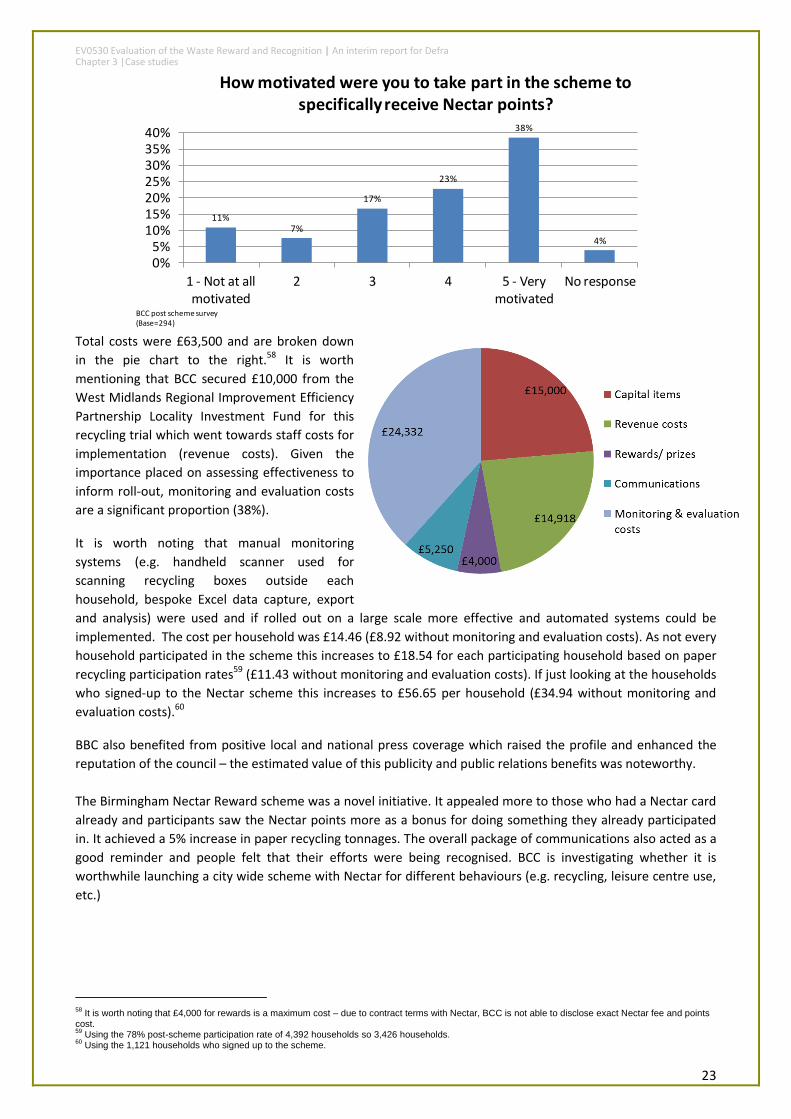
EV0530 Evaluation of the Waste Reward and Recognition | An interim report for Defra Chapter 3 |Case studies
23
11%7%
17%
23%
38%
4%
0%5%
10%15%20%25%30%35%40%
1 - Not at all motivated
2 3 4 5 - Very motivated
No response
How motivated were you to take part in the scheme to specifically receive Nectar points?
BCC post scheme survey(Base=294)
Total costs were £63,500 and are broken down
in the pie chart to the right.58 It is worth
mentioning that BCC secured £10,000 from the
West Midlands Regional Improvement Efficiency
Partnership Locality Investment Fund for this
recycling trial which went towards staff costs for
implementation (revenue costs). Given the
importance placed on assessing effectiveness to
inform roll-out, monitoring and evaluation costs
are a significant proportion (38%).
It is worth noting that manual monitoring
systems (e.g. handheld scanner used for
scanning recycling boxes outside each
household, bespoke Excel data capture, export
and analysis) were used and if rolled out on a large scale more effective and automated systems could be
implemented. The cost per household was £14.46 (£8.92 without monitoring and evaluation costs). As not every
household participated in the scheme this increases to £18.54 for each participating household based on paper
recycling participation rates59 (£11.43 without monitoring and evaluation costs). If just looking at the households
who signed-up to the Nectar scheme this increases to £56.65 per household (£34.94 without monitoring and
evaluation costs).60
BBC also benefited from positive local and national press coverage which raised the profile and enhanced the
reputation of the council – the estimated value of this publicity and public relations benefits was noteworthy.
The Birmingham Nectar Reward scheme was a novel initiative. It appealed more to those who had a Nectar card
already and participants saw the Nectar points more as a bonus for doing something they already participated
in. It achieved a 5% increase in paper recycling tonnages. The overall package of communications also acted as a
good reminder and people felt that their efforts were being recognised. BCC is investigating whether it is
worthwhile launching a city wide scheme with Nectar for different behaviours (e.g. recycling, leisure centre use,
etc.)
58
It is worth noting that £4,000 for rewards is a maximum cost – due to contract terms with Nectar, BCC is not able to disclose exact Nectar fee and points cost. 59
Using the 78% post-scheme participation rate of 4,392 households so 3,426 households. 60
Using the 1,121 households who signed up to the scheme.
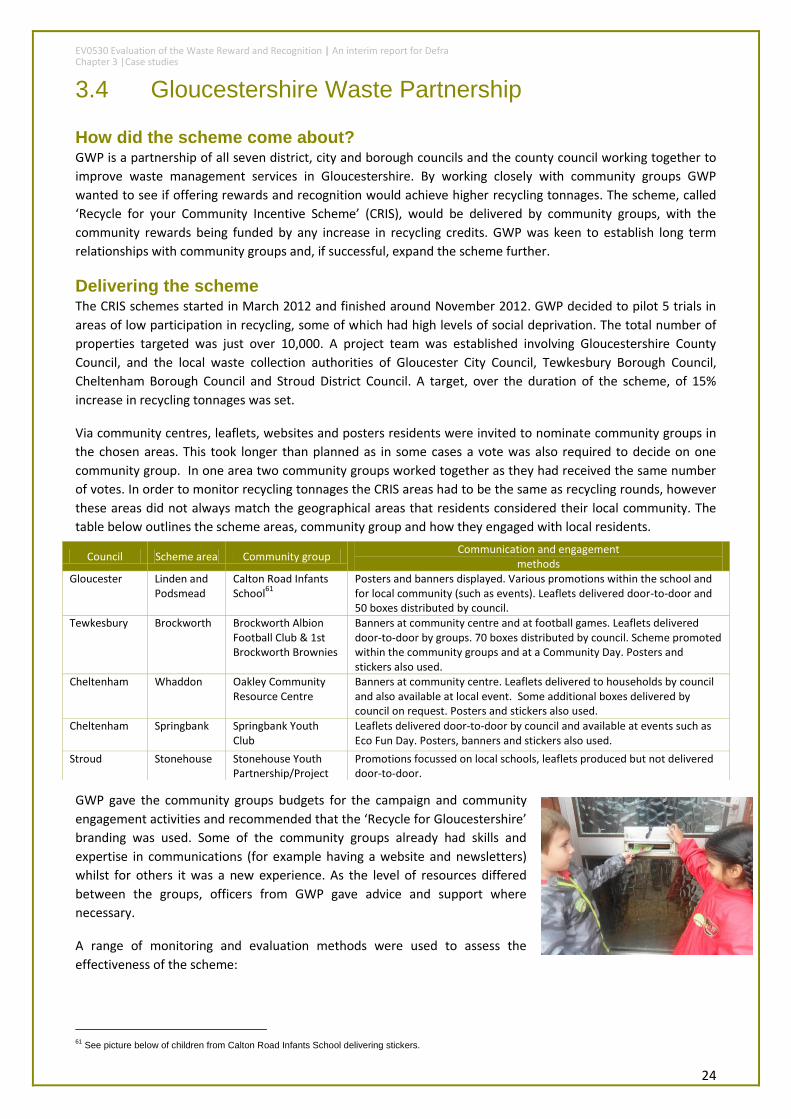
EV0530 Evaluation of the Waste Reward and Recognition | An interim report for Defra Chapter 3 |Case studies
24
3.4 Gloucestershire Waste Partnership
How did the scheme come about? GWP is a partnership of all seven district, city and borough councils and the county council working together to
improve waste management services in Gloucestershire. By working closely with community groups GWP
wanted to see if offering rewards and recognition would achieve higher recycling tonnages. The scheme, called
‘Recycle for your Community Incentive Scheme’ (CRIS), would be delivered by community groups, with the
community rewards being funded by any increase in recycling credits. GWP was keen to establish long term
relationships with community groups and, if successful, expand the scheme further.
Delivering the scheme The CRIS schemes started in March 2012 and finished around November 2012. GWP decided to pilot 5 trials in
areas of low participation in recycling, some of which had high levels of social deprivation. The total number of
properties targeted was just over 10,000. A project team was established involving Gloucestershire County
Council, and the local waste collection authorities of Gloucester City Council, Tewkesbury Borough Council,
Cheltenham Borough Council and Stroud District Council. A target, over the duration of the scheme, of 15%
increase in recycling tonnages was set.
Via community centres, leaflets, websites and posters residents were invited to nominate community groups in
the chosen areas. This took longer than planned as in some cases a vote was also required to decide on one
community group. In one area two community groups worked together as they had received the same number
of votes. In order to monitor recycling tonnages the CRIS areas had to be the same as recycling rounds, however
these areas did not always match the geographical areas that residents considered their local community. The
table below outlines the scheme areas, community group and how they engaged with local residents.
GWP gave the community groups budgets for the campaign and community
engagement activities and recommended that the ‘Recycle for Gloucestershire’
branding was used. Some of the community groups already had skills and
expertise in communications (for example having a website and newsletters)
whilst for others it was a new experience. As the level of resources differed
between the groups, officers from GWP gave advice and support where
necessary.
A range of monitoring and evaluation methods were used to assess the
effectiveness of the scheme:
61
See picture below of children from Calton Road Infants School delivering stickers.
Council Scheme area Community group Communication and engagement
methods Gloucester Linden and
Podsmead Calton Road Infants School
61
Posters and banners displayed. Various promotions within the school and for local community (such as events). Leaflets delivered door-to-door and 50 boxes distributed by council.
Tewkesbury Brockworth Brockworth Albion Football Club & 1st Brockworth Brownies
Banners at community centre and at football games. Leaflets delivered door-to-door by groups. 70 boxes distributed by council. Scheme promoted within the community groups and at a Community Day. Posters and stickers also used.
Cheltenham Whaddon Oakley Community Resource Centre
Banners at community centre. Leaflets delivered to households by council and also available at local event. Some additional boxes delivered by council on request. Posters and stickers also used.
Cheltenham Springbank Springbank Youth Club
Leaflets delivered door-to-door by council and available at events such as Eco Fun Day. Posters, banners and stickers also used.
Stroud Stonehouse Stonehouse Youth Partnership/Project
Promotions focussed on local schools, leaflets produced but not delivered door-to-door.
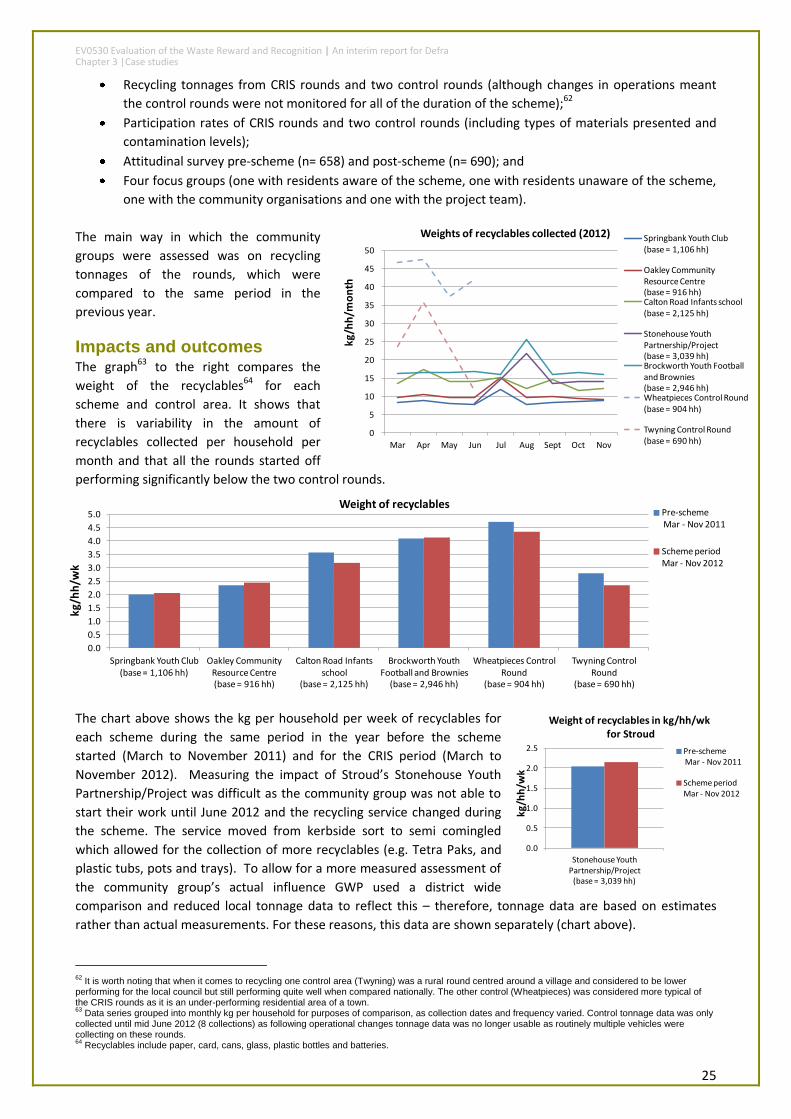
EV0530 Evaluation of the Waste Reward and Recognition | An interim report for Defra Chapter 3 |Case studies
25
0
5
10
15
20
25
30
35
40
45
50
Mar Apr May Jun Jul Aug Sept Oct Nov
kg/h
h/m
on
th
Weights of recyclables collected (2012) Springbank Youth Club (base = 1,106 hh)
Oakley Community Resource Centre (base = 916 hh)Calton Road Infants school (base = 2,125 hh)
Stonehouse Youth Partnership/Project (base = 3,039 hh)Brockworth Youth Football and Brownies (base = 2,946 hh)Wheatpieces Control Round (base = 904 hh)
Twyning Control Round (base = 690 hh)
0.0
0.5
1.0
1.5
2.0
2.5
3.0
3.5
4.0
4.5
5.0
Springbank Youth Club (base = 1,106 hh)
Oakley Community Resource Centre (base = 916 hh)
Calton Road Infants school
(base = 2,125 hh)
Brockworth Youth Football and Brownies
(base = 2,946 hh)
Wheatpieces Control Round
(base = 904 hh)
Twyning Control Round
(base = 690 hh)
kg/h
h/w
k
Weight of recyclables Pre-schemeMar - Nov 2011
Scheme periodMar - Nov 2012
0.0
0.5
1.0
1.5
2.0
2.5
Stonehouse Youth Partnership/Project
(base = 3,039 hh)
kg/h
h/w
k
Weight of recyclables in kg/hh/wkfor Stroud
Pre-schemeMar - Nov 2011
Scheme periodMar - Nov 2012
Recycling tonnages from CRIS rounds and two control rounds (although changes in operations meant
the control rounds were not monitored for all of the duration of the scheme);62
Participation rates of CRIS rounds and two control rounds (including types of materials presented and
contamination levels);
Attitudinal survey pre-scheme (n= 658) and post-scheme (n= 690); and
Four focus groups (one with residents aware of the scheme, one with residents unaware of the scheme,
one with the community organisations and one with the project team).
The main way in which the community
groups were assessed was on recycling
tonnages of the rounds, which were
compared to the same period in the
previous year.
Impacts and outcomes
The graph63 to the right compares the
weight of the recyclables64 for each
scheme and control area. It shows that
there is variability in the amount of
recyclables collected per household per
month and that all the rounds started off
performing significantly below the two control rounds.
The chart above shows the kg per household per week of recyclables for
each scheme during the same period in the year before the scheme
started (March to November 2011) and for the CRIS period (March to
November 2012). Measuring the impact of Stroud’s Stonehouse Youth
Partnership/Project was difficult as the community group was not able to
start their work until June 2012 and the recycling service changed during
the scheme. The service moved from kerbside sort to semi comingled
which allowed for the collection of more recyclables (e.g. Tetra Paks, and
plastic tubs, pots and trays). To allow for a more measured assessment of
the community group’s actual influence GWP used a district wide
comparison and reduced local tonnage data to reflect this – therefore, tonnage data are based on estimates
rather than actual measurements. For these reasons, this data are shown separately (chart above).
62
It is worth noting that when it comes to recycling one control area (Twyning) was a rural round centred around a village and considered to be lower performing for the local council but still performing quite well when compared nationally. The other control (Wheatpieces) was considered more typical of the CRIS rounds as it is an under-performing residential area of a town. 63
Data series grouped into monthly kg per household for purposes of comparison, as collection dates and frequency varied. Control tonnage data was only collected until mid June 2012 (8 collections) as following operational changes tonnage data was no longer usable as routinely multiple vehicles were collecting on these rounds. 64
Recyclables include paper, card, cans, glass, plastic bottles and batteries.
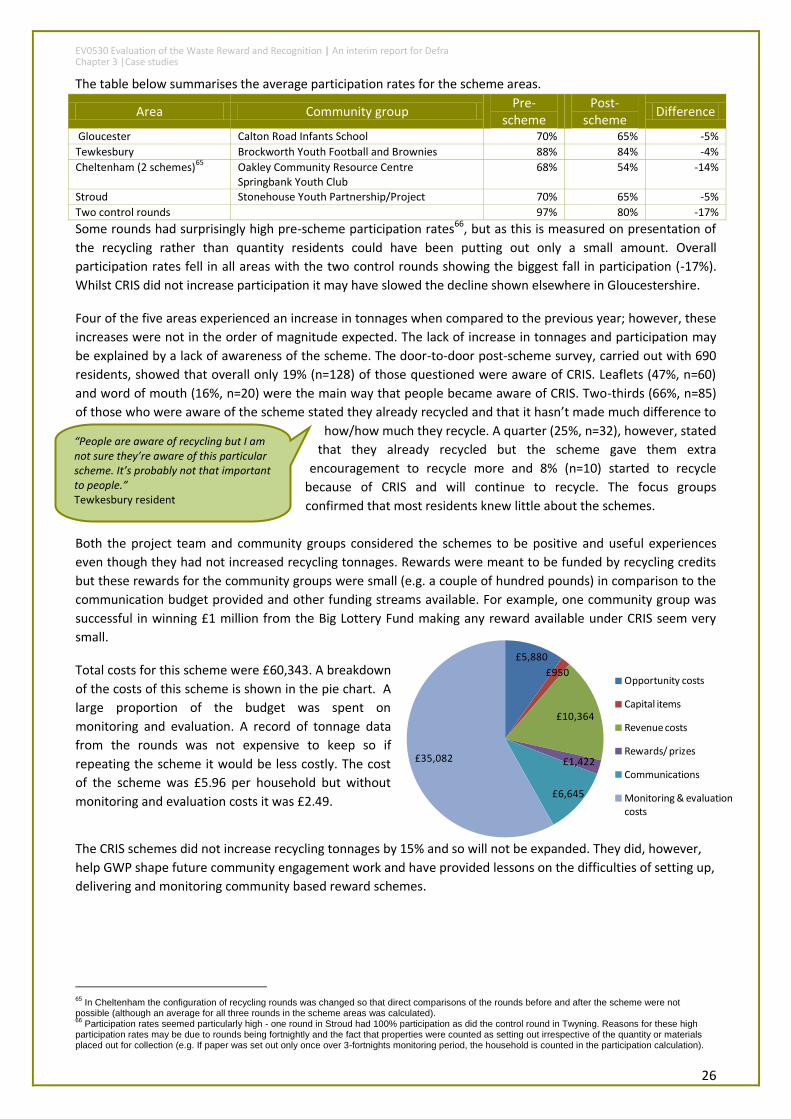
EV0530 Evaluation of the Waste Reward and Recognition | An interim report for Defra Chapter 3 |Case studies
26
£5,880
£950
£10,364
£1,422
£6,645
£35,082
Opportunity costs
Capital items
Revenue costs
Rewards/ prizes
Communications
Monitoring & evaluation costs
“People are aware of recycling but I am not sure they’re aware of this particular scheme. It’s probably not that important to people.” Tewkesbury resident
The table below summarises the average participation rates for the scheme areas.
Area Community group Pre-
scheme Post-
scheme Difference
Gloucester Calton Road Infants School 70% 65% -5%
Tewkesbury Brockworth Youth Football and Brownies 88% 84% -4%
Cheltenham (2 schemes)65
Oakley Community Resource Centre Springbank Youth Club
68% 54% -14%
Stroud Stonehouse Youth Partnership/Project 70% 65% -5%
Two control rounds 97% 80% -17%
Some rounds had surprisingly high pre-scheme participation rates66, but as this is measured on presentation of
the recycling rather than quantity residents could have been putting out only a small amount. Overall
participation rates fell in all areas with the two control rounds showing the biggest fall in participation (-17%).
Whilst CRIS did not increase participation it may have slowed the decline shown elsewhere in Gloucestershire.
Four of the five areas experienced an increase in tonnages when compared to the previous year; however, these
increases were not in the order of magnitude expected. The lack of increase in tonnages and participation may
be explained by a lack of awareness of the scheme. The door-to-door post-scheme survey, carried out with 690
residents, showed that overall only 19% (n=128) of those questioned were aware of CRIS. Leaflets (47%, n=60)
and word of mouth (16%, n=20) were the main way that people became aware of CRIS. Two-thirds (66%, n=85)
of those who were aware of the scheme stated they already recycled and that it hasn’t made much difference to
how/how much they recycle. A quarter (25%, n=32), however, stated
that they already recycled but the scheme gave them extra
encouragement to recycle more and 8% (n=10) started to recycle
because of CRIS and will continue to recycle. The focus groups
confirmed that most residents knew little about the schemes.
Both the project team and community groups considered the schemes to be positive and useful experiences
even though they had not increased recycling tonnages. Rewards were meant to be funded by recycling credits
but these rewards for the community groups were small (e.g. a couple of hundred pounds) in comparison to the
communication budget provided and other funding streams available. For example, one community group was
successful in winning £1 million from the Big Lottery Fund making any reward available under CRIS seem very
small.
Total costs for this scheme were £60,343. A breakdown
of the costs of this scheme is shown in the pie chart. A
large proportion of the budget was spent on
monitoring and evaluation. A record of tonnage data
from the rounds was not expensive to keep so if
repeating the scheme it would be less costly. The cost
of the scheme was £5.96 per household but without
monitoring and evaluation costs it was £2.49.
The CRIS schemes did not increase recycling tonnages by 15% and so will not be expanded. They did, however,
help GWP shape future community engagement work and have provided lessons on the difficulties of setting up,
delivering and monitoring community based reward schemes.
65
In Cheltenham the configuration of recycling rounds was changed so that direct comparisons of the rounds before and after the scheme were not possible (although an average for all three rounds in the scheme areas was calculated). 66
Participation rates seemed particularly high - one round in Stroud had 100% participation as did the control round in Twyning. Reasons for these high participation rates may be due to rounds being fortnightly and the fact that properties were counted as setting out irrespective of the quantity or materials placed out for collection (e.g. If paper was set out only once over 3-fortnights monitoring period, the household is counted in the participation calculation).
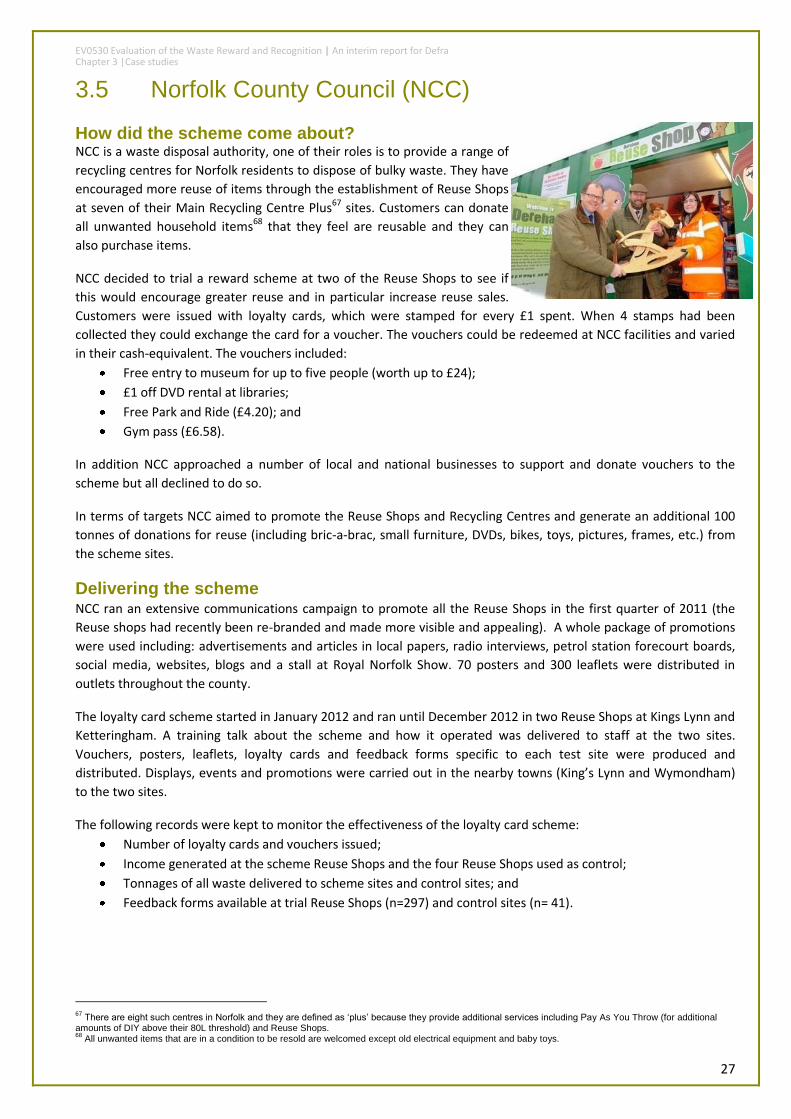
EV0530 Evaluation of the Waste Reward and Recognition | An interim report for Defra Chapter 3 |Case studies
27
3.5 Norfolk County Council (NCC)
How did the scheme come about? NCC is a waste disposal authority, one of their roles is to provide a range of
recycling centres for Norfolk residents to dispose of bulky waste. They have
encouraged more reuse of items through the establishment of Reuse Shops
at seven of their Main Recycling Centre Plus67 sites. Customers can donate
all unwanted household items68 that they feel are reusable and they can
also purchase items.
NCC decided to trial a reward scheme at two of the Reuse Shops to see if
this would encourage greater reuse and in particular increase reuse sales.
Customers were issued with loyalty cards, which were stamped for every £1 spent. When 4 stamps had been
collected they could exchange the card for a voucher. The vouchers could be redeemed at NCC facilities and varied
in their cash-equivalent. The vouchers included:
Free entry to museum for up to five people (worth up to £24);
£1 off DVD rental at libraries;
Free Park and Ride (£4.20); and
Gym pass (£6.58).
In addition NCC approached a number of local and national businesses to support and donate vouchers to the
scheme but all declined to do so.
In terms of targets NCC aimed to promote the Reuse Shops and Recycling Centres and generate an additional 100
tonnes of donations for reuse (including bric-a-brac, small furniture, DVDs, bikes, toys, pictures, frames, etc.) from
the scheme sites.
Delivering the scheme NCC ran an extensive communications campaign to promote all the Reuse Shops in the first quarter of 2011 (the
Reuse shops had recently been re-branded and made more visible and appealing). A whole package of promotions
were used including: advertisements and articles in local papers, radio interviews, petrol station forecourt boards,
social media, websites, blogs and a stall at Royal Norfolk Show. 70 posters and 300 leaflets were distributed in
outlets throughout the county.
The loyalty card scheme started in January 2012 and ran until December 2012 in two Reuse Shops at Kings Lynn and
Ketteringham. A training talk about the scheme and how it operated was delivered to staff at the two sites.
Vouchers, posters, leaflets, loyalty cards and feedback forms specific to each test site were produced and
distributed. Displays, events and promotions were carried out in the nearby towns (King’s Lynn and Wymondham)
to the two sites.
The following records were kept to monitor the effectiveness of the loyalty card scheme:
Number of loyalty cards and vouchers issued;
Income generated at the scheme Reuse Shops and the four Reuse Shops used as control;
Tonnages of all waste delivered to scheme sites and control sites; and
Feedback forms available at trial Reuse Shops (n=297) and control sites (n= 41).
67
There are eight such centres in Norfolk and they are defined as ‘plus’ because they provide additional services including Pay As You Throw (for additional amounts of DIY above their 80L threshold) and Reuse Shops. 68
All unwanted items that are in a condition to be resold are welcomed except old electrical equipment and baby toys.
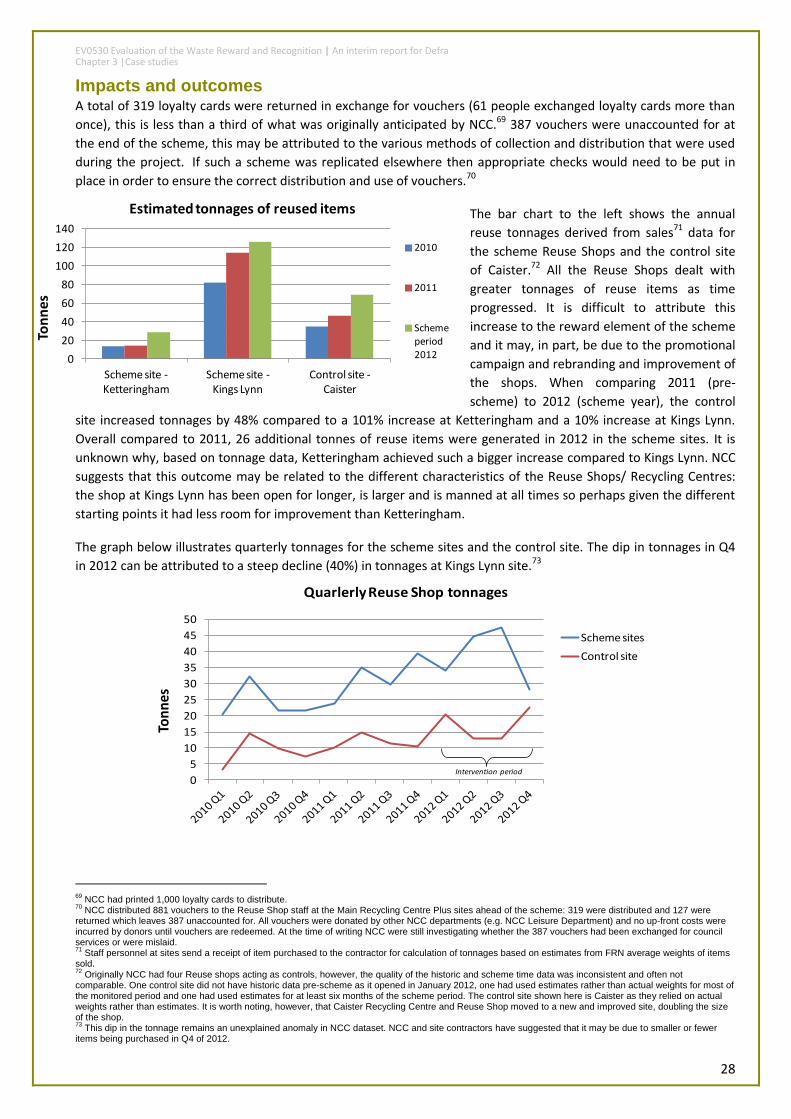
EV0530 Evaluation of the Waste Reward and Recognition | An interim report for Defra Chapter 3 |Case studies
28
0
20
40
60
80
100
120
140
Scheme site -Ketteringham
Scheme site -Kings Lynn
Control site -Caister
Ton
ne
s
Estimated tonnages of reused items
2010
2011
Scheme period2012
Impacts and outcomes
A total of 319 loyalty cards were returned in exchange for vouchers (61 people exchanged loyalty cards more than
once), this is less than a third of what was originally anticipated by NCC.69 387 vouchers were unaccounted for at
the end of the scheme, this may be attributed to the various methods of collection and distribution that were used
during the project. If such a scheme was replicated elsewhere then appropriate checks would need to be put in
place in order to ensure the correct distribution and use of vouchers.70
The bar chart to the left shows the annual
reuse tonnages derived from sales71 data for
the scheme Reuse Shops and the control site
of Caister.72 All the Reuse Shops dealt with
greater tonnages of reuse items as time
progressed. It is difficult to attribute this
increase to the reward element of the scheme
and it may, in part, be due to the promotional
campaign and rebranding and improvement of
the shops. When comparing 2011 (pre-
scheme) to 2012 (scheme year), the control
site increased tonnages by 48% compared to a 101% increase at Ketteringham and a 10% increase at Kings Lynn.
Overall compared to 2011, 26 additional tonnes of reuse items were generated in 2012 in the scheme sites. It is
unknown why, based on tonnage data, Ketteringham achieved such a bigger increase compared to Kings Lynn. NCC
suggests that this outcome may be related to the different characteristics of the Reuse Shops/ Recycling Centres:
the shop at Kings Lynn has been open for longer, is larger and is manned at all times so perhaps given the different
starting points it had less room for improvement than Ketteringham.
The graph below illustrates quarterly tonnages for the scheme sites and the control site. The dip in tonnages in Q4
in 2012 can be attributed to a steep decline (40%) in tonnages at Kings Lynn site.73
69
NCC had printed 1,000 loyalty cards to distribute. 70
NCC distributed 881 vouchers to the Reuse Shop staff at the Main Recycling Centre Plus sites ahead of the scheme: 319 were distributed and 127 were returned which leaves 387 unaccounted for. All vouchers were donated by other NCC departments (e.g. NCC Leisure Department) and no up-front costs were incurred by donors until vouchers are redeemed. At the time of writing NCC were still investigating whether the 387 vouchers had been exchanged for council services or were mislaid. 71
Staff personnel at sites send a receipt of item purchased to the contractor for calculation of tonnages based on estimates from FRN average weights of items sold. 72
Originally NCC had four Reuse shops acting as controls, however, the quality of the historic and scheme time data was inconsistent and often not comparable. One control site did not have historic data pre-scheme as it opened in January 2012, one had used estimates rather than actual weights for most of the monitored period and one had used estimates for at least six months of the scheme period. The control site shown here is Caister as they relied on actual weights rather than estimates. It is worth noting, however, that Caister Recycling Centre and Reuse Shop moved to a new and improved site, doubling the size of the shop. 73
This dip in the tonnage remains an unexplained anomaly in NCC dataset. NCC and site contractors have suggested that it may be due to smaller or fewer items being purchased in Q4 of 2012.
0
5
10
15
20
25
30
35
40
45
50
Ton
nes
Quarlerly Reuse Shop tonnages
Scheme sites
Control site
Intervention period

EV0530 Evaluation of the Waste Reward and Recognition | An interim report for Defra Chapter 3 |Case studies
29
£0
£1,000
£2,000
£3,000
£4,000
£5,000
£6,000
£7,000
£8,000
£9,000
Q1 2010
Q2 2010
Q3 2010
Q4 2010
Q1 2011
Q2 2011
Q3 2011
Q4 2011
Q1 2012
Q2 2012
Q3 2012
Q4 2012
Reuse Shop income dataScheme siteKetteringham
Scheme SiteKings Lynn
Control siteCaister
Feedback forms were completed by 297 respondents at the scheme sites. Questions were asked about the Reuse
Shops rather than the loyalty card scheme. Those that heard about the shops had done so because they were
regular users of the recycling centre (51%, n= 152 for the scheme sites). Very few said that they had heard about
the shop from the radio or newspaper advertisement. The campaign did not seem to bring in new users into the
shops as only a handful of respondents at the scheme sites were visiting for the first time. It is worth remembering
that respondents to the feedback form may not be representative of all visitors, however, the scheme seems to
have created an opportunity to better engage with existing visitors.
The income from sale at the scheme Reuse Shops was recorded and the graph below shows the two sites compared
to the control site.74
Over a third (36%, n= 108) of respondents were at the Reuse Shop to buy items. A fifth of respondents (21% n=61)
stated that the reason they were in the Reuse Shop was because they had come to the recycling centre and popped
into the shop while they were there. The only method
of capturing participants’ motivations for joining the
scheme or assessing a change in behaviour (either by
buying more or donating more) was the feedback
form. It may be that the loyalty cards rewarded
regular site users by giving them a new reason to
enter the reuse shop and make purchases, rather than
bringing in new visitors.
This initiative cost £27,371 and is broken down into
the various elements as shown in the pie chart. The
vouchers themselves were a significant proportion of
the budget (48%) – this was funded by NCC rather
than Defra.75 The other big cost was communications (33%); however, this covered promotional material for all the
Reuse shops in Norfolk (i.e. not just those trialling loyalty cards as part of this scheme). For each participating user
this means a cost of £106.09; without monitoring and evaluation costs it was £104.15.76
There seems to be little evidence that the loyalty card attracted new shoppers to the Reuse Shops. The scheme,
however, provided a useful opportunity to draw in site users to also visit the shop while they were there. Given the
lack of a robust control and the fact that all Reuse Shops were rebranded it is near impossible to attribute the
increase in tonnages to the scheme. NCC felt that loyalty cards could have contributed to the Ketteringham site
increase in reuse tonnage but not to Kings Lynn where the increase was lower than the increase in the control site.
74
Income data had to be estimated for the last quarter in 2012 for Caister - the control site. This is likely to be due to late arrival of data and staff issues on site. 75
The £13,081 cost is a maximum amount of money that could have been used in exchange for the vouchers that been issued (319) or mislaid (387). This is not necessarily the cost of the vouchers upfront as it is only when a voucher is exchanged at a NCC run facility for the actual service /experience e.g. museum visit, gym pass that it actually costs NCC money. 76
This is using the lowest estimate of 258 unique users (319 minus 61 repeats – but it is not possible to know how many of the 61 were single repeat users of the loyalty card).
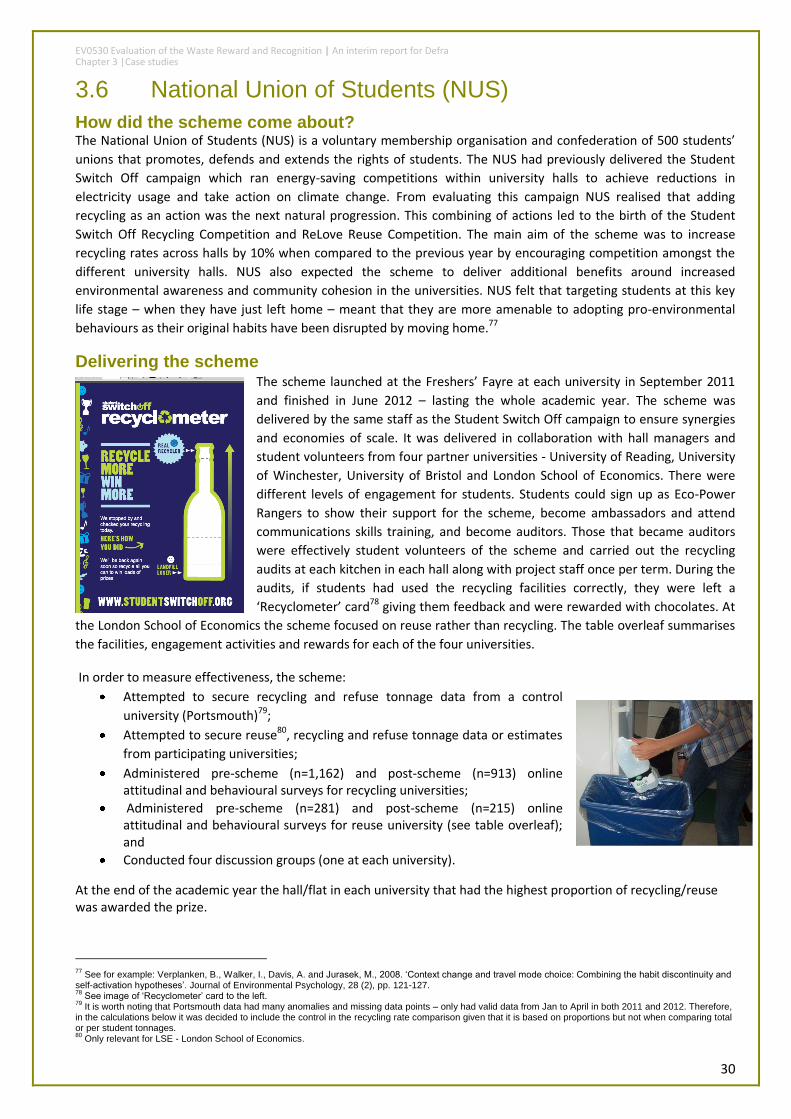
EV0530 Evaluation of the Waste Reward and Recognition | An interim report for Defra Chapter 3 |Case studies
30
3.6 National Union of Students (NUS)
How did the scheme come about? The National Union of Students (NUS) is a voluntary membership organisation and confederation of 500 students’
unions that promotes, defends and extends the rights of students. The NUS had previously delivered the Student
Switch Off campaign which ran energy-saving competitions within university halls to achieve reductions in
electricity usage and take action on climate change. From evaluating this campaign NUS realised that adding
recycling as an action was the next natural progression. This combining of actions led to the birth of the Student
Switch Off Recycling Competition and ReLove Reuse Competition. The main aim of the scheme was to increase
recycling rates across halls by 10% when compared to the previous year by encouraging competition amongst the
different university halls. NUS also expected the scheme to deliver additional benefits around increased
environmental awareness and community cohesion in the universities. NUS felt that targeting students at this key
life stage – when they have just left home – meant that they are more amenable to adopting pro-environmental
behaviours as their original habits have been disrupted by moving home.77
Delivering the scheme The scheme launched at the Freshers’ Fayre at each university in September 2011
and finished in June 2012 – lasting the whole academic year. The scheme was
delivered by the same staff as the Student Switch Off campaign to ensure synergies
and economies of scale. It was delivered in collaboration with hall managers and
student volunteers from four partner universities - University of Reading, University
of Winchester, University of Bristol and London School of Economics. There were
different levels of engagement for students. Students could sign up as Eco-Power
Rangers to show their support for the scheme, become ambassadors and attend
communications skills training, and become auditors. Those that became auditors
were effectively student volunteers of the scheme and carried out the recycling
audits at each kitchen in each hall along with project staff once per term. During the
audits, if students had used the recycling facilities correctly, they were left a
‘Recyclometer’ card78 giving them feedback and were rewarded with chocolates. At
the London School of Economics the scheme focused on reuse rather than recycling. The table overleaf summarises
the facilities, engagement activities and rewards for each of the four universities.
In order to measure effectiveness, the scheme:
Attempted to secure recycling and refuse tonnage data from a control
university (Portsmouth)79;
Attempted to secure reuse80, recycling and refuse tonnage data or estimates
from participating universities;
Administered pre-scheme (n=1,162) and post-scheme (n=913) online attitudinal and behavioural surveys for recycling universities;
Administered pre-scheme (n=281) and post-scheme (n=215) online attitudinal and behavioural surveys for reuse university (see table overleaf); and
Conducted four discussion groups (one at each university).
At the end of the academic year the hall/flat in each university that had the highest proportion of recycling/reuse was awarded the prize.
77
See for example: Verplanken, B., Walker, I., Davis, A. and Jurasek, M., 2008. ‘Context change and travel mode choice: Combining the habit discontinuity and self-activation hypotheses’. Journal of Environmental Psychology, 28 (2), pp. 121-127. 78
See image of ‘Recyclometer’ card to the left. 79
It is worth noting that Portsmouth data had many anomalies and missing data points – only had valid data from Jan to April in both 2011 and 2012. Therefore, in the calculations below it was decided to include the control in the recycling rate comparison given that it is based on proportions but not when comparing total or per student tonnages. 80
Only relevant for LSE - London School of Economics.
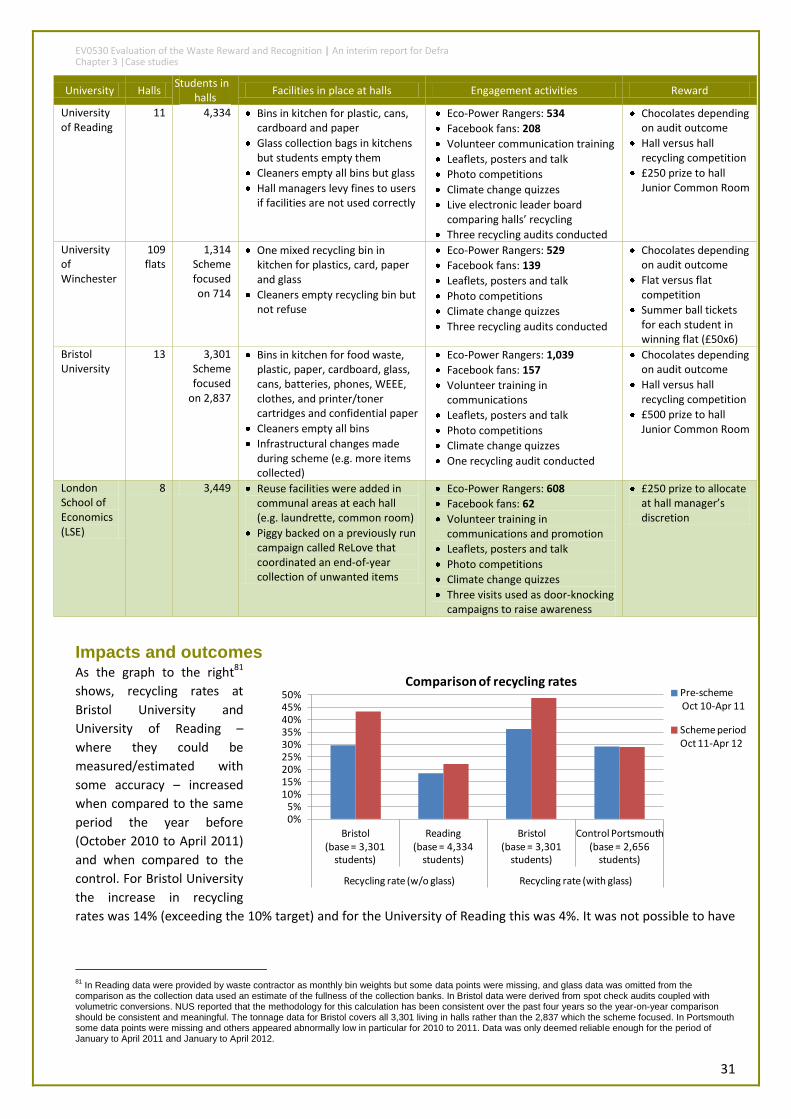
EV0530 Evaluation of the Waste Reward and Recognition | An interim report for Defra Chapter 3 |Case studies
31
0%5%
10%15%20%25%30%35%40%45%50%
Bristol (base = 3,301
students)
Reading (base = 4,334
students)
Bristol (base = 3,301
students)
Control Portsmouth (base = 2,656
students)
Recycling rate (w/o glass) Recycling rate (with glass)
Comparison of recycling ratesPre-schemeOct 10-Apr 11
Scheme period Oct 11-Apr 12
University Halls Students in
halls Facilities in place at halls Engagement activities Reward
University of Reading
11 4,334 Bins in kitchen for plastic, cans, cardboard and paper
Glass collection bags in kitchens but students empty them
Cleaners empty all bins but glass
Hall managers levy fines to users if facilities are not used correctly
Eco-Power Rangers: 534
Facebook fans: 208
Volunteer communication training
Leaflets, posters and talk
Photo competitions
Climate change quizzes
Live electronic leader board comparing halls’ recycling
Three recycling audits conducted
Chocolates depending on audit outcome
Hall versus hall recycling competition
£250 prize to hall Junior Common Room
University of Winchester
109 flats
1,314 Scheme focused on 714
One mixed recycling bin in kitchen for plastics, card, paper and glass
Cleaners empty recycling bin but not refuse
Eco-Power Rangers: 529
Facebook fans: 139
Leaflets, posters and talk
Photo competitions
Climate change quizzes
Three recycling audits conducted
Chocolates depending on audit outcome
Flat versus flat competition
Summer ball tickets for each student in winning flat (£50x6)
Bristol University
13 3,301 Scheme focused
on 2,837
Bins in kitchen for food waste, plastic, paper, cardboard, glass, cans, batteries, phones, WEEE, clothes, and printer/toner cartridges and confidential paper
Cleaners empty all bins
Infrastructural changes made during scheme (e.g. more items collected)
Eco-Power Rangers: 1,039
Facebook fans: 157
Volunteer training in communications
Leaflets, posters and talk
Photo competitions
Climate change quizzes
One recycling audit conducted
Chocolates depending on audit outcome
Hall versus hall recycling competition
£500 prize to hall Junior Common Room
London School of Economics (LSE)
8 3,449 Reuse facilities were added in communal areas at each hall (e.g. laundrette, common room)
Piggy backed on a previously run campaign called ReLove that coordinated an end-of-year collection of unwanted items
Eco-Power Rangers: 608
Facebook fans: 62
Volunteer training in communications and promotion
Leaflets, posters and talk
Photo competitions
Climate change quizzes
Three visits used as door-knocking campaigns to raise awareness
£250 prize to allocate at hall manager’s discretion
Impacts and outcomes
As the graph to the right81
shows, recycling rates at
Bristol University and
University of Reading –
where they could be
measured/estimated with
some accuracy – increased
when compared to the same
period the year before
(October 2010 to April 2011)
and when compared to the
control. For Bristol University
the increase in recycling
rates was 14% (exceeding the 10% target) and for the University of Reading this was 4%. It was not possible to have
81
In Reading data were provided by waste contractor as monthly bin weights but some data points were missing, and glass data was omitted from the comparison as the collection data used an estimate of the fullness of the collection banks. In Bristol data were derived from spot check audits coupled with volumetric conversions. NUS reported that the methodology for this calculation has been consistent over the past four years so the year-on-year comparison should be consistent and meaningful. The tonnage data for Bristol covers all 3,301 living in halls rather than the 2,837 which the scheme focused. In Portsmouth some data points were missing and others appeared abnormally low in particular for 2010 to 2011. Data was only deemed reliable enough for the period of January to April 2011 and January to April 2012.
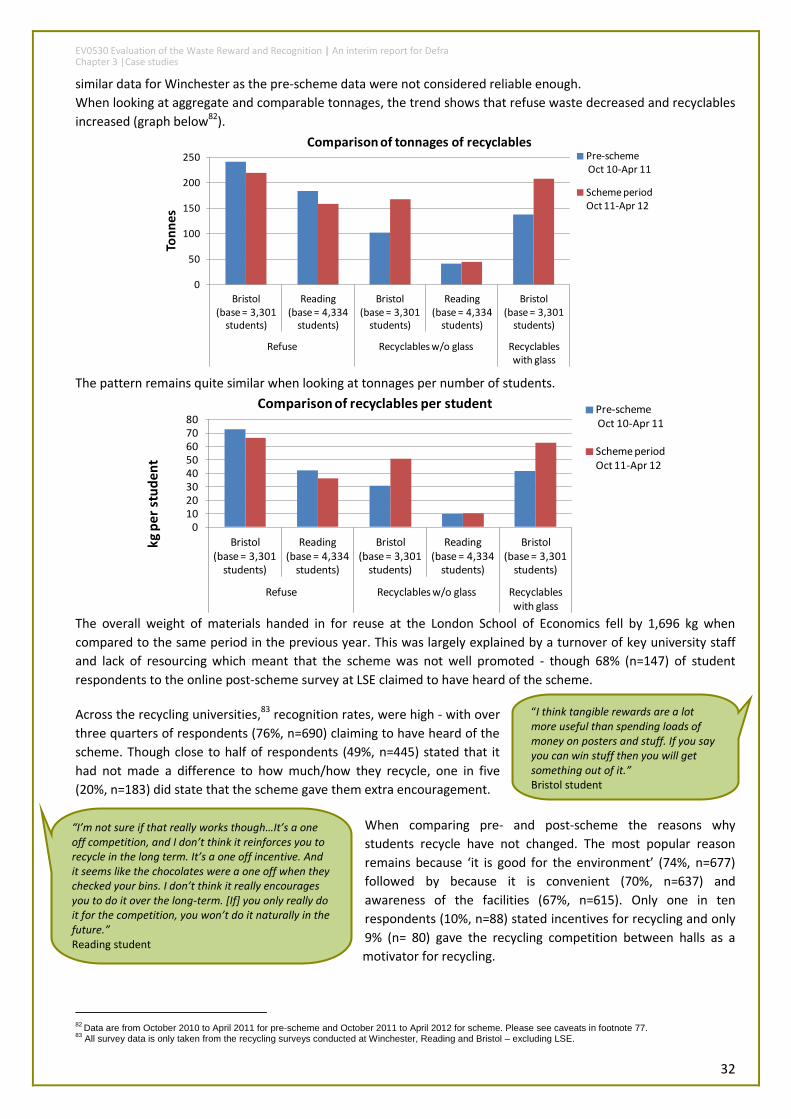
EV0530 Evaluation of the Waste Reward and Recognition | An interim report for Defra Chapter 3 |Case studies
32
“I think tangible rewards are a lot more useful than spending loads of money on posters and stuff. If you say you can win stuff then you will get something out of it.” Bristol student
“I’m not sure if that really works though…It’s a one off competition, and I don’t think it reinforces you to recycle in the long term. It’s a one off incentive. And it seems like the chocolates were a one off when they checked your bins. I don’t think it really encourages you to do it over the long-term. [If] you only really do it for the competition, you won’t do it naturally in the future.” Reading student
similar data for Winchester as the pre-scheme data were not considered reliable enough.
When looking at aggregate and comparable tonnages, the trend shows that refuse waste decreased and recyclables
increased (graph below82).
The pattern remains quite similar when looking at tonnages per number of students.
The overall weight of materials handed in for reuse at the London School of Economics fell by 1,696 kg when
compared to the same period in the previous year. This was largely explained by a turnover of key university staff
and lack of resourcing which meant that the scheme was not well promoted - though 68% (n=147) of student
respondents to the online post-scheme survey at LSE claimed to have heard of the scheme.
Across the recycling universities,83 recognition rates, were high - with over
three quarters of respondents (76%, n=690) claiming to have heard of the
scheme. Though close to half of respondents (49%, n=445) stated that it
had not made a difference to how much/how they recycle, one in five
(20%, n=183) did state that the scheme gave them extra encouragement.
When comparing pre- and post-scheme the reasons why
students recycle have not changed. The most popular reason
remains because ‘it is good for the environment’ (74%, n=677)
followed by because it is convenient (70%, n=637) and
awareness of the facilities (67%, n=615). Only one in ten
respondents (10%, n=88) stated incentives for recycling and only
9% (n= 80) gave the recycling competition between halls as a
motivator for recycling.
82
Data are from October 2010 to April 2011 for pre-scheme and October 2011 to April 2012 for scheme. Please see caveats in footnote 77. 83
All survey data is only taken from the recycling surveys conducted at Winchester, Reading and Bristol – excluding LSE.
0
50
100
150
200
250
Bristol (base = 3,301
students)
Reading (base = 4,334
students)
Bristol (base = 3,301
students)
Reading (base = 4,334
students)
Bristol (base = 3,301
students)
Refuse Recyclables w/o glass Recyclables with glass
Ton
ne
s
Comparison of tonnages of recyclablesPre-schemeOct 10-Apr 11
Scheme period Oct 11-Apr 12
01020304050607080
Bristol (base = 3,301
students)
Reading (base = 4,334
students)
Bristol (base = 3,301
students)
Reading (base = 4,334
students)
Bristol (base = 3,301
students)
Refuse Recyclables w/o glass Recyclables with glass
kg p
er
stu
de
nt
Comparison of recyclables per student Pre-schemeOct 10-Apr 11
Scheme period Oct 11-Apr 12
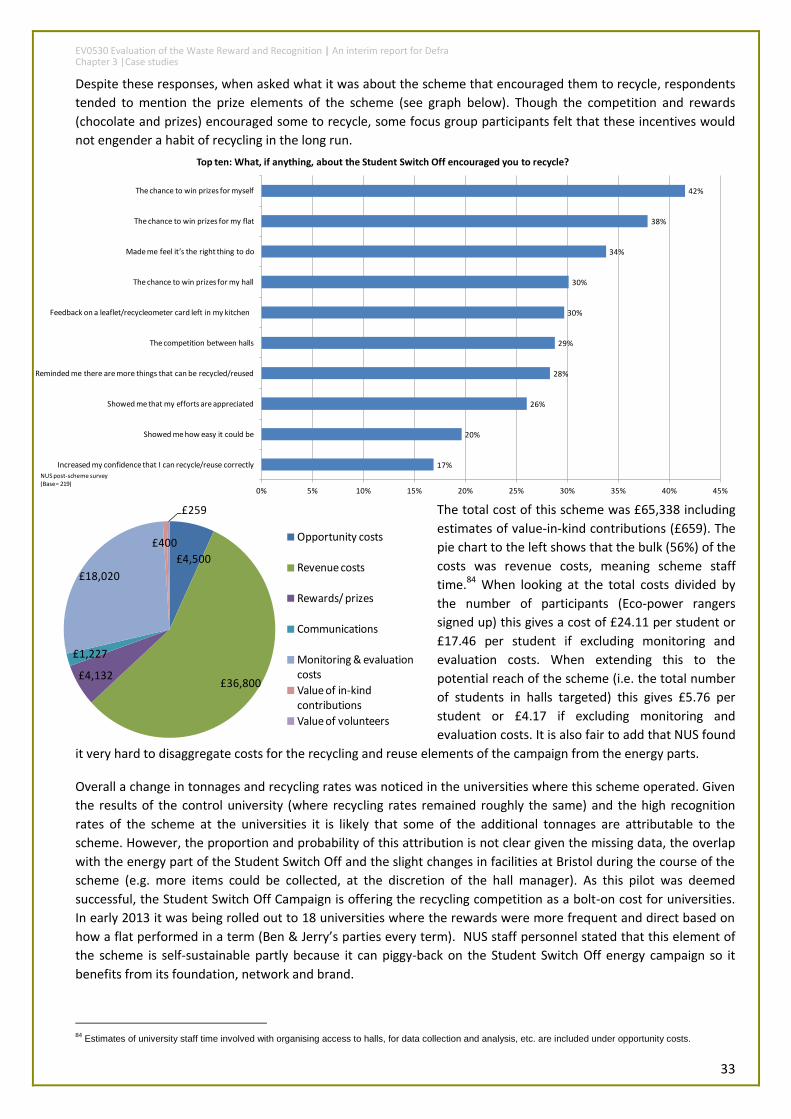
EV0530 Evaluation of the Waste Reward and Recognition | An interim report for Defra Chapter 3 |Case studies
33
£4,500
£36,800£4,132
£1,227
£18,020
£400
£259
Opportunity costs
Revenue costs
Rewards/ prizes
Communications
Monitoring & evaluation costs
Value of in-kind contributions
Value of volunteers
Despite these responses, when asked what it was about the scheme that encouraged them to recycle, respondents
tended to mention the prize elements of the scheme (see graph below). Though the competition and rewards
(chocolate and prizes) encouraged some to recycle, some focus group participants felt that these incentives would
not engender a habit of recycling in the long run.
The total cost of this scheme was £65,338 including
estimates of value-in-kind contributions (£659). The
pie chart to the left shows that the bulk (56%) of the
costs was revenue costs, meaning scheme staff
time.84 When looking at the total costs divided by
the number of participants (Eco-power rangers
signed up) this gives a cost of £24.11 per student or
£17.46 per student if excluding monitoring and
evaluation costs. When extending this to the
potential reach of the scheme (i.e. the total number
of students in halls targeted) this gives £5.76 per
student or £4.17 if excluding monitoring and
evaluation costs. It is also fair to add that NUS found
it very hard to disaggregate costs for the recycling and reuse elements of the campaign from the energy parts.
Overall a change in tonnages and recycling rates was noticed in the universities where this scheme operated. Given
the results of the control university (where recycling rates remained roughly the same) and the high recognition
rates of the scheme at the universities it is likely that some of the additional tonnages are attributable to the
scheme. However, the proportion and probability of this attribution is not clear given the missing data, the overlap
with the energy part of the Student Switch Off and the slight changes in facilities at Bristol during the course of the
scheme (e.g. more items could be collected, at the discretion of the hall manager). As this pilot was deemed
successful, the Student Switch Off Campaign is offering the recycling competition as a bolt-on cost for universities.
In early 2013 it was being rolled out to 18 universities where the rewards were more frequent and direct based on
how a flat performed in a term (Ben & Jerry’s parties every term). NUS staff personnel stated that this element of
the scheme is self-sustainable partly because it can piggy-back on the Student Switch Off energy campaign so it
benefits from its foundation, network and brand.
84
Estimates of university staff time involved with organising access to halls, for data collection and analysis, etc. are included under opportunity costs.
17%
20%
26%
28%
29%
30%
30%
34%
38%
42%
0% 5% 10% 15% 20% 25% 30% 35% 40% 45%
Increased my confidence that I can recycle/reuse correctly
Showed me how easy it could be
Showed me that my efforts are appreciated
Reminded me there are more things that can be recycled/reused
The competition between halls
Feedback on a leaflet/recycleometer card left in my kitchen
The chance to win prizes for my hall
Made me feel it’s the right thing to do
The chance to win prizes for my flat
The chance to win prizes for myself
Top ten: What, if anything, about the Student Switch Off encouraged you to recycle?
NUS post-scheme survey (Base= 219)
EV0530 Evaluation of the Waste Reward and Recognition | An interim report for Defra Chapter 3 |Case studies
34
3.7 Preen Community Interest Company (Preen)
How did the scheme come about? The scheme was led by Preen Community Interest Company (Preen), a reuse social
enterprise based in the operational area of Central Bedfordshire Council, in
collaboration with local parishes. The scheme was a new reward and recognition
scheme, aiming to increase purchasing and donation to the two Preen reuse shops.
No such scheme had existed in the past. Items for reuse included furniture,
clothing, books, bric-a-brac and electrical appliances. Preen had two target
audiences for the scheme: the local councils (both at local authority level and
parish/town councils) and the general public. Their potential target audience was 252,000 (the population of the
area from which they collect used furniture). The geographical area of the local authority is one of the least densely
populated in England. Preen had approximately 6,500 registered members before the start of the scheme and
aimed to increase this by 4,000 (registration was compulsory for anyone wishing to buy or donate). Preen aimed for
a 33% increase in tonnes of donation for reuse, 30% increase in re-use goods purchased85 and 66% increase in
members.
Delivering the scheme The scheme was called the ‘Preen Community Challenge’ and was in operation from March to October 2012. It was
managed by Preen staff. The logic of the scheme was as follows:
Whenever anyone donated or bought items from the shop, they had to register as a member.
Members received points every time they donated or purchased an item (the number of points depended
on the type of item which was loosely related to its weight), and these points were allocated to the
members’ parish council.
Parish councils competed against each other through this points system.
As well as getting points for donations and purchases, parish councils could also obtain points by engaging
with the scheme (e.g. attending the launch, getting residents to fill in surveys, etc.).
The winning councils and runners-up in each category (see below) would receive a community reward in
the form of cash (up to £5,000) and Preen vouchers (up to £22,000), to be spent on community
improvements (e.g. furnishing a village hall) or distributed as they saw fit.
There were three categories for which awards were given: average tonnage donated per household, percentage of
households in parish participating in scheme,86 and amount of money spent in Preen shops per household. An extra
award was given to the parish that collected the most points. The rewards were originally ring-fenced irrespective
of turnover projections but given that increases in turnover were achieved (actual sales income), the rewards were
funded in this manner. Not all of the reward pot, however, was distributed as not as many parishes participated as
Preen had hoped.87 At the end of the scheme a discretionary award was given to the parish considered to be most
engaged in the scheme, funded through some of the reward pot.
Preen relied on their proprietary database, which recorded information on members, donations and purchases to
assess impacts. This database used the Furniture Re-Use Network standard weights to estimate tonnages. Online
surveys were sent to Preen members when they signed up (n= 125) and at the end of the scheme (n=169) to find
out about reuse attitudes and behaviours, and how these changed over the course of the scheme. There was no
control area and little formal qualitative research, although anecdotal evidence was gathered through talking to
customers and reviewing comments posted on Preen’s social media website. There were some delivery issues:
85
It was not possible to measure data on re-use goods purchased so no data are available. 86
Preen used the data for households of each parish and then looked at the number of participating household from each parish. Each parish had its own unique number. Each member had the relevant number for their parish assigned to their data on sign up. Reporting for this was done on parish number. This was then compared to the total population/households figures. 87
1,804 households participated in the ‘Preen Community Challenge’ from 51 different parishes/towns (out of 78 parishes/towns in total). The total number of households that signed up was 81,255 from a total of 109,000 households.
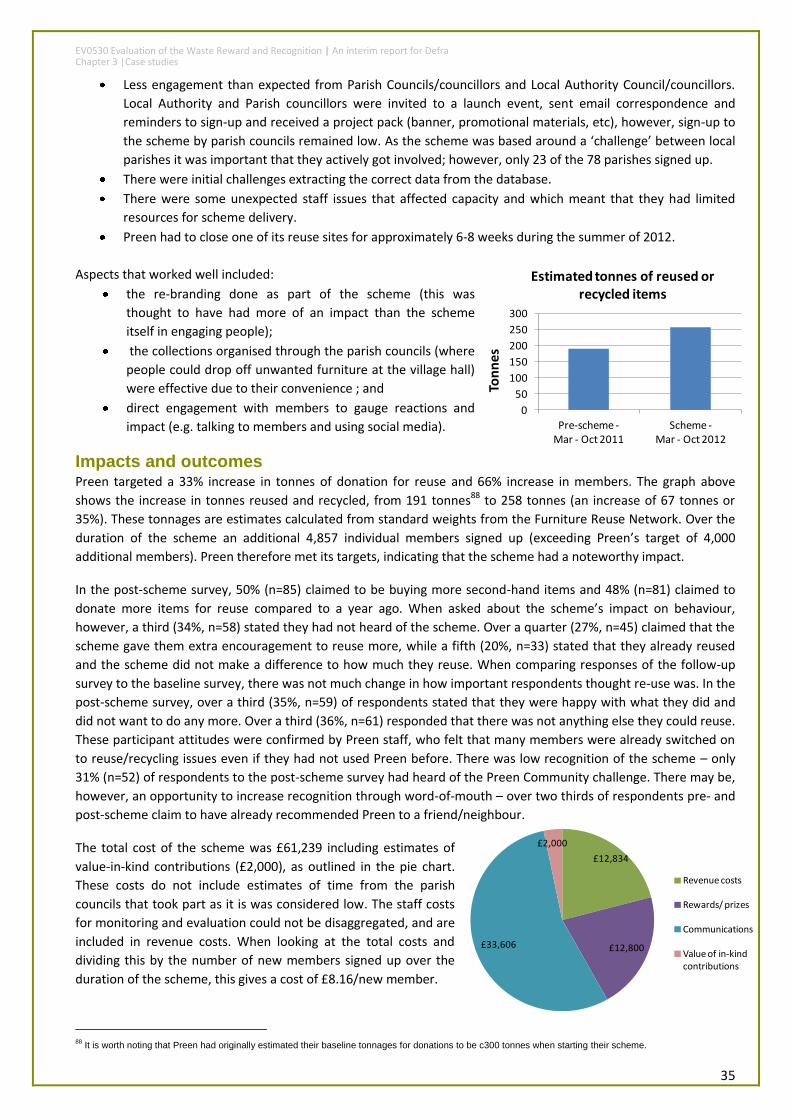
EV0530 Evaluation of the Waste Reward and Recognition | An interim report for Defra Chapter 3 |Case studies
35
£12,834
£12,800£33,606
£2,000
Revenue costs
Rewards/ prizes
Communications
Value of in-kind contributions
Less engagement than expected from Parish Councils/councillors and Local Authority Council/councillors.
Local Authority and Parish councillors were invited to a launch event, sent email correspondence and
reminders to sign-up and received a project pack (banner, promotional materials, etc), however, sign-up to
the scheme by parish councils remained low. As the scheme was based around a ‘challenge’ between local
parishes it was important that they actively got involved; however, only 23 of the 78 parishes signed up.
There were initial challenges extracting the correct data from the database.
There were some unexpected staff issues that affected capacity and which meant that they had limited
resources for scheme delivery.
Preen had to close one of its reuse sites for approximately 6-8 weeks during the summer of 2012.
Aspects that worked well included:
the re-branding done as part of the scheme (this was
thought to have had more of an impact than the scheme
itself in engaging people);
the collections organised through the parish councils (where
people could drop off unwanted furniture at the village hall)
were effective due to their convenience ; and
direct engagement with members to gauge reactions and
impact (e.g. talking to members and using social media).
Impacts and outcomes Preen targeted a 33% increase in tonnes of donation for reuse and 66% increase in members. The graph above
shows the increase in tonnes reused and recycled, from 191 tonnes88 to 258 tonnes (an increase of 67 tonnes or
35%). These tonnages are estimates calculated from standard weights from the Furniture Reuse Network. Over the
duration of the scheme an additional 4,857 individual members signed up (exceeding Preen’s target of 4,000
additional members). Preen therefore met its targets, indicating that the scheme had a noteworthy impact.
In the post-scheme survey, 50% (n=85) claimed to be buying more second-hand items and 48% (n=81) claimed to
donate more items for reuse compared to a year ago. When asked about the scheme’s impact on behaviour,
however, a third (34%, n=58) stated they had not heard of the scheme. Over a quarter (27%, n=45) claimed that the
scheme gave them extra encouragement to reuse more, while a fifth (20%, n=33) stated that they already reused
and the scheme did not make a difference to how much they reuse. When comparing responses of the follow-up
survey to the baseline survey, there was not much change in how important respondents thought re-use was. In the
post-scheme survey, over a third (35%, n=59) of respondents stated that they were happy with what they did and
did not want to do any more. Over a third (36%, n=61) responded that there was not anything else they could reuse.
These participant attitudes were confirmed by Preen staff, who felt that many members were already switched on
to reuse/recycling issues even if they had not used Preen before. There was low recognition of the scheme – only
31% (n=52) of respondents to the post-scheme survey had heard of the Preen Community challenge. There may be,
however, an opportunity to increase recognition through word-of-mouth – over two thirds of respondents pre- and
post-scheme claim to have already recommended Preen to a friend/neighbour.
The total cost of the scheme was £61,239 including estimates of
value-in-kind contributions (£2,000), as outlined in the pie chart.
These costs do not include estimates of time from the parish
councils that took part as it is was considered low. The staff costs
for monitoring and evaluation could not be disaggregated, and are
included in revenue costs. When looking at the total costs and
dividing this by the number of new members signed up over the
duration of the scheme, this gives a cost of £8.16/new member.
88
It is worth noting that Preen had originally estimated their baseline tonnages for donations to be c300 tonnes when starting their scheme.
0
50
100
150
200
250
300
Pre-scheme -Mar - Oct 2011
Scheme -Mar - Oct 2012
Ton
ne
s
Estimated tonnes of reused or recycled items
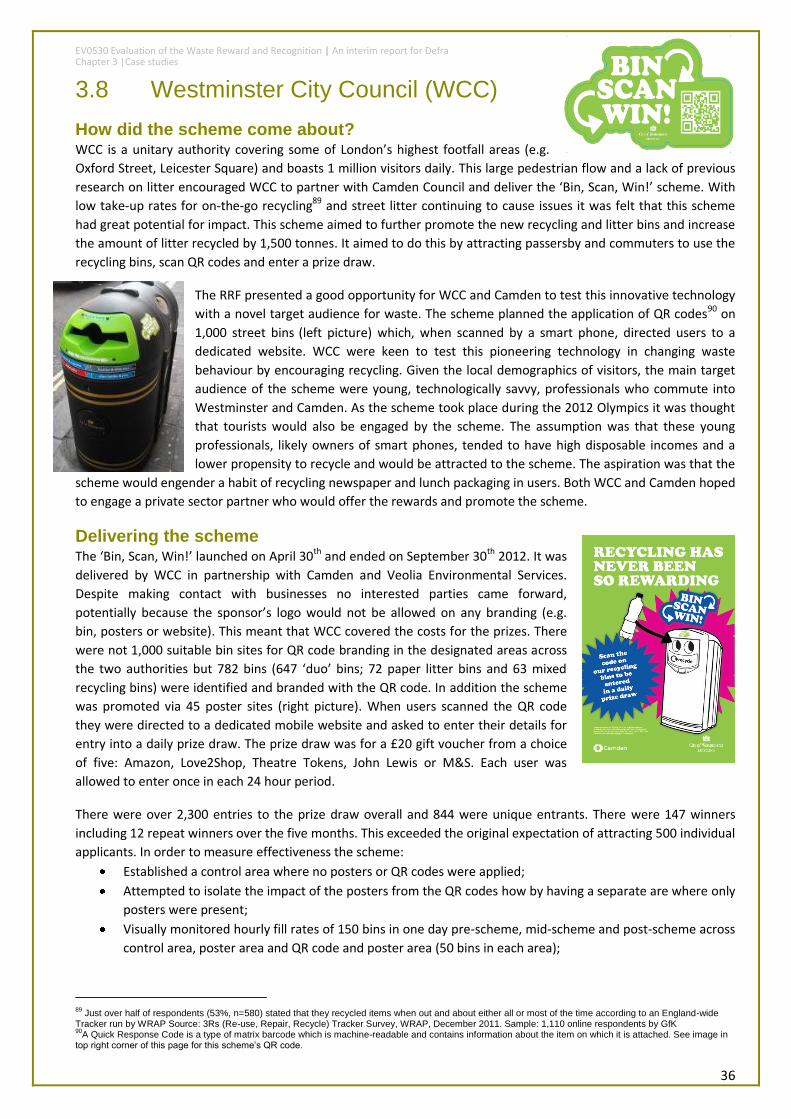
EV0530 Evaluation of the Waste Reward and Recognition | An interim report for Defra Chapter 3 |Case studies
36
3.8 Westminster City Council (WCC)
How did the scheme come about? WCC is a unitary authority covering some of London’s highest footfall areas (e.g.
Oxford Street, Leicester Square) and boasts 1 million visitors daily. This large pedestrian flow and a lack of previous
research on litter encouraged WCC to partner with Camden Council and deliver the ‘Bin, Scan, Win!’ scheme. With
low take-up rates for on-the-go recycling89 and street litter continuing to cause issues it was felt that this scheme
had great potential for impact. This scheme aimed to further promote the new recycling and litter bins and increase
the amount of litter recycled by 1,500 tonnes. It aimed to do this by attracting passersby and commuters to use the
recycling bins, scan QR codes and enter a prize draw.
The RRF presented a good opportunity for WCC and Camden to test this innovative technology
with a novel target audience for waste. The scheme planned the application of QR codes90 on
1,000 street bins (left picture) which, when scanned by a smart phone, directed users to a
dedicated website. WCC were keen to test this pioneering technology in changing waste
behaviour by encouraging recycling. Given the local demographics of visitors, the main target
audience of the scheme were young, technologically savvy, professionals who commute into
Westminster and Camden. As the scheme took place during the 2012 Olympics it was thought
that tourists would also be engaged by the scheme. The assumption was that these young
professionals, likely owners of smart phones, tended to have high disposable incomes and a
lower propensity to recycle and would be attracted to the scheme. The aspiration was that the
scheme would engender a habit of recycling newspaper and lunch packaging in users. Both WCC and Camden hoped
to engage a private sector partner who would offer the rewards and promote the scheme.
Delivering the scheme The ‘Bin, Scan, Win!’ launched on April 30th and ended on September 30th 2012. It was
delivered by WCC in partnership with Camden and Veolia Environmental Services.
Despite making contact with businesses no interested parties came forward,
potentially because the sponsor’s logo would not be allowed on any branding (e.g.
bin, posters or website). This meant that WCC covered the costs for the prizes. There
were not 1,000 suitable bin sites for QR code branding in the designated areas across
the two authorities but 782 bins (647 ‘duo’ bins; 72 paper litter bins and 63 mixed
recycling bins) were identified and branded with the QR code. In addition the scheme
was promoted via 45 poster sites (right picture). When users scanned the QR code
they were directed to a dedicated mobile website and asked to enter their details for
entry into a daily prize draw. The prize draw was for a £20 gift voucher from a choice
of five: Amazon, Love2Shop, Theatre Tokens, John Lewis or M&S. Each user was
allowed to enter once in each 24 hour period.
There were over 2,300 entries to the prize draw overall and 844 were unique entrants. There were 147 winners
including 12 repeat winners over the five months. This exceeded the original expectation of attracting 500 individual
applicants. In order to measure effectiveness the scheme:
Established a control area where no posters or QR codes were applied;
Attempted to isolate the impact of the posters from the QR codes how by having a separate are where only
posters were present;
Visually monitored hourly fill rates of 150 bins in one day pre-scheme, mid-scheme and post-scheme across
control area, poster area and QR code and poster area (50 bins in each area);
89
Just over half of respondents (53%, n=580) stated that they recycled items when out and about either all or most of the time according to an England-wide Tracker run by WRAP Source: 3Rs (Re-use, Repair, Recycle) Tracker Survey, WRAP, December 2011. Sample: 1,110 online respondents by GfK 90
A Quick Response Code is a type of matrix barcode which is machine-readable and contains information about the item on which it is attached. See image in top right corner of this page for this scheme’s QR code.

EV0530 Evaluation of the Waste Reward and Recognition | An interim report for Defra Chapter 3 |Case studies
37
£10,000
£17,000
£2,940
£20,000
£9,500
£940Capital items
Revenue costs
Rewards/ prizes
Communications
Monitoring & evaluation costs
Value of partnership & stakeholder collaborations
0
20
40
60
80
100
120
140
Survey area 1 - Poster sites and QR code
Survey area 2 - Poster sites only
Survey area 3 -Control
kgs
Estimated weights of recyclables by area
Pre-scheme Apr-12
Mid-scheme Jul-12
Post-scheme Sept-12
Conducted on-street attitudinal surveys with passersby and users of bins (n= 95); and
Administered a post-scheme online survey sent to all entrants to prize draw (n=135).
Impacts and outcomes
This scheme was not able to increase litter
recycling by 1,500 tonnes. Recycling tonnages
decreased when comparing pre and post scheme
figures extrapolated to cover all scheme bins. The
graph to the right shows the estimated weights of
recyclables from the 150 monitored bins by area at
the three intervals.91 This may be in part explained
by Transport for London’s (TfL) assessment of
travel demand in London and the West End in
particular. TfL state that though number of visitors
and thus number of journeys into West End
stations rose during the Olympics there was a reduction in background/commuter travel which was the main target
audience for this scheme.92 However, this trend would have affected both scheme and control areas. When the 135 respondents to the post-scheme online survey were asked about the impact of the ‘Bin, Scan, Win!’
scheme, 43% (n=58) stated that they already recycled and the scheme has given them extra encouragement to
recycle more. 28% (n=38) stated that it did not make a difference to how/how much they recycled. According to
WCC, the main barriers for users seemed to be lack of technology or lack of understanding of QR code technology;
feeling embarrassed about being seen scanning a bin; and lack of time – commuters, especially, were often in a
rush. Daily entrants to the prize draw steadily increased throughout the duration of the scheme and peaked at 50
in a day. There was, however, no mechanism of verifying that users had actually recycled or scanned the bin in
person – they could have scanned the bin and not recycled or been forwarded the website link. Future equipment,
like contactless payment card technology, would be better positioned to overcome any misuse. A key lesson, from a
monitoring perspective, was the need to have a more robust fill-rate method. Preferably this would use actual
weights (either weighing at pick-up or bespoke weighbridge tickets), be over a longer period of time, monitor more
bins and report overflowing bins.
The total cost of the scheme was £60,380
including estimates of value-in-kind
contributions (£940). The pie chart to the right
outlines the costs for this scheme. When
looking at the total costs divided by the
number of participants this gives £72/unique
entrant or £60/ unique entrant excluding
monitoring and evaluation costs or £26/entry
or £22/entry excluding monitoring and
evaluation costs. Engendering a habit of on-
the-go recycling with a very brief touch-point
engagement was perhaps too ambitious: however, as a short-term communications campaign with the added
bonus of a prize draw it was effective at raising the profile of WCC.
91
Bin weight estimates provide only snapshots, as measured over the course of several hours on three days (one each in April, July and September). Weight estimates calculated from fill rates and average weights. Average weights per bin have been taken from previous monitoring work undertaken by WCC (Mixed recycling and litter bin weight calculated from approx. 100 samples taken from mixed recycling and litter bins in Oxford Street and Praed Street in 2010. Paper bin weight calculated from 50 samples taken from paper bins from various locations in Westminster in 2008). 92
For more information see Transport for London and Mayor of London (2012), Travel in London: Report 5. http://www.tfl.gov.uk/assets/downloads/corporate/travel-in-london-report-5.pdf
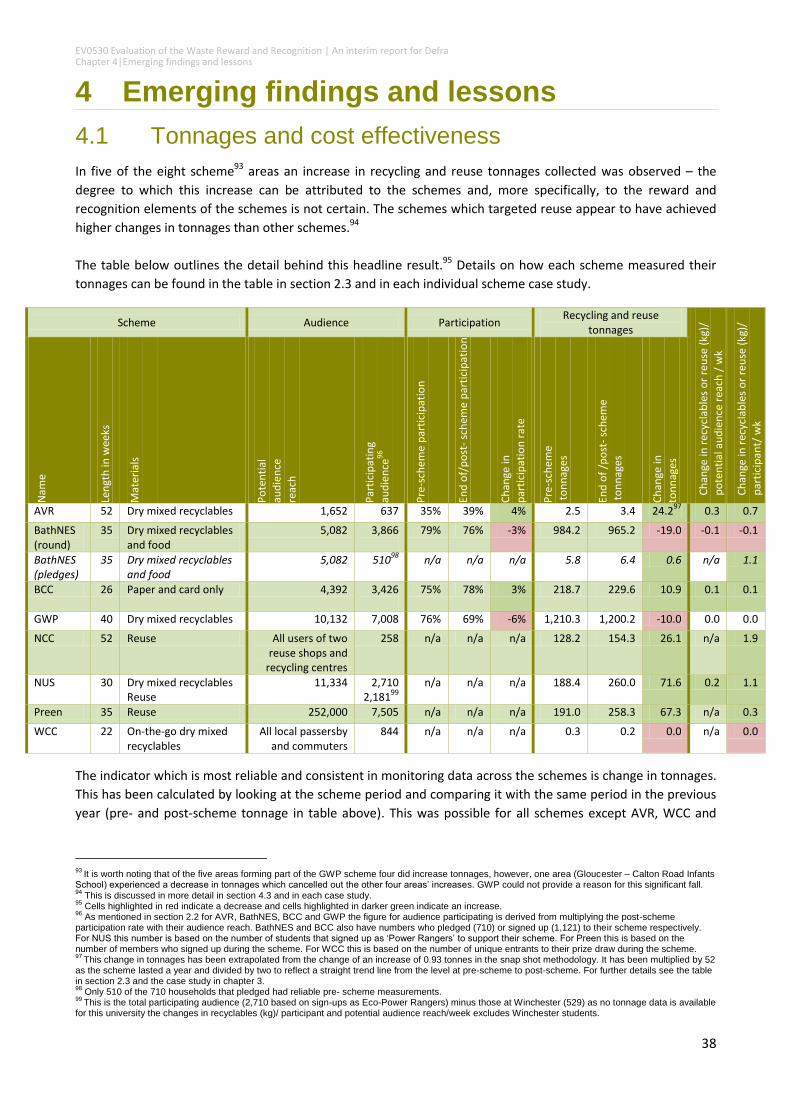
EV0530 Evaluation of the Waste Reward and Recognition | An interim report for Defra Chapter 4|Emerging findings and lessons
38
4 Emerging findings and lessons
4.1 Tonnages and cost effectiveness
In five of the eight scheme93 areas an increase in recycling and reuse tonnages collected was observed – the
degree to which this increase can be attributed to the schemes and, more specifically, to the reward and
recognition elements of the schemes is not certain. The schemes which targeted reuse appear to have achieved
higher changes in tonnages than other schemes.94
The table below outlines the detail behind this headline result.95 Details on how each scheme measured their
tonnages can be found in the table in section 2.3 and in each individual scheme case study.
Scheme Audience Participation Recycling and reuse
tonnages
Ch
ange
in r
ecyc
lab
les
or
reu
se (
kg)/
po
ten
tial
au
die
nce
rea
ch /
wk
Ch
ange
in r
ecyc
lab
les
or
reu
se (
kg)/
par
tici
pan
t/ w
k
Nam
e
Len
gth
in w
eeks
Mat
eria
ls
Po
ten
tial
aud
ien
ce
reac
h
Par
tici
pat
ing
aud
ien
ce96
Pre
-sch
eme
par
tici
pat
ion
End
of/
po
st-
sch
eme
par
tici
pat
ion
Ch
ange
in
par
tici
pat
ion
rat
e
Pre
-sch
eme
to
nn
ages
End
of
/po
st-
sch
eme
t
on
nag
es
Ch
ange
in
ton
nag
es
AVR 52 Dry mixed recyclables 1,652 637 35% 39% 4% 2.5 3.4 24.297
0.3 0.7
BathNES (round)
35 Dry mixed recyclables and food
5,082 3,866
79% 76% -3% 984.2 965.2 -19.0 -0.1 -0.1
BathNES (pledges)
35 Dry mixed recyclables and food
5,082 51098
n/a n/a n/a 5.8 6.4 0.6 n/a 1.1
BCC 26 Paper and card only 4,392 3,426
75% 78% 3% 218.7 229.6 10.9 0.1 0.1
GWP 40 Dry mixed recyclables 10,132 7,008 76% 69% -6% 1,210.3 1,200.2 -10.0 0.0 0.0
NCC 52 Reuse All users of two reuse shops and
recycling centres
258 n/a n/a n/a 128.2 154.3 26.1 n/a 1.9
NUS 30 Dry mixed recyclables Reuse
11,334 2,710 2,181
99
n/a n/a n/a 188.4 260.0 71.6 0.2 1.1
Preen 35 Reuse 252,000 7,505 n/a n/a n/a 191.0 258.3 67.3 n/a 0.3
WCC 22 On-the-go dry mixed recyclables
All local passersby and commuters
844 n/a n/a n/a 0.3 0.2 0.0 n/a 0.0
The indicator which is most reliable and consistent in monitoring data across the schemes is change in tonnages.
This has been calculated by looking at the scheme period and comparing it with the same period in the previous
year (pre- and post-scheme tonnage in table above). This was possible for all schemes except AVR, WCC and
93
It is worth noting that of the five areas forming part of the GWP scheme four did increase tonnages, however, one area (Gloucester – Calton Road Infants School) experienced a decrease in tonnages which cancelled out the other four areas’ increases. GWP could not provide a reason for this significant fall. 94
This is discussed in more detail in section 4.3 and in each case study. 95
Cells highlighted in red indicate a decrease and cells highlighted in darker green indicate an increase. 96
As mentioned in section 2.2 for AVR, BathNES, BCC and GWP the figure for audience participating is derived from multiplying the post-scheme participation rate with their audience reach. BathNES and BCC also have numbers who pledged (710) or signed up (1,121) to their scheme respectively. For NUS this number is based on the number of students that signed up as ‘Power Rangers’ to support their scheme. For Preen this is based on the number of members who signed up during the scheme. For WCC this is based on the number of unique entrants to their prize draw during the scheme. 97
This change in tonnages has been extrapolated from the change of an increase of 0.93 tonnes in the snap shot methodology. It has been multiplied by 52 as the scheme lasted a year and divided by two to reflect a straight trend line from the level at pre-scheme to post-scheme. For further details see the table in section 2.3 and the case study in chapter 3. 98
Only 510 of the 710 households that pledged had reliable pre- scheme measurements. 99
This is the total participating audience (2,710 based on sign-ups as Eco-Power Rangers) minus those at Winchester (529) as no tonnage data is available for this university the changes in recyclables (kg)/ participant and potential audience reach/week excludes Winchester students.
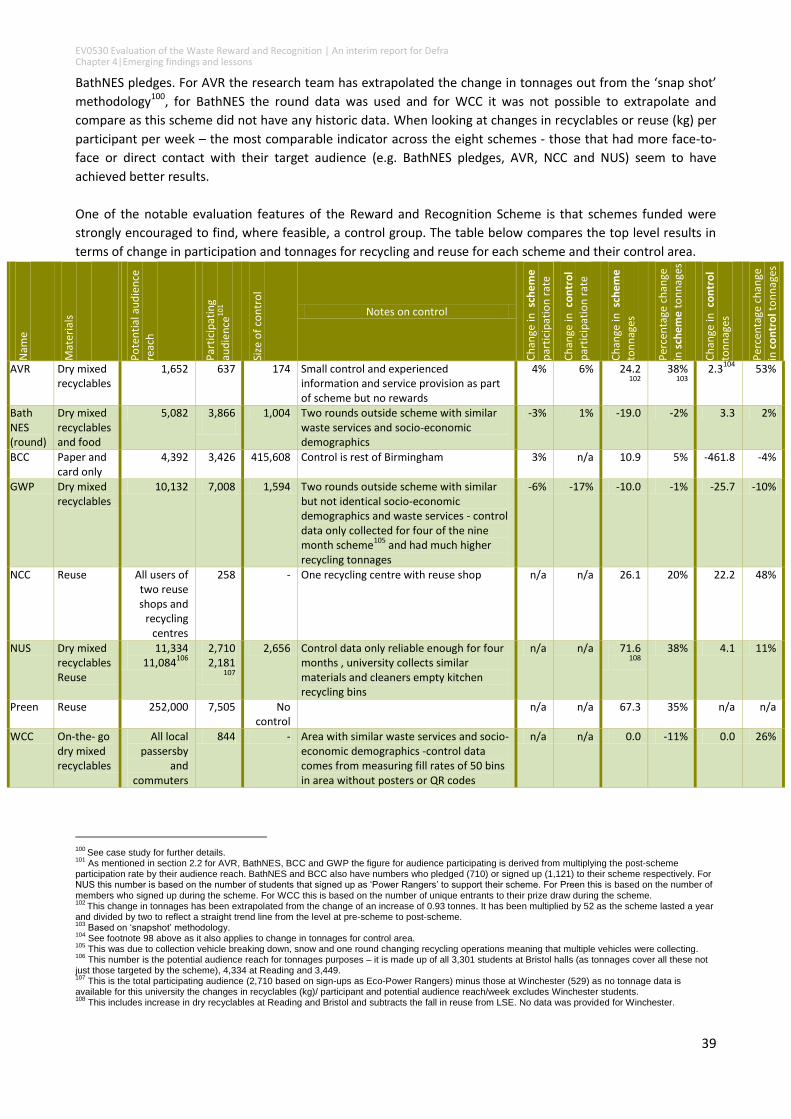
EV0530 Evaluation of the Waste Reward and Recognition | An interim report for Defra Chapter 4|Emerging findings and lessons
39
BathNES pledges. For AVR the research team has extrapolated the change in tonnages out from the ‘snap shot’
methodology100, for BathNES the round data was used and for WCC it was not possible to extrapolate and
compare as this scheme did not have any historic data. When looking at changes in recyclables or reuse (kg) per
participant per week – the most comparable indicator across the eight schemes - those that had more face-to-
face or direct contact with their target audience (e.g. BathNES pledges, AVR, NCC and NUS) seem to have
achieved better results.
One of the notable evaluation features of the Reward and Recognition Scheme is that schemes funded were
strongly encouraged to find, where feasible, a control group. The table below compares the top level results in
terms of change in participation and tonnages for recycling and reuse for each scheme and their control area.
Nam
e
Mat
eria
ls
Po
ten
tial
au
die
nce
re
ach
Par
tici
pat
ing
aud
ien
ce10
1
Size
of
con
tro
l
Notes on control
Ch
ange
in s
che
me
par
tici
pat
ion
rat
e
Ch
ange
in c
on
tro
l
par
tici
pat
ion
rat
e
Ch
ange
in s
che
me
to
nn
ages
Per
cen
tage
ch
ange
in
sch
em
e t
on
nag
es
Ch
ange
in c
on
tro
l
ton
nag
es
Per
cen
tage
ch
ange
in c
on
tro
l to
nn
ages
AVR Dry mixed recyclables
1,652 637 174 Small control and experienced information and service provision as part of scheme but no rewards
4% 6% 24.2102
38%
103
2.3104
53%
Bath NES (round)
Dry mixed recyclables and food
5,082 3,866
1,004 Two rounds outside scheme with similar waste services and socio-economic demographics
-3% 1% -19.0 -2% 3.3 2%
BCC Paper and card only
4,392 3,426
415,608 Control is rest of Birmingham 3% n/a 10.9 5% -461.8 -4%
GWP Dry mixed recyclables
10,132 7,008 1,594 Two rounds outside scheme with similar but not identical socio-economic demographics and waste services - control data only collected for four of the nine month scheme
105 and had much higher
recycling tonnages
-6% -17% -10.0 -1% -25.7 -10%
NCC Reuse All users of two reuse shops and
recycling centres
258 - One recycling centre with reuse shop n/a n/a 26.1 20% 22.2 48%
NUS Dry mixed recyclables Reuse
11,334 11,084
106
2,710 2,181
107
2,656 Control data only reliable enough for four months , university collects similar materials and cleaners empty kitchen recycling bins
n/a n/a 71.6108
38% 4.1 11%
Preen Reuse 252,000 7,505 No control
n/a n/a 67.3 35% n/a n/a
WCC On-the- go dry mixed recyclables
All local passersby
and commuters
844 - Area with similar waste services and socio-economic demographics -control data comes from measuring fill rates of 50 bins in area without posters or QR codes
n/a n/a 0.0 -11% 0.0 26%
100
See case study for further details. 101
As mentioned in section 2.2 for AVR, BathNES, BCC and GWP the figure for audience participating is derived from multiplying the post-scheme participation rate by their audience reach. BathNES and BCC also have numbers who pledged (710) or signed up (1,121) to their scheme respectively. For NUS this number is based on the number of students that signed up as ‘Power Rangers’ to support their scheme. For Preen this is based on the number of members who signed up during the scheme. For WCC this is based on the number of unique entrants to their prize draw during the scheme. 102
This change in tonnages has been extrapolated from the change of an increase of 0.93 tonnes. It has been multiplied by 52 as the scheme lasted a year and divided by two to reflect a straight trend line from the level at pre-scheme to post-scheme. 103
Based on ‘snapshot’ methodology. 104
See footnote 98 above as it also applies to change in tonnages for control area. 105
This was due to collection vehicle breaking down, snow and one round changing recycling operations meaning that multiple vehicles were collecting. 106
This number is the potential audience reach for tonnages purposes – it is made up of all 3,301 students at Bristol halls (as tonnages cover all these not just those targeted by the scheme), 4,334 at Reading and 3,449. 107
This is the total participating audience (2,710 based on sign-ups as Eco-Power Rangers) minus those at Winchester (529) as no tonnage data is available for this university the changes in recyclables (kg)/ participant and potential audience reach/week excludes Winchester students. 108
This includes increase in dry recyclables at Reading and Bristol and subtracts the fall in reuse from LSE. No data was provided for Winchester.
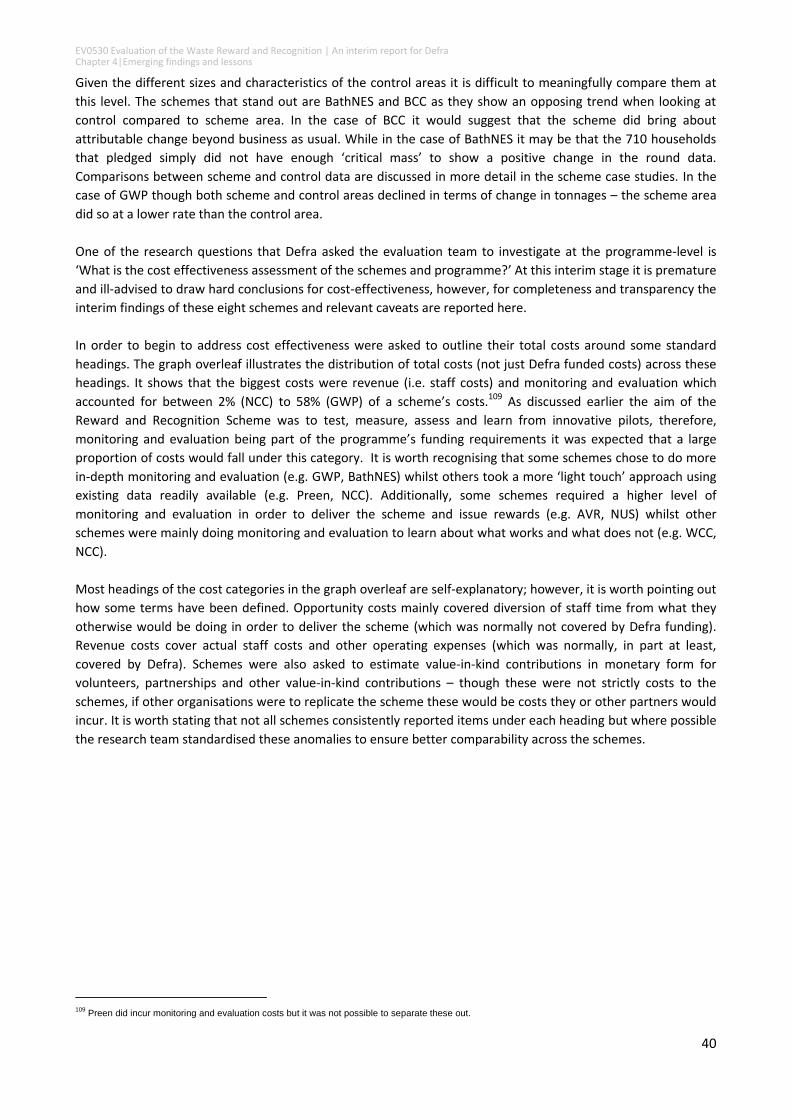
EV0530 Evaluation of the Waste Reward and Recognition | An interim report for Defra Chapter 4|Emerging findings and lessons
40
Given the different sizes and characteristics of the control areas it is difficult to meaningfully compare them at
this level. The schemes that stand out are BathNES and BCC as they show an opposing trend when looking at
control compared to scheme area. In the case of BCC it would suggest that the scheme did bring about
attributable change beyond business as usual. While in the case of BathNES it may be that the 710 households
that pledged simply did not have enough ‘critical mass’ to show a positive change in the round data.
Comparisons between scheme and control data are discussed in more detail in the scheme case studies. In the
case of GWP though both scheme and control areas declined in terms of change in tonnages – the scheme area
did so at a lower rate than the control area.
One of the research questions that Defra asked the evaluation team to investigate at the programme-level is
‘What is the cost effectiveness assessment of the schemes and programme?’ At this interim stage it is premature
and ill-advised to draw hard conclusions for cost-effectiveness, however, for completeness and transparency the
interim findings of these eight schemes and relevant caveats are reported here.
In order to begin to address cost effectiveness were asked to outline their total costs around some standard
headings. The graph overleaf illustrates the distribution of total costs (not just Defra funded costs) across these
headings. It shows that the biggest costs were revenue (i.e. staff costs) and monitoring and evaluation which
accounted for between 2% (NCC) to 58% (GWP) of a scheme’s costs.109 As discussed earlier the aim of the
Reward and Recognition Scheme was to test, measure, assess and learn from innovative pilots, therefore,
monitoring and evaluation being part of the programme’s funding requirements it was expected that a large
proportion of costs would fall under this category. It is worth recognising that some schemes chose to do more
in-depth monitoring and evaluation (e.g. GWP, BathNES) whilst others took a more ‘light touch’ approach using
existing data readily available (e.g. Preen, NCC). Additionally, some schemes required a higher level of
monitoring and evaluation in order to deliver the scheme and issue rewards (e.g. AVR, NUS) whilst other
schemes were mainly doing monitoring and evaluation to learn about what works and what does not (e.g. WCC,
NCC).
Most headings of the cost categories in the graph overleaf are self-explanatory; however, it is worth pointing out
how some terms have been defined. Opportunity costs mainly covered diversion of staff time from what they
otherwise would be doing in order to deliver the scheme (which was normally not covered by Defra funding).
Revenue costs cover actual staff costs and other operating expenses (which was normally, in part at least,
covered by Defra). Schemes were also asked to estimate value-in-kind contributions in monetary form for
volunteers, partnerships and other value-in-kind contributions – though these were not strictly costs to the
schemes, if other organisations were to replicate the scheme these would be costs they or other partners would
incur. It is worth stating that not all schemes consistently reported items under each heading but where possible
the research team standardised these anomalies to ensure better comparability across the schemes.
109
Preen did incur monitoring and evaluation costs but it was not possible to separate these out.
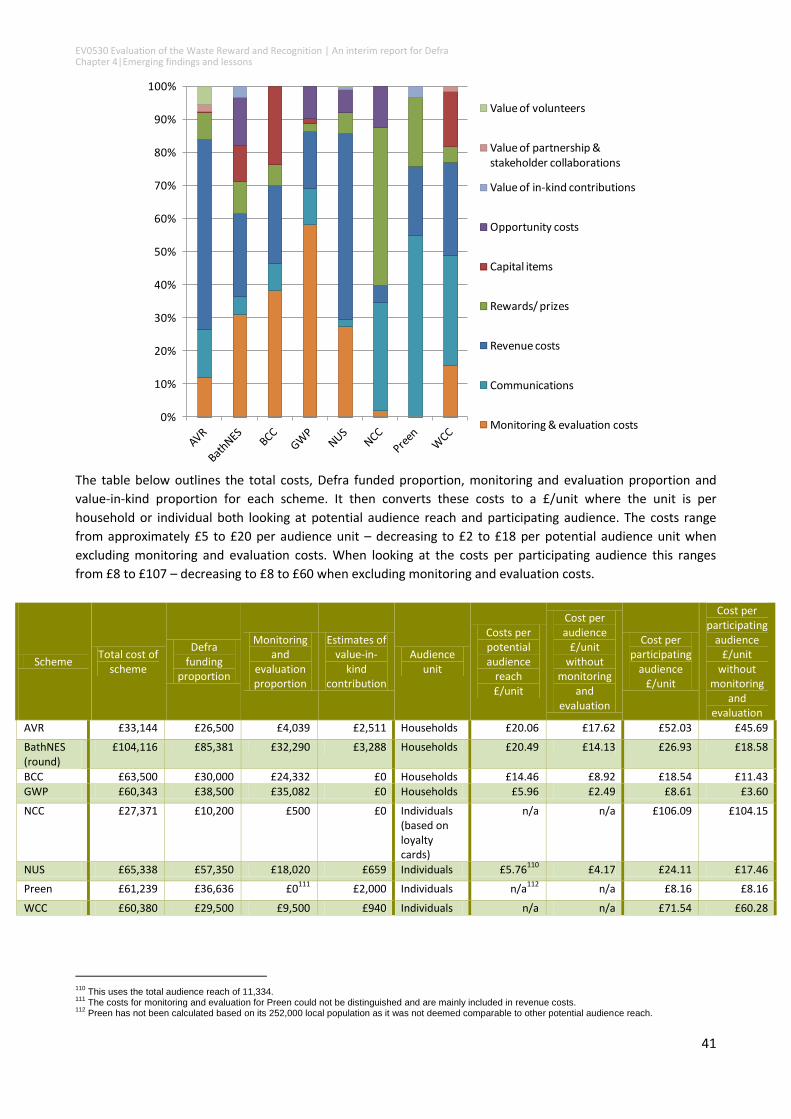
EV0530 Evaluation of the Waste Reward and Recognition | An interim report for Defra Chapter 4|Emerging findings and lessons
41
The table below outlines the total costs, Defra funded proportion, monitoring and evaluation proportion and
value-in-kind proportion for each scheme. It then converts these costs to a £/unit where the unit is per
household or individual both looking at potential audience reach and participating audience. The costs range
from approximately £5 to £20 per audience unit – decreasing to £2 to £18 per potential audience unit when
excluding monitoring and evaluation costs. When looking at the costs per participating audience this ranges
from £8 to £107 – decreasing to £8 to £60 when excluding monitoring and evaluation costs.
Scheme Total cost of
scheme
Defra funding
proportion
Monitoring and
evaluation proportion
Estimates of value-in-
kind contribution
Audience unit
Costs per potential audience
reach £/unit
Cost per audience
£/unit without
monitoring and
evaluation
Cost per participating
audience £/unit
Cost per participating
audience £/unit
without monitoring
and evaluation
AVR £33,144 £26,500 £4,039 £2,511 Households £20.06 £17.62 £52.03 £45.69
BathNES (round)
£104,116 £85,381 £32,290 £3,288 Households £20.49 £14.13 £26.93 £18.58
BCC £63,500 £30,000 £24,332 £0 Households £14.46 £8.92 £18.54 £11.43 GWP £60,343 £38,500 £35,082 £0 Households £5.96 £2.49 £8.61 £3.60
NCC £27,371 £10,200 £500 £0 Individuals (based on loyalty cards)
n/a n/a £106.09 £104.15
NUS £65,338 £57,350 £18,020 £659 Individuals £5.76110
£4.17 £24.11 £17.46
Preen £61,239 £36,636 £0111
£2,000 Individuals n/a112
n/a £8.16 £8.16
WCC £60,380 £29,500 £9,500 £940 Individuals n/a n/a £71.54 £60.28
110
This uses the total audience reach of 11,334. 111
The costs for monitoring and evaluation for Preen could not be distinguished and are mainly included in revenue costs. 112
Preen has not been calculated based on its 252,000 local population as it was not deemed comparable to other potential audience reach.
0%
10%
20%
30%
40%
50%
60%
70%
80%
90%
100%
Value of volunteers
Value of partnership & stakeholder collaborations
Value of in-kind contributions
Opportunity costs
Capital items
Rewards/ prizes
Revenue costs
Communications
Monitoring & evaluation costs
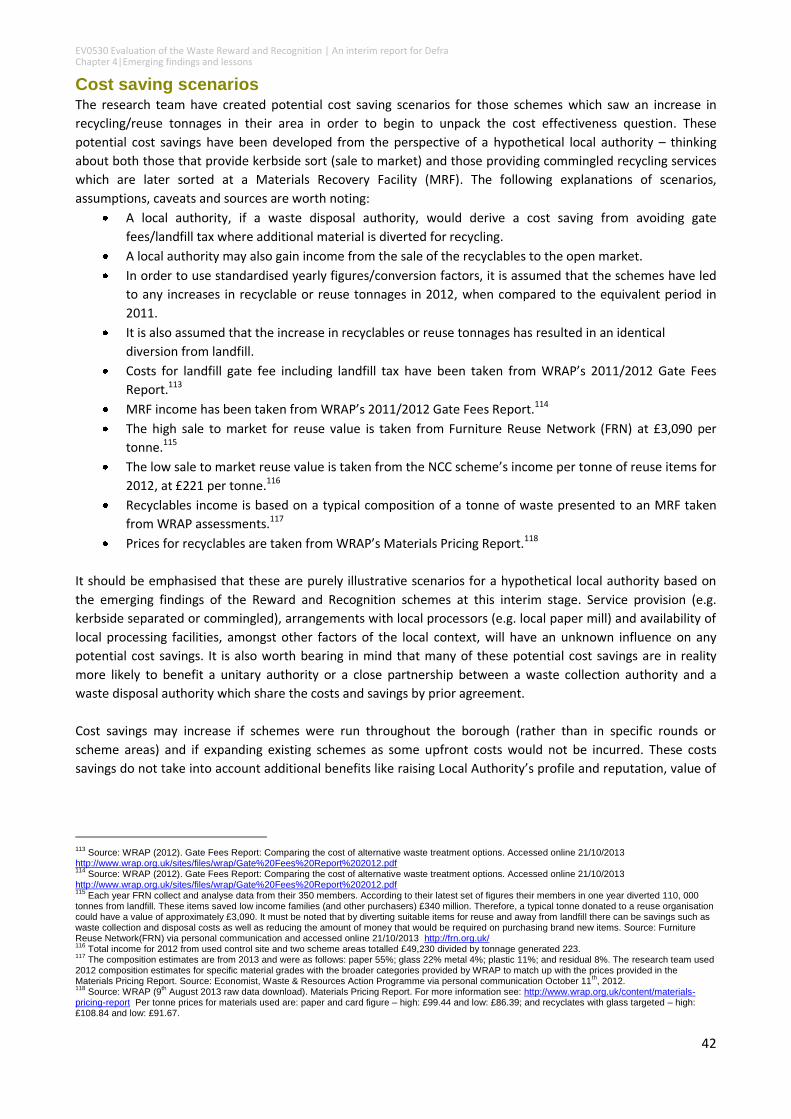
EV0530 Evaluation of the Waste Reward and Recognition | An interim report for Defra Chapter 4|Emerging findings and lessons
42
Cost saving scenarios The research team have created potential cost saving scenarios for those schemes which saw an increase in
recycling/reuse tonnages in their area in order to begin to unpack the cost effectiveness question. These
potential cost savings have been developed from the perspective of a hypothetical local authority – thinking
about both those that provide kerbside sort (sale to market) and those providing commingled recycling services
which are later sorted at a Materials Recovery Facility (MRF). The following explanations of scenarios,
assumptions, caveats and sources are worth noting:
A local authority, if a waste disposal authority, would derive a cost saving from avoiding gate
fees/landfill tax where additional material is diverted for recycling.
A local authority may also gain income from the sale of the recyclables to the open market.
In order to use standardised yearly figures/conversion factors, it is assumed that the schemes have led
to any increases in recyclable or reuse tonnages in 2012, when compared to the equivalent period in
2011.
It is also assumed that the increase in recyclables or reuse tonnages has resulted in an identical
diversion from landfill.
Costs for landfill gate fee including landfill tax have been taken from WRAP’s 2011/2012 Gate Fees
Report.113
MRF income has been taken from WRAP’s 2011/2012 Gate Fees Report.114
The high sale to market for reuse value is taken from Furniture Reuse Network (FRN) at £3,090 per
tonne.115
The low sale to market reuse value is taken from the NCC scheme’s income per tonne of reuse items for
2012, at £221 per tonne.116
Recyclables income is based on a typical composition of a tonne of waste presented to an MRF taken
from WRAP assessments.117
Prices for recyclables are taken from WRAP’s Materials Pricing Report.118
It should be emphasised that these are purely illustrative scenarios for a hypothetical local authority based on
the emerging findings of the Reward and Recognition schemes at this interim stage. Service provision (e.g.
kerbside separated or commingled), arrangements with local processors (e.g. local paper mill) and availability of
local processing facilities, amongst other factors of the local context, will have an unknown influence on any
potential cost savings. It is also worth bearing in mind that many of these potential cost savings are in reality
more likely to benefit a unitary authority or a close partnership between a waste collection authority and a
waste disposal authority which share the costs and savings by prior agreement.
Cost savings may increase if schemes were run throughout the borough (rather than in specific rounds or
scheme areas) and if expanding existing schemes as some upfront costs would not be incurred. These costs
savings do not take into account additional benefits like raising Local Authority’s profile and reputation, value of
113
Source: WRAP (2012). Gate Fees Report: Comparing the cost of alternative waste treatment options. Accessed online 21/10/2013 http://www.wrap.org.uk/sites/files/wrap/Gate%20Fees%20Report%202012.pdf 114
Source: WRAP (2012). Gate Fees Report: Comparing the cost of alternative waste treatment options. Accessed online 21/10/2013 http://www.wrap.org.uk/sites/files/wrap/Gate%20Fees%20Report%202012.pdf 115
Each year FRN collect and analyse data from their 350 members. According to their latest set of figures their members in one year diverted 110, 000 tonnes from landfill. These items saved low income families (and other purchasers) £340 million. Therefore, a typical tonne donated to a reuse organisation could have a value of approximately £3,090. It must be noted that by diverting suitable items for reuse and away from landfill there can be savings such as waste collection and disposal costs as well as reducing the amount of money that would be required on purchasing brand new items. Source: Furniture Reuse Network(FRN) via personal communication and accessed online 21/10/2013 http://frn.org.uk/ 116
Total income for 2012 from used control site and two scheme areas totalled £49,230 divided by tonnage generated 223. 117
The composition estimates are from 2013 and were as follows: paper 55%; glass 22% metal 4%; plastic 11%; and residual 8%. The research team used 2012 composition estimates for specific material grades with the broader categories provided by WRAP to match up with the prices provided in the Materials Pricing Report. Source: Economist, Waste & Resources Action Programme via personal communication October 11
th, 2012.
118 Source: WRAP (9
th August 2013 raw data download). Materials Pricing Report. For more information see: http://www.wrap.org.uk/content/materials-
pricing-report Per tonne prices for materials used are: paper and card figure – high: £99.44 and low: £86.39; and recyclates with glass targeted – high: £108.84 and low: £91.67.
EV0530 Evaluation of the Waste Reward and Recognition | An interim report for Defra Chapter 4|Emerging findings and lessons
43
£0
£2,000
£4,000
£6,000
£8,000
£10,000
£12,000
£14,000
£16,000
£18,000
24.2 tonnesMixed dry recyclables
(AVR)
10.9 tonnesPaper and card
(BCC)
73.4 tonnesMixed dry recyclables
(NUS)
Reycling cost savings scenariosMRF scenario -high
Sale to market scenario -high
Sale to market scenario -low
£0
£50,000
£100,000
£150,000
£200,000
£250,000
26.1 tonnes(NCC)
67.3 tonnes(Preen)
Reuse cost savings scenarios
Sale to market scenario -high
Sale to market scenario -low
publicity and public relations (e.g. local and national press coverage), etc. These values are hard to measure and
estimate; however, both BCC and WCC mentioned these benefits as a positive ‘spin-off’ from their scheme.
Based on these assumptions and caveats the potential cost savings drawing from the three schemes that observed an increase in recycling tonnages are shown in the graph to the right.119
Based on the above assumptions and
caveats the potential cost savings
drawing from the two schemes that
observed an increase in reuse tonnages
are shown in the graph to the right
below.
Both these graphs carry a sizeable health
warning. They have been developed for
illustrative purposes only and no firm
conclusions should be drawn from them.
Neither the research team nor Defra are
suggesting that these are the cost savings
to be expected from running similar
schemes. Furthermore, as outlined
earlier in this chapter, overall these
schemes cost more to run than the cost
savings they could potentially generate.
4.2 Behaviour and attitudes As outlined in section 2.2 many respondents claimed that they were already recycling/reusing and that the
reward and recognition scheme did not make a difference to how they recycled/reused. Up to two-fifths of
respondents, however, for some schemes (WCC and BCC) stated that they already recycled but that the scheme
gave them ‘extra encouragement’ to recycle.
When respondents were asked ‘what, if anything, about the scheme encouraged you to recycle more or better
than you did before’, the two most popular responses were ‘made me feel it’s the right thing to do’ and ‘showed
me that my efforts are appreciated’. The graph overleaf shows the top five responses to this question across the
six schemes that asked it.
When looking at the schemes that provided an individual reward (WCC, BCC and NUS120) compared to those that
provided a community reward (AVR, Preen and GWP) aspects that related to personal agency and personal
sense of purpose tended to be slightly more popular in individual reward schemes (e.g. ‘showed me that my
efforts are appreciated’ and ‘made me feel it’s the right thing to do’). Community reasons, however, were less
mentioned across all schemes. A minority of respondents mentioned community reasons (e.g. ‘inspired me to
help my community by recycling/reusing’) and these tended to be more often in community reward schemes.
119
For NUS the total tonnages are 73.4 as it only takes into account recycling and excludes the fall of 1.8 tonnes in reuse. 120
Bearing in mind that NUS was both an individual and a community reward scheme but that for this analysis it fits better with the individual rewards category. In the survey analysis, NUS responses exclude LSE as they offered a reuse scheme and had different questions in their survey.
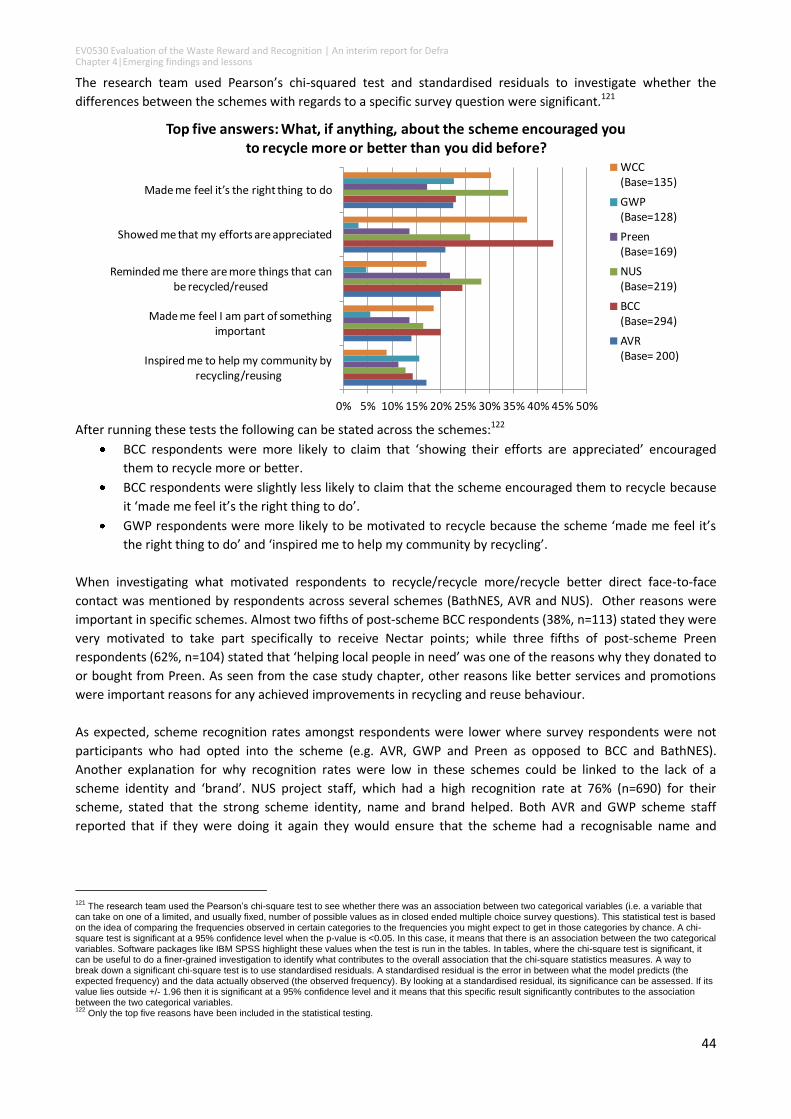
EV0530 Evaluation of the Waste Reward and Recognition | An interim report for Defra Chapter 4|Emerging findings and lessons
44
The research team used Pearson’s chi-squared test and standardised residuals to investigate whether the
differences between the schemes with regards to a specific survey question were significant.121
After running these tests the following can be stated across the schemes:122
BCC respondents were more likely to claim that ‘showing their efforts are appreciated’ encouraged
them to recycle more or better.
BCC respondents were slightly less likely to claim that the scheme encouraged them to recycle because
it ‘made me feel it’s the right thing to do’.
GWP respondents were more likely to be motivated to recycle because the scheme ‘made me feel it’s
the right thing to do’ and ‘inspired me to help my community by recycling’.
When investigating what motivated respondents to recycle/recycle more/recycle better direct face-to-face
contact was mentioned by respondents across several schemes (BathNES, AVR and NUS). Other reasons were
important in specific schemes. Almost two fifths of post-scheme BCC respondents (38%, n=113) stated they were
very motivated to take part specifically to receive Nectar points; while three fifths of post-scheme Preen
respondents (62%, n=104) stated that ‘helping local people in need’ was one of the reasons why they donated to
or bought from Preen. As seen from the case study chapter, other reasons like better services and promotions
were important reasons for any achieved improvements in recycling and reuse behaviour.
As expected, scheme recognition rates amongst respondents were lower where survey respondents were not
participants who had opted into the scheme (e.g. AVR, GWP and Preen as opposed to BCC and BathNES).
Another explanation for why recognition rates were low in these schemes could be linked to the lack of a
scheme identity and ‘brand’. NUS project staff, which had a high recognition rate at 76% (n=690) for their
scheme, stated that the strong scheme identity, name and brand helped. Both AVR and GWP scheme staff
reported that if they were doing it again they would ensure that the scheme had a recognisable name and
121
The research team used the Pearson’s chi-square test to see whether there was an association between two categorical variables (i.e. a variable that can take on one of a limited, and usually fixed, number of possible values as in closed ended multiple choice survey questions). This statistical test is based on the idea of comparing the frequencies observed in certain categories to the frequencies you might expect to get in those categories by chance. A chi-square test is significant at a 95% confidence level when the p-value is <0.05. In this case, it means that there is an association between the two categorical variables. Software packages like IBM SPSS highlight these values when the test is run in the tables. In tables, where the chi-square test is significant, it can be useful to do a finer-grained investigation to identify what contributes to the overall association that the chi-square statistics measures. A way to break down a significant chi-square test is to use standardised residuals. A standardised residual is the error in between what the model predicts (the expected frequency) and the data actually observed (the observed frequency). By looking at a standardised residual, its significance can be assessed. If its value lies outside +/- 1.96 then it is significant at a 95% confidence level and it means that this specific result significantly contributes to the association between the two categorical variables. 122
Only the top five reasons have been included in the statistical testing.
0% 5% 10% 15% 20% 25% 30% 35% 40% 45% 50%
Inspired me to help my community by recycling/reusing
Made me feel I am part of something important
Reminded me there are more things that can be recycled/reused
Showed me that my efforts are appreciated
Made me feel it’s the right thing to do
Top five answers: What, if anything, about the scheme encouraged you to recycle more or better than you did before?
WCC(Base=135)
GWP(Base=128)
Preen(Base=169)
NUS(Base=219)
BCC(Base=294)
AVR(Base= 200)
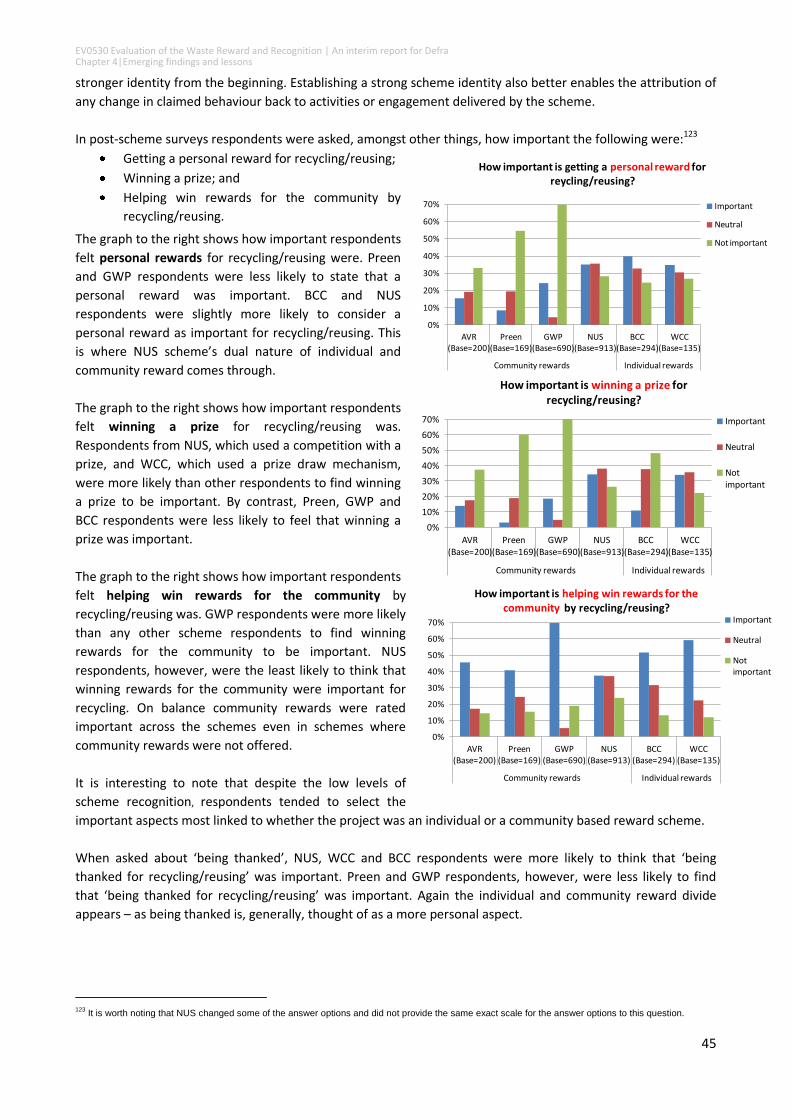
EV0530 Evaluation of the Waste Reward and Recognition | An interim report for Defra Chapter 4|Emerging findings and lessons
45
0%
10%
20%
30%
40%
50%
60%
70%
AVR(Base=200)
Preen(Base=169)
GWP(Base=690)
NUS(Base=913)
BCC(Base=294)
WCC(Base=135)
Community rewards Individual rewards
How important is helping win rewards for the community by recycling/reusing?
Important
Neutral
Not important
0%
10%
20%
30%
40%
50%
60%
70%
AVR(Base=200)
Preen(Base=169)
GWP(Base=690)
NUS(Base=913)
BCC(Base=294)
WCC(Base=135)
Community rewards Individual rewards
How important is winning a prize for recycling/reusing?
Important
Neutral
Not important
0%
10%
20%
30%
40%
50%
60%
70%
AVR(Base=200)
Preen(Base=169)
GWP(Base=690)
NUS(Base=913)
BCC(Base=294)
WCC(Base=135)
Community rewards Individual rewards
How important is getting a personal reward for reycling/reusing?
Important
Neutral
Not important
stronger identity from the beginning. Establishing a strong scheme identity also better enables the attribution of
any change in claimed behaviour back to activities or engagement delivered by the scheme.
In post-scheme surveys respondents were asked, amongst other things, how important the following were:123
Getting a personal reward for recycling/reusing;
Winning a prize; and
Helping win rewards for the community by
recycling/reusing.
The graph to the right shows how important respondents
felt personal rewards for recycling/reusing were. Preen
and GWP respondents were less likely to state that a
personal reward was important. BCC and NUS
respondents were slightly more likely to consider a
personal reward as important for recycling/reusing. This
is where NUS scheme’s dual nature of individual and
community reward comes through.
The graph to the right shows how important respondents
felt winning a prize for recycling/reusing was.
Respondents from NUS, which used a competition with a
prize, and WCC, which used a prize draw mechanism,
were more likely than other respondents to find winning
a prize to be important. By contrast, Preen, GWP and
BCC respondents were less likely to feel that winning a
prize was important.
The graph to the right shows how important respondents
felt helping win rewards for the community by
recycling/reusing was. GWP respondents were more likely
than any other scheme respondents to find winning
rewards for the community to be important. NUS
respondents, however, were the least likely to think that
winning rewards for the community were important for
recycling. On balance community rewards were rated
important across the schemes even in schemes where
community rewards were not offered.
It is interesting to note that despite the low levels of
scheme recognition, respondents tended to select the
important aspects most linked to whether the project was an individual or a community based reward scheme.
When asked about ‘being thanked’, NUS, WCC and BCC respondents were more likely to think that ‘being
thanked for recycling/reusing’ was important. Preen and GWP respondents, however, were less likely to find
that ‘being thanked for recycling/reusing’ was important. Again the individual and community reward divide
appears – as being thanked is, generally, thought of as a more personal aspect.
123
It is worth noting that NUS changed some of the answer options and did not provide the same exact scale for the answer options to this question.
EV0530 Evaluation of the Waste Reward and Recognition | An interim report for Defra Chapter 4|Emerging findings and lessons
46
4.3 Barriers, challenges and risks The eight schemes all attempted to change behaviour through novel and previously untested means on their
own target audience. Inevitably there were barriers, challenges and risks associated with all of the schemes as
they moved from planning to delivery. Considerable insight can be gained from their experiences and the table
below shows those that are related to the delivery of the schemes.
Activity Barriers, Challenges and Risks Schemes that experienced these issues
Knowing your target audience
Not knowing their target audience in detail:
Not being able to quantify and define specific target audience;
Not making the rewards relevant to target audience (see below); and
Not knowing enough about what type of engagement would work best with target audience.
WCC, NCC
Setting appropriate targets
Difficulties setting and monitoring progress against SMART objectives (for instance where a baseline is not known).
Preen, AVR
Communications Raising awareness was not as easy as originally planned and lead to disappointing recognition rates in post- survey. Schemes often had to repeat messages and use a wide range of methods in order to raise awareness – no one size fits all solution.
GWP, Preen, NUS, BCC
Encouraging recycling could lead to frustrations with the existing service set-up (e.g. size/shape of container provided, materials accepted) – careful communications were needed in order to overcome issue.
GWP, AVR
Providing instant feedback was challenging and not always possible. BCC, NUS Difficulties in awareness levels when there is not a clear scheme identity. AVR, GWP,
Preen Choosing your rewards
Rewards not attractive to audience e.g. if householders did not wish to have a Nectar card, or unfamiliar with chosen reward e.g. Bath Olivers.
BCC, BathNES, NUS
Rewards needed to be funded by cost savings (recycling credits) so this resulted in them being low compared to effort required and other funding options.
GWP
Some rewards were chosen because they were in-house or easily available but these might not have been most appealing.
NCC, WCC
Individuals who are already recycling or reusing well cannot necessarily increase their performance to get reward.
BathNES, Preen
If rewards require participants to own particular technology (e.g. smart phones, Nectar card) then some who are doing the necessary behaviour may be excluded due to not having the needed technology/card.
WCC, BCC
Community rewards required efforts from all community members so individuals might feel disheartened or frustrated e.g. members of Preen living in a Parish that had not signed up, or if community failed to reach target despite community group activity.
Preen, GWP
Engaging with ‘hard to reach’ or low participation areas
These groups had a variety of reasons why they were not previously participating. Whilst it was felt rewards would provide an additional incentive this was not always demonstrated.
AVR, GWP, Preen, BCC
Attracting sponsorship
Unsuccessful in attracting sponsorship or rewards from private companies or other sources.
NCC, WCC
Delivery partners
Using delivery partners meant that the scheme was out of direct control of lead organisation. This sometimes meant delays, changes or some areas not participating.
AVR, GWP, Preen
Delivery partner did not deliver as initially thought (either didn’t get engaged as expected or changed priorities).
AVR, Preen
Community groups did not always have the skill set and resources to deliver the scheme therefore more support was required than planned.
GWP, AVR
Contractors did not always have the capacity and skill set to deliver as planned. WCC, NCC, NUS
Engaging partners is a lengthy and resource intensive process GWP, NCC
Encouraging new customers or a shift in behaviour away from the norm
Generally schemes that encouraged recycling found it easier to deliver the scheme than those trying to give a reward for new behaviour (buying reused items). WCC gave rewards but did not know if this encouraged previous non-recyclers to recycle litter waste.
NCC, WCC, BCC
EV0530 Evaluation of the Waste Reward and Recognition | An interim report for Defra Chapter 4|Emerging findings and lessons
47
Activity Barriers, Challenges and Risks Schemes that experienced these issues
Prevention of possible misuse of rewards
Risk that rewards will be misused, mislaid or issued without the intended behaviour change occurring.
NCC, WCC
Operational issues to service provision
Standard difficulties experienced by most organisations/authorities providing recycling and reuse services:
Disruptions due to: service changes, round changes, weather, bank holidays, vehicle break down, etc.
GWP, AVR, BCC
Project Management
Most schemes experienced typical problems often encountered when delivering any project (staff sickness, change of staff, lack or resources, not having appropriate skills set, time delays, communication issues, unplanned changes or problems).
All schemes
Some projects felt that Defra’s Reward and Recognition Scheme timescale meant that some activities could not be carried out e.g. research before the project started, scheme launch.
GWP
Exit strategy Schemes ran for a specific period as a pilot and it is difficult to know/ it is not known if there were any effects of withdrawing the support once funding round had finished.
All schemes
All the schemes used a variety of methods to monitor and evaluate each scheme’s impacts. The majority of schemes (all except WCC) delivered rewards on the basis of actual performance so had to monitor this in order to issue rewards. All schemes also carried out evaluation activities as part of the requirement of being part of Defra’s Reward and Recognition Scheme. In terms of monitoring and evaluation the barriers, challenges and risks are listed in the table overleaf.
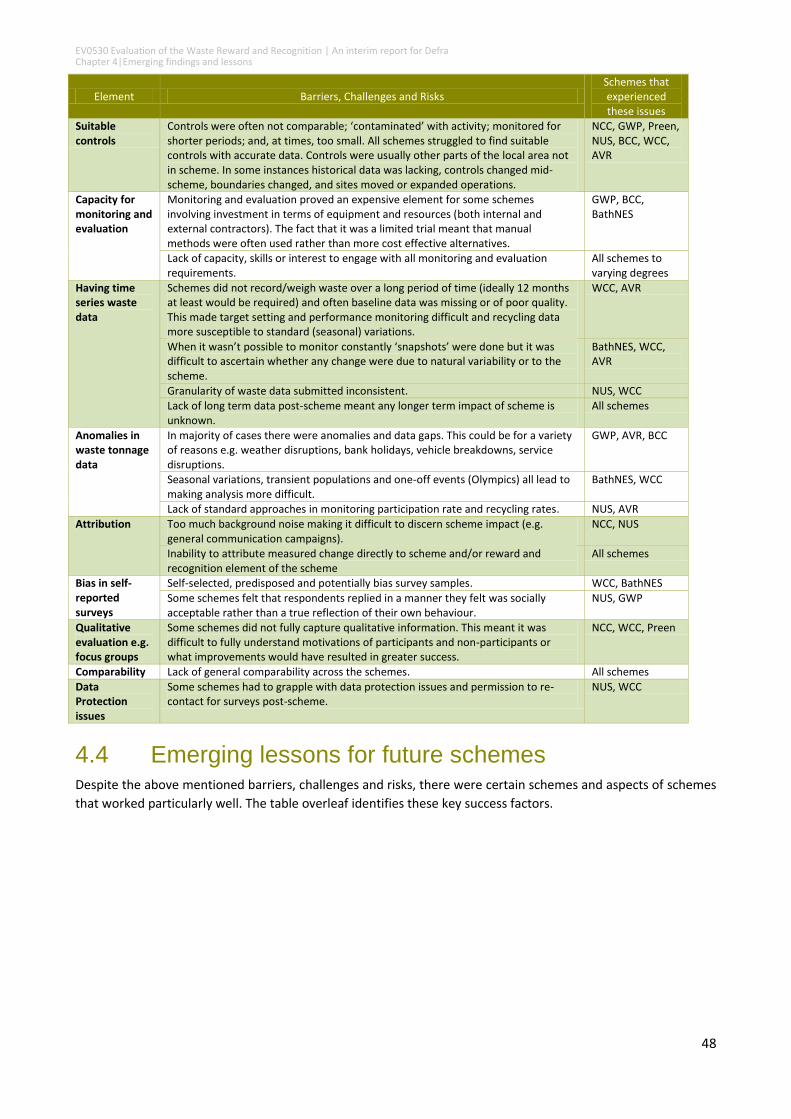
EV0530 Evaluation of the Waste Reward and Recognition | An interim report for Defra Chapter 4|Emerging findings and lessons
48
Element Barriers, Challenges and Risks Schemes that experienced these issues
Suitable controls
Controls were often not comparable; ‘contaminated’ with activity; monitored for shorter periods; and, at times, too small. All schemes struggled to find suitable controls with accurate data. Controls were usually other parts of the local area not in scheme. In some instances historical data was lacking, controls changed mid-scheme, boundaries changed, and sites moved or expanded operations.
NCC, GWP, Preen, NUS, BCC, WCC, AVR
Capacity for monitoring and evaluation
Monitoring and evaluation proved an expensive element for some schemes involving investment in terms of equipment and resources (both internal and external contractors). The fact that it was a limited trial meant that manual methods were often used rather than more cost effective alternatives.
GWP, BCC, BathNES
Lack of capacity, skills or interest to engage with all monitoring and evaluation requirements.
All schemes to varying degrees
Having time series waste data
Schemes did not record/weigh waste over a long period of time (ideally 12 months at least would be required) and often baseline data was missing or of poor quality. This made target setting and performance monitoring difficult and recycling data more susceptible to standard (seasonal) variations.
WCC, AVR
When it wasn’t possible to monitor constantly ‘snapshots’ were done but it was difficult to ascertain whether any change were due to natural variability or to the scheme.
BathNES, WCC, AVR
Granularity of waste data submitted inconsistent. NUS, WCC Lack of long term data post-scheme meant any longer term impact of scheme is unknown.
All schemes
Anomalies in waste tonnage data
In majority of cases there were anomalies and data gaps. This could be for a variety of reasons e.g. weather disruptions, bank holidays, vehicle breakdowns, service disruptions.
GWP, AVR, BCC
Seasonal variations, transient populations and one-off events (Olympics) all lead to making analysis more difficult.
BathNES, WCC
Lack of standard approaches in monitoring participation rate and recycling rates. NUS, AVR
Attribution Too much background noise making it difficult to discern scheme impact (e.g. general communication campaigns).
NCC, NUS
Inability to attribute measured change directly to scheme and/or reward and recognition element of the scheme
All schemes
Bias in self-reported surveys
Self-selected, predisposed and potentially bias survey samples. WCC, BathNES
Some schemes felt that respondents replied in a manner they felt was socially acceptable rather than a true reflection of their own behaviour.
NUS, GWP
Qualitative evaluation e.g. focus groups
Some schemes did not fully capture qualitative information. This meant it was difficult to fully understand motivations of participants and non-participants or what improvements would have resulted in greater success.
NCC, WCC, Preen
Comparability Lack of general comparability across the schemes. All schemes
Data Protection issues
Some schemes had to grapple with data protection issues and permission to re-contact for surveys post-scheme.
NUS, WCC
4.4 Emerging lessons for future schemes Despite the above mentioned barriers, challenges and risks, there were certain schemes and aspects of schemes
that worked particularly well. The table overleaf identifies these key success factors.
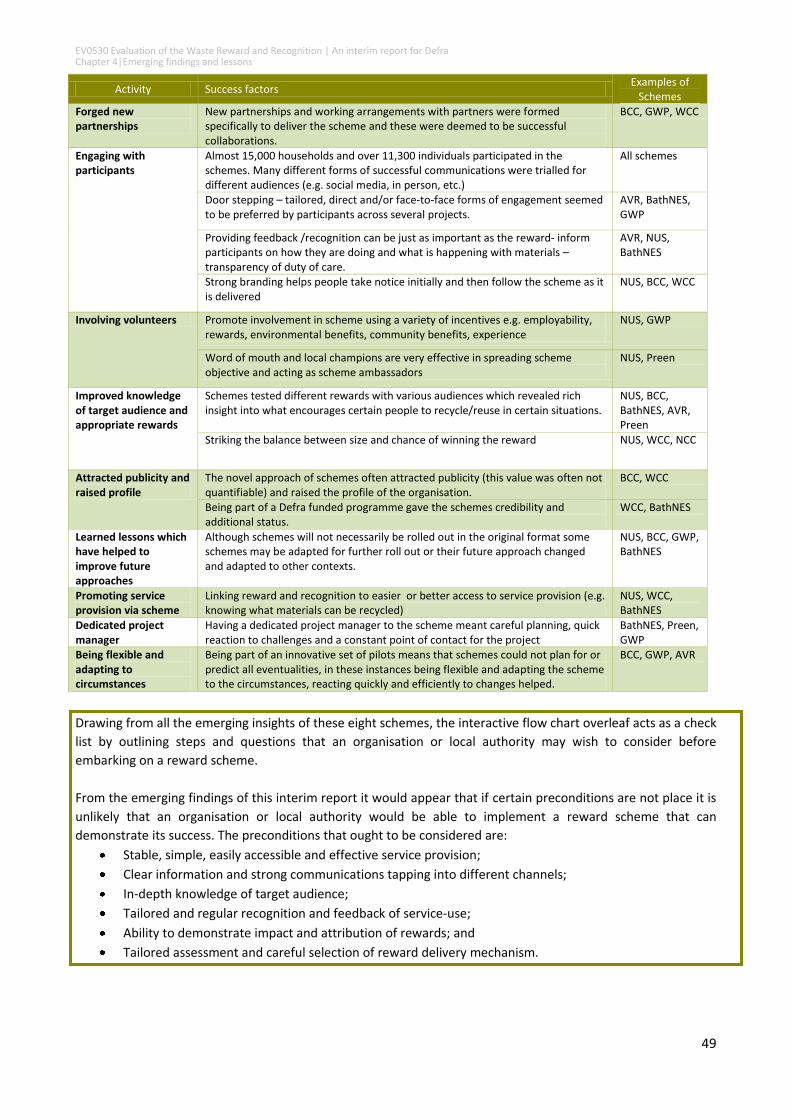
EV0530 Evaluation of the Waste Reward and Recognition | An interim report for Defra Chapter 4|Emerging findings and lessons
49
Activity Success factors Examples of
Schemes
Forged new partnerships
New partnerships and working arrangements with partners were formed specifically to deliver the scheme and these were deemed to be successful collaborations.
BCC, GWP, WCC
Engaging with participants
Almost 15,000 households and over 11,300 individuals participated in the schemes. Many different forms of successful communications were trialled for different audiences (e.g. social media, in person, etc.)
All schemes
Door stepping – tailored, direct and/or face-to-face forms of engagement seemed to be preferred by participants across several projects.
AVR, BathNES, GWP
Providing feedback /recognition can be just as important as the reward- inform participants on how they are doing and what is happening with materials – transparency of duty of care.
AVR, NUS, BathNES
Strong branding helps people take notice initially and then follow the scheme as it is delivered
NUS, BCC, WCC
Involving volunteers Promote involvement in scheme using a variety of incentives e.g. employability, rewards, environmental benefits, community benefits, experience
NUS, GWP
Word of mouth and local champions are very effective in spreading scheme objective and acting as scheme ambassadors
NUS, Preen
Improved knowledge of target audience and appropriate rewards
Schemes tested different rewards with various audiences which revealed rich insight into what encourages certain people to recycle/reuse in certain situations.
NUS, BCC, BathNES, AVR, Preen
Striking the balance between size and chance of winning the reward NUS, WCC, NCC
Attracted publicity and raised profile
The novel approach of schemes often attracted publicity (this value was often not quantifiable) and raised the profile of the organisation.
BCC, WCC
Being part of a Defra funded programme gave the schemes credibility and additional status.
WCC, BathNES
Learned lessons which have helped to improve future approaches
Although schemes will not necessarily be rolled out in the original format some schemes may be adapted for further roll out or their future approach changed and adapted to other contexts.
NUS, BCC, GWP, BathNES
Promoting service provision via scheme
Linking reward and recognition to easier or better access to service provision (e.g. knowing what materials can be recycled)
NUS, WCC, BathNES
Dedicated project manager
Having a dedicated project manager to the scheme meant careful planning, quick reaction to challenges and a constant point of contact for the project
BathNES, Preen, GWP
Being flexible and adapting to circumstances
Being part of an innovative set of pilots means that schemes could not plan for or predict all eventualities, in these instances being flexible and adapting the scheme to the circumstances, reacting quickly and efficiently to changes helped.
BCC, GWP, AVR
Drawing from all the emerging insights of these eight schemes, the interactive flow chart overleaf acts as a check
list by outlining steps and questions that an organisation or local authority may wish to consider before
embarking on a reward scheme.
From the emerging findings of this interim report it would appear that if certain preconditions are not place it is
unlikely that an organisation or local authority would be able to implement a reward scheme that can
demonstrate its success. The preconditions that ought to be considered are:
Stable, simple, easily accessible and effective service provision;
Clear information and strong communications tapping into different channels;
In-depth knowledge of target audience;
Tailored and regular recognition and feedback of service-use;
Ability to demonstrate impact and attribution of rewards; and
Tailored assessment and careful selection of reward delivery mechanism.
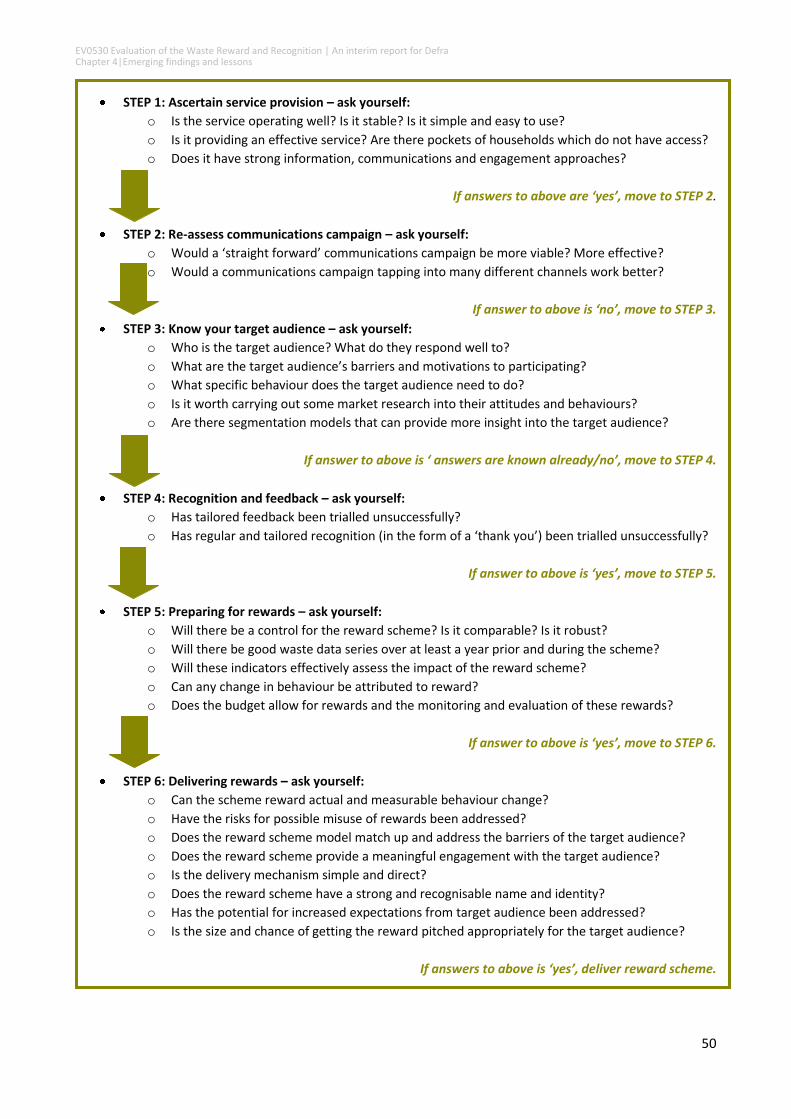
EV0530 Evaluation of the Waste Reward and Recognition | An interim report for Defra Chapter 4|Emerging findings and lessons
50
STEP 1: Ascertain service provision – ask yourself:
o Is the service operating well? Is it stable? Is it simple and easy to use?
o Is it providing an effective service? Are there pockets of households which do not have access?
o Does it have strong information, communications and engagement approaches?
If answers to above are ‘yes’, move to STEP 2.
STEP 2: Re-assess communications campaign – ask yourself:
o Would a ‘straight forward’ communications campaign be more viable? More effective?
o Would a communications campaign tapping into many different channels work better?
If answer to above is ‘no’, move to STEP 3.
STEP 3: Know your target audience – ask yourself:
o Who is the target audience? What do they respond well to?
o What are the target audience’s barriers and motivations to participating?
o What specific behaviour does the target audience need to do?
o Is it worth carrying out some market research into their attitudes and behaviours?
o Are there segmentation models that can provide more insight into the target audience?
If answer to above is ‘ answers are known already/no’, move to STEP 4.
STEP 4: Recognition and feedback – ask yourself:
o Has tailored feedback been trialled unsuccessfully?
o Has regular and tailored recognition (in the form of a ‘thank you’) been trialled unsuccessfully?
If answer to above is ‘yes’, move to STEP 5.
STEP 5: Preparing for rewards – ask yourself:
o Will there be a control for the reward scheme? Is it comparable? Is it robust?
o Will there be good waste data series over at least a year prior and during the scheme?
o Will these indicators effectively assess the impact of the reward scheme?
o Can any change in behaviour be attributed to reward?
o Does the budget allow for rewards and the monitoring and evaluation of these rewards?
If answer to above is ‘yes’, move to STEP 6.
STEP 6: Delivering rewards – ask yourself:
o Can the scheme reward actual and measurable behaviour change?
o Have the risks for possible misuse of rewards been addressed?
o Does the reward scheme model match up and address the barriers of the target audience?
o Does the reward scheme provide a meaningful engagement with the target audience?
o Is the delivery mechanism simple and direct?
o Does the reward scheme have a strong and recognisable name and identity?
o Has the potential for increased expectations from target audience been addressed?
o Is the size and chance of getting the reward pitched appropriately for the target audience?
If answers to above is ‘yes’, deliver reward scheme.
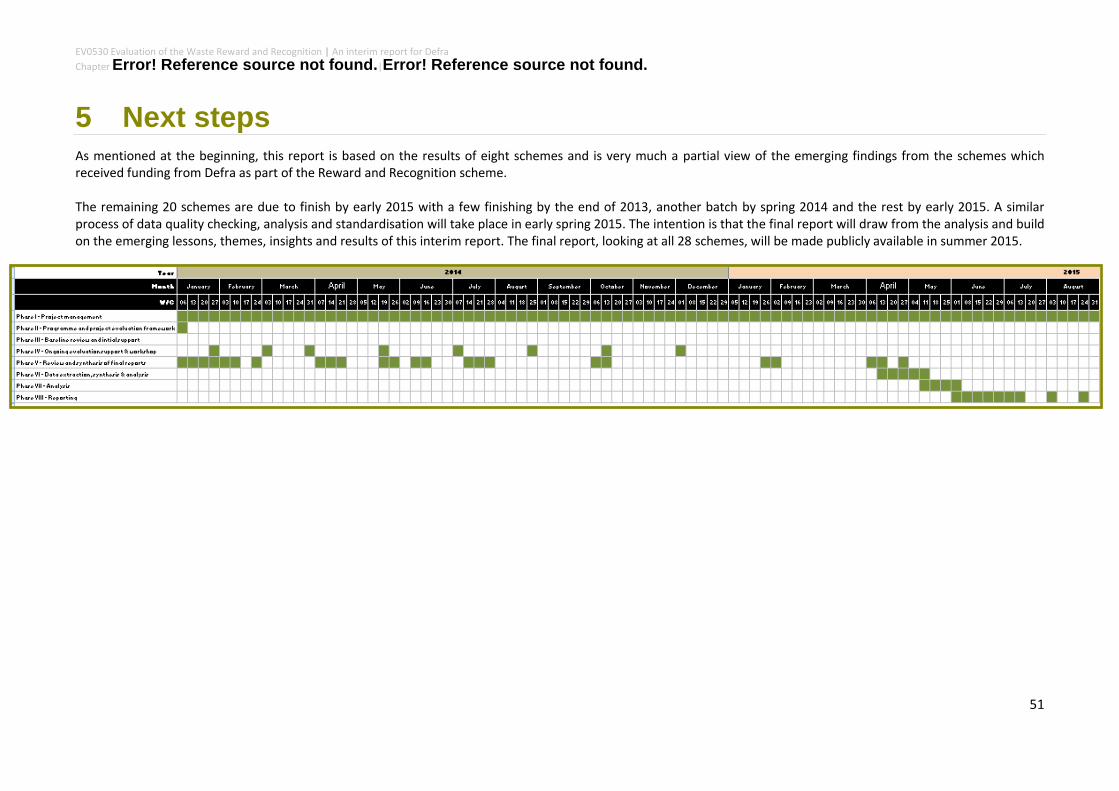
EV0530 Evaluation of the Waste Reward and Recognition | An interim report for Defra
Chapter Error! Reference source not found.|Error! Reference source not found.
51
5 Next steps
As mentioned at the beginning, this report is based on the results of eight schemes and is very much a partial view of the emerging findings from the schemes which received funding from Defra as part of the Reward and Recognition scheme. The remaining 20 schemes are due to finish by early 2015 with a few finishing by the end of 2013, another batch by spring 2014 and the rest by early 2015. A similar process of data quality checking, analysis and standardisation will take place in early spring 2015. The intention is that the final report will draw from the analysis and build on the emerging lessons, themes, insights and results of this interim report. The final report, looking at all 28 schemes, will be made publicly available in summer 2015.