Embed Size (px)
Citation preview

General rights Copyright and moral rights for the publications made accessible in the public portal are retained by the authors and/or other copyright owners and it is a condition of accessing publications that users recognise and abide by the legal requirements associated with these rights.
Users may download and print one copy of any publication from the public portal for the purpose of private study or research.
You may not further distribute the material or use it for any profit-making activity or commercial gain
You may freely distribute the URL identifying the publication in the public portal If you believe that this document breaches copyright please contact us providing details, and we will remove access to the work immediately and investigate your claim.
Downloaded from orbit.dtu.dk on: Jan 29, 2019
Evacuation of ChildrenFocusing on daycare centers and elementary schools
Larusdottir, Aldis Run; Dederichs, Anne Simone; Nilsson, Daniel
Publication date:2014
Document VersionPublisher's PDF, also known as Version of record
Link back to DTU Orbit
Citation (APA):Larusdottir, A. R., Dederichs, A., & Nilsson, D. (2014). Evacuation of Children: Focusing on daycare centers andelementary schools. Technical University of Denmark, Department of Civil Engineering. BYG Rapport R-295

Evacuation of Children
Focusing on daycare centers and elementary
schools
Aldís Rún Lárusdóttir
Ph.D. Thesis
Department of Civil Engineering
Technical University of Denmark
2013

Evacuation of ChildrenFocusing on daycare centers and elementary schoolsCopyright ©, Aldís Rún Lárusdóttir, 2013Department of Civil EngineeringTechnical University of DenmarkBYG Rapport R-295ISBN:9788778773814
Preface
This thesis is submitted as a partial fulfillment of the requirements for the Danish Ph.d.degree. The focus of the project has been to collect data and increase knowledge on evac-uation of children. The main supervisor of the project is Anne S. Dederichs, associateprofessor at the Department of Civil Engineering, Technical University of Denmark andthe co-supervisor is Daniel Nilsson, associate professor at the Department of Fire SafetyEngineering and Systems Safety, Lund University.
Starting in October 2009 and ending in September 2013, the project has most certainlybeen a journey, both professionally and personally, that is now about to come to an end.Little did I know when I started that I would become so fond of the academic world and ofbeing a part of the fire safety science community. Right from the beginning I felt welcomeboth by colleagues at DTU and researchers in the field even though I probably made anuntraditional appearance at my first conference, Pedestrian and Evacuation Dynamics, in2010. I showed up with a three month old baby and my husband as a babysitter. Afterliving in Denmark during my studies I returned to my home country, Iceland, for theexternal research stay and to complete the thesis.
This thesis consists of two parts. Part I is a synopsis of the work of the project andPart II includes the scientific papers which this thesis is based on.
Reykjavik, September 30th 2013
iii


Acknowledgements
This project could not have been completed without the help, support and participationof several people and institutes.
First of all I thank the European Union for financing the KESØ project.
I thank Copenhagen Fire Department for their contribution in arranging fire drills indaycare centers in the Vesterbro area, Copenhagen as well as all the participating day-care centers for their positive attitude towards the project. I also thank Anders LyhneSønderriis and Søren Mortensen for their work on data collecting in the daycare centers.
I thank the fire chief of Lyngby Taarbæk Municipally, Rasmus Storgaard Petersen forhis contribution in arranging fire drills in elementary schools in Lyngby as well as theschools’ positive attitude towards the drills. I also thank Birgit Pedersen for her work ondata collecting and initial analyzing of the elementary school fire drills.
I thank the Capital District Fire and Rescue Services in Iceland for hosting and wel-coming me during my external research stay in Iceland. I thank them for treating me asone of their own and for patiently answering my questions and giving me an inside viewinto their work and everyday challenges.
I thank the statistical team at the Science Institute of the University of Iceland, in par-ticular Óli Páll Geirsson, for helping with the statistical analysis.
Furthermore I thank my colleagues in the fire safety group at the Section for BuildingDesign, Department of Civil Engineering for their support and discussions throughoutthe project. In particular my fellow PhD. student and now my good friend, Janne GressSørensen who I shared an office with, for her professional and personal support at all times.
Thanks to co-supervisor Daniel Nilsson, especially for his input on and discussions onresearch ethics. I also thank other members of the KESØ project at Lund University forinspiring project meetings and cooperation.
v
I am greatly thankful to my supervisor, Anne S. Dederichs for introducing me to theacademic world and giving me the chance to do a PhD. For believing in me at all times,offering support when needed and giving space when needed. For not only being a super-visor, but also a colleague and a friend.
At last but not least I thank my family. My parents for babysitting and assisting atbusy times, my sister Sólrún and Lee for proofreading assistance and especially my hus-band, Sigurjón Björnsson, for encouraging me to grab the opportunity when offered aPhD. position. For listening to endless project talk and being a sparring partner whenneeded the most. For helping me with technical problems and for doing some macro pro-gramming for me to make my life just a little easier. For standing by my side when thingswere hard and for taking care of our home and children when I was too busy. And ofcourse I thank my wonderful children for bearing with me when I was away at conferencesor working late.

Abstract
Saving human lives is the highest priority in case of fire, according to fire codes around theworld. Codes state that everyone should be able to escape to safety in case of fire. In orderto design buildings that enable this the available safe egress time (ASET) must be held upagainst the required safe egress time (RSET). In theory if the ASET is larger than RSETeveryone gets out safely. Different calculation methods are used for the determinationof both times. Results of the calculations can however never be more accurate than thedata they are based on. The aim of this project is to provide new data and informationon children’s evacuation, which is a step towards including children in evacuation modelsand calculations.
Little is known about children’s evacuation characteristics in fire compared to other partsof the population. In recent years there has been more focus on children’s evacuationwhich is reflected in a rising number of publications on the topic.
This thesis comprises evacuation experiments in daycares for children 0-6 years old andelementary schools for children aged 6-15 years. Full scale evacuations were filmed allow-ing detailed data analysis.
Findings and results include elements of three different areas, namely measurable pa-rameters such as travel speed and flow though doors, human behavior such as choiceof route and actions and processes such as evacuation procedures and warning methods.These areas are all related and influence each other, making it hard to isolate single factorsand findings. Although an engineering approach fits best to the measurable parameters,the other areas are at least equally important when investigating or predicting children’sevacuation.
The key findings of the thesis are:
• Children are very dependent on adults for initiating and carrying through anevacuation where the youngest children need the most assistance in both phases.Self preservation i.e. where children descended stairs unassisted, was less than25 % for children aged 0-2 years but over 85 % for children aged 3-6 years.
vii
• Warning method influenced pre-evacuation time, indicating that an alarm withaudio signal is preferable to a light signal only or no alarm at all.
• Children’s evacuation cannot be described using adults’ evacuation modelsthroughout. Young children are slower than adults and travel speed increaseswith age. At the age of 12 years children can be described using adults’ travelparameters on stairs.
• Children generally achieved higher person densities and flow rates than adults.The flow rate increased with age until the age of 12 years where it startedlowering, approaching theoretical values for adults. Children used the wholewidth of doors and stairs where needed, not leaving a boundary layer as thetheory for adults suggests.
• Handrails were frequently used by both age groups in the daycare centers, morewhen walking on their own than when assisted. It was found that children usinga low handrail achieved on average a 23.5% higher travel speed than those usinga handrail designed for adults.
• Training has a positive effect on evacuation time and process. Fire drills showedweaknesses in evacuation procedures which could be revised accordingly.
Although a number of findings have been made and new data has been provided thereis need for further research on the topic. Suggestions include data collection as wellas further use of the existing video material, for answering unanswered questions andvalidating the current results.

Resumé
(Abstract in Danish)Menneskeliv har den højeste prioritet i tilfælde af en brand. Regler og love over det mesteaf verden kræver at alle, der opholder sig i en bygning, skal kunne bringe sig i sikkerhed,hvis en brand opstår. For at kunne designe bygninger, der opfylder dette krav, skal tidenindtil kritiske forhold opstår (tkrit) sammenlignes med den nødvendige evakueringstid(tevak). Teorien foreskriver at alle er sikre hvis tkrit er større end tevak. Der findesimidlertid forskellige måder at beregene de nævnte tider på, og beregningerne kan aldrigblive mere præcise end de data, som de bygger på. Formålet med dette projekt er attilvejebringe ny data og information om evakuering af børn, hvilket vil bringe os et skridtnærmere i bestræbelserne på at inkludere børn i evakueringsmodeller og -beregninger.
Der er findes på nuværende tidspunkt kun begrænset viden om hvordan børn reagereog handler i en evakueringssituation sammenlignet med andre dele af befolkningen. Deseneste år er der dog kommet et større fokus på hvordan børn evakuerer, hvilket også kanmåles på et øget antal publikationer om emnet.
Dette projekt omhandler evakueringsforsøg i daginstitutioner med børn i alderen 0-6 årog i folkeskoler med børn og unge i alderen 6-15 år. Alle fuld skala evakueringsforsøg blevfilmet, hvilket gav mulighed for en detaljeret analyse efterfølgende.
Resultaterne kan inddeles i tre områder, målbare fysiske parametre såsom hastighed ogpersonstrøm gennem døre, menneskeligadfærd, herunder valg af evakueringsrute samthandlinger og til sidst processer, hvilket inkluderer evakueringsprocedurer og varslingsme-toder. Disse tre områder er alle forbundne og det kan være svært at adskille de enkelteresultater og opdagelser fra hinanden. Selvom den ingeniørmæssige tilgang passer bedsttil de målbare fysiske parametre er de andre områder mindst lige så vigtige når børnsevakuering skal undersøges eller estimeres.
Projektets hovedresultater er følgende:
• Børn er meget afhængige af voksne for at initiere og gennemføre en evakuering.De yngste børn har brug for mest hjælp i begge faser. Ved gang ned af trappervar mindre end 25
ix
• Varslingsmetoden havde inflydelse på tiden det tog at initiere evakueringen. Enlydgivende alarm var at foretrække fremover en alarm kun med lyssignal elleringen alarm.
• Evakueringsmodeller for voksne kan ikke bruges enkeltstående til at beskrivebørn. Små børn er langsommere end voksne men hastigheden stiger medalderen. Børn fra og med 12 år kan beskrives med de samme parametre somfor voksne når det gælder gang nedad trapper.
• Børn opnåede generelt en højere personstrøm gennem døre end teorien angiverfor voksne. Personstrømmen var stigende med alderen indtil 12 års alderen, hvorden igen aftog og begyndte at nærme sig værdien for voksne. Børn anvendtehele bredden af døre og trapper hvor det var nødvendigt. Der opstod derforikke et grænselag på begge sider af evakueringsruten, som evakueringsteorienangiver.
• Gelænder blev hyppigt brugt af begge aldersgrupper i daginstitutioner, dog ihøjere grad for de selvhjulpne børn. Når de mindste børn brugte et gelænderplaceret i børnehøjde opnåede de en 23.5
• Træning har vist en positiv indflydelse på evakueringstiden og processerne underen evakuering. Brandøvelser afslørede svagheder i evakueringsprocedurer, somderaf kunne justeres.
Projektet har resulteret i en øget viden og nye data indenfor området evakuering af børn.Der er dog fortsat brug for mere forskning på området. Der skal indsamles en endnu størremængde data og de eksisterende videooptagelser skal danne grundlag for flere analyser.Dette er behøvet for at kunne besvare nogle af de ubesvarede spørgsmål som er opståetsamt til validering af de eksisterende data.

Samantekt
(Abstract in Icelandic)Þegar eldsvoði á sér stað hefur björgun mannslifa algjöran forgang samkvæmt brunavarnareglugerðumum allan heim sem tilgreina á einn eða annan hátt að allir notendur bygginga eigi að getaforðað sér örugglega. Við hönnun bygginga samkvæmt þessu þarf að bera saman áætlaðantíma uns hættuástand myndast, (th_tta) við áætlaðan flóttatíma, (tflótti). Samkvæmtbókinni eru allir öruggir ef th_tta er lengri en tflótti. Ýmsum aðferðum er beitt við tí-maútreikninginn en niðurstöðurnar verða þó aldrei nákvæmari en gögnin sem þær byggjaá. Markmið þessa verkefnis er að afla nýrra gagna og upplýsinga um rýmingu barna, semer skref í áttina að því að geta tekið tillit til barna í líkönum og útreikningum.
Samanborið við aðra hópa þjóðfélagsins er lítið vitað um hvað einkennir rýmingu barna.Undanfarin ár hefur þessu þó verið meiri gaumur gefinn sem endurspeglast í fleiri fræði-greinumsem fjalla um rýmingu barna.
Þetta verkefni byggir á rýmingaræfingum í leikskólum fyrir börn 0-6 ára og í grunnskólumfyrir börn 6-15 ára. Þar voru rýmingaræfingar myndaðar og gögnin rannsökuð nákvæm-lega.
Niðurstöðurnar eru þríþættar og varða mælanlegar breytur svo sem gönguhraða og flæðií gegnum dyr, mannlega hegðun svo sem viðbrögð og leiðarval og kerfislega þætti á borðvið rýmingaráætlun og tegund viðvörunar. Öll þessi atriði tengjast og hafa áhrif hvert áannað sem veldur erfiðleikum þegar einangra á stakar niðurstöður. Þó svo að verkfræðilegnálgur eigi best við mælanlegu breyturnar eru hinar ekki síður mikilvægar þegar rannsakaá eða spá fyrir um rýmingu barna.
Lykilniðurstöður rannsóknarinnar eru:
• Börn eru mjög háð fullorðnum þegar kemur að rýmingu og yngstu börnin þurfamesta aðstoð í öllu rýmingarferlinu. Hlutfall sjálfsbjarga barna, sem börn genguóstudd niður stiga, var undir 25 % hjá aldurshópnum 0-2 ára en yfir 85 % hjáaldurshópnum 3-6 ára.
xi
• Aðferð viðvörunar hafði áhrif á tímann sem leið uns fólk hóf eiginlega rýminguog gefa niðurstöðurnar til kynna að aðvörun með hljóðmerki sé betri en aðvörunaðeins með ljósi eða ekkert aðvörunarkerfi.
• Rýmingu barna er ekki hægt að lýsa eingöngu með rýmingarlíkönum fullorðinna.Ung börn fara hægar en fullorðnir og hraði eykst með aldrinum. Við tólf áraaldur er hægt að nota líkön fullorðinna til að lýsa göngu niður stiga.
• Börn þjöppuðu sér að jafnaði meira samanen fullorðnir og náðu örara flæðiFlæðið jókst með aldrinum en þó fór að draga úr þvi aftur við tólf ára aldurþar sem flæðið nálgaðist gildi fullorðinna. Börn nýttu til fulls vídddyraopa ogstigahúsa þar sem þörf var á svo að ónýtt jaðarlag var ekki sjáanlegt eins ogfræðin segja að eigi við um fullorðna.
• Handrið voru mikið notuð af báðum aldurshópum í leikskólum, þó meira þegarbörnin fengu ekki aðstoð frá fullorðnum. Niðurstöður sýndu að börn sem notuðulág handrið gengu að meðaltali 23.5 % hraðar en þau sem notuðu handrið ífullorðinshæð.
• Þjálfun hefur jákvæð áhrif á rýmingartíma og rýmingarferli. Rýmingaræfingarsýndu fram á veikleika í rýmingaráætlunum sem hægt var að lagfæra samkvæmtþeim.
Þrátt fyrir margvíslegar niðurstöður og ný gögn er þörf á frekari rannsóknum á sviðinu.Lögð er til bæði ný gagnasöfnun og frekari úrvinnsla myndefnis , til þess að svara ósvöruðumspurningum og að treysta þegar fengnar niðurstöður.
List of papers
Papers I-IV
Paper I:
A.R. Larusdottir and A.S. Dederichs, Evacuation of children - movement onstairs and on horizontal plane. Fire Technology, Vol.48, pages 43-53, 2012.
Paper II:
A.R. Larusdottir and A.S. Dederichs, A step towards including children’s evac-uation parameters and behavior in fire safe building design. Fire Safety Science10, pages 187–195, 2011.
Paper III:
A.R. Larusdottir and A.S. Dederichs, Movement down stairs during elemen-tary school fire drills. Fire and Materials, 2013. Submitted.
Paper IV:
A.R. Larusdottir and A.S. Dederichs, Evacuation of young children from mul-tistory daycare centers: Travel parameters down stairs. Fire Technology, 2013.Submitted.
Other papers
Presented at international conferences and published in conference proceedings (not ap-pended):
A.R. Larusdottir and A.S. Dederichs. Evacuation dynamics of children - walk-ing speeds, flow through doors in daycare centers. Proceedings of Pedestrianand Evacuation Dynamics Symposium, pages 139–147, 2010. (Paper I is anextended version of this paper.)
xiii
M.C. Campanella, A.R. Larusdottir, W. Daamen, and A.S. Dederichs. Em-pirical data analysis and modelling of the evacuation of children from threemulti-storey day-care centres. Proceedings of Evacuation and Human Behav-ior in Emergency Situations, Santander, 2011.
A.R. Larusdottir and A.S. Dederichs. Behavioural aspects of movement downstairs during elementary school fire drills. Proceedings of Human Behaviourin Fire Symposium, 2012.
In the making:
M.C. Campanella, A.R. Larusdottir, W. Daamen, and A.S. Dederichs. Identi-fying challenges when modeling children’s evacuation, by comparing empiricaldata to simulations. Manuscript.

Table of Contents
Preface iii
Acknowledgements v
Abstract vii
Resumé ix
Samantekt xi
List of papers xiii
PART I
1 Introduction 3
1.1 Objectives . . . . . . . . . . . . . . . . . . . . . . . . . . . . . . . . . . . . 51.2 Structure of the report . . . . . . . . . . . . . . . . . . . . . . . . . . . . . 5
2 Literature background 7
2.1 Overview - focus on children . . . . . . . . . . . . . . . . . . . . . . . . . . 7
3 Method 13
3.1 Background information . . . . . . . . . . . . . . . . . . . . . . . . . . . . 143.2 Ethics . . . . . . . . . . . . . . . . . . . . . . . . . . . . . . . . . . . . . . 143.3 Experiments . . . . . . . . . . . . . . . . . . . . . . . . . . . . . . . . . . . 153.4 Data analyzing . . . . . . . . . . . . . . . . . . . . . . . . . . . . . . . . . 193.5 Statistics . . . . . . . . . . . . . . . . . . . . . . . . . . . . . . . . . . . . . 22
4 Results and Discussion 23
4.1 Staff involvement . . . . . . . . . . . . . . . . . . . . . . . . . . . . . . . . 234.2 Pre-evacuation activities . . . . . . . . . . . . . . . . . . . . . . . . . . . . 264.3 Pre-evacuation times . . . . . . . . . . . . . . . . . . . . . . . . . . . . . . 274.4 Flow through doors . . . . . . . . . . . . . . . . . . . . . . . . . . . . . . . 294.5 Travel speed in horizontal plane . . . . . . . . . . . . . . . . . . . . . . . . 33
xv

4.6 Travel speed down stairs . . . . . . . . . . . . . . . . . . . . . . . . . . . . 334.7 Assistance in stairs . . . . . . . . . . . . . . . . . . . . . . . . . . . . . . . 394.8 Handrail use in stairs . . . . . . . . . . . . . . . . . . . . . . . . . . . . . . 424.9 Handholding in stairs . . . . . . . . . . . . . . . . . . . . . . . . . . . . . . 434.10 Gender difference . . . . . . . . . . . . . . . . . . . . . . . . . . . . . . . . 444.11 Behavioral aspects . . . . . . . . . . . . . . . . . . . . . . . . . . . . . . . 464.12 Design perspectives . . . . . . . . . . . . . . . . . . . . . . . . . . . . . . . 484.13 Procedures . . . . . . . . . . . . . . . . . . . . . . . . . . . . . . . . . . . . 504.14 Training . . . . . . . . . . . . . . . . . . . . . . . . . . . . . . . . . . . . . 53
5 Conclusion 55
5.1 Summary of results . . . . . . . . . . . . . . . . . . . . . . . . . . . . . . . 555.2 Limitations . . . . . . . . . . . . . . . . . . . . . . . . . . . . . . . . . . . 575.3 Future work . . . . . . . . . . . . . . . . . . . . . . . . . . . . . . . . . . . 585.4 Concluding remarks . . . . . . . . . . . . . . . . . . . . . . . . . . . . . . . 59
Bibliography 61
Appendices 67
A Icelandic program for 5 year old children 69
B Extended flow tables 71
C Extended speed tables 77
List of Figures 83
List of Tables 85
PART II
Paper I 89
Paper II 101
Paper III 115
Paper IV 127

PART I


C h a p t e r 1
Introduction
When entering the phrase "evacuation of children" into an online search engine the re-sults primarily deal with evacuation of British children from London to the countrysidewhich was considered safer, during Wold War II. As for this project the title Evacuationof children relates to moving children towards a safer location due to a potential threat,however it is limited to building evacuation.
A building evacuation may be triggered for different reasons, such as fire, earthquake,gas leak, bad weather and terror threats and they can have a different level of urgency.This project focuses on emergency evacuation due to fire, but the findings should appli-cable to other situations where immediate evacuation is needed.
Fire and building codes around the world focus on life safety, stating that everyone shouldhave the chance to escape safely in case of fire [1–3]. In order to design buildings that en-able this the estimated available safe egress time (ASET) is held up against the requiredsafe egress time (RSET). There are different methods to calculate both and in theoryeveryone gets out safely if the ASET is larger than RSET. The calculations can howevernever be more accurate than the data they base on.
The research field, of human behavior during evacuations and pedestrian dynamics, isyoung compared to many other research fields. Some of the earliest literature, which is infact still valid and referred to in today’s research, is Predtechenskii’s and Milinskii’s bookPlanning for Foot Traffic Flow in Buildings from 1969 [4] and Fruin’s book PedestrianPlanning and Design from 1971 [5]. Ever since, the research field has grown and moreliterature has become available.
3

Introduction
Children are a large subgroup of the population or 15-20 % of the Western countries’population [6]. This is a large group to neglect and a vulnerable one to, making it evenmore important to ensure its safety. As Fruin [5] put it:
"The child pedestrian is an especially vulnerable accident victim because ofgaps in language, perception, and visual and auditory comprehension. Manyaspects of human perception, such as peripheral vision, depth perception,judgement of speed and direction, and sound recognition, are attained throughexperience, which the child pedestrian has not yet acquired. This lack of ex-perience causes not only perceptual difficulties, but uncertain reactions underthe stress of frightening or unusual confrontations with moving traffic. In ad-dition, children do not comprehend road signs, or if they do, they do not fullyunderstand their responsibilities to obey these signs."
Even though this is meant in context of traffic safety it can easily be applied to fire safety.In case of fire, unexpected events can occur where advanced decision making, way finding,communication skills and physical strength might be needed, all of which a child mightnot have developed.
It is generally accepted that children are different from adults, although the differenceis not always well documented and tested. Scaling values for adults down to fit children,without proper testing and validation, is questionable. An example of this is when itcomes to estimating dosage and type of medication for children and adolescents [7].
Identifying locations and buildings where children are present is necessary in order toinvestigate the population and its evacuation characteristics. Apart from being at home,children are under many circumstances grouped together, namely in daycare centers or atschool while their parents are at work. Furthermore children are gathered at other placesfor shorter periods of time such as in shopping centers’ play areas, where parents canleave their children while shopping. Both types of situations mean that parents are notavailable during a potential evacuation resulting in a limited number of adults to initiate,guide and assist throughout the emergency.
Fire statistics show that fires are common in educational institutes and occur both duringand outside of occupancy hours where civilian injury is rare and death even rarer [8]. Ex-amples of tragic incidents however prove the consequences to life safety can be massive. InDecember 1958 a fire at Our Lady of the Angels School, Chicago, USA claimed the livesof 92 children and 3 teachers and injured many when the fire, ignited in the stairwell atbasement level, blocked the evacuation route for those on the second floor. Key elementsto the high loss of life were late discovery, warning and alarming to emergency services incombination with the layout of the building lacking a fire door and independent exits [9].In July 2004 a fire at the Saraswathi English Medium School, Kumbakonam, India killed87 children and one adult and injured at least 12 when the roof on third floor caughtfire and collapsed down on the classrooms. Key elements here were the flammable roof
4 Department of Civil Engineering - Technical University of Denmark

1.1 Objectives Introduction
material, a single exit and a single stairwell [10]. In June 2009 a fire at ABC Day Carecenter, Hermosillo, Mexico ultimately killed 47 young children and injured over 40 as thefire started in the neighboring compartment spreading through the roof to the daycare.This was during the "siesta" when most of the children were asleep. Here the key ele-ments of the tragic ending were late recognition, a single narrow exit, high child to adultratio and bad timing [11]. In May 2012 a fire at Gympanzee Nursery and Day Care inthe Villagio Mall, Doha, Qatar took the life of 13 children, 4 staff members and 2 firefighters. In this case the key elements of the outcome were a recent false alarm, malfunc-tioning sprinklers, inconvenient escape routes including a stair collapsing, and confusionregarding floor plans [12]. These are not the only fires in daycares and school with a fataloutcome, but only four tragic examples. Fortunately the fire at Our Lady of the AngelsSchool fire greatly impacted and improved fire codes [13]. A common factor in these fourincidents is that multiple failures lead to the fatal outcome, them being technical, human,procedural or organizational or a combination of these. As tempting as it is to claimthat the mentioned incidents could never happen today or could only happen in distantor undeveloped countries, the risk must be taken seriously because failures can happenanytime and anywhere.
An overview of available literature on fire safety focusing on children is provided in thenext chapter, where the most relevant literature is briefly discussed.
1.1 Objectives
The aim of the project is to bring the attention of the fire safety community and au-thorities to the topic emergency evacuation of children and to increase knowledge on thesubject. The project is expected to provide new data on children’s evacuation parameterswhich can influence future guidelines and designs. Hopefully it will lead to expansion ofcurrent models, praxis and regulations to comprehend children.
This project comprises evacuation experiments in daycares for children 0-6 years old andelementary schools for children aged 6-15 years where full scale evacuations are filmedallowing detailed data analysis and extraction.
1.2 Structure of the report
This thesis consists of two parts. Part I is a synopsis where the subject is introducedand the background and previous findings on the matter mentioned. The methodology ofthe project as well as the results are discussed comprehensively, ending with a conclusionchapter including a section on future work. Part II includes three scientific journal papersand one peer-reviewed paper published in conference proceedings which this thesis isbased on. Other papers presented at conferences are listed in the List of Papers butnot included. The four appended papers are throughout the thesis referred to as PaperI-Paper IV.
Department of Civil Engineering - Technical University of Denmark 5

Introduction 1.2 Structure of the report
6 Department of Civil Engineering - Technical University of Denmark

C h a p t e r 2
Literature background
Predicting people’s actions and evacuation patterns has an increased importance sinceperformance based fire codes have been implemented in Denmark and around the worldin recent years. Today’s models, regulations and manuals rely on numerous studies, re-ports and experience [14–16]. There is literature available on numerous building typessuch as highrise buildings [17–19] assembly buildings [20], apartment buildings [21, 22]and public buildings [23]. Furthermore publications are available on specific topics suchas effective width [24], panic [25, 26] and computer models [27, 28]. Much of the researchmentioned is only valid for able bodied adults, however some population groups that areconsidered vulnerable have also been specifically addressed, such as the elderly and peoplewith disabilities [29–34]. Children are also considered a vulnerable population group andare over represented in fire death statistics in many countries [35].
The human factor in fire safety is still weakly considered in nowadays fire regulations,praxis and models, while there are extensive regulations concerning the technical side ofthe fire safety, such as installations and structural parts of the building. The importanceof including the human factor is however being realized and an example of that is theongoing research and discussions concerning elevator use for evacuation, where the mainconcern is not the technical challenges of making elevators safe to use in fire, but howto get people to use them in an emergency after decades of convincing people not to doso [36–40].
2.1 Overview - focus on children
Tables 2.1 and 2.2 list many of the publications available on the fire safety of children.The literature is sorted by publishing year and it spans from the year 1975 to 2012.Publications published before this project came to life are included in table 2.1 whilepublications published in the years 2009-2012 are listed in table 2.2.
7

Literature background 2.1 Overview - focus on children
Table 2.1: Brief overview of available literature on fire safety of children prior to 2009
Year Title of paper/report Author(s) Country Age Method Key words1975 A fire signal system for deaf
school children [41]Kravontka, S.J. USA - study visual evacuation
signal, guide lines1985 A study of fire safety and evac-
uation planning for pre-schooland day care centers [42]
Murozaki, Y. &Ohnishi, K.
Japan 0-5 fire drills,question-naires
training, flow, travelspeed, design
1986 Evacuating schools on fire [43] Van Bogaert, A.F. Belgium - study evacuation episodes,design,specialschools
1986 Fire safety research and mea-sures in schools in Belgium [44]
Van Bogaert, A.F. Belgium - study, ma-terial test-ing
national norm, pre-vention, restriction,protection, disabledpupils
1994 Investigation of a behaviouralresponse model for fire emer-gency situations in secondaryschools [45]
Horasan, M. &Bruck D.
Australia 12-20 questionnaire behavioural responsemodeling, fire safetytraining
1999 Non-awakening in children inresponse to a smoke detectoralarm [46]
Bruck, D. Australia 6-17 experiments,interviews
sleep, youth, smokedetector
2001 The development of an educa-tion program effective in reduc-ing fire deaths of preschool chil-dren [47]
Gamache, S. &Porth, D.
USA 3-5 pre andpost fieldtest evalu-ation
preschool program,fire safety education,fire statistics
2003 Comparison of an evacuationexercise in a primary school tosimulation results [48]
Klüpfel, H. et al Germany 6-10 fire drill,simula-tions
drill vs simulation,repeated drill
2003 Balancing safety and security inthe school environment [13]
Szachnowicz USA - study fire challenges, bal-ancing ingress andegress
2004 A study on school children’sattitude towards firesafety andevacuation behaviour in Braziland the comparison with datafrom Japanese children [49]
Ono, R. & Tatebe,K.
Brazil &Japan
11-14 comparingsurvey
fire safety awareness,fire safety education,cultural aspects
2006 Towards the design and oper-ation of fire safe school facili-ties [50]
Hassanain, M.A. SaudiArabia
- study fire risk assessment,fire hazards, design
It can be seen that the number of papers on children has increased a lot in recent years.In fact 12 out of the 23 publications listed have been published since this project cameabout in 2009, five of them originating from it.
It is also interesting to see that the publications span a wide range geographically andculturally, originating from ten different countries.
The range of the content of the papers listed in table 2.1 and 2.2 is also wide and eventhough not all of the papers are directly relevant to this study the purpose of includingthem is to show publications where children were in focus.
In addition to the papers mentioned here, where children or facilities for children arethe main subject, there also exist publications where children are mentioned or resultson children are included even though children are not the main topic. Those data andfindings are equally important and contribute to the knowledge we have on children.
8 Department of Civil Engineering - Technical University of Denmark

2.1 Overview - focus on children Literature background
Table 2.2: Brief overview of available literature on fire safety of children 2009-2012
Year Title of paper/report Author(s) Country Age Method Key words2009 A study on evacuation of school
buildings for elementary educa-tion [51]
Ono, R. &Valentin, M.V.
Brazil 11-14 simulations alternative designs,fire exits, regulationrequirements, multistory schools
2009 Pre-School and school childrenbuilding evacuation [52]
KholshevnikovV.V. et al
Russia 3-17 fire drills,question-naire
pre-evacuation, stafftraining, travelspeed, stairs, design
2010 Evacuation dynamics of chil-dren - walking speeds, flowthrough doors in daycare cen-ters [53]
Larusdottir, A.R.& Dederichs, A.S.
Denmark 0-6 fire drills travel speed, flow,age dependance, spi-ral stairs
2010 The evacuate training problemsof earthquake in China [54]
Lu, C. China 3-18 study, firedrills
escape rules, speedvs. age, stairs
2011 A step towards including chil-dren’s evacuation parametersand behavior in fire safe build-ing design [55]
Larusdottir, A.R.& Dederichs, A.S.
Denmark 0-6 fire drills pre-evacuation time,flow model, travelspeed, behavior, as-sistance
2011 Empirical data analysis andmodeling of the evacuation ofchildren from three multi-storeyday-care centres [56]
Campanella, M.C.et al
Denmark 0-6 fire drills,simula-tions
drill vs simula-tion, evacuationprocedure
2012 Evacuation of children - move-ment on stairs and on horizon-tal plane [57]
Larusdottir, A.R.& Dederichs, A.S.
Denmark 0-6 fire drills travel speed, flow, ef-fective width, age,spiral stairs
2012 Study of Children Evacuationfrom Pre-school education insti-tutions [58]
KholshevnikovV.V. et al
Russia 0-7 study, firedrills
pre-evacuation,travel speed, stairs,density
2012 Behavioural aspects of move-ment down stairs during ele-mentary school fire drills [59]
Larusdottir, A.R.& Dederichs, A.S.
Denmark 6-15 fire drills travel speed, stairs,behaviour
2012 Children evacuation: empiricaldata and egress modeling [60]
Capote, J.A. et al Spain 3-16 fire drills,simula-tions
egress time, flow,travel speed, stairs,drill vs simulation
2012 Walking speed data of fire drillsat an elementary school [61]
Ono, R. et al Brazil 6-14 fire drills egress time, travelspeed, stairs, con-trolling factors
2012 Children behaviour duringevacuation process in schoolbuildings [62]
Capote, J.A. et al Spain 3-16 fire drills,simula-tions
pre-evacuation time,flow, travel speed,stairs, drill vs simu-lation
An example of that is a study on evacuation from apartment buildings where familieswith children were among participants. This resulted in some specific results on travelspeeds for children, even though the sample size was small [22,63]. Another example of astudy where children were included, is a study focusing on people with disabilities, wheredisabled children were a subgroup [31].
Department of Civil Engineering - Technical University of Denmark 9
Literature background 2.1 Overview - focus on children
2.1.1 Travel parameters - daycares and schools
The 1985 paper from Japan by Murozaki and Ohnishi [42] was the only paper availablewhich was directly related to evacuation of young children when the first evacuation ex-periments in Danish daycare centers were conducted in 2009. It was inspiring for theproject and it being almost 25 years old at the time and from Japan made it even moreinteresting to collect new data from Denmark.
The same year as the first experiments of the current research were conducted in 2009,a paper was presented at the 4th International Symposium on Human Behaviour in Fireon the topic evacuation of pre-schools in Russia, by Kholshevnikov et al. [52]. Althoughvery relevant and with many common factors of the present research, it provided limiteddata on travel parameters. An extended version of the paper was however published ina journal in 2012 [58]. It included large amounts of data on pre-school evacuations andchildren’s travel parameters, including results on pre-evacuation time, flow through doorsand travel speed which are amongst the focus points of the present research. However,much of the data is gathered through everyday use of the building and experimental setup.
The reason for also investigating school evacuations was to attempt to extend the datacollection to comprehend a continuous age range of children 0-15 years. On the 5th In-ternational Symposium on Human Behaviour in Fire 2012 there was a session dedicatedto school evacuations. In fact there were three papers presented, including one from thecurrent research, introducing somewhat similar results, all from different countries andteams of researchers. All studies included data on travel speed down stairs for elemen-tary school children. The study from Spain by Cuesta et al. [60] also included computersimulations and an investigation of whether the youngest children placed one or two feetper step. The study conducted in Brazil by Ono et al. [61] included discussions on howthe travel speed of a group was influenced by the child walking in front, referred to as theleader, and how the children that lagged behind sprinted to catch up.
At last a report from the NFPA, is very relevant to this research [64] (not listed intable 2.2 because it is not published yet). The main topic is children’s self-preservationand it is based on questionnaires, where professionals working at daycare centers andexperts in children’s development participated. Questions concerning child to adult ratioand self-preservation, when children can be expected to walk unsupported on a horizontalsurface and in stairs as well as when children can be expected to follow simple instructionsare particularly relevant.
Results from the mentioned studies will be referred to and displayed where relevant forcomparison.
Judging from recently published and presented papers, there are ongoing studies in sev-eral countries. Hopefully the literature on children will be further enriched in the near
10 Department of Civil Engineering - Technical University of Denmark

2.1 Overview - focus on children Literature background
future.
2.1.2 Fire safety education for children
There exist fire safety educational programs for children in several countries, startingalready at the pre-school age 3-5 years. When designing such programs the age of the au-dience plays a leading role, since learning skills develop throughout the childhood. Whiletesting these programs is important to measure their understanding and effectiveness, it isboth difficult and time consuming when looking at programs for pre-school children. Thisis due to the fact that children at that age need to be interviewed to measure their in-dividual knowledge and that finding a measurable variable of the effect is complicated [65].
However one of the listed papers in table 2.1 concerns the fire safety program "Learnnot to burn" where children’s fire safety knowledge is measured before and after complet-ing the program and related to statistics on fires and fire deaths. The program shouldreduce the risk of fire and burn, teach the children how to react to fire and to escapesafely in case of fire. The program showed a considerable knowledge increase on the top-ics taught and a reduction in child-set fires [47].
In Iceland there is a program running for 5 year old children, the oldest children indaycare. It has some of the same elements as the program described above, it howeveralso focuses on fire safety in the daycare. The children are taught how to do monthlyinspections of certain fire safety matters which they take turns on doing along with theirteachers. This way they are involved in embracing safety and are made aware of theprocedures. How the children and staff are kept involved, active and interested has someof the elements introduced in [66], where it is described how people should be helped ontheir own terms. This is done by including the resident population of the building andusing their strength and knowledge to embrace safety.
The Icelandic fire safety educational program has not been scientifically tested yet, how-ever there are indications of the program showing improvement in fire safety knowledgeand one reported incident of where a child reacted according to the education in a realfire. A summary of the program can be seen in Appendix A.
Department of Civil Engineering - Technical University of Denmark 11

Literature background 2.1 Overview - focus on children
12 Department of Civil Engineering - Technical University of Denmark

C h a p t e r 3
Method
As described in the Introduction the main objective of the project has been to collectdata on the evacuation of children and to disseminate the results to the fire safety com-munity. In the long run the work should contribute to improved fire safety for childrenand awareness of the similarities and differences between children’s and adults’ evacuation.
The choice was made to perform fire drills in buildings which naturally occupy groups ofchildren. Other possibilities were considered less feasible. Doing experiments at a fixedlocation or in a lab would require access to such facilities and using questionnaires orinterviewing fire survivors was considered less appropriate for children and more difficultto get access to and recruit potential subjects. The fire drills were full scale and semiunannounced. Semi unannounced in this context means that most of the children (ortheir parents) knew which week there would be a fire drill, the teachers knew the dayand the leader/headmaster knew the day and the time. Although it would be optimalto have the drills totally unannounced for the most natural response and behavior it wasnot possible to due the filming.
The findings of the experiments are considered representative for the type of buildingsinvolved. Furthermore it should be possible to generalize some of the results to children inother type of buildings. The main limitations of using a natural environment concernednot having control over the physical dimensions of the evacuation routes, the precise sizeand composition of the populations and camera locations were somewhat restricted. How-ever the recruiting was easier since individual recruiting was not needed and the socialbonds between participants were natural.
The method used throughout the project will be described in the following subsections.Beginning with some background information before mentioning the ethical considera-tions. Then introducing the experiments conducted including the equipment and setup.At last the method used to analyze the data is covered as well as the statistical analysis.
13

Method 3.1 Background information
3.1 Background information
Danish daycare centers accept children from the age of 6 months. From that age and untilthe children turn 3 years their institution is called "vuggestue" in Danish which could betranslated to nursery. This age interval is referred to as the younger children or children0-2 years in papers on the research (Paper I, Paper II and Paper IV). From the age of 3and until the children start school their institution is called "børnehave" in Danish whichcould be translated to kindergarten. This age interval is referred to as the older childrenor children 3-6 years in the same publications. Daycare centers can either include bothage groups or be specified for one or the other.
Most children in Denmark start school in the year they turn 6 years old (some startone year later) which is why the youngest class in the schools, class 0, is defined as 6 yearold children This gives a small overlap between the oldest children in daycare and theyoungest children in school, since school has a common start in the autumn and is notdependant on each child’s birthday. Elementary school has classes 0-9, defined as beingfor children and youth aged 6-15 years as referred to in Paper III.
When comparing Danish requirements to fire safety measures in schools and daycarecenters for children, the fundamental difference lies in the employment category. Schoolsand other educational buildings are defined as being category two and/or three dependingon the number of people. The assumption is that people are awake and able to evacuateby themselves but might not know the building’s emergency exits. Daycare centers areon the other hand defined as being in employment category six, which is a wide categoryof every building with people not being able to bring themselves to safety for one reasonor another. Other examples of buildings in this category are prisons, homes for the el-derly, homes for disabled people and hospitals. Requirements regarding fire safety varydepending on the employment category.
At last it should be mentioned that an update to the Danish building regulations in2004, required automatic fire alarms (with at least staff notification) for employment cat-egory six [1]. This however did not apply for buildings, including daycare centers, builtbefore then which is the reason why not all participating daycare centers had a fire alarm.
Annual fire safety inspections should be performed in both schools and daycare centers,however facilities with less than 50 occupants are excluded.
3.2 Ethics
The experiments involved in this project are classified as observational studies by theDanish Council of Ethics, because the participants are not exposed to any extreme orunusual circumstances (such as hinders, smoke etc.). This meant that permission fromthe Danish Council of Ethics was not needed. Furthermore no sensitive information was
14 Department of Civil Engineering - Technical University of Denmark

3.3 Experiments Method
gathered about the participants (such as on health, religion etc.), thus the project did notneed permission from the Danish Data Protection Agency.
Some thought was given to ethics, even though the project did not need formal ethicalapproval. The Swedish application form for ethical approval was inspiring with respect tobenefits of the research. In that context it can be said about the experiments performedthat the participants (children and staff/teachers in the institutions involved) benefitteddirectly from participating since they got training in evacuation and increased awarenessand knowledge on fire safety and evacuation. The participating population in general(children and staff/teachers at each time) also benefits from the experiments since theresults should increase scientific knowledge on the subject and thereby increase the levelof safety in these types of buildings in the future.
Due to policies on photographing and filming in many of the daycare centers involvedall parents were informed about the fire drill and filming in the daycare centers before-hand. Only a few expressed their concern, it was however rarely about the filming itselfbut more about the fire drill. The leaders answered their questions and reassured theparents that their children’s welfare was of highest priority. Apart from the hesitation atthe beginning, the project was in whole generally met with a positive attitude and waswelcomed both by staff and parents.
3.3 Experiments
Table 3.1 shows an overview of the experiments stating the type of institute (daycare orschool), age interval, location, year of experiments, number of experiments, number ofavailable cameras and at last the main focus of the research. All experimental periodsprovided results on more subjects than the one main focus mentioned in table 3.1.
Table 3.1: Overview of experimental periods
type age municipally year # exp # cam main focusdaycare 0-6 years Lyngby Taarbæk 2009 16 10 flow through doors 1
schools 6-15 years Lyngby Taarbæk 2010 7 59 travel speed down stairs2
daycare 0-6 years Copenhagen 2011 9 59 travel speed down stairs1Results in [67] are based on part of the data2Results in [68] are based on the data
The goal of the first experimental period was to get an overview of evacuations in daycarecenters and to gather data on flow through doors, also at high person densities.
Department of Civil Engineering - Technical University of Denmark 15
Method 3.3 Experiments
The second experimental period where elementary schools were evacuated, the goal wasto identify at what age children can be described by evacuation theory which is based onadults, focusing on movement on stairs.
The goal of the third and last experimental period was to continue to investigate youngchildren’s evacuation focusing on movement on stairs.
3.3.1 Equipment and setup
Since the experiments were run over two years covering three experimental periods, themethod developed with time as increased equipment and resources became available aswell as gained experience and knowledge in the field. All changes were however consid-ered carefully to ensure comparability between the results. The goal of all changes wasto minimize errors and to make the analysis more consistent.
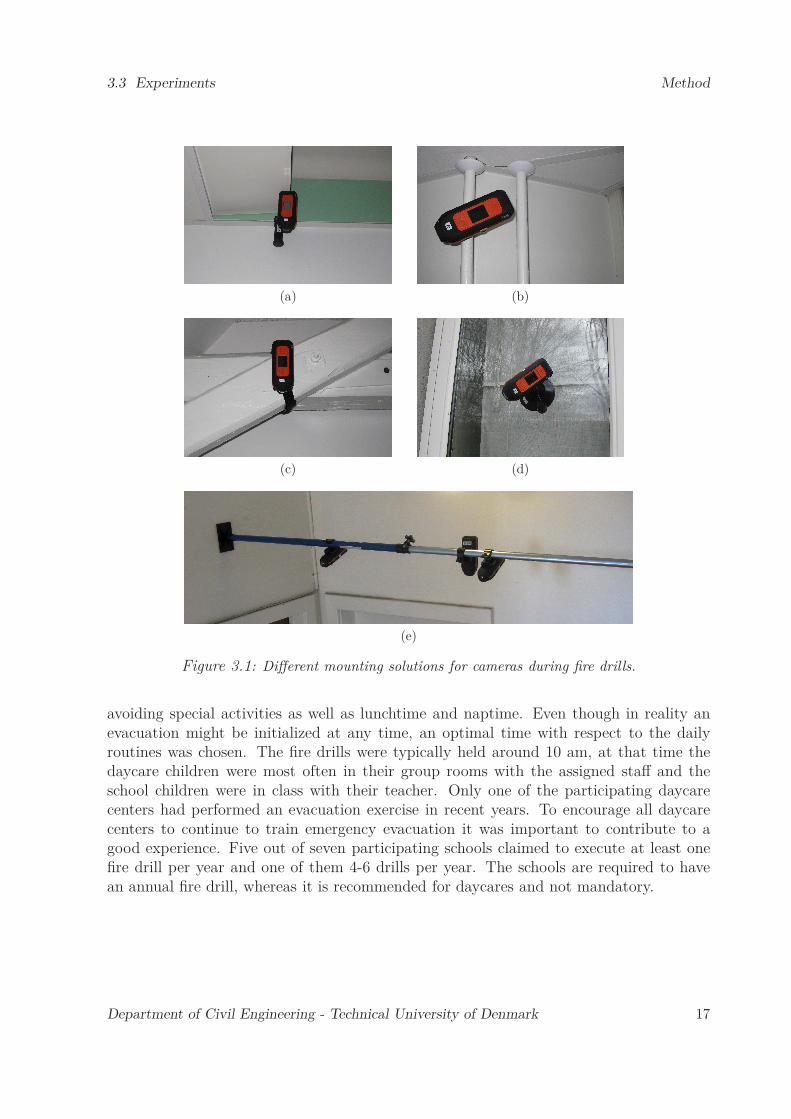
The filming equipment available at the beginning consisted of seven different recordingdevices, ranging from camcorders to a webcam connected to a laptop. Mounting solutionswere limited to furniture where the cameras could stand using duct-tape for support. Atthe end of the project DTU had established a mobile evacuation lab of 59 compact actioncameras as well as different mounting equipment. Figure 3.1 shows examples of cam-eras mounted using different solutions. The mounting equipment included multipurposeclamps (a), pipe fasteners (b), velcro strips (c), vacuum cups for use on glass (d) andvertical pressure bars (e) which were used with the pipe fasteners and were practical forhallways and stairs where there was limited furniture.
The cameras are of the make X170 from Drift Innovations. They have a 170◦ wide anglelens which makes it possible to capture a large area with a single camera. They further-more have a remote control and are very light weight which makes mounting easier withthe help of various mounting equipment. The cameras were synchronized by going by eachcamera with a stop watch running and filming the time. Then it was enough to identifythe start of the drill using one camera and the local time code on the other cameras couldbe calculated. This was most important where there was not an acoustic alarm systemwhere the start of the fire drill could be identified by the sound.
In addition to more and better equipment, human resources became available with thesupport of the European Union, through the KESØ project standing for Kompetencecenter for Evakuering Sikkerhed i Øresundregionen (Competence center on EvacuationSafety in the Oresund region), which is a cooperation project between DTU and LU. Thismeant helpers could be recruited to assist with camera setup at the largest locations.
3.3.2 Fire drills
Common factors for all conducted experiments were that the date and time for the firedrills were chosen in cooperation with the participating institutes, daycares and schools,
16 Department of Civil Engineering - Technical University of Denmark
3.3 Experiments Method
(a) (b)
(c) (d)
(e)
Figure 3.1: Different mounting solutions for cameras during fire drills.
avoiding special activities as well as lunchtime and naptime. Even though in reality anevacuation might be initialized at any time, an optimal time with respect to the dailyroutines was chosen. The fire drills were typically held around 10 am, at that time thedaycare children were most often in their group rooms with the assigned staff and theschool children were in class with their teacher. Only one of the participating daycarecenters had performed an evacuation exercise in recent years. To encourage all daycarecenters to continue to train emergency evacuation it was important to contribute to agood experience. Five out of seven participating schools claimed to execute at least onefire drill per year and one of them 4-6 drills per year. The schools are required to havean annual fire drill, whereas it is recommended for daycares and not mandatory.
Department of Civil Engineering - Technical University of Denmark 17

Method 3.3 Experiments
The course of action for each experiment was approximately as follows:
Prior to the day of the drill
• Met with leader or other person at location where the existing evacuation plan(if avaliable) was discussed as well as the upcoming fire drill. Possible cameralocations were marked in a plan drawing of the buildings as well as the expectednumber and age of the children in each part of the facility.
Day of the drill
• Setup of cameras (at a few locations, this was done the day before).
• In front of doors and on landings on the stairs, mats with a chess pattern wereplaced on the floor and filmed (black and white squares) and were used formeasuring density when analyzing the films.
• Synchronization of cameras.
• Fire drill initiated by activating the fire alarm or alarming a member of staff.
• The evacuation itself (and in the last experimental period also calling the firedepartment).
• Gathering at safe area outside ensuring everyone is out (and in the last experi-mental period also informing fire department of the situation).
• Occupants returned to building and prior activities.
• Taking down the cameras.
• Staff discussed the fire drill with the children.
• Recovering data files from cameras.
In the following days
• Internal evaluation of fire drill amongst staff
18 Department of Civil Engineering - Technical University of Denmark
3.4 Data analyzing Method
3.4 Data analyzing
The films were processed manually by using Adobe Premiere Pro which among otherthings allows for playback frame by frame, having multiple files open at the same timeand having a background layer during playback. Data retrieving, organizing and simplecalculations were made in Microsoft Excel. Figures, except for pictures, are generated inMatlab and RStudio.
When analyzing the films a number of relevant things were noted in a spreadsheet. Eachparticipant got a number, a physical description of the clothing and/or other identify-ing factors, age/age interval and gender. In addition to this the time step when passingrelevant points during the evacuation was noted, as were actions and behavior where rel-evant. The identifying was necessary to be able to track each individual between camerasallowing extensive mapping of the evacuation.For the last batch of experiments made inmultistory daycare centers in Copenhagen notations were also made concerning carrying,other assistance by adults and use of handrail when traveling down stairs. Handoldingbetween students was investigated in the schools.
3.4.1 Flow
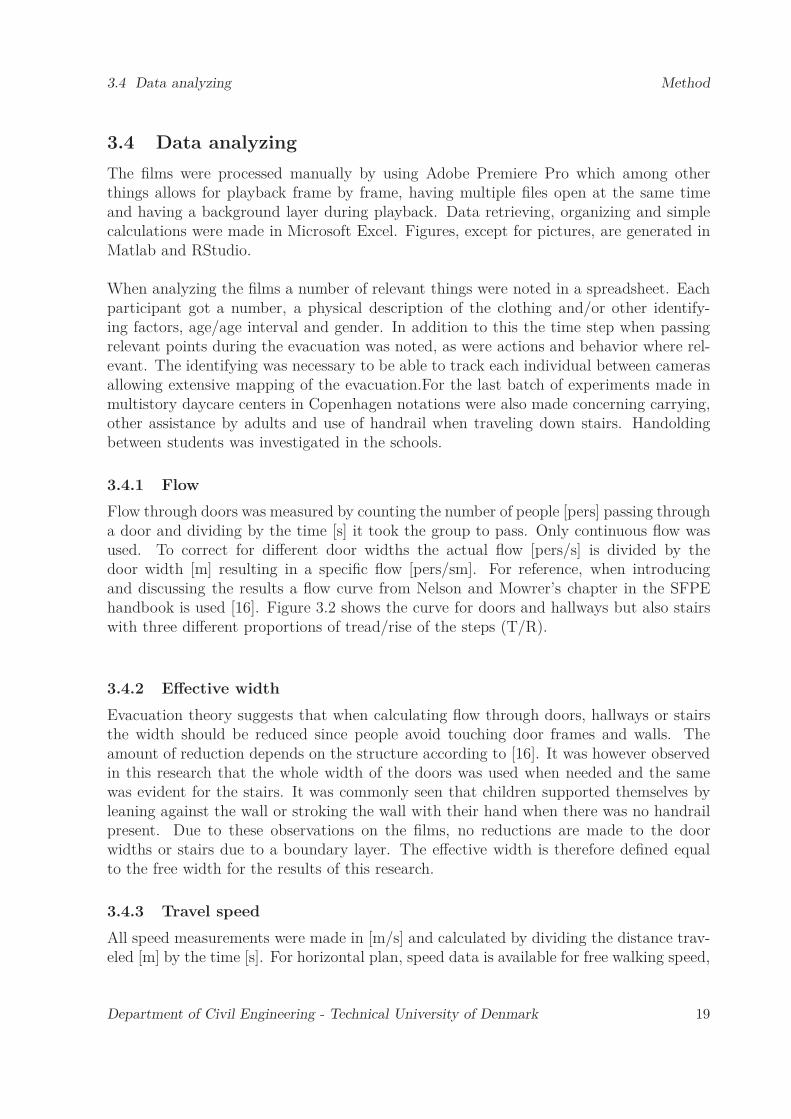
Flow through doors was measured by counting the number of people [pers] passing througha door and dividing by the time [s] it took the group to pass. Only continuous flow wasused. To correct for different door widths the actual flow [pers/s] is divided by thedoor width [m] resulting in a specific flow [pers/sm]. For reference, when introducingand discussing the results a flow curve from Nelson and Mowrer’s chapter in the SFPEhandbook is used [16]. Figure 3.2 shows the curve for doors and hallways but also stairswith three different proportions of tread/rise of the steps (T/R).
3.4.2 Effective width
Evacuation theory suggests that when calculating flow through doors, hallways or stairsthe width should be reduced since people avoid touching door frames and walls. Theamount of reduction depends on the structure according to [16]. It was however observedin this research that the whole width of the doors was used when needed and the samewas evident for the stairs. It was commonly seen that children supported themselves byleaning against the wall or stroking the wall with their hand when there was no handrailpresent. Due to these observations on the films, no reductions are made to the doorwidths or stairs due to a boundary layer. The effective width is therefore defined equalto the free width for the results of this research.
3.4.3 Travel speed
All speed measurements were made in [m/s] and calculated by dividing the distance trav-eled [m] by the time [s]. For horizontal plan, speed data is available for free walking speed,
Department of Civil Engineering - Technical University of Denmark 19
Method 3.4 Data analyzing
0 0.5 1 1.5 2 2.5 3 3.5 40
0.5
1
1.5
flow
[per
s/s
m]
person density [pers/m2]
Corridor, door, rampStairs, T/R=2Stairs, T/R=1.56Stairs, T/R=1.26
Figure 3.2: A frequently used flow curve fitted for different use [16].
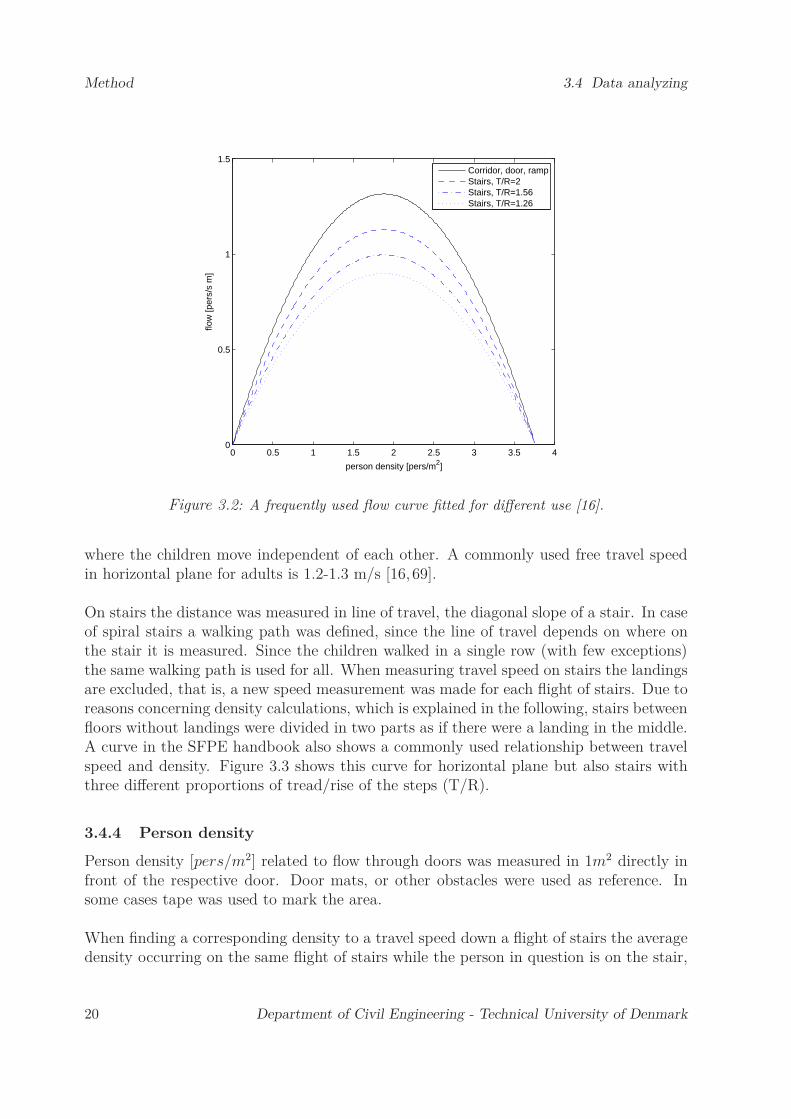
where the children move independent of each other. A commonly used free travel speedin horizontal plane for adults is 1.2-1.3 m/s [16, 69].
On stairs the distance was measured in line of travel, the diagonal slope of a stair. In caseof spiral stairs a walking path was defined, since the line of travel depends on where onthe stair it is measured. Since the children walked in a single row (with few exceptions)the same walking path is used for all. When measuring travel speed on stairs the landingsare excluded, that is, a new speed measurement was made for each flight of stairs. Due toreasons concerning density calculations, which is explained in the following, stairs betweenfloors without landings were divided in two parts as if there were a landing in the middle.A curve in the SFPE handbook also shows a commonly used relationship between travelspeed and density. Figure 3.3 shows this curve for horizontal plane but also stairs withthree different proportions of tread/rise of the steps (T/R).
3.4.4 Person density
Person density [pers/m2] related to flow through doors was measured in 1m2 directly infront of the respective door. Door mats, or other obstacles were used as reference. Insome cases tape was used to mark the area.
When finding a corresponding density to a travel speed down a flight of stairs the averagedensity occurring on the same flight of stairs while the person in question is on the stair,
20 Department of Civil Engineering - Technical University of Denmark

3.4 Data analyzing Method
0 0.5 1 1.5 2 2.5 3 3.5 40
0.2
0.4
0.6
0.8
1
1.2
spee
d [m
/s]
person density [pers/m2]
Corridor, door, rampStairs, T/R=2Stairs, T/R=1.56Stairs, T/R=1.26
Figure 3.3: A frequently used travel speed curve fitted for different use [16].
was used. For the second experimental period the number of persons on the stair wasmanually counted and noted every second and used for these calculations. For the thirdexperimental period the time stamps were used to calculate it automatically. Furthermoreit was decided to place an artificial landing if there were no landings in between floors, forcalculating both speed and density. The main reason for this is to avoid large differencesin the area used for density calculations. Also to minimize errors when a group of peopleis entering or emptying the stair. If the number of people who just entered a stair togetheris divided by the whole area of the stair, it results in indicating by far a lower persondensity than the people are experiencing.
The described method of how to measure density in stairs was a common decision of thegroup at DTU working with evacuation to ensure compatibility, at least between resultsfrom DTU. Methods regarding density calculations were found to be poorly described inexisting literature, it however suggests that the density is in some cases measured at thelandings or platforms between floors using either the whole landing or a reduced area. Asemphasized in [70, 71] comparisons between studies should be made with caution due todifferences in measuring technique.
Another unit used to measure person density is m2/m2, which indicates the area pro-jected by people out of the available area. A person’s horizontal projection is estimated
Department of Civil Engineering - Technical University of Denmark 21

Method 3.5 Statistics
according to age, clothing and accessories, so a child occupies less space than an adultand an adult in winter clothing with a suitcase even more. This method is introducedand used in Predtchenskii’s and Milinskii’s book [4] and should be useful when dealingwith mixed populations, as it is not necessary to estimate that all people are of equal size.Despite the advantages it is rarely used today, although Paper I includes a discussion ofthis method of measuring density in relation to daycare evacuations.
3.5 Statistics
For statistical calculations the software RStudio was used. For initial graphical inves-tigations to spot differences between groups or factors it was used to make box plots,showing means, upper and lower quartiles, 1.5 IQR (inter quartile range) and outliers.RStudio was then used for analysis of variance if the box plots indicated a difference,using α = 0.05 (95 % confidence level). At last a Tokey test was performed to investigatein more detail if and between what subgroups there was a statistically valid difference,again using α = 0.05.
22 Department of Civil Engineering - Technical University of Denmark
C h a p t e r 4
Results and Discussion
The results of this project will be summarized here. Most of the results are included inPaper I - Paper IV, however some new perspectives will be given here as well as com-parisons and results of statistical tests that have not all been previously displayed anddiscussed.
It is challenging to present the results of a project like this, to leave nothing out butstill have a continuous flow, to display things in the right context and still avoid too muchrepetition. The complexity also lies in the fact that the results are spread but relate toeach other and findings in one area might affect how to view findings in the next. In thefirst section of this chapter the staff involvement throughout the fire drills is discussed.Then sections 4.2-4.9 are arranged in a near chronological time order with respect to afire drill. At last there are sections 4.10-4.14, which refer to findings and results in someof the other sections, but with a different approach and/or context.
4.1 Staff involvement
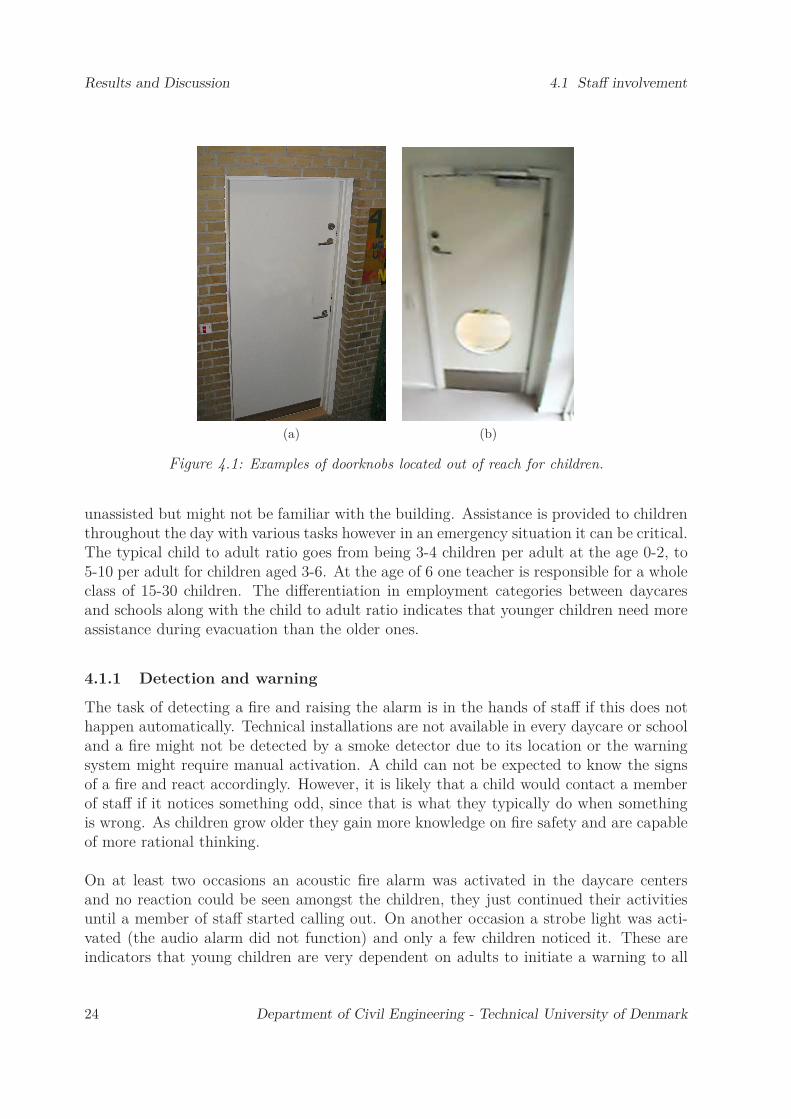
The staff in daycares and schools for children bear great responsibility in case of fire. Asmentioned in Chapter 3 the Danish Building Code [1] defines daycares in employmentcategory 6, where occupants are not expected to be able to evacuate unassisted due toimmobility, cognitive challenges or imprisonment. Other facilities in employment cate-gory 6 are homes for the elderly or disabled, hospitals and detention facilities. Childrenin daycare centers sometimes have all of those vulnerabilities as they have undevelopedmotor skills, limited understanding of the situation and doors are frequently locked orhave doorknobs at high locations. Figure 4.1 shows two examples of doors in daycarecenters with doorknobs out of reach for small children.
Schools however usually fall into both employment categories 2 (normal classrooms) and 3(auditoriums for 50 people or more), where occupants are expected to be able to evacuate
23
Results and Discussion 4.1 Staff involvement
(a) (b)
Figure 4.1: Examples of doorknobs located out of reach for children.
unassisted but might not be familiar with the building. Assistance is provided to childrenthroughout the day with various tasks however in an emergency situation it can be critical.The typical child to adult ratio goes from being 3-4 children per adult at the age 0-2, to5-10 per adult for children aged 3-6. At the age of 6 one teacher is responsible for a wholeclass of 15-30 children. The differentiation in employment categories between daycaresand schools along with the child to adult ratio indicates that younger children need moreassistance during evacuation than the older ones.
4.1.1 Detection and warning
The task of detecting a fire and raising the alarm is in the hands of staff if this does nothappen automatically. Technical installations are not available in every daycare or schooland a fire might not be detected by a smoke detector due to its location or the warningsystem might require manual activation. A child can not be expected to know the signsof a fire and react accordingly. However, it is likely that a child would contact a memberof staff if it notices something odd, since that is what they typically do when somethingis wrong. As children grow older they gain more knowledge on fire safety and are capableof more rational thinking.
On at least two occasions an acoustic fire alarm was activated in the daycare centersand no reaction could be seen amongst the children, they just continued their activitiesuntil a member of staff started calling out. On another occasion a strobe light was acti-vated (the audio alarm did not function) and only a few children noticed it. These areindicators that young children are very dependent on adults to initiate a warning to all
24 Department of Civil Engineering - Technical University of Denmark
4.1 Staff involvement Results and Discussion
occupants.
This research showed that where there were no fire alarms or detectors, the warningprocess delayed the evacuation. It took up to 225 seconds to warn everyone in a two-storydaycare center (where a staff member walked from one room to another delivering themessage). In one case, a staff member forgot to warn the others and just evacuated thechildren in his care, causing a delay of several minutes for the remaining occupants, wherethe warning time reached 322 seconds.
4.1.2 Reaction and decision making
Likewise the task of interpreting the fire cues or warning signals and initiating the evac-uation (as well as fighting a fire if possible) is the staff’s responsibility. A member ofstaff should also phone the fire department. The younger children are likely to need moresupport here than the older ones since some have never heard the alarm before and donot know the meaning of it.
It was observed that the children were easily distracted from the task of gathering orleaving the room. Seeing an exciting toy could trigger a child to go towards the toy in-stead of following instructions. This meant that adults needed to physically guide manyof the children towards the exits by carrying, handholding or other physical touching. Adifference could be seen between the two age groups in the daycare centers regarding this.
Results on the assistance received in this initial phase, when the evacuation is starting, areshown in table 4.1. The table shows a clear difference between the two age groups, thatis the younger children needed more physical assistance while the majority of older chil-dren were capable of evacuating following verbal instructions only (no physical assistance).
In the schools it was observed that children aged 6-8 years waited for their teachersfor instructions while children from the age of 9 could be seen reacting to the fire alarmbefore the teacher. It is however still the teacher’s responsibility to instruct the childrento evacuate and make sure everyone does so.
4.1.3 Travel to safety
Last but not least it is the adults’ task to assist the children throughout the evacuationand gather them at a safe meeting place. A member of staff should also meet with thefire department and inform them of the situation.
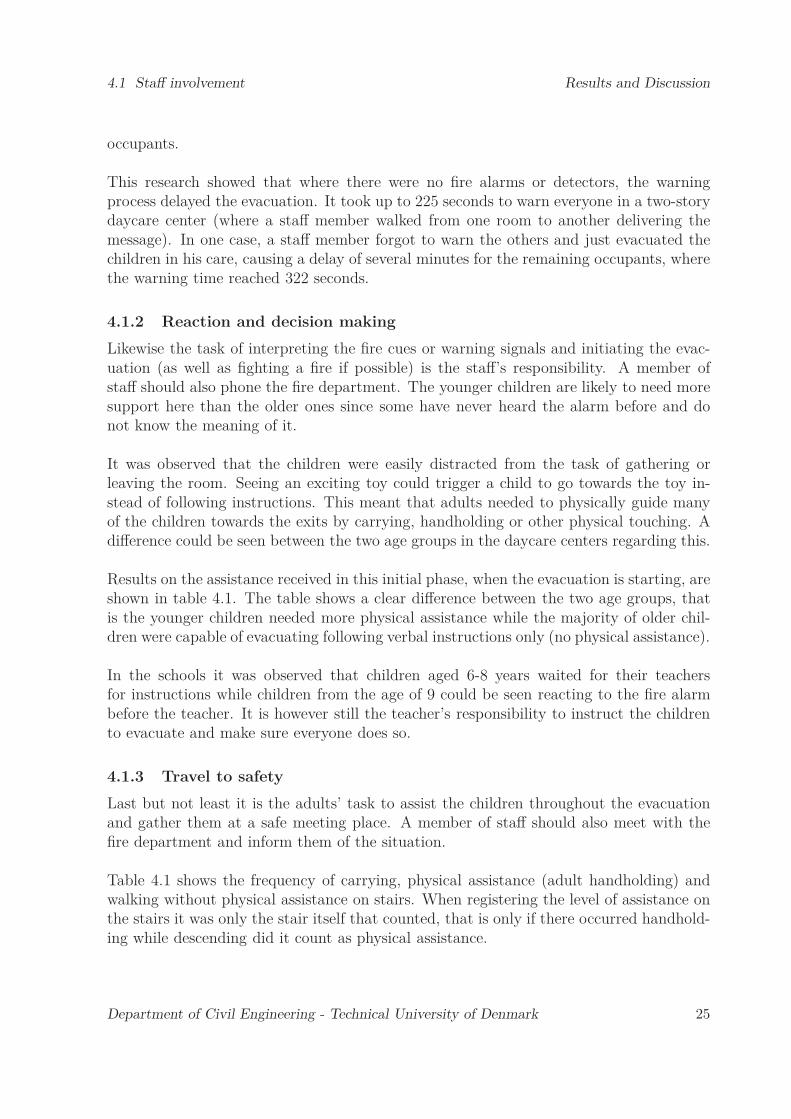
Table 4.1 shows the frequency of carrying, physical assistance (adult handholding) andwalking without physical assistance on stairs. When registering the level of assistance onthe stairs it was only the stair itself that counted, that is only if there occurred handhold-ing while descending did it count as physical assistance.
Department of Civil Engineering - Technical University of Denmark 25
Results and Discussion 4.2 Pre-evacuation activities
Table 4.1: The level of assistance for children in daycare centers in the initial phase of theevacuation and when descending stairs.
initial phase descending stairslevel of assistance 0-2 years 3-6 years 0-2 years 3-6 years
carried 22.2 % 1.8 % 33.3 % 0.9 %some physical assistance 57.6 % 12.3 % 42.3 % 13.9 %no physical assistance 20.2 % 85.9 % 24.3 % 85.2 %
The frequency and level of assistance between the initial phase and when descendingstairs can be compared in table 4.1. There is minimal difference in the age group 3-6years between initial phase and descending stairs. Looking at the age group 0-2 the re-sults are also similar, the most obvious difference is that more children needed carryingwhen traveling on stairs. This corresponds to the results of the NFPA study [64] onself-preservation where it was found that children are older when they can descend stairsunassisted than walking on horizontal plane.
4.2 Pre-evacuation activities
Least is known about the pre-evacuation phase even though it can be the most timeconsuming. It is hard to measure and predict, as it is very dependent on the precise cir-cumstances and human behavior. Increased effort has been put into research on humanbehavior in fire in an attempt to better understand this phase, introducing behavioralmodels which describe common activities prior to evacuating [14].
The most common activities performed by staff inside the group rooms before leavingwith the children for evacuation were taking the name lists, gathering children in a group,explaining the situation to the children, fetching clothes/shoes for children, turning offlights and closing windows. Furthermore some staff members performed personal taskssuch as grabbing own belongings, putting on a coat or finishing coffee. Where a warningsystem was present 44 % went to investigate the situation, confirm the alarm or consultwith peers, after hearing an alarm. Table 4.2 shows an overview of the most common tasksregardless of warning method. The name list should provide information on what chil-dren belong to the group and if they have arrived or left for the day. Gathering childrenwas only registered as a pre-evacuation activity if all the children were gathered beforeallowing any children to leave the room. Explaining the situation was registered if thechildren were told what was going on in more detail than "this is a fire drill" or "everyoneout". In addition to the tasks mentioned, adults instructed and assisted the children withthe evacuation. The children did not perform dedicated pre-evacuation tasks inside thegroup rooms other that playing/running around until an adult instructed them to stopor physically intervened.Table 4.2 does not include the task of putting on clothes, if this was done outside of thegroup room. It was not common practice but was done in a few cases.
26 Department of Civil Engineering - Technical University of Denmark

4.3 Pre-evacuation times Results and Discussion
Table 4.2: Pre evacuation tasks performed.
task performed by adult frequencytake name list 50 %gather children before leaving room 29 %personal tasks 16 %explaining situation to children 13 %closing windows/turning off lights 11 %fetching clothes and dressing children 5 %
The concept of putting outdoor clothes on during an evacuation is questionable. It mightseem harmless during fire drills, however one of the key elements in training, especiallyfor children, is repetition and practice [65]. It is therefore important that the evacuationprocess is similar during drills and in the event of fire. It is not desirable having to argueabout an exception to a rule in a real emergency. In addition, the layout of daycares varieswhere clothes and shoes are not always located in the evacuation path. It can however notbe ignored that weather conditions can be extreme, depending on the season and country.The alternative to give the children blankets instead of dressing them is suggested in [58]and some of the participating daycare centers had blankets ready, accessible from theoutside, to grab if needed.
The drills were performed in autumn in schools and in spring time in daycares. The wintermonths were avoided to minimize problems regarding clothing during the fire drills. Asmentioned a few daycare centers spent time dressing the children before evacuating butthe majority proceeded with evacuation without doing so. At a few places the clothingsituation was solved by having the children wear their shoes inside on the day of the drillor being extra careful with making the children wear their indoor shoes.
In the schools children were in most cases wearing shoes, so that was not an issue.
4.3 Pre-evacuation times
The pre-evacuation time is, in this thesis, defined as the time that passes from when thealarm is raised until leaving the current room. This is easier to measure than the timeuntil a person starts moving towards an exit since a lot of movement occurred insidethe room before actually leaving it. The same method was used by Kholshevnikov etal. [58], that is the moment a child leaves a group cell is used to define when the pre-evacuation activities end. As mentioned in the previous section, this method does notinclude pre-evacuation activities such as dressing that might take place outside the grouproom. Another example of a task that is not included is gathering children a second time,in cases where the children left the room but then start playing or running around again.
The pre-evacuation time in daycares (from the start of the fire drill until the last childhad left out of group room) varied greatly, ranging from 42 seconds to 481 seconds for
Department of Civil Engineering - Technical University of Denmark 27

Results and Discussion 4.3 Pre-evacuation times
children aged 0-2 and from 10 seconds to 545 seconds for children aged 3-6 years.
On at least three occasions, the observed pre-evacuation times were longer due to un-foreseen and/or unusual circumstances. The first occasion occurred when a staff memberfailed to warn others of the situation and evacuated with only the nearby children, re-sulting in a delayed warning and consequent delayed start of the evacuation. The secondoccasion occurred when staff did not react to a strobe light with no simultaneous audiowarning (due to a malfunction) resulting from late recognition and uncertainty that it wasa fire warning signal. The third occasion occurred when difficulties reading and interpret-ing the message on the fire alarm control panel (in order to choose the safest evacuationroute given the fire location) delayed the evacuation by about five minutes. These threeexamples illustrate the variety of scenarios that an evacuation design must cover, even ifthey are rare.
The average verbal warning time was 102 seconds for groups where there was not a firealarm system. The rooms near the "fire origin" have a warning time of only few seconds,while remote rooms have a longer warning time. If the results where a staff member forgotto warn and returned later to do so are excluded, then the average verbal warning timeis 79 seconds.
The average time for gathering the children by the door or in a circle before evacuat-ing was 71 seconds with a standard deviation of 34 seconds. It was noted that, comparedto older children, the younger children moved more slowly but received more assistanceand were usually in smaller groups, which resulted in no material difference between thetwo age groups. Furthermore, the average time between the first and last child leavinga particular room of origin was 20 seconds, with no difference between age groups, mostlikely due to the reasons already mentioned.
The average pre-evacuation time, including warning time and results from daycares withdelays described above, is 222 seconds for the younger age group and 114 seconds for theolder age group. The average time from warning until having lest the room is 168 secondsfor the younger age group and 54 seconds for the older age group. If the time from verbalconfirmation is used in the cases with the alarm where they waited for instruction andwhere the flashing light was ignored/not seen, then the averages are 56 seconds and 36seconds for the younger and older children respectively. Since no difference was foundbetween the age groups in gathering time (where that was done) or time it took to emptythe rooms, the difference between the age groups in the time from warning/warning con-firmation until having left the room, must be due to the other pre-evacuation activitiesincluding decision making. Note that, at some locations where there was a delayed evac-uation due to need of further warning, the staff had already gathered the children andwaited with them ready to evacuate; Time used for gathering the children being excludedfrom the averages for pre-evacuation activities if the task was performed before receivingthe second warning.
28 Department of Civil Engineering - Technical University of Denmark

4.4 Flow through doors Results and Discussion
0 2 4 6 8 10 12
01
23
4
0-2 years3-6 years6-8 years9-11 years12-15 yearsLiterature (adults)
Person density [pers/m2]
Flo
wth
rough
doors
[per
s/s
m]
Figure 4.2: Data points showing flow through doors in daycares and schools with respect todensity. Reference curve on adult’s flow from Nelson and Mowrer [16]
4.4 Flow through doors
Doors and stairs are typical congestion points during evacuations. According to hand-books [16] the theoretical flow curve (flow with respect to density) is a second degreepolynomial with intersection at 0.0, a maximum flow at a density just below 2 pers/m2
and the flow becoming zero before the density reaches 4 pers/m2 due to congestion.
Data on flow through doors was collected from both daycare centers and schools, in-cluding 1840 counts through doors in schools and 1000 counts through doors in daycares.The majority were children, although up to one in every four were adults amongst theyoungest age group. The combined results can be seen in figure 4.2 where the results arecategorized into the following age groups: 0-2 years, 3-6 years, 6-8 years, 9-11 years and12-15 years. Results on flow for children in daycare aged 0-6 years have been publishedin Paper I and Paper II.
It can be seen that in the schools the highest measured person densities were around4 pers/m2 whereas in the daycare centers it reached 10 pers/m2.
Department of Civil Engineering - Technical University of Denmark 29

Results and Discussion 4.4 Flow through doors
Paper II displayed the function for flow through doors with constants appropriate forchildren of 0-2 and 3-6 years. Equation 4.1 for specific flow, Fs, is here displayed withconstants for the five age groups identified in figure 4.2.
Fs = (1 − aD) kD (4.1)
where:D = density in pers/m2
a0−2 = 0.079
k0−2 = 0.399
a3−6 = 0.062
k3−6 = 0.622
a6−8 = 0.191
k6−8 = 1.645
a9−11 = 0.203
k9−11 = 2.153
a12−15 = 0.225
k12−15 = 1.887
The trend is that the flow increases with age but begins to decrease and tends towardsthe adults’ flow curve from literature at the age of 12-15 years. Figure 4.2 also showsthat, for the age group 12-15 years, there are no data points below the curve, while, forthe other age groups, up to 20 % of the measurements landed below. It can therefore beconcluded that, from the age of 12 years, adult values can be used.
Figure 4.3 shows a box plot for all 12 age categories. The mean values for flow throughdoors are shown with a thick line, the upper and lower lines of the box present the 25th and75th percentile, the end of the lines present 1.5IQR (inter quartile range) and the pointsare outliers. These results do not take the density into account. The flow rate can be seenincreasing with age and reaching a maximum at the age of 9 years and then decreasingagain. It can also be seen that a certain stability is reached at the age of 12 years. It isfurthermore noticeable that the flow rates for 6 year old children were lower than for the7 and 8 year old children, although 6-8 year old children are presented in figure 4.2 as oneage group. This difference can partly be explained by those students being new to thebuildings and the situation compared to the older students, having attended the schoolfor less than 2 months. Figure 4.3 also gives an idea of the spread of the flow rates withineach age category, although the large spread for the age group 3-6 years can be explainedby the large density range.
30 Department of Civil Engineering - Technical University of Denmark
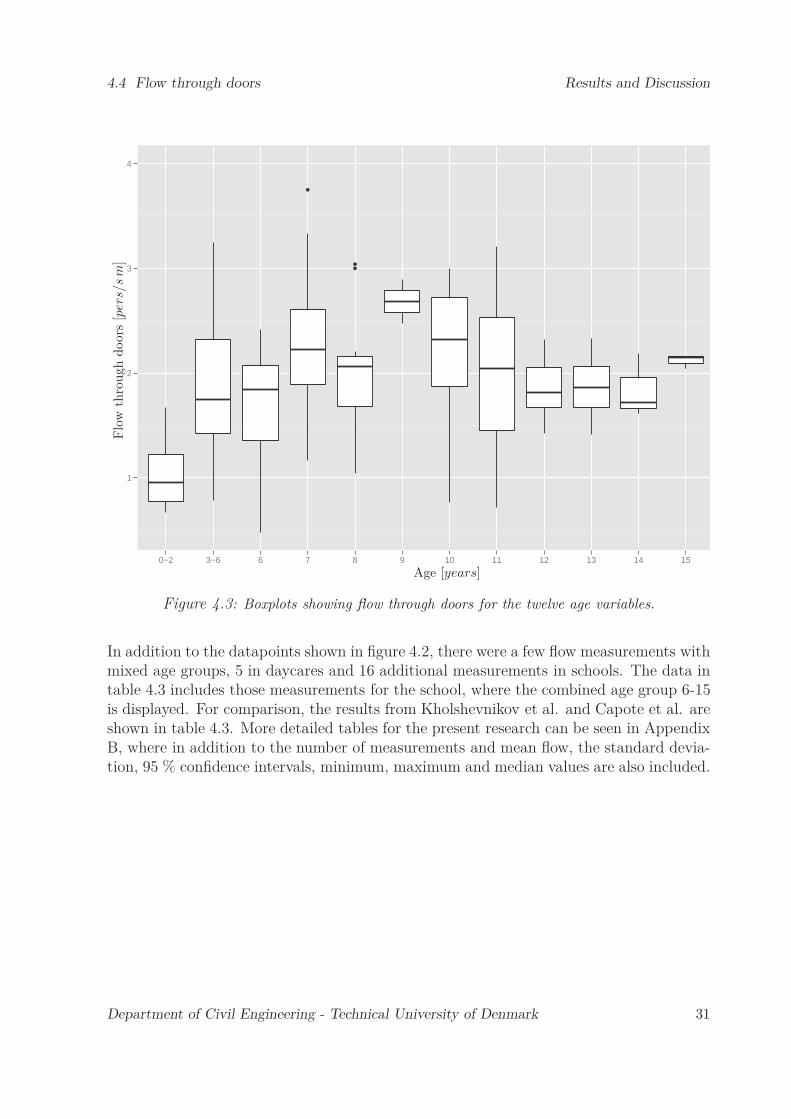
4.4 Flow through doors Results and Discussion
1
2
3
4
0−2 3−6 6 7 8 9 10 11 12 13 14 15
Age [years]
Flo
wth
rough
doors
[per
s/s
m]
Figure 4.3: Boxplots showing flow through doors for the twelve age variables.
In addition to the datapoints shown in figure 4.2, there were a few flow measurements withmixed age groups, 5 in daycares and 16 additional measurements in schools. The data intable 4.3 includes those measurements for the school, where the combined age group 6-15is displayed. For comparison, the results from Kholshevnikov et al. and Capote et al. areshown in table 4.3. More detailed tables for the present research can be seen in AppendixB, where in addition to the number of measurements and mean flow, the standard devia-tion, 95 % confidence intervals, minimum, maximum and median values are also included.
Department of Civil Engineering - Technical University of Denmark 31

Results and Discussion 4.4 Flow through doors
Table 4.3: Mean flow rate values through doors represented for different density intervals, fordaycares and schools. Results from Kholschevnikov et al. [58] and Capote et al. [60] are includedfor comparison
Current study Kholshchevnikov Capotedensity 0-2 years 3-6 years 6-15 years 4-7 years 3-16 yearsinterval n flow n flow n flow n flow n flow
[pers/m2][#]
[pers/sm][#]
[pers/sm][#]
[pers/sm][#]
[pers/sm][#]
[pers/sm][0, 1) - - - - 5 1.27 - -
-
0.6
7-
2.5
9
[1, 2) 1 0.67 4 1.10 42 1.99 32 1.98[2, 3) 2 0.84 3 1.39 27 2.23 42 2.50[3, 4) 7 0.95 9 1.42 21 2.13 11 2.71[4, 5) 5 1.08 11 1.89 1 1.61 51 3.03[5, 10) 5 1.23 16 2.31 - - 289 3.39[10, 15) - - 1 2.87 - - 183 3.36[15, 20) - - - - - - 6 1.65
Firstly a trend difference can be seen between the measurements in the daycare centersand schools. The person density only reaches 4 pers/m2 on one occasion in the schools,while in the daycare centers at least half of the measurements are made at person density4 or higher with the highest measured density of 10 pers/m2. It can be seen that the flowrate increases with increased density and a decline cannot be seen in this table for thedaycare centers. However, for the school children, a maximum flow rate is reached at thedensity interval [2,3) pers/m2 and the flow rate decreases at higher densities.
A part of the difference in flow rates between children and adults can be explained by thefact that children are physically smaller and that they need a less private atmosphere andexperience crowd movement on regular basis.
Looking at the numbers from Kholshevnikov’s study, the flow rate increases up to thedensity of 10 pers/m2. The numbers for density intervals [5,10) and [10,15) representweighted averages, as the study had smaller density intervals. Furthermore, it can beseen that a large amount of measurements are made at densities 10 pers/m2 and above,opposed to the measurements of the current research, where the highest density measuredwas at 10 pers/m2.
Capote did not specify the number of measurements or at what densities. The num-bers displayed in table 4.3 are the lowest and highest average flow rates of six occasions,measured at three different exits during two fire drills.
Effective width, where a door width is reduced due to a boundary layer on the sides,was here considered equal to the free width of the door, meaning that there was nounused boundary layer on the sides. Capote reduces every door by 0.3 m (2x 0.15 m)according to theory on effective width [16]. This results in higher flow compared to if this
32 Department of Civil Engineering - Technical University of Denmark

4.5 Travel speed in horizontal plane Results and Discussion
was not done. Kholshevnikov does not mention if the effective width is a reduction of thefree width of a door.
4.5 Travel speed in horizontal plane
Results for travel speed in horizontal plane for children 0-6 years have been published inPaper I and II and are briefly described here. Travel speed was measured in daycares onhorizontal plane, where the children moved freely (low person densities, < 0.5 pers/m2).A distinction was between walking and running, results can be seen in table 4.4.
Table 4.4 shows that the younger children walked and ran slower than the older ones.These results are based on a limited number of measurements. Another finding was thataround 40 % of the children aged 3-6 years ran during the evacuations compared to 5 %of the children aged 0-2 years.
Table 4.4: Travel speed on horizontal plane of free movement for children in daycare centers.
children 0-2 years children 3-6 yearsmean SD mean SD[m/s] [m/s] [m/s] [m/s]
walking 0.60 0.17 0.84 0.25running 1.14 0.30 2.23 0.64
4.6 Travel speed down stairs
Travel speed and density were measured in seven stairwells in six daycares for childrenaged 0-6 years and in seven stairwells in four elementary schools for children aged 6-15years. These results are included in Papers III and IV presented separately for childrenin daycares and schools. Travel speed measurements (without person density) were alsoobtained on three spiral stairs in daycare centers used by children aged 3-6 years; theseresults are published in Papers I and II where they are described in more detail.
The data set contains 3645 speed/density data points. There were a total of 12 agecategories: 0-2 years and 3-6 years in daycare centers and one for each year for schoolchildren. There were approximately an equal number of boys and girls for each age cate-gory, except for age 12 and 14 (more boys) and age 13 (more girls).
Figure 4.4 compares the commonly used Nelson’s and Mowrer’s curve [16] and this re-search’s twelve age categories, with the youngest children in the top left chart and theoldest in the bottom right chart. The travel speed is shown with respect to density.There are fewer data points for ages 7-9 years because of their classes’ locations withinthe schools resulting in less use of stairs.
Department of Civil Engineering - Technical University of Denmark 33
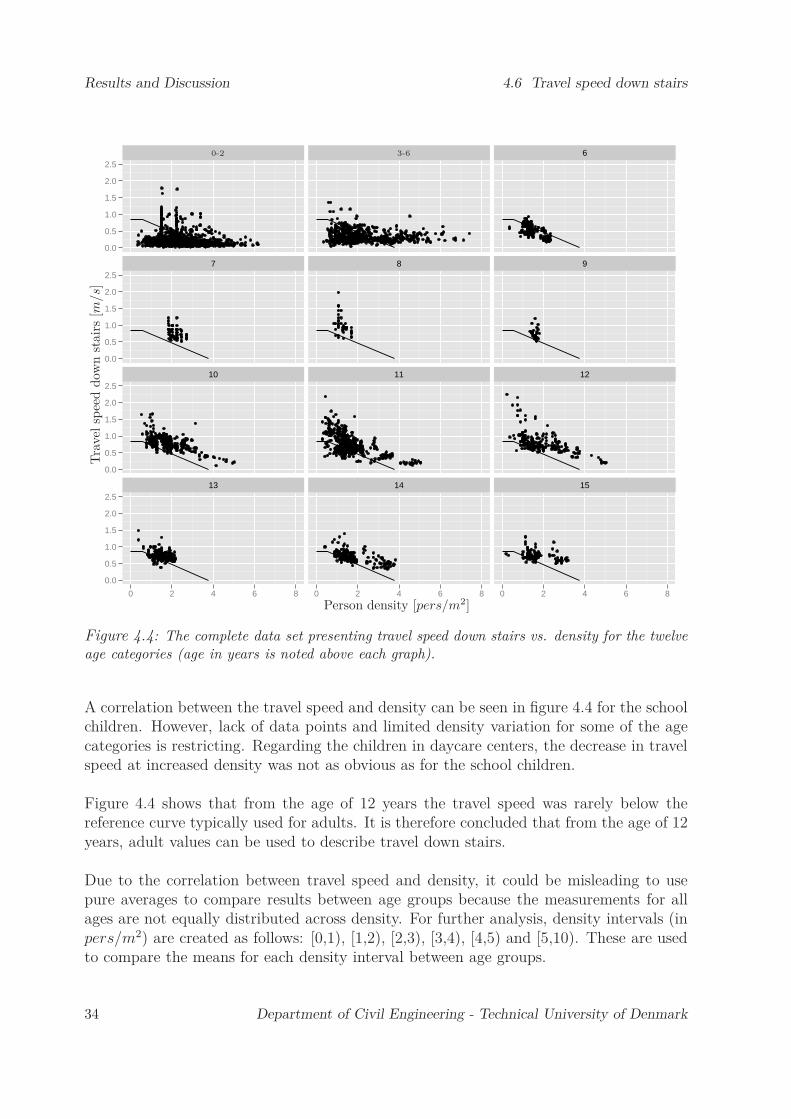
Results and Discussion 4.6 Travel speed down stairs
6
7 8 9
10 11 12
13 14 15
0.0
0.5
1.0
1.5
2.0
2.5
0.0
0.5
1.0
1.5
2.0
2.5
0.0
0.5
1.0
1.5
2.0
2.5
0.0
0.5
1.0
1.5
2.0
2.5
0 2 4 6 8 0 2 4 6 8 0 2 4 6 8
0-2 3-6
Person density [pers/m2]
Tra
vel
spee
ddow
nst
air
s[m
/s]
Figure 4.4: The complete data set presenting travel speed down stairs vs. density for the twelveage categories (age in years is noted above each graph).
A correlation between the travel speed and density can be seen in figure 4.4 for the schoolchildren. However, lack of data points and limited density variation for some of the agecategories is restricting. Regarding the children in daycare centers, the decrease in travelspeed at increased density was not as obvious as for the school children.
Figure 4.4 shows that from the age of 12 years the travel speed was rarely below thereference curve typically used for adults. It is therefore concluded that from the age of 12years, adult values can be used to describe travel down stairs.
Due to the correlation between travel speed and density, it could be misleading to usepure averages to compare results between age groups because the measurements for allages are not equally distributed across density. For further analysis, density intervals (inpers/m2) are created as follows: [0,1), [1,2), [2,3), [3,4), [4,5) and [5,10). These are usedto compare the means for each density interval between age groups.
34 Department of Civil Engineering - Technical University of Denmark
4.6 Travel speed down stairs Results and Discussion
6
7 8 9
10 11 12
13 14 15
0.0
0.5
1.0
1.5
2.0
2.5
0.0
0.5
1.0
1.5
2.0
2.5
0.0
0.5
1.0
1.5
2.0
2.5
0.0
0.5
1.0
1.5
2.0
2.5
[0,1) [1,2) [2,3) [3,4) [4,5) [5,10) [0,1) [1,2) [2,3) [3,4) [4,5) [5,10) [0,1) [1,2) [2,3) [3,4) [4,5) [5,10)
0-2 3-6
Person density interval [pers/m2]
Tra
vel
spee
ddow
nst
air
s[m
/s]
Figure 4.5: Boxplots showing travel speed down stairs with respect to density group for thetwelve age variables.
Figure 4.5 shows boxplots for the twelve age categories where travel speed down stairswith respect to density interval is displayed. The boxplots show the mean of the samplewith a thick line, the upper and lower edges of the box present 25th and 75th percentile,the end of the lines present 1.5IQR (inter quartile range) and the points are outliers. Theboxplots show the relation between speed and density more clearly than the raw datapoints and at what density intervals the data points were collected. The boxplot alsogives an overview of the spread of the data where the general trend is more variation inspeed at low densities. A number of outliers on the upper side can be seen at the densityinterval [1,2) pers/m2, indicating free and unrestricted movement at that density. Thatis confirmed by the video films, and by the fact that a density of 1 pers/m2 was exceeded
Department of Civil Engineering - Technical University of Denmark 35

Results and Discussion 4.6 Travel speed down stairs
with 2-6 people on a flight of stairs simultaneously depending on the width and numberof steps.
The results for children in daycare, shown in figures 4.4 and 4.5, include data on allchildren, regardless of whether a child was carried, assisted by handholding or walkedby itself. Results on the effect of the assistance on travel speed are discussed in section4.7. In the following, when comparing results between age groups and other literature,the carried children’s data will be excluded or presented separately. This is because theperson walking is an adult and it would be misleading to represent that as a travel speedfor a child.
Table 4.5 shows speed results for the children aged 0-2 years of this research comparedwith Kholshnevnikov et al. for children under 3 years [58], where the number of datapoints and mean travel speed are shown for each density group defined. Results fromMurozaki [42] are also included in the table where the minimum and maximum of fivemean travel speeds are displayed, although no density data was available.
Table 4.6 shows speed results for the age group 3-6 years from daycares and for 6 yearold children from schools from this research and results from Kholshnevnikov et al. [58]for children aged 3-4 years 4-5 years and 5-7 years as well as results from Capote [60] forthe age group 4-6 years. Results from Capote are shown for two fire drills performed butno person densities were provided.
Table 4.7 shows speed results for age groups 6-8 years, 9-11 years and 12-15 years fromthis research. Note that the 6 year old children are included in two tables, first indepen-dently and then included in the age group 6-8 years. Results from Capote are displayedas before and results from Ono [61] are also included. Ono’s results are the minimumand maximum mean values within the age intervals displayed during three fire drills; theresults did neither include the number of measurements nor the person density.
Extended tables including the standard deviation, 95 % confidence intervals, minimum,maximum and median values in addition to the number of measurements and the meanvalues are displayed for the current research in Appendix C. There are tables for each ofthe twelve age categories.
The average travel speeds follow a similar trend to the flow through doors for the agecategories 0-2 years, 3-6 years, 6-8 years, 9-11 years and 12-15 years. That is the speedincreases with age but then reaches a maximum at the age 9-11 and the age group 12-15being slower. Lower speeds were achieved in this research compared to results of otherstudies in literature available on children.
Table 4.5 shows that the results from Kholshevnikov and Murozaki have values that are in
36 Department of Civil Engineering - Technical University of Denmark

4.6 Travel speed down stairs Results and Discussion
Table 4.5: Mean travel speed down stairs represented for different density intervals, for daycaresage groups 0-2 years. Results from Kholshchevnikov et al. [58] and Murozaki et al. [42] areincluded for comparison
Current study Kholshchevnikov Murozaki0-2 years 0-2 years up to 3 years 0-5 years
density (not carried) (carried) (including adults)interval n speed n speed n speed n speed
[pers/m2] [#] [m/s] [#] [m/s] [#] [m/s] [#] [m/s][0, 1) 42 0.18 4 0.31 73 0.34
23-5
6
0.2
7-0
.36[1, 2) 248 0.19 117 0.55 71 0.33
[2, 3) 259 0.19 141 0.40 43 0.34[3, 4) 124 0.15 71 0.31 24 0.33[4, 5) 41 0.11 23 0.24 - -[5, 10) 12 0.13 7 0.15 - -
Table 4.6: Mean travel speed down stairs represented for different density intervals, for daycaresage group 3-6 years. Results from Kholschevnikov et al. [58] and Capote et al. [60] are includedfor comparison
Current study Kholshchevnikov Capote3-6 years 6 years 3-4 years 4-5 years 5-7 years 4-6 years
density (not carried) (from school) (drill 1 & drill 2)interval n speed n speed n speed n speed n speed n speed
[pers/m2] [#] [m/s] [#] [m/s] [#] [m/s] [#] [m/s] [#] [m/s] (#) [m/s][0, 1) 65 0.41 11 0.53 26 0.50 8 0.67 45 1.16
47
&46
0.4
8&
0.6
1[1, 2) 202 0.39 150 0.58 50 0.42 26 0.56 102 0.97[2, 3) 111 0.37 49 0.31 38 0.38 37 0.50 122 0.88[3, 4) 85 0.28 - - 27 0.34 36 0.45 46 0.78[4, 5) 52 0.33 - - 4 0.32 12 0.42 26 0.72[5, 10) 27 0.34 - - - - - - 4 0.68
Table 4.7: Mean travel speed down stairs represented for different density intervals, for schoolchildren age groups 6-8, 9-11 and 12-15 years. Results from Capote et al. [60] and Ono et al. [61]are included for comparison.
Current study Capote Ono6-8 years 9-11 years 12-15 years 8-12 years 12-16 years 6-8 y 9-11 y 12-15 y
density (drill 1 & drill 2) (lowest - highest mean)interval n speed n speed n speed n speed n speed speed speed speed
[pers/m2] [#] [m/s] [#] [m/s] [#] [m/s] [#] [m/s] [#] [m/s] [m/s] [m/s] [m/s][0, 1) 15 0.63 112 1.00 70 1.01
48
&102
0.8
7&
1.0
6
104
&63
1.0
0&
0.9
5
0.6
8-
1.0
3
0.6
8-
1.4
9
0.9
6-
1.5
3[1, 2) 208 0.68 628 0.76 531 0.75[2, 3) 95 0.52 116 0.66 96 0.70[3, 4) - - 42 0.42 58 0.53[4, 5) - - 26 0.22 8 0.27[5, 10) - - 3 0.21 1 0.20
Department of Civil Engineering - Technical University of Denmark 37
Results and Discussion 4.6 Travel speed down stairs
between the two groups shown for this research or higher. It is specified by Murozaki thatadults are included in the measurements, which could contribute to raising the averagetravel speeds as well as the children’s age range being 0-5 years.
Table 4.6 shows some similarities between the different studies, where speeds of the agegroup 3-6 years in daycares are closest to those found for children 3-4 years old by Khol-shevnikov. Speeds found in this research for 6 year old children in schools are close toKholshevnikov’s results on children 4-5 year old and Capote’s results for children aged4-6 years, although Capote’s results do not include specific densities making comparisondifficult. As mentioned in chapter 2 Kholshevnikov’s measurements are not made duringfire drills but during normal use of the buildings and during special experiments withgroups of children. This difference in method must be kept in mind when comparing theresults, however the effect is not known.
In table 4.7 it is difficult to directly compare the results of the current research to thoseof Capote and Ono, since neither includes density values. However the common trend ofall three studies is that the youngest age group in the schools were slower than the twoother age groups and there was not much difference between the other two.
4.6.1 Spiral stairs
When using the three spiral stairs, children evacuated in a single row, with very fewexceptions. As mentioned these three stairs were all used by children aged 3-6. Thetravel speed results spanned a wide range and were affected by both the design of thestairs and the children’s knowledge of the stair and evacuation route in whole. Meantravel speed, min, max and standard deviations for the three stairs are shown in table4.8. The table shows that the greatest difference was between stair 1 and 3. The differencein design between stair 1, where the children achieved the highest mean speed, and stair 3,where the travel speed was lowest, was the material of the stair and position of a handrail.The more troubling one for the children was an external metal grid fire escape, where thesteps were see-through. The handrail was high and with vertical bars. The stair wherethe children traveled the fastest was an internal wooden spiral stair with two handrails,one at a normal height and one lower, suitable for the children. The design was such thatone could slide a hand continuously along the handrail all the way down.
38 Department of Civil Engineering - Technical University of Denmark

4.7 Assistance in stairs Results and Discussion
Table 4.8: Travel speed measured on three spiral stairs used by children aged 3-6 years.
children 3-6 yearsmean min max SD[m/s] [m/s] [m/s] [m/s]
stair 1 0.58 0.25 1.40 0.31stair 2 0.38 0.29 0.48 0.07stair 3 0.13 0.08 0.33 0.06
There was also a difference in knowledge of the evacuation path and training. The chil-dren did not know about the metallic fire escape and had never used it before. It wasobserved that the children were insecure walking on the stair and needed to concentratea lot, moving their hand from one vertical bar to the other for support. They frequentlylooked down through the metallic grid but also stopped and looked around, perhaps en-joying the view, as they had never been there before. The internal staircase was theirprimary stair between floors and was used every day when going out to the playground.The children were therefore comfortable using the stair in large groups.
The difference in standard deviation can also be seen in table 4.8, where stair 1 has thehighest standard deviation. It was noted that the highest travel speeds were accomplishedby the first children that used the stair. The speed decreased as more children enteredthe stair, most likely due to congestion, but also because the more hesitant children couldbe seen waiting until last.
4.7 Assistance in stairs
As mentioned in the first section of this chapter, adults are highly involved in an emer-gency evacuation from the beginning to the end. The frequency and level of assistanceprovided to the children have already been presented separately for children 0-2 years oldand children 3-6 years old. Figure 4.6 shows the mean travel speed on stairs for each levelof assistance for both age groups.
Figure 4.6 indicates that for children aged 0-2 years, the level of assistance greatly af-fects travel speed on stairs. This on the other hand does not seem to be the case forchildren aged 3-6 years. The null hypothesis used in an analysis of variance are that themeans are the same regardless of level of assistance. With an alpha value of 0.05 the nullhypothesis was rejected for the younger children, aged 0-2 years but failed to reject for theolder children, 3-6 years. The statistical tests confirm what figure 4.6 shows. The Tukeytest was used to determine where (between which levels of assistance) there was a differ-ence in travel speed for the children 0-2 years. Using α = 0.05 it was confirmed with 95% level of confidence that there was a difference between all levels of assistance. However,the greatest difference in travel speed was between children who were carried and childrenthat walked themselves followed by the difference between children who were carried andchildren who were assisted. There was only marginal difference between children who were
Department of Civil Engineering - Technical University of Denmark 39

Results and Discussion 4.7 Assistance in stairs
0−2 years 3−6 years
0.0
0.5
1.0
1.5
carried assisted self carried assisted self
Level of assistance
Tra
vel
spee
ddow
nst
air
s[m
/s]
Figure 4.6: Boxplots showing travel speed down stairs with respect to age group and level ofassistance.
assisted and those who walked themselves, where the children being assisted achieved ahigher travel speed on average as seen in figure 4.6.
The boxplots in figure 4.7 show how person density affects the travel speed in daycares,divided into the three levels of assistance and the two age categories. It is interesting tosee that the traditional relationship between speed and density is most obvious where thechildren are carried. This indicates that young children are not as affected by the persondensity as adults are.
40 Department of Civil Engineering - Technical University of Denmark

4.7 Assistance in stairs Results and Discussion
carried assist self
0.0
0.5
1.0
1.5
0.0
0.5
1.0
1.5
0−2 years
3−6 years
[0,1) [1,2) [2,3) [3,4) [4,5) [5,10) [0,1) [1,2) [2,3) [3,4) [4,5) [5,10) [0,1) [1,2) [2,3) [3,4) [4,5) [5,10)
Person density interval [pers/m2]
Tra
vel
spee
ddow
nst
air
s[m
/s]
Figure 4.7: Boxplots showing travel speed down stairs with respect to age group and level ofassistance for each density interval.
Department of Civil Engineering - Technical University of Denmark 41

Results and Discussion 4.8 Handrail use in stairs
4.8 Handrail use in stairs
Handrail use during evacuation of daycare centers was observed. The findings are in-cluded in Paper IV where some more detailed descriptions are provided. In two stairs,used by children aged 0-2 years, there was a low handrail on one side and a high handrailon the other.In one stair, also used by children aged 0-2 years, there was a low and a highhandrail on the same side of the stair and no handrail on the other.
The low handrails were 34-61 cm high. Table 4.9 shows the frequency of handrail usefor children in daycares. It shows that over 90 % of children 0-2 years old, who did notreceive assistance from adults, used a handrail for support whereas less than 60 % of chil-dren aged 3-6 years did the same. This complies with the children’s physical development,as the older children had better physical control and stability and did not need as muchsupport to walk on stairs. Another reason could be that there were no handrails availableat optimal height for children in the older age group.
For both age groups the handrail use frequency decreased when they received assistancefrom adults. This is not surprising as handholding provided enough support for some ofthe children. Furthermore the adult often controlled the path taken on the stairs and itdid not always allow for the child to hold on to the handrail.
Apart from noting for each child if a handrail was used or not when descending thestairs it was noted if the handrail was low or high or the only handrail available (high).Figure 4.8 shows a boxplot to compare the speeds of the children holding a handrail,depending on the height of it. It is interesting to see that on average the children usinga low handrail for support achieved a higher travel speed than the others. An analysis ofvariance confirmed that there was a statistical difference. On average the children in theage group 0-2 years using a low handrail walked 23.5 % faster than the ones using otherhandrails.
Table 4.9: Frequency of handrail use for children during daycare fire drills.
handrail no handrail other total
0-2 yearsself 92.7 % 6.5 % 0.8 %1 100 %
assisted 75.0 % 21.8 % 3.2 %2 100 %
3-6 yearsself 58.6 % 41.4 % - 100 %
assisted 44.7 % 53.3 % - 100 %1children that crawled backwards down2children that held adults in both hands
42 Department of Civil Engineering - Technical University of Denmark

4.9 Handholding in stairs Results and Discussion
0.00
0.25
0.50
0.75
1.00
1.25
low high only available
Handrail used
Tra
vel
spee
ddow
nst
air
s[m
/s]
Figure 4.8: Boxplots showing travel speed down stairs with respect to the handrail used.
4.9 Handholding in stairs
During daycare evacuations handholding only existed between adults and children withthe exception of four children (two pairs) that held each other’s hands. However this wascommon practice for the lower classes in the school evacuations. Results on handhold-ing amongst school children are included in Paper III, where they are described in moredetail. Table 4.10 shows how the handholding decreases by increasing age of the schoolchildren. It also shows how the children continue walking side by side even though theydo not hold hands. After the age of 9 years handholding was rarely seen.
It was observed from the films that the handholding and walking in pairs continued untiloutside and the whole class walked together and did not mix together with other children.For the older classes, where this pairing was not evident, there was more blending betweenthe classes and more overtaking on the stairs.
Department of Civil Engineering - Technical University of Denmark 43

Results and Discussion 4.10 Gender difference
Table 4.10: Frequency of handholding (between students) during elementary school fire drills.
class 0 class 1 class 2 class 3 class 4-96 years 7 years 8 years 9 years 10-15 years
students holding hands 100 % 82 % 48 % 29 % <5 %students walking in pairs 0 % 18 % 44 % 29 %students walking alone 0 % 0 % 8 % 42 %
The handholding originates from teacher’s instructions where the youngest school childrenfollow the instructions literally but as the children get older they seem to obey the in-structions on an organized evacuation but do not necessarily physically hold hands. Thisgrowing independency was also seen in the initial phase where children started to reactbefore the teacher.
4.10 Gender difference
Since each individual was identified by gender, the travel speed down stairs and the levelassistance was analyzed for gender difference or trends. For travel speed this was done foreach age /age category. For the level of assistance it was only done for age categories 0-2years and 3-6 years. In a few cases the gender could not be identified with high accuracyand the individual’s gender categorized as undefined. This only happened amongst theyoungest children.
Table 4.11 shows that a similar proportion of boys and girls received each level of as-sistance when descending the stairs.
Figure 4.9 shows a boxplot comparing males and females separately for the level of assis-tance for the daycare age groups. Comparing the mean travel speeds between boys andgirls a difference cannot be seen except when the children are carried. An analysis ofvariance is used to test the null hypothesis that the means are the same for females andmales, when the children walk self or receive assistance. The hypothesis is not rejected(failed to reject) indicating no gender difference. The difference when the children arecarried is not interesting as that speed depends on the adult who carries the child.
Table 4.11: Assistance received with respect to gender.
age group level of assistance female male
0-2 yearscarried 34.3 % 32.3 %assisted 43.3 % 42.5 %
self 22.4 % 25.2 %
3-6 yearscarried 1.9 % 0 %assisted 11.6 % 15.9 %
self 86.4 % 84.1 %
44 Department of Civil Engineering - Technical University of Denmark
4.10 Gender difference Results and Discussion
female male unknown
0.0
0.5
1.0
1.5
0.0
0.5
1.0
1.5
0−2 years
3−6 years
carried assisted self carried assisted self carried assisted self
Level of assistance
Tra
vel
spee
ddow
nst
air
s[m
/s]
Figure 4.9: Boxplots showing travel speed down stairs with respect gender and level of assistance.
Department of Civil Engineering - Technical University of Denmark 45
Results and Discussion 4.11 Behavioral aspects
6 7 8 9 10
11 12 13 14 15
0.0
0.5
1.0
1.5
2.0
0.0
0.5
1.0
1.5
2.0
female male female male female male female male female male
Gender
Tra
vel
spee
ddow
nst
air
s[m
/s]
Figure 4.10: Boxplots showing travel speed down stairs with respect gender and level of assis-tance.
Figure 4.10 shows a boxplot for each age category for the school children. A quick lookindicates no general gender difference and that is confirmed by an analysis of variancewith the exceptions of 7 year old children where the girls were on average 0.11 m/s fasterand 13 year old where the difference was marginal, but showing the girls being faster.
4.11 Behavioral aspects
A number of interesting behaviors were noticed during the fire drills. Some of whom relatedirectly to what can be expected from adults, while other might be more identifying ofchildren.
46 Department of Civil Engineering - Technical University of Denmark

4.11 Behavioral aspects Results and Discussion
4.11.1 Affiliation
Like adults, children are most comfortable with familiar people and routes. When toldto go outside some children ran towards the main exit, although the plan was to use thedirect emergency exit to outdoor. This is natural as that is the most used door and thedoor they entered through. Children could also be seen following the adults and childrenform their own group, throughout the evacuation where possible, indicating a preference.
4.11.2 Family bonds
Two examples of impact of family bonds could be seen during the fire drills. One examplewas when parents were arriving with their children when the fire drill started, they couldbe seen evacuating independently of the other daycare occupants, assisting their own child.
Another example was when children in the older age group asked the staff about theiryounger siblings who were located in another part of the facility. Even though they didnot act on the family bond, they did express their concern.
4.11.3 Gathering belongings
A few children took belongings with them out and at least one child was seen gettingupset over not being allowed to go get a favorite item.
Adults could be seen taking some personal belongings before leaving the rooms or grabbingthem on the way out.
4.11.4 Helping others
On one occasion, children from the older age group in a daycare center were located in aroom next to the younger children’s department when the alarm was raised. That meantthat they evacuated along with the younger children. The older children were keen toassist and ended up holding hands with younger children to support them.
During a school evacuation a student on crutches received help from a fellow student.
4.11.5 Investment
In some cases children were reluctant to stop their activities which can be related toinvestment theory, where people do not want to evacuate due to their financial or timeinvestment in something. Examples of this could be that a child would lose a good spotor a toy by leaving.
In the cases where adults finished their coffee, they were saving their investment, since itwould get cold during the evacuation.
Department of Civil Engineering - Technical University of Denmark 47
Results and Discussion 4.12 Design perspectives
4.11.6 Redirecting
In the school evacuations it could occasionally be seen that children or groups of childrenredirected to an other exit or stair due to congestion.
4.11.7 Rules and routines
It could be seen through several examples that children in daycares are used to a structuredenvironment, where certain rules and routines are followed during the day. Children couldbe seen starting to change from indoor shoes to outdoor shoes, as that is what normallyis done when going outside. Children could also be seen stopping by the outside door tozip up a jacket and to put on a hat for the same reason and stopping by the door or bya stair, waiting for adults permission to proceed.
4.11.8 Social influence
Young children did not seem to mind what the people around them were doing and a fewexamples could be seen where children kept playing even though everyone left the room.They only evacuated when an adult came to get them.
Older children seemed more aware of their surroundings and what their peers were doing.Children could be seen making jokes about the fire drills, perhaps not wanting to seemtoo serious or uptight. However, social influence was most obvious amongst the adults,who showed hesitation to evacuate without confirming that other groups were doing soas well.
4.12 Design perspectives
Looking at design perspectives it is important to identify what design supported efficientevacuation and what design most likely delayed it.
4.12.1 Alarm systems
Results indicate that alarm systems with an audio signal shorten the pre-evacuation timeand ensure simultaneous warning. Some problems with the audio signal strength werenoticed during activities behind closed doors. It should be ensured that the alarm can beheard at all locations with doors shut.
Research has shown that identifying and noticing a fire alarm correctly is not a mat-ter of course [72, 73]. The task has not become easier as more and more sound alarmsare used to notify us of different things. It was noticed that the fire alarms were differentbetween the daycares (one even had a different warning signal inside the facility than inthe staircase) and that some of the schools did not have specific fire alarm, but used thenormal school bell either ringing in intervals or having a spoken message before. The factthat alarm sounds differ makes it even more important to train evacuations so that the
48 Department of Civil Engineering - Technical University of Denmark

4.12 Design perspectives Results and Discussion
children can be conditioned to associate the alarm with an evacuation.
The optimal would be to have a uniform fire alarm signal in all institutions to be ableto limit the number of sounds that a child should connect to an emergency evacuation.Ideally children would be able to recognize a fire alarm in other buildings after trainingin a daycare or school.
4.12.2 Handrail
The results indicate that children prefer to use a handrail for support when descendingstairs. Handrails could therefore be recommended on both sides of stairs. The travelspeeds are likely to be higher if handrails are available at children’s height.
Design of the low handrails could been improved by having them longer than the stairs,that is having the handrail start before the stair and ending a bit into the landing. Thisis suggested because the video footage showed children struggling with reaching forwardto the low handrail, as the children seemed to want to get a firm grip on it before enteringthe stair. This resulted in stretching and knee bending as the children tried to grab thelow handrail, causing a delay in entering the stair. A similar problem was seen at the endof the handrail, where the children did not want to let go before both feet were safe onthe landing, this resulted in leaning back and backward arm stretching. This is a simpleadjustment that could potentially improve the movement down stairs for young children.
4.12.3 People load
In schools it was noticed that the people load in the stairs varied, due to location ofthe offices and teachers’ study rooms within the schools. In some schools these were allgrouped together, resulting in uneven use of the school’s two stairs, one only being usedby a few members of staff, while the other stair was used by hundreds of children causingcongestion on the stairs. Some thought should be given to the people load of each emer-gency route, to avoid overloading.
An alternative could be to implement this into the evacuation plan, by directing someclassrooms to use the less occupied stair, if safe.
4.12.4 Stairs
It was observed that straight stairs caused less problems than half turn stairs. This ismost likely due to the fact that the half turn stairs do not have a uniform step dimensionthroughout the stair. The steps are narrower on the inner side (similar to spiral stairs)and since the handrail was positioned on the inner side it encouraged the children tochoose that travel path. Travel speeds on the two half turn stairs were below the average.
It was also observed that stairs with landings caused less problems than those without.
Department of Civil Engineering - Technical University of Denmark 49
Results and Discussion 4.13 Procedures
This was reflected in more frequent carrying of young children in stairs without land-ing(s). Even though the results on travel speed do not directly reflect this problem withstairs without landings, it did cause more delay on the landings between floors. Childrenhesitated to enter the stair and adults hesitated to allow the children to enter the stairwithout assistance most likely due to higher risk of injury in case of falling.
The results did not indicate that the steeper the stair, the lower the travel speed. Infact the relationship was opposite to what was expected, that is higher travel speeds weremeasured at steeper stairs. Assuming that the theory for adults is correct, a possibleexplanation to why this relation is different or not as strong for children could be thatchildren have smaller feet, so the run of the steps can be smaller without causing suchdiscomfort that it effects the walking speed.
4.13 Procedures
Some potential flaws in the evacuation procedures were observed during the fire drills.Three examples will be described and discussed in the following subsections.
4.13.1 Locked door delayed evacuation
During one evacuation, adults instructed the children (aged 3-6 years) to evacuate andopened a door to a back stair. The children walked down but could not open the doorto the outside because it was locked and they did not know how or did not have thestrength to unlock it. The children piled up in front of the door until an adult camedown, squeezing through the group of children and opened the door.
Furthermore, and not less worrying, was that one child could be seen continuing downthe stair to the basement. That child came up again shortly afterwards and evacuatedwith the other children. No adult observed this and it is worrying that a child could havebeen left behind.
This situation could have been avoided by sending one of the adults down first to openthe door and guide the children through it, instead of the adults grouping up at last.
4.13.2 Staff pre-evacuation actions delayed evacuation
In one case, already mentioned in connection with the pre-evacuation, the evacuation pro-cedure required a few members of staff to take on the role of controlling the evacuation.The first task after putting on an identifying vest was to gather at the fire alarm controlpanel and find out where the fire was located. They should then inform the other occu-pants in the group rooms, who should be waiting ready to evacuate, of which evacuationroute to take.
The remaining adults gathered the children when the alarm sounded but then waited
50 Department of Civil Engineering - Technical University of Denmark
4.13 Procedures Results and Discussion
in the rooms for confirmation and instructions. In fact, they waited up to five minutesfor instructions about which route to take. The delay was due to difficulties reading andunderstanding the fire alarm control panel.
It can be said that the benefits of having an audio alarm, that normally should shortenthe pre-evacuation time, were minimized in this case.
The delay could be shortened by training the staff in reading the panel and/or replacingit with one with a more user friendly interface. Another option is to rely on the staff forchoosing a safe route for each group, depending on the fire cues available and recognizedon the way.
4.13.3 Limited staff and multiple stairs delayed evacuation
A third example is the challenge of getting a large number of children down multipleflights of stairs. As the results showed regarding assistance, the younger children neededit the most. In one of the daycare centers around 100 children aged 0-2 years and 25adults evacuated using the daycarecenter’s two stairs. The daycare center was locatedon fourth floor so the evacuation plan stated that each staff member was responsible ofhelping children between two particular floors to avoid needing to go up and down thewhole stairwell multiple times. This procedure however, resulted in adults leaving fortheir positions further down the stairwell with only one or two children or even no chil-dren with them. This meant that the remaining staff had even more children per person.On several occasions the flow into the stair came to a stop due to lack of staff to assistthe children.
Figure 4.11 shows snapshots taken every 20 seconds on the landing where 45 childrenand 11 adults enter a stair on the fourth floor. It can be seen that it takes over 7 minutesto get everyone into the 0.95 m wide stair. On a number of snapshots, adults can be seenwaiting with children while another adult runs up and down the stair assisting children.
This example shows how important every adult is and that evacuation plans need tobe carefully considered and tested to ensure efficiency.
Department of Civil Engineering - Technical University of Denmark 51
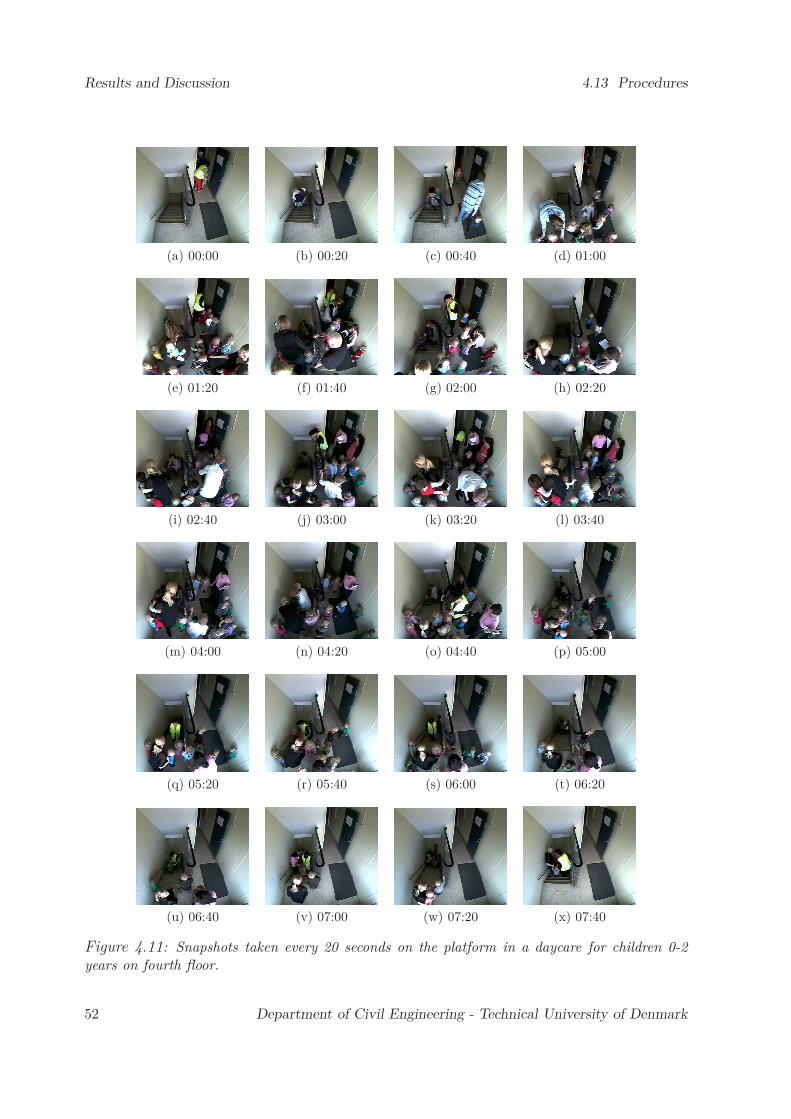
Results and Discussion 4.13 Procedures
(a) 00:00 (b) 00:20 (c) 00:40 (d) 01:00
(e) 01:20 (f) 01:40 (g) 02:00 (h) 02:20
(i) 02:40 (j) 03:00 (k) 03:20 (l) 03:40
(m) 04:00 (n) 04:20 (o) 04:40 (p) 05:00
(q) 05:20 (r) 05:40 (s) 06:00 (t) 06:20
(u) 06:40 (v) 07:00 (w) 07:20 (x) 07:40
Figure 4.11: Snapshots taken every 20 seconds on the platform in a daycare for children 0-2years on fourth floor.
52 Department of Civil Engineering - Technical University of Denmark

4.14 Training Results and Discussion
4.14 Training
Training can both be direct and indirect. Direct training is where fire drills are used totrain the procedures and evacuation of buildings and indirect training can be passing theevacuation route or a part of it in another context. An example of this could be to havea group of children use a fire escape stair or a back stair once a week when exiting thebuilding. This would make the children aware of the location of the stair and make themcomfortable using it. Surprises could therefore be minimized if it becomes necessary touse it in an emergency. Back stairs or fire escape stairs are typically not as user friendlyas main stairs, even though it might be especially important for them to be easy to use.
This indirect training effect was identified during a fire drill in a daycare center, wheretwo spiral stairs were used during a fire drill. The average travel speed for the children onan internal spiral stair, which the children used daily, was over four times higher than forthe children using the external fire escape stair for the first time. Due to difference in stairdesign it was not possible to isolate the training effect from the design effect, but it wasclearly observed that in addition to difficulties walking down the children were distractedby the new situation and view.
The effect of direct training could be measured on one occasion, where a daycare centermade two similar evacuation experiments during the same month. The total evacuationtime was reduced from 3:35 min to 2:38 min, or more than 25 % and behaviors thatindicated lack of training and knowledge of evacuation procedure were not seen duringthe second fire drill.
Although more data on the effect of training is needed, there are indications that bothdirect and indirect training are beneficial during evacuation. Furthermore, training canbe useful for detecting flaws and weaknesses in the evacuation plan and procedure whichcan then be improved accordingly.
Department of Civil Engineering - Technical University of Denmark 53

Results and Discussion 4.14 Training
54 Department of Civil Engineering - Technical University of Denmark

C h a p t e r 5
Conclusion
This chapter includes a summary of the results, overview of the limitations of the research,suggestions for future work and concluding remarks.
5.1 Summary of results
The volume of available literature focusing on children in relation to fire safety and evacu-ation has increased in recent years. In the past couple of years, publications show ongoingstudies in at least three countries in addition to Denmark, namely Brazil, Spain and Rus-sia (chapter 2).
This project provides a large amount of new data and findings on children’s evacua-tion from daycare centers and schools, covering children aged 0-15 years. The data wasgathered during fire drills in daycare centers and schools which were filmed and analyzedafterwards. The results touch on three areas, namely measurable parameters, human be-havior and process, all of which are related when it comes to fire safety and evacuationsand influence each other. The main results are summarized below.
It has been shown that staff in daycares and schools play a leading role in initiatingan evacuation and assisting the children throughout evacuations. The role of the staff ismore important for younger children (chapter 4, section 4.1).
Pre-evacuation activities and times depended on the warning method, the adult’s re-actions and the local evacuation procedures. Simultaneous audio warning signal had apositive effect on the pre-evacuation time in daycare centers compared to verbal warning(chapter 4, sections 4.2 and 4.3).
Children generally achieve higher flow though doors than existing handbooks state foradults. The flow rate for children increased with age, peaking in the age group 9-11 yearsand for the age group 12-15 years it started approaching theoretical values for adults.
55
Conclusion 5.1 Summary of results
Since no measurements were under the reference curve for adults after the age of 12 years,it can be considered safe to use adult values from that age. Person densities for children3-6 years reached 10 pers/m2 but for school children aged 6-15 years 4 pers/m2 was thehighest person density measured. Effective width was found to being equal to the freewidth as children used the whole width of doors and stairs and did not leave a boundarylayer, as theory suggests for adults (chapter 4, section 4.4).
Free walking speed in horizontal plane was lower than for adults and lower for 0-2 yearold children than for 3-6 year old children. Running occurred more frequently amongstchildren 3-6 years, where their travel speed exceeded adults’ typical walking speed (chap-ter 4, section 4.5).
Travel speed on stairs increased with age. At the age of 12 years the travel speed wasrarely below the reference curve for adults and it can be considered representative fromthat age. Travel speed on stairs was found to be dependant on person density for all agegroups, although the density had less effect on the travel speed of children in daycarescompared to the other age groups (chapter 4, section 4.6 .
Children aged 6 years were consistently slower on stairs and achieved lower flow ratesthan other students of the schools which can partly be explained by them having at-tended school for less than two months, not knowing the procedures and surroundings aswell as the others.
While the travel speed of children 0-2 years was affected by the level of assistance re-ceived, where children that were carried traveled fastest, followed by children assisted byhandholding and children descending the stairs without physical assistance were slowest.This was not the case for children aged 3-6 years, where there was not a statistical differ-ence in the travel speed with respect to level of assistance (chapter 4, section 4.7).
Majority of children in daycares used a handrail for support when descending the stairs,the younger ones more than the older ones and the handrail use decreased if the childrenwere assisted by handholding. It was found that children using a handrail at children’sheight moved on average 23.5 % faster than those using a handrail at traditional height(designed for adults) (chapter 4, section 4.8).
Handholding amongst students was seen in the lower classes in schools, where childrenevacuated in double lines holding hands. The frequency of handholding went from 100 %for 6 year old children down to 29 % for 9 year old children. Only occasional handholdingappeared amongst older children (chapter 4, section 4.9).
No general difference could be seen in the travel speed down stairs between boys and girls.Boys and girls furthermore received similar level of assistance in the daycares (chapter 4,section 4.10).
56 Department of Civil Engineering - Technical University of Denmark

5.2 Limitations Conclusion
Examples were found in the results where procedures or failures in procedures causeda delay in the evacuation at some point. These could be adjusted accordingly to avoidsuch delays (chapter 4, section 4.13.
Examples where found where the design of the evacuation route influenced the evacu-ation. By optimizing the design to fit the use and occupants of the building valuable timecan be saved (chapter 4, section 4.12).
Training had a positive effect on the evacuation time and procedure and is highly rec-ommended. This comprehends both direct training through fire drills but also indirecttraining where alternative exits or stairs are used to make the children aware of theirexistence and comfortable using them (chapter 4, section 4.14).
5.2 Limitations
When implementing or using data produced in this project, the method used during col-lection and analyzing needs to be kept in mind, ensuring compatibility with the situationof interest. Details have been described when relevant but some of the more importantlimitations will be highlighted here.
The results are collected during partly announced fire drills where unannounced fire drillwould have been preferred, using more discrete cameras. The effect of the participantsknowledge of the drill or partial knowledge is not known.
As the results show a lot of difference between the age groups 0-2 years and 3-6 yearsit would be preferable to have smaller ager groups and potentially identifying how thechange develops with age as large jumps are seen between the two groups. This might beachieved by marking the children using colored vests or a more discrete marking such asa sticker. An other option would be to target daycare centers, where children are dividedinto groups by the year, to participate.
For some of the age groups there is a lack of data on travel down stairs, where theresults only base on a single class or travel down a single flight of stairs. This might notbe representative for the age group in whole.
The practical side has been a learning process where by every experiment conductedthe routine became smoother, less stressing and fewer mistakes were made. One of themost important lessons learnt is the value of planning, organizing and documenting. Fur-thermore it was found out that too many pictures cannot be taken of the setup, stairsand buildings. As the last of the practical things mentioned here is that the camera loca-tion should not be underestimated, avoiding disturbance by changing conditions such assunlight and doors positions which might influence the view of the camera is essential.
Department of Civil Engineering - Technical University of Denmark 57

Conclusion 5.3 Future work
5.3 Future work
A lot of new data has been gathered and many questions have been answered, howevermany new questions have been raised simultaneously. This is not uncommon when re-search is involved and is perhaps the key to continuous development in many researchfields, where indeed the new questions drive the field forward.
It is strange to think of not being able to "finish" what has been started. That con-tinuing the progress on this particular subject, evacuation of children, is most likely inthe hands of others. Hopefully someone is ready to take on the challenge because thereis plenty of work to be done.
The video files, over 1.5 TB, still contain a lot of information that has not been ex-tracted and documented. Also the data that has been retrieved from the videos already,still has room for analyzing. Then further experiments provide endless possibilities.
The following list is not in any way completed, it only represents some of the interestingthings that could be investigated, using the already collected video material.
• The video recordings from the elementary schools include children going outfor recess/break in addition to the fire drill. Analyzing the walking speeds andnoting the behavior and comparing to the fire drills would be interesting. Theresult could conclude if data from schools could be collected on normal schooldays when the children go outside and used to extend the experimental datacollected during fire drills.
• The video recordings from the daycares have a near full coverage of the facilitiesmeaning that each individual’s evacuation path can be tracked from beginningto end. This could be used in a number of ways. One is to map the evacuationin a way so the evacuation progress could be viewed graphically at perhaps 30s time steps.
• Compare the empirical results to results of simulation software could be veryinteresting. Plan drawings with dimensions to a reasonable accuracy alreadyexist.
• A comprehensive analysis using the person density unit m2/m2 as presentedin [4] where different size of individuals are accounted for. This would easecomparison between adult data and data on children, when looking at param-eters dependant on density.
• A more structured collection of occurring behavior to be able to map it in someextend and estimate frequency of occurrence.
58 Department of Civil Engineering - Technical University of Denmark

5.4 Concluding remarks Conclusion
Then many interesting questions need further gathering of data. Those could be:
• Further extension of the data set focusing on the largest gaps such as travelspeed in horizontal plane at different densities and the travel speed on stairsfor the age groups lacking data.
• The effect of training on total evacuation time as well as the evacuation process,by repeating fire drills in the same institutes. Even though this project aimedon answering this question, only fractional answers were found.
• The effect of adult/child ratio on total evacuation time as well as the evacuationprocess, by varying this ratio throughout multiple fire drills.
• Investigating the different acoustic fire alarm signals used in daycares and edu-cational buildings in Denmark and investigate if people recognize the sound asfire alarms.
5.4 Concluding remarks
The original aims of the thesis were to bring focus to the topic of evacuation of childrenand to provide new data and knowledge on children’s evacuation. This thesis appliedthe research method described in chapter 3 in order to achieve these aims, resultingin the novel contribution in the data in chapter 4, as also published at internationalconferences and in a journal. This project has also been critically assessed by identifyingits limitations. Finally, this thesis lays foundation for further research by also identifyingcandidate future work.
Department of Civil Engineering - Technical University of Denmark 59

Conclusion 5.4 Concluding remarks
60 Department of Civil Engineering - Technical University of Denmark

Bibliography
[1] Erhverfs og Byggestyrelsen. Bygningsreglement for erhverfs- og etagebyggeri, inkl.tillæg 14., 2006. (in Danish).
[2] Mannvirkjastofnun. Byggingarreglugerð nr.112/2012, 2012. (in Icelandic).
[3] National Fire Protection Association. Nfpa 101 - life safety code, 2012.
[4] V.M. Predtechenskii and A.I. Milinskii. Planning for Foot Traffic Flow in Buildings.Stroiizdat Publishers, Moscow, 1969.
[5] J.J. Fruin. Pedestrian Planning and Design. Metropolitan Association of UrbanDesigners and Environmental Planners Inc., New York, 1971.
[6] Nordic statistical yearbook. Nordic Council of Ministers, 2009.
[7] M. Koelch. Ethical issues in psychopharmacology of children and adolescents. CurrOpin Psychiatry, 21(6):598–605, 2008.
[8] B. Evarts. Structure fires in educational properties. Report, National Fire ProtectionAssociation, June 2011.
[9] C.I. Babcock. The chicago school fire. Nfpa quarterly report, National Fire ProtectionAssociation, January 1959.
[10] G. Srinivasan. 87 children die in school fire. Online edition of India’s Na-tional Newspaper, July 17th 2004. News article retreved September 19th2013(http://www.hindu.com/2004/07/17/stories/2004071707570100.htm).
[11] Xinhua. Death toll from Mexico’s daycare center fire rises to 47. Peo-ple’s Daily Online, June 23rd 2009. News article retreved September 19th2013(http://english.peopledaily.com.cn/90001/90777/90852/6684347.html).
[12] Collins. Doha mall fire: Tragic list of characters in a terrible, terribletale. The National, May 30th 2012. News article, retreved September19th 2013 (http://www.thenational.ae/news/uae-news/doha-mall-fire-tragic-list-of-characters-in-a-terrible-terrible-tale).
61

Bibliography
[13] A.L. Szachnowicz. Balancing safety and security in the school environment. FireProtection Engineering, October 2003.
[14] J. L. Bryan. SFPE Handbook of Fire Protection Engineering, Behavioral Responseto Fire and Smoke. National Fire Protection Association, USA, third edition, 2002.
[15] G. Proulx. SFPE Handbook of Fire Protection Engineering, Movement of People -The Evacuation Timing. National Fire Protection Association, USA, third edition,2002.
[16] H. E. Nelson and F. W. Mowrer. SFPE Handbook of Fire Protection Engineering,Emergency Movement. National Fire Protection Association, USA, third edition,2002.
[17] J.L. Pauls. Evacuation and other fire safety measures in high rise buildings. AshraeTransactions, 81:528–534, 1975.
[18] G. Prolux. Critical factors in high-rise evacuations. Fire Prevention, pages 24–27,1996.
[19] J.R. Hall. High-rise building fires. Technical report, National Fire Protection Agency,USA, December 2011.
[20] F. B. et al Steffensen. Brand og brandsikkerhed i forsamlingslokaler - et fælles ansvar.Technical report, Københavns Brandvæsen, Forebyggende afdeling, Projekt- og ud-viklingssektionen., May 2000. (In Danish).
[21] G. Prolux. Occupant responce during a residential fire. Fire and Materials, 23(6):317–323, 1999.
[22] G. Prolux and C. McQueen. Evacuation timing in apartment buildings. InternalReport 660, National Reseach Council Canada, June 1994.
[23] G. Prolux. How to initiate evacuation movement in public buildings. Facilities,17(9/10):331–335, 1999.
[24] J.L. Pauls. Effective-width model for evacuation flow in buildings. Proceedings ofEngineering Applications of Fire Technology Workshop, pages 215–232, April 1980.
[25] R.F. Fahy and G. Prolux. ’panic’and human behaviour in fire. Proceedings of HumanBehaviour in Fire Symposium, pages 387–398, July 2009.
[26] R.F. Fahy, G. Prolux, and L. Aiman. Panic or not in fire: Clarifying the misconcep-tion. Fire and Materials, 2011.
[27] E.D. Kuligowski, R.D. Peacock, and B.L. Hoskins. A review of buliding evacua-tion models 2nd edition. Technical Note 1680, National Institute of Standards andTechnology, 2010.
62 Department of Civil Engineering - Technical University of Denmark
Bibliography
[28] S. Gwynne and E.R. Galea. A review of the methodologies and critical apprasialof computer models used inthe simulation of evacuation from the built environment.Technical Report 97/IM/21, Centre for Numerical Modelling and Process Analysis,University of Greenwich, 1997.
[29] G. Hallberg. Defining care and residential buildings with respect to the evacuationcapabiliry of occupants. Fire Safety Science 3, pages 825–834, 1991.
[30] S.M.V. Gwynne, D.L. Boswell, and G. Proulx. Understanding the effectiveness ofnotification technologies in assisting vulnerable populations. Fire Protection Engi-neering, 19:31–49, February 2009.
[31] K.E. Boyce, T.J.Shields, and G.W.H. Silcock. Toward the characterization of buildingoccupancies for fire safety engineering: Prevalence, type and mobility of disabledpeople. Fire Technology, 35(1):35–50, 1999.
[32] K.E. Boyce, T.J.Shields, and G.W.H. Silcock. Toward the characterization of build-ing occupancies for fire safety engineering: Capabilities of disabled people movinghorizontally and on incline. Fire Technology, 35(1):51–67, 1999.
[33] K.E. Boyce, T.J.Shields, and G.W.H. Silcock. Toward the characterization of buildingoccupancies for fire safety engineering: Capability of disabled people to negotiatedoors. Fire Technology, 35(1):68–78, 1999.
[34] K.E. Boyce, T.J.Shields, and G.W.H. Silcock. Toward the characterization of buildingoccupancies for fire safety engineering: Capability of people with disabilities to readand locate exit signs. Fire Technology, 35(1):79–86, 1999.
[35] A. Chalmers. Improving the fire safety knowledge and practices of vulnerable groups.New Zealand Fire Service Commision Research Report 8, New Zealand Council forEducation Research, June 2000.
[36] E. Kuligowski. Elevators for occupant evacuation and fire department access. Pro-ceedings of the CIB-CTBUH International Conference on Tall Buildings, May 2003.
[37] G. Prolux. Evacuation by elevators- who goes first? Workshop on the Use forElevators in Fires and Other Emergencies, Atlanta, Georgia, pages 1–13, March2004.
[38] G. Prolux, E. Heyes, G. Hedman, J. Averill, J. Paules, D. MCColl, and P. Johnson.The use of elevators for egress. Proceedings of Human Behaviour in Fire Symposium,pages 97–110, July 2009.
[39] M.J. Kinsey, E.R. Galea, and P.J. Lawrence. Investigating the use of elevators forhigh-rise building evacuation through computer simulation. Proceedings of HumanBehaviour in Fire Symposium, pages 85–96, July 2009.
Department of Civil Engineering - Technical University of Denmark 63

Bibliography
[40] J.J. O’Donoghue. Evolution of an elevator task group project. Fire Engneering, 2010.
[41] S.J. Kravontka. A fire signal system for deaf school children. Fire Technology,11(1):23–28, 1975.
[42] Y. Murozaki and K. Ohnishi. A study of fire safety and evacuation planning for pre-schools and day care centers. Memoirs of the Faculty of Engineering Kobe University,32:99–109, 1985.
[43] A.F. Van Bogaert. Evacuating schools on fire. Fire Safety Science 1, pages 551–560,1986.
[44] A.F. Van Bogaert. Fire safety research and measures in schools in belgium. FireSafety Science 1, pages 819–828, 1986.
[45] M. Horasan and Bruck D. Investigation of a behavioural response model for fireemergency situations in secondary schools. Fire Safety Science 4, pages 715–726,1994.
[46] D. Bruck. Non-awakening in children in response to a smoke detector alarm. FireSafety Journal, pages 369–376, 1998.
[47] D. Gamache, S. andPorth. The development of an education program effective inreducing the fire deaths of preschool children. Proceedings of Human Behaviour inFire Symposium, 2001.
[48] H. Klüpfel, T. Meyer-König, and M. Schrecjenberg. Comparison of an evacuationexercise in a primary school to simulation results. Traffic and Granular Flow ’01,pages 549–554, 2003.
[49] R. Ono and K. Tatebe. A study on school children’s attitude towards firesafety andevacuation behaviour in brazil and the comparison with data from japanese children.Proceedings of Human Behaviour in Fire Symposium, 2004.
[50] M.A. Hassanain. Towards the design and operation of fire safe school facilities.Disaster and prevention management, 15(5):838–846, 2006.
[51] R. Ono and M.V. Valentin. A study on evacuation of school buildings for elementaryeducation. Proceedings of Human Behaviour in Fire Symposium, pages 231–242,2009.
[52] Kholshevnikov V.V., D.A. Samoshin, and A.P. Parfenenko. Pre-school and schoolchildren building evacuation. Proceedings of Human Behaviour in Fire Symposium,pages 231–242, 2009.
[53] A.R. Larusdottir and A.S. Dederichs. Evacuation dynamics of children - walkingspeeds, flow through doors in daycare centers. Proceedings of Pedestrian and Evac-uation Dynamics Symposium, pages 139–147, 2010.
64 Department of Civil Engineering - Technical University of Denmark
Bibliography
[54] C. Lu. The evacuate training problems of earthquake in china. Proceedings of Pedes-trian and Evacuation Dynamics Symposium, pages 121–127, 2010.
[55] A.R. Larusdottir and A.S. Dederichs. A step towards including children’s evacuationparameters and behavior in fire safe building design. Fire Safety Science 10, pages187–195, 2011.
[56] M.C. Campanella, A.R. Larusdottir, W. Daamen, and A.S. Dederichs. Empirical dataanalysis and modelling of the evacuation of children from three multi-storey day-carecentres. Proceedings of Evacuation and Human Behavior in Emergency Situations,Santander, 2011.
[57] A.R. Larusdottir and A.S. Dederichs. Evacuation of children - movement on stairsand on horizontal plane. Fire Technology, 48(1):43–53, 2012.
[58] V.V. Kholshevnikov, D.A. Samoshin, A.P. Parfenenko, and I.P. Belosokhov. Studyof children evacuation from pre-school education institutions. Fire and Materials,36:349–366, 2012.
[59] A.R. Larusdottir and A.S. Dederichs. Behavioural aspects of movement down stairsduring elementary school fire drills. Proceedings of Human Behaviour in Fire Sym-posium, 2012.
[60] J.A. Capote, D. Alvear, O. Abreu, A. Cuesta, and J. Hernando. Children evacua-tion: Empirical data and egress modelling. Proceedings of Human Behaviour in FireSymposium, 2012.
[61] R. Ono, M.V. Valentin, and F. Vittorino. Walking speed data of fire drills at anelementary school. Proceedings of Human Behaviour in Fire Symposium, 2012.
[62] J.A. Capote, D. Alvear, O. Abreu, A. Cuesta, and F. Ancona. Children be-haviour during evacation process in school buildings. Proceedings of the InternationalCongress Fire Computer Modelling, Santander, pages 441–456, 2012.
[63] G. Proulx. Evacuation time and movement in apartment buildings. Fire SafetyJournal, 24:229–246, 1995.
[64] A. Taciuc and A.S. Dederichs. Determining self-preservation capability in pre-schoolchildren. Technical note, The Fire Protection Research Foundation, 2013. (To bepublished).
[65] A.E. Cote, editor. Fire Protection Handbook, Principles and Techniques of Fire andLife Safety Education (Section 5, chapter 1). National Fire Protection Association,twentieth edition, 2008.
[66] S.M.V. Gwynne. Helping people on their own terms: Developing inclusive emergencyprocedures. Fire Technology, 44:439–461, September 2008.
Department of Civil Engineering - Technical University of Denmark 65

Bibliography
[67] A.R. Larusdottir. Evacuation process of daycare centers for children 0-6 years. Mas-ter’s thesis, Technical University of Denmark, August 2009.
[68] B.A. Pedersen. Grundlag for designkriterier til brandsikring ad bygninger for børnog unge 6-15 år. Master’s thesis, Technical University of Denmark, February 2011.(In Danish).
[69] Brandskyddshandboken. Report 3134, Department of Fire Safety Engineering, LundUniversity, 2005. (In Swedish).
[70] B.L. Hoskins. Effective density measurements methods on stairs. Proceedings ofHuman Behaviour in Fire Symposium, 2012.
[71] B.L. Hoskins and J.A. Milke. Differences in measurement methods for travel distanceand area for estimates of occupant speed on stairs. Fire Safety Journal, 48:49 – 57,2012. doi:http://dx.doi.org/10.1016/j.firesaf.2011.12.009.
[72] L. Benthorn and H. Frantzich. Fire alarm in a public building: How do peopleevaluate information and choose evacuation exit? Technical Report ISSN 1102-8246,Department of Fire Safety Engineering, Lund University, June 1996.
[73] R. Palmgren, J. Åberg, and D. Nilsson. Which acoustic and optical signals are bestsuited for evacuaiton alarms? Proceedings of Human Behaviour in Fire Symposium,2012. (Poster).
66 Department of Civil Engineering - Technical University of Denmark

Appendices
67


Appendix A
Icelandic program for 5 year old children
In Iceland a fire safety educational programme for 5 year old children (last year of day-care/kindergarten) started in 2007. The name of the programme is Flame (Icelandincboy’s name: Logi) and Ember (Icelandic girl’s name: Glóð) which are the names of fic-tional characters (elfish) that are the fire department’s helpers.
Every year two staff members of the local fire department visit daycare centers and meetwith the 5 year old children. While one does the annual fire inspection the other one goesthrough the educational program with the children.
The children are asked to join Flame and Ember in helping the fire department, wheretheir task will be to take turns in inspecting the daycare facility on a monthly basis. Thepoints to be inspected are explained carefully to the children using pictures and demon-strations. The children learn about emergency exits and signs, importance of keepingexits clear, fire alarms, smoke detectors, fire extinguishers, door pumps and to minimizegarbage inside.
They are told what to do if they need to evacuate the daycare and the message is simple,stop what they are doing and quickly form a line and the teacher will lead them out,choosing a safe route.
Then the importance of smoke detectors and to have a fire extinguisher in homes arediscussed and the children are asked to check or ask their parents if their home has smokedetectors and a fire extinguisher.
Then the children are told about the emergency line and learn a way to memorize theemergency number 1-1-2. Then the children see the fire man take on his protective suitand his smoke equipment on to see how a fire man would look and how a fire man wouldsound like if ever in the need of help. They are told that they always come to help andshould never be afraid of one.
69

Icelandic program for 5 year old children
At last the group goes outside to take a look at the ambulance or fire truck they ar-rived in. The children get some material with pictures to color and information for theparents.
This project has been a success, it has become very welcomed among the daycares andthey claim to be more aware of fire safety after the yearly reminder. According to responseto the fire department from parents it is also likely to have good affect on smoke detectorinstallation in homes, although not proven.
The fire department also visits every class with eight year old children annually. Theyreceive some general fire safety education and get a small story book about Flame andEmber and their adventures. The book also includes useful information on fire safety inhomes.
The school project for eight year old children started several years before the daycareproject for five year old children. Although not investigated, it can be mentioned thatthe fire department felt a jump up in level of knowledge, when the first children receivingeducation in their daycare, came through to the school education programmes.
70 Department of Civil Engineering - Technical University of Denmark
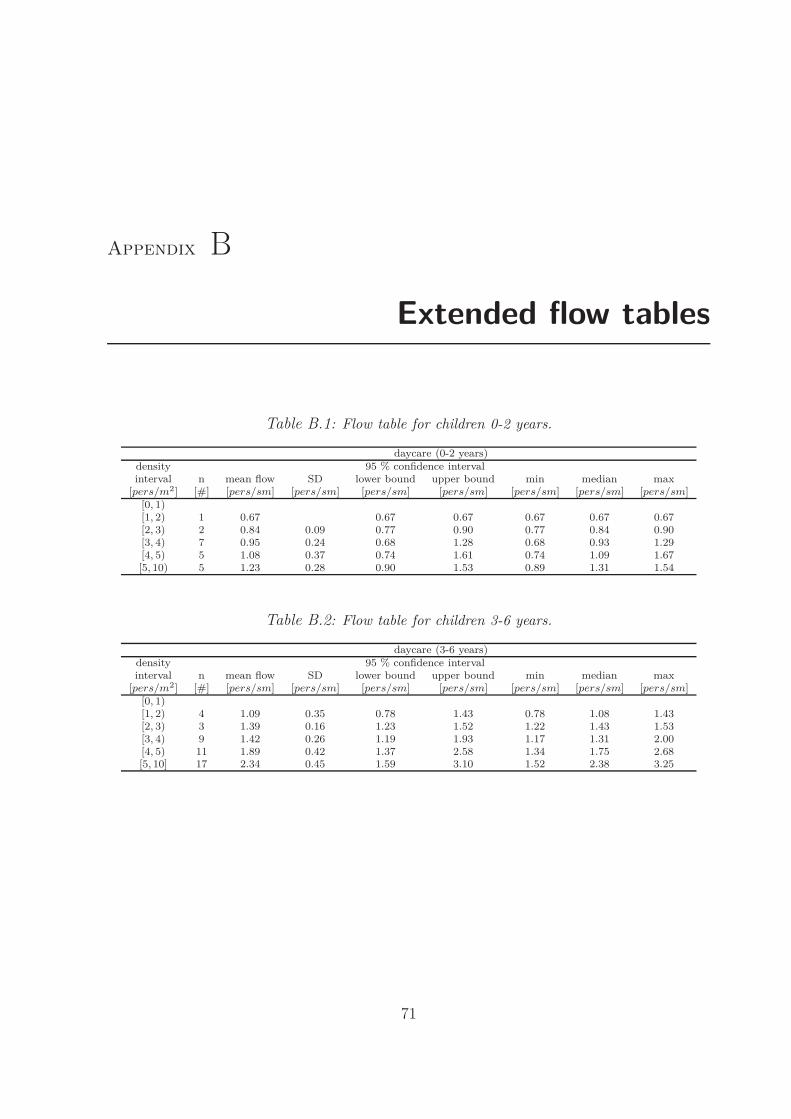
Appendix B
Extended flow tables
Table B.1: Flow table for children 0-2 years.
daycare (0-2 years)density 95 % confidence intervalinterval n mean flow SD lower bound upper bound min median max
[pers/m2] [#] [pers/sm] [pers/sm] [pers/sm] [pers/sm] [pers/sm] [pers/sm] [pers/sm][0, 1)[1, 2) 1 0.67 0.67 0.67 0.67 0.67 0.67[2, 3) 2 0.84 0.09 0.77 0.90 0.77 0.84 0.90[3, 4) 7 0.95 0.24 0.68 1.28 0.68 0.93 1.29[4, 5) 5 1.08 0.37 0.74 1.61 0.74 1.09 1.67[5, 10) 5 1.23 0.28 0.90 1.53 0.89 1.31 1.54
Table B.2: Flow table for children 3-6 years.
daycare (3-6 years)density 95 % confidence intervalinterval n mean flow SD lower bound upper bound min median max
[pers/m2] [#] [pers/sm] [pers/sm] [pers/sm] [pers/sm] [pers/sm] [pers/sm] [pers/sm][0, 1)[1, 2) 4 1.09 0.35 0.78 1.43 0.78 1.08 1.43[2, 3) 3 1.39 0.16 1.23 1.52 1.22 1.43 1.53[3, 4) 9 1.42 0.26 1.19 1.93 1.17 1.31 2.00[4, 5) 11 1.89 0.42 1.37 2.58 1.34 1.75 2.68[5, 10] 17 2.34 0.45 1.59 3.10 1.52 2.38 3.25
71

Extended flow tables
Table B.3: Flow table for children 6-8 years.
school (6-8 years)density 95 % confidence intervalinterval n mean flow SD lower bound upper bound min median max
[pers/m2] [#] [pers/sm] [pers/sm] [pers/sm] [pers/sm] [pers/sm] [pers/sm] [pers/sm][0, 1)[1, 2) 4 1.09 0.35 0.78 1.43 0.78 1.08 1.43[2, 3) 3 1.39 0.16 1.23 1.52 1.22 1.43 1.53[3, 4) 9 1.42 0.26 1.19 1.93 1.17 1.31 2.00[4, 5) 11 1.89 0.42 1.37 2.58 1.34 1.75 2.68[5, 10) 17 2.34 0.45 1.59 3.10 1.52 2.38 3.25
Table B.4: Flow table for children 9-11 years.
school (9-11 years)density 95 % confidence intervalinterval n mean flow SD lower bound upper bound min median max
[pers/m2] [#] [pers/sm] [pers/sm] [pers/sm] [pers/sm] [pers/sm] [pers/sm] [pers/sm][0, 1)[1, 2) 4 1.09 0.35 0.78 1.43 0.78 1.08 1.43[2, 3) 3 1.39 0.16 1.23 1.52 1.22 1.43 1.53[3, 4) 9 1.42 0.26 1.19 1.93 1.17 1.31 2.00[4, 5) 11 1.89 0.42 1.37 2.58 1.34 1.75 2.68[5, 10) 17 2.34 0.45 1.59 3.10 1.52 2.38 3.25
Table B.5: Flow table for children 12-15 years.
school (12-15 years)density 95 % confidence intervalinterval n mean flow SD lower bound upper bound min median max
[pers/m2] [#] [pers/sm] [pers/sm] [pers/sm] [pers/sm] [pers/sm] [pers/sm] [pers/sm][0, 1)[1, 2) 4 1.09 0.35 0.78 1.43 0.78 1.08 1.43[2, 3) 3 1.39 0.16 1.23 1.52 1.22 1.43 1.53[3, 4) 9 1.42 0.26 1.19 1.93 1.17 1.31 2.00[4, 5) 11 1.89 0.42 1.37 2.58 1.34 1.75 2.68[5, 10) 17 2.34 0.45 1.59 3.10 1.52 2.38 3.25
Table B.6: Flow table for children 6 years.
school (6 years)density 95 % confidence intervalinterval n mean flow SD lower bound upper bound min median max
[pers/m2] [#] [pers/sm] [pers/sm] [pers/sm] [pers/sm] [pers/sm] [pers/sm] [pers/sm][0, 1)[1, 2) 2 1.82 0.55 1.45 2.19 1.43 1.82 2.21[2, 3) 5 2.00 0.32 1.62 2.40 1.59 1.94 2.42[3, 4) 4 1.21 0.56 0.54 1.80 0.48 1.25 1.84[4, 5)[5, 10)
72 Department of Civil Engineering - Technical University of Denmark
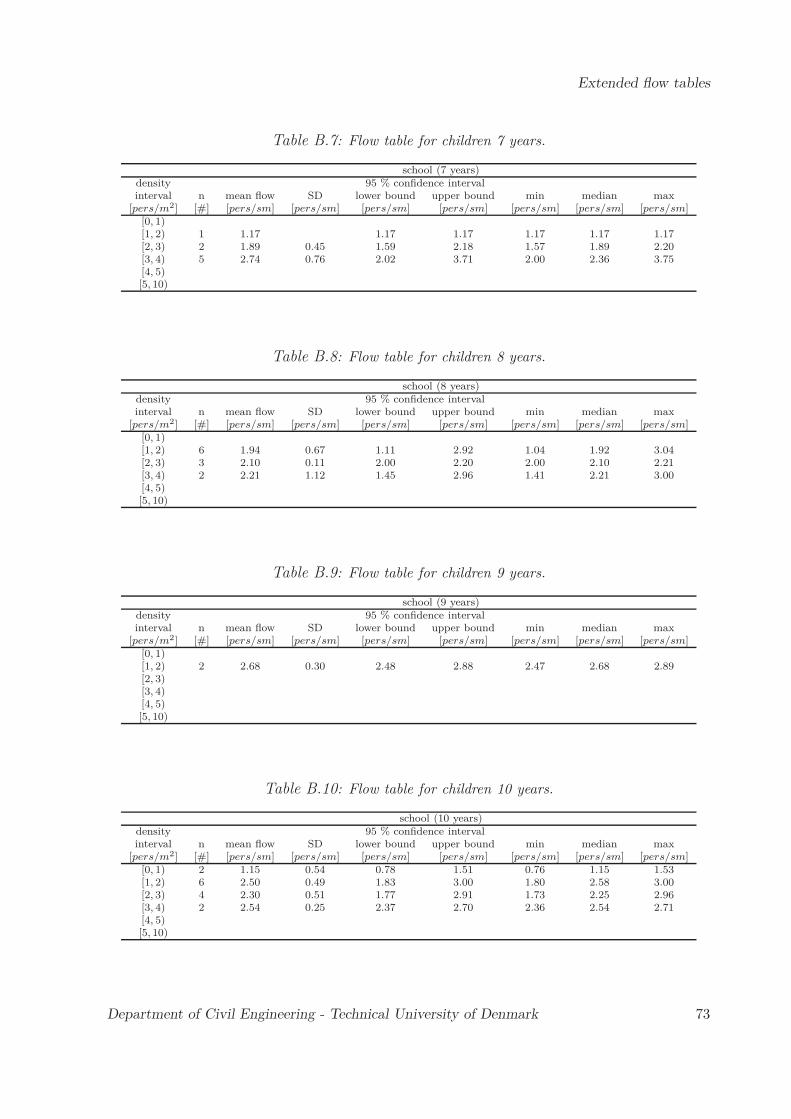
Extended flow tables
Table B.7: Flow table for children 7 years.
school (7 years)density 95 % confidence intervalinterval n mean flow SD lower bound upper bound min median max
[pers/m2] [#] [pers/sm] [pers/sm] [pers/sm] [pers/sm] [pers/sm] [pers/sm] [pers/sm][0, 1)[1, 2) 1 1.17 1.17 1.17 1.17 1.17 1.17[2, 3) 2 1.89 0.45 1.59 2.18 1.57 1.89 2.20[3, 4) 5 2.74 0.76 2.02 3.71 2.00 2.36 3.75[4, 5)[5, 10)
Table B.8: Flow table for children 8 years.
school (8 years)density 95 % confidence intervalinterval n mean flow SD lower bound upper bound min median max
[pers/m2] [#] [pers/sm] [pers/sm] [pers/sm] [pers/sm] [pers/sm] [pers/sm] [pers/sm][0, 1)[1, 2) 6 1.94 0.67 1.11 2.92 1.04 1.92 3.04[2, 3) 3 2.10 0.11 2.00 2.20 2.00 2.10 2.21[3, 4) 2 2.21 1.12 1.45 2.96 1.41 2.21 3.00[4, 5)[5, 10)
Table B.9: Flow table for children 9 years.
school (9 years)density 95 % confidence intervalinterval n mean flow SD lower bound upper bound min median max
[pers/m2] [#] [pers/sm] [pers/sm] [pers/sm] [pers/sm] [pers/sm] [pers/sm] [pers/sm][0, 1)[1, 2) 2 2.68 0.30 2.48 2.88 2.47 2.68 2.89[2, 3)[3, 4)[4, 5)[5, 10)
Table B.10: Flow table for children 10 years.
school (10 years)density 95 % confidence intervalinterval n mean flow SD lower bound upper bound min median max
[pers/m2] [#] [pers/sm] [pers/sm] [pers/sm] [pers/sm] [pers/sm] [pers/sm] [pers/sm][0, 1) 2 1.15 0.54 0.78 1.51 0.76 1.15 1.53[1, 2) 6 2.50 0.49 1.83 3.00 1.80 2.58 3.00[2, 3) 4 2.30 0.51 1.77 2.91 1.73 2.25 2.96[3, 4) 2 2.54 0.25 2.37 2.70 2.36 2.54 2.71[4, 5)[5, 10)
Department of Civil Engineering - Technical University of Denmark 73

Extended flow tables
Table B.11: Flow table for children 11 years.
school (11 years)density 95 % confidence intervalinterval n mean flow SD lower bound upper bound min median max
[pers/m2] [#] [pers/sm] [pers/sm] [pers/sm] [pers/sm] [pers/sm] [pers/sm] [pers/sm][0, 1) 2 1.15 0.54 0.78 1.51 0.76 1.15 1.53[1, 2) 5 1.89 0.99 0.77 3.14 0.72 1.80 3.21[2, 3) 3 2.22 0.46 1.76 2.62 1.73 2.29 2.64[3, 4) 2 2.54 0.25 2.37 2.70 2.36 2.54 2.71[4, 5)[5, 10)
Table B.12: Flow table for children 12 years.
school (12 years)density 95 % confidence intervalinterval n mean flow SD lower bound upper bound min median max
[pers/m2] [#] [pers/sm] [pers/sm] [pers/sm] [pers/sm] [pers/sm] [pers/sm] [pers/sm][0, 1) 1 1.74 1.74 1.74 1.74 1.74 1.74[1, 2) 3 1.84 0.16 1.68 1.97 1.67 1.88 1.98[2, 3) 3 1.80 0.46 1.43 2.29 1.42 1.67 2.32[3, 4) 1 2.27 2.27 2.27 2.27 2.27 2.27[4, 5)[5, 10)
Table B.13: Flow table for children 13 years.
school (13 years)density 95 % confidence intervalinterval n mean flow SD lower bound upper bound min median max
[pers/m2] [#] [pers/sm] [pers/sm] [pers/sm] [pers/sm] [pers/sm] [pers/sm] [pers/sm][0, 1)[1, 2) 6 1.75 0.24 1.44 2.04 1.41 1.70 2.05[2, 3) 2 2.21 0.17 2.10 2.32 2.09 2.21 2.33[3, 4)[4, 5)[5, 10)
Table B.14: Flow table for children 14 years.
school (14 years)density 95 % confidence intervalinterval n mean flow SD lower bound upper bound min median max
[pers/m2] [#] [pers/sm] [pers/sm] [pers/sm] [pers/sm] [pers/sm] [pers/sm] [pers/sm][0, 1)[1, 2) 1 1.72 1.72 1.72 1.72 1.72 1.72[2, 3) 2 1.90 0.41 1.62 2.18 1.61 1.90 2.19[3, 4)[4, 5)[5, 10)
74 Department of Civil Engineering - Technical University of Denmark

Extended flow tables
Table B.15: Flow table for children 15 years.
school (15 years)density 95 % confidence intervalinterval n mean flow SD lower bound upper bound min median max
[pers/m2] [#] [pers/sm] [pers/sm] [pers/sm] [pers/sm] [pers/sm] [pers/sm] [pers/sm][0, 1)[1, 2) 2 2.09 0.08 2.04 2.15 2.04 2.09 2.15[2, 3) 1 2.16 2.16 2.16 2.16 2.16 2.16[3, 4)[4, 5)[5, 10)
Table B.16: Flow table for children 0-6 years.
daycare (0-6 years)density 95 % confidence intervalinterval n mean flow SD lower bound upper bound min median max
[pers/m2] [#] [pers/sm] [pers/sm] [pers/sm] [pers/sm] [pers/sm] [pers/sm] [pers/sm][0, 1)[1, 2) 5 1.01 0.36 0.68 1.42 0.67 0.80 1.43[2, 3) 5 1.17 0.33 0.78 1.52 0.77 1.22 1.53[3, 4) 17 1.20 0.34 0.68 1.87 0.68 1.25 2.00[4, 5) 17 1.62 0.54 0.76 2.52 0.74 1.67 2.68[5, 10] 25 1.99 0.65 0.90 3.02 0.89 2.15 3.25
Table B.17: Flow table for children 6-15 years.
school (6-15 years)density 95 % confidence intervalinterval n mean flow SD lower bound upper bound min median max
[pers/m2] [#] [pers/sm] [pers/sm] [pers/sm] [pers/sm] [pers/sm] [pers/sm] [pers/sm][0, 1) 5 1.26 0.47 0.76 1.72 0.76 1.53 1.74[1, 2) 39 1.98 0.57 1.02 3.05 0.72 1.92 3.21[2, 3) 30 2.22 0.61 1.53 3.96 1.42 2.20 4.00[3, 4) 21 2.13 0.79 0.85 3.54 0.48 2.27 3.75[4, 5) 1 1.61 1.61 1.61 1.61 1.61 1.61[5, 10)
Department of Civil Engineering - Technical University of Denmark 75

Extended flow tables
76 Department of Civil Engineering - Technical University of Denmark

Appendix C
Extended speed tables
Table C.1: Travel speed down stairs for children 0-2 years.
daycare (0-2 years)density 95 % confidence intervalinterval n mean speed SD lower bound upper bound min median max
[pers/m2] [#] [m/s] [m/s] [m/s] [m/s] [m/s] [m/s] [m/s][0, 1) 46 0.19 0.10 0.06 0.38 0.06 0.18 0.50[1, 2) 365 0.31 0.27 0.06 1.04 0.02 0.20 1.79[2, 3) 400 0.27 0.22 0.05 0.88 0.03 0.21 1.76[3, 4) 195 0.20 0.17 0.04 0.68 0.03 0.15 1.02[4, 5) 64 0.16 0.09 0.06 0.39 0.04 0.14 0.49[5, 10) 19 0.14 0.06 0.07 0.29 0.07 0.12 0.32
Table C.2: Travel speed down stairs for children 3-6 years.
daycare (3-6 years)density 95 % confidence intervalinterval n mean speed SD lower bound upper bound min median max
[pers/m2] [#] [m/s] [m/s] [m/s] [m/s] [m/s] [m/s] [m/s][0, 1) 65 0.41 0.28 0.07 1.19 0.06 0.36 1.36[1, 2) 203 0.39 0.19 0.13 0.75 0.04 0.34 1.16[2, 3) 112 0.37 0.15 0.14 0.68 0.08 0.35 0.68[3, 4) 87 0.28 0.11 0.14 0.57 0.11 0.26 0.67[4, 5) 53 0.32 0.12 0.16 0.50 0.16 0.30 0.95[5, 10) 27 0.34 0.13 0.17 0.59 0.16 0.29 0.63
77
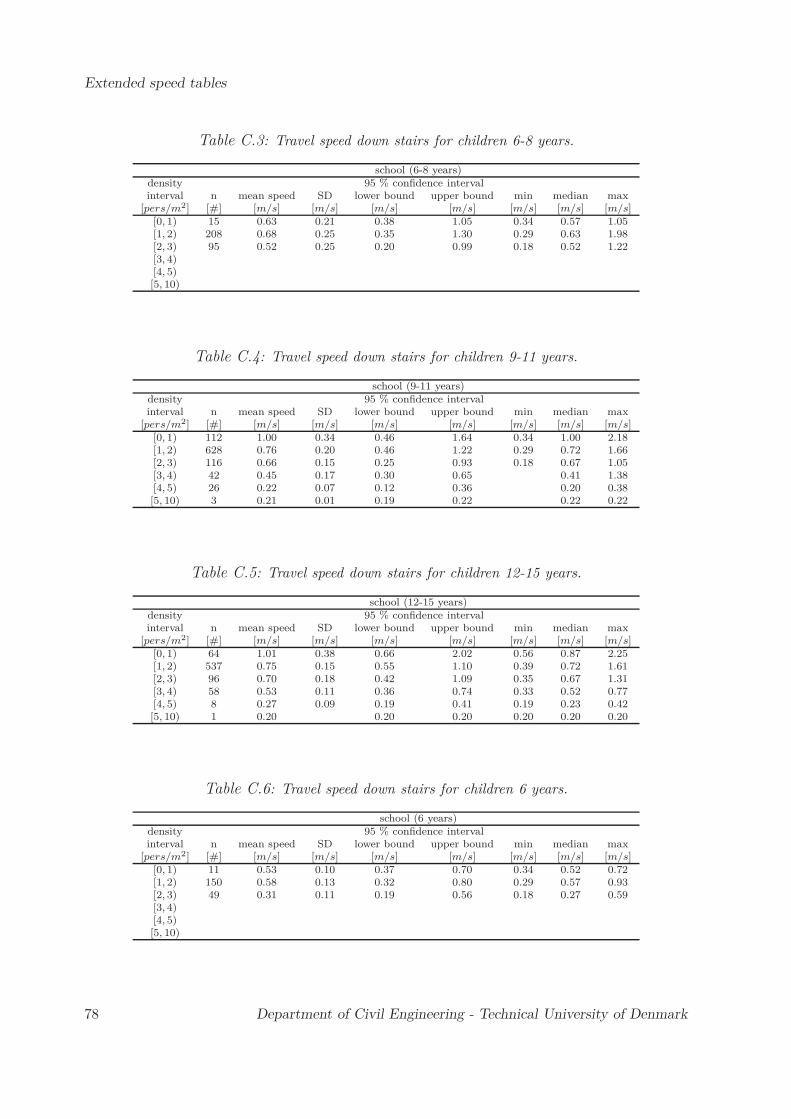
Extended speed tables
Table C.3: Travel speed down stairs for children 6-8 years.
school (6-8 years)density 95 % confidence intervalinterval n mean speed SD lower bound upper bound min median max
[pers/m2] [#] [m/s] [m/s] [m/s] [m/s] [m/s] [m/s] [m/s][0, 1) 15 0.63 0.21 0.38 1.05 0.34 0.57 1.05[1, 2) 208 0.68 0.25 0.35 1.30 0.29 0.63 1.98[2, 3) 95 0.52 0.25 0.20 0.99 0.18 0.52 1.22[3, 4)[4, 5)[5, 10)
Table C.4: Travel speed down stairs for children 9-11 years.
school (9-11 years)density 95 % confidence intervalinterval n mean speed SD lower bound upper bound min median max
[pers/m2] [#] [m/s] [m/s] [m/s] [m/s] [m/s] [m/s] [m/s][0, 1) 112 1.00 0.34 0.46 1.64 0.34 1.00 2.18[1, 2) 628 0.76 0.20 0.46 1.22 0.29 0.72 1.66[2, 3) 116 0.66 0.15 0.25 0.93 0.18 0.67 1.05[3, 4) 42 0.45 0.17 0.30 0.65 0.41 1.38[4, 5) 26 0.22 0.07 0.12 0.36 0.20 0.38[5, 10) 3 0.21 0.01 0.19 0.22 0.22 0.22
Table C.5: Travel speed down stairs for children 12-15 years.
school (12-15 years)density 95 % confidence intervalinterval n mean speed SD lower bound upper bound min median max
[pers/m2] [#] [m/s] [m/s] [m/s] [m/s] [m/s] [m/s] [m/s][0, 1) 64 1.01 0.38 0.66 2.02 0.56 0.87 2.25[1, 2) 537 0.75 0.15 0.55 1.10 0.39 0.72 1.61[2, 3) 96 0.70 0.18 0.42 1.09 0.35 0.67 1.31[3, 4) 58 0.53 0.11 0.36 0.74 0.33 0.52 0.77[4, 5) 8 0.27 0.09 0.19 0.41 0.19 0.23 0.42[5, 10) 1 0.20 0.20 0.20 0.20 0.20 0.20
Table C.6: Travel speed down stairs for children 6 years.
school (6 years)density 95 % confidence intervalinterval n mean speed SD lower bound upper bound min median max
[pers/m2] [#] [m/s] [m/s] [m/s] [m/s] [m/s] [m/s] [m/s][0, 1) 11 0.53 0.10 0.37 0.70 0.34 0.52 0.72[1, 2) 150 0.58 0.13 0.32 0.80 0.29 0.57 0.93[2, 3) 49 0.31 0.11 0.19 0.56 0.18 0.27 0.59[3, 4)[4, 5)[5, 10)
78 Department of Civil Engineering - Technical University of Denmark

Extended speed tables
Table C.7: Travel speed down stairs for children 7 years.
school (7 years)density 95 % confidence intervalinterval n mean speed SD lower bound upper bound min median max
[pers/m2] [#] [m/s] [m/s] [m/s] [m/s] [m/s] [m/s] [m/s][0, 1)[1, 2) 17 0.83 0.19 0.57 1.18 0.55 0.83 1.22[2, 3) 46 0.74 0.15 0.55 0.99 0.51 0.69 1.22[3, 4)[4, 5)[5, 10)
Table C.8: Travel speed down stairs for children 8 years.
school (8 years)density 95 % confidence intervalinterval n mean speed SD lower bound upper bound min median max
[pers/m2] [#] [m/s] [m/s] [m/s] [m/s] [m/s] [m/s] [m/s][0, 1) 4 0.92 0.17 0.70 1.05 0.69 0.97 1.05[1, 2) 41 1.00 0.28 0.63 1.58 0.61 0.93 1.98[2, 3)[3, 4)[4, 5)[5, 10)
Table C.9: Travel speed down stairs for children 9 years.
school (9 years)density 95 % confidence intervalinterval n mean speed SD lower bound upper bound min median max
[pers/m2] [#] [m/s] [m/s] [m/s] [m/s] [m/s] [m/s] [m/s][0, 1)[1, 2) 28 0.75 0.16 0.53 1.11 0.53 0.76 1.20[2, 3)[3, 4)[4, 5)[5, 10)
Table C.10: Travel speed down stairs for children 10 years.
school (10 years)density 95 % confidence intervalinterval n mean speed SD lower bound upper bound min median max
[pers/m2] [#] [m/s] [m/s] [m/s] [m/s] [m/s] [m/s] [m/s][0, 1) 33 1.00 0.26 0.69 1.64 0.66 0.92 1.64[1, 2) 189 0.83 0.16 0.54 1.16 0.48 0.81 1.66[2, 3) 65 0.71 0.12 0.52 0.95 0.49 0.69 1.05[3, 4) 17 0.53 0.24 0.32 1.09 0.29 0.44 1.38[4, 5) 8 0.27 0.09 0.12 0.37 0.11 0.29 0.38[5, 10) 1 0.22 0.22 0.22 0.22 0.22 0.22
Department of Civil Engineering - Technical University of Denmark 79

Extended speed tables
Table C.11: Travel speed down stairs for children 11 years.
school (11 years)density 95 % confidence intervalinterval n mean speed SD lower bound upper bound min median max
[pers/m2] [#] [m/s] [m/s] [m/s] [m/s] [m/s] [m/s] [m/s][0, 1) 79 1.00 0.37 0.42 1.65 0.39 1.06 2.18[1, 2) 411 0.72 0.21 0.40 1.25 0.23 0.67 1.58[2, 3) 51 0.60 0.17 0.24 0.86 0.19 0.62 0.94[3, 4) 25 0.39 0.05 0.31 0.49 0.30 0.40 0.52[4, 5) 18 0.20 0.04 0.14 0.29 0.13 0.19 0.30[5, 10) 2 0.21 0.02 0.19 0.22 0.19 0.21 0.22
,
Table C.12: Travel speed down stairs for children 12 years.
school (12 years)density 95 % confidence intervalinterval n mean speed SD lower bound upper bound min median max
[pers/m2] [#] [m/s] [m/s] [m/s] [m/s] [m/s] [m/s] [m/s][0, 1) 29 1.18 0.48 0.61 2.18 0.56 1.02 2.25[1, 2) 127 0.79 0.19 0.58 1.44 0.52 0.73 1.61[2, 3) 41 0.76 0.19 0.52 1.09 0.51 0.71 1.31[3, 4) 22 0.55 0.12 0.37 0.76 0.36 0.56 0.77[4, 5) 8 0.27 0.09 0.19 0.41 0.19 0.23 0.42[5, 10) 1 0.20 0.20 0.20 0.20 0.20 0.20
Table C.13: Travel speed down stairs for children 13 years.
school (13 years)density 95 % confidence intervalinterval n mean speed SD lower bound upper bound min median max
[pers/m2] [#] [m/s] [m/s] [m/s] [m/s] [m/s] [m/s] [m/s][0, 1) 17 0.89 0.21 0.68 1.37 0.68 0.84 1.49[1, 2) 184 0.73 0.12 0.53 0.97 0.39 0.72 1.29[2, 3) 15 0.65 0.08 0.56 0.82 0.56 0.64 0.84[3, 4)[4, 5)[5, 10)
Table C.14: Travel speed down stairs for children 14 years.
school (14 years)density 95 % confidence intervalinterval n mean speed SD lower bound upper bound min median max
[pers/m2] [#] [m/s] [m/s] [m/s] [m/s] [m/s] [m/s] [m/s][0, 1) 14 0.88 0.16 0.70 1.19 0.70 0.85 1.22[1, 2) 129 0.73 0.14 0.55 1.07 0.44 0.70 1.39[2, 3) 17 0.64 0.20 0.36 0.98 0.35 0.60 1.01[3, 4) 30 0.50 0.10 0.35 0.69 0.33 0.49 0.73[4, 5)[5, 10)
80 Department of Civil Engineering - Technical University of Denmark
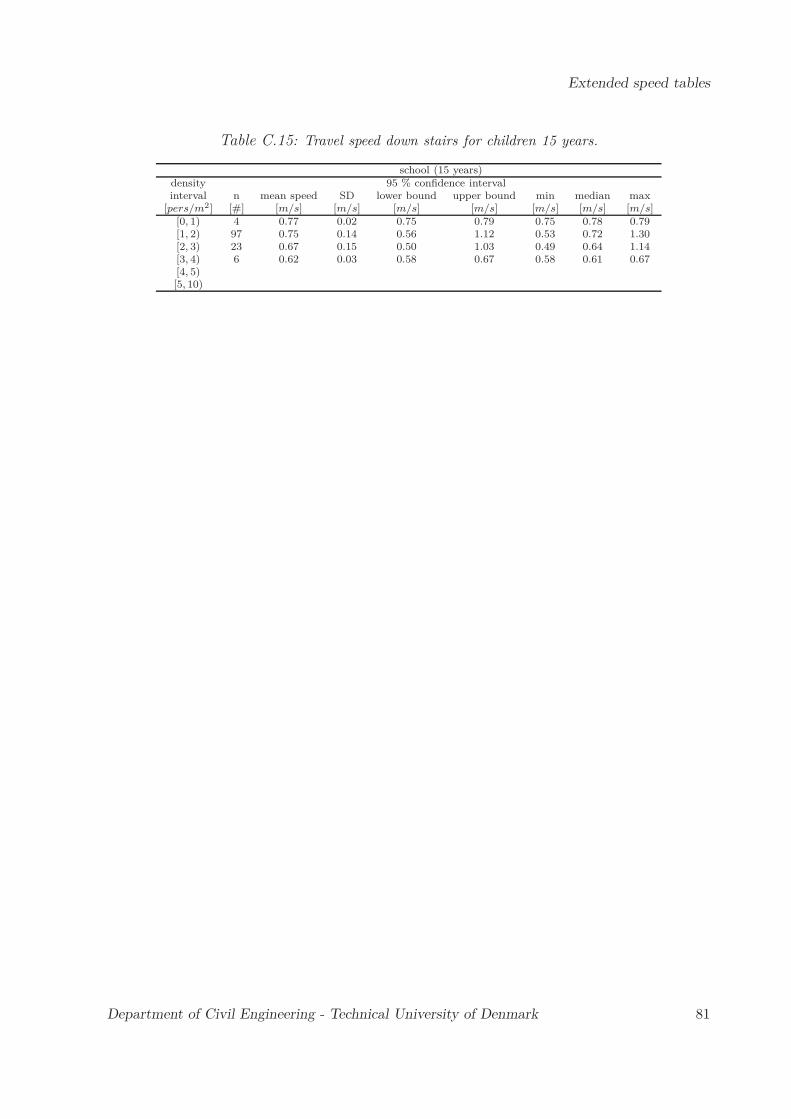
Extended speed tables
Table C.15: Travel speed down stairs for children 15 years.
school (15 years)density 95 % confidence intervalinterval n mean speed SD lower bound upper bound min median max
[pers/m2] [#] [m/s] [m/s] [m/s] [m/s] [m/s] [m/s] [m/s][0, 1) 4 0.77 0.02 0.75 0.79 0.75 0.78 0.79[1, 2) 97 0.75 0.14 0.56 1.12 0.53 0.72 1.30[2, 3) 23 0.67 0.15 0.50 1.03 0.49 0.64 1.14[3, 4) 6 0.62 0.03 0.58 0.67 0.58 0.61 0.67[4, 5)[5, 10)
Department of Civil Engineering - Technical University of Denmark 81
Extended speed tables
82 Department of Civil Engineering - Technical University of Denmark

List of Figures
3.1 Different mounting solutions for cameras during fire drills. . . . . . . . . . 173.2 A frequently used flow curve fitted for different use [16]. . . . . . . . . . . . 203.3 A frequently used travel speed curve fitted for different use [16]. . . . . . . 21
4.1 Examples of doorknobs located out of reach for children. . . . . . . . . . . 244.2 Data points showing flow through doors in daycares and schools with re-
spect to density. Reference curve on adult’s flow from Nelson and Mowrer [16] 294.3 Boxplots showing flow through doors for the twelve age variables. . . . . . 314.4 The complete data set presenting travel speed down stairs vs. density for
the twelve age categories (age in years is noted above each graph). . . . . . 344.5 Boxplots showing travel speed down stairs with respect to density group
for the twelve age variables. . . . . . . . . . . . . . . . . . . . . . . . . . . 354.6 Boxplots showing travel speed down stairs with respect to age group and
level of assistance. . . . . . . . . . . . . . . . . . . . . . . . . . . . . . . . . 404.7 Boxplots showing travel speed down stairs with respect to age group and
level of assistance for each density interval. . . . . . . . . . . . . . . . . . . 414.8 Boxplots showing travel speed down stairs with respect to the handrail used. 434.9 Boxplots showing travel speed down stairs with respect gender and level of
assistance. . . . . . . . . . . . . . . . . . . . . . . . . . . . . . . . . . . . . 454.10 Boxplots showing travel speed down stairs with respect gender and level of
assistance. . . . . . . . . . . . . . . . . . . . . . . . . . . . . . . . . . . . . 464.11 Snapshots taken every 20 seconds on the platform in a daycare for children
0-2 years on fourth floor. . . . . . . . . . . . . . . . . . . . . . . . . . . . . 52
83

List of Figures
84 Department of Civil Engineering - Technical University of Denmark
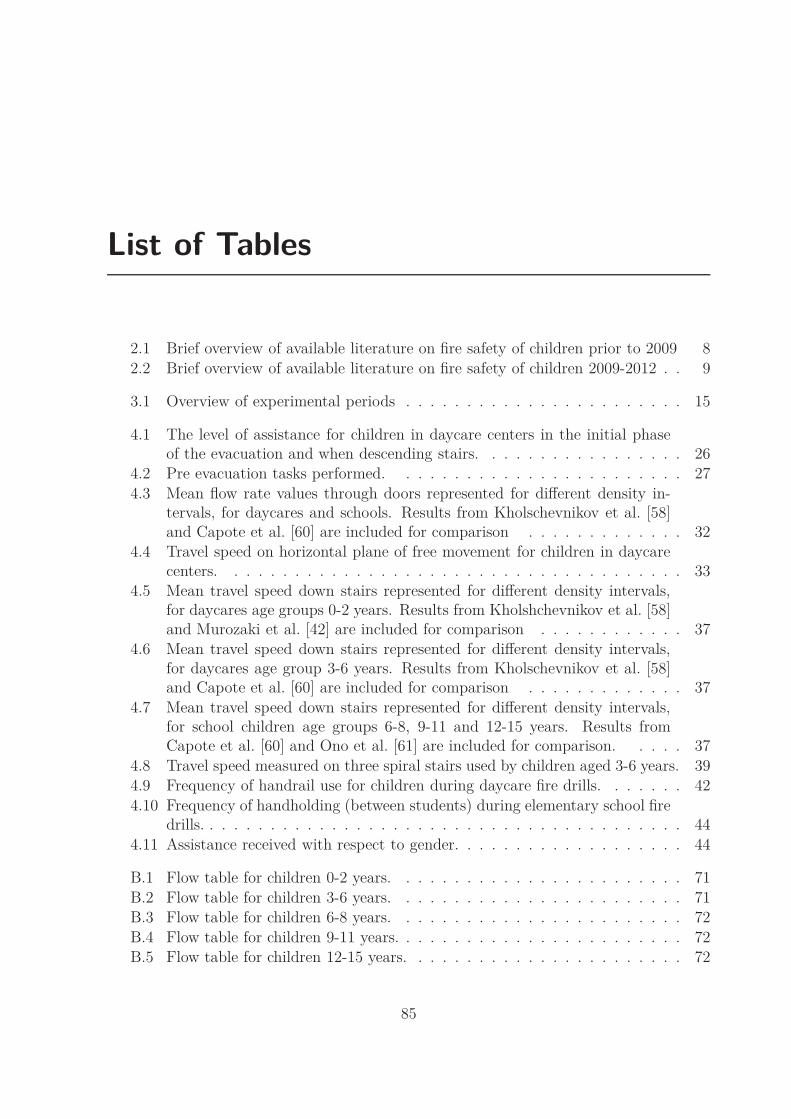
List of Tables
2.1 Brief overview of available literature on fire safety of children prior to 2009 82.2 Brief overview of available literature on fire safety of children 2009-2012 . . 9
3.1 Overview of experimental periods . . . . . . . . . . . . . . . . . . . . . . . 15
4.1 The level of assistance for children in daycare centers in the initial phaseof the evacuation and when descending stairs. . . . . . . . . . . . . . . . . 26
4.2 Pre evacuation tasks performed. . . . . . . . . . . . . . . . . . . . . . . . 274.3 Mean flow rate values through doors represented for different density in-
tervals, for daycares and schools. Results from Kholschevnikov et al. [58]and Capote et al. [60] are included for comparison . . . . . . . . . . . . . 32
4.4 Travel speed on horizontal plane of free movement for children in daycarecenters. . . . . . . . . . . . . . . . . . . . . . . . . . . . . . . . . . . . . . 33
4.5 Mean travel speed down stairs represented for different density intervals,for daycares age groups 0-2 years. Results from Kholshchevnikov et al. [58]and Murozaki et al. [42] are included for comparison . . . . . . . . . . . . 37
4.6 Mean travel speed down stairs represented for different density intervals,for daycares age group 3-6 years. Results from Kholschevnikov et al. [58]and Capote et al. [60] are included for comparison . . . . . . . . . . . . . 37
4.7 Mean travel speed down stairs represented for different density intervals,for school children age groups 6-8, 9-11 and 12-15 years. Results fromCapote et al. [60] and Ono et al. [61] are included for comparison. . . . . 37
4.8 Travel speed measured on three spiral stairs used by children aged 3-6 years. 394.9 Frequency of handrail use for children during daycare fire drills. . . . . . . 424.10 Frequency of handholding (between students) during elementary school fire
drills. . . . . . . . . . . . . . . . . . . . . . . . . . . . . . . . . . . . . . . . 444.11 Assistance received with respect to gender. . . . . . . . . . . . . . . . . . . 44
B.1 Flow table for children 0-2 years. . . . . . . . . . . . . . . . . . . . . . . . 71B.2 Flow table for children 3-6 years. . . . . . . . . . . . . . . . . . . . . . . . 71B.3 Flow table for children 6-8 years. . . . . . . . . . . . . . . . . . . . . . . . 72B.4 Flow table for children 9-11 years. . . . . . . . . . . . . . . . . . . . . . . . 72B.5 Flow table for children 12-15 years. . . . . . . . . . . . . . . . . . . . . . . 72
85

List of Tables
B.6 Flow table for children 6 years. . . . . . . . . . . . . . . . . . . . . . . . . 72B.7 Flow table for children 7 years. . . . . . . . . . . . . . . . . . . . . . . . . 73B.8 Flow table for children 8 years. . . . . . . . . . . . . . . . . . . . . . . . . 73B.9 Flow table for children 9 years. . . . . . . . . . . . . . . . . . . . . . . . . 73B.10 Flow table for children 10 years. . . . . . . . . . . . . . . . . . . . . . . . . 73B.11 Flow table for children 11 years. . . . . . . . . . . . . . . . . . . . . . . . . 74B.12 Flow table for children 12 years. . . . . . . . . . . . . . . . . . . . . . . . . 74B.13 Flow table for children 13 years. . . . . . . . . . . . . . . . . . . . . . . . . 74B.14 Flow table for children 14 years. . . . . . . . . . . . . . . . . . . . . . . . . 74B.15 Flow table for children 15 years. . . . . . . . . . . . . . . . . . . . . . . . . 75B.16 Flow table for children 0-6 years. . . . . . . . . . . . . . . . . . . . . . . . 75B.17 Flow table for children 6-15 years. . . . . . . . . . . . . . . . . . . . . . . . 75
C.1 Travel speed down stairs for children 0-2 years. . . . . . . . . . . . . . . . . 77C.2 Travel speed down stairs for children 3-6 years. . . . . . . . . . . . . . . . . 77C.3 Travel speed down stairs for children 6-8 years. . . . . . . . . . . . . . . . . 78C.4 Travel speed down stairs for children 9-11 years. . . . . . . . . . . . . . . . 78C.5 Travel speed down stairs for children 12-15 years. . . . . . . . . . . . . . . 78C.6 Travel speed down stairs for children 6 years. . . . . . . . . . . . . . . . . . 78C.7 Travel speed down stairs for children 7 years. . . . . . . . . . . . . . . . . . 79C.8 Travel speed down stairs for children 8 years. . . . . . . . . . . . . . . . . . 79C.9 Travel speed down stairs for children 9 years. . . . . . . . . . . . . . . . . . 79C.10 Travel speed down stairs for children 10 years. . . . . . . . . . . . . . . . . 79C.11 Travel speed down stairs for children 11 years. . . . . . . . . . . . . . . . . 80C.12 Travel speed down stairs for children 12 years. . . . . . . . . . . . . . . . . 80C.13 Travel speed down stairs for children 13 years. . . . . . . . . . . . . . . . . 80C.14 Travel speed down stairs for children 14 years. . . . . . . . . . . . . . . . . 80C.15 Travel speed down stairs for children 15 years. . . . . . . . . . . . . . . . . 81
86 Department of Civil Engineering - Technical University of Denmark

PART II


Paper I
Paper I is an extended version of a paper presented at Pedestrian Evacuation Dynamics2010. It was published in a special issue of Fire Technology in 2012 (online in 2010).
89
Paper I
90 Department of Civil Engineering - Technical University of Denmark
Paper I
Department of Civil Engineering - Technical University of Denmark 91
Paper I
92 Department of Civil Engineering - Technical University of Denmark

Paper I
Department of Civil Engineering - Technical University of Denmark 93

Paper I
94 Department of Civil Engineering - Technical University of Denmark

Paper I
Department of Civil Engineering - Technical University of Denmark 95

Paper I
96 Department of Civil Engineering - Technical University of Denmark

Paper I
Department of Civil Engineering - Technical University of Denmark 97

Paper I
98 Department of Civil Engineering - Technical University of Denmark

Paper I
Department of Civil Engineering - Technical University of Denmark 99
Paper I
100 Department of Civil Engineering - Technical University of Denmark

Paper II
Paper II was presented at the 10th International Symposium on Fire Safety Science,Maryland 2011 and published in conference proceedings.
101

Paper II
102 Department of Civil Engineering - Technical University of Denmark

Paper II
Department of Civil Engineering - Technical University of Denmark 103

Paper II
104 Department of Civil Engineering - Technical University of Denmark
Paper II
Department of Civil Engineering - Technical University of Denmark 105
Paper II
106 Department of Civil Engineering - Technical University of Denmark

Paper II
Department of Civil Engineering - Technical University of Denmark 107

Paper II
108 Department of Civil Engineering - Technical University of Denmark

Paper II
Department of Civil Engineering - Technical University of Denmark 109
Paper II
110 Department of Civil Engineering - Technical University of Denmark

Paper II
Department of Civil Engineering - Technical University of Denmark 111
Paper II
112 Department of Civil Engineering - Technical University of Denmark

Paper II
Department of Civil Engineering - Technical University of Denmark 113
Paper II
114 Department of Civil Engineering - Technical University of Denmark
Paper III
Paper III focuses on evacuation of school children when descending stairs. It has beensubmitted to Fire and Materials.
115

Paper III
116 Department of Civil Engineering - Technical University of Denmark

Paper III
Department of Civil Engineering - Technical University of Denmark 117

Paper III
118 Department of Civil Engineering - Technical University of Denmark

Paper III
Department of Civil Engineering - Technical University of Denmark 119

Paper III
120 Department of Civil Engineering - Technical University of Denmark

Paper III
Department of Civil Engineering - Technical University of Denmark 121

Paper III
122 Department of Civil Engineering - Technical University of Denmark

Paper III
Department of Civil Engineering - Technical University of Denmark 123

Paper III
124 Department of Civil Engineering - Technical University of Denmark

Paper III
Department of Civil Engineering - Technical University of Denmark 125

Paper III
126 Department of Civil Engineering - Technical University of Denmark
Paper IV
Paper IV focuses on evacuation of children from daycare centers when descending stairs.It has been submitted to Fire Technology.
127

Paper IV
128 Department of Civil Engineering - Technical University of Denmark

Paper IV
Department of Civil Engineering - Technical University of Denmark 129
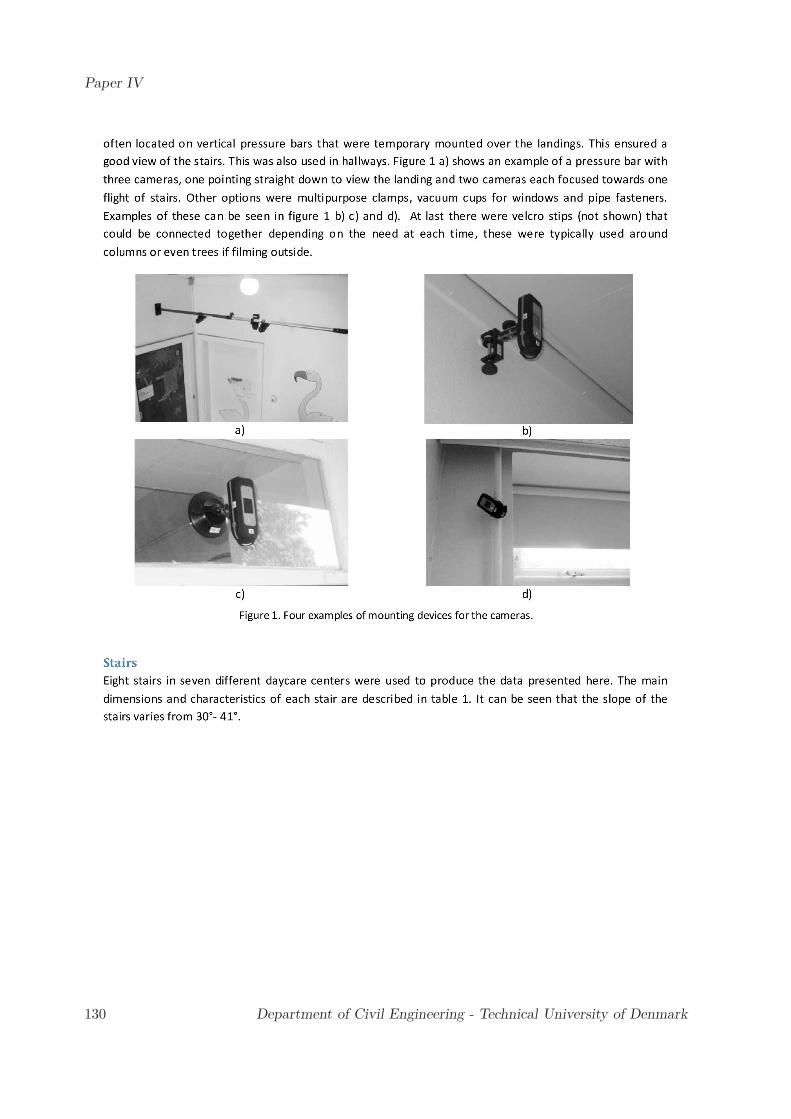
Paper IV
130 Department of Civil Engineering - Technical University of Denmark

Paper IV
Department of Civil Engineering - Technical University of Denmark 131

Paper IV
132 Department of Civil Engineering - Technical University of Denmark

Paper IV
Department of Civil Engineering - Technical University of Denmark 133

Paper IV
134 Department of Civil Engineering - Technical University of Denmark
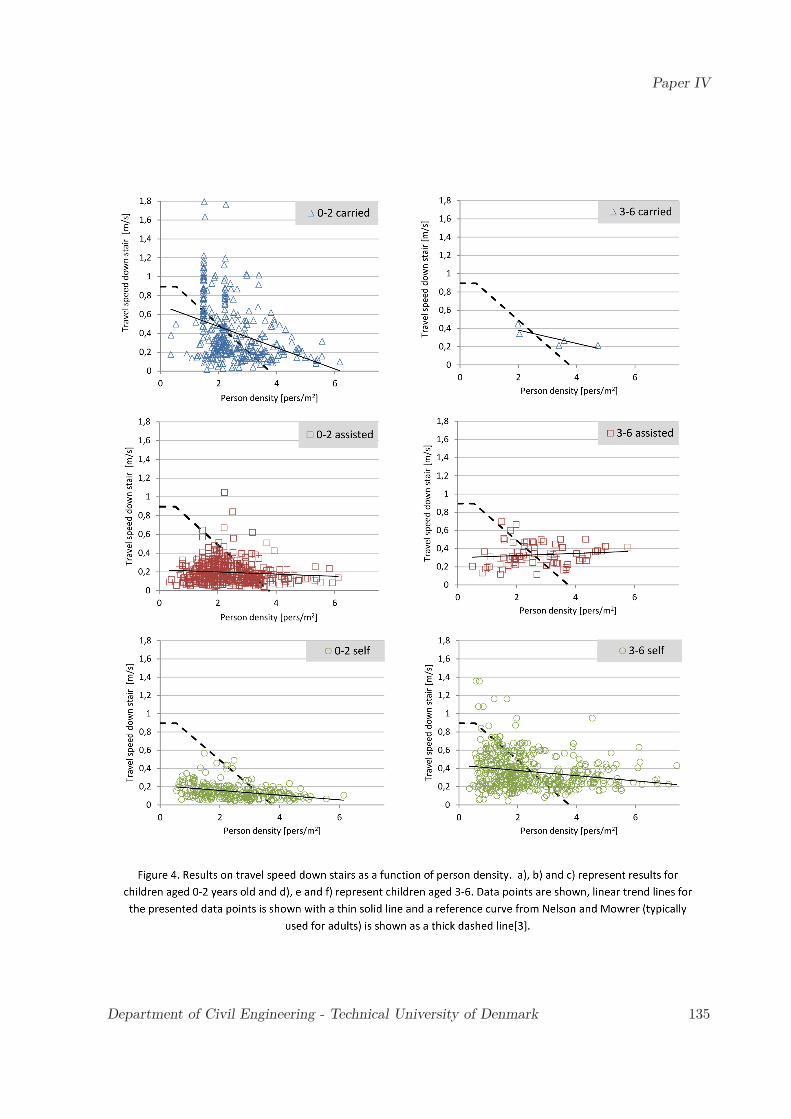
Paper IV
Department of Civil Engineering - Technical University of Denmark 135
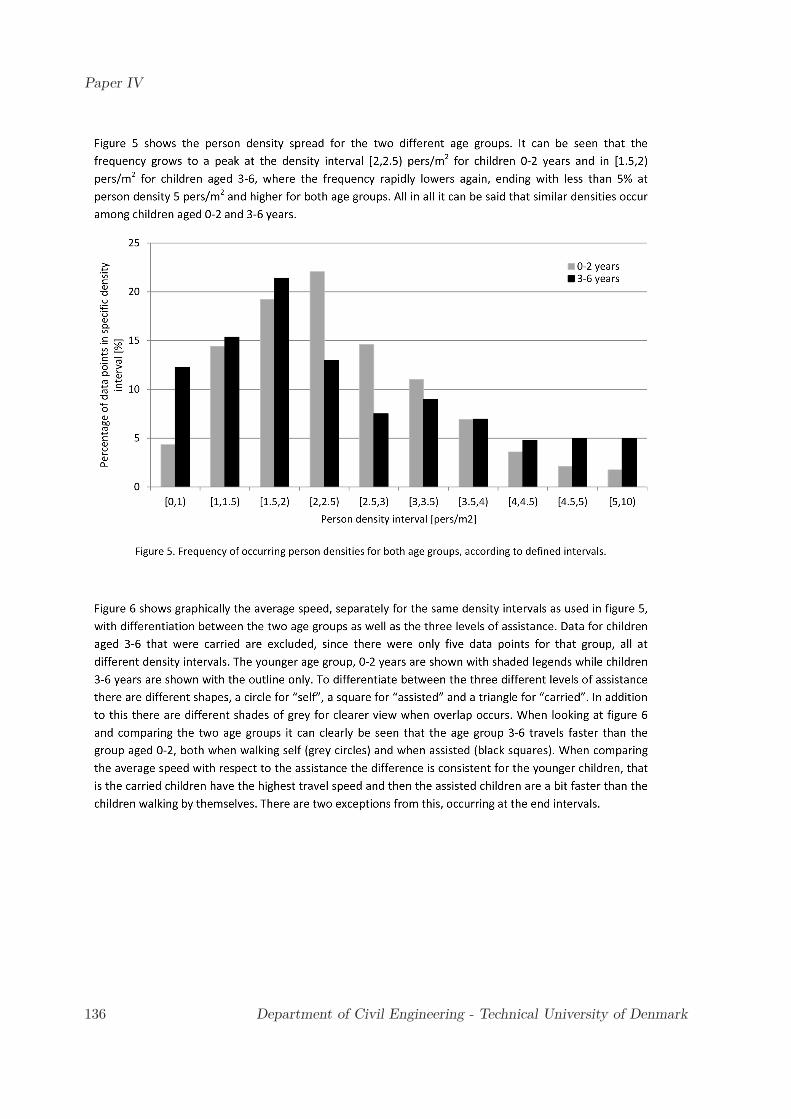
Paper IV
136 Department of Civil Engineering - Technical University of Denmark

Paper IV
Department of Civil Engineering - Technical University of Denmark 137
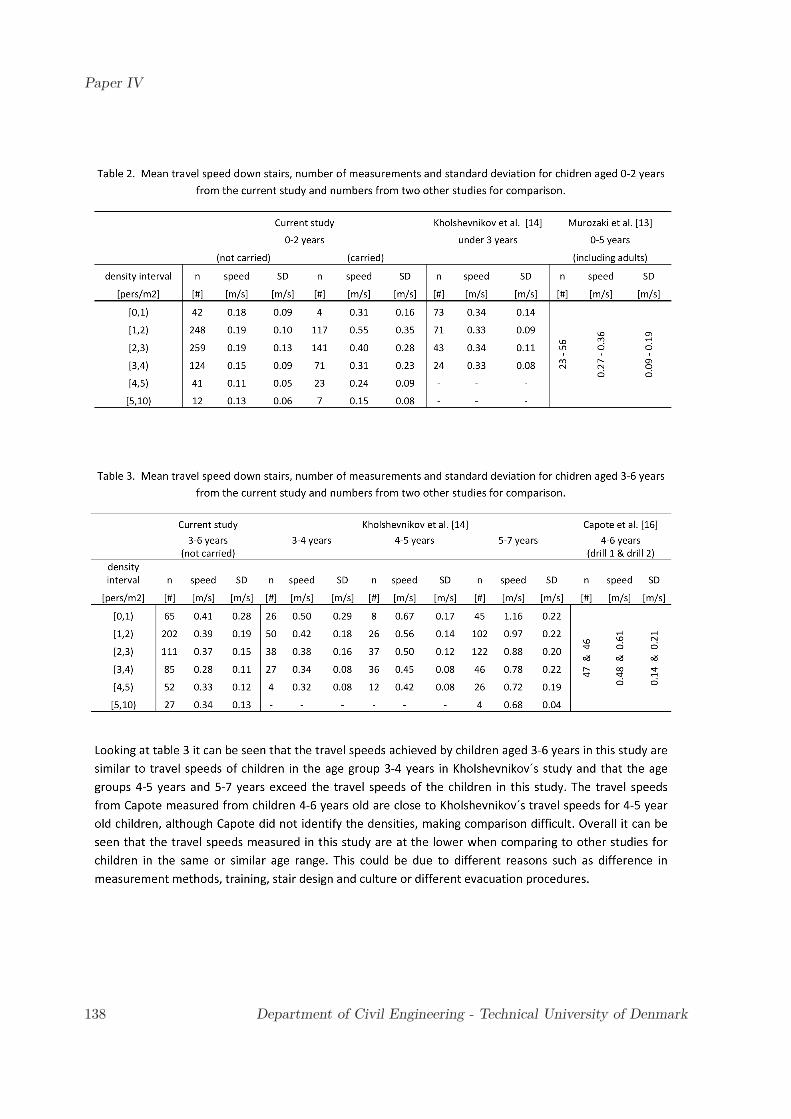
Paper IV
138 Department of Civil Engineering - Technical University of Denmark

Paper IV
Department of Civil Engineering - Technical University of Denmark 139
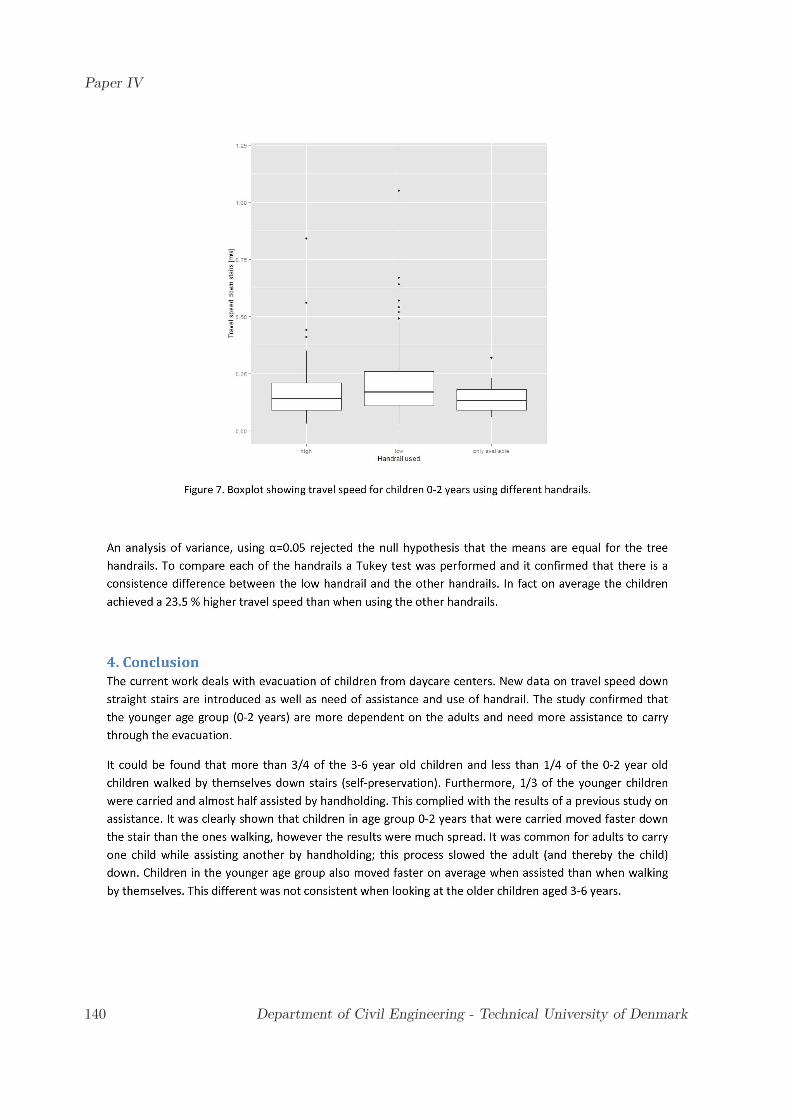
Paper IV
140 Department of Civil Engineering - Technical University of Denmark

Paper IV
Department of Civil Engineering - Technical University of Denmark 141
Paper IV
142 Department of Civil Engineering - Technical University of Denmark