Embed Size (px)
Citation preview
Evaluating a high rise building for passive house classifications Simulating and improving the Slovenian Eco
Silver House in European climates using PHPP
Martin Lundmark
Master thesis in Master of Science in Energy Engineering 30 credits EN1517
I
Summary As part of the EU project Energy Efficient Demo Multiresidential highrise Building (EE-highrise), this
thesis work evaluates and changes the Slovenian Eco Silver House (ESH) high rise building model in
order to see if it can be classifiable as a passive house in different European regions.
The purpose of this thesis work was to evaluate if the ESH could meet the European and Swedish
passive house classification in Sibernik, Ljubljana, Lund, Östersund, Sundsvall and Kiruna. The purpose
was also to make a sensitivity analysis of different energy efficiency measures in the energy
performance of the building. This analysis was conducted to understand which of the selected energy
efficiency measures made the most significant improvements in the results. The measures included in
the sensitivity analysis were the building envelopes wall insulation thickness, changing the window
frames, altering the ventilation air duct length and width as well as increasing the air duct insulation
thickness. Finally, simulations with solar panels on the roof of the ESH were carried out.
For the European passive house classification, the study involved constructing the model in the Passive
House Planning Package (PHPP) and simulating each region and energy efficiency measures separately.
PHPP is however made specifically for verifying buildings according to the European passive house
standard. So the demands for the Swedish passive house classification cannot be calculated in the
PHPP simulations. Because of this, the data available through PHPP was used to manually calculate the
Swedish passive house requirements.
The results showed that the original ESH model, was only passive house certifiable according to the
European classification in Sibernik. When including the additional energy efficiency measures it was
possible for the ESH to become passive house certifiable in Lund, Ljubljana and Sibernik.
The Swedish passive house classification results suggests that the ESH may be passive house certifiable
in Lund. Also, with additional energy efficiency measures the ESH may meet the passive house
requirements in Sundsvall and Kiruna. However, all the passive house classification parameters could
not be considered in this study. Accordingly, additional analysis are required to draw final conclusions
on whether the ESH building could meet the Swedish passive house certification in the different
Swedish climate zones.
The conclusions drawn were that all the energy efficiency measures contribute to reducing the primary
energy demand, heating demand and the heating load. However, these same energy efficiency
measures would at the same time increase the cooling demand. Because of this, it was discussed that
specific regional models should be made. Because some regional models might benefit from not
including the energy efficiency measures used in this thesis at all. They might instead benefit from
finding and implementing energy efficiency measures that reduce the cooling demand.

II
Acknowledgement This thesis is part of the Master of Science program in Energy Engineering at Umeå University. It is of
30 credits. It was performed on behalf of the Department of Applied Physics and Electronics during the
first semester of 2015.
I would like to thank Gireesh Nair who has been my supervisor during this semester. He always helped
if I had questions or needed input. I would also like to thank Mohsen Soleimani-Mohseni for making
sure we could get relevant information from EE-highrise partners.
I would like to extend a special thanks to Rasmus Hasselrot who also worked on this project but in IDA-
ICE. Having someone there to discuss all things thesis related with was invaluable. Thank you.
III
Definitions Space Heating (SH) – The heating of an enclosed, often smaller, area.
Domestic Hot Water (DHW) – Water used for the houses domestic purposes like drinking and
showering. DHW does not include space heating.
EE-highrise – A project supported by the European Commission. The overall objective of the EU-project
is to demonstrate and validate the new technologies, concepts, and systems used in this project, in
order to test and assess the technological and economic feasibility of innovative energy solutions in
the high rise demo building Eco Silver House, and to contribute directly to the EU energy and climate
change policy (Akropola, 2015).
Eco silver house (ESH) – A high rise building which is part of the EE-highrise project. Two versions of
the building are being focused on in this thesis. The first one is the ESH version 11 which is the older
ESH model. It has also has been built in Slovenia and modified according to the land they acquired for
the construction of the house. The second one is the ESH version 21 which is the newest ESH model
to date acquired from the EE-highrise partner Akropola.
Passive house planning package (PHPP) – The program used for the simulations in this project. It is
used as a tool for modeling and simulating passive house performances. With its spreadsheet design
it has lately become widely adopted as one of the bigger programs for classifying passive houses.
Annual heating demand (Heating demand) – The heating demand is the yearly energy required for
heating of the ESH. It does not include the domestic hot water use. It is measured in kWh/m2a and is
one of the European passive house classification demands.
Heating load – The heating load is the peak demand of heat that has to be delivered to the ESH. It is
measured in W/m2 and is one of the European passive house classification requirements.
Cooling load – The cooling load is the peak demand of cold that has to be delivered to the ESH. It is
measured in W/m2 and is one of the European passive house classification requirements.
Partial sensitivity analysis – A partial sensitivity analysis is made by noting how relevant results change
when adjusting any parameter in the simulation, one at a time, keeping the others constant.
Heat loss number (HLN) – The heat required during winter in order to keep it warm indoors. The HLN
is the buildings specific heat losses through infiltration ventilation and transmission. It is calculated at
a dimensioning outdoor winter temperature (DVUT) and is measured in W/m2a. It is one of the Swedish
passive house classification demands (Sveriges Centrum för Nollenergihus, 2013).
Dimensioning outdoor winter temperature (DVUT) – The coldest temperature in a region used for the
said region when calculating the energy usage and dimensioning the heating system (Sveriges Centrum
för Nollenergihus, 2013).

IV
Nomenclature
Ψ – Thermal bridge heat loss coefficient [W/(mK)]
𝐼 – The length of the thermal bridge [m]
𝑓𝑇 – Temperature reduction factor
𝐺𝑇 – Degree hours [Kh]
𝐸𝑑𝑒𝑙,𝑖 – Delivered energy for energy carrier I [kWh/a]
𝐸𝑒𝑥𝑝,𝑖 – Exported energy for energy carrier I [kWh/a]
𝑓𝑃,𝑑𝑒𝑙,𝑖 – Primary energy factor for the delivered energy carrier i
𝑓𝑃,𝑒𝑥𝑝,𝑖 – Primary energy factor for the exported energy carrier i
U – Overall heat transfer coefficient [W/(m2K)]
𝑅𝑡𝑜𝑡𝑎𝑙 – Thermal resistance over a building part [(m2K)/W]
h – Heat transfer coefficient [W/(m2K)]
k – Thermal conductivity of a substance [W/(mK)]
𝑄𝑇 – Thermal transmission loss [kWh]
𝑃𝑝𝑖𝑝𝑒 – The losses in the hot water circulation and hot water piping [W]
𝜌𝐻2𝑂 – The density of water [kg/m3]
𝑐𝑝 – The waters specific heat capacity [kJ/kgK]
𝑞ℎ𝑤𝑐 – The volume flow in the hot water circulation system [l/s]
𝑇ℎ𝑜𝑡𝑤𝑎𝑡𝑒𝑟 – The water inflow temperature in the system [K]
𝑇𝑟𝑒𝑡𝑢𝑟𝑛 – The return water temperature [K]
𝐻𝑇 – The buildings heat loss number [W/m2]
DVUT – The dimensioning winter outdoor temperature [°C]
𝐴𝑡𝑒𝑚𝑝 – The total floor area for temperature controlled space [m2]
𝐴𝑜𝑚𝑠𝑙 – The building envelope area measured from the inside [m2]
𝑈𝑚 – The building envelopes average U-value [W/m2K]
𝜌𝑎𝑖𝑟 – The density of air [kg/m3]
𝑐 – The heat capacity of the air [kJ/kgK]

V
𝑞𝑙ä𝑐𝑘 – The building air leakage [l/s]
𝑞𝑣𝑒𝑛𝑡 – The infiltration air change rate [l/s]
v – The heat recovery efficiency [%]
d – The relative uptime of the ventilation [%]
VI
Contents Summary .................................................................................................................................................. I
Acknowledgement ................................................................................................................................... II
Definitions .............................................................................................................................................. III
Nomenclature ......................................................................................................................................... IV
List of tables ........................................................................................................................................... IX
1 Introduction ..................................................................................................................................... 1
1.1 Background .............................................................................................................................. 1
1.2 Purpose and goal ..................................................................................................................... 2
2 Literature study ............................................................................................................................... 3
2.1 Passive houses ......................................................................................................................... 3
2.1.1 The passive house concept .............................................................................................. 3
2.1.2 Operational optimization ................................................................................................ 4
2.2 Passive house classification ..................................................................................................... 4
2.2.1 European passive house classification ............................................................................ 4
2.2.2 Swedish passive house classification ............................................................................... 5
2.3 Primary energy ........................................................................................................................ 7
2.3.1 Primary energy supply ..................................................................................................... 7
2.3.2 Primary energy factors .................................................................................................... 7
2.4 Heat loss number .................................................................................................................... 7
2.5 Energy efficient building measures ......................................................................................... 8
2.5.1 Indoor temperature ......................................................................................................... 8
2.5.2 Insulation ......................................................................................................................... 8
2.5.3 Windows .......................................................................................................................... 8
2.5.4 Ventilation ....................................................................................................................... 8
2.5.5 Domestic hot water ......................................................................................................... 8
2.5.6 Overheating ..................................................................................................................... 9
2.5.7 Electricity ......................................................................................................................... 9
3 The eco silver house ...................................................................................................................... 10
3.1 About the building ................................................................................................................. 10
3.2 Building components ............................................................................................................. 10
3.2.1 Heating and hot water heating ..................................................................................... 11
3.2.2 Ventilation and air conditioning .................................................................................... 11
The Eco Silver House base case ..................................................................................................... 12
VII
4 Theory ............................................................................................................................................ 13
4.1 Heating losses ........................................................................................................................ 13
4.1.1 Thermal bridges ............................................................................................................. 13
4.1.2 Other transmission losses ............................................................................................. 13
4.2 Primary energy ...................................................................................................................... 14
4.3 Hot water circulation ............................................................................................................. 15
4.4 Heat loss number .................................................................................................................. 15
5 Method .......................................................................................................................................... 17
5.1 Study ...................................................................................................................................... 17
5.2 The Passive House Planning Package .................................................................................... 17
5.3 European certification criteria .............................................................................................. 18
5.4 Building assembly .................................................................................................................. 19
5.4.1 U-values of building elements ....................................................................................... 19
5.4.2 Ventilation air ducts ...................................................................................................... 19
5.5 Base case ............................................................................................................................... 20
5.6 Energy efficiency measures ................................................................................................... 20
5.7 Primary energy factors .......................................................................................................... 20
5.8 Sensitivity analysis ................................................................................................................. 21
5.8.1 Indoor temperature, overheating and ventilation ........................................................ 21
5.8.2 Insulation, windows, and DHW with solar panels ......................................................... 22
5.9 Heat loss number calculations for the Swedish standard ..................................................... 23
5.10 Yearly energy delivered to buildings for the Swedish standard ............................................ 23
5.11 Limitations ............................................................................................................................. 23
6 Results ........................................................................................................................................... 26
6.1 Base case ............................................................................................................................... 26
6.2 Sensitivity analysis ................................................................................................................. 27
6.2.1 Insulation ....................................................................................................................... 27
6.2.2 Ventilation ..................................................................................................................... 31
6.2.3 Windows ........................................................................................................................ 34
6.2.4 DHW with solar panels .................................................................................................. 36
6.3 Swedish passive house max case simulation ........................................................................ 36
6.4 European passive house max case simulations .................................................................... 38
6.4.1 Eco silver house version 11 ........................................................................................... 38
6.4.2 Final results version 11 .................................................................................................. 40
VIII
6.4.3 Eco silver house version 21 ........................................................................................... 41
7 Discussion ...................................................................................................................................... 44
8 Conclusion ..................................................................................................................................... 47
Bibliography ........................................................................................................................................... 48
Appendix ................................................................................................................................................ 52
8.1 Max case version 11 .............................................................................................................. 52
8.2 Max case version 21 .............................................................................................................. 54
8.2.1 Base results .................................................................................................................... 54
8.2.2 Improved version ........................................................................................................... 54
8.3 Swedish passive house classification..................................................................................... 57
8.4 Climate data .......................................................................................................................... 58
IX
List of tables Table 1: Requirements needed for the European passive house classification (Feist, 2012). ................ 5
Table 2: Criteria for being certified as a passive house in Sweden (Erlandsson, et al., 2012). ............... 6
Table 3: Base case values of the energy efficiency measures evaluated in the ESH. ........................... 12
Table 4: European passive house certification criteria (Wolfgang, 2013). ........................................... 18
Table 5: Primary energy factors (non-renewable) for both electricity and district heating in Sweden
(Nordic), Slovenia (SLO-MIX) and what is set as the default European factors (called EF). .................. 21
Table 6: List of European passive house certification results in the simulated regions based on the
input data given from Slovenia without any changes made to the ESH version 11 model. ................. 26
Table 7: Comparisons of the base case and the max case parameters ................................................ 38
Table 8: Table over ESH version 11 performance after including every max case scenario from the
sensitivity analysis into the simulation.................................................................................................. 40
Table 9: The insulation material was changed and the insulation thickness was increased. ............... 52
Table 10: The ventilation insulation thickness was changed and the nominal width was adjusted to
fulfill the 75% heat recovery. ................................................................................................................ 52
Table 11: The window frames was changed to lesser heat conducting ones. ...................................... 53
Table 12: Solar panels for domestic hot water was added ................................................................... 53
Table 13: Base case version 21 .............................................................................................................. 54
Table 14: Insulation material and thickness .......................................................................................... 54
Table 15: Windows frame change ......................................................................................................... 55
Table 16: Ventilation insulation thickness change ................................................................................ 55
Table 17: Table over ESH version 21 performance after including every max case scenario from the
sensitivity analysis into the simulation.................................................................................................. 56
Table 18: Table of the dimensioning winter outdoor temperature DVUT taken from FEBY 12
(Erlandsson, et al., 2012). ...................................................................................................................... 57
Table 19: Climate data for Ljubljana...................................................................................................... 58
Table 20: Climate data for Sibernik ....................................................................................................... 59
Table 21: Climate data for Lund ............................................................................................................ 60
Table 22: Climate data for Östersund ................................................................................................... 61
Table 23: Climate data for Sundsvall ..................................................................................................... 62
Table 24: Climate data for Kiruna .......................................................................................................... 63
1
1 Introduction This thesis work is part of an EU project investigating the EE-highrise Eco Silver house (referred to as
ESH) in dissimilar climates bearing in mind the energy use and building component performance. The
model constructed in the passive house planning package (referred to as PHPP) of the ESH is used for
simulating the different regions of Europe (southern Europe, central Europe and northern Europe) and
uses the simulated data to conclude if the ESH can be certified as a passive house in the selected region.
When evaluating and analyzing the passive high rise ESH the following aspects will be considered:
Operational energy- and power use (thermal and electrical) Environmental sustainability (primary energy factor)
1.1 Background Energy efficiency measures have become more common in the building sector during the last decades.
Concerns about energy use and climate change may have contributed to this public interest in the
energy sector. As of today, measures are continuously taken to reduce energy dependence. One of
these measures is the European 2020 climate and energy package, which is referred to as “a set of
binding legislation which aims to ensure the European Union meets its ambitious climate and energy
targets for 2020” (European Commission, 2015). The European Commission also made huge
investments in the energy sector to finance the growth of energy efficiency measures. In a framework
program called FP7 with the research theme ‘Energy’ 2350 million euros have been invested in
different projects (CORDIS, 2013). The Eco Silver House (ESH) is one of the many projects under this
initiative. From a wider energy perspective, buildings such as the ESH, which is a high rise passive house
building, might also be interesting because of how it bypasses the travel necessity that often comes
with living in most passive house areas today which are often placed further away from the central
part of cities (Stephan, et al., 2013).
Energy efficiency and energy saving measures when evaluating houses are the quickest and most
economically beneficial ways of addressing the climate policies set by the European commission
(Cellura, et al., 2013). This is because “Buildings account for the largest share of the total EU final
energy consumption (42%) and produce about 35% of all greenhouse emissions” (COMMISSION OF
THE EUROPEAN COMMUNITIES, 2007). Accordingly, the building sector offers a large potential to
incorporate energy savings and energy efficiency measures.
The work on done on the ESH could also contribute to the building sector. First of all, when it comes
to energy savings and energy efficiency measures, research in the field of passive houses can be
inspiring because of how e.g. heating and cooling are handled and implemented as energy efficiency
measures to some extent. However while the ESH is, in this thesis project, trying to achieve a passive
house classification, it is first of all a high rise building. High rise buildings can be interesting when
housing demand steadily increases in urban regions. In the United Nations Economic Commission for
Europe (UNECE) region, spanning 56 countries in the region, more than 75% of the population lives in
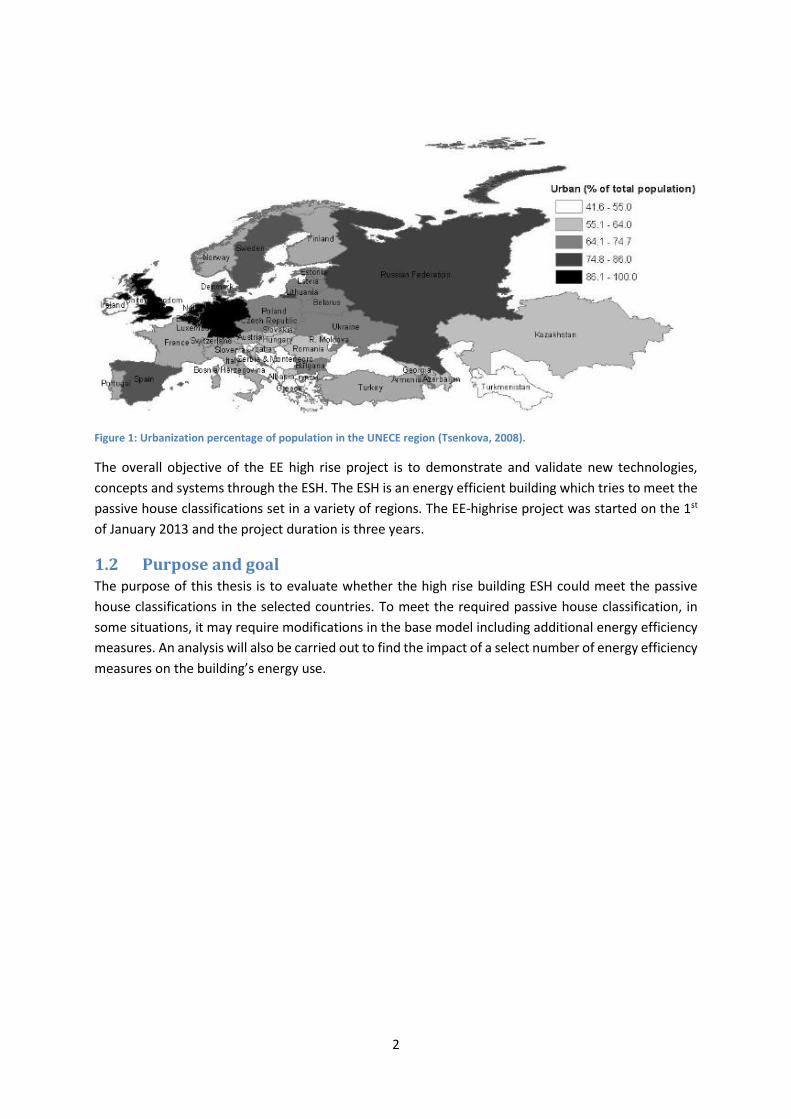
urban districts (Specified by nation in Figure 1 below), and is a constantly growing (Tsenkova, 2008).
The numbers of homeless people in these regions are also steadily rising. In 2006 it was documented
that the homeless population in Europe was close to 600,000 people with roughly 400,000 people
living in homeless shelters. These are also numbers which were expected to rise. Doing research and
creating low-energy and passive house models of multi-residential buildings which can lead to future
construction would help to meet the steady demand of urbanized housing in a sustainable manner.
2
Figure 1: Urbanization percentage of population in the UNECE region (Tsenkova, 2008).
The overall objective of the EE high rise project is to demonstrate and validate new technologies,
concepts and systems through the ESH. The ESH is an energy efficient building which tries to meet the
passive house classifications set in a variety of regions. The EE-highrise project was started on the 1st
of January 2013 and the project duration is three years.
1.2 Purpose and goal The purpose of this thesis is to evaluate whether the high rise building ESH could meet the passive
house classifications in the selected countries. To meet the required passive house classification, in
some situations, it may require modifications in the base model including additional energy efficiency
measures. An analysis will also be carried out to find the impact of a select number of energy efficiency
measures on the building’s energy use.
3
2 Literature study For the purpose of understanding passive houses and elucidate the concept, a literature study has
been made. The thesis also discusses the importance of a well calculated Primary Energy Factor (PEF)
and the simulation possibilities of the Passive House Planning Program (PHPP).
2.1 Passive houses The passive house concept is one possibility to achieve an energy use reduction in the building sector.
Some of the most important aspects when achieving an energy use reduction are low heat losses and
high heat gains. Therefore these can be seen as good aspects to consider when determining where
possible improvements, of energy efficiency, on a building can be made.
2.1.1 The passive house concept
There are five principles included in the passive house concept. These are to have a thermal bridge
free design, thermal insulation, passive house windows (low thermal bridge coefficients and low u-
values), ventilation that includes heat recovery and finally an airtight construction (Müller & Berker,
2013). A passive house is therefore a concept aimed to reach comfortable indoor temperatures
without an external heating or cooling. Since the passive house concept stresses a high heat recycling
rate and a high ventilation flow rate, it follows that when you fulfill these demands, you also keep the
air quality decent. Nevertheless, it is not uncommon for a passive house to still have an external
heating. However, due to the various energy efficiency measures implemented on a passive house, an
external heating included in the system can always be expected to operate at a lowered rate in
comparison to a conventional house (Müller & Berker, 2013).
In 2011 about 32,000 passive houses or 46,000 dwelling units existed in Europe which was classified
according to the European passive house demands (Krause, et al., 2011). Lately the passive house
concept has also been used globally as a benchmark for energy efficient refurbishment and
constructions (Wünsch, 2014). It is also noted that the passive house classification is not only having
an impact on individual buildings anymore, but that it also serves as the base for building “complexes
and even entire neighborhoods” (Wünsch, 2014).
The general strategies developed to reduce a buildings energy demand have been in use since the
1970s. Initially some energy efficiency measures on the existing building parts were made. The parts
which were looked at were primarily airtight windows and building envelopes, things made to reduce
the infiltration of air into the living space (Wolfgang, et al., 2005). These improvements were followed
up with installing renewable energy sources. The primary energy sources used to compensate for
energy losses in passive houses are solar gains and internal energy gains as well as a possible external
heating system (Wolfgang, et al., 2005). Internal gains are referring to heat gain from inhabitants,
recycled heat from the water- and ventilation system as well as appliances.
The installation of all airtight components, however, led to problems with air quality due to reduced
air flow rate. The air flow rate could only be increased if the residents themselves opened their
windows. The lowered ventilation rate also caused mold growth, particularly at thermal bridges.
Finding solutions to issues like these were for many years one of the most important factors in
designing the passive house concept (Wolfgang, et al., 2005). Today there are many established
solutions to the older passive house problems because of these experiences (Wolfgang, et al., 2005).
4
As the passive house concept has been welcomed in many parts of the world, cultural dissimilarities
and climate differences has forced some countries to adapt the European passive house classification
to a passive house classification of their own. An example of cultural dissimilarities would be that in
Sweden it will be more common to have a centralized district heating system in an apartment building.
The centralized heating was seen as a welfare solution earlier in Sweden and during the mid-20th
century about 45% of all Swedish housing contained a central heating system (Larsdotter, 2012).
However, in Slovenia there can be a demand for individual heat exchangers for every flat. This might
be because the Slovenian inhabitants are more likely to want complete control over their energy use
(Marko, 2015). Climate differences might also be a contributing factor as to why a different passive
house classification is developed. If the outdoor temperature in one region is colder than another, you
will most likely need a thicker insulation to prevent the indoor heat losses. While the thicker insulation
might keep the indoor temperature comfortable during winter, it will struggle to keep the indoor
temperature comfortable during the warmest days during summer. This means that some logical
changes to the passive house classification might be required. For example, allowing a higher
overheating temperature during summer for a longer duration of time. Adapting the European passive
house principle, instead of disregarding it, means that energy efficiency measures are being considered.
The modifications adapted by various countries for the passive house classification has helped making
the concept more accepted globally (Müller & Berker, 2013).
2.1.2 Operational optimization
Depending on what you evaluate e.g. air infiltration, ambient cooling, heating load etc., these different
parts of the building will be the most useful parameter to check. However, every small gain possible
will contribute to the efficiency of the building as a whole.
By adding solar thermal collectors to the system, less fossil-fuel based external heating would be
required for the system. However, the building cooling demand and the room comfort enhancement
will not be affected. Nonetheless, it may increase redundancy and system security by allowing for a
second smaller heating source. Solar thermal collectors will also make the buildings promise of a low
energy commitment visible to the public eye (Lehmann, et al., 2010).
In an air heating (AH) analysis it was concluded that internal gains have a great impact over passive
house buildings since the design of a passive house considerably alter the thermal behavior (Georges,
et al., 2013). This also means that thermal loss from ventilation ducts may be significant. This means
that proper insulation needs to be implemented, especially in cases where the ducts have to cross an
unheated building segment like basements or storage facilities (Georges, et al., 2013).
2.2 Passive house classification There are different passive house classifications which have been made over the years. There is
primarily the European passive house classification. In some countries an adaptation of this European
passive house classification has appeared. They are tools used to show that specific buildings fulfill the
different energy efficiency measures. Just as KRAV is a certification for ecological products with
consideration for animals and general health. The passive house classifications appear in the building
sector to promote energy efficient buildings.
2.2.1 European passive house classification
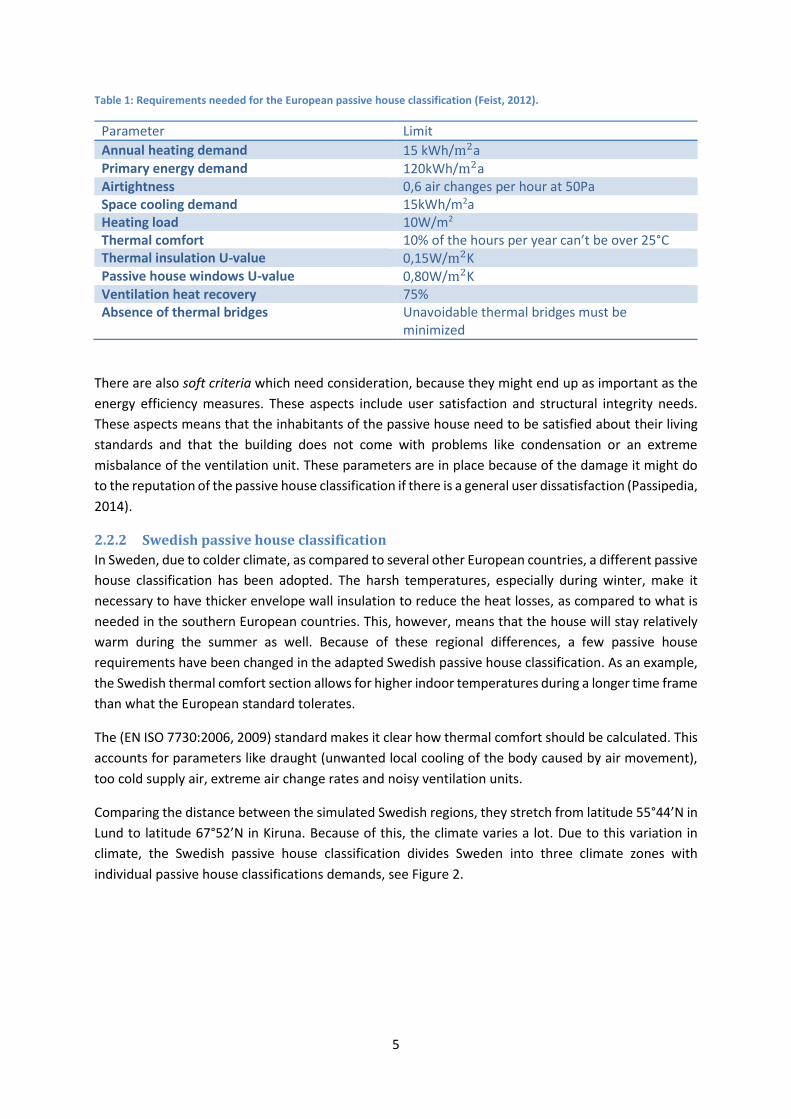
Table 1 provides the specifications that are to be met in order to receive the passive house certification
as per the European classification.
5
Table 1: Requirements needed for the European passive house classification (Feist, 2012).
Parameter Limit
Annual heating demand 15 kWh/m2a Primary energy demand 120kWh/m2a Airtightness 0,6 air changes per hour at 50Pa Space cooling demand 15kWh/m2a Heating load 10W/m2
Thermal comfort 10% of the hours per year can’t be over 25°C Thermal insulation U-value 0,15W/m2K Passive house windows U-value 0,80W/m2K Ventilation heat recovery 75% Absence of thermal bridges Unavoidable thermal bridges must be
minimized
There are also soft criteria which need consideration, because they might end up as important as the
energy efficiency measures. These aspects include user satisfaction and structural integrity needs.
These aspects means that the inhabitants of the passive house need to be satisfied about their living
standards and that the building does not come with problems like condensation or an extreme
misbalance of the ventilation unit. These parameters are in place because of the damage it might do
to the reputation of the passive house classification if there is a general user dissatisfaction (Passipedia,
2014).
2.2.2 Swedish passive house classification
In Sweden, due to colder climate, as compared to several other European countries, a different passive
house classification has been adopted. The harsh temperatures, especially during winter, make it
necessary to have thicker envelope wall insulation to reduce the heat losses, as compared to what is
needed in the southern European countries. This, however, means that the house will stay relatively
warm during the summer as well. Because of these regional differences, a few passive house
requirements have been changed in the adapted Swedish passive house classification. As an example,
the Swedish thermal comfort section allows for higher indoor temperatures during a longer time frame
than what the European standard tolerates.
The (EN ISO 7730:2006, 2009) standard makes it clear how thermal comfort should be calculated. This
accounts for parameters like draught (unwanted local cooling of the body caused by air movement),
too cold supply air, extreme air change rates and noisy ventilation units.
Comparing the distance between the simulated Swedish regions, they stretch from latitude 55°44’N in
Lund to latitude 67°52’N in Kiruna. Because of this, the climate varies a lot. Due to this variation in
climate, the Swedish passive house classification divides Sweden into three climate zones with
individual passive house classifications demands, see Figure 2.
6
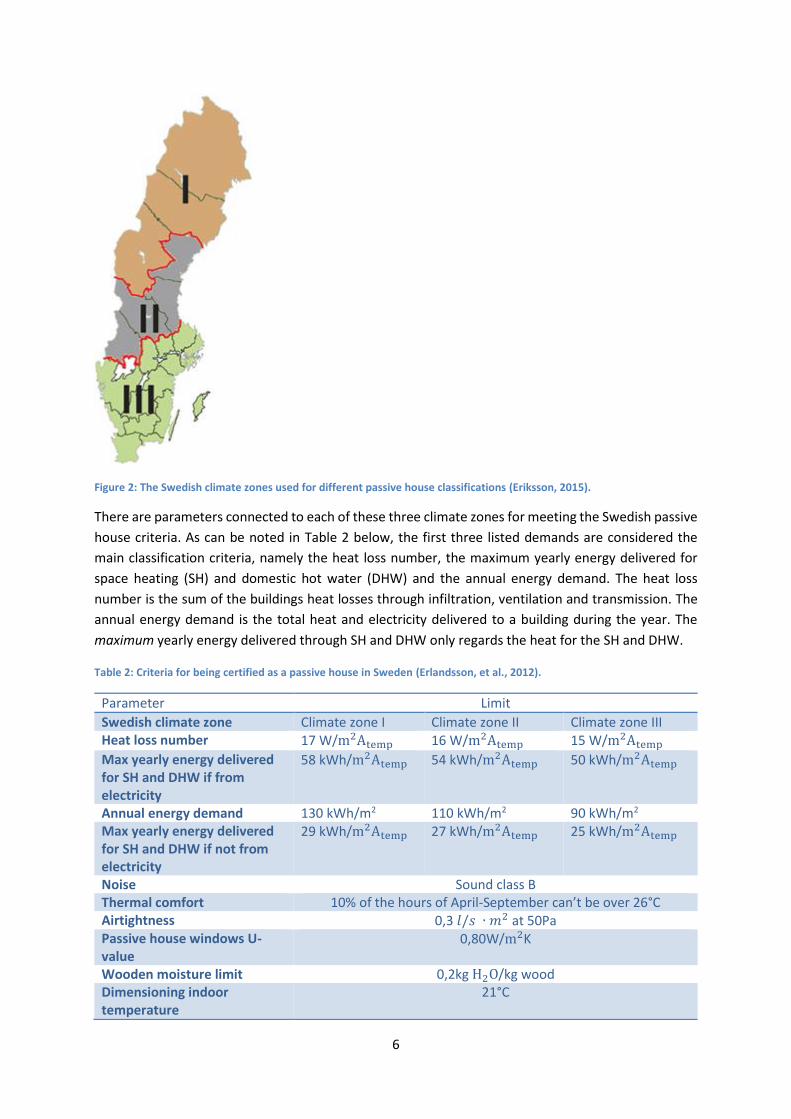
Figure 2: The Swedish climate zones used for different passive house classifications (Eriksson, 2015).
There are parameters connected to each of these three climate zones for meeting the Swedish passive
house criteria. As can be noted in Table 2 below, the first three listed demands are considered the
main classification criteria, namely the heat loss number, the maximum yearly energy delivered for
space heating (SH) and domestic hot water (DHW) and the annual energy demand. The heat loss
number is the sum of the buildings heat losses through infiltration, ventilation and transmission. The
annual energy demand is the total heat and electricity delivered to a building during the year. The
maximum yearly energy delivered through SH and DHW only regards the heat for the SH and DHW.
Table 2: Criteria for being certified as a passive house in Sweden (Erlandsson, et al., 2012).
Parameter Limit
Swedish climate zone Climate zone I Climate zone II Climate zone III Heat loss number 17 W/m2Atemp 16 W/m2Atemp 15 W/m2Atemp
Max yearly energy delivered for SH and DHW if from electricity
58 kWh/m2Atemp 54 kWh/m2Atemp 50 kWh/m2Atemp
Annual energy demand 130 kWh/m2 110 kWh/m2 90 kWh/m2 Max yearly energy delivered for SH and DHW if not from electricity
29 kWh/m2Atemp 27 kWh/m2Atemp 25 kWh/m2Atemp
Noise Sound class B Thermal comfort 10% of the hours of April-September can’t be over 26°C Airtightness 0,3 𝑙/𝑠 ∙ 𝑚2 at 50Pa Passive house windows U-value
0,80W/m2K
Wooden moisture limit 0,2kg H2O/kg wood Dimensioning indoor temperature
21°C
7
2.3 Primary energy To be able to evaluate the energy efficiency of e.g. certain buildings it is common to look at the systems
primary energy.
2.3.1 Primary energy supply
As per PHPP classification the primary energy demand is the energy demand from non-renewable
energy sources that is supplied to the building for all energy uses. This includes transportation of said
renewable fuel. The source of such energy is called primary energy supply. This primary energy supply
consists of untouched energy sources such as natural resource fuels. Refined energy sources such as
electricity are not part of the primary energy supply. Some examples of this natural energy are sources
such as biomass, solar and geothermal heat. However, the primary energy supply also includes fossil
fuels such as coal. Direct uses of these sources are categorized as a primary energy supply (Fredriksen
& Werner, 2014).
There are also primary energy processes. These use and refine the primary energy sources in processes
such as waste and methane destruction and generating electricity. This means that the primary energy
supply should be considerably higher than the refined and delivered energy to customers (Fredriksen
& Werner, 2014).
2.3.2 Primary energy factors
Primary energy factors (PEF’s) are used for the current passive house legalizations. It gives a value for
the ratio between the primary energy and the final energy. The more environmental friendly and
resource effective energy source, the lower PEF you have (DANPOWER, u.d.). PEF’s are often brought
up in scientific energy research and includes factors like transportation, distribution, storage, delivery
and extraction of the used energy (Wilby, et al., 2014).
A PEF is by definition variable when looking at different regions. This holds true since different
countries can be said to have more or less different ways of processing their energy. An example would
be that parameters such as how energy sources are handled and transported play a role in determining
the regions PEF. This parameter varies specific to every country’s e.g. environment and market (Wilby,
et al., 2014).
(Wilby, et al., 2014) argued that “PEF’s should rely on empirical data and evolve in time. Otherwise the
obtained efficiencies may not be representative of the actual energy system. In addition, inaccurate
standard PEF’s may cause a negative effect on the energy efficiency measures. For instance, imposing
a high value on the PEF of electricity may discourage the use of renewable energy sources, which have
an actual value close to 1”.
2.4 Heat loss number The Heat loss number (HLN) is an important parameter in the Swedish passive house certification
process (Erlandsson, et al., 2012). The HLN is a number that take into consideration the transmission,
air leakage and ventilation heat losses. “The HLN is a functional demand independent of how solar
energy and waste heat contributes to the heating demand of the building. It is also independent of
operational and behavioral factors. Only the losses are calculated” (Erlandsson, et al., 2012).
8
2.5 Energy efficient building measures In order to simulate possible energy efficiency measures in PHPP while still following the PHI protocol
for passive house certification (see Table 4 in methods) the following measures were considered. The
windows and ventilation were chosen because of them being some of the most well-known measures
when it comes to energy efficiency of a building. Changing the indoor temperature and allowing a
higher overheating temperature were a few things chosen to fulfill the passive house requirements of
the Swedish passive house classification.
2.5.1 Indoor temperature
As per the Swedish passive house classification the indoor temperature in a passive house should be
21°C (Erlandsson, et al., 2012). However, the European passive house classification dimensions for 20°C.
This value should only be changed in justifiable cases, however, since it is the requirement of the
Swedish passive house classification, it is considered justifiable for these calculations. Increasing the
indoor temperature would of course require more heat to be held within the thermal envelope which
will change the thermal performance of the ESH.
2.5.2 Insulation
It is argued that the insulation could be one of the most important energy efficiency measures
environmental programs promote today (Catalina, et al., 2013). This is because they argue that
correctly designing a building with its insulation is the first and most important step towards having a
low energy building (Catalina, et al., 2013). The wall insulation thickness and heat conductivity (k) are
two important parameters which determine its U-value. Generally, lower heat conductivity and thicker
insulation material provides less heat loss. As an example, the envelope wall insulation thickness of a
normal Swedish passive house is 45cm (Passivhuscentrum, 2010).
2.5.3 Windows
Windows are an important aspect when evaluating and reducing a buildings heat loss. Yoo, et al.,
(2013) measures the thermal performance of different window systems and analyzes their energy
savings in South Korea. It strengthened the importance of evaluating proper windows and window
frames. The study showed that by improving the insulating performance of windows, such as using
windows with a low U-value, energy savings of up to 20% could be achieved (Yoo, et al., 2013).
2.5.4 Ventilation
In order to improve the heat recovery in a ventilation system, the ventilation insulation thickness is an
efficient energy efficiency measure (Ciampi, et al., 2003). Furthermore, an insulation thickness around
the ventilation air duct about 150mm would be both economically viable and energy efficient (Ciampi,
et al., 2003). It is also possible to change the nominal width of the air duct in the ESH as well as shorten
the actual length of the outdoor air duct as energy efficiency measures (Ciampi, et al., 2003). This
would reduce the surface area of the ducts and decrease the heat leakage.
2.5.5 Domestic hot water
Adding solar panels for water heating to a building is one way to reduce the energy requirement for
domestic hot water use and in turn the primary energy use of the facility. It is usually economically
sustainable to add a solar heating system for a maximum of 50% of a yearly solar fraction of DHW
production for this purpose (Feist, et al., 2012). The solar panel area is normally approximated with
1m2/person, however for multi-residential buildings, this value should be lower (Feist, et al., 2012).
9
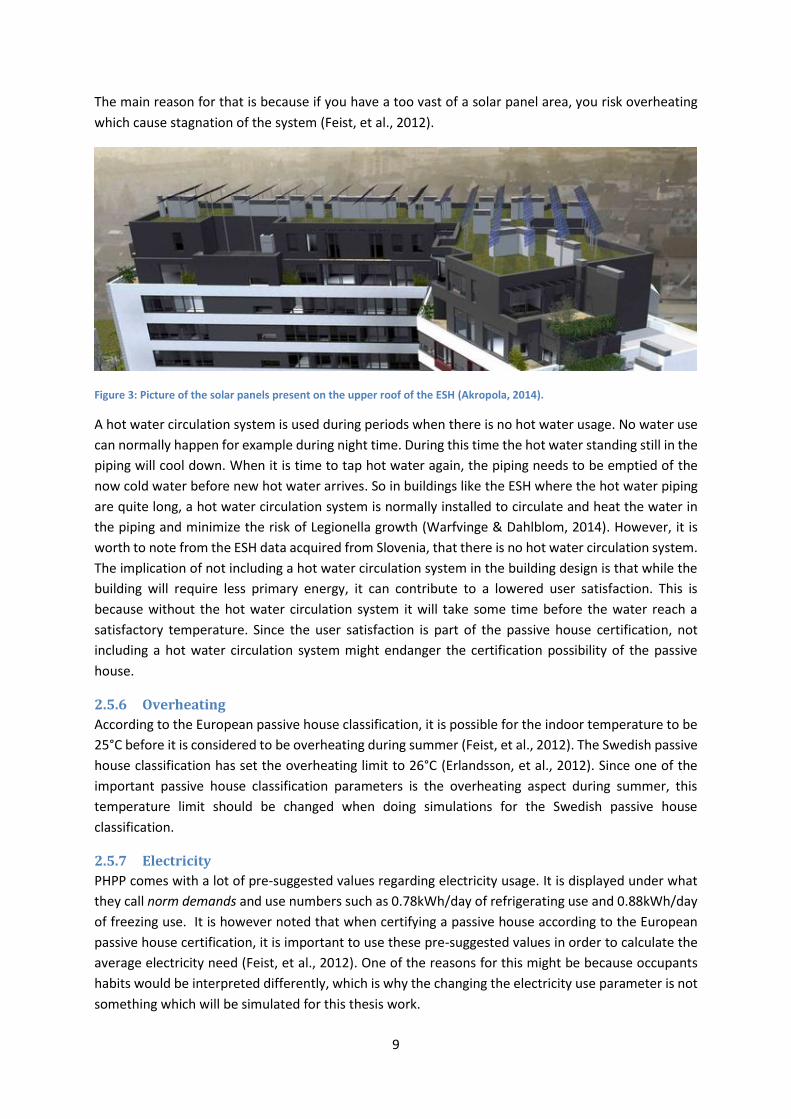
The main reason for that is because if you have a too vast of a solar panel area, you risk overheating
which cause stagnation of the system (Feist, et al., 2012).
Figure 3: Picture of the solar panels present on the upper roof of the ESH (Akropola, 2014).
A hot water circulation system is used during periods when there is no hot water usage. No water use
can normally happen for example during night time. During this time the hot water standing still in the
piping will cool down. When it is time to tap hot water again, the piping needs to be emptied of the
now cold water before new hot water arrives. So in buildings like the ESH where the hot water piping
are quite long, a hot water circulation system is normally installed to circulate and heat the water in
the piping and minimize the risk of Legionella growth (Warfvinge & Dahlblom, 2014). However, it is
worth to note from the ESH data acquired from Slovenia, that there is no hot water circulation system.
The implication of not including a hot water circulation system in the building design is that while the
building will require less primary energy, it can contribute to a lowered user satisfaction. This is
because without the hot water circulation system it will take some time before the water reach a
satisfactory temperature. Since the user satisfaction is part of the passive house certification, not
including a hot water circulation system might endanger the certification possibility of the passive
house.
2.5.6 Overheating
According to the European passive house classification, it is possible for the indoor temperature to be
25°C before it is considered to be overheating during summer (Feist, et al., 2012). The Swedish passive
house classification has set the overheating limit to 26°C (Erlandsson, et al., 2012). Since one of the
important passive house classification parameters is the overheating aspect during summer, this
temperature limit should be changed when doing simulations for the Swedish passive house
classification.
2.5.7 Electricity
PHPP comes with a lot of pre-suggested values regarding electricity usage. It is displayed under what
they call norm demands and use numbers such as 0.78kWh/day of refrigerating use and 0.88kWh/day
of freezing use. It is however noted that when certifying a passive house according to the European
passive house certification, it is important to use these pre-suggested values in order to calculate the
average electricity need (Feist, et al., 2012). One of the reasons for this might be because occupants
habits would be interpreted differently, which is why the changing the electricity use parameter is not
something which will be simulated for this thesis work.
10
3 The eco silver house The following chapter describes the ESH both from a more generic view as well as how some of the
building components have been designed.
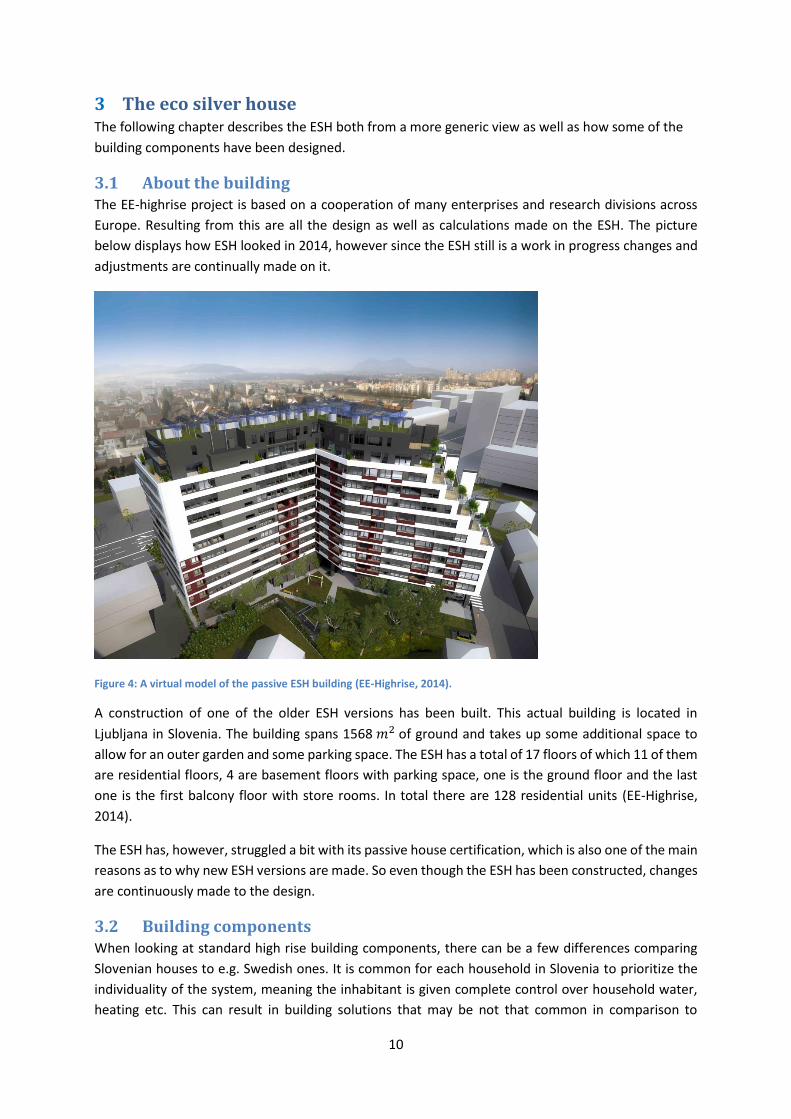
3.1 About the building The EE-highrise project is based on a cooperation of many enterprises and research divisions across
Europe. Resulting from this are all the design as well as calculations made on the ESH. The picture
below displays how ESH looked in 2014, however since the ESH still is a work in progress changes and
adjustments are continually made on it.
Figure 4: A virtual model of the passive ESH building (EE-Highrise, 2014).
A construction of one of the older ESH versions has been built. This actual building is located in
Ljubljana in Slovenia. The building spans 1568 𝑚2 of ground and takes up some additional space to
allow for an outer garden and some parking space. The ESH has a total of 17 floors of which 11 of them
are residential floors, 4 are basement floors with parking space, one is the ground floor and the last
one is the first balcony floor with store rooms. In total there are 128 residential units (EE-Highrise,
2014).
The ESH has, however, struggled a bit with its passive house certification, which is also one of the main
reasons as to why new ESH versions are made. So even though the ESH has been constructed, changes
are continuously made to the design.
3.2 Building components When looking at standard high rise building components, there can be a few differences comparing
Slovenian houses to e.g. Swedish ones. It is common for each household in Slovenia to prioritize the
individuality of the system, meaning the inhabitant is given complete control over household water,
heating etc. This can result in building solutions that may be not that common in comparison to
11
Swedish high rise buildings that more often than not use a system which the inhabitants share. The
following sub-systems of the ESH are therefore mentioned in order to describe how things such as the
heating and domestic hot water are handled, as well as the ventilation, in a situation as in Slovenia.
3.2.1 Heating and hot water heating
The heat distribution is from radiators and floor convectors. The ESH is connected to a district heating
system and the heat is distributed to heat regulation units with a heat exchanger which each
apartment has (Akropola, 2014). From an individual perspective, this is of course beneficial in the sense
that you get full control over your usage. However this also means that the district heating piping must
go all the way through the building to each apartment as well as that the extra cost of all the heat
exchangers also becomes an economical aspect to consider.
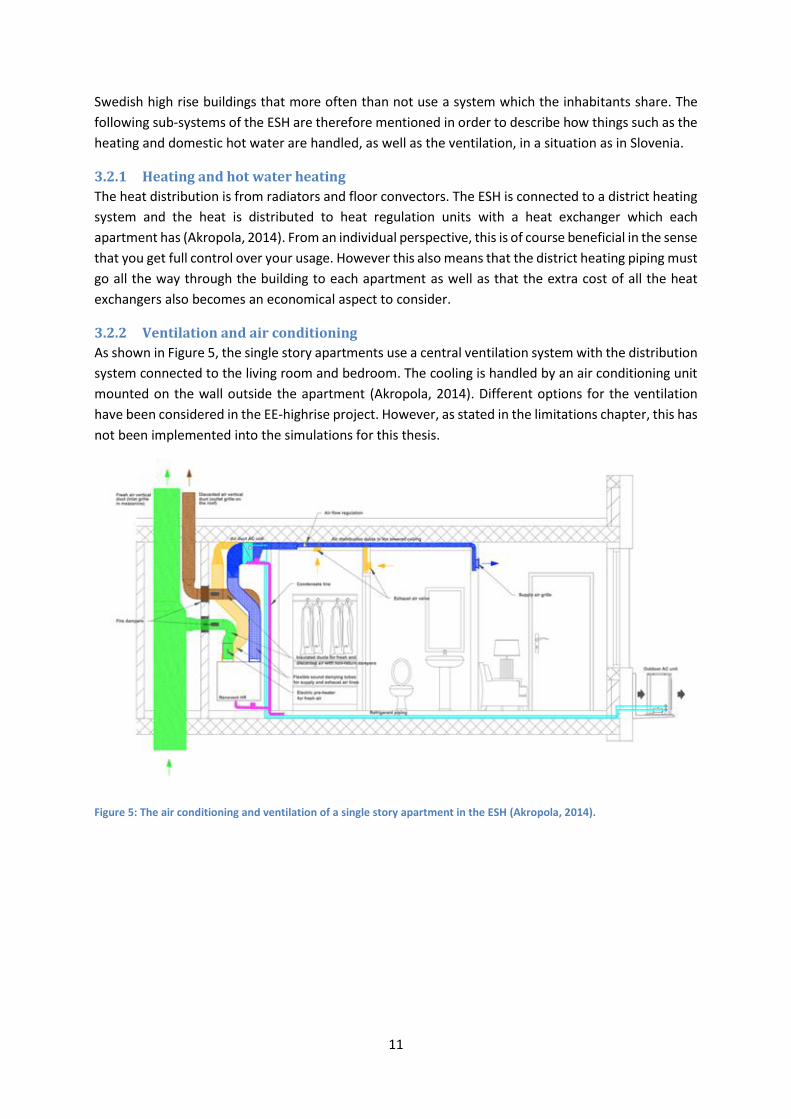
3.2.2 Ventilation and air conditioning
As shown in Figure 5, the single story apartments use a central ventilation system with the distribution
system connected to the living room and bedroom. The cooling is handled by an air conditioning unit
mounted on the wall outside the apartment (Akropola, 2014). Different options for the ventilation
have been considered in the EE-highrise project. However, as stated in the limitations chapter, this has
not been implemented into the simulations for this thesis.
Figure 5: The air conditioning and ventilation of a single story apartment in the ESH (Akropola, 2014).
12
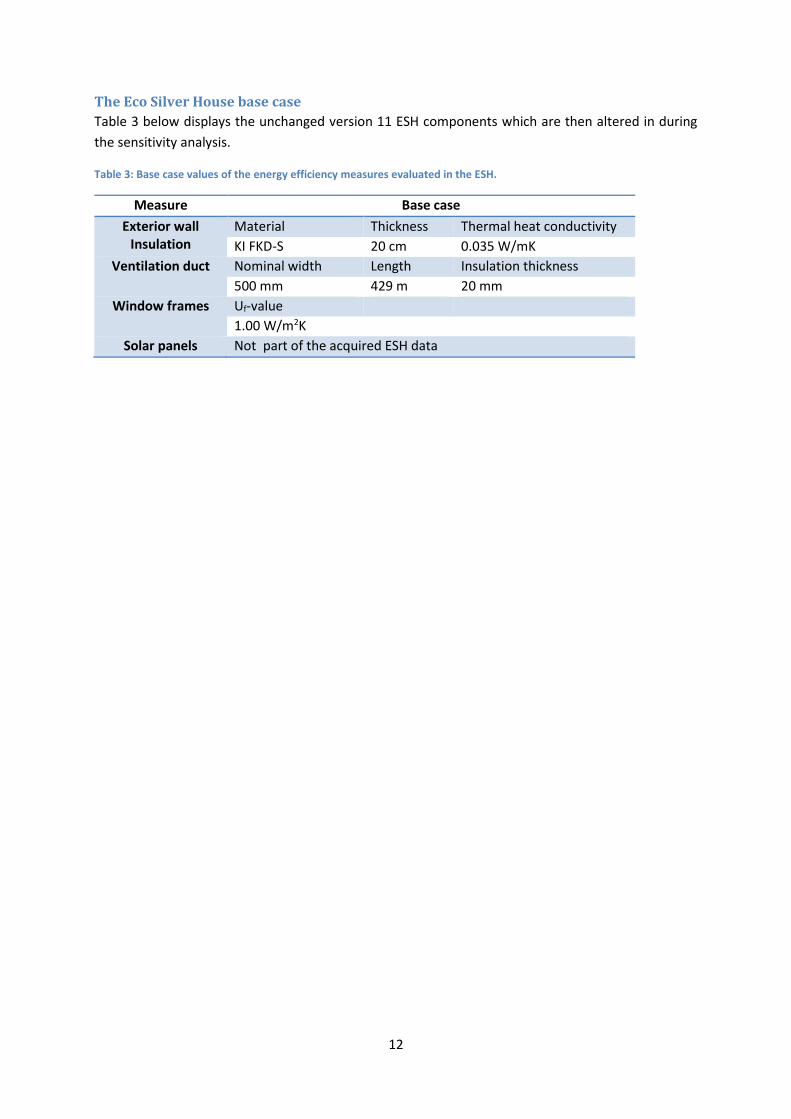
The Eco Silver House base case
Table 3 below displays the unchanged version 11 ESH components which are then altered in during
the sensitivity analysis.
Table 3: Base case values of the energy efficiency measures evaluated in the ESH.
Measure Base case
Exterior wall Insulation
Material Thickness Thermal heat conductivity
KI FKD-S 20 cm 0.035 W/mK
Ventilation duct Nominal width Length Insulation thickness
500 mm 429 m 20 mm
Window frames Uf-value
1.00 W/m2K
Solar panels Not part of the acquired ESH data
13
4 Theory PHPP is a calculation tool that bases all its results on pre-defined physics. Because of this, PHPP has
become a common tool in passive house calculations. This chapter lists the most relevant calculations
to this study. These are calculations made both through PHPP and manually. These manual calculations
were made since PHPP is made specifically for the European passive house classification but was still
used in this study to evaluate the ESH according to the Swedish passive house classification. Since the
Swedish passive house classification evaluates parameters like the so called Heat Loss Number (HLN)
which is not a part of PHPP, these manual calculations was made.
4.1 Heating losses As climate differences are an important part of the simulations, and how the building holds warmth or
cold, the heat transfer fundamentals are of course really significant to look at for the simulations.
4.1.1 Thermal bridges
One of the PH definitions is that thermal bridges should be nonexistent and if it is not possible to
completely eliminate the thermal bridge, it should be minimized. PHPP recommend the setting
“construction without thermal bridges” since this makes the extra heat flows subsequently small so
they can be neglected. Nevertheless, if a thermal bridge heat loss coefficient Ψ is bigger than 0.01
W/(mK) that loss need to be implemented (Feist, et al., 2012).
If the linear Ψ-value has been given from a third party program such as ‘Heat2’, ‘Bisco’, ‘Winslo’ or
‘Therm’ it is possible to calculate the transmission heating losses through PHPP with
𝑄𝑇 = 𝐼 ∙ 𝛹 ∙ 𝑓𝑇 ∙ 𝐺𝑇. [1] where
Ψ is the thermal bridge heat loss coefficient,
𝐼 is the length of the thermal bridge,
𝑓𝑇 is the temperature reduction factor,
𝐺𝑇 is the degree hours.
4.1.2 Other transmission losses
The transmission heating loss is calculated in a similar way as thermal bridges. However, thermal
bridges are calculated with the specific thermal bridge heat loss coefficient and the length of the
thermal bridge, as in equation [1], other kinds of transmission losses use the building parts area with
a corresponding U-value instead (Feist, et al., 2012).
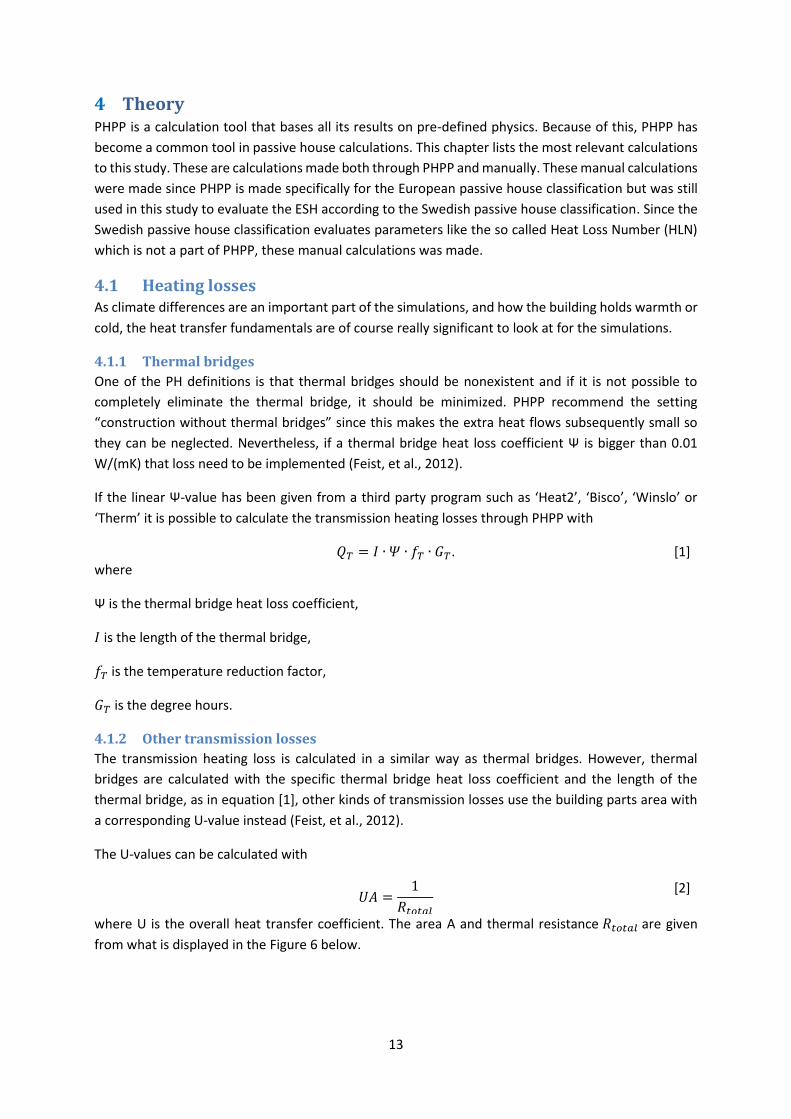
The U-values can be calculated with
𝑈𝐴 =
1
𝑅𝑡𝑜𝑡𝑎𝑙
[2]
where U is the overall heat transfer coefficient. The area A and thermal resistance 𝑅𝑡𝑜𝑡𝑎𝑙 are given
from what is displayed in the Figure 6 below.
14
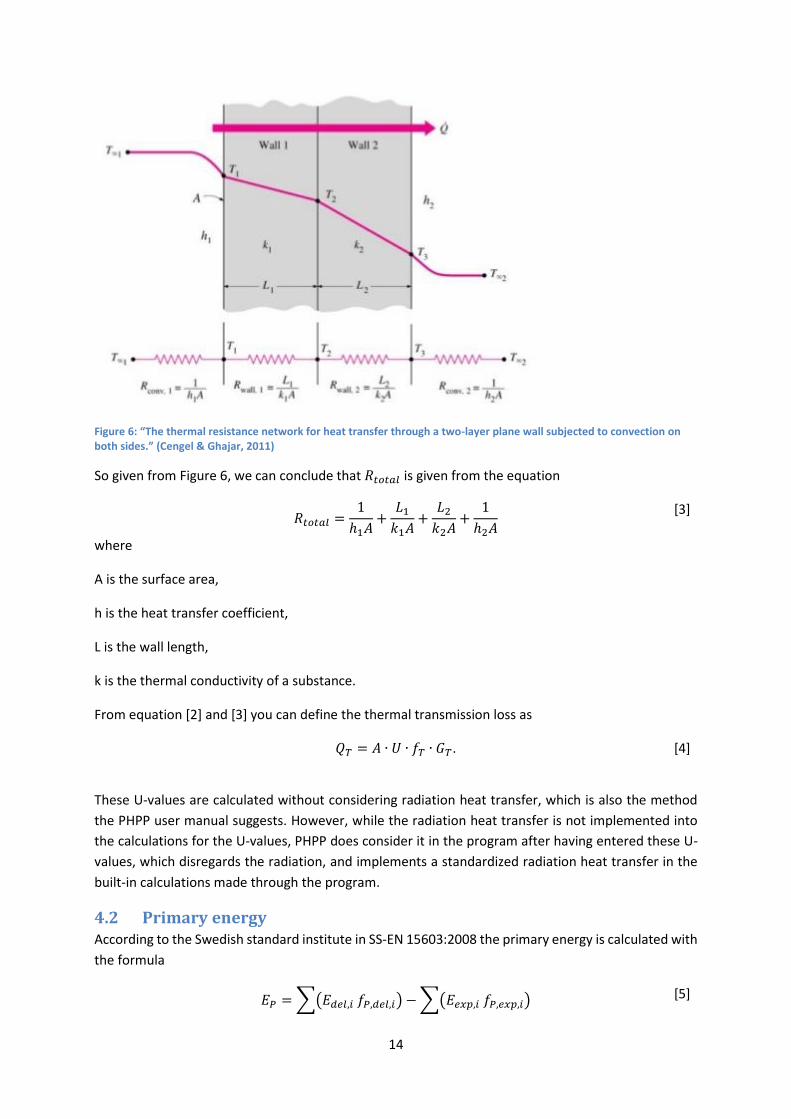
Figure 6: “The thermal resistance network for heat transfer through a two-layer plane wall subjected to convection on both sides.” (Cengel & Ghajar, 2011)
So given from Figure 6, we can conclude that 𝑅𝑡𝑜𝑡𝑎𝑙 is given from the equation
𝑅𝑡𝑜𝑡𝑎𝑙 =
1
ℎ1𝐴+
𝐿1
𝑘1𝐴+
𝐿2
𝑘2𝐴+
1
ℎ2𝐴
[3]
where
A is the surface area,
h is the heat transfer coefficient,
L is the wall length,
k is the thermal conductivity of a substance.
From equation [2] and [3] you can define the thermal transmission loss as
𝑄𝑇 = 𝐴 ∙ 𝑈 ∙ 𝑓𝑇 ∙ 𝐺𝑇. [4]
These U-values are calculated without considering radiation heat transfer, which is also the method
the PHPP user manual suggests. However, while the radiation heat transfer is not implemented into
the calculations for the U-values, PHPP does consider it in the program after having entered these U-
values, which disregards the radiation, and implements a standardized radiation heat transfer in the
built-in calculations made through the program.
4.2 Primary energy According to the Swedish standard institute in SS-EN 15603:2008 the primary energy is calculated with
the formula
𝐸𝑃 = ∑(𝐸𝑑𝑒𝑙,𝑖 𝑓𝑃,𝑑𝑒𝑙,𝑖) − ∑(𝐸𝑒𝑥𝑝,𝑖 𝑓𝑃,𝑒𝑥𝑝,𝑖) [5]
15
where
𝐸𝑑𝑒𝑙,𝑖 is the delivered energy for energy carrier i,
𝐸𝑒𝑥𝑝,𝑖 is the exported energy for energy carrier i,
𝑓𝑃,𝑑𝑒𝑙,𝑖 is the primary energy factor for the delivered energy carrier i,
𝑓𝑃,𝑒𝑥𝑝,𝑖 is the primary energy factor for the exported energy carrier i.
4.3 Hot water circulation When adding a hot water circulation flow, the heat losses from the piping need to be considered. They
are dependent on the piping length, the dimensions of the hot water and circulation piping, the
domestic hot water temperature, the piping insulation and the surrounding temperature (Warfvinge
& Dahlblom, 2014).
The heat losses can be calculated with the following formula:
𝑃𝑝𝑖𝑝𝑒 = 𝜌𝐻2𝑂 ∙ 𝑐𝑃 ∙ 𝑞ℎ𝑤𝑐 ∙ (𝑇ℎ𝑜𝑡 𝑤𝑎𝑡𝑒𝑟 − 𝑇𝑟𝑒𝑡𝑢𝑟𝑛) [6]
where
𝑃𝑝𝑖𝑝𝑒 is the losses in the hot water circulation and hot water piping,
𝜌𝐻2𝑂 is the density of water,
𝑐𝑝 is the waters specific heat capacity,
𝑞ℎ𝑤𝑐 is the volume flow in the hot water circulation system,
𝑇ℎ𝑜𝑡𝑤𝑎𝑡𝑒𝑟 is the water inflow in the system,
𝑇𝑟𝑒𝑡𝑢𝑟𝑛 is the return water.
4.4 Heat loss number The Heat loss number (HLN) is one of the main parameters looked at for the Swedish passive house
certification. PHPP is however designed for the European certification. Because of this, no calculations
are made in PHPP to acquire the HLN. So in order to see if the ESH meet the Swedish passive house
classification, calculations have to be done by hand.
According to (Erlandsson, et al., 2012) in FEBY 12, the HLN is calculated as a sum of the entire buildings
heat losses through transmission, ventilation and infiltration.
It is defined by the following equation:
𝑉𝐹𝑇𝐷𝑉𝑈𝑇 = 𝐻𝑇 ∙ (21 − 𝐷𝑉𝑈𝑇)/𝐴𝑡𝑒𝑚𝑝 [7]
where
𝐻𝑇 is the buildings heat loss number,
16
DVUT is the dimensioning winter outdoor temperature,
𝐴𝑡𝑒𝑚𝑝 is the total floor area for temperature controlled space.
(Swedish Standards Institute, 2008) shows in EN ISO 13789:2007 how to calculate 𝐻𝑇. It is calculated
with the following formula:
𝐻𝑇 = ∑ 𝑈𝑚 ∙ 𝐴𝑜𝑚𝑠𝑙 + 𝜌𝑎𝑖𝑟 ∙ 𝑐 ∙ 𝑞𝑙ä𝑐𝑘 + 𝜌𝑎𝑖𝑟 ∙ 𝑐 ∙ 𝑑 ∙ 𝑞𝑣𝑒𝑛𝑡 ∙ (1 − 𝑣) [8]
where
𝐴𝑜𝑚𝑠𝑙 is the building envelope area measured from the inside,
𝑈𝑚 is the building envelopes average U-value,
𝜌𝑎𝑖𝑟 is the density of the air,
𝑐 is the heat capacity of the air,
𝑞𝑙ä𝑐𝑘 is the building air leakage,
𝑞𝑣𝑒𝑛𝑡 is the infiltration air change rate,
v is the heat recovery efficiency,
d is the relative uptime of the ventilation.
DVUT is acquired from Table 18 after calculating the buildings time constant 𝜏𝑏 . To calculate 𝜏𝑏 is
rather complicated and time consuming activity. However, in the buildings planning phase it is allowed
to roughly estimate this time constant (Erlandsson, et al., 2012). The following time constant
approximations are used to find the DVUT from table 18.
Building Type 𝝉𝒃 Building type description
Light building: 3 days (light construction and crawl space)
Half-light building: 6 days (light construction, concrete ground)
Half-heavy building: 12 days (heavy construction, concrete beams, light curtain walls)
Heavy building: 12 days Maximum of 12 days is used during HLN calculations.
17
5 Method These are the methods used when simulating, evaluating, calculating and improving upon the given
data of the ESH.
5.1 Study As mentioned previously, the literature study has been done for the purpose of understanding passive
houses while also clarifying the concept. This literature study was also meant to cover the basic
principles of passive houses, previous relevant work in the field, as well as looking at different regional
regulations regarding the passive house classification. After the literature study, relevant simulations,
a sensitivity analysis and evaluation of regional differences was made using the passive house
certification software Passive House Planning Package (PHPP).
The needed ESH data is given in different PHPP documents. Some segments of how this data is used is
presented further below in Figure 7 and Figure 8. Therefore in order to meet the certain PH
classifications, the ESH data is put together in PHPP together with relevant climate data found for the
specific region simulated.
The partial sensitivity analysis is made by noting how relevant results change when adjusting the
energy related parameters of the ESH, one at a time, while keeping the others constant. These different
parameters are those such as the insulation thickness, window types, ventilation parameters, domestic
hot water parameters (DHW) etc. In other words, get a better understanding of the relationships
between the inputs and outputs of PHPP. This is done while also noting what contributes to a change
of the certification factors the most.
5.2 The Passive House Planning Package The Passive house planning package (PHPP) is the software used in this project and is a tool for
modeling and simulating passive house performances. It has a spreadsheet design and is a modified
excel document. PHPP has lately become widely adopted as one of the most common tool for
classifying passive houses according to the European passive house classification (Moran, et al., 2013).
One of the reasons as to why PHPP is widely chosen is because its transparency, namely that all
calculations and implementations are fully displayed (Moran, et al., 2013).
PHPP is built around different data sheets, where each sheet contains a specific data input segment.
These sheets include parts of the building such as the building areas, the U-values, the Windows, the
ventilation, the climate data (see Table 19 - Table 24 in the appendix), the verification results and many
more. PHPP is made so that each sheet is built with calculations linking your input data to other
relevant calculations. When all the received input data is defined in PHPP, the passive house
classification parameters results will be listed under the verification sheet.
Regarding ventilation modeling, PHPP by default expects a single ventilation system for the entire
building envelope. However if needed there is an advanced mode allowing for taking up to 10 different
ventilation units into consideration (Feist, et al., 2012).
PHPP does not consider some issues related to the energy efficiency measures such as the rebound
effect. The rebound effect can be explained as the term for how the benefits gained from energy
efficiency measures are lower than expected, often due to the system/building operation practices by
its occupants. Since PHPP does not take this behavior into consideration it means that the energy
18
savings calculated might be high (Moran, et al., 2013). While the rebound effect might cause actual
lower energy savings than expected, it does immediately affect the actual passive house certification.
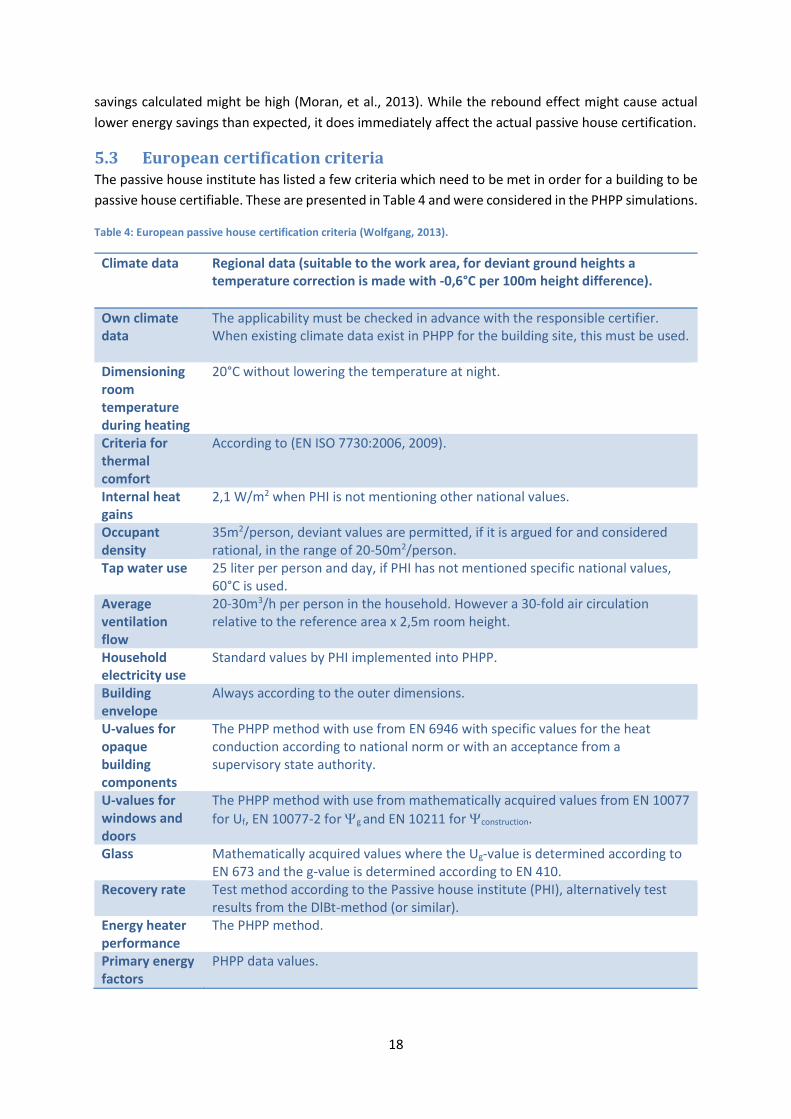
5.3 European certification criteria The passive house institute has listed a few criteria which need to be met in order for a building to be
passive house certifiable. These are presented in Table 4 and were considered in the PHPP simulations.
Table 4: European passive house certification criteria (Wolfgang, 2013).
Climate data Regional data (suitable to the work area, for deviant ground heights a temperature correction is made with -0,6°C per 100m height difference).
Own climate data
The applicability must be checked in advance with the responsible certifier. When existing climate data exist in PHPP for the building site, this must be used.
Dimensioning room temperature during heating
20°C without lowering the temperature at night.
Criteria for thermal comfort
According to (EN ISO 7730:2006, 2009).
Internal heat gains
2,1 W/m2 when PHI is not mentioning other national values.
Occupant density
35m2/person, deviant values are permitted, if it is argued for and considered rational, in the range of 20-50m2/person.
Tap water use 25 liter per person and day, if PHI has not mentioned specific national values, 60°C is used.
Average ventilation flow
20-30m3/h per person in the household. However a 30-fold air circulation relative to the reference area x 2,5m room height.
Household electricity use
Standard values by PHI implemented into PHPP.
Building envelope
Always according to the outer dimensions.
U-values for opaque building components
The PHPP method with use from EN 6946 with specific values for the heat conduction according to national norm or with an acceptance from a supervisory state authority.
U-values for windows and doors
The PHPP method with use from mathematically acquired values from EN 10077
for Uf, EN 10077-2 for g and EN 10211 for construction.
Glass Mathematically acquired values where the Ug-value is determined according to EN 673 and the g-value is determined according to EN 410.
Recovery rate Test method according to the Passive house institute (PHI), alternatively test results from the DlBt-method (or similar).
Energy heater performance
The PHPP method.
Primary energy factors
PHPP data values.
19
5.4 Building assembly The construction of the model is defining specific values related to the ESH building design in PHPP’s
excel sheets. Here is an explanation of how the building elements U-values and the building air ducts
are defined in PHPP.
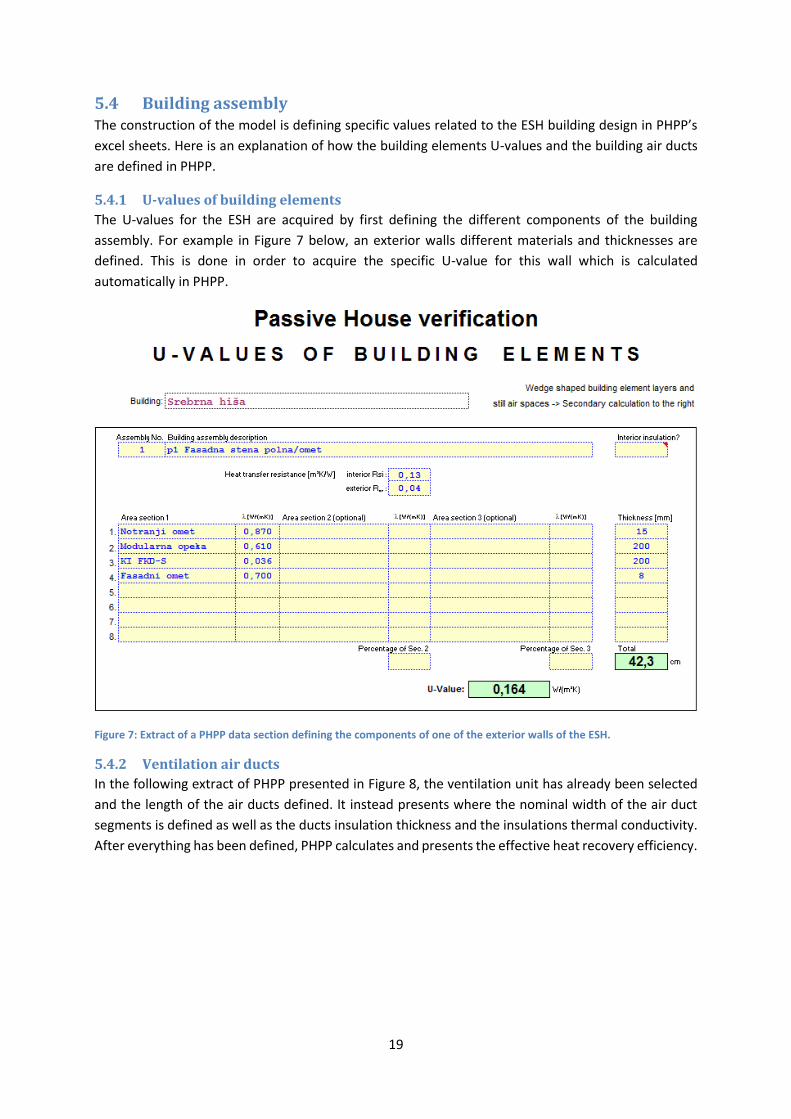
5.4.1 U-values of building elements
The U-values for the ESH are acquired by first defining the different components of the building
assembly. For example in Figure 7 below, an exterior walls different materials and thicknesses are
defined. This is done in order to acquire the specific U-value for this wall which is calculated
automatically in PHPP.
Figure 7: Extract of a PHPP data section defining the components of one of the exterior walls of the ESH.
5.4.2 Ventilation air ducts
In the following extract of PHPP presented in Figure 8, the ventilation unit has already been selected
and the length of the air ducts defined. It instead presents where the nominal width of the air duct
segments is defined as well as the ducts insulation thickness and the insulations thermal conductivity.
After everything has been defined, PHPP calculates and presents the effective heat recovery efficiency.
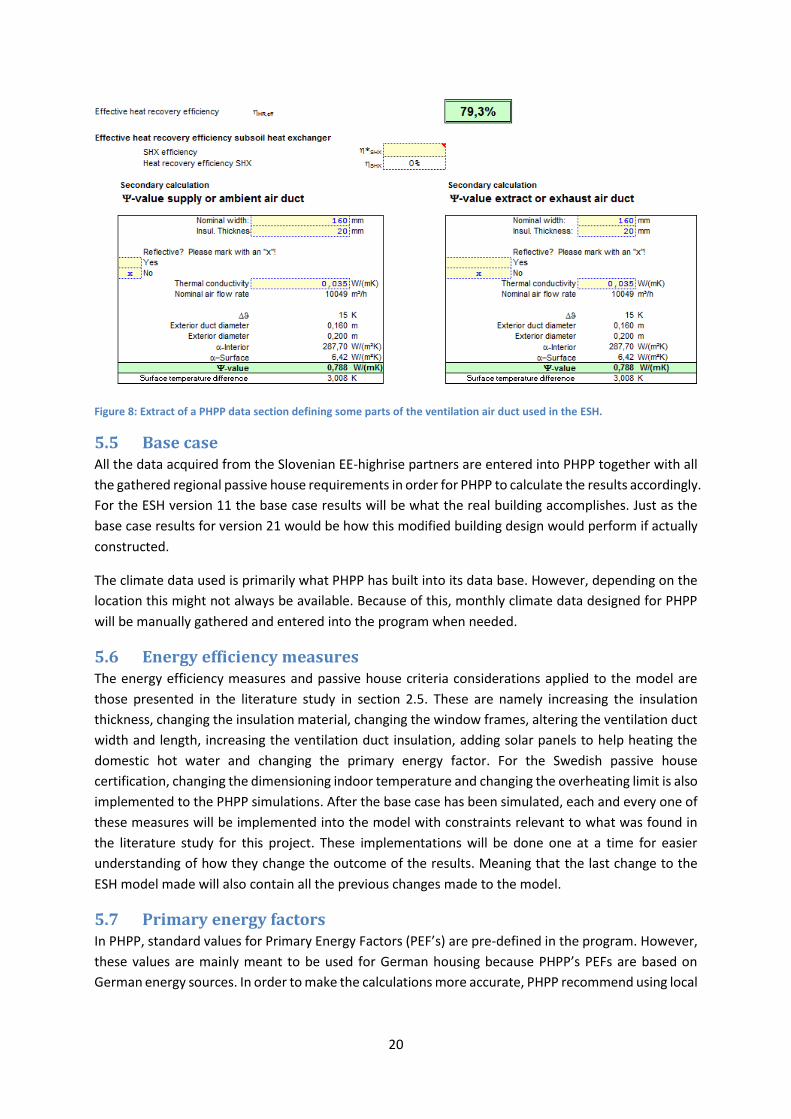
20
Figure 8: Extract of a PHPP data section defining some parts of the ventilation air duct used in the ESH.
5.5 Base case All the data acquired from the Slovenian EE-highrise partners are entered into PHPP together with all
the gathered regional passive house requirements in order for PHPP to calculate the results accordingly.
For the ESH version 11 the base case results will be what the real building accomplishes. Just as the
base case results for version 21 would be how this modified building design would perform if actually
constructed.
The climate data used is primarily what PHPP has built into its data base. However, depending on the
location this might not always be available. Because of this, monthly climate data designed for PHPP
will be manually gathered and entered into the program when needed.
5.6 Energy efficiency measures The energy efficiency measures and passive house criteria considerations applied to the model are
those presented in the literature study in section 2.5. These are namely increasing the insulation
thickness, changing the insulation material, changing the window frames, altering the ventilation duct
width and length, increasing the ventilation duct insulation, adding solar panels to help heating the
domestic hot water and changing the primary energy factor. For the Swedish passive house
certification, changing the dimensioning indoor temperature and changing the overheating limit is also
implemented to the PHPP simulations. After the base case has been simulated, each and every one of
these measures will be implemented into the model with constraints relevant to what was found in
the literature study for this project. These implementations will be done one at a time for easier
understanding of how they change the outcome of the results. Meaning that the last change to the
ESH model made will also contain all the previous changes made to the model.
5.7 Primary energy factors In PHPP, standard values for Primary Energy Factors (PEF’s) are pre-defined in the program. However,
these values are mainly meant to be used for German housing because PHPP’s PEFs are based on
German energy sources. In order to make the calculations more accurate, PHPP recommend using local
21
values depending on which region the building will be simulated in. Because of this, the primary energy
factors used in the simulations of the ESH for the different regions differ between countries.
The Slovenian PEF’s which were used were taken from the EUROSTAT primary energy data (Kurnitski,
2010). In the acquired data given by the EE-highrise partners, primary energy factors were given which
also closely resembles the primary energy factors taken from EUROSTAT. Because of this close
resemblance, the data from EUROSTAT is used in the Slovenian simulations. However, due to the
limitations with finding Croatian primary energy factors, the simulations made with the climate data
from Sibernik will use PEF’s from the standardized European factors (EF) (ISO 16346, 2013).
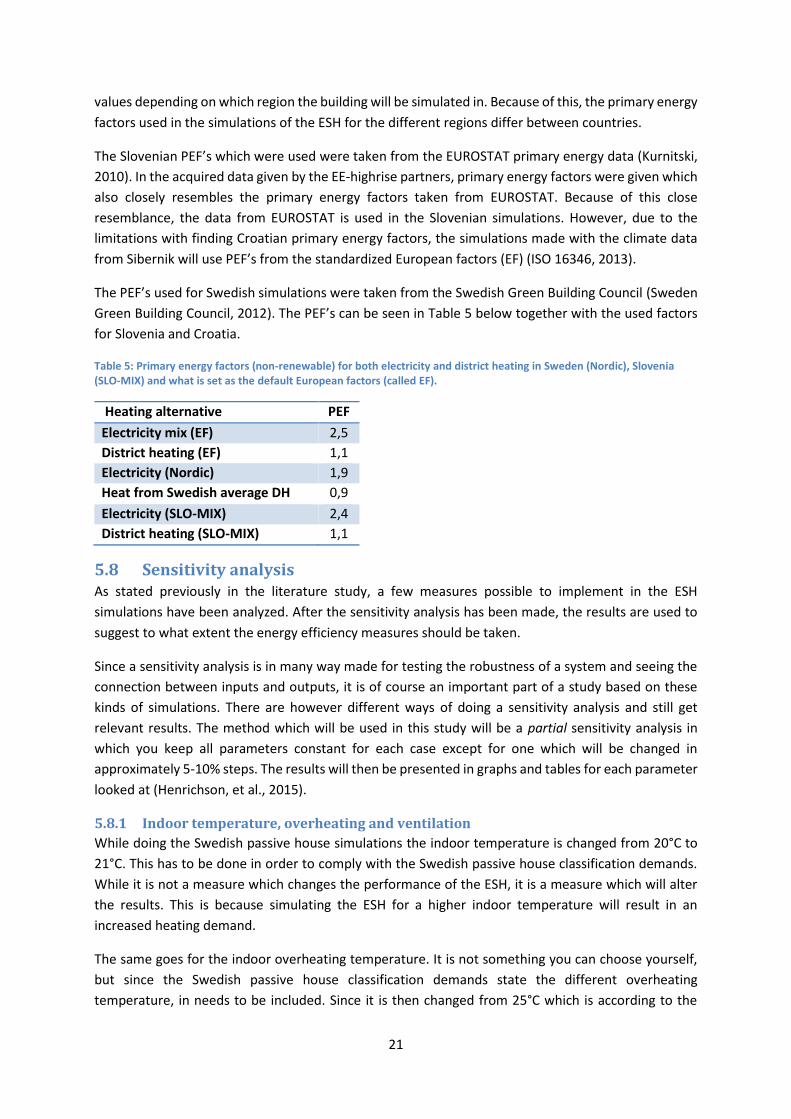
The PEF’s used for Swedish simulations were taken from the Swedish Green Building Council (Sweden
Green Building Council, 2012). The PEF’s can be seen in Table 5 below together with the used factors
for Slovenia and Croatia.
Table 5: Primary energy factors (non-renewable) for both electricity and district heating in Sweden (Nordic), Slovenia (SLO-MIX) and what is set as the default European factors (called EF).
Heating alternative PEF
Electricity mix (EF) 2,5
District heating (EF) 1,1
Electricity (Nordic) 1,9
Heat from Swedish average DH 0,9
Electricity (SLO-MIX) 2,4
District heating (SLO-MIX) 1,1
5.8 Sensitivity analysis As stated previously in the literature study, a few measures possible to implement in the ESH
simulations have been analyzed. After the sensitivity analysis has been made, the results are used to
suggest to what extent the energy efficiency measures should be taken.
Since a sensitivity analysis is in many way made for testing the robustness of a system and seeing the
connection between inputs and outputs, it is of course an important part of a study based on these
kinds of simulations. There are however different ways of doing a sensitivity analysis and still get
relevant results. The method which will be used in this study will be a partial sensitivity analysis in
which you keep all parameters constant for each case except for one which will be changed in
approximately 5-10% steps. The results will then be presented in graphs and tables for each parameter
looked at (Henrichson, et al., 2015).
5.8.1 Indoor temperature, overheating and ventilation
While doing the Swedish passive house simulations the indoor temperature is changed from 20°C to
21°C. This has to be done in order to comply with the Swedish passive house classification demands.
While it is not a measure which changes the performance of the ESH, it is a measure which will alter
the results. This is because simulating the ESH for a higher indoor temperature will result in an
increased heating demand.
The same goes for the indoor overheating temperature. It is not something you can choose yourself,
but since the Swedish passive house classification demands state the different overheating
temperature, in needs to be included. Since it is then changed from 25°C which is according to the
22
European classification, to 26°C which is according to the Swedish classification, the results will show
that the ESH is overheated less during summer. This also cause a lesser cooling demand because the
temperature of when it is considered overheating is higher.
As listed in Table 1, the heat recovery efficiency for the heat recovery unit needs to be at least 75% in
order to be passive house certifiable. While the unit used in the ESH is at a certified heat recovery at
83%, the effective heat recovery, which is the heat recovery after taking heat loss into consideration,
in the ESH can be improved by minimizing heat losses from the ventilation air ducts. In the base case
of version 11 of the ESH, calculated by PHPP, the effective heat recovery is at approximately 50%, with
minor fluctuations depending on the regional climate data. This implies that there are heat losses
through the air duct system. While not being a part of version 11, the structural energy efficiency
measures listed in the literature study in section 2.5 have already been added into version 21 of the
ESH. These structural changes are changing the nominal width of the air ducts and changing the length
of the outdoor air ducts and exhaust air ducts. Because of these already set design changes, they are
also added into the simulations ESH version 11 as part of the sensitivity analysis. The measures
mentioned are especially important between the air intake and the heat recovery ventilation unit. This
is because the air duct is not as insulated as, for example, the walls of the ESH. So if there are a lot of
air duct surface exposed to the outside, there will be a significant energy loss (Firestone, 2011). While
the nominal width and length of the ventilation ducts already use set values from ESH version 21, the
air duct insulation can be examined more thoroughly with a partial sensitivity analysis. The structural
design of the air ducts are assumed to display the most significant change of energy reduction, since
version 21 shows a significantly higher heat recovery. However, an energy reduction is still expected
from changing the insulation.
5.8.2 Insulation, windows, and DHW with solar panels
Increasing the insulation, changing the window frames as well as adding solar panels are the measures
included in the sensitivity analysis. Therefore they will also later be evaluated about their relevancy in
improving the model.
In the base case, which is the simulation in which the given ESH model is not altered, the insulation is
set to have a thickness of 20 cm. As stated in the literature study, it is possible to add up to 45 cm of
insulation in the outer walls of the ESH giving a possible increase of 25 cm of the insulation thickness.
It is also possible to change the insulation material to one with a lesser heat conductivity. The insulation
used in the base case is referred to as the Slovenian insulation. It is actually called KI FKD-S and is the
insulation specified in the ESH model. Version 11 of the ESH was built mainly with the Slovenian
insulation. It is stone wool insulation with a variable thickness (Knauf Insulation, 2015). This insulation
has a heat conductivity of 0.036 W/mK. However, in Sweden this might not be enough because of the
colder winters. Therefore, these regions require better insulation to reduce the heat loss. So in order
to accommodate for the more northern climate in Sweden, and not to be forced to use an unrealistic
insulation thickness, a Swedish insulation called SPU Vind was implemented into PHPP instead of the
KI FKD-S insulation. The Swedish insulation has a heat conductivity of 0.023 W/mK (SPU, 2015).
The windows frames used in the model can be switched to frames with lower heat conductivity.
According to Table 1 and Table 2, a passive house window needs an overall U-value below 0.8W/m2K.
The Slovenian window glazing types Zas Okna, Zas Stek stene and Zas ognjevarno all have the Ug-value
(The U-value of the glazing) of 0.6W/m2K, and were used during the construction of ESH version 11.
23
They all meet the passive house requirements and have Ug-values well below the built in window
glazing suggestions Ug-values in PHPP. The same cannot be said about the window frames used. They
all have an Uf-value (The U-value of the frames) of 1 W/m2K which is higher than the majority of the
pre-existing PHPP window frame suggestions. The passive house institute has a component database
for building material suggestions. By using one of the top performing window frames like the FIX Glas
Trösch - Composite Glazing - Festverglasung - withSuperSp. TriSeal PU, you can lower the Uf-values to
0.58 W/m2K.
The last parameter looked at in the sensitivity analysis is the domestic hot water and its primary energy
contribution. While not being part of the data acquired for the ESH version 11 and version 21 because
of conversion problems between programs, solar panels are already incorporated into the ESH project.
16 rows of solar panels are expected to be placed on the roof of the ESH (see Figure 3). Adding these
in the simulations can lower the needed primary energy. However, since this data has not been
acquired, it means that if solar panels are to be implemented into the PHPP simulations. However,
they might not be completely truthful to the actual case since the actual solar panels used in the ESH
are unknown. Because of this, a standardized solar panel type recommended by PHPP have been used.
The solar panels collection area and their configuration have also been unknown. However, by
measuring the lengths of the upper ESH roof while cross checking with Figure 3 and the ESH floor plans,
it is determined that the panels are facing south, have an angle of inclination from the horizontal of
about 35° and that the solar collector area is around 300 m2. This approximation is also close in
accordance to what would be the result using the recommendations set in the PHPP user manual
mentioned in the literature study. In the sensitivity analysis, the collector area is the unit which will be
variable. In this case, the simulations will be going from -25% to +25% because of the approximated
reference value.
5.9 Heat loss number calculations for the Swedish standard As mentioned previously, the Swedish passive house classification does not look at parameters as the
European passive house classification does. As an example, instead of evaluating the primary energy
demand, the Swedish passive house classification evaluates the Heat loss number (HLN) which is
calculated from equation 7. However, equation 8 is needed to calculate the parameter 𝐻𝑇 used in
equation 7. Most of the data needed for making these calculations can be gathered directly from PHPP.
However the DVUT data can be acquired from Table 18 in the appendix. The properties of air are taken
from the Heat and Mass transfer – Fundamentals and Applications-book. Finally, the buildings time
constant 𝜏𝑏 is approximated according to FEBY 12, since the work is still is in a planning-phase in
regards to the newer ESH models.
5.10 Yearly energy delivered to buildings for the Swedish standard The delivered yearly energy to buildings parameter is a combination of the annual heating demand
and the total specific heating demand of the domestic hot water system. However, the yearly delivered
energy to buildings is not calculated in PHPP. Nevertheless, the annual heating demand and the total
specific heating demand of the DHW system is calculated. To calculate the yearly delivered energy
parameter, the above two calculated values are added.
5.11 Limitations There is a newer version of the Eco Silver House (ESH) model which is currently being developed called
the ESH version 21. At first this model was disregarded as incomplete after having a conversation with
24
the EE-highrise partners. Because of this, this thesis work limits itself to look at the version 11 of the
ESH model. During the late stages of the thesis work, it was shown that preliminary simulations could
be done on the version 21 of the ESH model. Because of this, a max case scenario of these simulations
was decided to be included. However, these results will be more limited because of time and the
amount of acquired data, in comparison to the work carried out on the ESH version 11.
In the beginning of this thesis project it was stated by the EE-highrise partners that they would like to
evaluate different heating options (Centralized, decentralized and so on). However, all of these heating
options will not be considered in this thesis work. Because, in the advanced mode of PHPP it is only
possible to simulate up to 10 different ventilation systems. Due to the limitations of this advanced
mode, the different heating options wished for in the ESH project might not be able to be implemented
into the ESH model in PHPP. This is because of the fact that 10 different ventilation systems is not even
close to enough for such a big building as the ESH. For example, the advanced mode would require
more than one system per floor in the ESH building. Therefore, this thesis will focus on having one
ventilation system for the whole building. However, this might not correlate perfectly with how the
building might be constructed in the ESH project.
The regions considered for the climate simulations are Ljubljana in Slovenia, Sibernik in Croatia and
Lund, Östersund/Sundsvall and Kiruna in Sweden. The reason for the distinction between Östersund
and Sundsvall is because the European study was looking at the southern, middle and northern Sweden.
However, Östersund belongs to climate zone 1 just as Kiruna. So in order to have climate zone specific
simulations for the Swedish passive house classification study, Östersund was replaced with Sundsvall.
However, due to time limitations, Östersund was kept in the European simulations.
When looking at primary energy factors, the European standardized values according to (ISO 16346,
2013) were used for Croatia. This is because of the difficulty to find reliable sources listing Croatian
primary energy factors. Since the Swedish and Slovenian simulations use primary energy factors which
are backed up by sources listing these specific factors, the simulation results for these regions should
be considered more accurate regarding primary energy than the simulations made with the Croatian
values.
The solar panels of the ESH are another limitation. While they have been accepted as a part of the ESH,
there the data acquired for the PHPP simulations contained no such information. As stated by the EE-
highrise partner Akropola at the end of the thesis project, this lack of data was due to the fact that
there are problems when converting a BIM-model into PHPP. This means that the simulations made
with solar panels might not perfectly represent the actual case. However, the sensitivity analysis
should still be relevant when it comes to discussing about the significance of having solar panels on
the ESH, built to decrease the primary energy need.
The Swedish passive house classification calculations were made using an approximate value of the
time constant (see chapter 4.4 Heat loss Number) following the procedure of FEBY12. While it being
allowed in simulation stages such as this, it can be argued that the acquired results will be different
from the actual performance and should not be taken as completely true.
Simulation wise, PHPP does not do dynamic calculations. It will always be put in a steady state mode.
This means that time variances are not really taken into consideration because of the state

25
methodologies. PHPP also only use monthly values for the climate data inputs further decreasing the
monthly variance in the results (Badescu, et al., 2010).
The Annual energy demand for the Swedish passive house classification is not included in the results.
This is the consequence of PHPP being a calculation based tool made only for the European passive
house classification. Since the Swedish passive house classification evaluates the heat loss number,
max yearly energy delivered and the annual energy demand rather than the annual heating demand,
heating load, overall specific cooling demand, cooling load and primary energy demand which are used
in the European passive house classification, calculations have to be done outside of PHPP in order to
acquire the desired results.
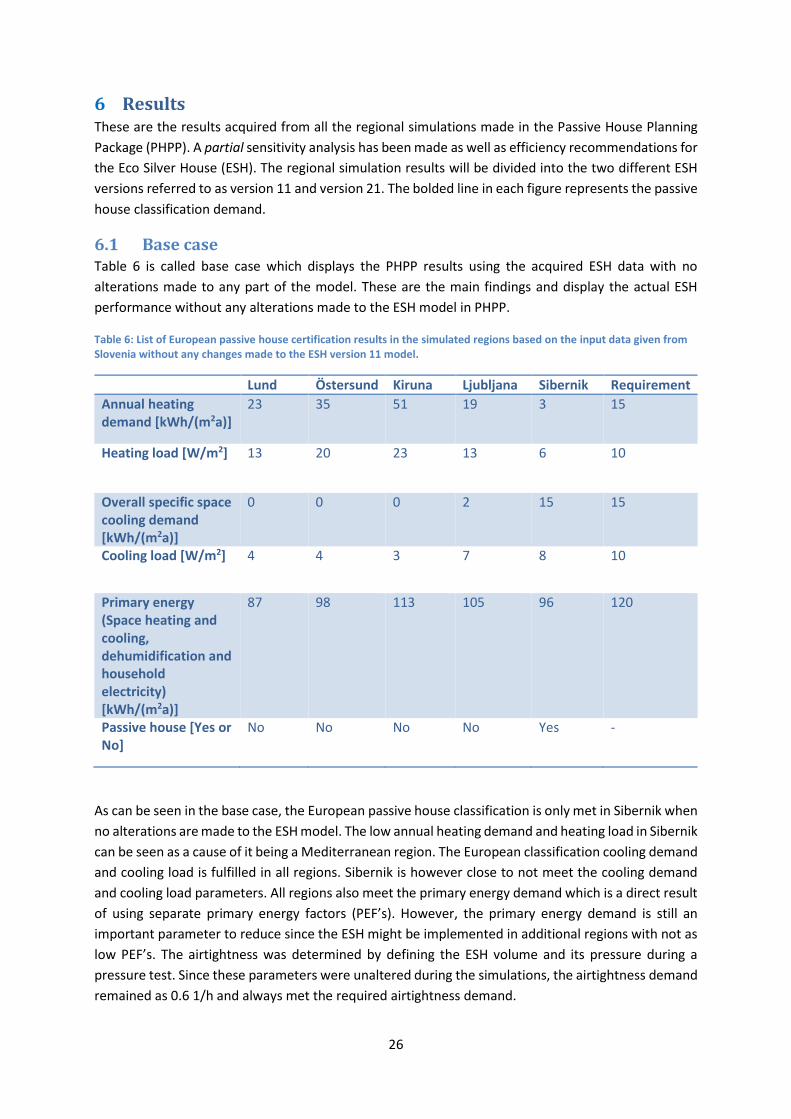
26
6 Results These are the results acquired from all the regional simulations made in the Passive House Planning
Package (PHPP). A partial sensitivity analysis has been made as well as efficiency recommendations for
the Eco Silver House (ESH). The regional simulation results will be divided into the two different ESH
versions referred to as version 11 and version 21. The bolded line in each figure represents the passive
house classification demand.
6.1 Base case Table 6 is called base case which displays the PHPP results using the acquired ESH data with no
alterations made to any part of the model. These are the main findings and display the actual ESH
performance without any alterations made to the ESH model in PHPP.
Table 6: List of European passive house certification results in the simulated regions based on the input data given from Slovenia without any changes made to the ESH version 11 model.
Lund Östersund Kiruna Ljubljana Sibernik Requirement
Annual heating demand [kWh/(m2a)]
23 35 51 19 3 15
Heating load [W/m2] 13 20 23 13 6 10
Overall specific space cooling demand [kWh/(m2a)]
0 0 0 2 15 15
Cooling load [W/m2] 4 4 3 7 8 10
Primary energy (Space heating and cooling, dehumidification and household electricity) [kWh/(m2a)]
87 98 113 105 96 120
Passive house [Yes or No]
No No No No Yes -
As can be seen in the base case, the European passive house classification is only met in Sibernik when
no alterations are made to the ESH model. The low annual heating demand and heating load in Sibernik
can be seen as a cause of it being a Mediterranean region. The European classification cooling demand
and cooling load is fulfilled in all regions. Sibernik is however close to not meet the cooling demand
and cooling load parameters. All regions also meet the primary energy demand which is a direct result
of using separate primary energy factors (PEF’s). However, the primary energy demand is still an
important parameter to reduce since the ESH might be implemented in additional regions with not as
low PEF’s. The airtightness was determined by defining the ESH volume and its pressure during a
pressure test. Since these parameters were unaltered during the simulations, the airtightness demand
remained as 0.6 1/h and always met the required airtightness demand.
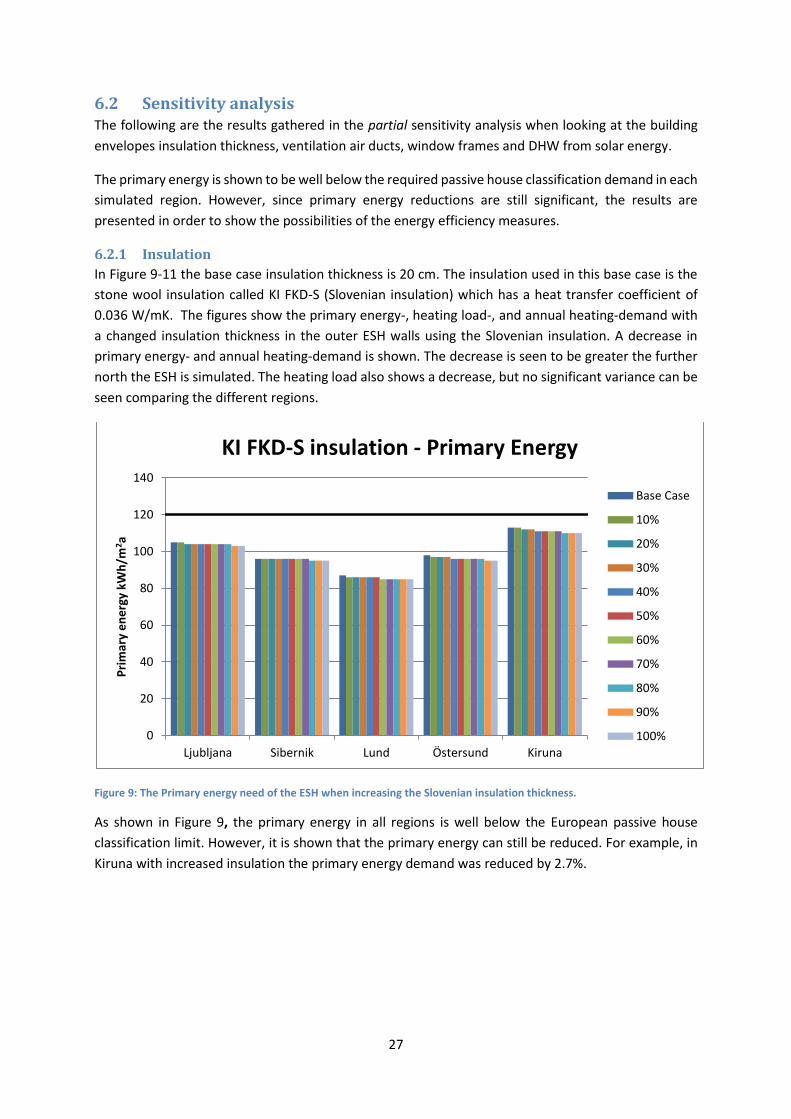
27
6.2 Sensitivity analysis The following are the results gathered in the partial sensitivity analysis when looking at the building
envelopes insulation thickness, ventilation air ducts, window frames and DHW from solar energy.
The primary energy is shown to be well below the required passive house classification demand in each
simulated region. However, since primary energy reductions are still significant, the results are
presented in order to show the possibilities of the energy efficiency measures.
6.2.1 Insulation
In Figure 9-11 the base case insulation thickness is 20 cm. The insulation used in this base case is the
stone wool insulation called KI FKD-S (Slovenian insulation) which has a heat transfer coefficient of
0.036 W/mK. The figures show the primary energy-, heating load-, and annual heating-demand with
a changed insulation thickness in the outer ESH walls using the Slovenian insulation. A decrease in
primary energy- and annual heating-demand is shown. The decrease is seen to be greater the further
north the ESH is simulated. The heating load also shows a decrease, but no significant variance can be
seen comparing the different regions.
Figure 9: The Primary energy need of the ESH when increasing the Slovenian insulation thickness.
As shown in Figure 9, the primary energy in all regions is well below the European passive house
classification limit. However, it is shown that the primary energy can still be reduced. For example, in
Kiruna with increased insulation the primary energy demand was reduced by 2.7%.
0
20
40
60
80
100
120
140
Ljubljana Sibernik Lund Östersund Kiruna
Pri
mar
y e
ne
rgy
kWh
/m2a
KI FKD-S insulation - Primary Energy
Base Case
10%
20%
30%
40%
50%
60%
70%
80%
90%
100%
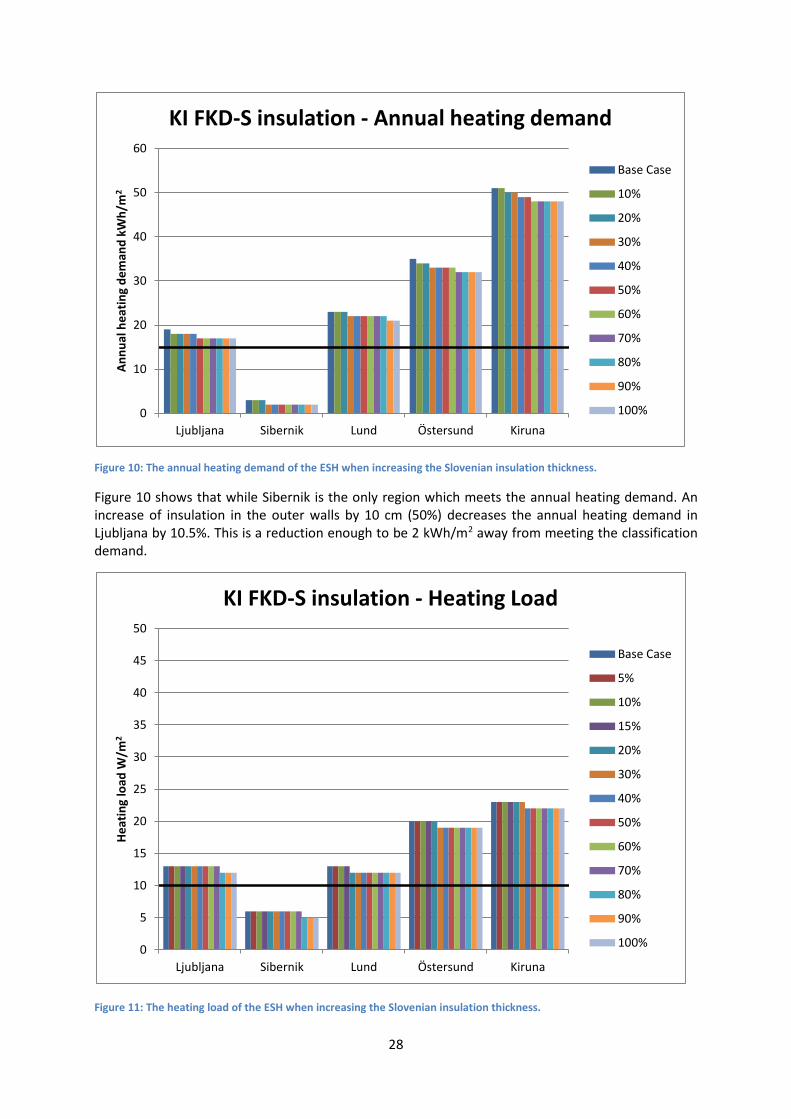
28
Figure 10: The annual heating demand of the ESH when increasing the Slovenian insulation thickness.
Figure 10 shows that while Sibernik is the only region which meets the annual heating demand. An increase of insulation in the outer walls by 10 cm (50%) decreases the annual heating demand in Ljubljana by 10.5%. This is a reduction enough to be 2 kWh/m2 away from meeting the classification demand.
Figure 11: The heating load of the ESH when increasing the Slovenian insulation thickness.
0
10
20
30
40
50
60
Ljubljana Sibernik Lund Östersund Kiruna
An
nu
al h
eat
ing
de
man
d k
Wh
/m2
KI FKD-S insulation - Annual heating demand
Base Case
10%
20%
30%
40%
50%
60%
70%
80%
90%
100%
0
5
10
15
20
25
30
35
40
45
50
Ljubljana Sibernik Lund Östersund Kiruna
He
atin
g lo
ad W
/m2
KI FKD-S insulation - Heating Load
Base Case
5%
10%
15%
20%
30%
40%
50%
60%
70%
80%
90%
100%
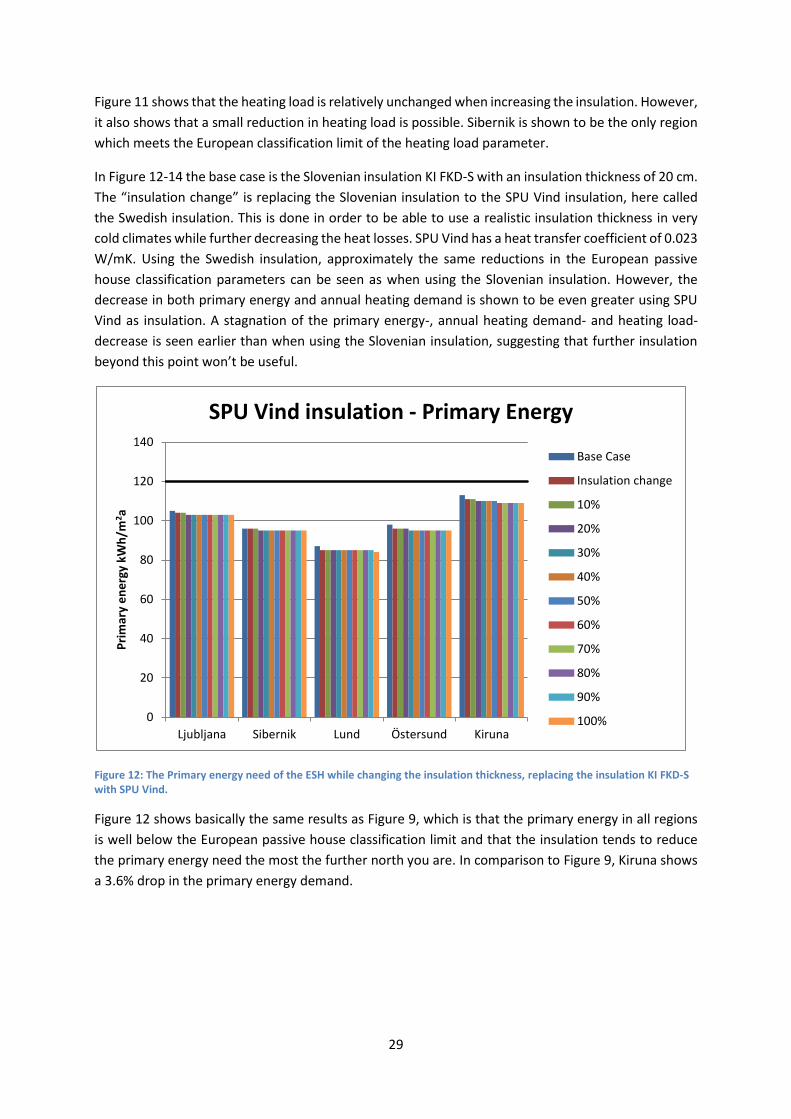
29
Figure 11 shows that the heating load is relatively unchanged when increasing the insulation. However,
it also shows that a small reduction in heating load is possible. Sibernik is shown to be the only region
which meets the European classification limit of the heating load parameter.
In Figure 12-14 the base case is the Slovenian insulation KI FKD-S with an insulation thickness of 20 cm.
The “insulation change” is replacing the Slovenian insulation to the SPU Vind insulation, here called
the Swedish insulation. This is done in order to be able to use a realistic insulation thickness in very
cold climates while further decreasing the heat losses. SPU Vind has a heat transfer coefficient of 0.023
W/mK. Using the Swedish insulation, approximately the same reductions in the European passive
house classification parameters can be seen as when using the Slovenian insulation. However, the
decrease in both primary energy and annual heating demand is shown to be even greater using SPU
Vind as insulation. A stagnation of the primary energy-, annual heating demand- and heating load-
decrease is seen earlier than when using the Slovenian insulation, suggesting that further insulation
beyond this point won’t be useful.
Figure 12: The Primary energy need of the ESH while changing the insulation thickness, replacing the insulation KI FKD-S with SPU Vind.
Figure 12 shows basically the same results as Figure 9, which is that the primary energy in all regions
is well below the European passive house classification limit and that the insulation tends to reduce
the primary energy need the most the further north you are. In comparison to Figure 9, Kiruna shows
a 3.6% drop in the primary energy demand.
0
20
40
60
80
100
120
140
Ljubljana Sibernik Lund Östersund Kiruna
Pri
mar
y e
ne
rgy
kWh
/m2 a
SPU Vind insulation - Primary Energy
Base Case
Insulation change
10%
20%
30%
40%
50%
60%
70%
80%
90%
100%
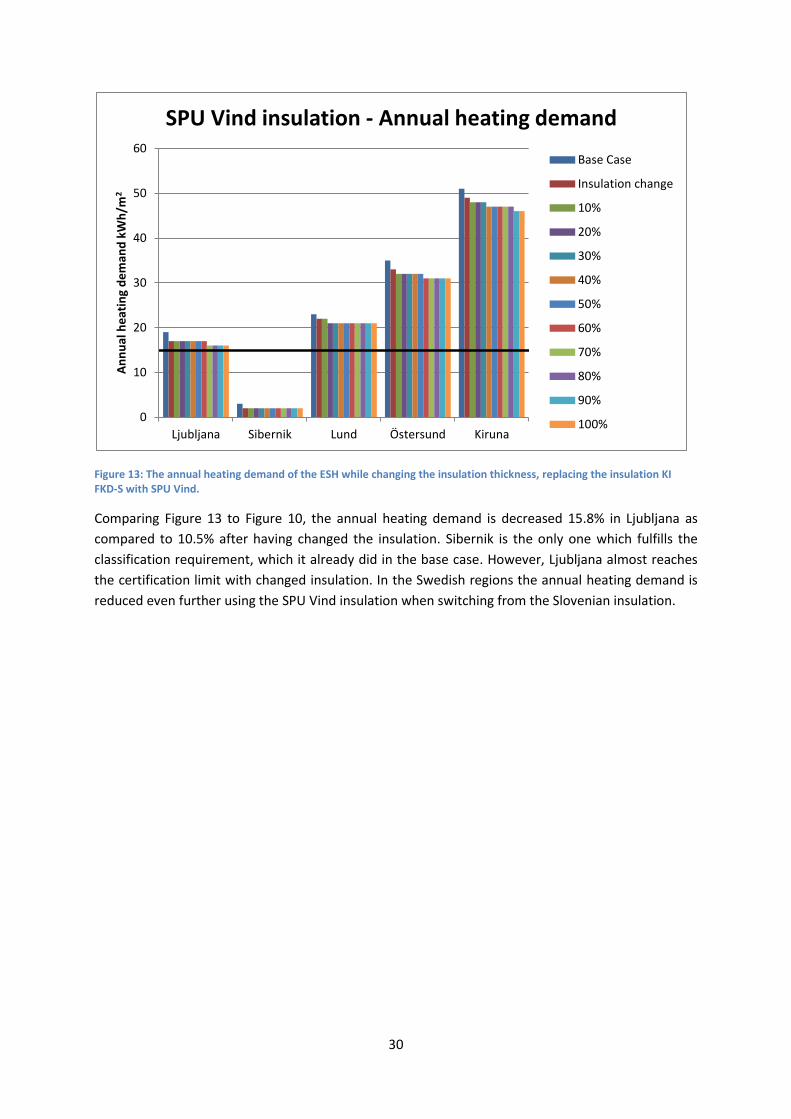
30
Figure 13: The annual heating demand of the ESH while changing the insulation thickness, replacing the insulation KI FKD-S with SPU Vind.
Comparing Figure 13 to Figure 10, the annual heating demand is decreased 15.8% in Ljubljana as
compared to 10.5% after having changed the insulation. Sibernik is the only one which fulfills the
classification requirement, which it already did in the base case. However, Ljubljana almost reaches
the certification limit with changed insulation. In the Swedish regions the annual heating demand is
reduced even further using the SPU Vind insulation when switching from the Slovenian insulation.
0
10
20
30
40
50
60
Ljubljana Sibernik Lund Östersund Kiruna
An
nu
al h
eat
ing
de
man
d k
Wh
/m2
SPU Vind insulation - Annual heating demand
Base Case
Insulation change
10%
20%
30%
40%
50%
60%
70%
80%
90%
100%
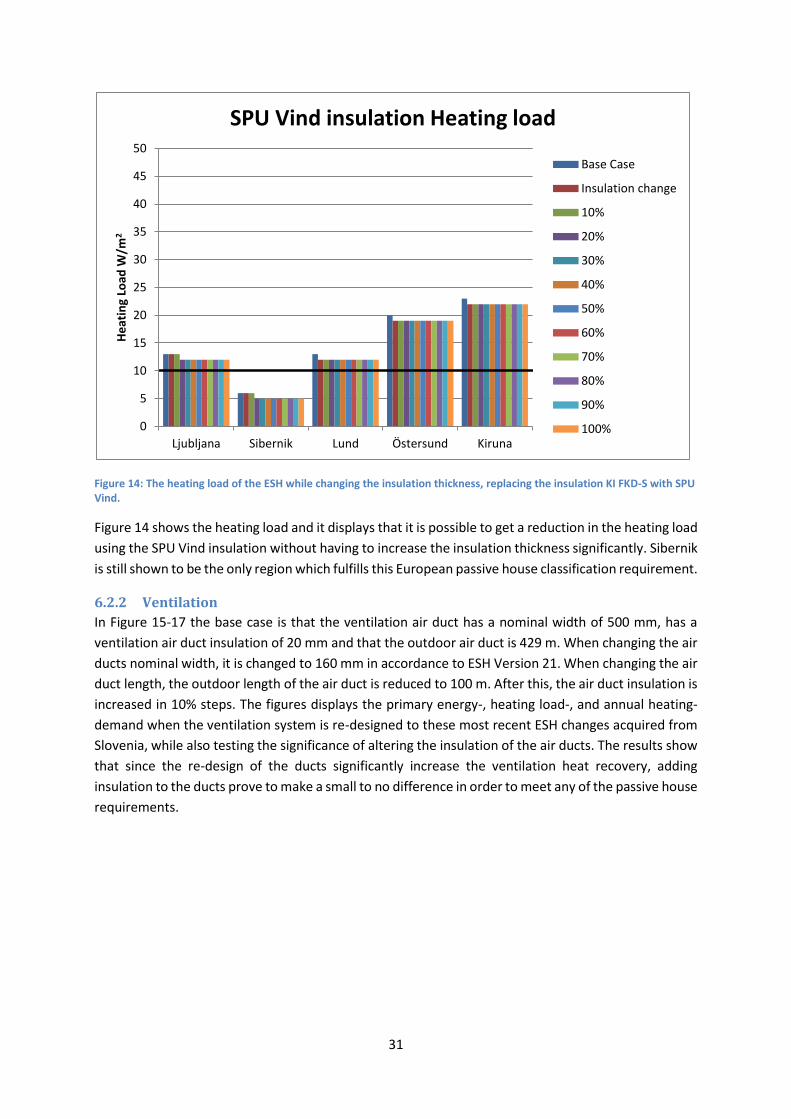
31
Figure 14: The heating load of the ESH while changing the insulation thickness, replacing the insulation KI FKD-S with SPU Vind.
Figure 14 shows the heating load and it displays that it is possible to get a reduction in the heating load
using the SPU Vind insulation without having to increase the insulation thickness significantly. Sibernik
is still shown to be the only region which fulfills this European passive house classification requirement.
6.2.2 Ventilation
In Figure 15-17 the base case is that the ventilation air duct has a nominal width of 500 mm, has a
ventilation air duct insulation of 20 mm and that the outdoor air duct is 429 m. When changing the air
ducts nominal width, it is changed to 160 mm in accordance to ESH Version 21. When changing the air
duct length, the outdoor length of the air duct is reduced to 100 m. After this, the air duct insulation is
increased in 10% steps. The figures displays the primary energy-, heating load-, and annual heating-
demand when the ventilation system is re-designed to these most recent ESH changes acquired from
Slovenia, while also testing the significance of altering the insulation of the air ducts. The results show
that since the re-design of the ducts significantly increase the ventilation heat recovery, adding
insulation to the ducts prove to make a small to no difference in order to meet any of the passive house
requirements.
0
5
10
15
20
25
30
35
40
45
50
Ljubljana Sibernik Lund Östersund Kiruna
He
atin
g Lo
ad W
/m2
SPU Vind insulation Heating load
Base Case
Insulation change
10%
20%
30%
40%
50%
60%
70%
80%
90%
100%
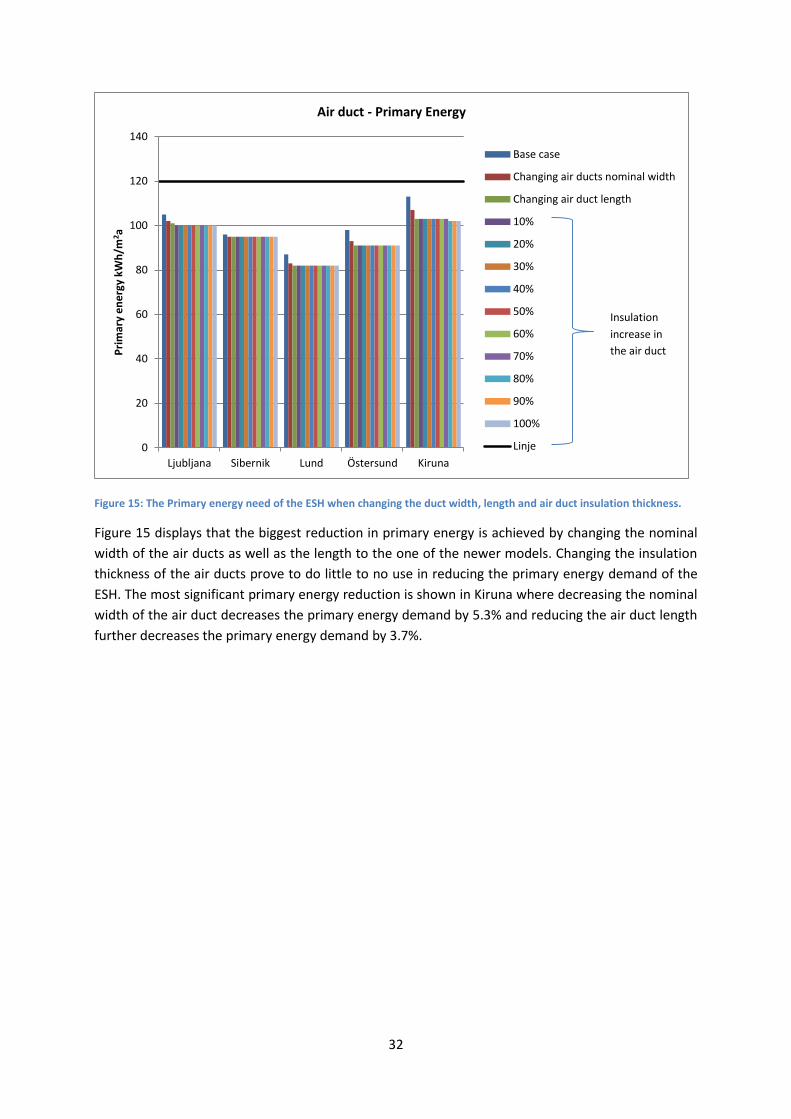
32
Figure 15: The Primary energy need of the ESH when changing the duct width, length and air duct insulation thickness.
Figure 15 displays that the biggest reduction in primary energy is achieved by changing the nominal
width of the air ducts as well as the length to the one of the newer models. Changing the insulation
thickness of the air ducts prove to do little to no use in reducing the primary energy demand of the
ESH. The most significant primary energy reduction is shown in Kiruna where decreasing the nominal
width of the air duct decreases the primary energy demand by 5.3% and reducing the air duct length
further decreases the primary energy demand by 3.7%.
0
20
40
60
80
100
120
140
Ljubljana Sibernik Lund Östersund Kiruna
Pri
mar
y e
ne
rgy
kWh
/m2 a
Air duct - Primary Energy
Base case
Changing air ducts nominal width
Changing air duct length
10%
20%
30%
40%
50%
60%
70%
80%
90%
100%
Linje
Insulation
increase in
the air duct
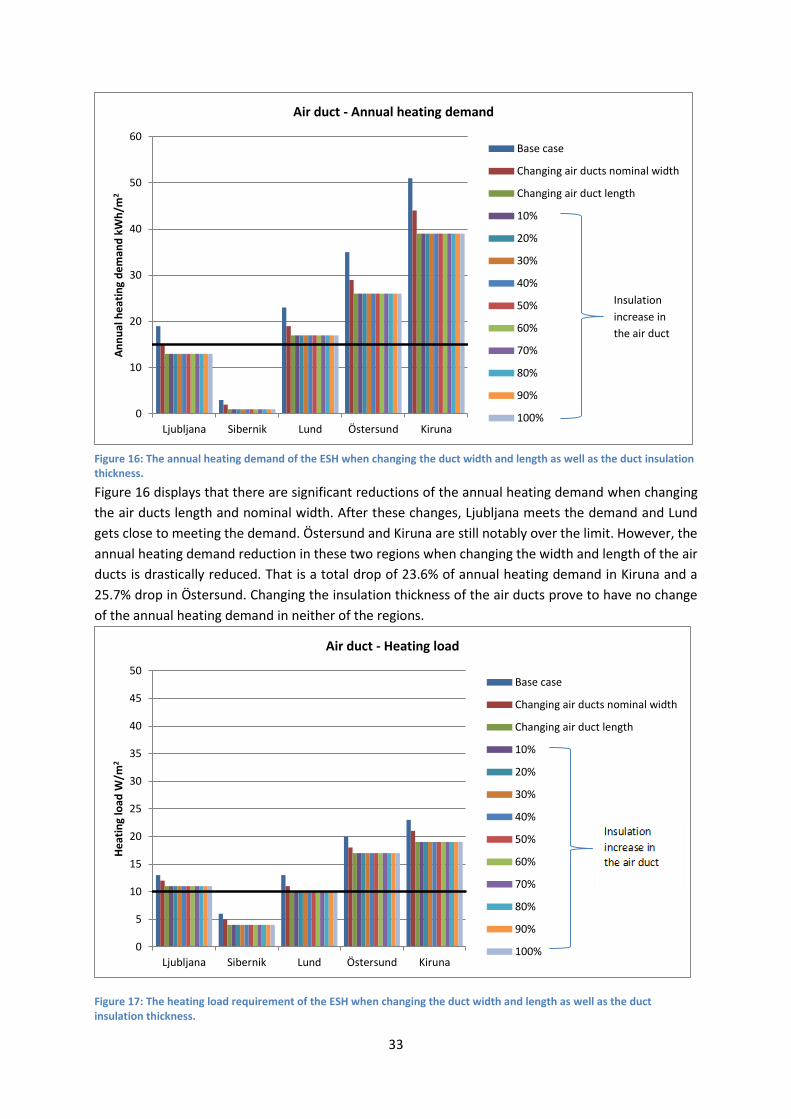
33
Figure 16: The annual heating demand of the ESH when changing the duct width and length as well as the duct insulation thickness.
Figure 16 displays that there are significant reductions of the annual heating demand when changing
the air ducts length and nominal width. After these changes, Ljubljana meets the demand and Lund
gets close to meeting the demand. Östersund and Kiruna are still notably over the limit. However, the
annual heating demand reduction in these two regions when changing the width and length of the air
ducts is drastically reduced. That is a total drop of 23.6% of annual heating demand in Kiruna and a
25.7% drop in Östersund. Changing the insulation thickness of the air ducts prove to have no change
of the annual heating demand in neither of the regions.
Figure 17: The heating load requirement of the ESH when changing the duct width and length as well as the duct insulation thickness.
0
10
20
30
40
50
60
Ljubljana Sibernik Lund Östersund Kiruna
An
nu
al h
eat
ing
de
man
d k
Wh
/m2
Air duct - Annual heating demand
Base case
Changing air ducts nominal width
Changing air duct length
10%
20%
30%
40%
50%
60%
70%
80%
90%
100%
0
5
10
15
20
25
30
35
40
45
50
Ljubljana Sibernik Lund Östersund Kiruna
He
atin
g lo
ad W
/m2
Air duct - Heating load
Base case
Changing air ducts nominal width
Changing air duct length
10%
20%
30%
40%
50%
60%
70%
80%
90%
100%
Insulation
increase in
the air duct
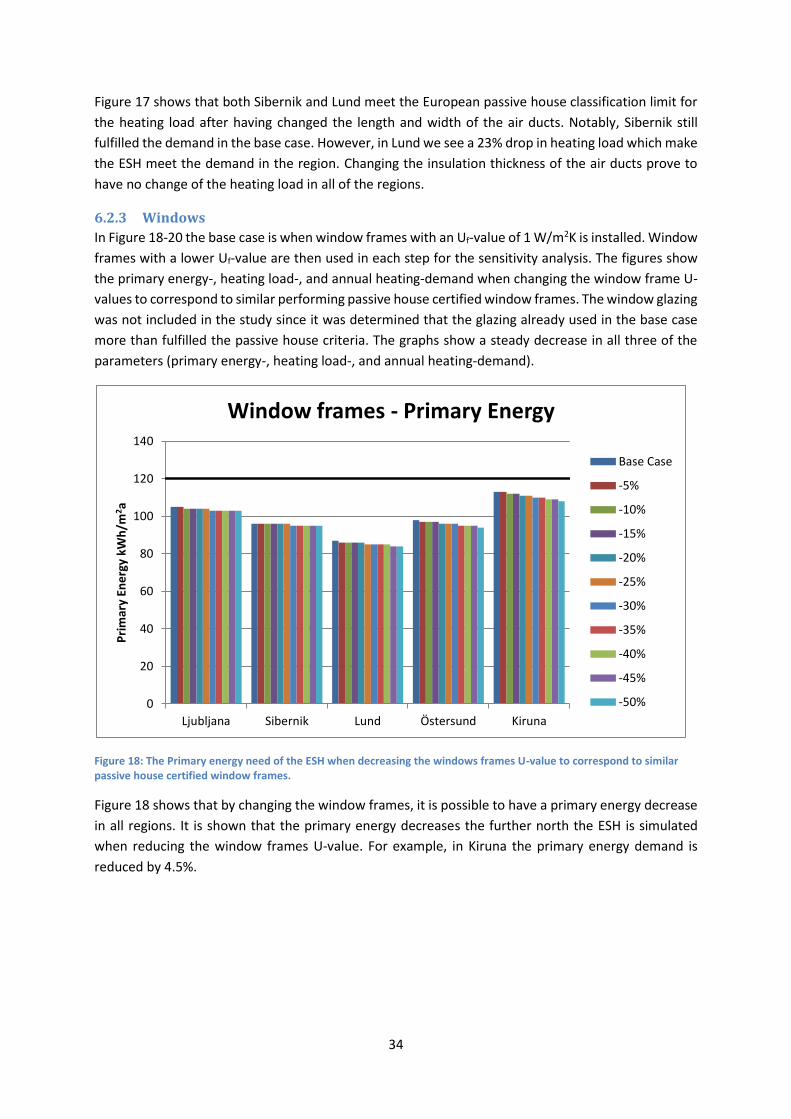
34
Figure 17 shows that both Sibernik and Lund meet the European passive house classification limit for
the heating load after having changed the length and width of the air ducts. Notably, Sibernik still
fulfilled the demand in the base case. However, in Lund we see a 23% drop in heating load which make
the ESH meet the demand in the region. Changing the insulation thickness of the air ducts prove to
have no change of the heating load in all of the regions.
6.2.3 Windows
In Figure 18-20 the base case is when window frames with an Uf-value of 1 W/m2K is installed. Window
frames with a lower Uf-value are then used in each step for the sensitivity analysis. The figures show
the primary energy-, heating load-, and annual heating-demand when changing the window frame U-
values to correspond to similar performing passive house certified window frames. The window glazing
was not included in the study since it was determined that the glazing already used in the base case
more than fulfilled the passive house criteria. The graphs show a steady decrease in all three of the
parameters (primary energy-, heating load-, and annual heating-demand).
Figure 18: The Primary energy need of the ESH when decreasing the windows frames U-value to correspond to similar passive house certified window frames.
Figure 18 shows that by changing the window frames, it is possible to have a primary energy decrease
in all regions. It is shown that the primary energy decreases the further north the ESH is simulated
when reducing the window frames U-value. For example, in Kiruna the primary energy demand is
reduced by 4.5%.
0
20
40
60
80
100
120
140
Ljubljana Sibernik Lund Östersund Kiruna
Pri
mar
y En
erg
y kW
h/m
2 a
Window frames - Primary Energy
Base Case
-5%
-10%
-15%
-20%
-25%
-30%
-35%
-40%
-45%
-50%
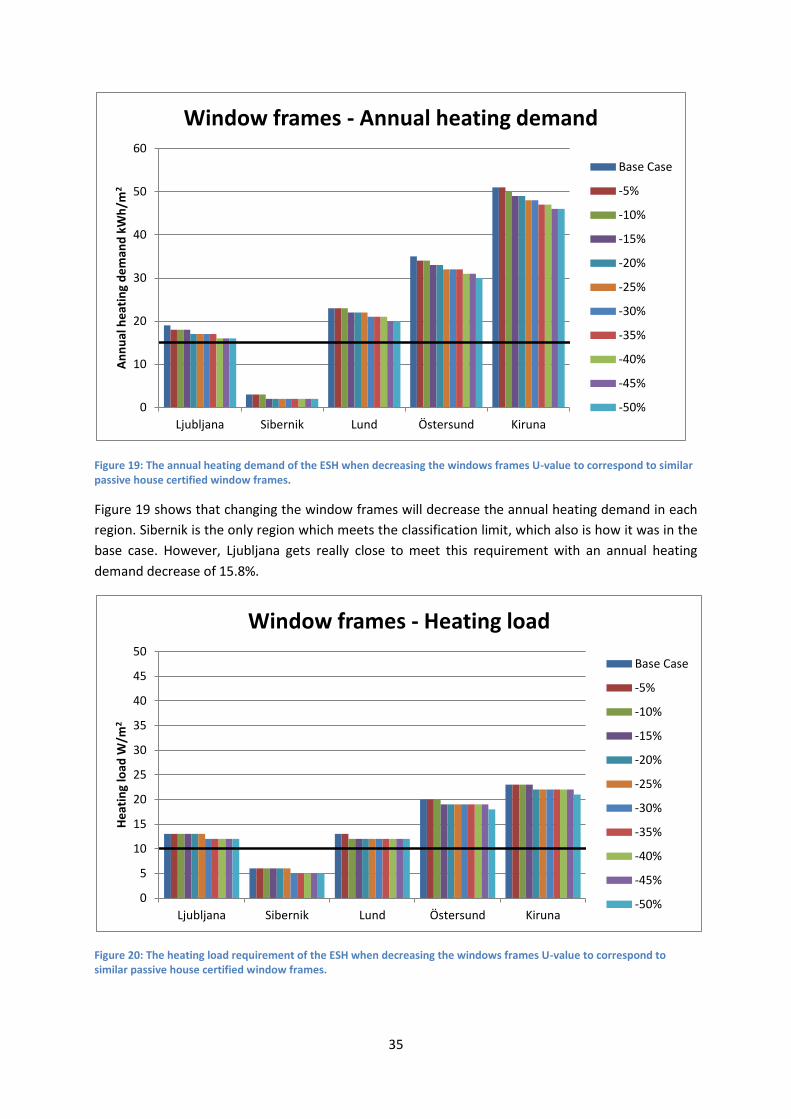
35
Figure 19: The annual heating demand of the ESH when decreasing the windows frames U-value to correspond to similar passive house certified window frames.
Figure 19 shows that changing the window frames will decrease the annual heating demand in each
region. Sibernik is the only region which meets the classification limit, which also is how it was in the
base case. However, Ljubljana gets really close to meet this requirement with an annual heating
demand decrease of 15.8%.
Figure 20: The heating load requirement of the ESH when decreasing the windows frames U-value to correspond to similar passive house certified window frames.
0
10
20
30
40
50
60
Ljubljana Sibernik Lund Östersund Kiruna
An
nu
al h
eat
ing
de
man
d k
Wh
/m2
Window frames - Annual heating demand
Base Case
-5%
-10%
-15%
-20%
-25%
-30%
-35%
-40%
-45%
-50%
0
5
10
15
20
25
30
35
40
45
50
Ljubljana Sibernik Lund Östersund Kiruna
He
atin
g lo
ad W
/m2
Window frames - Heating load
Base Case
-5%
-10%
-15%
-20%
-25%
-30%
-35%
-40%
-45%
-50%
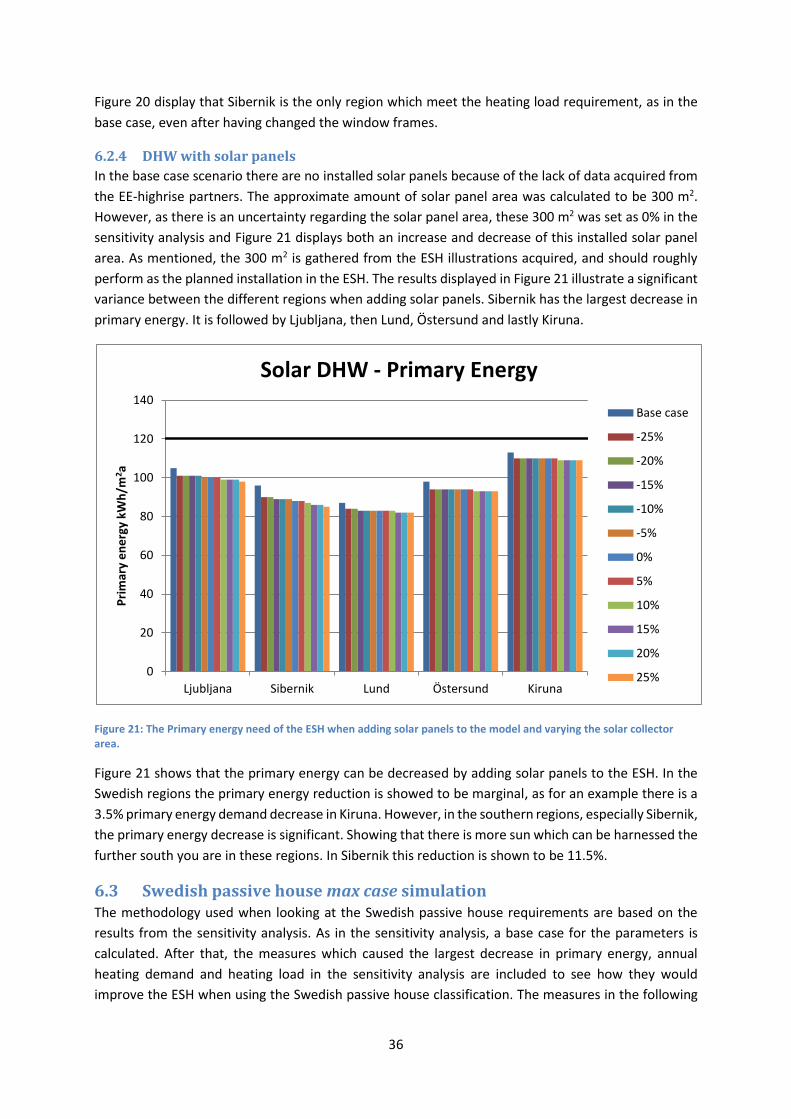
36
Figure 20 display that Sibernik is the only region which meet the heating load requirement, as in the
base case, even after having changed the window frames.
6.2.4 DHW with solar panels
In the base case scenario there are no installed solar panels because of the lack of data acquired from
the EE-highrise partners. The approximate amount of solar panel area was calculated to be 300 m2.
However, as there is an uncertainty regarding the solar panel area, these 300 m2 was set as 0% in the
sensitivity analysis and Figure 21 displays both an increase and decrease of this installed solar panel
area. As mentioned, the 300 m2 is gathered from the ESH illustrations acquired, and should roughly
perform as the planned installation in the ESH. The results displayed in Figure 21 illustrate a significant
variance between the different regions when adding solar panels. Sibernik has the largest decrease in
primary energy. It is followed by Ljubljana, then Lund, Östersund and lastly Kiruna.
Figure 21: The Primary energy need of the ESH when adding solar panels to the model and varying the solar collector area.
Figure 21 shows that the primary energy can be decreased by adding solar panels to the ESH. In the
Swedish regions the primary energy reduction is showed to be marginal, as for an example there is a
3.5% primary energy demand decrease in Kiruna. However, in the southern regions, especially Sibernik,
the primary energy decrease is significant. Showing that there is more sun which can be harnessed the
further south you are in these regions. In Sibernik this reduction is shown to be 11.5%.
6.3 Swedish passive house max case simulation The methodology used when looking at the Swedish passive house requirements are based on the
results from the sensitivity analysis. As in the sensitivity analysis, a base case for the parameters is
calculated. After that, the measures which caused the largest decrease in primary energy, annual
heating demand and heating load in the sensitivity analysis are included to see how they would
improve the ESH when using the Swedish passive house classification. The measures in the following
0
20
40
60
80
100
120
140
Ljubljana Sibernik Lund Östersund Kiruna
Pri
mar
y e
ne
rgy
kWh
/m2a
Solar DHW - Primary Energy
Base case
-25%
-20%
-15%
-10%
-5%
0%
5%
10%
15%
20%
25%
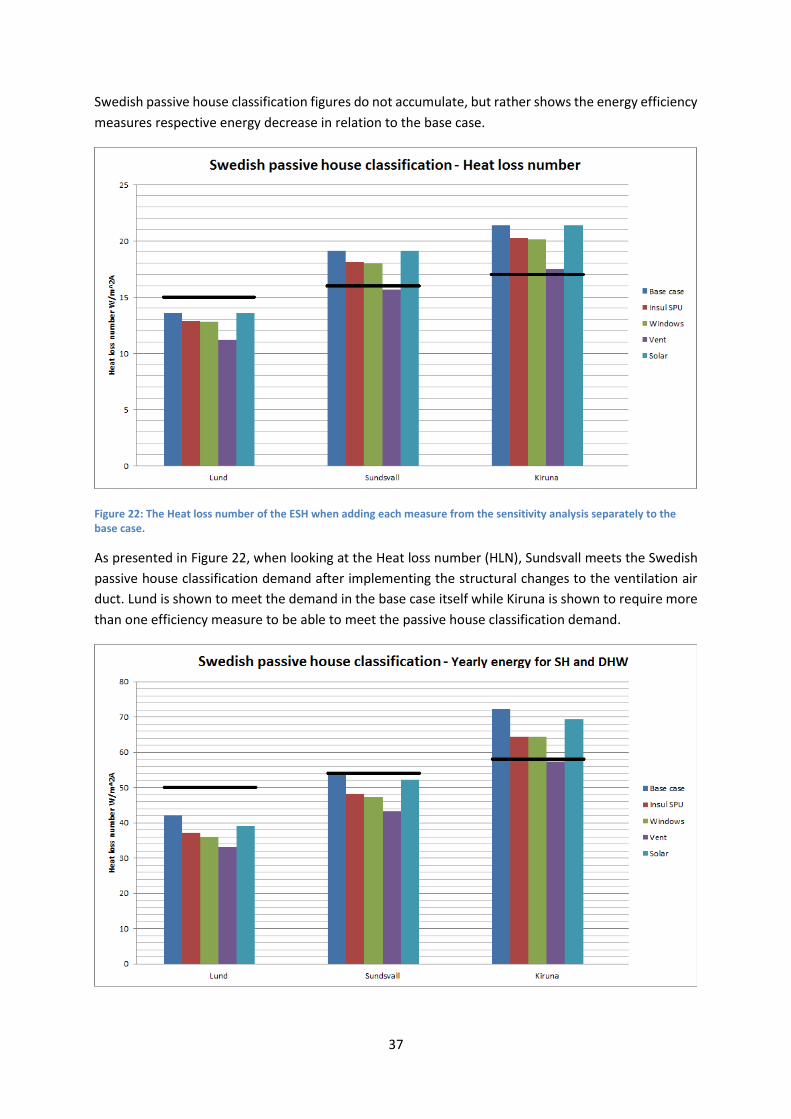
37
Swedish passive house classification figures do not accumulate, but rather shows the energy efficiency
measures respective energy decrease in relation to the base case.
Figure 22: The Heat loss number of the ESH when adding each measure from the sensitivity analysis separately to the base case.
As presented in Figure 22, when looking at the Heat loss number (HLN), Sundsvall meets the Swedish
passive house classification demand after implementing the structural changes to the ventilation air
duct. Lund is shown to meet the demand in the base case itself while Kiruna is shown to require more
than one efficiency measure to be able to meet the passive house classification demand.
38
Figure 23: The delivered yearly energy to buildings of the ESH when adding each measure from the sensitivity analysis separately to the base case.
Figure 23 displays the results of the Swedish house classification parameter yearly energy for SH and
DHW. Both Lund and Sundsvall fulfills this demand already in the base case. However, by changing the
ventilation, Kiruna has a 20.7% decrease in yearly energy for SH and DHW. This makes Kiruna meet the
passive house classification demand.
6.4 European passive house max case simulations The max case simulations are based on the sensitivity analysis. In this analysis the values which caused
the largest decrease of primary energy, annual heating demand and heating load in the each of the
sensitivity analysis cases are used. The max case simulations start from the base case and then the
energy efficiency measures are accumulated in order to find how the results would change in one
simulation. As an example, addition of energy efficiency measures in Ljubljana and Sibernik may result
in an increased primary energy demand because of an increase in annual cooling demand.
This max case scenario is built around fulfilling the European passive house criteria. Accordingly, the
analysis does not include measures such as changing the indoor temperature or increasing the
tolerance for overheating.
In Table 7 below, the different energy efficiency measures for the max case is shown. When including
these energy efficiency measures in the max case, the insulation material is changed to SPU Nord and
the changes to the air ducts nominal width and length is included.
Table 7: Comparisons of the base case and the max case parameters
Energy efficiency measure Base case Max case
Insulation thickness 20 cm 40 cm
Air duct Insulation change 20 mm 20 mm
New window frames 1 kWh/m2 0,5 kWh/m2
Solar panels for DHW 0 m2 375 m2
6.4.1 Eco silver house version 11
The following results are acquired from the base case using the ESH version 11. Figure 24 displays the
primary energy of the ESH after every energy efficiency measure is added one after another. Figure 25
displays the annual heating demand. Lastly, Figure 26 displays the overall specific cooling demand. The
results show that the primary energy is well below the required passive house demand. The annual
heating demand in Ljubljana and Lund can meet the passive house requirement by implementing these
energy efficiency measures. Figure 26 shows that when all the measures are implemented into the
model, then Sibernik cannot meet the cooling demand for the passive house classification.
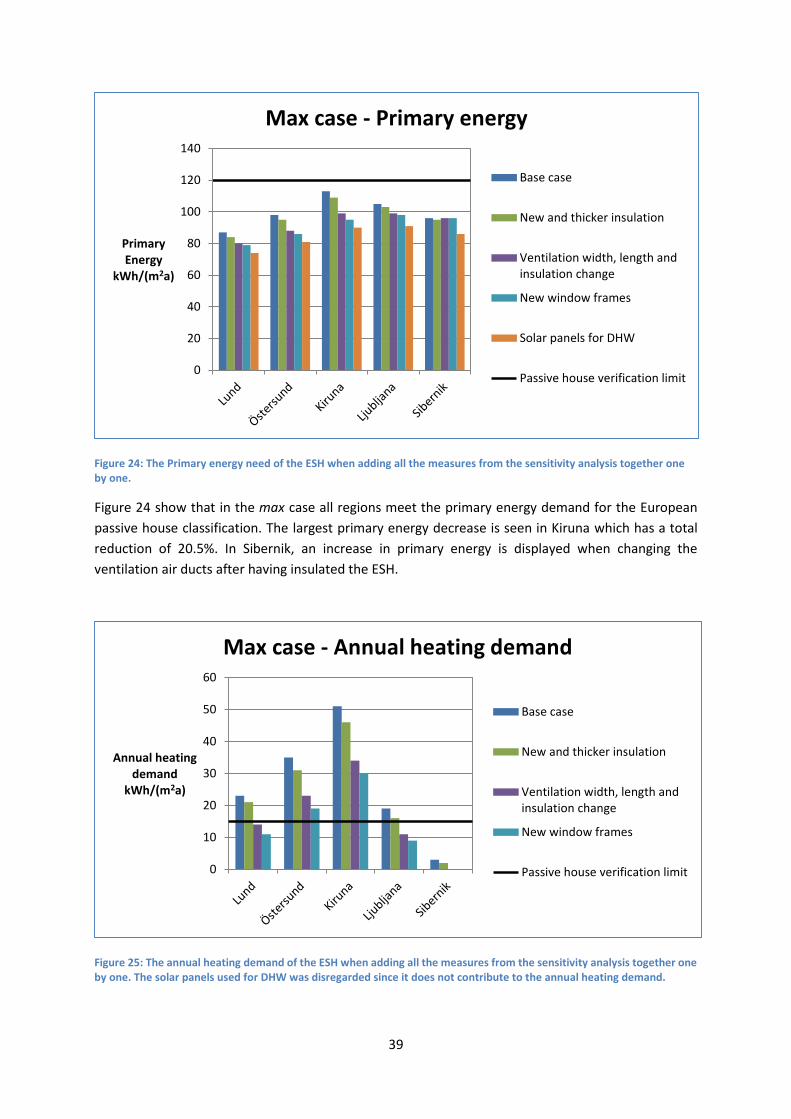
39
Figure 24: The Primary energy need of the ESH when adding all the measures from the sensitivity analysis together one by one.
Figure 24 show that in the max case all regions meet the primary energy demand for the European
passive house classification. The largest primary energy decrease is seen in Kiruna which has a total
reduction of 20.5%. In Sibernik, an increase in primary energy is displayed when changing the
ventilation air ducts after having insulated the ESH.
Figure 25: The annual heating demand of the ESH when adding all the measures from the sensitivity analysis together one by one. The solar panels used for DHW was disregarded since it does not contribute to the annual heating demand.
0
20
40
60
80
100
120
140
PrimaryEnergy
kWh/(m2a)
Max case - Primary energy
Base case
New and thicker insulation
Ventilation width, length andinsulation change
New window frames
Solar panels for DHW
Passive house verification limit
0
10
20
30
40
50
60
Annual heating demand
kWh/(m2a)
Max case - Annual heating demand
Base case
New and thicker insulation
Ventilation width, length andinsulation change
New window frames
Passive house verification limit
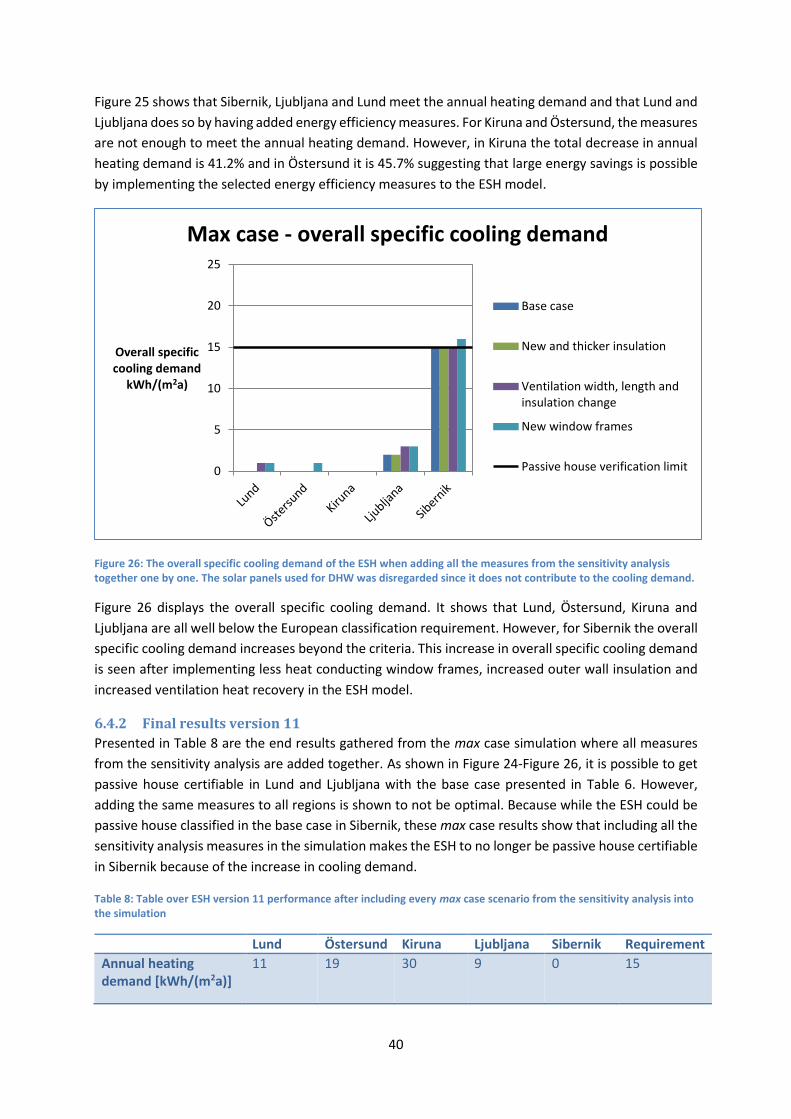
40
Figure 25 shows that Sibernik, Ljubljana and Lund meet the annual heating demand and that Lund and
Ljubljana does so by having added energy efficiency measures. For Kiruna and Östersund, the measures
are not enough to meet the annual heating demand. However, in Kiruna the total decrease in annual
heating demand is 41.2% and in Östersund it is 45.7% suggesting that large energy savings is possible
by implementing the selected energy efficiency measures to the ESH model.
Figure 26: The overall specific cooling demand of the ESH when adding all the measures from the sensitivity analysis together one by one. The solar panels used for DHW was disregarded since it does not contribute to the cooling demand.
Figure 26 displays the overall specific cooling demand. It shows that Lund, Östersund, Kiruna and
Ljubljana are all well below the European classification requirement. However, for Sibernik the overall
specific cooling demand increases beyond the criteria. This increase in overall specific cooling demand
is seen after implementing less heat conducting window frames, increased outer wall insulation and
increased ventilation heat recovery in the ESH model.
6.4.2 Final results version 11
Presented in Table 8 are the end results gathered from the max case simulation where all measures
from the sensitivity analysis are added together. As shown in Figure 24-Figure 26, it is possible to get
passive house certifiable in Lund and Ljubljana with the base case presented in Table 6. However,
adding the same measures to all regions is shown to not be optimal. Because while the ESH could be
passive house classified in the base case in Sibernik, these max case results show that including all the
sensitivity analysis measures in the simulation makes the ESH to no longer be passive house certifiable
in Sibernik because of the increase in cooling demand.
Table 8: Table over ESH version 11 performance after including every max case scenario from the sensitivity analysis into the simulation
Lund Östersund Kiruna Ljubljana Sibernik Requirement
Annual heating demand [kWh/(m2a)]
11 19 30 9 0 15
0
5
10
15
20
25
Overall specific cooling demand
kWh/(m2a)
Max case - overall specific cooling demand
Base case
New and thicker insulation
Ventilation width, length andinsulation change
New window frames
Passive house verification limit
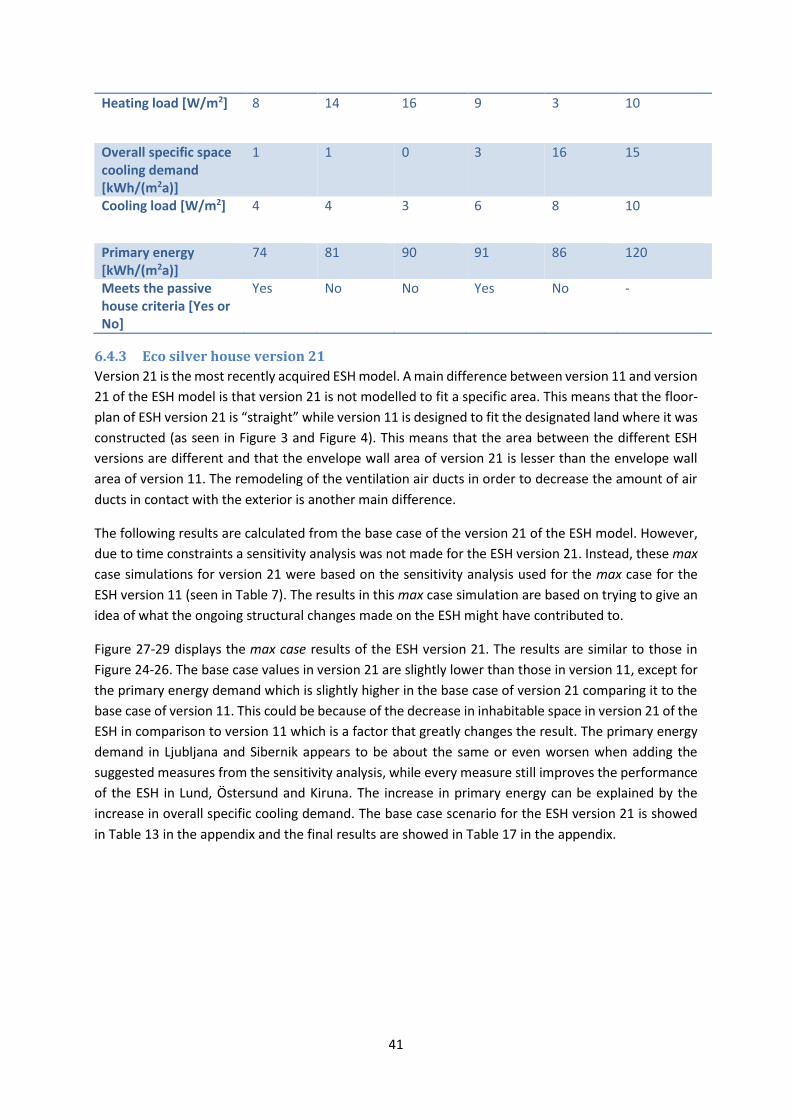
41
Heating load [W/m2] 8 14 16 9 3 10
Overall specific space cooling demand [kWh/(m2a)]
1 1 0 3 16 15
Cooling load [W/m2] 4 4 3 6 8 10
Primary energy [kWh/(m2a)]
74 81 90 91 86 120
Meets the passive house criteria [Yes or No]
Yes No No Yes No -
6.4.3 Eco silver house version 21
Version 21 is the most recently acquired ESH model. A main difference between version 11 and version
21 of the ESH model is that version 21 is not modelled to fit a specific area. This means that the floor-
plan of ESH version 21 is “straight” while version 11 is designed to fit the designated land where it was
constructed (as seen in Figure 3 and Figure 4). This means that the area between the different ESH
versions are different and that the envelope wall area of version 21 is lesser than the envelope wall
area of version 11. The remodeling of the ventilation air ducts in order to decrease the amount of air
ducts in contact with the exterior is another main difference.
The following results are calculated from the base case of the version 21 of the ESH model. However,
due to time constraints a sensitivity analysis was not made for the ESH version 21. Instead, these max
case simulations for version 21 were based on the sensitivity analysis used for the max case for the
ESH version 11 (seen in Table 7). The results in this max case simulation are based on trying to give an
idea of what the ongoing structural changes made on the ESH might have contributed to.
Figure 27-29 displays the max case results of the ESH version 21. The results are similar to those in
Figure 24-26. The base case values in version 21 are slightly lower than those in version 11, except for
the primary energy demand which is slightly higher in the base case of version 21 comparing it to the
base case of version 11. This could be because of the decrease in inhabitable space in version 21 of the
ESH in comparison to version 11 which is a factor that greatly changes the result. The primary energy
demand in Ljubljana and Sibernik appears to be about the same or even worsen when adding the
suggested measures from the sensitivity analysis, while every measure still improves the performance
of the ESH in Lund, Östersund and Kiruna. The increase in primary energy can be explained by the
increase in overall specific cooling demand. The base case scenario for the ESH version 21 is showed
in Table 13 in the appendix and the final results are showed in Table 17 in the appendix.
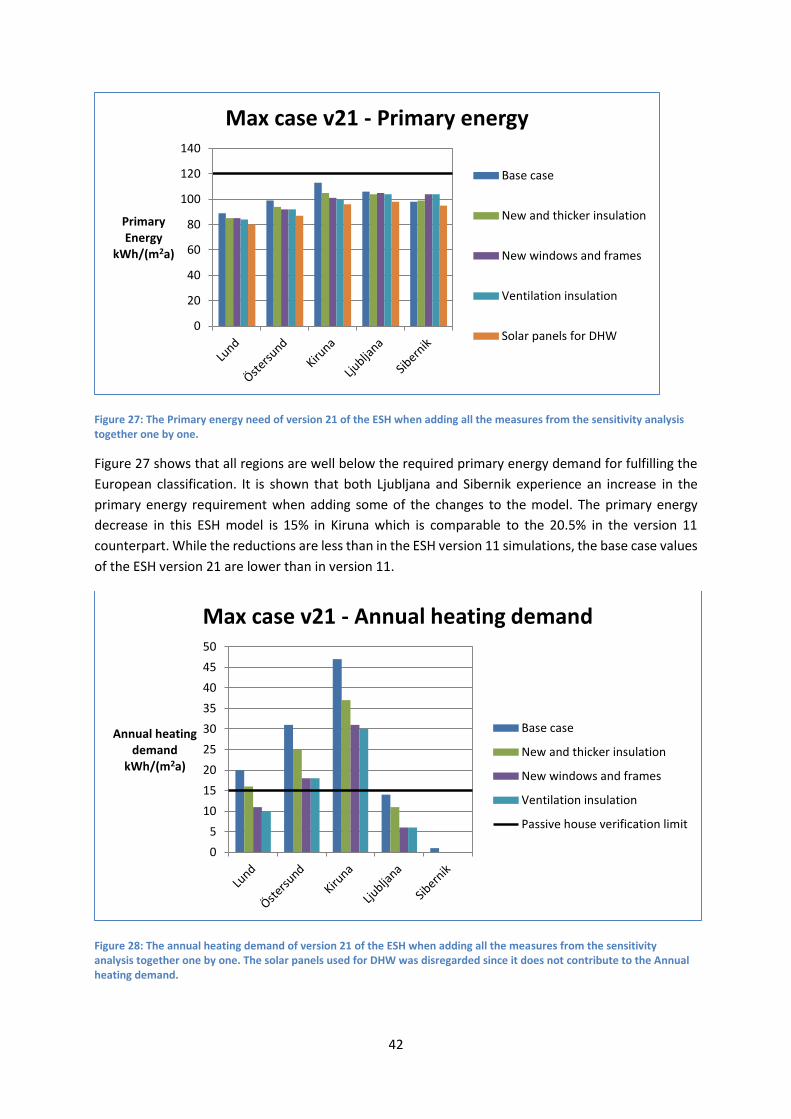
42
Figure 27: The Primary energy need of version 21 of the ESH when adding all the measures from the sensitivity analysis together one by one.
Figure 27 shows that all regions are well below the required primary energy demand for fulfilling the
European classification. It is shown that both Ljubljana and Sibernik experience an increase in the
primary energy requirement when adding some of the changes to the model. The primary energy
decrease in this ESH model is 15% in Kiruna which is comparable to the 20.5% in the version 11
counterpart. While the reductions are less than in the ESH version 11 simulations, the base case values
of the ESH version 21 are lower than in version 11.
Figure 28: The annual heating demand of version 21 of the ESH when adding all the measures from the sensitivity analysis together one by one. The solar panels used for DHW was disregarded since it does not contribute to the Annual heating demand.
0
20
40
60
80
100
120
140
PrimaryEnergy
kWh/(m2a)
Max case v21 - Primary energy
Base case
New and thicker insulation
New windows and frames
Ventilation insulation
Solar panels for DHW
0
5
10
15
20
25
30
35
40
45
50
Annual heating demand
kWh/(m2a)
Max case v21 - Annual heating demand
Base case
New and thicker insulation
New windows and frames
Ventilation insulation
Passive house verification limit
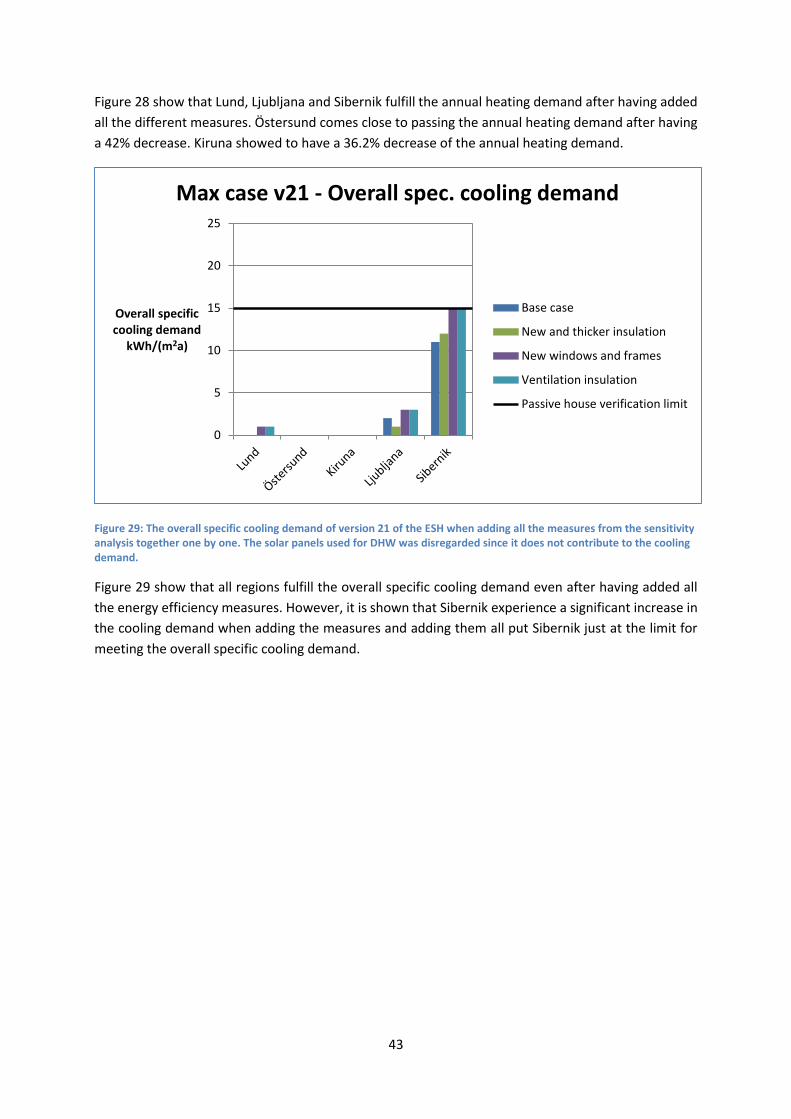
43
Figure 28 show that Lund, Ljubljana and Sibernik fulfill the annual heating demand after having added
all the different measures. Östersund comes close to passing the annual heating demand after having
a 42% decrease. Kiruna showed to have a 36.2% decrease of the annual heating demand.
Figure 29: The overall specific cooling demand of version 21 of the ESH when adding all the measures from the sensitivity analysis together one by one. The solar panels used for DHW was disregarded since it does not contribute to the cooling demand.
Figure 29 show that all regions fulfill the overall specific cooling demand even after having added all
the energy efficiency measures. However, it is shown that Sibernik experience a significant increase in
the cooling demand when adding the measures and adding them all put Sibernik just at the limit for
meeting the overall specific cooling demand.
0
5
10
15
20
25
Overall specific cooling demand
kWh/(m2a)
Max case v21 - Overall spec. cooling demand
Base case
New and thicker insulation
New windows and frames
Ventilation insulation
Passive house verification limit
44
7 Discussion We can see that in the base case, the Eco Silver House (ESH) does only meet the passive house
classification in Sibernik. When implementing all the energy efficiency measures the ESH becomes too
effective, keeping the heat from escaping, in Ljubljana and Sibernik. As seen in Figure 26 and in Figure
29, the measures which decreased the primary energy demand as well as the heating load and heating
demand are increasing the cooling demand. So the cumulative effect of the energy efficiency measures
considered in this analysis can make the ESH unable to meet the European passive house cooling
demand in Sibernik. However, the cooling demand in the max case was still insignificant in the northern
part of Sweden. From this it is possible to draw the conclusion that there isn’t one “great” model which
can be used for different European climates. But rather that each region would benefit from a uniquely
made model for that specific region. This also correlates well with what was found in (Müller & Berker,
2013) discussing the importance of adapting the original passive house classification to more regional
sets of passive house classifications.
When looking at the results and how they changed when comparing the ESH model version 11 to
version 21, we can see that both Ljubljana and Sibernik perform better in the version 21 simulations.
Where version 21 is the ESH model in which actual changes to its construction have been made.
However, the results in Östersund and Kiruna didn’t change that much between the two versions.
Furthermore, even though the exact same energy efficiency measures was implemented to both ESH
versions, the version 11 of Kiruna and Östersund actually ended up performing better than the version
21 counterpart. Suggesting that the envelope changes made in version 21 made cooling more efficient,
which is beneficial for the warmer regions. However, in the more extreme northern Swedish climates,
the changes only increased the annual heating demand.
Catalina, et al., 2013 suggested that the insulation thickness was an important energy efficiency
measure when constructing a passive house. Increasing the envelope walls insulation thickness in the
sensitivity analysis mainly decreased the annual heating demand. However, the primary energy as well
as the heating load was also lowered showing that the insulation is definitely an energy efficiency
measure worth considering making the ESH passive house classified. In the sensitivity analysis the
insulation thickness was changed in steps of 10%. However, the insulation thickness is often pre-
determined by the distributor/manufacturer. Changing the ventilation air ducts also proved to be one
of the measures which could reduce the primary energy demand as well as the heating load and
heating demand the most. This also correlates well with what was found in the air heating analysis “Air
heating of passive houses in cold climates: investigation using detailed dynamic simulations” (Georges,
et al., 2013). Their study concluded that the internal gains have a great impact over passive house
buildings since they considerably alter the passive houses thermal behavior. Since the thermal losses
from ventilation air ducts are by definition internal gains, they conclude that reducing the thermal loss
from ventilation ducts and proper insulation are two parameters important when working with a
passive house (Georges, et al., 2013). The ventilation air duct insulation thickness did not change the
results. This does not comply with the findings of (Ciampi, et al., 2003). However, it can be argued that
the effective ventilation heat recovery already was so high that these changes to the insulation
thickness would have little to no contribution to the results.
As seen in the results, while the heating demand and heating load are higher in the Swedish regions in
comparison to Ljubljana and Sibernik, the primary energy need in the Swedish regions are in some
cases equal or even smaller than what it is in Ljubljana and Sibernik. This also implies the importance
45
of the primary energy factor (PEF). As seen in Table 5, the Swedish PEF’s were considerably lower than
the ones used for Ljubljana and Sibernik. The Swedish regions would most likely have a considerably
higher primary energy need if they were to use the same primary energy factor as the other simulated
regions. However, the Swedish cities benefit from the fact that the primary energy factor is indeed
lesser because of the use of more renewable energy in Sweden. This also implies that because of the
lower primary energy factor here in Sweden it is possible to have a higher final energy use while still
able to be certifiable as a passive house as per European passive house classification. This is because
in PHPP and for the European passive house classification, the renewable energy will not count
towards the primary energy demand.
PHPP uses a pre-determined value for household electricity use. Having an average electricity use, set
in PHPP, which spans every European country, will of course bring variations to what it actually is.
What can be said is that the parameter affects the outcome of the primary energy results. Furthermore,
that using local values brings the results of the simulations closer to reality. Just as in the case of the
primary energy factor. However, the electricity use is not allowed to be changed for the European
passive house classification. The argument for this is that having these parameters open to local
change may cause shady builders and planners to undershoot the actual energy use and make a house
which would not meet the primary energy demand actually meet the primary energy demand. Because
of this, while the electricity use parameters might contribute a lot to the actual primary energy demand,
nothing is allowed to be changed in the classification simulations, as stated by (Feist, et al., 2012).
The U-values of both the window glazing and the frames contributes to the total U-value of windows.
This total U-value is what is regulated in the passive house classifications. PHPP handles the U-values
of the glazing and frames separately. As the U value of window frames were higher (1 W/m2K) than
the glazing (0.6 W/m2K) it was decided to focus only on improving the window frames in the
simulations. As seen in the results, by changing only the window frames, it was still possible to get a
lower primary energy demand, as well as a lower heating load and a lower heating demand. However,
in the sensitivity analysis the U-values of the window frames was lowered to the point where it had
about the same U-value as the glazing. It can be argued that it is expensive to consider more energy
efficient windows in the project. However, in the sensitivity analysis it would have been interesting to
include a more efficient glazing as well.
When calculating the results for the Swedish passive house classification, a time constant was
approximated in order to roughly calculate the DVUT-value (dimensioning winter outdoor value).
Erlandsson, et al., (2012) states that in the buildings planning phase it is acceptable to use such an
estimation. However, it should be noted that proper calculations will have to be made when the
building is finalized. Since a calculated time constant will most likely give a different DVUT-value which
will end up changing the HLN (Heat loss number) and thereby deciding whether or not the building
meet the Swedish passive house classification parameter.
The results of the simulations showed that in Lund the evaluated Swedish passive house classification
parameters were met, suggesting it could be passive house classified. Additionally, in both Sundsvall
and Lund the passive house classification demands could be met with a few energy efficiency measures
added to the model. The Swedish passive house classification requires that a building should meet
stipulated values for parameters such as in Table 2. However, in this thesis only the heat loss number
and max yearly energy delivered from SH and DHW are included, while the annual energy demand was

46
not considered. The annual energy demand was not included due to the difficulty in retrieving
sufficient data from PHPP. So while the results suggest that the ESH may meet the Swedish passive
house classification, at least regions in a few Swedish climate zones, no final conclusions can be drawn
before the annual energy demand has been properly calculated.
47
8 Conclusion The purpose of this thesis was to evaluate the Slovenian high rise building ESH (Eco Silver House)
according to the European and Swedish passive house classification and determine whether or not the
ESH could be passive house classified in three different European climate zones. Also a sensitivity
analysis was conducted to determine whether implementing a few energy efficiency measures could
make the ESH meet the passive house classifications in the different regions.
In the study both the European and Swedish passive house classifications were considered. It was
determined that the ESH would only meet the European passive house classification in Sibernik
without any changes made to the existing ESH model. Nevertheless, a sensitivity analysis showed that
incorporating a few energy efficiency measures, such as increasing the insulation and installing less
heat conducting window frames to the model, both Ljubljana and Lund could also be passive house
certifiable.
The Swedish passive house classification results suggest that the ESH can be passive house certified in
the Swedish regions if the evaluated energy efficiency measures are added to the model. However the
annual energy demand needs to be evaluated before final conclusions can be drawn.
It was determined that adding solar panels, changing the ventilation air ducts length and width,
changing the window frames and increasing the insulation on the outer walls of the ESH, all contributed
to reducing the primary energy demand, heating demand and the heating load. This, however,
increased the cooling demand. Therefore, it was discussed that energy efficiency measures reducing
the cooling demand could be considered in the more southern regions of Europe.
Further analysis could be done to build-up on this thesis. For example, the sensitivity analysis could be
carried out with a lower U-value window glazing and with a different outer wall insulation material
with varying thickness. Also, actual calculations of the time constant for the Swedish passive house
classification could be done to get a more accurate heat loss number. It would be interesting to see
how the ESH performs in additional climates and also to calculate the annual energy demand for the
Swedish passive house classifications. Finally, what could be done is to make region specific models.
With these region specific models, it is meant that the energy efficiency measures are added to the
base case, for each respective region individually. By using the results from the sensitivity analysis, it
is then possible to only include the energy efficiency measures which is beneficial for this specific
region.
48
Bibliography Akropola, 2014. EE-highrise. [Online]
Available at: http://www.ee-highrise.eu/index.php/virtual-building/sustainable-systems
[Använd 19 03 2015].
Akropola, D., 2015. Eco silver house EE - Highrise. [Online]
Available at: http://www.ee-highrise.eu/
[Använd 10 03 2015].
Badescu, V. o.a., 2010. Modeling, validation and time-dependent simulation of the first large passive
building in Romania. Renewable Energy, pp. 1-15.
Catalina, T., Lordache, V. & Caracalenau, B., 2013. Multiple regression model for fast prediction of
the heating energy demand. Energy and buildings, pp. 302-312.
Cellura, M. o.a., 2013. The role of the building sector for reducing the energy consumption and
greenhouse gases: An Italian case study. Renewable Energy, pp. 586-597.
Cengel, Y. A. & Ghajar, A. J., 2011. HEAT and MASS TRANSFER - Fundamentals and Applications. New
York: McGraw-Hill.
Ciampi, M., Leccese, F. & Tuoni, G., 2003. Ventilated facades energy performance in summer coolng
of buildings. Solar energy, pp. 1-12.
CORDIS, 2013. http://cordis.europa.eu/programme/rcn/856_en.html. [Online]
Available at: http://cordis.europa.eu/programme/rcn/856_en.html
[Använd 11 02 2015].
C. O. T. E. C., 2007. EUR-Lex. [Online]
Available at: http://eur-lex.europa.eu/legal-content/EN/TXT/?uri=CELEX:52007SC1729
[Använd 13 05 2015].
DANPOWER, u.d. Primary energy factor - interesting for homeowners. [Online]
Available at: http://www.danpower-gruppe.de/se/primary_energy_factor.html?L=1
[Använd 03 02 2015].
E. C., 2015. European commission. [Online]
Available at: http://ec.europa.eu/clima/policies/package/index_en.htm
[Använd 12 04 2015].
EE-Highrise, 2014. Eco efficient demo multiresidental high rise building. [Online]
Available at: http://ee-highrise.eu/
[Använd 12 02 2015].
EE-Highrise, 2014. Eco efficient demo multiresidental highrise building. [Online]
Available at: http://ee-highrise.eu/images/slide_vb_pictures/exterier/ESH%20ext1.jpg
[Använd 12 02 2015].
49
EN ISO 7730:2006, 2009. Ergonomics of thermal environment -- Analytical determination and
interpretation of thermal comfort using calculation of the PMV and PPD indices and local thermal
comfort criteria.
Eriksson, T., 2015. Hudikhus. [Online]
Available at: http://www.hudikhus.se/om-hudikhus/energi
[Använd 10 02 2015].
Erlandsson, M. o.a., 2012. FEBY 12 Kravspecifikation för nollenergihus, passivhus och minienergihus -
Bostäder, u.o.: Sveriges centrom för nollenergihus.
Feist, W., 2012. Passive house institute. [Online]
Available at: http://passiv.de/en/02_informations/02_passive-house-requirements/02_passive-
house-requirements.htm
[Använd 05 02 2015].
Feist, W. o.a., 2012. Passivhus-projekteringspaket PHPP Version 7. Germany: Passive House Institute.
Firestone, R., 2011. Green Compliance Plus. [Online]
Available at: http://greencomplianceplus.markenglisharchitects.com/technical/ventilation/new-
ventilation-systems-todays-airtight-homes/
[Använd 01 05 2015].
Fredriksen, S. & Werner, S., 2014. District heating and cooling. Lund: Studentlitteratur AB.
Georges, L., Berner, M. & Mathisen, H. M., 2013. Air heatig of passive houses in cold climates:
Investigation using detailed dynamic sumulations. Building and environment, pp. 1-12.
Henrichson, C., Matthies, C. & Rinaldi, J., 2015. Cbkb. [Online]
Available at: http://cbkb.org/toolkit/sensitivity-analysis/
[Använd 15 04 2015].
I. 1., 2013. ISO 16346. Energy performance of buildings - Assessment of overall energy performance.
Knauf Insulation, 2015. Knauf Insulation - eas ehranit energii. [Online]
Available at: http://www.knaufinsulation.cz/cedicova-vata/fkd_s
[Använd 05 05 2015].
Krause, A., Löbau, B. & Günter, L., 2011. International passive house conference 2011. Innsbruck,
Passive house institute.
Kurnitski, J., 2010. Latest Achievement promoting heat pumps in finland: energy carrier factors and
ESBO freeware, Aalto: SITRA.
Larsdotter, A., 2012. Centralvärme. Populär historia, 12.
Lehmann, B. o.a., 2010. Eawag Forum Chriesbach-Simulation and measurement of energy
performance and comfort in a sustainable office building. Energy and buildings, pp. 1-10.
M., 2015. Personal Communication with Akropola. u.o.:u.n.
50
Moran, F., Blight, T., Natarajan, S. & Shea, A., 2013. The use of Passive House Planning Package to
reduce energy use and CO2 emissions in historic dwellings. Energy and buildings, pp. 1-12.
Müller, L. & Berker, T., 2013. Passive House at the crossroads: The past and the present of a
voluntary standard that managed to bridge the energy efficiency gap. Energy Policy, pp. 1-7.
Passipedia, 2014. The passive house resource. [Online]
Available at:
http://www.passipedia.org/passipedia_en/planning/other_attributs_for_passive_houses?s%5B%5D=
soft&s%5B%5D=criteria
[Använd 12 02 2015].
Passivhuscentrum, 2010. Passivhuscentrum - Västra götaland. [Online]
Available at: http://www.passivhuscentrum.se/node/4969
[Använd 04 03 2015].
Ramesh, T., Prakash, R. & Shukla, K., 2009. Life cycle analysis of buildings: An overview. Energy and
buildings, pp. 1592-1600.
S. G. B. C., 2012. Treatment of Scandinavian District Energy Systems in LEED, Stockholm: u.n.
SPU, I., 2015. SPU Vind. [Online]
Available at: http://www.spu-isolering.se/produkter/produkt/spu-vind/
[Använd 04 03 2015].
S. S. I., 2008. EN ISO 13789:2007. Thermal performance of buildings- Transmission and ventilation
heat transfer coefficients.
Stephan, A., Crawfard, R. H. & Myttenaere, K. d., 2013. A comprehensive assessment of the life cycle
demand of passiv ehouses. Applied Energy, pp. 23-34.
Svensk fjärrvärme, 2012. Miljövärdering 2012 - Guide för allokering i kraftvärmeverk och
fjärrvärmens elanvändning, u.o.: Miljövärdering.
Sveriges Centrum för Nollenergihus, 2013. Nollhus. [Online]
Available at: http://www.nollhus.se/feby-12/noll-passiv-minienergihus/begrepp
[Använd 04 05 2015].
Tsenkova, S., 2008. Provision of affordable housing in Europe, North America and Central Asia:
policies and practices, Calgary: UN HABITAT.
Warfvinge, C. & Dahlblom, M., 2014. Projektering av VVS-installationer. Lund: Studentlitteratur AB.
Wilby, M. R., González, A. B. R. & Díaz, J. J. V., 2014. Empirical and dynamic primary energy factors.
Energy, pp. 771-779.
Wilby, M. R., Rodríguez González, A. B. & Vinagre Díaz, J. J., 2014. Empirical and dynamic primary
energy factors. Energy, pp. 771-779.

51
Wolfgang, F., 2013. Certifieringskriterier för passivhus för bostadsändamål, Darmstadt: Passivhaus
Institut.
Wolfgang, F., Schnieders, J., Dorer, V. & Haas, A., 2005. Re-inventing air heating: Convenient and
comfortable within the frame of the Passive House concept. Energy and buildings, pp. 1-4.
Wünsch, B., 2014. International Passive House Conference 2014. Leipzig, Passive house institute.
Yoo, S., Jeong, H. & Ahn, B.-l., 2013. Thermal transmittance of window systems and effects on
building heating energy use and energy efficiency ratings in South Korea. Energy and buildings, pp.
236-244.
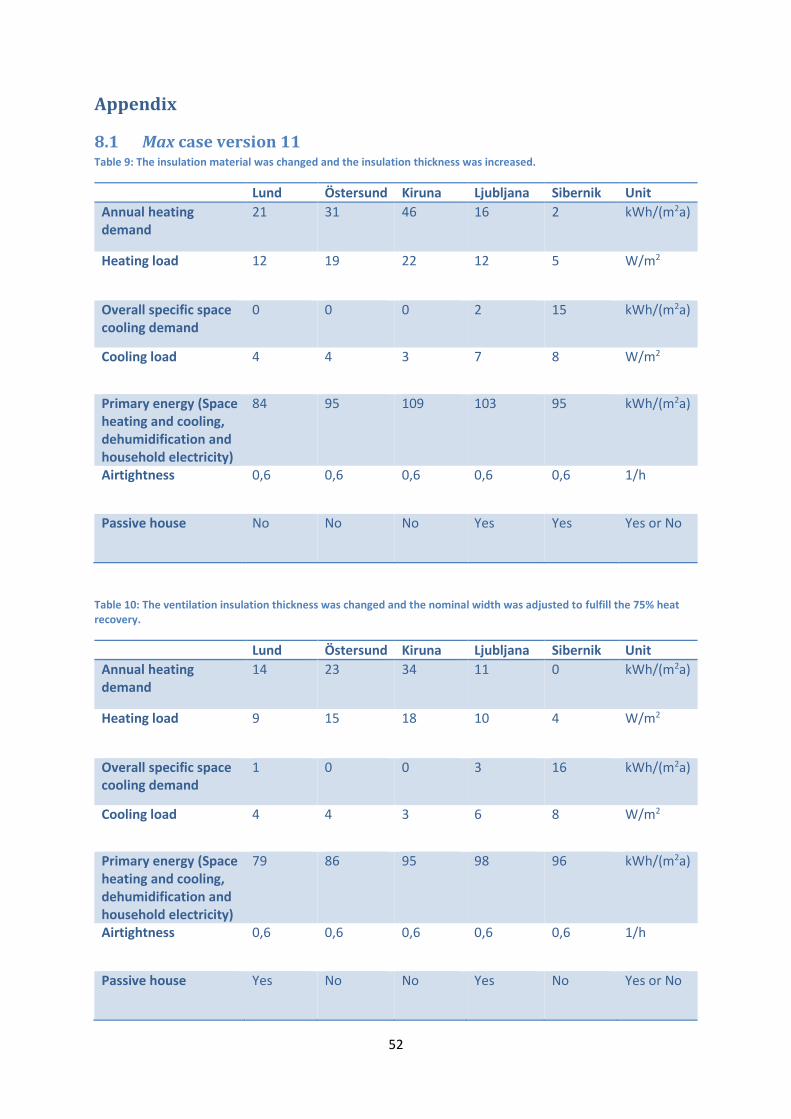
52
Appendix
8.1 Max case version 11 Table 9: The insulation material was changed and the insulation thickness was increased.
Lund Östersund Kiruna Ljubljana Sibernik Unit
Annual heating demand
21 31 46 16 2 kWh/(m2a)
Heating load 12 19 22 12 5 W/m2
Overall specific space cooling demand
0 0 0 2 15 kWh/(m2a)
Cooling load 4 4 3 7 8 W/m2
Primary energy (Space heating and cooling, dehumidification and household electricity)
84 95 109 103 95 kWh/(m2a)
Airtightness 0,6 0,6 0,6 0,6 0,6 1/h
Passive house No No No Yes Yes Yes or No
Table 10: The ventilation insulation thickness was changed and the nominal width was adjusted to fulfill the 75% heat recovery.
Lund Östersund Kiruna Ljubljana Sibernik Unit
Annual heating demand
14 23 34 11 0 kWh/(m2a)
Heating load 9 15 18 10 4 W/m2
Overall specific space cooling demand
1 0 0 3 16 kWh/(m2a)
Cooling load 4 4 3 6 8 W/m2
Primary energy (Space heating and cooling, dehumidification and household electricity)
79 86 95 98 96 kWh/(m2a)
Airtightness 0,6 0,6 0,6 0,6 0,6 1/h
Passive house Yes No No Yes No Yes or No
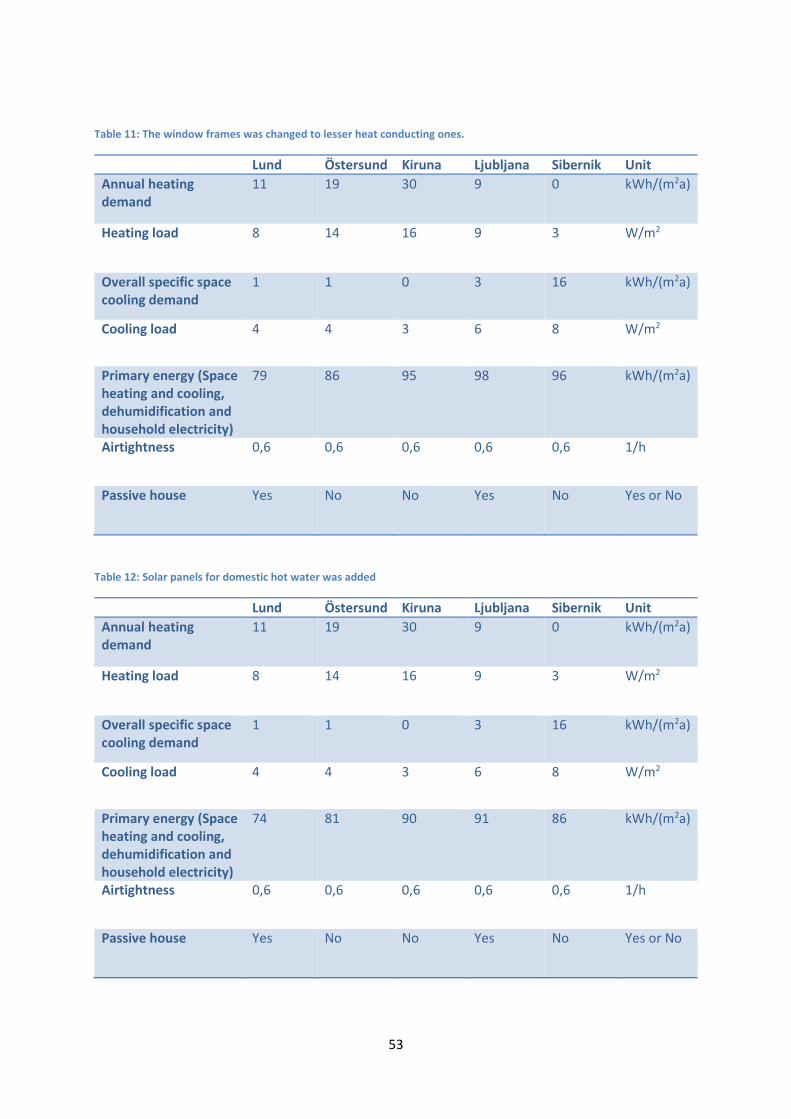
53
Table 11: The window frames was changed to lesser heat conducting ones.
Lund Östersund Kiruna Ljubljana Sibernik Unit
Annual heating demand
11 19 30 9 0 kWh/(m2a)
Heating load 8 14 16 9 3 W/m2
Overall specific space cooling demand
1 1 0 3 16 kWh/(m2a)
Cooling load 4 4 3 6 8 W/m2
Primary energy (Space heating and cooling, dehumidification and household electricity)
79 86 95 98 96 kWh/(m2a)
Airtightness 0,6 0,6 0,6 0,6 0,6 1/h
Passive house Yes No No Yes No Yes or No
Table 12: Solar panels for domestic hot water was added
Lund Östersund Kiruna Ljubljana Sibernik Unit
Annual heating demand
11 19 30 9 0 kWh/(m2a)
Heating load 8 14 16 9 3 W/m2
Overall specific space cooling demand
1 1 0 3 16 kWh/(m2a)
Cooling load 4 4 3 6 8 W/m2
Primary energy (Space heating and cooling, dehumidification and household electricity)
74 81 90 91 86 kWh/(m2a)
Airtightness 0,6 0,6 0,6 0,6 0,6 1/h
Passive house Yes No No Yes No Yes or No
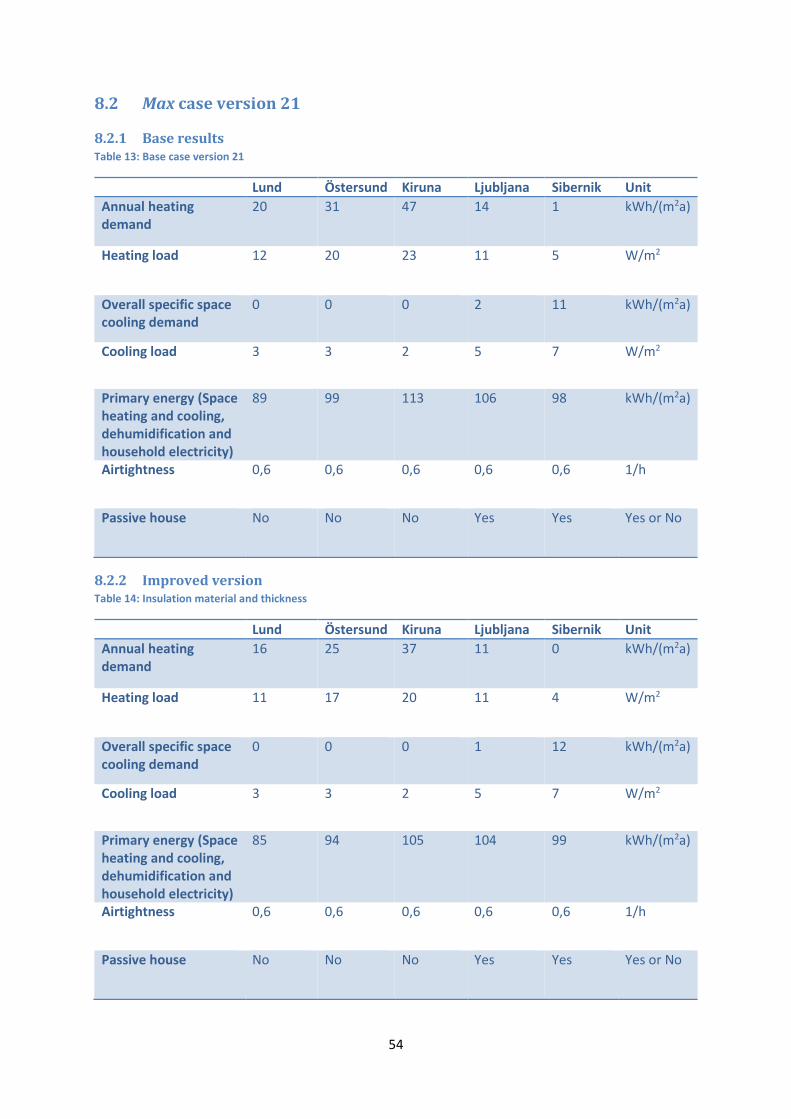
54
8.2 Max case version 21
8.2.1 Base results Table 13: Base case version 21
Lund Östersund Kiruna Ljubljana Sibernik Unit
Annual heating demand
20 31 47 14 1 kWh/(m2a)
Heating load 12 20 23 11 5 W/m2
Overall specific space cooling demand
0 0 0 2 11 kWh/(m2a)
Cooling load 3 3 2 5 7 W/m2
Primary energy (Space heating and cooling, dehumidification and household electricity)
89 99 113 106 98 kWh/(m2a)
Airtightness 0,6 0,6 0,6 0,6 0,6 1/h
Passive house No No No Yes Yes Yes or No
8.2.2 Improved version Table 14: Insulation material and thickness
Lund Östersund Kiruna Ljubljana Sibernik Unit
Annual heating demand
16 25 37 11 0 kWh/(m2a)
Heating load 11 17 20 11 4 W/m2
Overall specific space cooling demand
0 0 0 1 12 kWh/(m2a)
Cooling load 3 3 2 5 7 W/m2
Primary energy (Space heating and cooling, dehumidification and household electricity)
85 94 105 104 99 kWh/(m2a)
Airtightness 0,6 0,6 0,6 0,6 0,6 1/h
Passive house No No No Yes Yes Yes or No
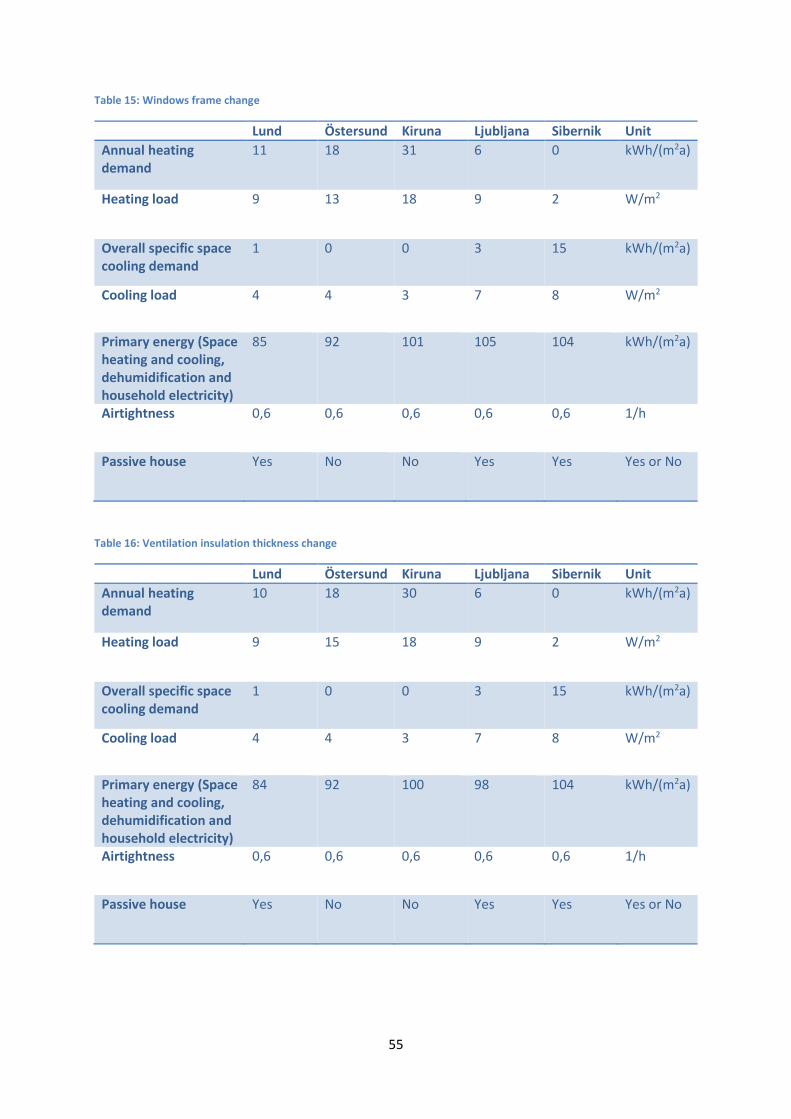
55
Table 15: Windows frame change
Lund Östersund Kiruna Ljubljana Sibernik Unit
Annual heating demand
11 18 31 6 0 kWh/(m2a)
Heating load 9 13 18 9 2 W/m2
Overall specific space cooling demand
1 0 0 3 15 kWh/(m2a)
Cooling load 4 4 3 7 8 W/m2
Primary energy (Space heating and cooling, dehumidification and household electricity)
85 92 101 105 104 kWh/(m2a)
Airtightness 0,6 0,6 0,6 0,6 0,6 1/h
Passive house Yes No No Yes Yes Yes or No
Table 16: Ventilation insulation thickness change
Lund Östersund Kiruna Ljubljana Sibernik Unit
Annual heating demand
10 18 30 6 0 kWh/(m2a)
Heating load 9 15 18 9 2 W/m2
Overall specific space cooling demand
1 0 0 3 15 kWh/(m2a)
Cooling load 4 4 3 7 8 W/m2
Primary energy (Space heating and cooling, dehumidification and household electricity)
84 92 100 98 104 kWh/(m2a)
Airtightness 0,6 0,6 0,6 0,6 0,6 1/h
Passive house Yes No No Yes Yes Yes or No
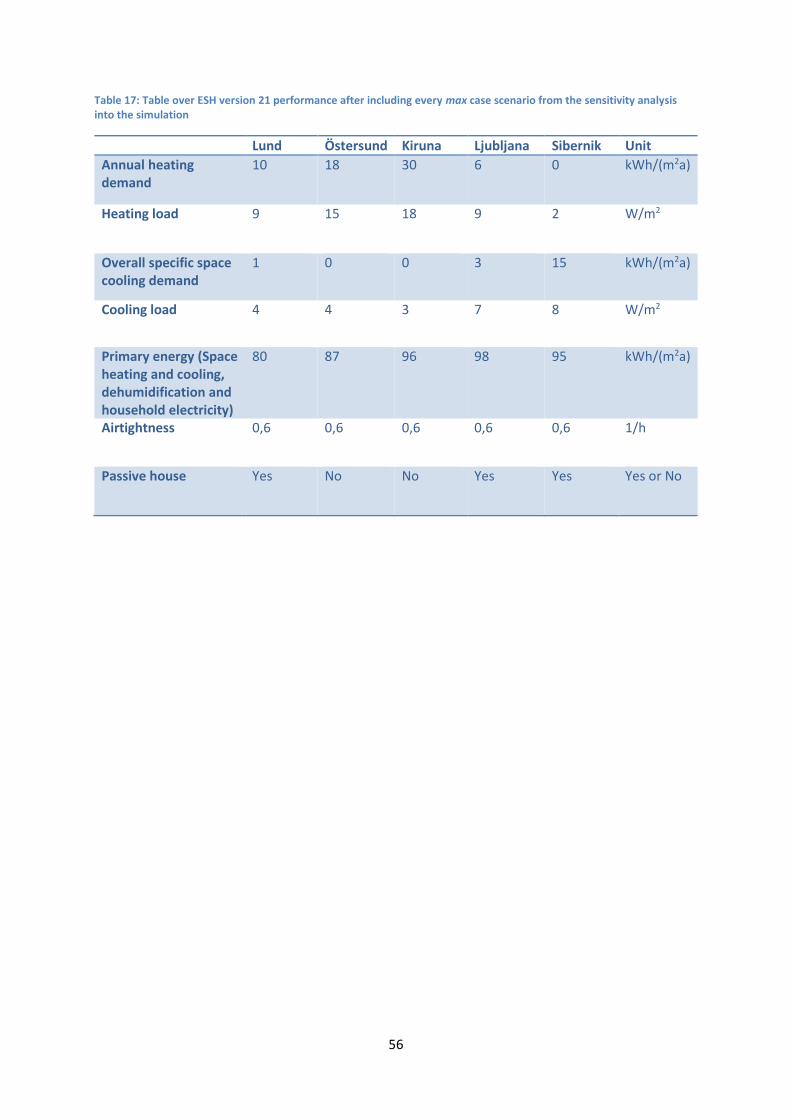
56
Table 17: Table over ESH version 21 performance after including every max case scenario from the sensitivity analysis into the simulation
Lund Östersund Kiruna Ljubljana Sibernik Unit
Annual heating demand
10 18 30 6 0 kWh/(m2a)
Heating load 9 15 18 9 2 W/m2
Overall specific space cooling demand
1 0 0 3 15 kWh/(m2a)
Cooling load 4 4 3 7 8 W/m2
Primary energy (Space heating and cooling, dehumidification and household electricity)
80 87 96 98 95 kWh/(m2a)
Airtightness 0,6 0,6 0,6 0,6 0,6 1/h
Passive house Yes No No Yes Yes Yes or No
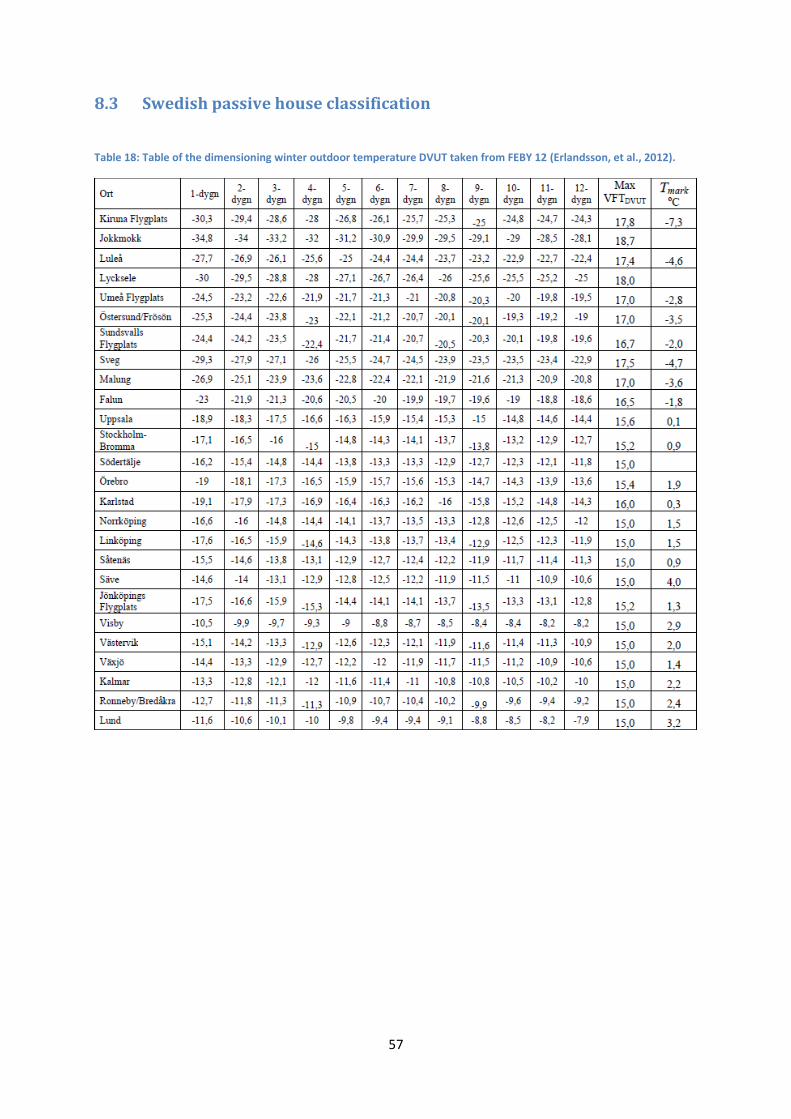
57
8.3 Swedish passive house classification
Table 18: Table of the dimensioning winter outdoor temperature DVUT taken from FEBY 12 (Erlandsson, et al., 2012).
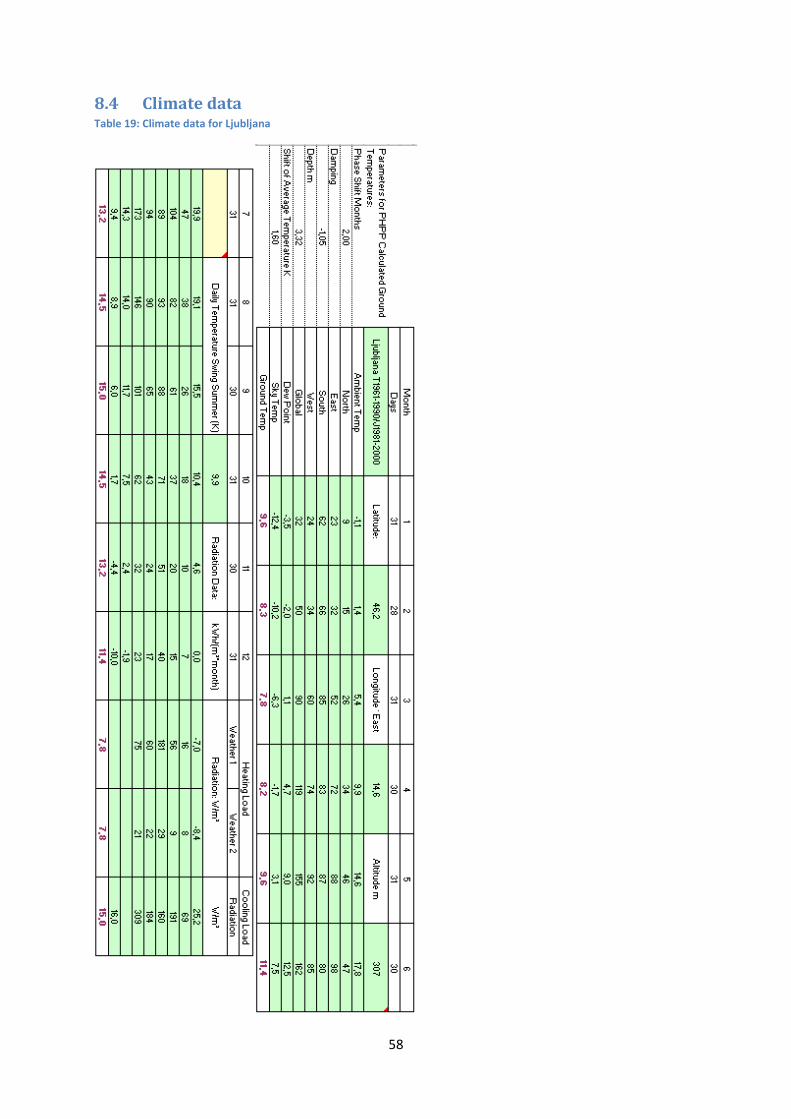
58
8.4 Climate data Table 19: Climate data for Ljubljana
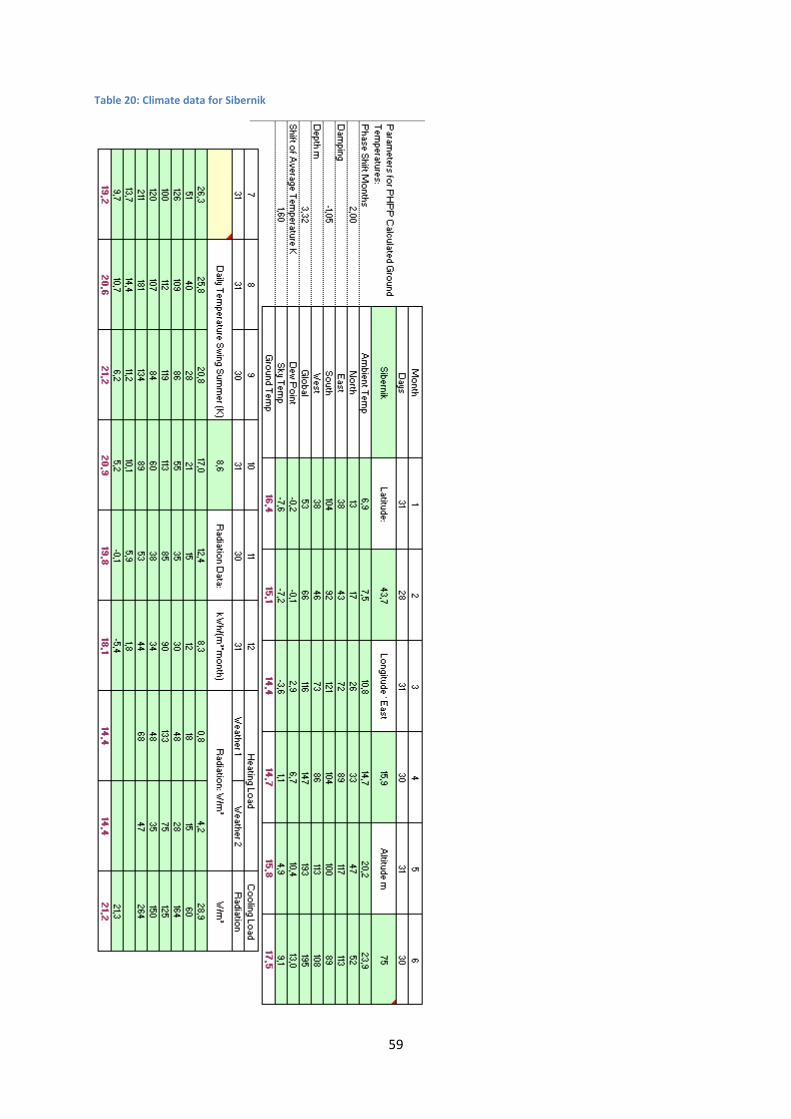
59
Table 20: Climate data for Sibernik
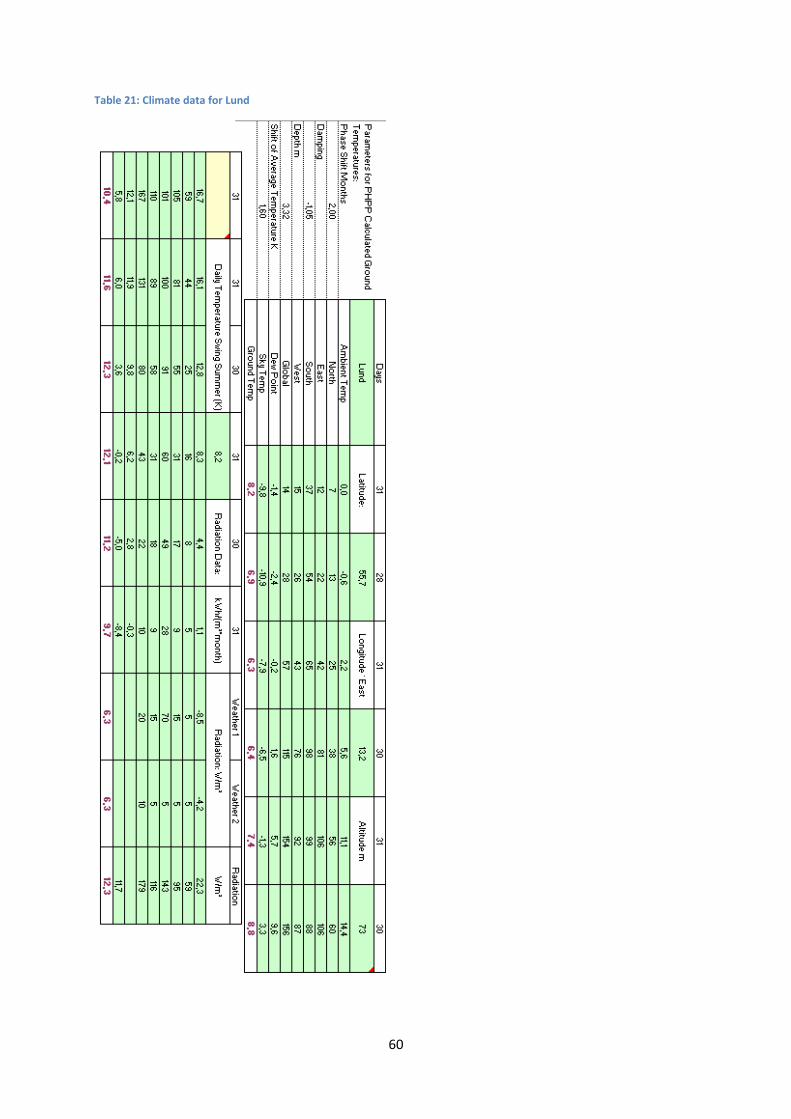
60
Table 21: Climate data for Lund
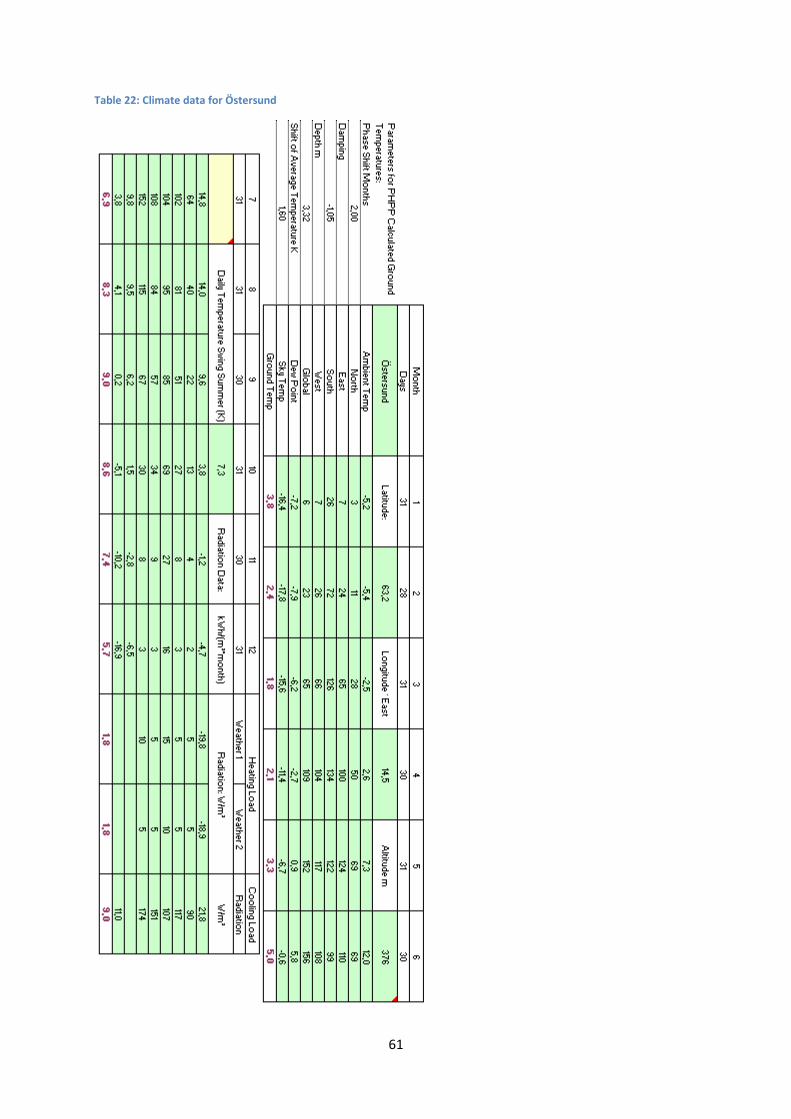
61
Table 22: Climate data for Östersund

62
Table 23: Climate data for Sundsvall
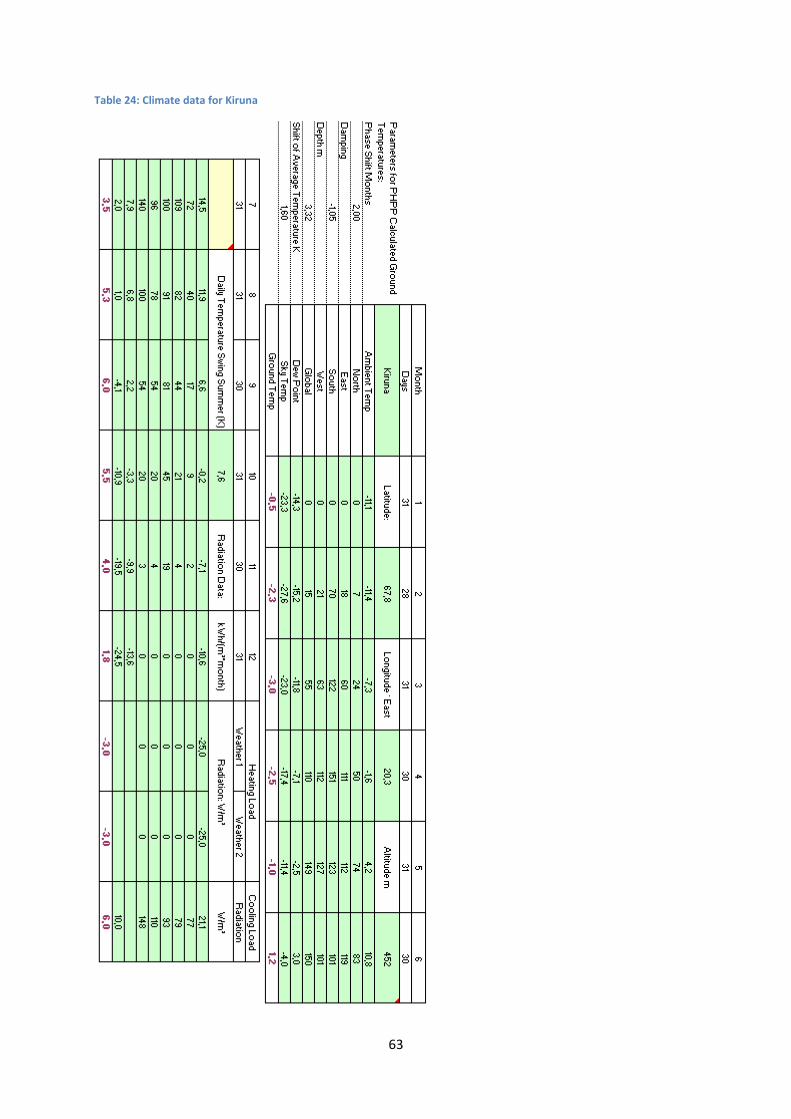
63
Table 24: Climate data for Kiruna


![Sensitivity Analysis of Passive Design Strategies for ...passive design strategies for higha -rise residential building in the hot and humid climate of China [37]. While those papers](https://img.pdfslide.net/doc/110x75/5ee3a50aad6a402d666d5e72/sensitivity-analysis-of-passive-design-strategies-for-passive-design-strategies.jpg)