Embed Size (px)
Citation preview
Journal of Colloid and Interface Science 354 (2011) 709–717
Contents lists available at ScienceDirect
Journal of Colloid and Interface Science
www.elsevier .com/locate / jc is
Evaluating alternative electrostatic potential models for polyacrylamide-co-acrylatein aqueous solution
Byung Joon Lee 1, Mark A. Schlautman ⇑Department of Environmental Engineering and Earth Sciences, Clemson University, Anderson, SC 29625-6510, USA
a r t i c l e i n f o
Article history:Received 13 August 2010Accepted 27 October 2010Available online 3 November 2010
Keywords:PolyelectrolytesElectrostatic modelProton bindingAcid–base titration
0021-9797/$ - see front matter � 2010 Elsevier Inc. Adoi:10.1016/j.jcis.2010.10.059
⇑ Corresponding author. Fax: +1 864 656 0672.E-mail address: [email protected] (M.A. Schla
1 Present address: Hydraulics Laboratory, DeparKatholieke University of Leuven, Kasteelpark Arenberg
a b s t r a c t
The capabilities of three simplified analytical equations to accurately model electrostatic interactionsduring proton binding and release by linear anionic polyelectrolytes in aqueous solution were evaluated.The impermeable sphere (IS), Donnan (DN), and cylindrical (CY) electrostatic models were fit to experi-mental acid–base titration curves of linear polyacrylamide-co-acrylate having ionizable site densitiesranging from ca. 10–35%. The titrations were conducted in 0.003–0.12 M NaCl solutions and the sumof squared errors from modeled and experimental data was used as a comparative index of each model’scapability. In addition, the relative size of each polyelectrolyte was estimated from its measured specificviscosity and then compared against the values obtained from the fitting procedure for the size param-eter that each model contained. Although the IS and DN electrostatic models could be used to obtain rea-sonably good fits to each titration curve, the size parameter values obtained by each model were notreflective of the actual polyelectrolyte sizes, indicating that the models had limited physical meaningand that the size parameter was essentially just an additional fitting parameter in each model. In con-trast, the CY model was not only more effective in its ability to fit the titration data but also provideda better physical representation of the polyelectrolyte size. Therefore, for polyelectrolytes that remainessentially linear or are only loosely coiled such that counter ions are free to travel throughout the poly-mer structure, we conclude that the CY model and its morphological representation of a cylindrical poly-electrolyte are more valid and realistic than the IS and DN models and their representation ofpolyelectrolytes as spheres.
� 2010 Elsevier Inc. All rights reserved.
1. Introduction
Polyelectrolytes have important characteristics in aqueoussolution, including relatively high solubilities, counter ion bindingcapabilities, and electrostatic interactions among proximatecharged functional groups. Linear anionic polyelectrolytes are espe-cially of great interest because of their ubiquity and indispensabil-ity in many industries and environments [1–4]. Therefore, manyresearchers have investigated various characteristic behaviors oflinear anionic polyelectrolytes in aqueous solution and havedeveloped numerous mathematical models to represent thosebehaviors.
Two key characteristics of linear anionic polyelectrolytes inaqueous solution are: (1) their physical morphology and metamor-phosis (e.g., shape, size, contraction, expansion) and (2) theelectrostatic interactions that occur among charged or ionizablefunctional groups, and it is important to recognize that these two
ll rights reserved.
utman).tment of Civil Engineering,40, B-3001 Heverlee, Belgium.
characteristics are often interdependent. For example, linearanionic polyelectrolytes can become more ionized with increasingpH and develop a more expanded structure due to increasedelectrostatic repulsion, whereas at low pH they may bind protonsand become less ionized and thus develop a more coiled orcompact structure. In turn, the morphology of a linear anionicpolyelectrolyte affects electrostatic interactions by the locationand density of charged sites. For example, for the same numberof charged sites a polyelectrolyte with a cylindrical shape will havea higher surface charge density than one with a spherical shapedue to the smaller specific area of the cylinder [5,6]. The metamor-phosis of a polyelectrolyte can also affect its chemistry by enhancingor limiting the mobility of co-ions or counter ions in an expandedversus contracted structure, respectively [2,7–14]. Therefore, bothacid–base chemistry and morphology/metamorphosis need to beincorporated in models to predict the interactive physicochemicalbehaviors of polyelectrolytes in aqueous solution.
Numerous models have been developed to predict electrostaticinteractions based on simplifications of the Poisson–Boltzman (PB)equation. In particular, several approximate analytical electrostaticpotential models have been developed based on simplifications ofpolyelectrolyte morphology, such as the Debye–Huckel theory
710 B.J. Lee, M.A. Schlautman / Journal of Colloid and Interface Science 354 (2011) 709–717
(approximates polyelectrolytes as impermeable spheres or cylin-ders), Gouy–Chapman theory (flat plates), Donnan model (gel-likepermeable spheres), and so on [3,4,15]. Decisions about which ofthese morphological simplifications to use are not always clearcut due to the absence of tools that can directly probe polyelectro-lyte structures in aqueous solution. For example, Nagasawa andcoworkers [7,9] modeled polymathacrylic acid as a rod-like cylin-der whereas Pohlmeier and Haber-Pohlmeier [16] modeled thesame polyelectrolyte as an impermeable sphere by rationalizingthat the electrostatic repulsion between charged sites would notbe strong enough to stretch the polyelectrolyte chain from its as-sumed coiled structure.
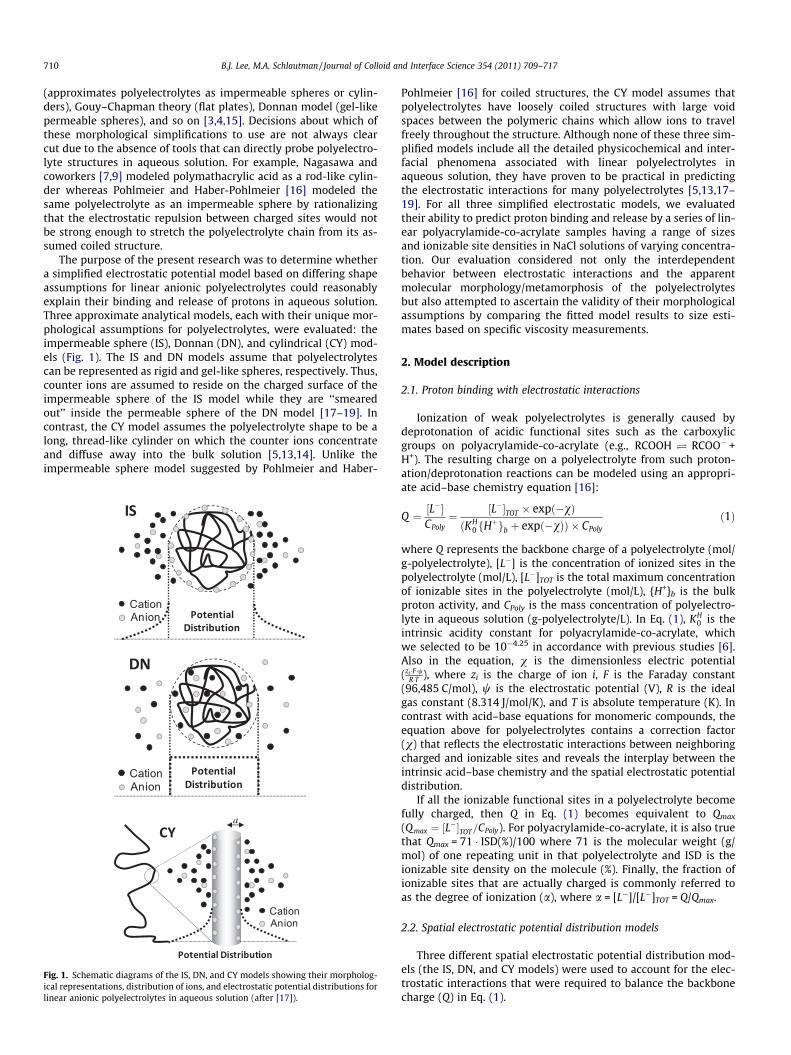
The purpose of the present research was to determine whethera simplified electrostatic potential model based on differing shapeassumptions for linear anionic polyelectrolytes could reasonablyexplain their binding and release of protons in aqueous solution.Three approximate analytical models, each with their unique mor-phological assumptions for polyelectrolytes, were evaluated: theimpermeable sphere (IS), Donnan (DN), and cylindrical (CY) mod-els (Fig. 1). The IS and DN models assume that polyelectrolytescan be represented as rigid and gel-like spheres, respectively. Thus,counter ions are assumed to reside on the charged surface of theimpermeable sphere of the IS model while they are ‘‘smearedout’’ inside the permeable sphere of the DN model [17–19]. Incontrast, the CY model assumes the polyelectrolyte shape to be along, thread-like cylinder on which the counter ions concentrateand diffuse away into the bulk solution [5,13,14]. Unlike theimpermeable sphere model suggested by Pohlmeier and Haber-
a
CationAnion
CationAnion
CationAnion
Fig. 1. Schematic diagrams of the IS, DN, and CY models showing their morpholog-ical representations, distribution of ions, and electrostatic potential distributions forlinear anionic polyelectrolytes in aqueous solution (after [17]).
Pohlmeier [16] for coiled structures, the CY model assumes thatpolyelectrolytes have loosely coiled structures with large voidspaces between the polymeric chains which allow ions to travelfreely throughout the structure. Although none of these three sim-plified models include all the detailed physicochemical and inter-facial phenomena associated with linear polyelectrolytes inaqueous solution, they have proven to be practical in predictingthe electrostatic interactions for many polyelectrolytes [5,13,17–19]. For all three simplified electrostatic models, we evaluatedtheir ability to predict proton binding and release by a series of lin-ear polyacrylamide-co-acrylate samples having a range of sizesand ionizable site densities in NaCl solutions of varying concentra-tion. Our evaluation considered not only the interdependentbehavior between electrostatic interactions and the apparentmolecular morphology/metamorphosis of the polyelectrolytesbut also attempted to ascertain the validity of their morphologicalassumptions by comparing the fitted model results to size esti-mates based on specific viscosity measurements.
2. Model description
2.1. Proton binding with electrostatic interactions
Ionization of weak polyelectrolytes is generally caused bydeprotonation of acidic functional sites such as the carboxylicgroups on polyacrylamide-co-acrylate (e.g., RCOOH � RCOO� +H+). The resulting charge on a polyelectrolyte from such proton-ation/deprotonation reactions can be modeled using an appropri-ate acid–base chemistry equation [16]:
Q ¼ ½L��
CPoly¼ ½L��TOT � expð�vÞðKH
0 fHþgb þ expð�vÞÞ � CPoly
ð1Þ
where Q represents the backbone charge of a polyelectrolyte (mol/g-polyelectrolyte), [L�] is the concentration of ionized sites in thepolyelectrolyte (mol/L), [L�]TOT is the total maximum concentrationof ionizable sites in the polyelectrolyte (mol/L), {H+}b is the bulkproton activity, and CPoly is the mass concentration of polyelectro-lyte in aqueous solution (g-polyelectrolyte/L). In Eq. (1), KH
0 is theintrinsic acidity constant for polyacrylamide-co-acrylate, whichwe selected to be 10�4.25 in accordance with previous studies [6].Also in the equation, v is the dimensionless electric potential(zi �F�w
R�T ), where zi is the charge of ion i, F is the Faraday constant(96,485 C/mol), w is the electrostatic potential (V), R is the idealgas constant (8.314 J/mol/K), and T is absolute temperature (K). Incontrast with acid–base equations for monomeric compounds, theequation above for polyelectrolytes contains a correction factor(v) that reflects the electrostatic interactions between neighboringcharged and ionizable sites and reveals the interplay between theintrinsic acid–base chemistry and the spatial electrostatic potentialdistribution.
If all the ionizable functional sites in a polyelectrolyte becomefully charged, then Q in Eq. (1) becomes equivalent to Qmax
(Qmax ¼ ½L��TOT=CPoly). For polyacrylamide-co-acrylate, it is also truethat Qmax = 71 � ISD(%)/100 where 71 is the molecular weight (g/mol) of one repeating unit in that polyelectrolyte and ISD is theionizable site density on the molecule (%). Finally, the fraction ofionizable sites that are actually charged is commonly referred toas the degree of ionization (a), where a = [L�]/[L�]TOT = Q/Qmax.
2.2. Spatial electrostatic potential distribution models
Three different spatial electrostatic potential distribution mod-els (the IS, DN, and CY models) were used to account for the elec-trostatic interactions that were required to balance the backbonecharge (Q) in Eq. (1).
B.J. Lee, M.A. Schlautman / Journal of Colloid and Interface Science 354 (2011) 709–717 711
2.2.1. Impermeable sphere modelIn the IS model, which is a simplified analytical solution of the
PB equation in spherical coordinates, a polyelectrolyte is assumedto be an impermeable sphere with its ionized sites located on thesurface of the sphere (Fig. 1). Therefore, the counter ions and elec-trostatic interaction potential both concentrate on the surface ofthe sphere and diffuse away into the bulk solution in accordancewith Eqs. (2) and (3) [17,19]:
Q ¼ S � rIS
F¼ S � 2 � csalt � zsalt
j2 � sinh �vIS
2
� �þ 4
j � RHtanh �vIS
4
� �� �ð2Þ
j ¼ 2 � F2 � csalt � z2salt
R � T � e0 � e
!12
ð3Þ
where S represents the specific surface area (m2/g) which is propor-tional to the hydrodynamic volume or the specific viscosity of a
spherical polyelectrolyte (i.e., VH / S3=2 and gsp / VH), rIS is thecharge density on the surface of the impermeable sphere (C/m2),vIS is the dimensionless electrostatic potential in the diffuse do-main, RH is the hydrodynamic radius of the spherical polyelectrolyte(RH ¼
ffiffiffiffiffiffiffiffiffiffiffiffiffiffiffiffiffiffiffiffiffiffiffiffiffiffiffiffiffiffiffiffiffiffiffiffiS �MW=ð4p � NAÞ
p, m), MW is polyelectrolyte molecular
weight (g/mol), NA is Avogadro’s number (6.022 � 1023/mol), j isthe Debye constant (m�1), csalt is the concentration of backgroundsalts in the solution phase (mol/L), zsalt is the charge number ofbackground salts, e0 is the permittivity of free space (8.854 �10�12 C/m/J), and e is the relative dielectric constant of water(78.5 at 25 �C) [3].
2.2.2. Donnan modelIn the DN model, a polyelectrolyte is assumed to be a permeable
sphere into which counter ions diffuse without hindrance. There-fore, the counter ions are assumed to reside inside polyelectrolytespheres and thus the electrostatic potential remains constantthroughout the sphere (Fig. 1). The mathematical representationof the DN model is [17,19]:
Q ¼ �VD � qD
F¼ VD � 2� csalt � zsalt � sinhð�vDÞ ð4Þ
where VD is the Donnan volume (L/g; m3/kg) which is proportionalto the hydrodynamic volume or the specific viscosity of a polyelec-trolyte (VD ¼ VH and gsp / VH), qD is the charge density in the Don-nan volume (C/m3), wD is the electrostatic potential in the Donnanvolume (V), and vD is the dimensionless electrostatic potential inthe Donnan domain.
2.2.3. Cylindrical modelIn the CY model, polyelectrolyte molecules are assumed to be
thread-like long cylinders and their ionized sites are located onthe surface of these cylinders. The electrostatic potential on ionizedpolyelectrolytes is counterbalanced by the spatial distribution ofcounter ions from the charged cylindrical surfaces into the bulksolution phase. The mathematical equation of the CY model isthe simplified analytical solution of the PB equation in cylindricalcoordinates [5,13,14]:
Q ¼ L� ~rCY
F¼ L
F� e� e0 � j� K1ðjaÞ
K0ðjaÞ � �v� R� TF
� �� 2p� a
ð5Þ
L ¼ NA
Mseg� Lseg ð6Þ
where L represents the specific length (m/g), Mseg is the molecularweight of an individual segment of a polyelectrolyte molecule
(g/mol), Lseg is the length of an individual segment (m), a is the ra-dius of a polyelectrolyte cylinder (m), and Kn(x) is the modified Bes-sel function of the second kind.
3. Materials and methods
3.1. Polyelectrolyte sample preparation and characterization
A series of linear polyacrylamide-co-acrylates (referred to com-mercially as anionic PAMs) having a range of molecular weights(MW, g/mol) and ionizable site densities (ISD, No: of hydrolyzable units
No: of repeating units , %)were obtained from Kemira Water Solutions Inc. (Lakeland, FL).To remove salts and other impurities (mostly NaCl), the polyelec-trolytes were cleaned using repeated steps of dissolution,acidification, and precipitation in water–methanol mixtures [20].First, the sample powders were dissolved in distilled deionizedwater (DDW; Millipore Milli-Q) and gently mixed on a Thermo-lyne� Bigger Bill orbital shaker (Thermo Fisher Scientific Inc.) for1–2 days. After complete dissolution, the solutions were acidifiedto pH 3 with hydrochloric acid to dissociate salt cations from thecarboxylate functional groups and then the samples were precipi-tated by adding methanol and placing the solution in a 4 �C coldroom. The serial steps of dissolution, acidification, and precipita-tion were repeated four to five times. Finally, the precipitatedsamples were lyophilized with a bench top freeze dryer (VirTis�,SP Industries Inc.) and stored in powder form for use in subsequentexperiments. Prior to their use, 5 g/L aqueous stock solutions wereprepared by dissolving the freeze-dried treated samples in DDWand storing them in the dark when not being used.
The cleaned polyacrylamide-co-acrylate samples were charac-terized for viscosity-average molecular weight (MWV) and ionizablesite density (ISD). For the MWV measurements, specific viscosity(gsp) values were determined in accordance with Sperling [21] usinga #50 Cannon–Fenske routine viscometer (Cannon Instrument Com-pany, Inc.) in a constant temperature water bath (PolyScience, IL) at25 �C and pH 9 for polyelectrolyte sample concentrations rangingfrom 2.5 � 10�5 to 1.0 � 10�4 g/mL [22]. Extrapolation of the Hug-gins equation to zero polyelectrolyte concentration provides a valueof the intrinsic viscosity ([g]) for each sample [21,22]. The MWV ofeach polyelectrolyte was then estimated from its corresponding[g] value using the Mark–Houwink–Sakurada equation (MHS equa-tion, [g] = K �MWa
V) and parameter values developed by Wu andcoworkers [23]. A more detailed description of these procedures isavailable our previous report [22]. In that particular study, we ob-served that MWV values determined by this approach correlatedwell with measurements of the weight-average molecular weight(MWW) of other polyacrylamide-co-acrylate samples, although theMWv values were consistently lower than the MWW values as ex-pected for such polydisperse materials [21,22]. In the present study,we use the MWV values primarily for comparative purposes amongthe different polyelectrolyte samples. Values for the ISD of eachpolyacrylamide-co-acrylate sample were obtained from the acid–base titrations themselves. In this procedure, ISD values are deter-mined from the difference of the upper (fully ionized molecules)and lower (fully protonated molecules) plateaus of each S-shapedacid–base titration curve. Our previous study found this approachfor determining ISD values to be as good as or better than measuringnitrogen-to-carbon ratios, and additional details on the ISD mea-surement procedure itself can be found there [22]. Table 1 showsthe values determined for MWV and ISD of the polyacrylamide-co-acrylate samples used in this study.
3.2. Acid–base titrations and model fitting procedures
For the conventional acid–base titrations, 50 mL solutionscontaining 1 g/L each of the different polyacrylamide-co-acrylate
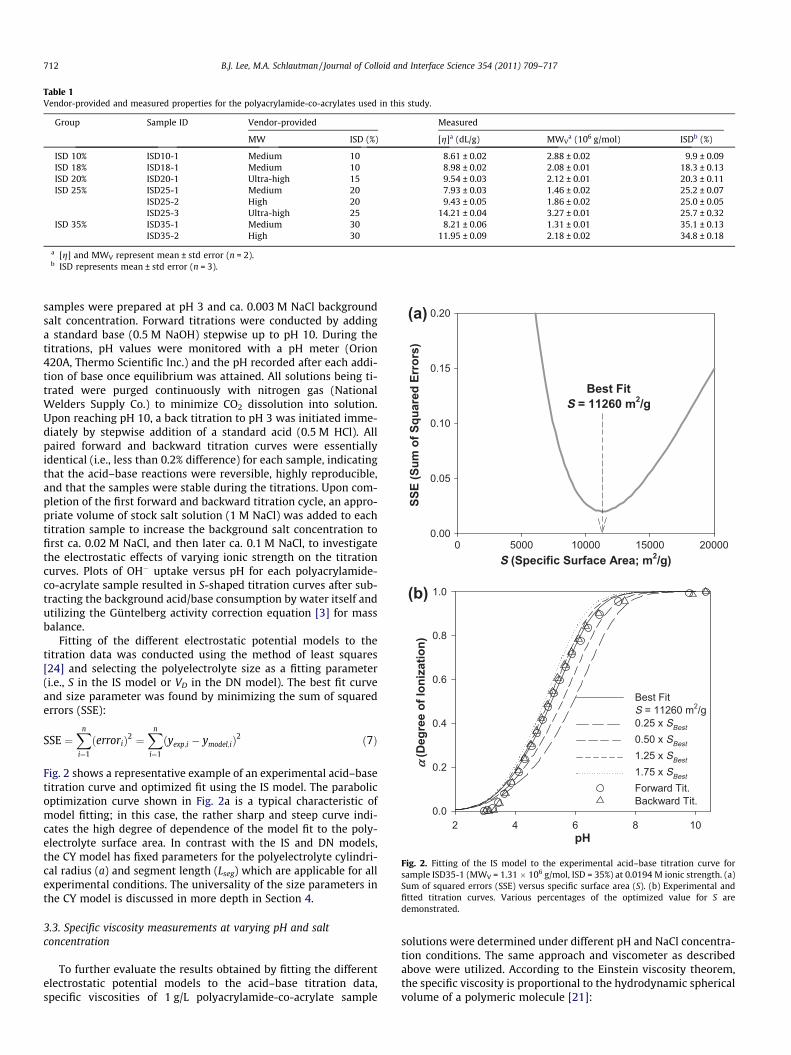
Table 1Vendor-provided and measured properties for the polyacrylamide-co-acrylates used in this study.
Group Sample ID Vendor-provided Measured
MW ISD (%) [g]a (dL/g) MWVa (106 g/mol) ISDb (%)
ISD 10% ISD10-1 Medium 10 8.61 ± 0.02 2.88 ± 0.02 9.9 ± 0.09ISD 18% ISD18-1 Medium 10 8.98 ± 0.02 2.08 ± 0.01 18.3 ± 0.13ISD 20% ISD20-1 Ultra-high 15 9.54 ± 0.03 2.12 ± 0.01 20.3 ± 0.11ISD 25% ISD25-1 Medium 20 7.93 ± 0.03 1.46 ± 0.02 25.2 ± 0.07
ISD25-2 High 20 9.43 ± 0.05 1.86 ± 0.02 25.0 ± 0.05ISD25-3 Ultra-high 25 14.21 ± 0.04 3.27 ± 0.01 25.7 ± 0.32
ISD 35% ISD35-1 Medium 30 8.21 ± 0.06 1.31 ± 0.01 35.1 ± 0.13ISD35-2 High 30 11.95 ± 0.09 2.18 ± 0.02 34.8 ± 0.18
a [g] and MWV represent mean ± std error (n = 2).b ISD represents mean ± std error (n = 3).
(b)
pH2 4 6 8 10
α(D
egre
e of
Ioni
zatio
n)
0.0
0.2
0.4
0.6
0.8
1.0
Best FitS = 11260 m2/g0.25 x SBest
0.50 x SBest
1.25 x SBest
1.75 x SBest
Forward Tit.Backward Tit.
(a)
S (Specific Surface Area; m2/g)0 5000 10000 15000 20000
SSE
(Sum
of S
quar
ed E
rror
s)
0.00
0.05
0.10
0.15
0.20
Best FitS = 11260 m2/g
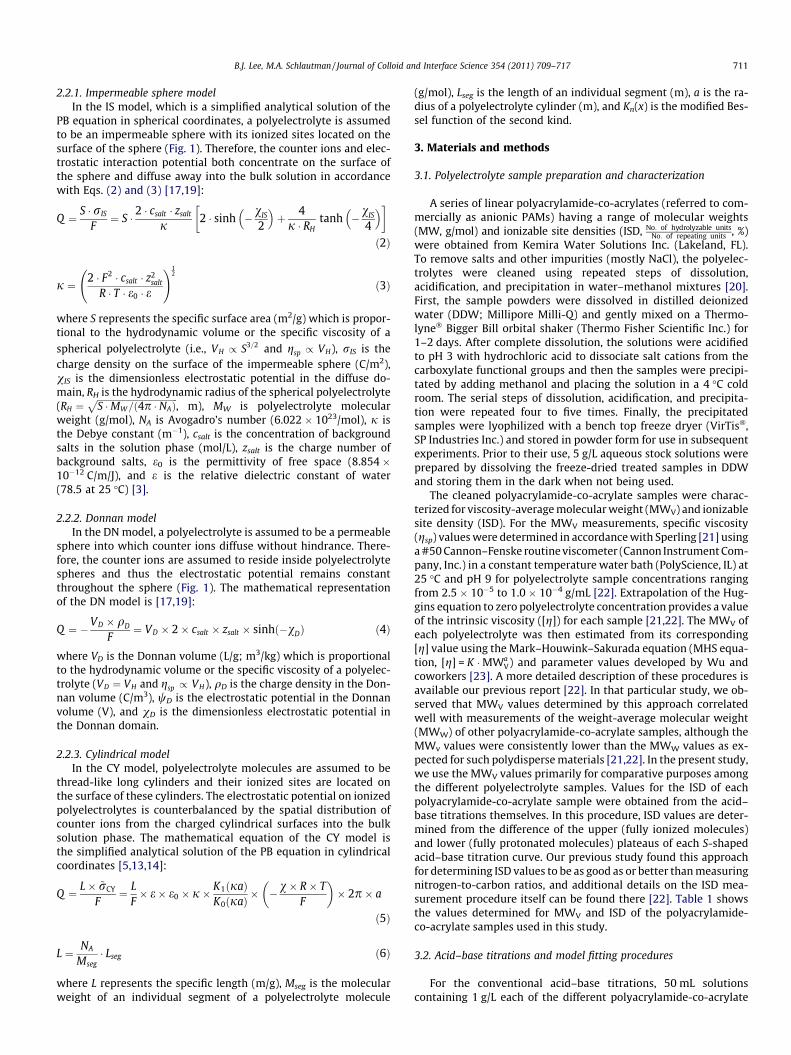
Fig. 2. Fitting of the IS model to the experimental acid–base titration curve forsample ISD35-1 (MWV = 1.31 � 106 g/mol, ISD = 35%) at 0.0194 M ionic strength. (a)Sum of squared errors (SSE) versus specific surface area (S). (b) Experimental andfitted titration curves. Various percentages of the optimized value for S aredemonstrated.
712 B.J. Lee, M.A. Schlautman / Journal of Colloid and Interface Science 354 (2011) 709–717
samples were prepared at pH 3 and ca. 0.003 M NaCl backgroundsalt concentration. Forward titrations were conducted by addinga standard base (0.5 M NaOH) stepwise up to pH 10. During thetitrations, pH values were monitored with a pH meter (Orion420A, Thermo Scientific Inc.) and the pH recorded after each addi-tion of base once equilibrium was attained. All solutions being ti-trated were purged continuously with nitrogen gas (NationalWelders Supply Co.) to minimize CO2 dissolution into solution.Upon reaching pH 10, a back titration to pH 3 was initiated imme-diately by stepwise addition of a standard acid (0.5 M HCl). Allpaired forward and backward titration curves were essentiallyidentical (i.e., less than 0.2% difference) for each sample, indicatingthat the acid–base reactions were reversible, highly reproducible,and that the samples were stable during the titrations. Upon com-pletion of the first forward and backward titration cycle, an appro-priate volume of stock salt solution (1 M NaCl) was added to eachtitration sample to increase the background salt concentration tofirst ca. 0.02 M NaCl, and then later ca. 0.1 M NaCl, to investigatethe electrostatic effects of varying ionic strength on the titrationcurves. Plots of OH� uptake versus pH for each polyacrylamide-co-acrylate sample resulted in S-shaped titration curves after sub-tracting the background acid/base consumption by water itself andutilizing the Güntelberg activity correction equation [3] for massbalance.
Fitting of the different electrostatic potential models to thetitration data was conducted using the method of least squares[24] and selecting the polyelectrolyte size as a fitting parameter(i.e., S in the IS model or VD in the DN model). The best fit curveand size parameter was found by minimizing the sum of squarederrors (SSE):
SSE ¼Xn
i¼1
ðerroriÞ2 ¼Xn
i¼1
ðyexp;i � ymodel;iÞ2 ð7Þ
Fig. 2 shows a representative example of an experimental acid–basetitration curve and optimized fit using the IS model. The parabolicoptimization curve shown in Fig. 2a is a typical characteristic ofmodel fitting; in this case, the rather sharp and steep curve indi-cates the high degree of dependence of the model fit to the poly-electrolyte surface area. In contrast with the IS and DN models,the CY model has fixed parameters for the polyelectrolyte cylindri-cal radius (a) and segment length (Lseg) which are applicable for allexperimental conditions. The universality of the size parameters inthe CY model is discussed in more depth in Section 4.
3.3. Specific viscosity measurements at varying pH and saltconcentration
To further evaluate the results obtained by fitting the differentelectrostatic potential models to the acid–base titration data,specific viscosities of 1 g/L polyacrylamide-co-acrylate sample
solutions were determined under different pH and NaCl concentra-tion conditions. The same approach and viscometer as describedabove were utilized. According to the Einstein viscosity theorem,the specific viscosity is proportional to the hydrodynamic sphericalvolume of a polymeric molecule [21]:
(a)
α(D
egre
e of
Ioni
zatio
n)
0.2
0.4
0.6
0.8
1.0
Exp. Data (0.0044 M)Exp. Data (0.1150 M)
MonomericCarboxylic Acid
B.J. Lee, M.A. Schlautman / Journal of Colloid and Interface Science 354 (2011) 709–717 713
gsp ¼g� g0
g0¼ tc � ts
ts¼ 2:5
n2
V
� �VH ) gsp / VH ð8Þ
where g and g0 are the viscosities of polyelectrolyte and back-ground aqueous solution, respectively, tc and ts are the travel timesfor the polyelectrolyte and background aqueous solution, respec-tively, through the capillary tube of the viscometer, n2/V is the num-ber of polymeric molecules per unit volume, and VH is thehydrodynamic volume (L/g; m3/kg). Therefore, the measured spe-cific viscosity was used as a relative size index to investigate possi-ble correlations with the different model-fitted size indices (S in theIS model or VD in the DN model) as well as to demonstrate thechange in size of the polyacrylamide-co-acrylate samples withvarying solution chemistry conditions [17].
(c)
pH2 4 6 8 10
Res
idua
ls
-0.15
-0.10
-0.05
0.00
0.05
0.10
0.15
xxx
xx x x x x
xxx x x x
xx x x
x
x
x
xxx
xx
xx x xxx
xxxx x
x x x x
xx
DN ModelIS Model x
CY Model
(b)
pH2 4 6 8 10
Res
idua
ls
-0.15
-0.10
-0.05
0.00
0.05
0.10
0.15
xx x x x x x x x
x xx x
x xx
x xx
x
x
x
xx x x
xx
xx
xx x x
xx
xx
x x x x
xx
DN ModelIS Model x
CY Model
pH2 4 6 8 10
0.0
DN Model (Best Fit)IS Model (Best Fit)CY Model (Fixed Parameter)
Fig. 3. Experimental acid–base titration data and model fits for sample ISD35-1(MWV = 1.31 � 106 g/mol, ISD = 35%) at 0.0044 and 0.115 M solution ionic strength.(a) Titration curves and model fits. (b) Residuals between experimental and fitteddata for solution ionic strength of 0.0044 M. (c) Residuals between experimentaland fitted data for solution ionic strength of 0.115 M.
4. Results and discussion
To evaluate the electrostatic interaction behavior of the differentpolyacrylamide-co-acrylate samples, we first examined the experi-mental and fitted acid–base titration curves. Typical results areshown in Figs. 2 and 3 for the sample designated ISD35-1, whichwas one of the smallest polyelectrolytes tested (MWV of1.31 � 106 g/mol) but which had one of the highest ISD values at�35% (Table 1). Fig. 2 demonstrates the importance of the specificsurface area parameter in the IS model used to optimize the modelfit to the titration data, while Fig. 3 shows how varying the ionicstrength from 0.0044 to 0.115 M NaCl affected not only the titrationcurve itself for ISD35-1 but also the ability of the three electrostaticpotential models to fit the experimental data. Also shown in Fig. 3aare the hypothetical titration curves at these same two ionicstrengths for a simple monomeric carboxylic acid having the sameintrinsic acidity constant. Some general observations can be noted.First, the effect of ionic strength on the monomeric carboxylic acidis much less important than it is for the polyelectrolyte. Second, inall cases the titration curves for the polyelectrolytes are not as steepas for the monomeric carboxylic acid, that is, it takes a wider pHrange and higher pH values to achieve complete deprotonation.Polyelectrolytes exhibit less steep titration curves because the elec-trostatic interactions among neighboring functional groups tend tohinder the formation of charged sites due to deprotonation. The ef-fects of these electrostatic repulsion interactions also explain thefact that titration curves for polyelectrolytes become steeper withincreasing ionic strength and with decreasing polyelectrolyte ISD.
Fitting of the acid–base titration curves with the IS, DN, and CYmodels was conducted to evaluate their ability to mimic the shapeand curvature of the experimental data. For example, in Fig. 3a theshape and curvature obtained with each model was clearly differentfor the lowest ionic strength (0.0044 M) condition. With increasingpH, the curve generated by the DN model exhibits the steepest slopewhile the CY model curve has the shallowest slope. Considering themorphological assumptions for polyelectrolytes by the CY and DNmodels, the same number of charged sites should be distributedmore densely on the thread-like cylindrical surface (CY) than inthe permeable spherical volume (DN). In turn, the dense distributionof charged sites with the CY model induces higher electrostaticinteraction potentials and proton-holding properties which lead toacid–base titration curves that are less steep than those obtainedusing the DN model. The fitted titration curve for the IS model wasintermediate between the above two extreme cases of the CY andDN models. Therefore, the different morphological assumptions ofthe three models play a critical role in adequately representing theelectrostatic interactions among acid–base functional groups andthe resulting model titration curves.
714 B.J. Lee, M.A. Schlautman / Journal of Colloid and Interface Science 354 (2011) 709–717
With respect to accuracy of the three models, we found that theIS and CY models produced marginally better fits to the experi-mental data with smaller residual errors than with the DN model,especially at the lowest ionic strength conditions (e.g., Fig. 3b).However, because the CY model uses fixed size index parametersfor all solution conditions without resorting to iterative fitting pro-cedures, it is actually a more robust model than either the IS or DNmodels.
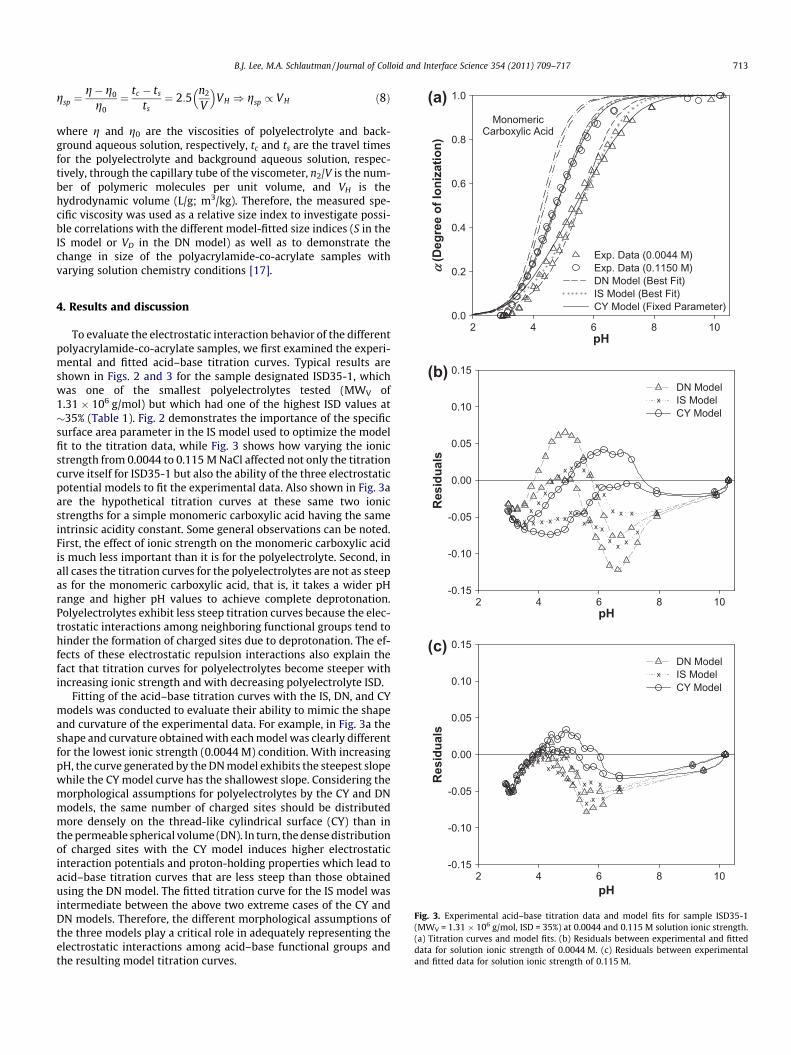
Hereinafter, the universality of the CY model is compared againstthe variable size parameter approach used by the IS and DN modelstogether with their morphological assumptions for polyelectrolytes.For example, upon comparing values of gsp determined from theviscosity measurements and the fitted model size indices (S in theIS model and VD in the DN model), two shortcomings in the IS andDN models can be identified. First, it is immediately obvious thatthere are inconsistencies between the experimental and model sizeindices as the pH changes during acid–base titrations. For example,experimental values of gsp for the ISD35-1 polyacrylamide-co-acry-late sample increase with increasing pH (Fig. 4a). Recall that gsp isdirectly proportional to the polyelectrolyte hydrodynamic volume(Eq. (8)). In contrast, the size indices contained in the IS and DN mod-
Low pHHigh pH
Ionization
CationAnion
Low pHHigh pH
IonizationCationAnion
Model Assumption
Reality : Viscosity Measurement
(b)
(a)
pH2 4 6 8 10
η sp(S
peci
fic V
isco
sity
)
0
5
10
15
20
x
x
x x
0.0048 M0.0195 Mx0.1153 M
Fig. 4. (a) Experimental specific viscosity (gsp) versus pH for sample ISD35-1(MWV = 1.31 � 106 g/mol, ISD = 35%) measured under different solution ionicstrength conditions. (b) Schematic diagrams of polyelectrolyte morphology andmetamorphosis as represented in the IS and DN models (top) versus that observedin specific viscosity tests (bottom).
els (S or VD) must be constant with pH (Fig. 4b) because they are usedas fitting parameters over the entire titration curve [17,19].
In contrast with our observations of polyelectrolyte expansionand contraction with changing pH, Pohlmeier and Haber-Pohlme-ier [16] reported that the pH-dependent size change of the poly-electrolytes used in their study was minor. However, it isimportant to note that the polyacrylamide-co-acrylate materialswe used had MW values that were tens or hundreds times largerthan the polyelectrolytes used by Pohlmeier and Haber-Pohlmeier,and so it would be expected that our samples would be more likelyto expand or contract with pH. Furthermore, other researchershave reported similar polyelectrolyte conformational changes withpH [2,7–14]. Therefore, we conclude that the assumption inherentin the IS and DN models that polyelectrolyte size remain constantover a wide pH range may not be valid for large linear polyelectro-lytes such as the polyacrylamide-co-acrylate samples used here.
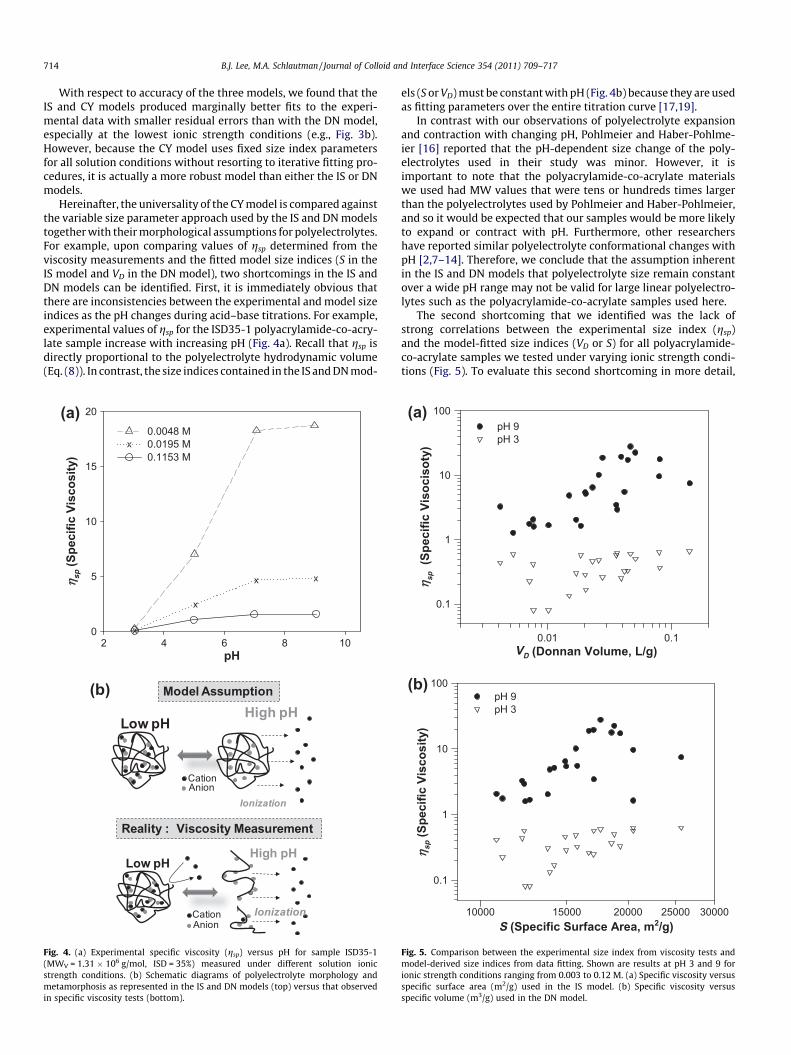
The second shortcoming that we identified was the lack ofstrong correlations between the experimental size index (gsp)and the model-fitted size indices (VD or S) for all polyacrylamide-co-acrylate samples we tested under varying ionic strength condi-tions (Fig. 5). To evaluate this second shortcoming in more detail,
S (Specific Surface Area, m2/g)15000 20000 25000 3000010000
η sp
(Spe
cific
Vis
cosi
ty)
0.1
1
10
100pH 9pH 3
(b)
VD (Donnan Volume, L/g)1.010.0
η sp (S
peci
fic V
isoc
isot
y)
0.1
1
10
100pH 9pH 3
(a)
Fig. 5. Comparison between the experimental size index from viscosity tests andmodel-derived size indices from data fitting. Shown are results at pH 3 and 9 forionic strength conditions ranging from 0.003 to 0.12 M. (a) Specific viscosity versusspecific surface area (m2/g) used in the IS model. (b) Specific viscosity versusspecific volume (m3/g) used in the DN model.
S (Specific Surface Area, m2/g)15000 20000 25000 3000010000
η sp (
Spec
ific
Visc
osity
)
0.1
1
10
100ISD25-1 (Medium MW)ISD25-2 (High MW)ISD25-3 (Ultra-High MW)
pH 9
pH 3
IncreasingIonic
Strength
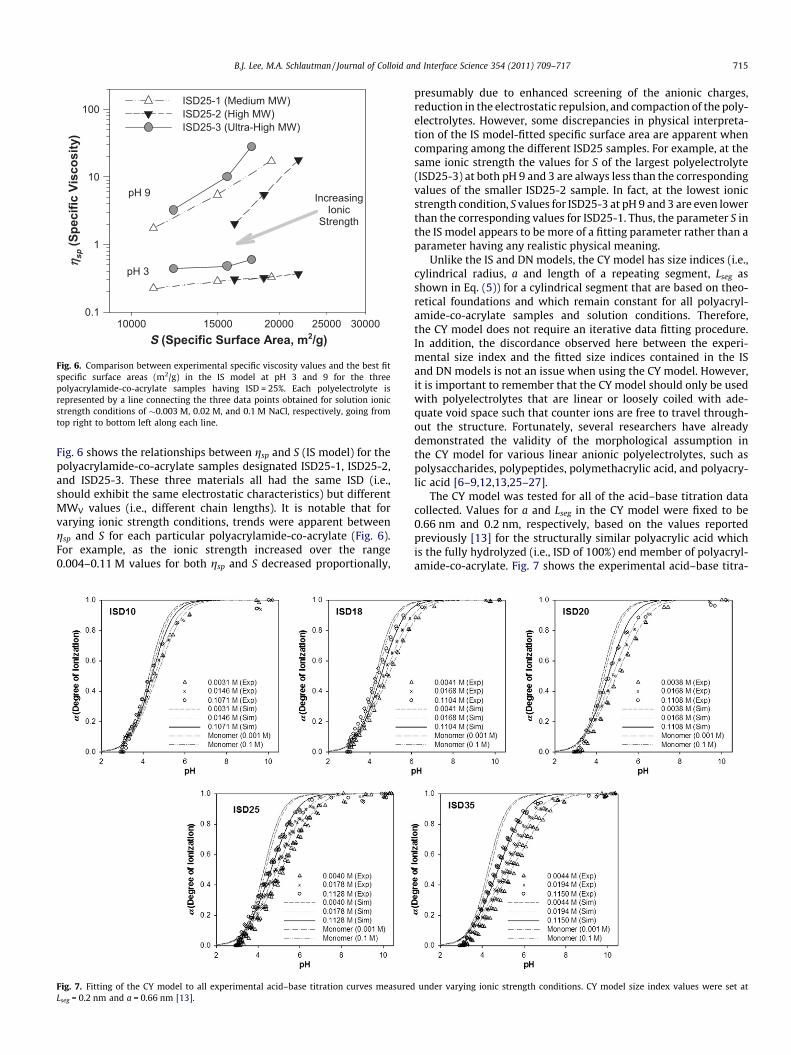
Fig. 6. Comparison between experimental specific viscosity values and the best fitspecific surface areas (m2/g) in the IS model at pH 3 and 9 for the threepolyacrylamide-co-acrylate samples having ISD = 25%. Each polyelectrolyte isrepresented by a line connecting the three data points obtained for solution ionicstrength conditions of �0.003 M, 0.02 M, and 0.1 M NaCl, respectively, going fromtop right to bottom left along each line.
B.J. Lee, M.A. Schlautman / Journal of Colloid and Interface Science 354 (2011) 709–717 715
Fig. 6 shows the relationships between gsp and S (IS model) for thepolyacrylamide-co-acrylate samples designated ISD25-1, ISD25-2,and ISD25-3. These three materials all had the same ISD (i.e.,should exhibit the same electrostatic characteristics) but differentMWV values (i.e., different chain lengths). It is notable that forvarying ionic strength conditions, trends were apparent betweengsp and S for each particular polyacrylamide-co-acrylate (Fig. 6).For example, as the ionic strength increased over the range0.004–0.11 M values for both gsp and S decreased proportionally,
Fig. 7. Fitting of the CY model to all experimental acid–base titration curves measuredLseg = 0.2 nm and a = 0.66 nm [13].
presumably due to enhanced screening of the anionic charges,reduction in the electrostatic repulsion, and compaction of the poly-electrolytes. However, some discrepancies in physical interpreta-tion of the IS model-fitted specific surface area are apparent whencomparing among the different ISD25 samples. For example, at thesame ionic strength the values for S of the largest polyelectrolyte(ISD25-3) at both pH 9 and 3 are always less than the correspondingvalues of the smaller ISD25-2 sample. In fact, at the lowest ionicstrength condition, S values for ISD25-3 at pH 9 and 3 are even lowerthan the corresponding values for ISD25-1. Thus, the parameter S inthe IS model appears to be more of a fitting parameter rather than aparameter having any realistic physical meaning.
Unlike the IS and DN models, the CY model has size indices (i.e.,cylindrical radius, a and length of a repeating segment, Lseg asshown in Eq. (5)) for a cylindrical segment that are based on theo-retical foundations and which remain constant for all polyacryl-amide-co-acrylate samples and solution conditions. Therefore,the CY model does not require an iterative data fitting procedure.In addition, the discordance observed here between the experi-mental size index and the fitted size indices contained in the ISand DN models is not an issue when using the CY model. However,it is important to remember that the CY model should only be usedwith polyelectrolytes that are linear or loosely coiled with ade-quate void space such that counter ions are free to travel through-out the structure. Fortunately, several researchers have alreadydemonstrated the validity of the morphological assumption inthe CY model for various linear anionic polyelectrolytes, such aspolysaccharides, polypeptides, polymethacrylic acid, and polyacry-lic acid [6–9,12,13,25–27].
The CY model was tested for all of the acid–base titration datacollected. Values for a and Lseg in the CY model were fixed to be0.66 nm and 0.2 nm, respectively, based on the values reportedpreviously [13] for the structurally similar polyacrylic acid whichis the fully hydrolyzed (i.e., ISD of 100%) end member of polyacryl-amide-co-acrylate. Fig. 7 shows the experimental acid–base titra-
under varying ionic strength conditions. CY model size index values were set at
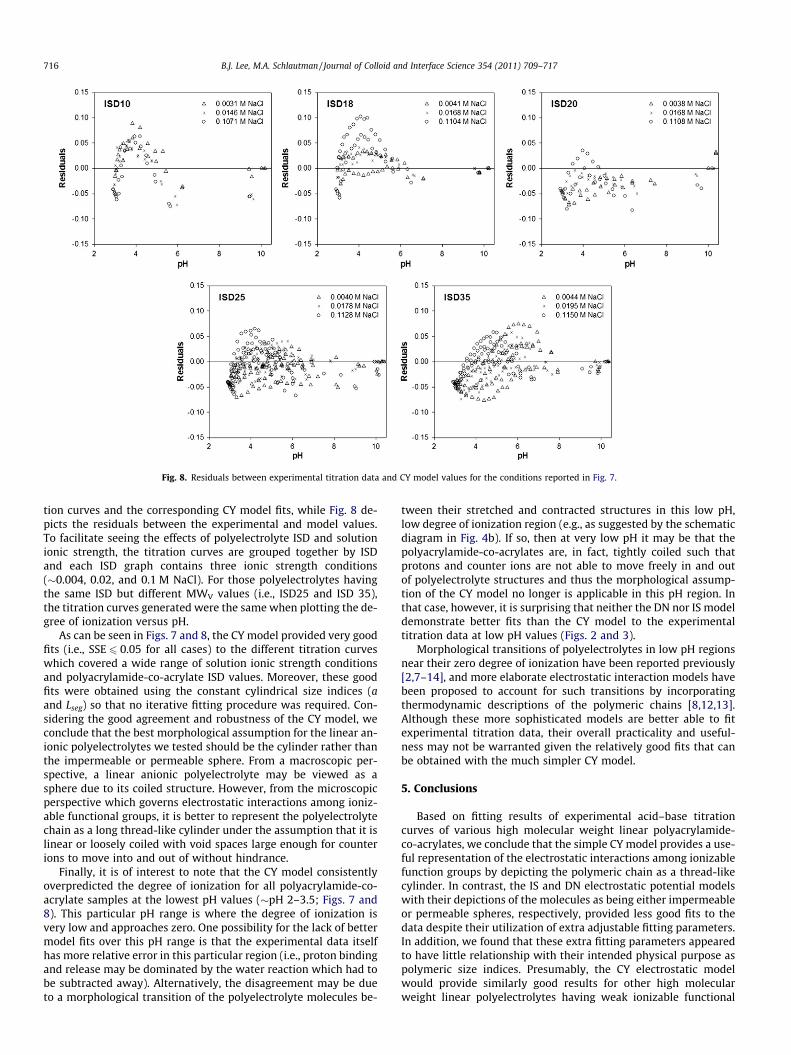
Fig. 8. Residuals between experimental titration data and CY model values for the conditions reported in Fig. 7.
716 B.J. Lee, M.A. Schlautman / Journal of Colloid and Interface Science 354 (2011) 709–717
tion curves and the corresponding CY model fits, while Fig. 8 de-picts the residuals between the experimental and model values.To facilitate seeing the effects of polyelectrolyte ISD and solutionionic strength, the titration curves are grouped together by ISDand each ISD graph contains three ionic strength conditions(�0.004, 0.02, and 0.1 M NaCl). For those polyelectrolytes havingthe same ISD but different MWV values (i.e., ISD25 and ISD 35),the titration curves generated were the same when plotting the de-gree of ionization versus pH.
As can be seen in Figs. 7 and 8, the CY model provided very goodfits (i.e., SSE 6 0.05 for all cases) to the different titration curveswhich covered a wide range of solution ionic strength conditionsand polyacrylamide-co-acrylate ISD values. Moreover, these goodfits were obtained using the constant cylindrical size indices (aand Lseg) so that no iterative fitting procedure was required. Con-sidering the good agreement and robustness of the CY model, weconclude that the best morphological assumption for the linear an-ionic polyelectrolytes we tested should be the cylinder rather thanthe impermeable or permeable sphere. From a macroscopic per-spective, a linear anionic polyelectrolyte may be viewed as asphere due to its coiled structure. However, from the microscopicperspective which governs electrostatic interactions among ioniz-able functional groups, it is better to represent the polyelectrolytechain as a long thread-like cylinder under the assumption that it islinear or loosely coiled with void spaces large enough for counterions to move into and out of without hindrance.
Finally, it is of interest to note that the CY model consistentlyoverpredicted the degree of ionization for all polyacrylamide-co-acrylate samples at the lowest pH values (�pH 2–3.5; Figs. 7 and8). This particular pH range is where the degree of ionization isvery low and approaches zero. One possibility for the lack of bettermodel fits over this pH range is that the experimental data itselfhas more relative error in this particular region (i.e., proton bindingand release may be dominated by the water reaction which had tobe subtracted away). Alternatively, the disagreement may be dueto a morphological transition of the polyelectrolyte molecules be-
tween their stretched and contracted structures in this low pH,low degree of ionization region (e.g., as suggested by the schematicdiagram in Fig. 4b). If so, then at very low pH it may be that thepolyacrylamide-co-acrylates are, in fact, tightly coiled such thatprotons and counter ions are not able to move freely in and outof polyelectrolyte structures and thus the morphological assump-tion of the CY model no longer is applicable in this pH region. Inthat case, however, it is surprising that neither the DN nor IS modeldemonstrate better fits than the CY model to the experimentaltitration data at low pH values (Figs. 2 and 3).
Morphological transitions of polyelectrolytes in low pH regionsnear their zero degree of ionization have been reported previously[2,7–14], and more elaborate electrostatic interaction models havebeen proposed to account for such transitions by incorporatingthermodynamic descriptions of the polymeric chains [8,12,13].Although these more sophisticated models are better able to fitexperimental titration data, their overall practicality and useful-ness may not be warranted given the relatively good fits that canbe obtained with the much simpler CY model.
5. Conclusions
Based on fitting results of experimental acid–base titrationcurves of various high molecular weight linear polyacrylamide-co-acrylates, we conclude that the simple CY model provides a use-ful representation of the electrostatic interactions among ionizablefunction groups by depicting the polymeric chain as a thread-likecylinder. In contrast, the IS and DN electrostatic potential modelswith their depictions of the molecules as being either impermeableor permeable spheres, respectively, provided less good fits to thedata despite their utilization of extra adjustable fitting parameters.In addition, we found that these extra fitting parameters appearedto have little relationship with their intended physical purpose aspolymeric size indices. Presumably, the CY electrostatic modelwould provide similarly good results for other high molecularweight linear polyelectrolytes having weak ionizable functional
B.J. Lee, M.A. Schlautman / Journal of Colloid and Interface Science 354 (2011) 709–717 717
groups if they remain essentially linear or are only loosely coiledsuch that counter ions are free to travel throughout the polymerstructure.
Acknowledgments
We gratefully acknowledge the helpful comments provided bythe reviewers. Primary funding for this study was provided bythe USDA Natural Resources Conservation Service (NRCS-69-4639-1-0010) through the Changing Land Use and Environment(CLUE) Project at Clemson University. Additional support was pro-vided by the USDA Cooperative State Research, Education, andExtension Service (USDA-CSREES) under project numbers SC-1700278 and SC-1700395. Any opinions, findings, conclusions orrecommendations expressed in this article are solely those of theauthors and do not necessarily reflect the views of the USDA.Author Lee also acknowledges financial support from the ClemsonUniversity Department of Environmental Engineering and EarthSciences (teaching assistantship and L.G. Rich Fellowship) andthe Clemson University Graduate School (R.C. Edwards Fellow-ship). This is Technical Contribution No. 5875 of the ClemsonUniversity Experiment Station.
References
[1] P. Molyneux, Water-Soluble Synthetic Polymers: Properties and Behavior, vol.3, CRC Press Inc., Boca Raton, Florida, 1983.
[2] S. Rice, M. Nagasawa, Molecular Biology, Polyelectrolyte Solutions, vol. 2,Academic Press Inc., New York, NY, 1961.
[3] W. Stumm, J. Morgan, Aquatic Chemistry: Chemical Equilibria and Rates inNatural Waters, third ed., John Wiley & Sons, Inc., New York, NY, 1996.
[4] E. Tipping, Cation Binding by Humic Substances, Cambridge University Press,Cambridge, UK, 2002.
[5] T. Hill, Arch. Biochem. Biophys. 57 (1955) 229–239.[6] L. Kotin, M. Nagasawa, J. Phys. Chem. 36 (1962) 873–880.[7] M. Nagasawa, T. Murase, K. Kondo, J. Phys. Chem. 69 (1965) 4005–4012.[8] D. Olander, A. Holtzer, J. Am. Chem. Soc. 90 (1968) 4549–4560.[9] Y. Kawaguchi, M. Nagasawa, J. Phys. Chem. 73 (1969) 4382–4384.
[10] F. Oosawa, Polyelectrolytes, Mercel Dekker, New York, 1971.[11] Y. Muroga, K. Suzuki, Y. Kawaguchi, M. Nagasawa, Biopolymers 11 (1972) 137–
144.[12] R. Cleland, Macromolecules 17 (1984) 634–645.[13] M. Ullner, B. Jonsson, Macromolecules 29 (1996) 6645–6655.[14] E. Matijevic, Surface and Colloid Science, vol. 16, Kluwer Academic/Plenum
Publishers, New York, NY, 2001.[15] J. Hansen, H. Lowen, Annu. Rev. Phys. Chem. 51 (2000) 209–242.[16] A. Pohlmeier, S. Haber-Pohlmeier, J. Colloid Interface Sci. 273 (2004) 369–380.[17] M. Avena, L. Koopal, W. Riemsdijk, J. Colloid Interface Sci. 217 (1999) 37–48.[18] L. Koopal, T. Saito, J. Pinheiro, W. Riemsdijk, Colloids Surf., A: Physicochem.
Eng. Aspects 265 (2005) 40–54.[19] T. Saito, S. Nagasaki, S. Tanaka, L. Koopal, Colloids Surf., A: Physicochem. Eng.
Aspects 265 (2005) 104–113.[20] J. Francois, D. Sarazin, T. Schwartz, G. Weil, Polymer 20 (1979) 969–975.[21] L. Sperling, Introduction to Physical Polymer Science, fourth ed., John Wiley &
Sons, Inc., Hoboken, NJ, 2006.[22] B. Lee, S. Ko, I. Luzinov, J. Hayes, M. Schlautman, Trans. ASABE 53 (2010) 1127–
1136.[23] X. Wu, D. Hunkeler, A. Hamielec, R. Pelton, D. Woods, J. Appl. Polym. Sci. 42
(1991) 2081–2093.[24] P. Berthouex, L. Brown, Statistics for Environmental Engineers, Lewis
Publishers, Boca Raton, FL, 1994.[25] M. Nagasawa, A. Holtzer, J. Am. Chem. Soc. 86 (1964) 531–538.[26] R. Cleland, J. Wang, D. Detweiler, Macromolecules 15 (1982) 386–395.[27] M. Deserno, C. Holm, S. May, Macromolecules 33 (2000) 199–206.