Embed Size (px)
Citation preview
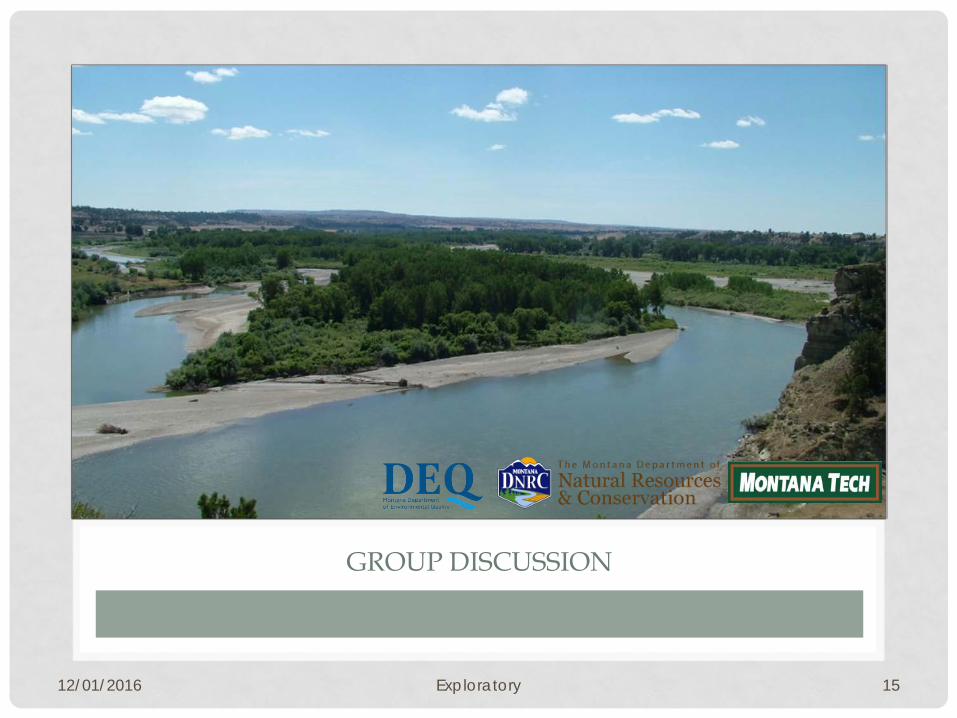
K . F L Y N N , L . D O L A N , C . D A L B Y , R . N A G I S E T T Y
EVALUATING CLIMATE CHANGE IMPACTS ON WATER QUALITY USING
MECHANISTIC RECEIVING-WATER MODELS
EXPLORATORY – Caveat Emptor
OVERVIEW
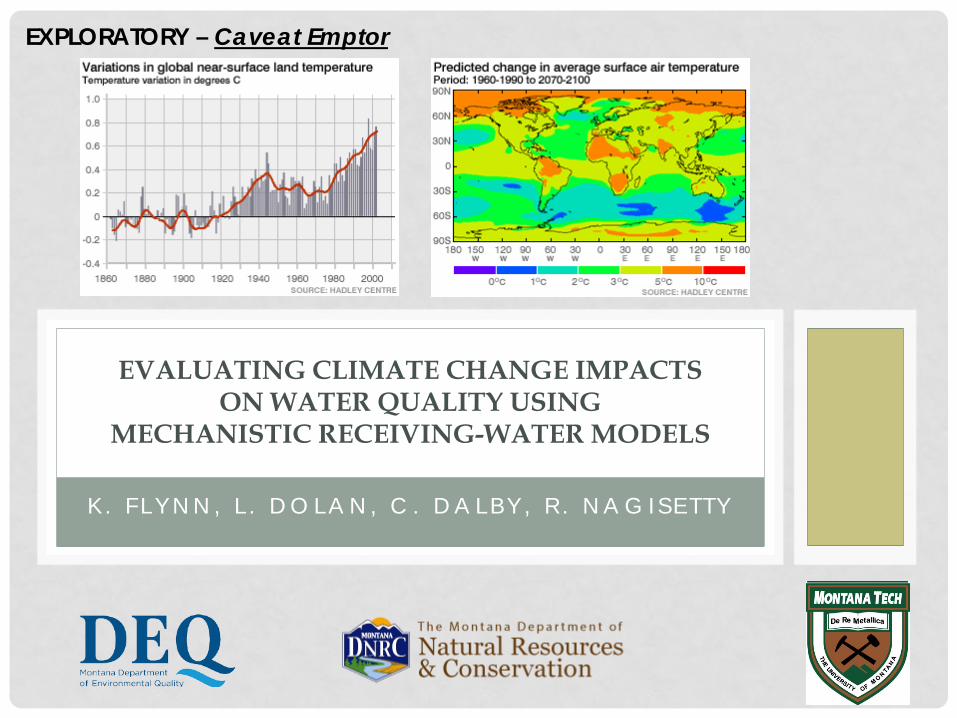
• Introduction • Summarize potential impacts of climate change on water
quality • How mechanistic water-quality model frameworks can be
integrated to inform climate change science • Example
• Case study – Yellowstone River • GCM downscaling • Climate change emission scenarios in WQ model
• Results • Discussion
12/01/2016 Exploratory 2
BASIC LITERATURE REVIEW
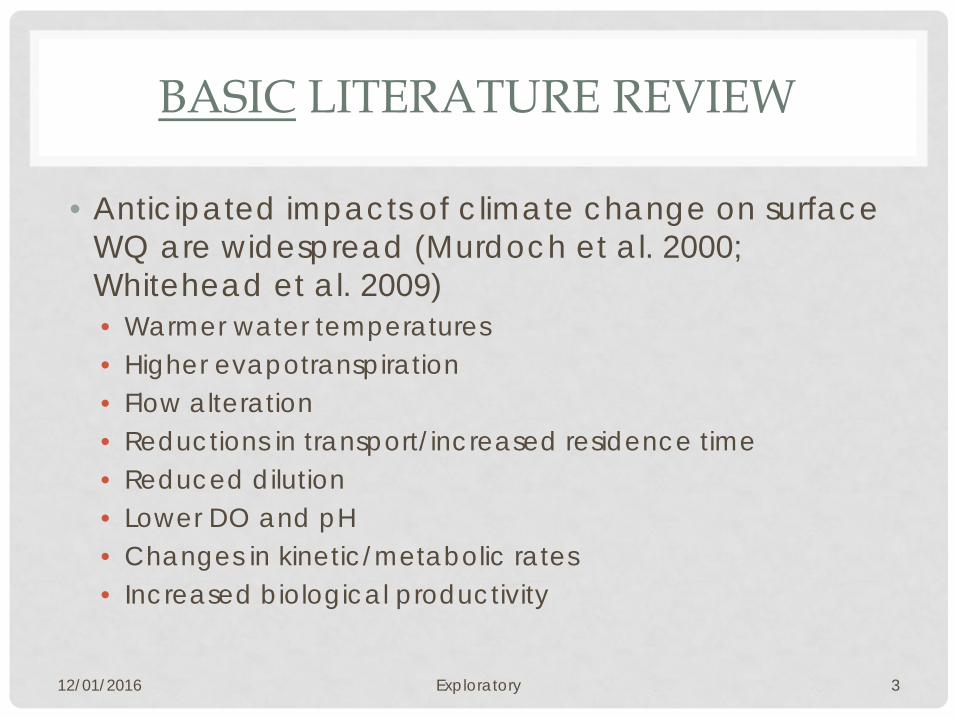
• Anticipated impacts of climate change on surface WQ are widespread (Murdoch et al. 2000; Whitehead et al. 2009) • Warmer water temperatures • Higher evapotranspiration • Flow alteration • Reductions in transport/increased residence time • Reduced dilution • Lower DO and pH • Changes in kinetic/metabolic rates • Increased biological productivity
12/01/2016 Exploratory 3
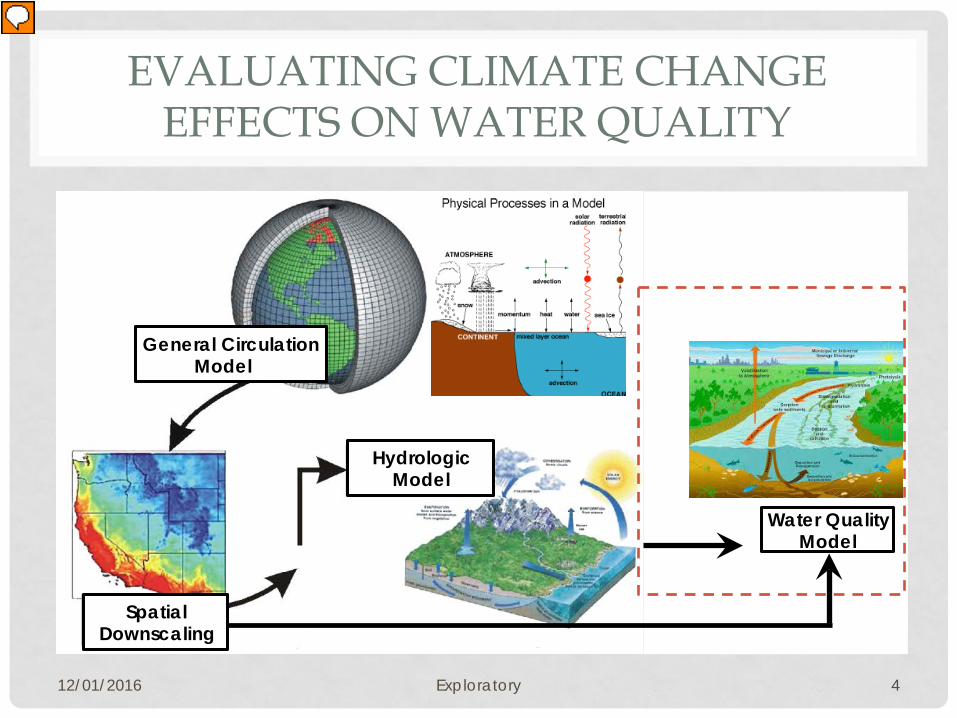
EVALUATING CLIMATE CHANGE EFFECTS ON WATER QUALITY
12/01/2016 Exploratory 4
General Circulation Model
Spatial Downscaling
Hydrologic Model
Water Quality Model
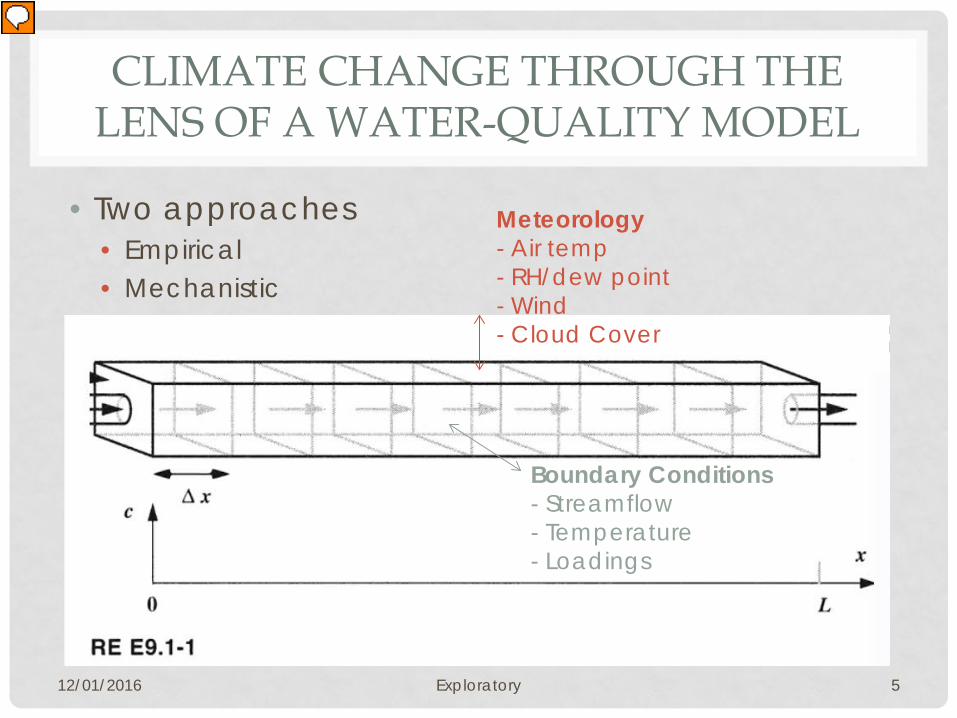
CLIMATE CHANGE THROUGH THE LENS OF A WATER-QUALITY MODEL
• Two approaches • Empirical • Mechanistic
12/01/2016 Exploratory 5
Morrill et al. (2005)
Meteorology - Air temp - RH/dew point - Wind - Cloud Cover
Boundary Conditions - Streamflow - Temperature - Loadings
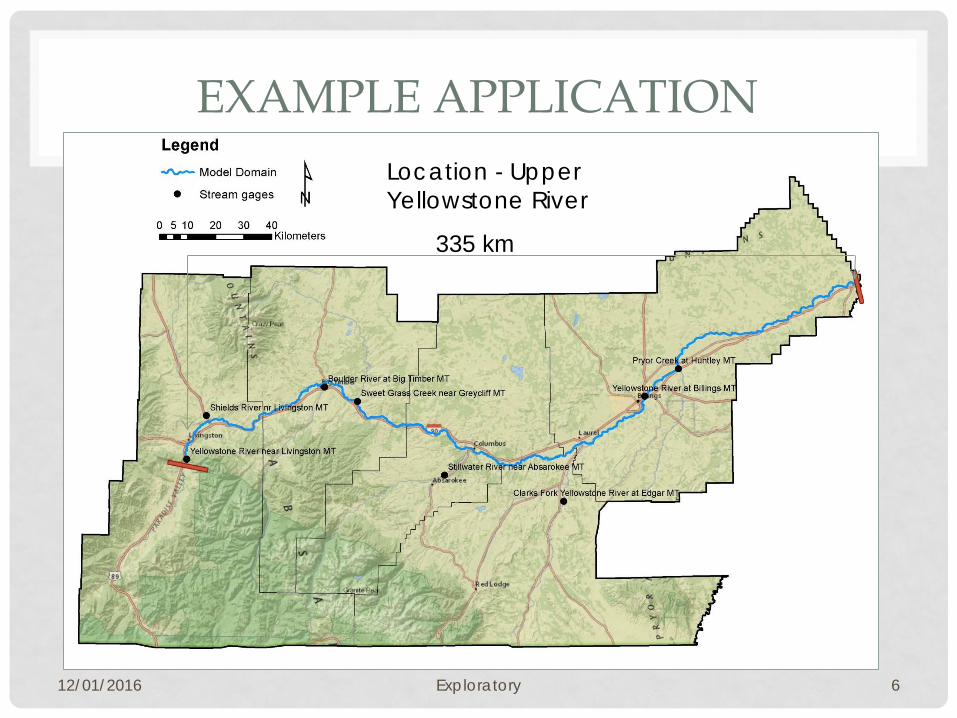
EXAMPLE APPLICATION
12/01/2016 Exploratory 6
335 km
Location - Upper Yellowstone River

MODEL, DATA, AND CLIMATE SCENARIOS
• Use existing QUAL2K1-D heat/mass transport model • Draft; not fully calibrated (rates from Flynn et al. 2015)
• Evaluate two 2099 greenhouse gas emission scenarios • Representative concentration pathway (RCP) RCP 4.5 (560
ppm by 2100) and RCP 8.5 (1370 ppm by 2100). • Air temperature, dew point, wind speed, cloud cover,
tributary and headwater flows, temperatures, dissolved oxygen, point source inflows
• Downscaled CMIP5 multi-model ensemble median
12/01/2016 Exploratory 7
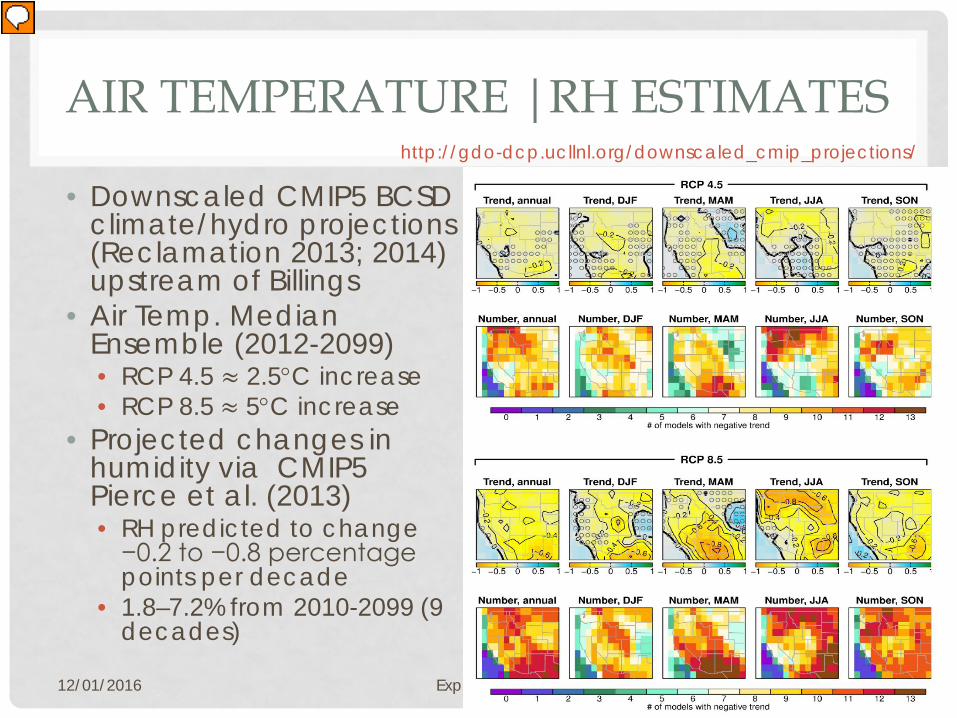
AIR TEMPERATURE |RH ESTIMATES
• Downscaled CMIP5 BCSD climate/hydro projections (Reclamation 2013; 2014) upstream of Billings
• Air Temp. Median Ensemble (2012-2099) • RCP 4.5 ≈ 2.5°C increase • RCP 8.5 ≈ 5°C increase
• Projected changes in humidity via CMIP5 Pierce et al. (2013) • RH predicted to change
−0.2 to −0.8 percentage points per decade
• 1.8–7.2% from 2010-2099 (9 decades)
12/01/2016 Exploratory 8
http://gdo-dcp.ucllnl.org/downscaled_cmip_projections/
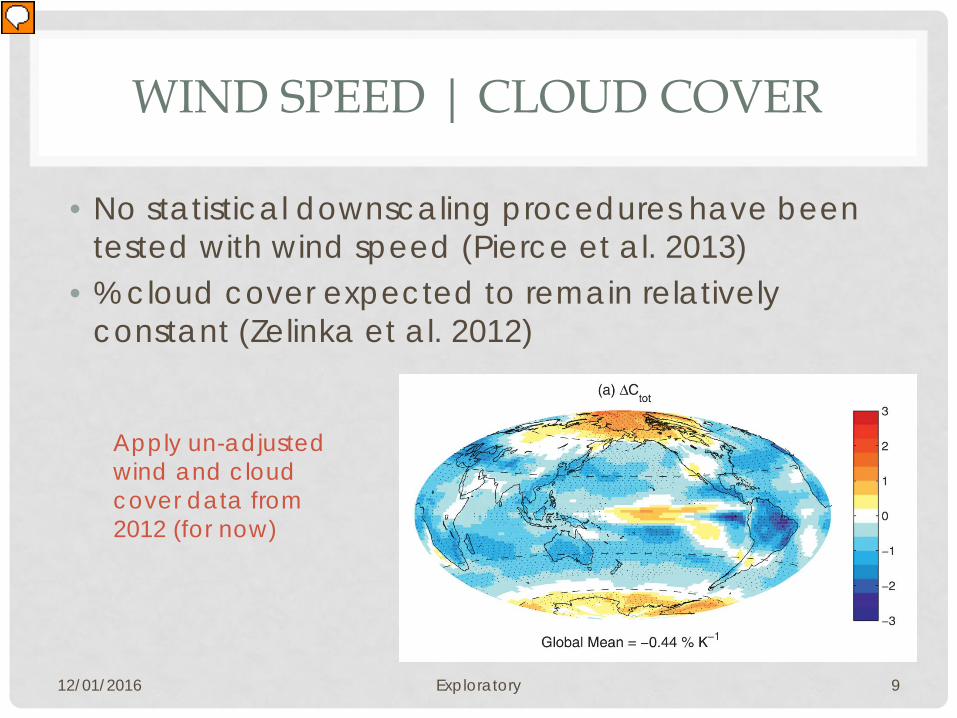
WIND SPEED | CLOUD COVER
• No statistical downscaling procedures have been tested with wind speed (Pierce et al. 2013)
• % cloud cover expected to remain relatively constant (Zelinka et al. 2012)
12/01/2016 Exploratory 9
Apply un-adjusted wind and cloud cover data from 2012 (for now)
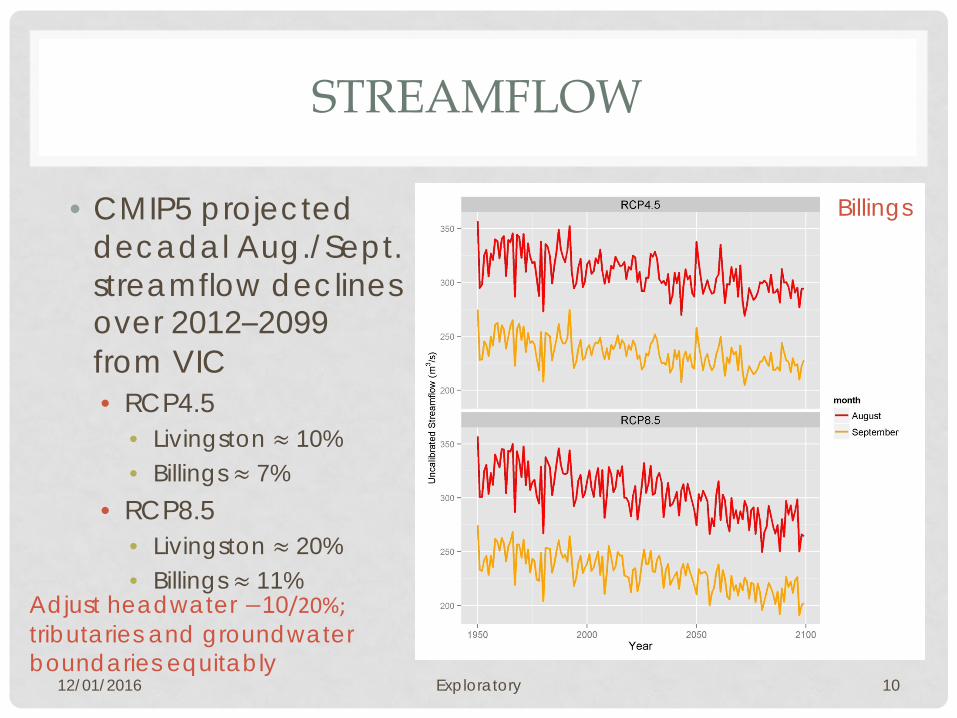
STREAMFLOW
• CMIP5 projected decadal Aug./Sept. streamflow declines over 2012–2099 from VIC • RCP4.5
• Livingston ≈ 10% • Billings ≈ 7%
• RCP8.5 • Livingston ≈ 20% • Billings ≈ 11%
12/01/2016 Exploratory 10
Billings
Adjust headwater −10/20%; tributaries and groundwater boundaries equitably
T99
T90
T50
T1
T10
Q99Q95
Q90
Q50Q20
Q5Q1
Q80
Q10
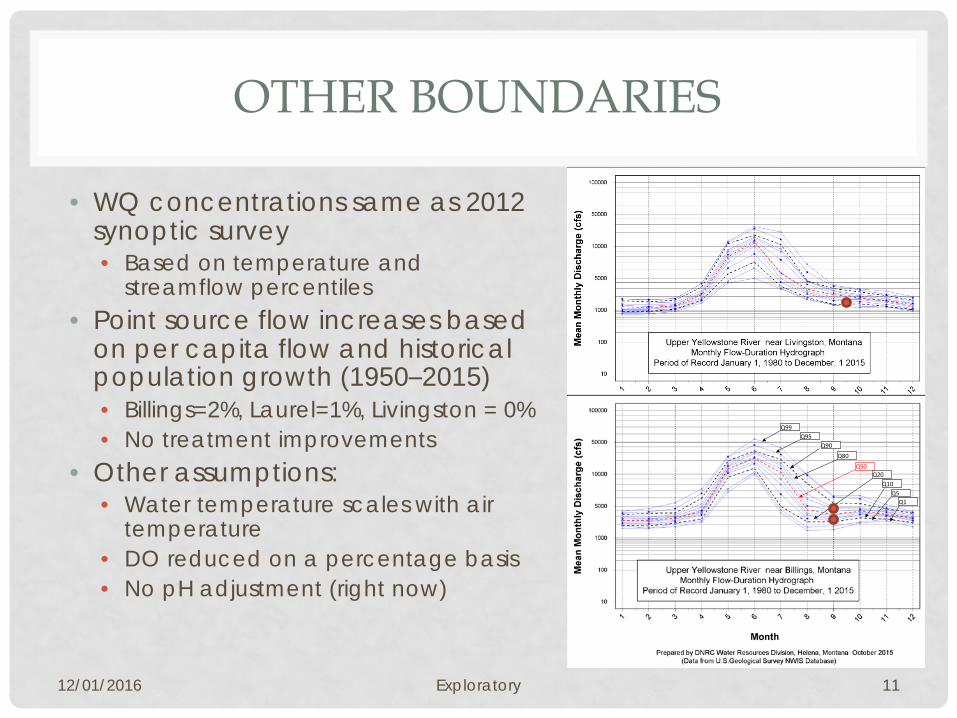
OTHER BOUNDARIES
• WQ concentrations same as 2012 synoptic survey • Based on temperature and
streamflow percentiles • Point source flow increases based
on per capita flow and historical population growth (1950–2015) • Billings=2%, Laurel=1%, Livingston = 0% • No treatment improvements
• Other assumptions: • Water temperature scales with air
temperature • DO reduced on a percentage basis • No pH adjustment (right now)
12/01/2016 Exploratory 11
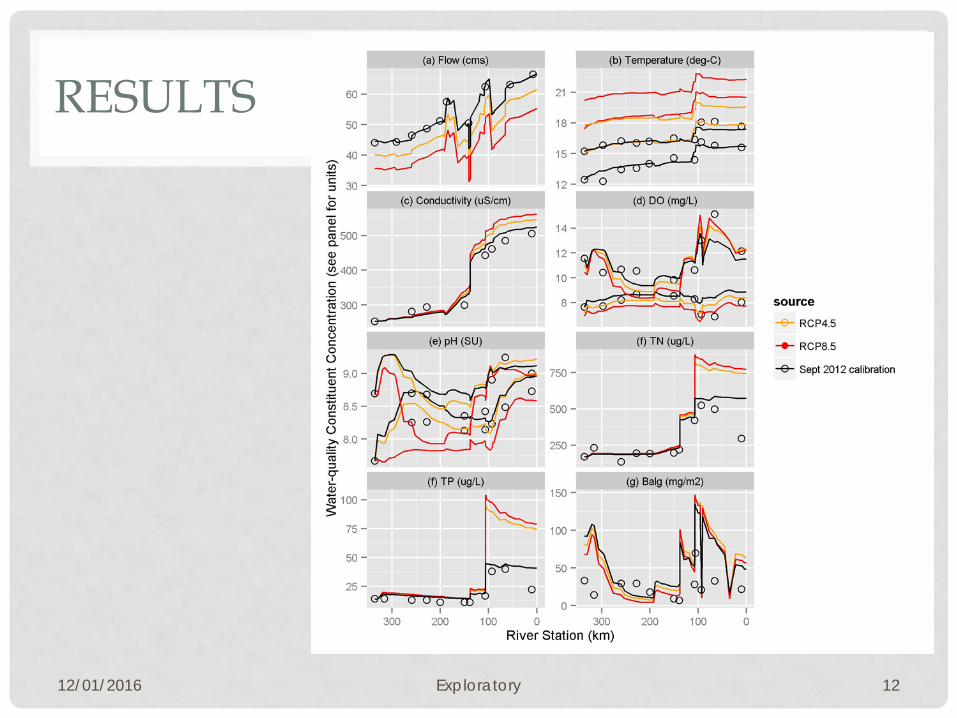
RESULTS
12/01/2016 Exploratory 12
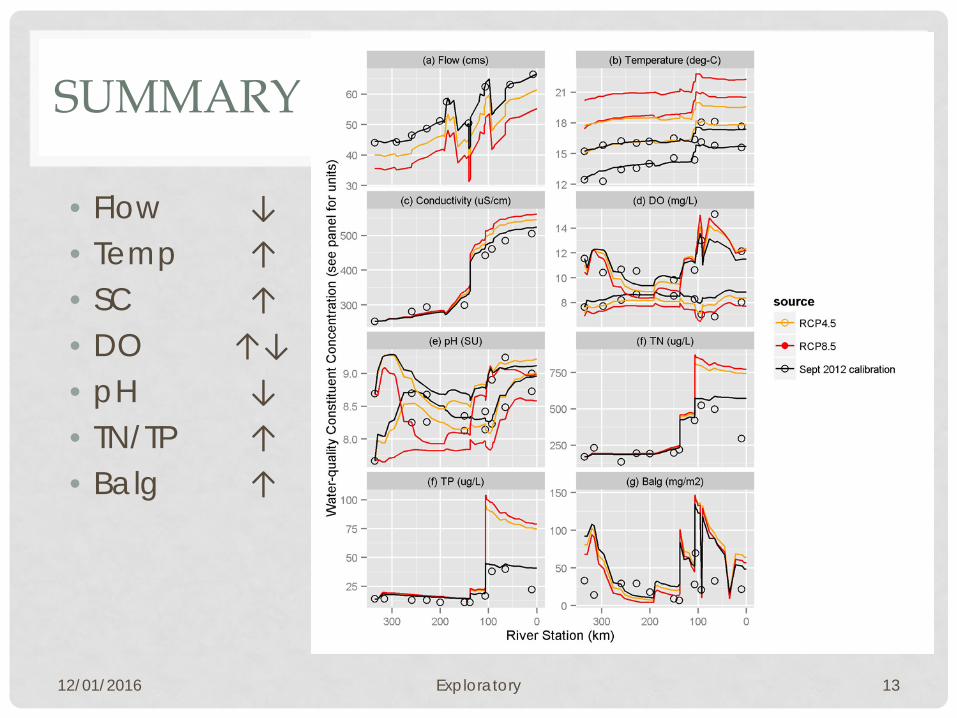
SUMMARY
12/01/2016 Exploratory 13
• Flow ↓ • Temp ↑ • SC ↑ • DO ↑↓ • pH ↓ • TN/TP ↑ • Balg ↑
DISCUSSION
• Water temperature expected to increase roughly proportionally to air temperature (thermal stress)
• Dilution greatly reduced as evidenced by concentration increases at Billings, MT
• Larger GPP cycles should occur • Benthic biomass stimulated when enriched
12/01/2016 Exploratory 14