Embed Size (px)
Citation preview
U.S. Fish and Wildlife Service
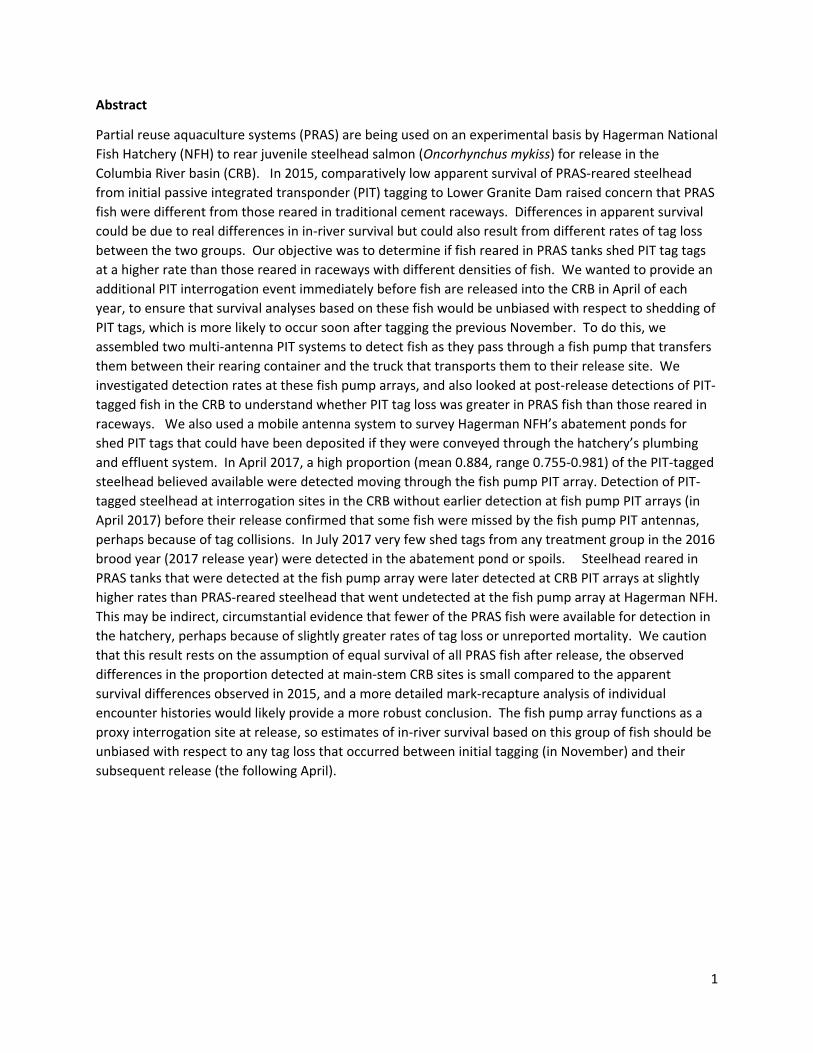
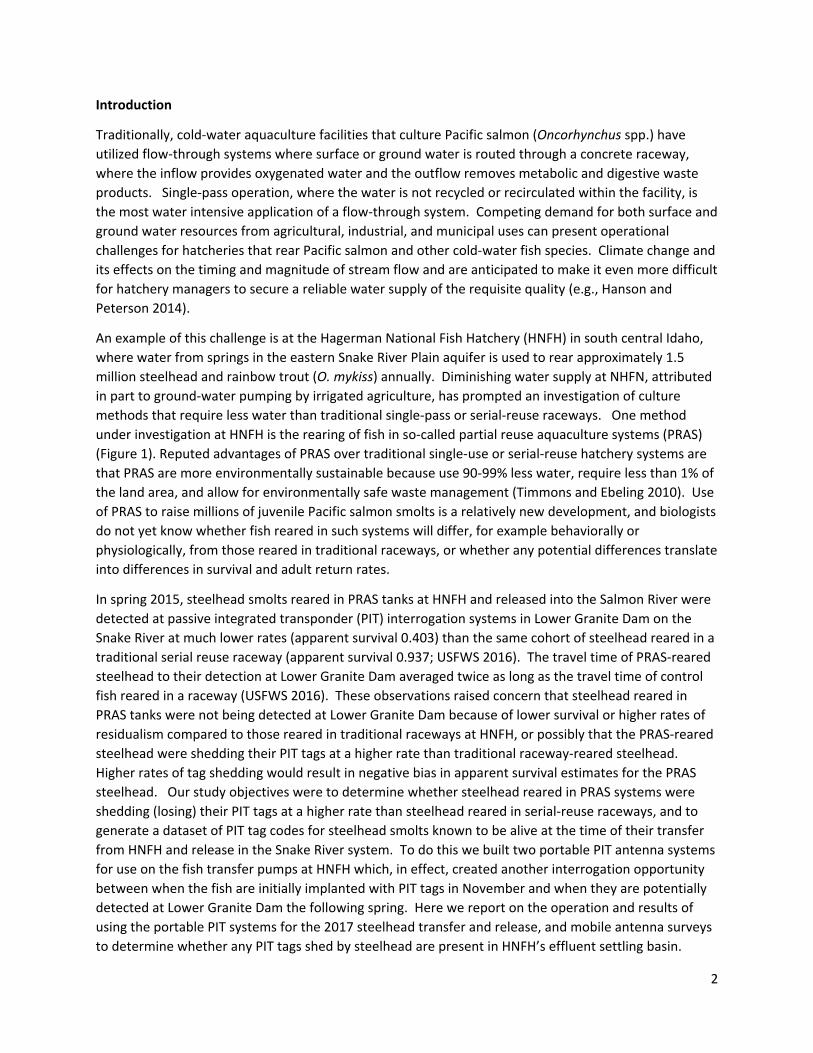
Evaluating comparative PIT tag loss of steelhead reared in partial reuse aquaculture systems (PRAS) or traditional raceways at Hagerman National Fish Hatchery Annual Report 2017
January 5, 2018 By Doug Peterson1 , Will Simpson2and Kurt Steinke
Abernathy Fish Technology Center 1440 Abernathy Creek Road Longview, Washington 98632
1Email address: [email protected] 2Current address: USFWS, Columbia River Fish and Wildlife Conserva on Office, 1211 SE Cardinal Court, Suite 100, Vancouver, WA 98683
Transferring steelhead from PRAS tank to transport truck Steelhead in suc on hose passing by PIT antenna
1
Abstract
Partial reuse aquaculture systems (PRAS) are being used on an experimental basis by Hagerman National
Fish Hatchery (NFH) to rear juvenile steelhead salmon (Oncorhynchus mykiss) for release in the
Columbia River basin (CRB). In 2015, comparatively low apparent survival of PRAS‐reared steelhead
from initial passive integrated transponder (PIT) tagging to Lower Granite Dam raised concern that PRAS
fish were different from those reared in traditional cement raceways. Differences in apparent survival
could be due to real differences in in‐river survival but could also result from different rates of tag loss
between the two groups. Our objective was to determine if fish reared in PRAS tanks shed PIT tag tags
at a higher rate than those reared in raceways with different densities of fish. We wanted to provide an
additional PIT interrogation event immediately before fish are released into the CRB in April of each
year, to ensure that survival analyses based on these fish would be unbiased with respect to shedding of
PIT tags, which is more likely to occur soon after tagging the previous November. To do this, we
assembled two multi‐antenna PIT systems to detect fish as they pass through a fish pump that transfers
them between their rearing container and the truck that transports them to their release site. We
investigated detection rates at these fish pump arrays, and also looked at post‐release detections of PIT‐
tagged fish in the CRB to understand whether PIT tag loss was greater in PRAS fish than those reared in
raceways. We also used a mobile antenna system to survey Hagerman NFH’s abatement ponds for
shed PIT tags that could have been deposited if they were conveyed through the hatchery’s plumbing
and effluent system. In April 2017, a high proportion (mean 0.884, range 0.755‐0.981) of the PIT‐tagged
steelhead believed available were detected moving through the fish pump PIT array. Detection of PIT‐
tagged steelhead at interrogation sites in the CRB without earlier detection at fish pump PIT arrays (in
April 2017) before their release confirmed that some fish were missed by the fish pump PIT antennas,
perhaps because of tag collisions. In July 2017 very few shed tags from any treatment group in the 2016
brood year (2017 release year) were detected in the abatement pond or spoils. Steelhead reared in
PRAS tanks that were detected at the fish pump array were later detected at CRB PIT arrays at slightly
higher rates than PRAS‐reared steelhead that went undetected at the fish pump array at Hagerman NFH.
This may be indirect, circumstantial evidence that fewer of the PRAS fish were available for detection in
the hatchery, perhaps because of slightly greater rates of tag loss or unreported mortality. We caution
that this result rests on the assumption of equal survival of all PRAS fish after release, the observed
differences in the proportion detected at main‐stem CRB sites is small compared to the apparent
survival differences observed in 2015, and a more detailed mark‐recapture analysis of individual
encounter histories would likely provide a more robust conclusion. The fish pump array functions as a
proxy interrogation site at release, so estimates of in‐river survival based on this group of fish should be
unbiased with respect to any tag loss that occurred between initial tagging (in November) and their
subsequent release (the following April).
2
Introduction
Traditionally, cold‐water aquaculture facilities that culture Pacific salmon (Oncorhynchus spp.) have
utilized flow‐through systems where surface or ground water is routed through a concrete raceway,
where the inflow provides oxygenated water and the outflow removes metabolic and digestive waste
products. Single‐pass operation, where the water is not recycled or recirculated within the facility, is
the most water intensive application of a flow‐through system. Competing demand for both surface and
ground water resources from agricultural, industrial, and municipal uses can present operational
challenges for hatcheries that rear Pacific salmon and other cold‐water fish species. Climate change and
its effects on the timing and magnitude of stream flow and are anticipated to make it even more difficult
for hatchery managers to secure a reliable water supply of the requisite quality (e.g., Hanson and
Peterson 2014).
An example of this challenge is at the Hagerman National Fish Hatchery (HNFH) in south central Idaho,
where water from springs in the eastern Snake River Plain aquifer is used to rear approximately 1.5
million steelhead and rainbow trout (O. mykiss) annually. Diminishing water supply at NHFN, attributed
in part to ground‐water pumping by irrigated agriculture, has prompted an investigation of culture
methods that require less water than traditional single‐pass or serial‐reuse raceways. One method
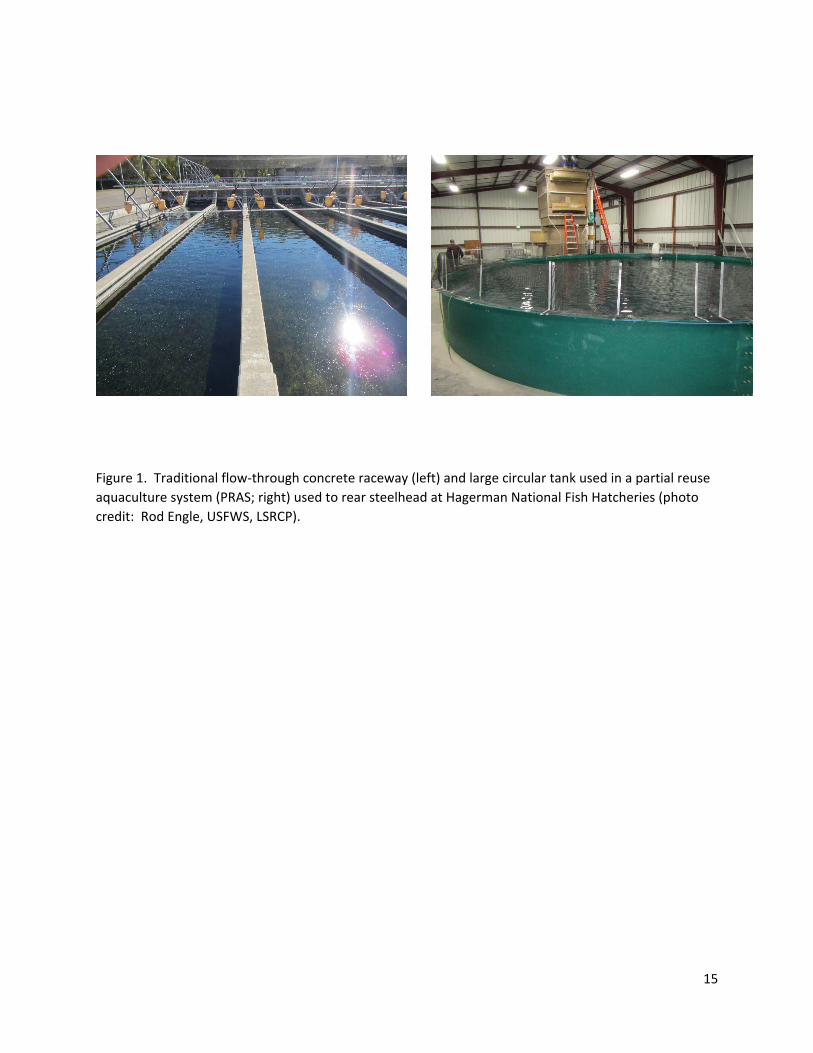
under investigation at HNFH is the rearing of fish in so‐called partial reuse aquaculture systems (PRAS)
(Figure 1). Reputed advantages of PRAS over traditional single‐use or serial‐reuse hatchery systems are
that PRAS are more environmentally sustainable because use 90‐99% less water, require less than 1% of
the land area, and allow for environmentally safe waste management (Timmons and Ebeling 2010). Use
of PRAS to raise millions of juvenile Pacific salmon smolts is a relatively new development, and biologists
do not yet know whether fish reared in such systems will differ, for example behaviorally or
physiologically, from those reared in traditional raceways, or whether any potential differences translate
into differences in survival and adult return rates.
In spring 2015, steelhead smolts reared in PRAS tanks at HNFH and released into the Salmon River were
detected at passive integrated transponder (PIT) interrogation systems in Lower Granite Dam on the
Snake River at much lower rates (apparent survival 0.403) than the same cohort of steelhead reared in a
traditional serial reuse raceway (apparent survival 0.937; USFWS 2016). The travel time of PRAS‐reared
steelhead to their detection at Lower Granite Dam averaged twice as long as the travel time of control
fish reared in a raceway (USFWS 2016). These observations raised concern that steelhead reared in
PRAS tanks were not being detected at Lower Granite Dam because of lower survival or higher rates of
residualism compared to those reared in traditional raceways at HNFH, or possibly that the PRAS‐reared
steelhead were shedding their PIT tags at a higher rate than traditional raceway‐reared steelhead.
Higher rates of tag shedding would result in negative bias in apparent survival estimates for the PRAS
steelhead. Our study objectives were to determine whether steelhead reared in PRAS systems were
shedding (losing) their PIT tags at a higher rate than steelhead reared in serial‐reuse raceways, and to
generate a dataset of PIT tag codes for steelhead smolts known to be alive at the time of their transfer
from HNFH and release in the Snake River system. To do this we built two portable PIT antenna systems
for use on the fish transfer pumps at HNFH which, in effect, created another interrogation opportunity
between when the fish are initially implanted with PIT tags in November and when they are potentially
detected at Lower Granite Dam the following spring. Here we report on the operation and results of
using the portable PIT systems for the 2017 steelhead transfer and release, and mobile antenna surveys
to determine whether any PIT tags shed by steelhead are present in HNFH’s effluent settling basin.
3
Materials and Methods
Portable PIT antenna systems
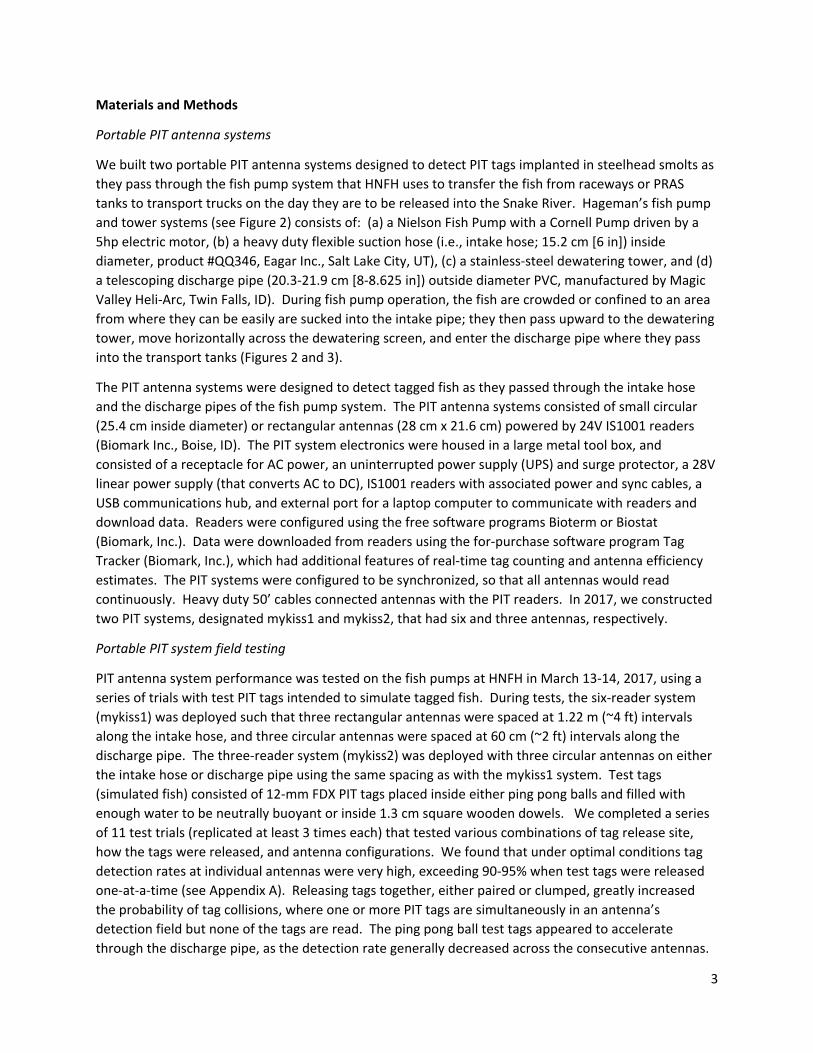
We built two portable PIT antenna systems designed to detect PIT tags implanted in steelhead smolts as
they pass through the fish pump system that HNFH uses to transfer the fish from raceways or PRAS
tanks to transport trucks on the day they are to be released into the Snake River. Hageman’s fish pump
and tower systems (see Figure 2) consists of: (a) a Nielson Fish Pump with a Cornell Pump driven by a
5hp electric motor, (b) a heavy duty flexible suction hose (i.e., intake hose; 15.2 cm [6 in]) inside
diameter, product #QQ346, Eagar Inc., Salt Lake City, UT), (c) a stainless‐steel dewatering tower, and (d)
a telescoping discharge pipe (20.3‐21.9 cm [8‐8.625 in]) outside diameter PVC, manufactured by Magic
Valley Heli‐Arc, Twin Falls, ID). During fish pump operation, the fish are crowded or confined to an area
from where they can be easily are sucked into the intake pipe; they then pass upward to the dewatering
tower, move horizontally across the dewatering screen, and enter the discharge pipe where they pass
into the transport tanks (Figures 2 and 3).
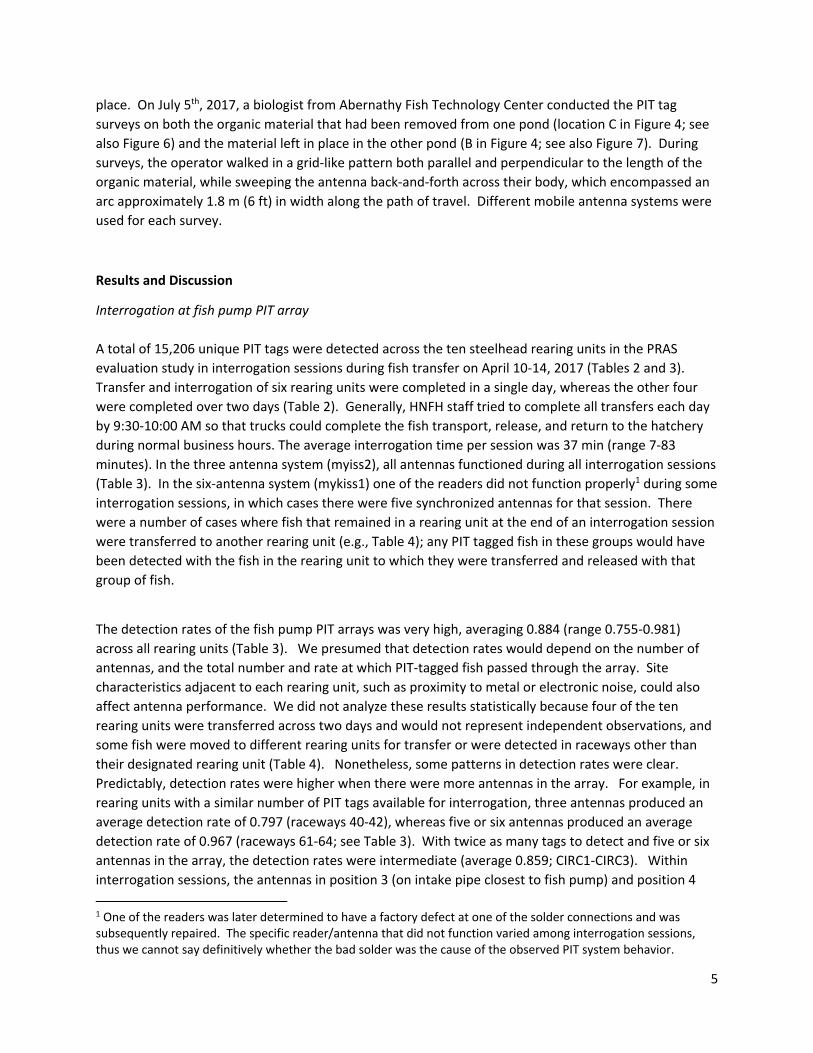
The PIT antenna systems were designed to detect tagged fish as they passed through the intake hose
and the discharge pipes of the fish pump system. The PIT antenna systems consisted of small circular
(25.4 cm inside diameter) or rectangular antennas (28 cm x 21.6 cm) powered by 24V IS1001 readers
(Biomark Inc., Boise, ID). The PIT system electronics were housed in a large metal tool box, and
consisted of a receptacle for AC power, an uninterrupted power supply (UPS) and surge protector, a 28V
linear power supply (that converts AC to DC), IS1001 readers with associated power and sync cables, a
USB communications hub, and external port for a laptop computer to communicate with readers and
download data. Readers were configured using the free software programs Bioterm or Biostat
(Biomark, Inc.). Data were downloaded from readers using the for‐purchase software program Tag
Tracker (Biomark, Inc.), which had additional features of real‐time tag counting and antenna efficiency
estimates. The PIT systems were configured to be synchronized, so that all antennas would read
continuously. Heavy duty 50’ cables connected antennas with the PIT readers. In 2017, we constructed
two PIT systems, designated mykiss1 and mykiss2, that had six and three antennas, respectively.
Portable PIT system field testing
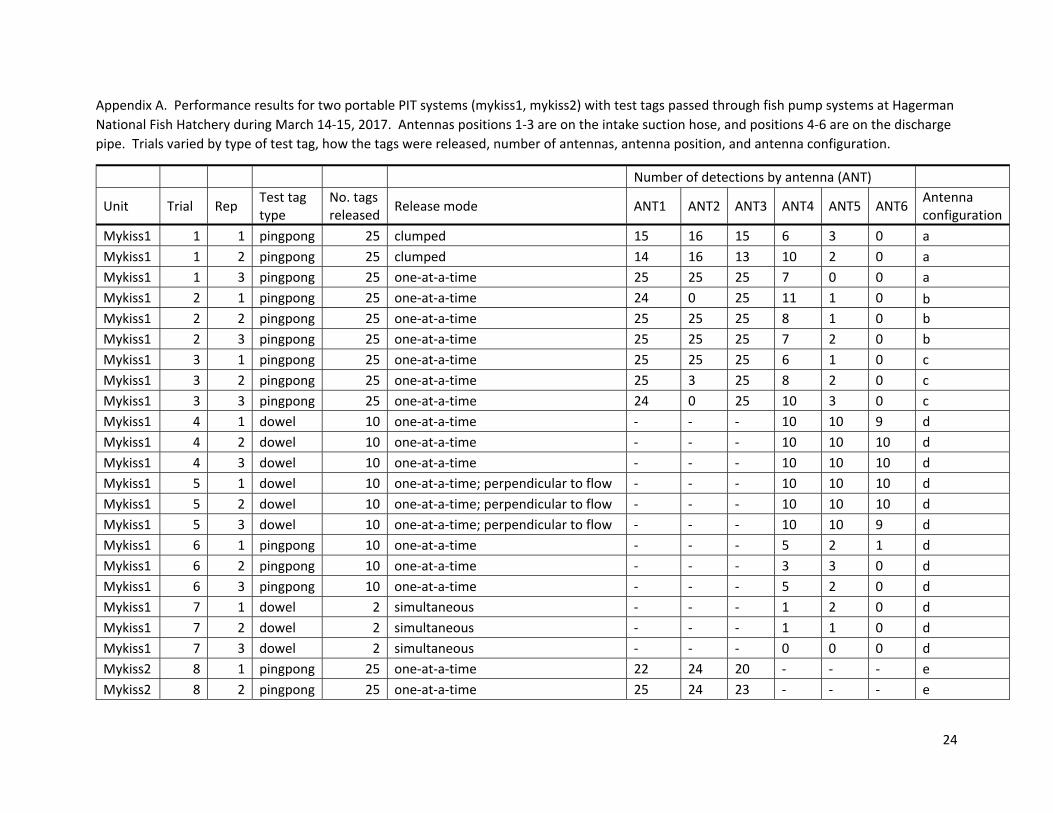
PIT antenna system performance was tested on the fish pumps at HNFH in March 13‐14, 2017, using a
series of trials with test PIT tags intended to simulate tagged fish. During tests, the six‐reader system
(mykiss1) was deployed such that three rectangular antennas were spaced at 1.22 m (~4 ft) intervals
along the intake hose, and three circular antennas were spaced at 60 cm (~2 ft) intervals along the
discharge pipe. The three‐reader system (mykiss2) was deployed with three circular antennas on either
the intake hose or discharge pipe using the same spacing as with the mykiss1 system. Test tags
(simulated fish) consisted of 12‐mm FDX PIT tags placed inside either ping pong balls and filled with
enough water to be neutrally buoyant or inside 1.3 cm square wooden dowels. We completed a series
of 11 test trials (replicated at least 3 times each) that tested various combinations of tag release site,
how the tags were released, and antenna configurations. We found that under optimal conditions tag
detection rates at individual antennas were very high, exceeding 90‐95% when test tags were released
one‐at‐a‐time (see Appendix A). Releasing tags together, either paired or clumped, greatly increased
the probability of tag collisions, where one or more PIT tags are simultaneously in an antenna’s
detection field but none of the tags are read. The ping pong ball test tags appeared to accelerate
through the discharge pipe, as the detection rate generally decreased across the consecutive antennas.

4
In summary, we determined that the PIT systems worked as we expected and concluded they should be
effective at interrogating live fish during transfer.
Interrogating steelhead smolts during fish transfer
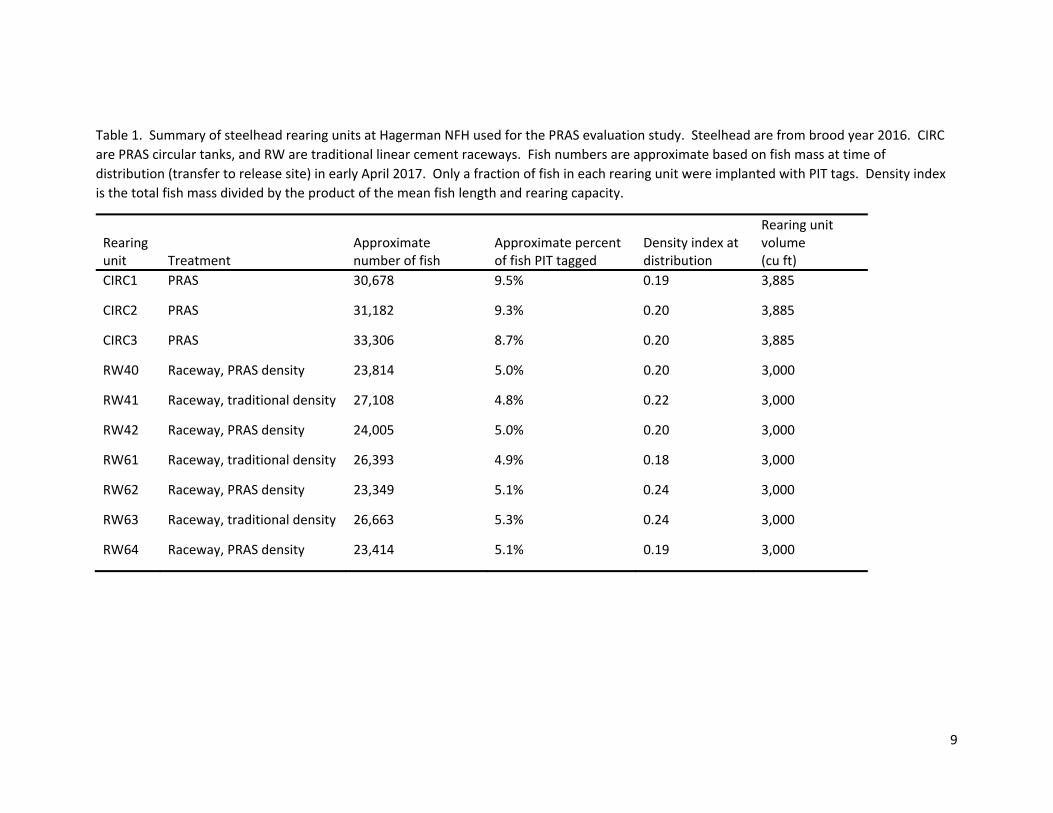
Steelhead involved in the PRAS evaluation study at HNFH were reared across ten units (Table 1). Each
rearing unit held at least 20,000 to more than 30,000 steelhead, but only about 5‐10% of the fish in a
given unit had been implanted with 12mm FDX PIT tags. Fish pumps used for the PRAS tanks were
almost always fitted with the six‐antenna system, while fish pumps used for the traditional hatchery
raceways were fitted with either the three‐ or six‐antenna PIT system. The six‐antenna system was
deployed so there were three rectangular antennas on intake suction hose (spaced 1.22 m apart) and
three circular antennas on the discharge pipe (spaced 0.61 m apart; see Figure 3). PIT system operation
was confirmed by test tags before fish were passed through the fish pump and tower system. Fish
transfers and interrogation sessions always occurred in the morning, because once fish were loaded into
transport tanks they needed to be driven immediately to the release site which was approximately 3 hr
away. During the interrogation sessions, one or two biologists monitored each PIT system and detection
data were exported (using Tag Tracker) and saved to disk.
Detection data were summarized by interrogation session (e.g., total number of unique tags) and by
individual antenna within each session to determine if detection rate varied by antenna position or if
overall detection rate varied by total number of antennas. Detection data were compared with the PIT
tag database generated at the time of initial tagging (in November 2016), and after accounting for any
mortalities of PIT‐tagged fish that occurred between November 2016 – April 2017, to determine how
many PIT tagged fish were unaccounted for at the time of transfer. The set of PIT tag codes that was
not accounted for in this calculation would represent fish that either shed their tags, were alive but not
detected at the fish pump PIT array because of tag collisions, or simply passed through the array
undetected.
Shed tag survey of effluent settling basin
To determine if PIT tags shed by steelhead are flushed through the effluent plumbing of HNFH, we
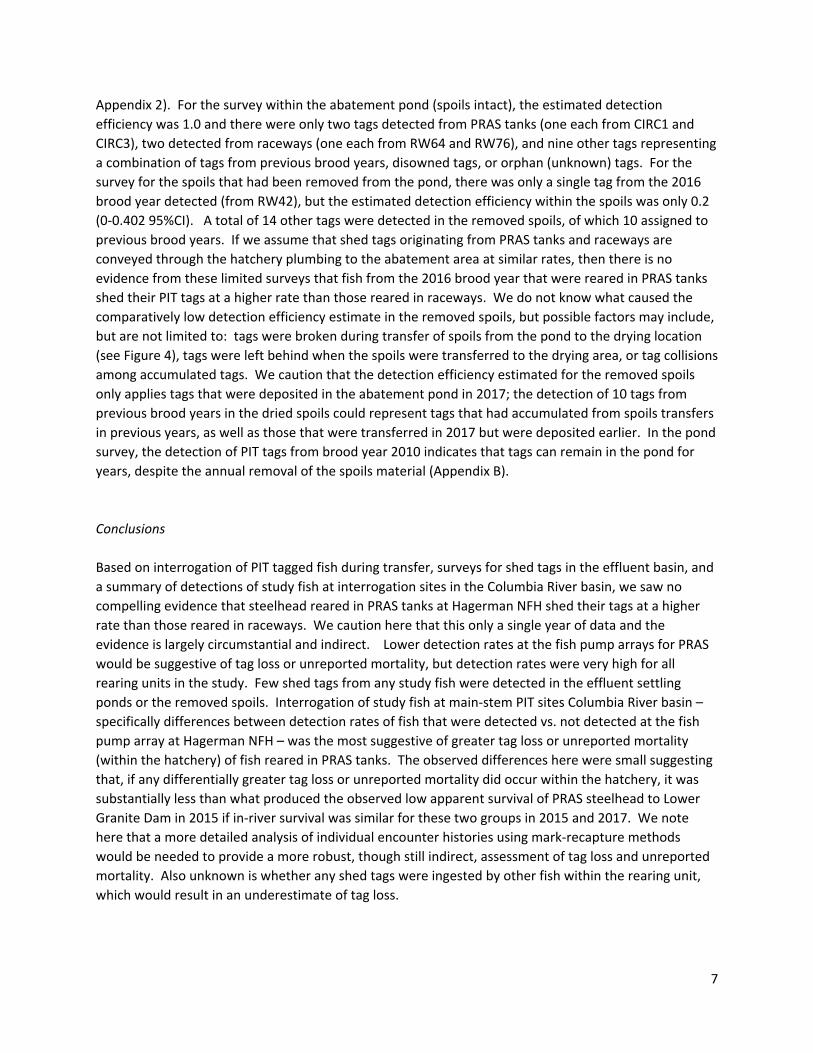
conducted mobile PIT antenna surveys of the hatchery’s two concrete‐lined abatement ponds, which
are settling basins for the solid waste from salmon rearing units (Figure 4). On June 14, 2017,
approximately three weeks before conducting the mobile antenna surveys, each pond was seeded
directly with 15 PIT tags of the same type (12 mm FDX) implanted into steelhead. These tags were
intended to serve as positive controls to determine detection rates of PIT tags present in the sediment
of the abatement pond. Surveys were conducted by a biologist using mobile PIT‐tag detection systems
(so‐called PITpacks, Hill et al. 2006). Each PITpack consisted of 24V IS1001 PIT tag reader (identical to
those used in the fish pump PIT arrays) powered by a lithium‐ion batteries and a hand‐held antenna
constructed of PVC and internal wire loops (Figure 5). A Windows‐based tablet running Bioterm or
Biostat served as a user interface for operating the reader and downloading PIT detection data.
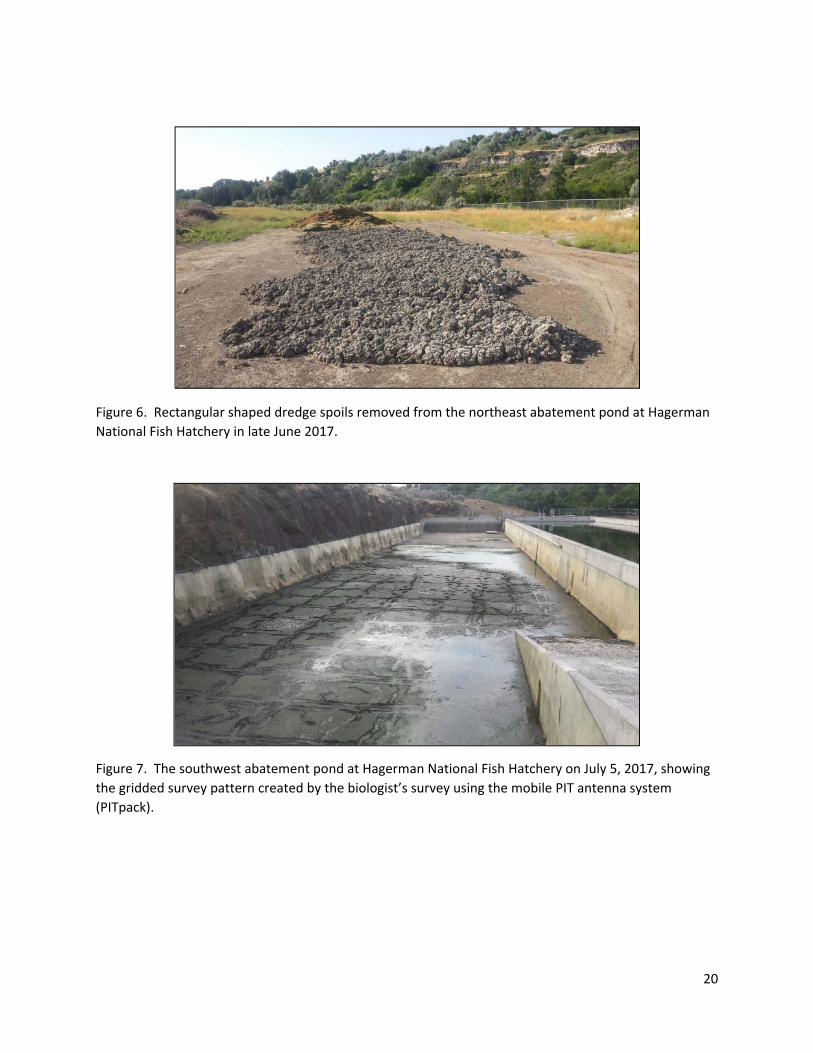
The northeast abatement pond (labeled A in Figure 4) was dewatered and partially dried in late June
2017. The organic material (spoils) at the bottom of this pond was removed with heavy equipment and
placed on the ground adjacent to the ponds (labeled C in Figure 4). Heavy equipment was used to
spread the material evenly into a rectangular shape in preparation for the PIT tag survey (Figure 6). The
southwest abatement pond (labeled B in Figure 4) was also drained, but the organic material was left in
5
place. On July 5th, 2017, a biologist from Abernathy Fish Technology Center conducted the PIT tag
surveys on both the organic material that had been removed from one pond (location C in Figure 4; see
also Figure 6) and the material left in place in the other pond (B in Figure 4; see also Figure 7). During
surveys, the operator walked in a grid‐like pattern both parallel and perpendicular to the length of the
organic material, while sweeping the antenna back‐and‐forth across their body, which encompassed an
arc approximately 1.8 m (6 ft) in width along the path of travel. Different mobile antenna systems were
used for each survey.
Results and Discussion
Interrogation at fish pump PIT array
A total of 15,206 unique PIT tags were detected across the ten steelhead rearing units in the PRAS
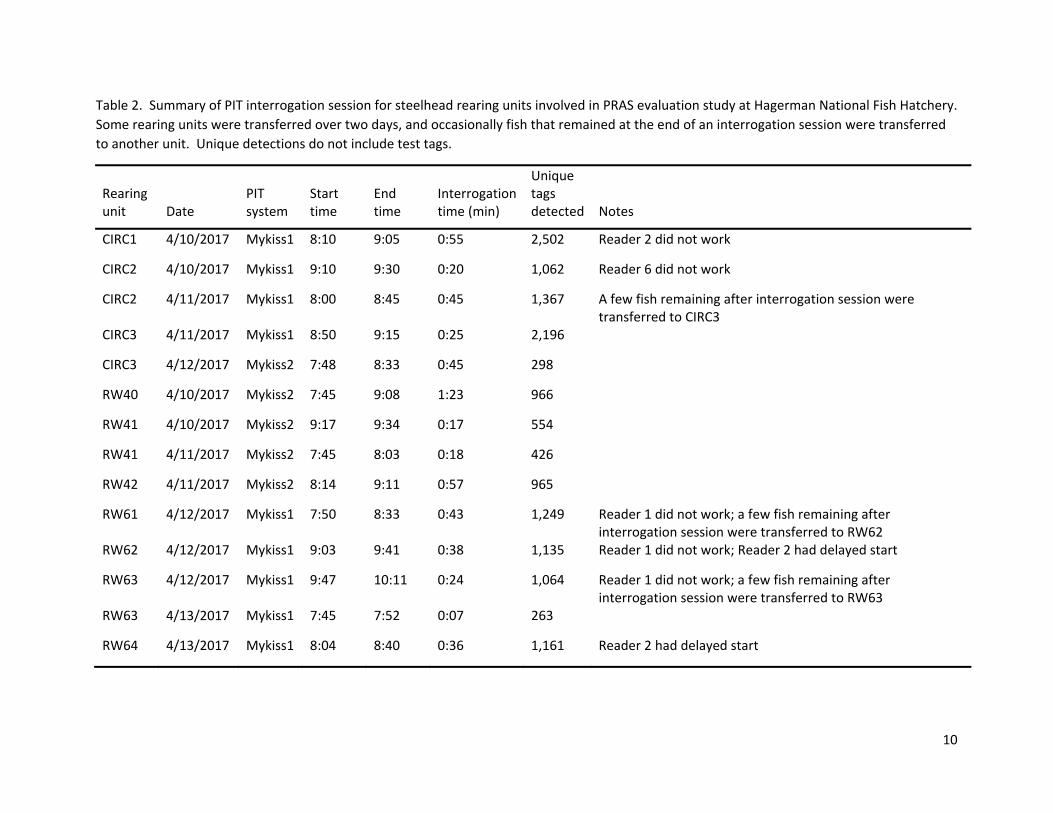
evaluation study in interrogation sessions during fish transfer on April 10‐14, 2017 (Tables 2 and 3).
Transfer and interrogation of six rearing units were completed in a single day, whereas the other four
were completed over two days (Table 2). Generally, HNFH staff tried to complete all transfers each day
by 9:30‐10:00 AM so that trucks could complete the fish transport, release, and return to the hatchery
during normal business hours. The average interrogation time per session was 37 min (range 7‐83
minutes). In the three antenna system (myiss2), all antennas functioned during all interrogation sessions
(Table 3). In the six‐antenna system (mykiss1) one of the readers did not function properly1 during some
interrogation sessions, in which cases there were five synchronized antennas for that session. There
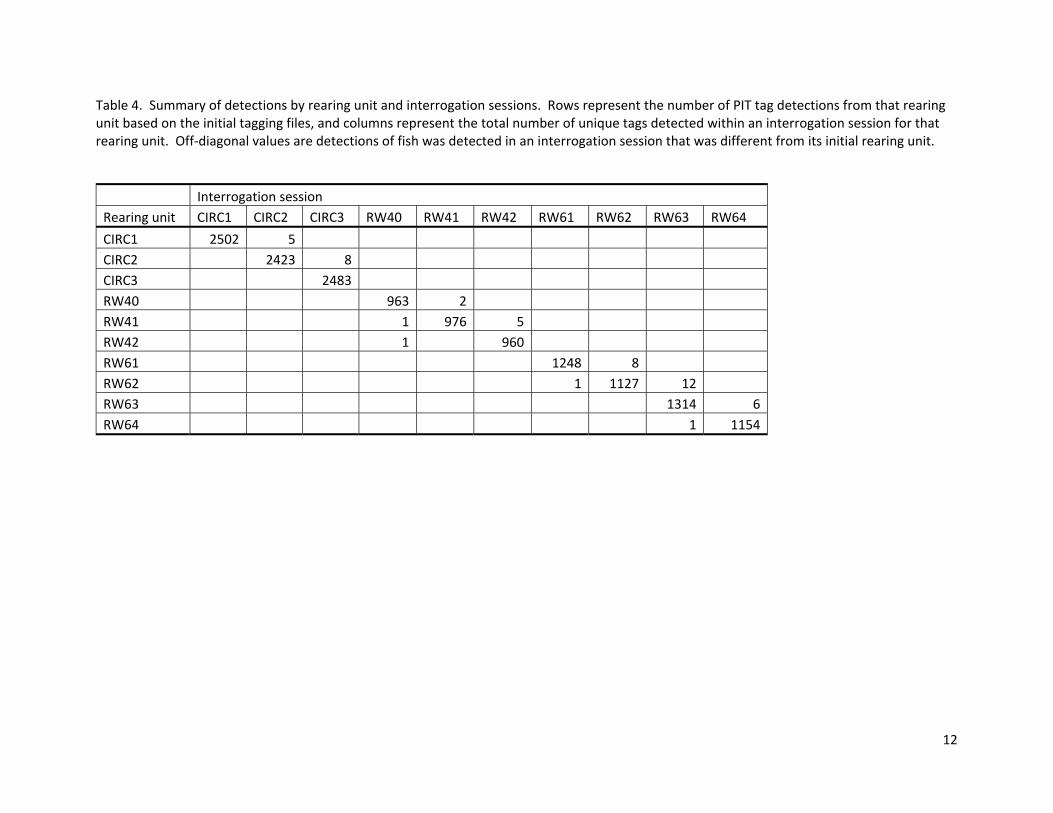
were a number of cases where fish that remained in a rearing unit at the end of an interrogation session
were transferred to another rearing unit (e.g., Table 4); any PIT tagged fish in these groups would have
been detected with the fish in the rearing unit to which they were transferred and released with that
group of fish.
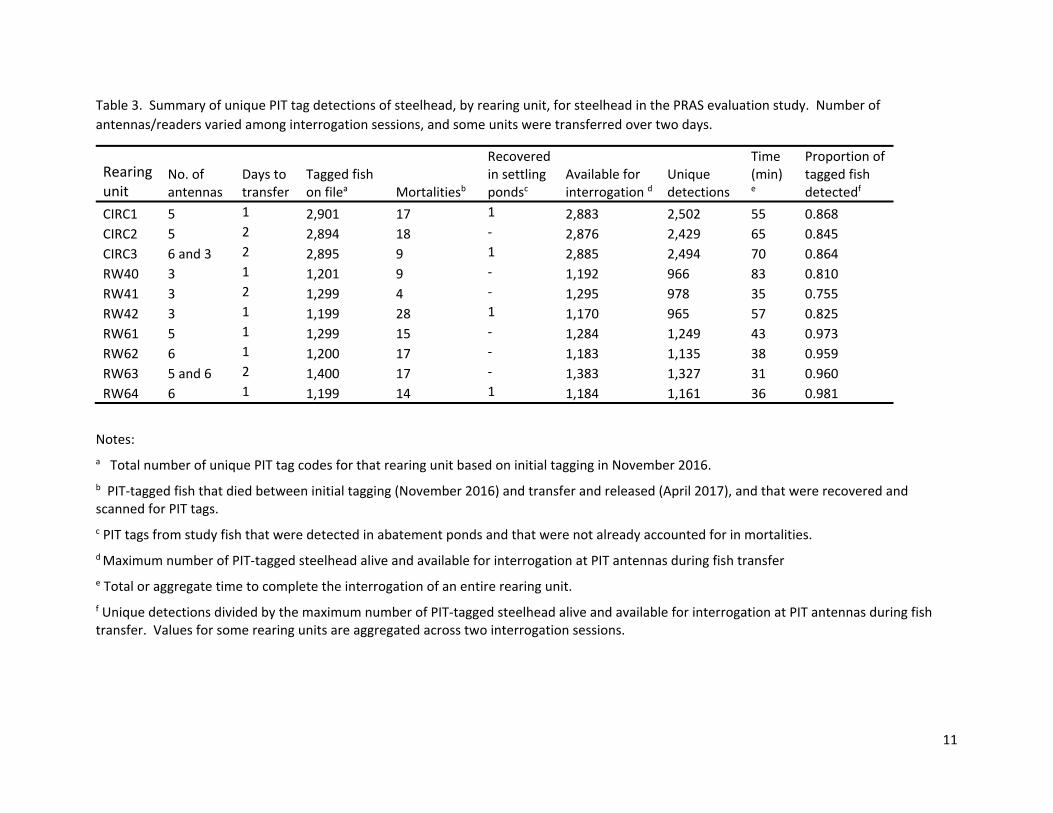
The detection rates of the fish pump PIT arrays was very high, averaging 0.884 (range 0.755‐0.981)
across all rearing units (Table 3). We presumed that detection rates would depend on the number of
antennas, and the total number and rate at which PIT‐tagged fish passed through the array. Site
characteristics adjacent to each rearing unit, such as proximity to metal or electronic noise, could also
affect antenna performance. We did not analyze these results statistically because four of the ten
rearing units were transferred across two days and would not represent independent observations, and
some fish were moved to different rearing units for transfer or were detected in raceways other than
their designated rearing unit (Table 4). Nonetheless, some patterns in detection rates were clear.
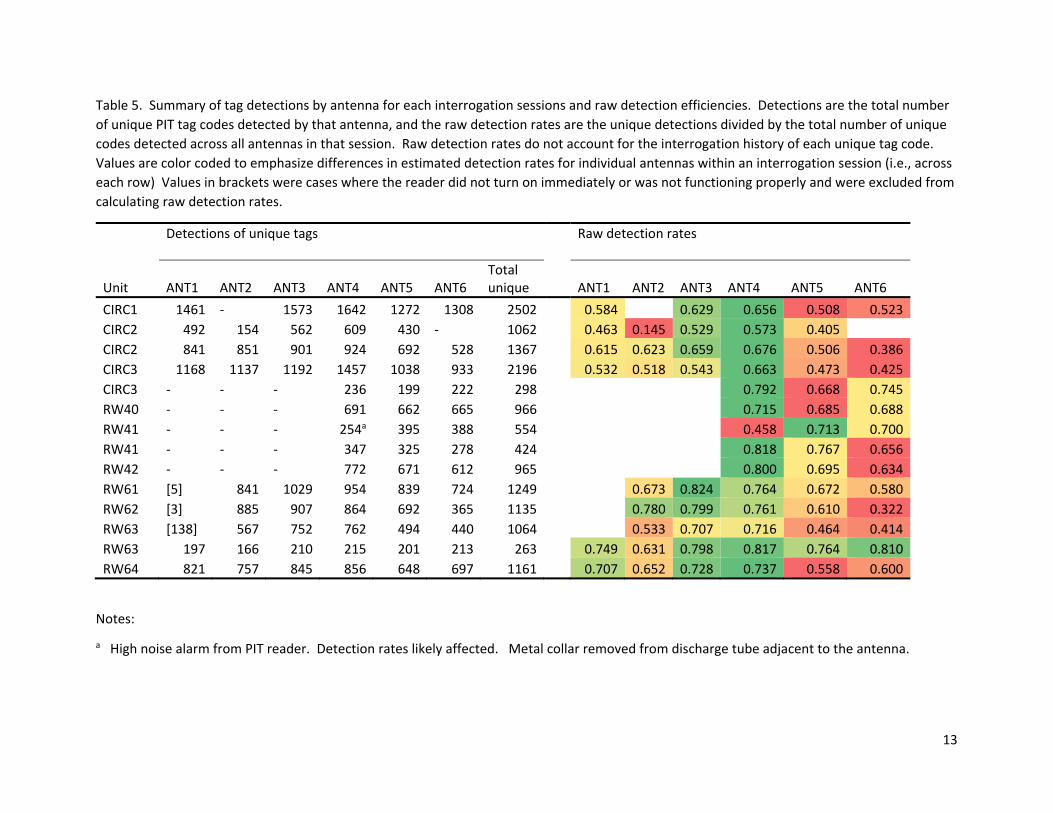
Predictably, detection rates were higher when there were more antennas in the array. For example, in
rearing units with a similar number of PIT tags available for interrogation, three antennas produced an
average detection rate of 0.797 (raceways 40‐42), whereas five or six antennas produced an average
detection rate of 0.967 (raceways 61‐64; see Table 3). With twice as many tags to detect and five or six
antennas in the array, the detection rates were intermediate (average 0.859; CIRC1‐CIRC3). Within
interrogation sessions, the antennas in position 3 (on intake pipe closest to fish pump) and position 4
1 One of the readers was later determined to have a factory defect at one of the solder connections and was subsequently repaired. The specific reader/antenna that did not function varied among interrogation sessions, thus we cannot say definitively whether the bad solder was the cause of the observed PIT system behavior.

6
(on discharge pipe closest to fish pump) almost always had the highest individual detection rates (Table
5).
Disposition of tagged fish not detected during interrogation sessions
Tagged fish presumed available for interrogation but not detected at the fish pump array could
represent fish not available for detection (e.g., shed tags, unreported mortalities) or those that were
available but simply not detected (e.g., tag collision, moving too fast). We did not have a way to directly
measure this, but to provide some initial insight on which factors might be important we queried PTAGIS
for how many of the fish from each rearing unit or treatment group that were not detected at the fish
pump array were subsequently detected at the juvenile PIT array at Lower Granite Dam or at any main‐
stem Columbia River basin (CRB) PIT array downstream from their release site. We assumed that at
release, all tagged fish in a rearing unit would survive to and be detected at similar rates at main‐stem
arrays, whether or not they were detected at the fish pump array. If the proportion of fish detected at
main‐stem arrays but not at the fish pump array was less than the proportion of fish detected at both,
then this would suggest that fewer tags were available for interrogation at the fish pump array (i.e., due
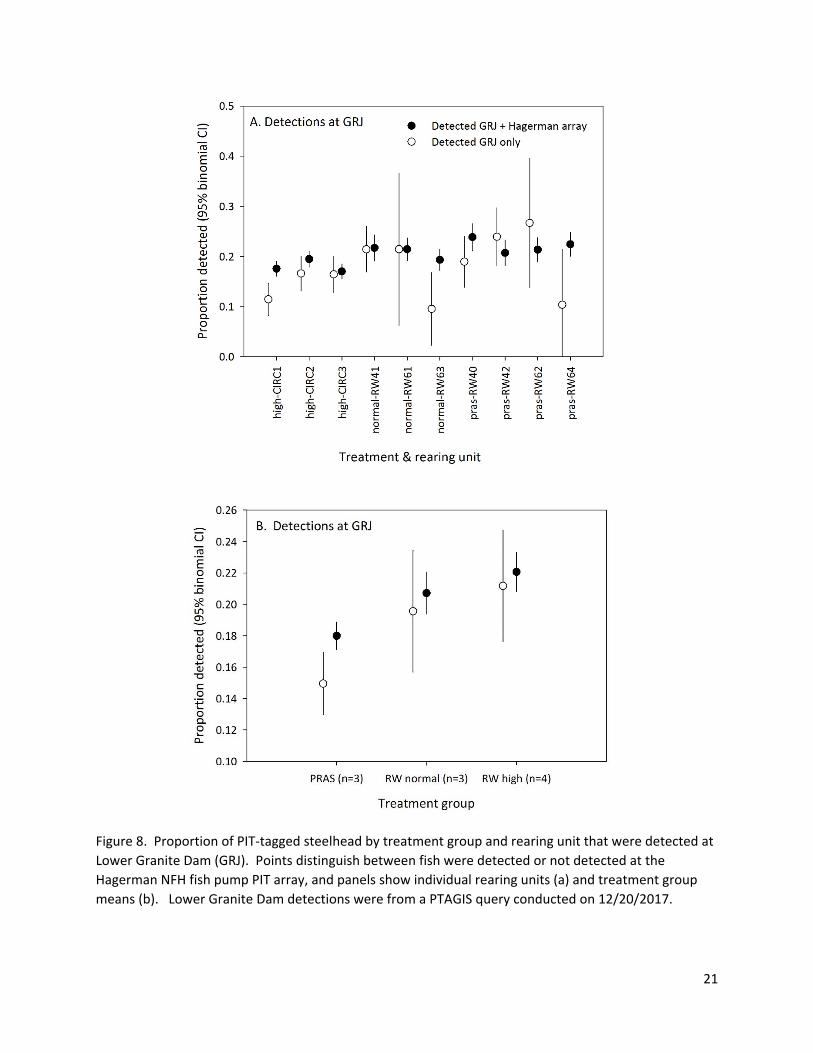
to tag loss and/or unreported mortality). The proportion of fish detected at the fish pump array that
were subsequently detected at Lower Granite Dam was slightly lower for the fish reared in the PRAS
tanks (mean 0.18) compared to those reared in raceways (mean 0.215), but only one other rearing unit
(RW40) was statistically different from all three PRAS tanks based on binomial confidence intervals
(Figure 8A). For two of three PRAS tanks, the proportion of fish either detected or not detected at the
fish pump array was statistically equivalent when treated individually (Figure 8A), but the group
averages were statistically different (Figure 8B). If the assumptions about equal survival and detection
rates are correct, then this suggests that for two of the PRAS tanks the non‐detections at the fish pump
array are mostly missed detections, and do not represent shed tags or unreported mortalities. The
group means are more suggestive of shed tags or unreported mortalities, but that difference appears to
be driven by one rearing unit (CIRC1; Figure 8).
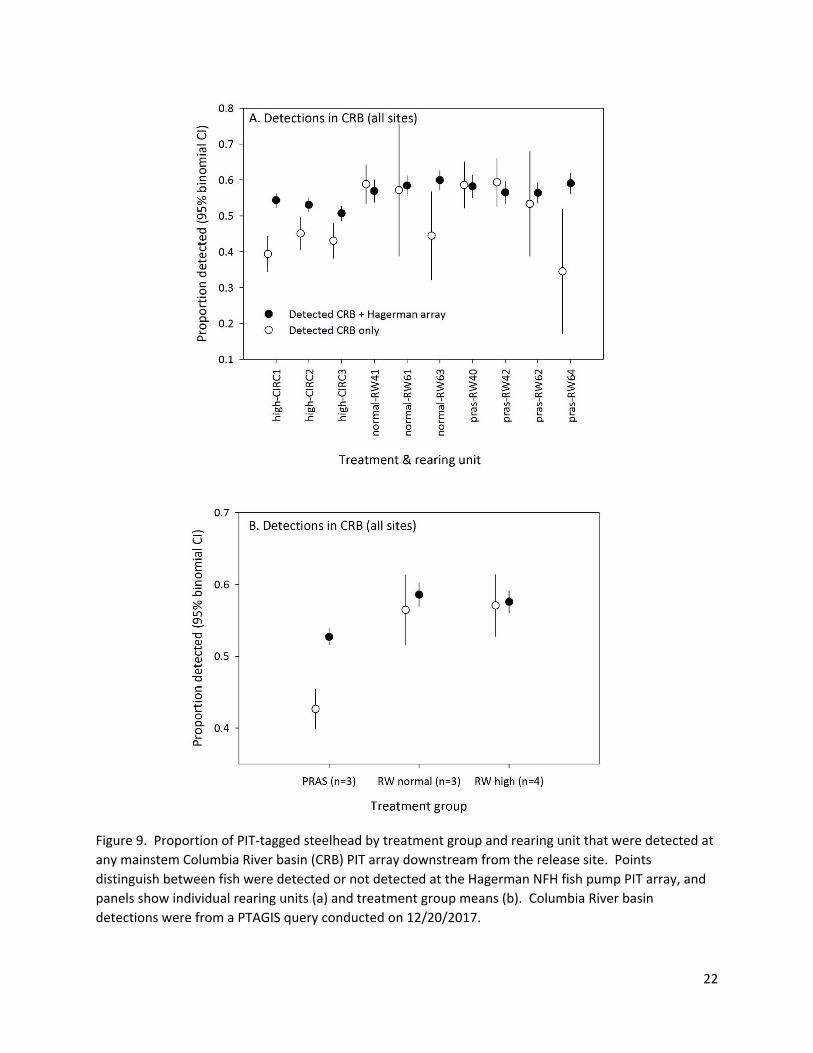
When detections at all CRB main‐stem sites are considered; the proportion detected again tended to be
lower for fish reared in PRAS relative to traditional raceways (Figure 9). Within the PRAS rearing units,
the proportion of fish either detected or not detected at the fish pump array were statistically different
for all three comparisons (Figure 9A) and for the group means (Figure 9B). These observations are more
suggestive of non‐detections at the fish pump array being influenced by unavailability (e.g., tag loss or
unreported mortalities). These detections must be interpreted cautiously, however, because the
assumption of equal survival and detection rates is more tenuous as aggregating detections from a
variety of sites could potentially introduce bias because of differences in detection rates among
interrogation sites. A more robust analysis that the simple summary reported here would involve
analyzing individual encounter histories using an appropriate capture‐recapture model (e.g., Cormack‐
Jolly‐Seber).
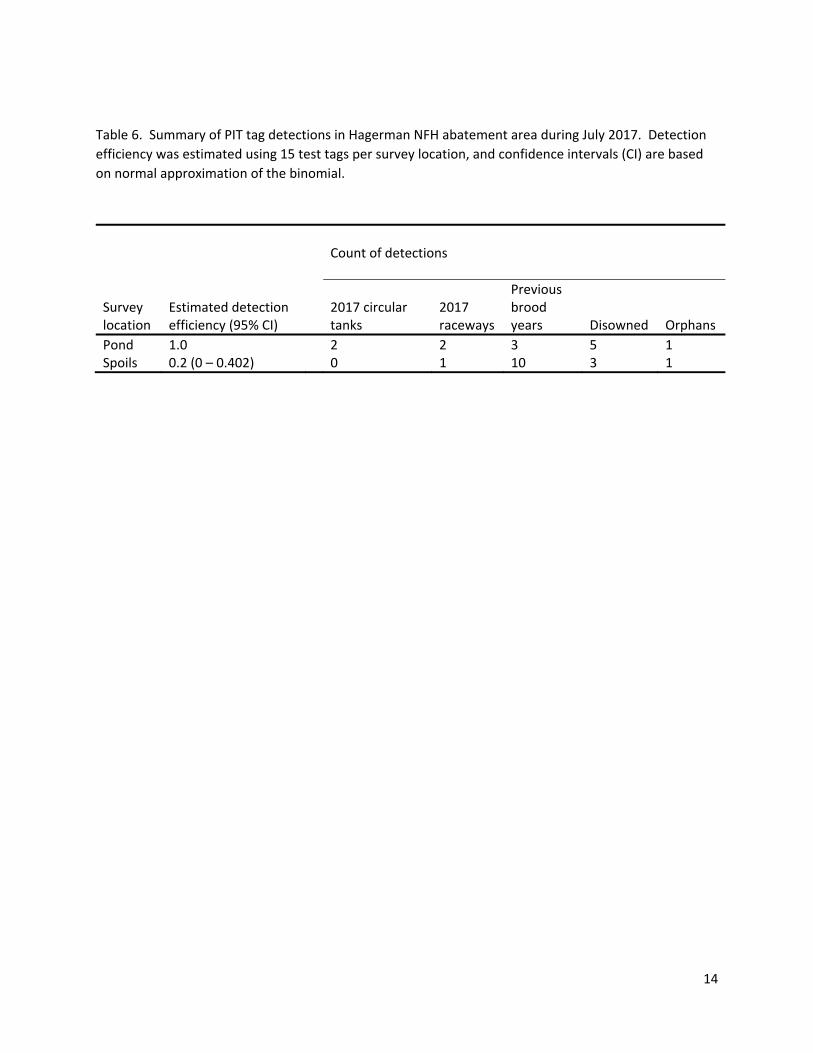
Shed tag surveys in effluent settling basins For the 2016 brood year (2017 release year), there were very few detections of shed tags in the
abatement area from steelhead reared in either circular (PRAS) tanks or traditional raceways (Table 6;
7
Appendix 2). For the survey within the abatement pond (spoils intact), the estimated detection
efficiency was 1.0 and there were only two tags detected from PRAS tanks (one each from CIRC1 and
CIRC3), two detected from raceways (one each from RW64 and RW76), and nine other tags representing
a combination of tags from previous brood years, disowned tags, or orphan (unknown) tags. For the
survey for the spoils that had been removed from the pond, there was only a single tag from the 2016
brood year detected (from RW42), but the estimated detection efficiency within the spoils was only 0.2
(0‐0.402 95%CI). A total of 14 other tags were detected in the removed spoils, of which 10 assigned to
previous brood years. If we assume that shed tags originating from PRAS tanks and raceways are
conveyed through the hatchery plumbing to the abatement area at similar rates, then there is no
evidence from these limited surveys that fish from the 2016 brood year that were reared in PRAS tanks
shed their PIT tags at a higher rate than those reared in raceways. We do not know what caused the
comparatively low detection efficiency estimate in the removed spoils, but possible factors may include,
but are not limited to: tags were broken during transfer of spoils from the pond to the drying location
(see Figure 4), tags were left behind when the spoils were transferred to the drying area, or tag collisions
among accumulated tags. We caution that the detection efficiency estimated for the removed spoils
only applies tags that were deposited in the abatement pond in 2017; the detection of 10 tags from
previous brood years in the dried spoils could represent tags that had accumulated from spoils transfers
in previous years, as well as those that were transferred in 2017 but were deposited earlier. In the pond
survey, the detection of PIT tags from brood year 2010 indicates that tags can remain in the pond for
years, despite the annual removal of the spoils material (Appendix B).
Conclusions
Based on interrogation of PIT tagged fish during transfer, surveys for shed tags in the effluent basin, and
a summary of detections of study fish at interrogation sites in the Columbia River basin, we saw no
compelling evidence that steelhead reared in PRAS tanks at Hagerman NFH shed their tags at a higher
rate than those reared in raceways. We caution here that this only a single year of data and the
evidence is largely circumstantial and indirect. Lower detection rates at the fish pump arrays for PRAS
would be suggestive of tag loss or unreported mortality, but detection rates were very high for all
rearing units in the study. Few shed tags from any study fish were detected in the effluent settling
ponds or the removed spoils. Interrogation of study fish at main‐stem PIT sites Columbia River basin –
specifically differences between detection rates of fish that were detected vs. not detected at the fish
pump array at Hagerman NFH – was the most suggestive of greater tag loss or unreported mortality
(within the hatchery) of fish reared in PRAS tanks. The observed differences here were small suggesting
that, if any differentially greater tag loss or unreported mortality did occur within the hatchery, it was
substantially less than what produced the observed low apparent survival of PRAS steelhead to Lower
Granite Dam in 2015 if in‐river survival was similar for these two groups in 2015 and 2017. We note
here that a more detailed analysis of individual encounter histories using mark‐recapture methods
would be needed to provide a more robust, though still indirect, assessment of tag loss and unreported
mortality. Also unknown is whether any shed tags were ingested by other fish within the rearing unit,
which would result in an underestimate of tag loss.
8
The high detection efficiency at the fish pump arrays, especially when six antennas were deployed,
renders the question of differential tag loss in PRAS fish somewhat irrelevant. The detections of fish at
the fish pump array serves, in effect, as the interrogation site at release, so estimates of in‐river survival
should be unbiased with respect to any tag loss that occurred in steelhead between their initial tagging
(in November) and their subsequent release (the following April). The two common‐sense suggestions
to maximize the number of detections are to use as many antennas as possible and to transfer the fish
as slowly as practicable to reduce tag collisions.
Acknowledgements
Funding was provided through the Lower Snake River Compensation Plan administered by Rod Engle
and Margaret Anderson. Anna Ray with the Hagerman NFH assisted with purchasing. We thank the
staff at Hagerman NFH for their logistical support in testing the PIT systems and during data collection,
and also thank Chris Griffith and Mike Murray from the Idaho Fish and Wildlife Conservation Office for
their help operating the systems. Christian Smith (Abernathy Fish Technology Center) provided helpful
comments on the draft report. The findings and conclusions in this article are those of the authors and
do not necessarily represent the views of the U.S. Fish and Wildlife Service.
References
Hanson, K. C. and D. P. Peterson. 2014. Modeling the potential impacts of climate change on Pacific salmon culture programs: an example at Winthrop National Fish Hatchery. Environmental Management 54:433‐448.
Hill, M. S., G. B. Zydlewski, J. D. Zydlewski, and J. M. Gasvoda. 2006. Development and evaluation of portable PIT tag detection units: PITpacks. Fisheries Research 77:102–109.
Timmons, MB. and J.M. Ebeling. 2010. Recirculating Aquaculture, 2nd edition. Cayuga Aqua Ventures, Ithaca, NY.
US Fish and Wildlife Service (USFWS). 2016. Evaluation of Steelhead Reared in a Reuse Aquaculture System at Hagerman NFH. Unpublished data report to Hagerman NFH Evaluation Team, dated 26 July 2016.
9
Table 1. Summary of steelhead rearing units at Hagerman NFH used for the PRAS evaluation study. Steelhead are from brood year 2016. CIRC
are PRAS circular tanks, and RW are traditional linear cement raceways. Fish numbers are approximate based on fish mass at time of
distribution (transfer to release site) in early April 2017. Only a fraction of fish in each rearing unit were implanted with PIT tags. Density index
is the total fish mass divided by the product of the mean fish length and rearing capacity.
Rearing unit Treatment
Approximate number of fish
Approximate percent of fish PIT tagged
Density index at distribution
Rearing unit volume (cu ft)
CIRC1 PRAS 30,678 9.5% 0.19 3,885
CIRC2 PRAS 31,182 9.3% 0.20 3,885
CIRC3 PRAS 33,306 8.7% 0.20 3,885
RW40 Raceway, PRAS density 23,814 5.0% 0.20 3,000
RW41 Raceway, traditional density 27,108 4.8% 0.22 3,000
RW42 Raceway, PRAS density 24,005 5.0% 0.20 3,000
RW61 Raceway, traditional density 26,393 4.9% 0.18 3,000
RW62 Raceway, PRAS density 23,349 5.1% 0.24 3,000
RW63 Raceway, traditional density 26,663 5.3% 0.24 3,000
RW64 Raceway, PRAS density 23,414 5.1% 0.19 3,000
10
Table 2. Summary of PIT interrogation session for steelhead rearing units involved in PRAS evaluation study at Hagerman National Fish Hatchery.
Some rearing units were transferred over two days, and occasionally fish that remained at the end of an interrogation session were transferred
to another unit. Unique detections do not include test tags.
Rearing unit Date
PIT system
Start time
End time
Interrogation time (min)
Unique tags detected Notes
CIRC1 4/10/2017 Mykiss1 8:10 9:05 0:55 2,502 Reader 2 did not work
CIRC2 4/10/2017 Mykiss1 9:10 9:30 0:20 1,062 Reader 6 did not work
CIRC2 4/11/2017 Mykiss1 8:00 8:45 0:45 1,367 A few fish remaining after interrogation session were transferred to CIRC3
CIRC3 4/11/2017 Mykiss1 8:50 9:15 0:25 2,196
CIRC3 4/12/2017 Mykiss2 7:48 8:33 0:45 298
RW40 4/10/2017 Mykiss2 7:45 9:08 1:23 966
RW41 4/10/2017 Mykiss2 9:17 9:34 0:17 554
RW41 4/11/2017 Mykiss2 7:45 8:03 0:18 426
RW42 4/11/2017 Mykiss2 8:14 9:11 0:57 965
RW61 4/12/2017 Mykiss1 7:50 8:33 0:43 1,249 Reader 1 did not work; a few fish remaining after interrogation session were transferred to RW62
RW62 4/12/2017 Mykiss1 9:03 9:41 0:38 1,135 Reader 1 did not work; Reader 2 had delayed start
RW63 4/12/2017 Mykiss1 9:47 10:11 0:24 1,064 Reader 1 did not work; a few fish remaining after interrogation session were transferred to RW63
RW63 4/13/2017 Mykiss1 7:45 7:52 0:07 263
RW64 4/13/2017 Mykiss1 8:04 8:40 0:36 1,161 Reader 2 had delayed start
11
Table 3. Summary of unique PIT tag detections of steelhead, by rearing unit, for steelhead in the PRAS evaluation study. Number of
antennas/readers varied among interrogation sessions, and some units were transferred over two days.
Rearing unit
No. of antennas
Days to transfer
Tagged fish on filea Mortalitiesb
Recovered in settling pondsc
Available for interrogation d
Unique detections
Time (min) e
Proportion of tagged fish detectedf
CIRC1 5 1 2,901 17 1 2,883 2,502 55 0.868
CIRC2 5 2 2,894 18 ‐ 2,876 2,429 65 0.845
CIRC3 6 and 3 2 2,895 9 1 2,885 2,494 70 0.864
RW40 3 1 1,201 9 ‐ 1,192 966 83 0.810
RW41 3 2 1,299 4 ‐ 1,295 978 35 0.755
RW42 3 1 1,199 28 1 1,170 965 57 0.825
RW61 5 1 1,299 15 ‐ 1,284 1,249 43 0.973
RW62 6 1 1,200 17 ‐ 1,183 1,135 38 0.959
RW63 5 and 6 2 1,400 17 ‐ 1,383 1,327 31 0.960
RW64 6 1 1,199 14 1 1,184 1,161 36 0.981
Notes:
a Total number of unique PIT tag codes for that rearing unit based on initial tagging in November 2016.
b PIT‐tagged fish that died between initial tagging (November 2016) and transfer and released (April 2017), and that were recovered and scanned for PIT tags.
c PIT tags from study fish that were detected in abatement ponds and that were not already accounted for in mortalities.
d Maximum number of PIT‐tagged steelhead alive and available for interrogation at PIT antennas during fish transfer
e Total or aggregate time to complete the interrogation of an entire rearing unit.
f Unique detections divided by the maximum number of PIT‐tagged steelhead alive and available for interrogation at PIT antennas during fish transfer. Values for some rearing units are aggregated across two interrogation sessions.
12
Table 4. Summary of detections by rearing unit and interrogation sessions. Rows represent the number of PIT tag detections from that rearing unit based on the initial tagging files, and columns represent the total number of unique tags detected within an interrogation session for that rearing unit. Off‐diagonal values are detections of fish was detected in an interrogation session that was different from its initial rearing unit.
Interrogation session
Rearing unit CIRC1 CIRC2 CIRC3 RW40 RW41 RW42 RW61 RW62 RW63 RW64
CIRC1 2502 5 CIRC2 2423 8 CIRC3 2483 RW40 963 2 RW41 1 976 5 RW42 1 960 RW61 1248 8 RW62 1 1127 12
RW63 1314 6
RW64 1 1154
13
Table 5. Summary of tag detections by antenna for each interrogation sessions and raw detection efficiencies. Detections are the total number
of unique PIT tag codes detected by that antenna, and the raw detection rates are the unique detections divided by the total number of unique
codes detected across all antennas in that session. Raw detection rates do not account for the interrogation history of each unique tag code.
Values are color coded to emphasize differences in estimated detection rates for individual antennas within an interrogation session (i.e., across
each row) Values in brackets were cases where the reader did not turn on immediately or was not functioning properly and were excluded from
calculating raw detection rates.
Detections of unique tags
Raw detection rates
Unit ANT1 ANT2 ANT3 ANT4 ANT5 ANT6 Total unique ANT1 ANT2 ANT3 ANT4 ANT5 ANT6
CIRC1 1461 ‐ 1573 1642 1272 1308 2502 0.584 0.629 0.656 0.508 0.523
CIRC2 492 154 562 609 430 ‐ 1062 0.463 0.145 0.529 0.573 0.405 CIRC2 841 851 901 924 692 528 1367 0.615 0.623 0.659 0.676 0.506 0.386
CIRC3 1168 1137 1192 1457 1038 933 2196 0.532 0.518 0.543 0.663 0.473 0.425
CIRC3 ‐ ‐ ‐ 236 199 222 298 0.792 0.668 0.745
RW40 ‐ ‐ ‐ 691 662 665 966 0.715 0.685 0.688
RW41 ‐ ‐ ‐ 254a 395 388 554 0.458 0.713 0.700
RW41 ‐ ‐ ‐ 347 325 278 424 0.818 0.767 0.656
RW42 ‐ ‐ ‐ 772 671 612 965 0.800 0.695 0.634
RW61 [5] 841 1029 954 839 724 1249 0.673 0.824 0.764 0.672 0.580
RW62 [3] 885 907 864 692 365 1135 0.780 0.799 0.761 0.610 0.322
RW63 [138] 567 752 762 494 440 1064 0.533 0.707 0.716 0.464 0.414
RW63 197 166 210 215 201 213 263 0.749 0.631 0.798 0.817 0.764 0.810
RW64 821 757 845 856 648 697 1161 0.707 0.652 0.728 0.737 0.558 0.600
Notes:
a High noise alarm from PIT reader. Detection rates likely affected. Metal collar removed from discharge tube adjacent to the antenna.
14
Table 6. Summary of PIT tag detections in Hagerman NFH abatement area during July 2017. Detection
efficiency was estimated using 15 test tags per survey location, and confidence intervals (CI) are based
on normal approximation of the binomial.
Count of detections
Survey location
Estimated detection efficiency (95% CI)
2017 circular tanks
2017 raceways
Previous brood years
Disowned
Orphans
Pond 1.0 2 2 3 5 1 Spoils 0.2 (0 – 0.402) 0 1 10 3 1
15
Figure 1. Traditional flow‐through concrete raceway (left) and large circular tank used in a partial reuse
aquaculture system (PRAS; right) used to rear steelhead at Hagerman National Fish Hatcheries (photo
credit: Rod Engle, USFWS, LSRCP).
16
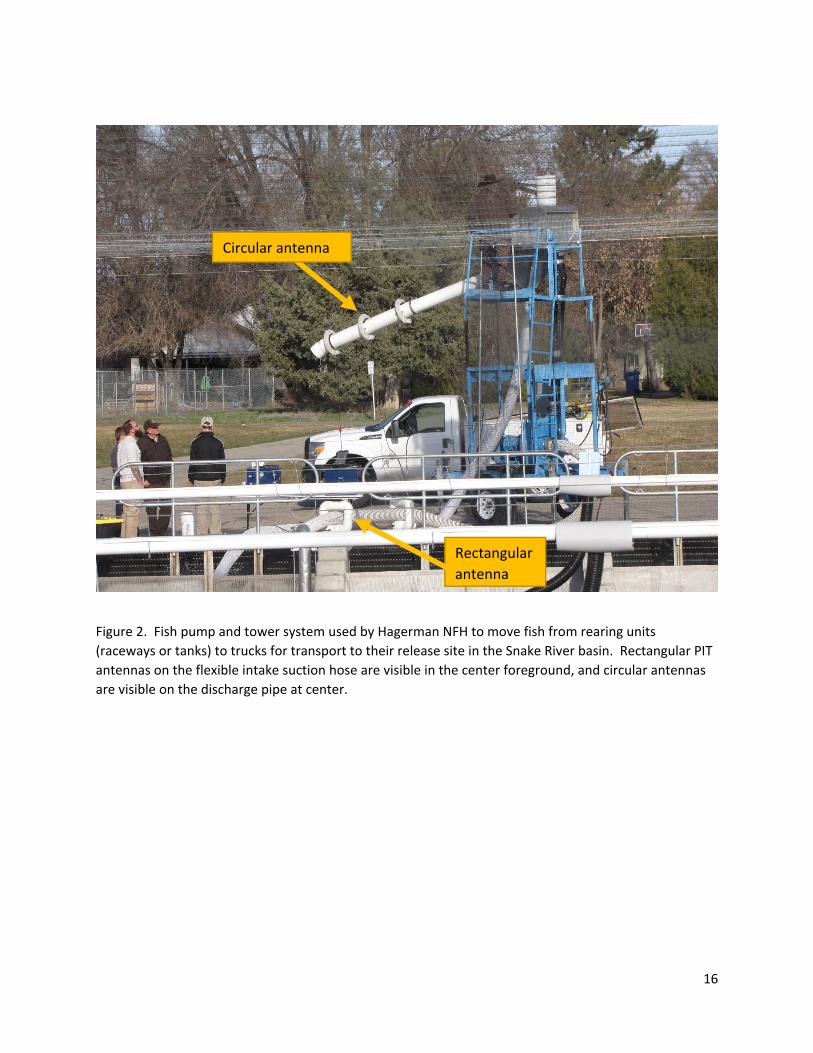
Figure 2. Fish pump and tower system used by Hagerman NFH to move fish from rearing units
(raceways or tanks) to trucks for transport to their release site in the Snake River basin. Rectangular PIT
antennas on the flexible intake suction hose are visible in the center foreground, and circular antennas
are visible on the discharge pipe at center.
Circular antenna
Rectangular
antenna
17
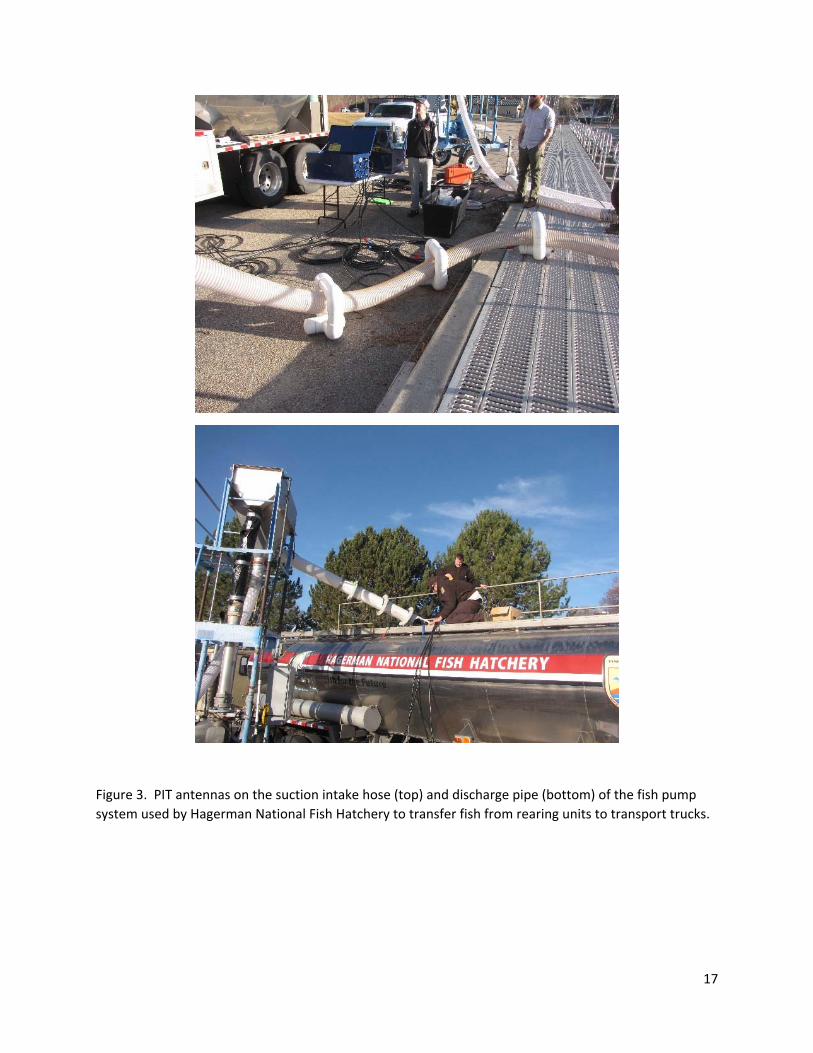
Figure 3. PIT antennas on the suction intake hose (top) and discharge pipe (bottom) of the fish pump
system used by Hagerman National Fish Hatchery to transfer fish from rearing units to transport trucks.
18
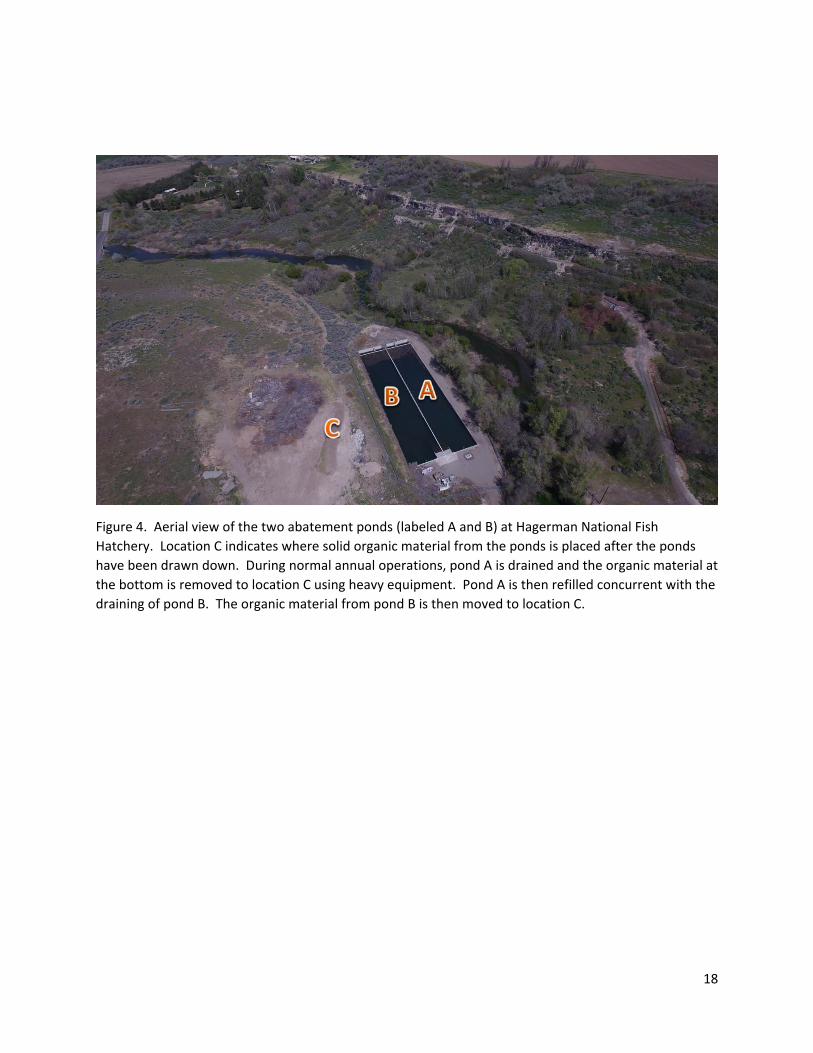
Figure 4. Aerial view of the two abatement ponds (labeled A and B) at Hagerman National Fish
Hatchery. Location C indicates where solid organic material from the ponds is placed after the ponds
have been drawn down. During normal annual operations, pond A is drained and the organic material at
the bottom is removed to location C using heavy equipment. Pond A is then refilled concurrent with the
draining of pond B. The organic material from pond B is then moved to location C.
19
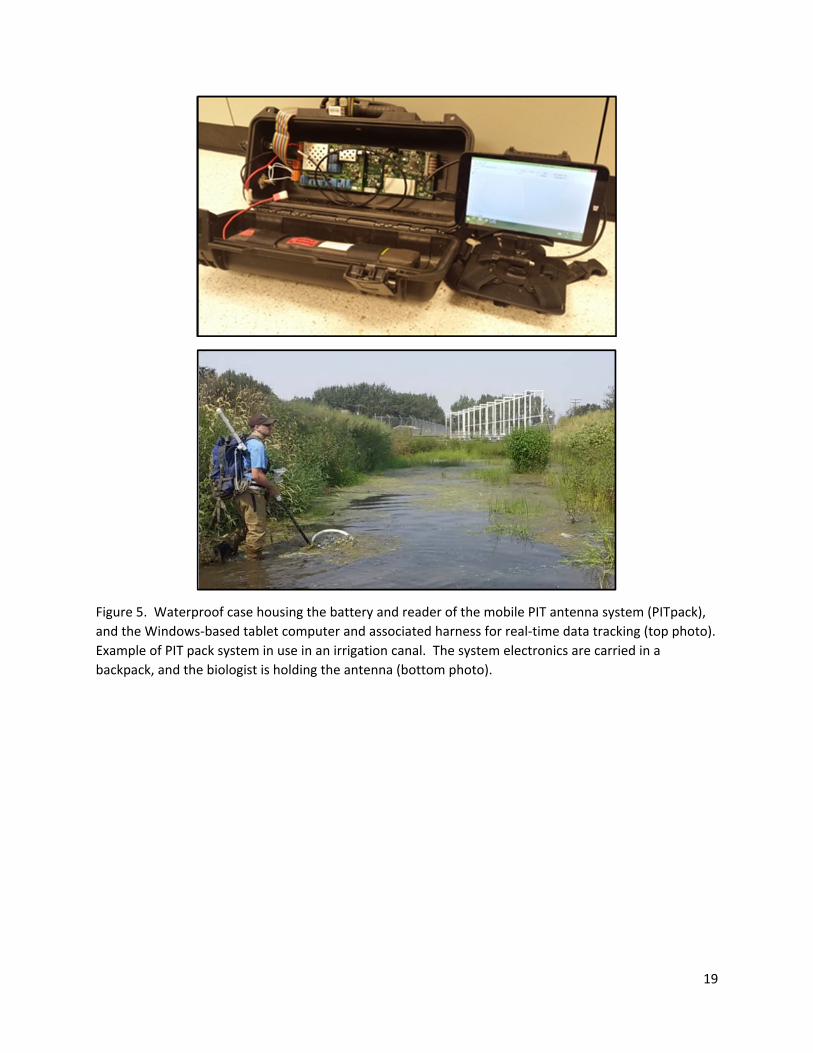
Figure 5. Waterproof case housing the battery and reader of the mobile PIT antenna system (PITpack),
and the Windows‐based tablet computer and associated harness for real‐time data tracking (top photo).
Example of PIT pack system in use in an irrigation canal. The system electronics are carried in a
backpack, and the biologist is holding the antenna (bottom photo).
20
Figure 6. Rectangular shaped dredge spoils removed from the northeast abatement pond at Hagerman
National Fish Hatchery in late June 2017.
Figure 7. The southwest abatement pond at Hagerman National Fish Hatchery on July 5, 2017, showing
the gridded survey pattern created by the biologist’s survey using the mobile PIT antenna system
(PITpack).
21
Figure 8. Proportion of PIT‐tagged steelhead by treatment group and rearing unit that were detected at
Lower Granite Dam (GRJ). Points distinguish between fish were detected or not detected at the
Hagerman NFH fish pump PIT array, and panels show individual rearing units (a) and treatment group
means (b). Lower Granite Dam detections were from a PTAGIS query conducted on 12/20/2017.
22
Figure 9. Proportion of PIT‐tagged steelhead by treatment group and rearing unit that were detected at
any mainstem Columbia River basin (CRB) PIT array downstream from the release site. Points
distinguish between fish were detected or not detected at the Hagerman NFH fish pump PIT array, and
panels show individual rearing units (a) and treatment group means (b). Columbia River basin
detections were from a PTAGIS query conducted on 12/20/2017.

23
Appendices
24
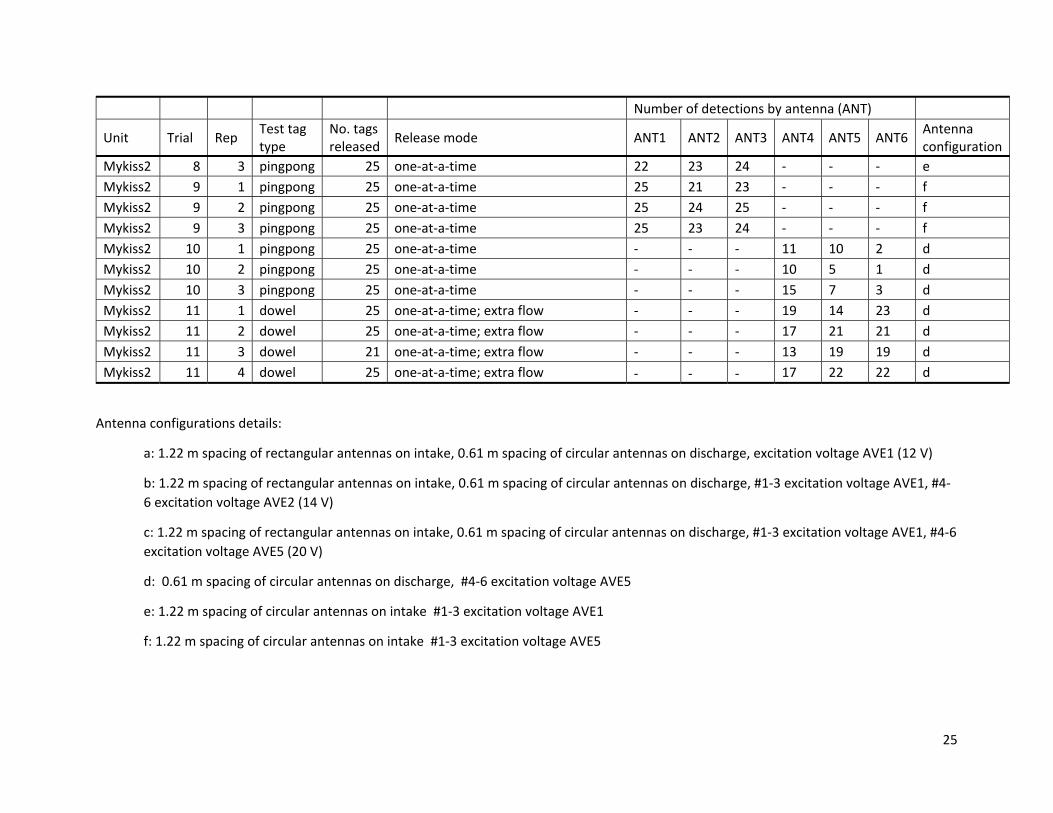
Appendix A. Performance results for two portable PIT systems (mykiss1, mykiss2) with test tags passed through fish pump systems at Hagerman
National Fish Hatchery during March 14‐15, 2017. Antennas positions 1‐3 are on the intake suction hose, and positions 4‐6 are on the discharge
pipe. Trials varied by type of test tag, how the tags were released, number of antennas, antenna position, and antenna configuration.
Number of detections by antenna (ANT)
Unit Trial Rep Test tag type
No. tags released
Release mode ANT1 ANT2 ANT3 ANT4 ANT5 ANT6 Antenna configuration
Mykiss1 1 1 pingpong 25 clumped 15 16 15 6 3 0 a
Mykiss1 1 2 pingpong 25 clumped 14 16 13 10 2 0 a
Mykiss1 1 3 pingpong 25 one‐at‐a‐time 25 25 25 7 0 0 a
Mykiss1 2 1 pingpong 25 one‐at‐a‐time 24 0 25 11 1 0 b
Mykiss1 2 2 pingpong 25 one‐at‐a‐time 25 25 25 8 1 0 b
Mykiss1 2 3 pingpong 25 one‐at‐a‐time 25 25 25 7 2 0 b
Mykiss1 3 1 pingpong 25 one‐at‐a‐time 25 25 25 6 1 0 c
Mykiss1 3 2 pingpong 25 one‐at‐a‐time 25 3 25 8 2 0 c
Mykiss1 3 3 pingpong 25 one‐at‐a‐time 24 0 25 10 3 0 c
Mykiss1 4 1 dowel 10 one‐at‐a‐time ‐ ‐ ‐ 10 10 9 d
Mykiss1 4 2 dowel 10 one‐at‐a‐time ‐ ‐ ‐ 10 10 10 d
Mykiss1 4 3 dowel 10 one‐at‐a‐time ‐ ‐ ‐ 10 10 10 d
Mykiss1 5 1 dowel 10 one‐at‐a‐time; perpendicular to flow ‐ ‐ ‐ 10 10 10 d
Mykiss1 5 2 dowel 10 one‐at‐a‐time; perpendicular to flow ‐ ‐ ‐ 10 10 10 d
Mykiss1 5 3 dowel 10 one‐at‐a‐time; perpendicular to flow ‐ ‐ ‐ 10 10 9 d
Mykiss1 6 1 pingpong 10 one‐at‐a‐time ‐ ‐ ‐ 5 2 1 d
Mykiss1 6 2 pingpong 10 one‐at‐a‐time ‐ ‐ ‐ 3 3 0 d
Mykiss1 6 3 pingpong 10 one‐at‐a‐time ‐ ‐ ‐ 5 2 0 d
Mykiss1 7 1 dowel 2 simultaneous ‐ ‐ ‐ 1 2 0 d
Mykiss1 7 2 dowel 2 simultaneous ‐ ‐ ‐ 1 1 0 d
Mykiss1 7 3 dowel 2 simultaneous ‐ ‐ ‐ 0 0 0 d
Mykiss2 8 1 pingpong 25 one‐at‐a‐time 22 24 20 ‐ ‐ ‐ e
Mykiss2 8 2 pingpong 25 one‐at‐a‐time 25 24 23 ‐ ‐ ‐ e
25
Number of detections by antenna (ANT)
Unit Trial Rep Test tag type
No. tags released
Release mode ANT1 ANT2 ANT3 ANT4 ANT5 ANT6 Antenna configuration
Mykiss2 8 3 pingpong 25 one‐at‐a‐time 22 23 24 ‐ ‐ ‐ e
Mykiss2 9 1 pingpong 25 one‐at‐a‐time 25 21 23 ‐ ‐ ‐ f
Mykiss2 9 2 pingpong 25 one‐at‐a‐time 25 24 25 ‐ ‐ ‐ f
Mykiss2 9 3 pingpong 25 one‐at‐a‐time 25 23 24 ‐ ‐ ‐ f
Mykiss2 10 1 pingpong 25 one‐at‐a‐time ‐ ‐ ‐ 11 10 2 d
Mykiss2 10 2 pingpong 25 one‐at‐a‐time ‐ ‐ ‐ 10 5 1 d
Mykiss2 10 3 pingpong 25 one‐at‐a‐time ‐ ‐ ‐ 15 7 3 d
Mykiss2 11 1 dowel 25 one‐at‐a‐time; extra flow ‐ ‐ ‐ 19 14 23 d
Mykiss2 11 2 dowel 25 one‐at‐a‐time; extra flow ‐ ‐ ‐ 17 21 21 d
Mykiss2 11 3 dowel 21 one‐at‐a‐time; extra flow ‐ ‐ ‐ 13 19 19 d
Mykiss2 11 4 dowel 25 one‐at‐a‐time; extra flow ‐ ‐ ‐ 17 22 22 d
Antenna configurations details:
a: 1.22 m spacing of rectangular antennas on intake, 0.61 m spacing of circular antennas on discharge, excitation voltage AVE1 (12 V)
b: 1.22 m spacing of rectangular antennas on intake, 0.61 m spacing of circular antennas on discharge, #1‐3 excitation voltage AVE1, #4‐
6 excitation voltage AVE2 (14 V)
c: 1.22 m spacing of rectangular antennas on intake, 0.61 m spacing of circular antennas on discharge, #1‐3 excitation voltage AVE1, #4‐6
excitation voltage AVE5 (20 V)
d: 0.61 m spacing of circular antennas on discharge, #4‐6 excitation voltage AVE5
e: 1.22 m spacing of circular antennas on intake #1‐3 excitation voltage AVE1
f: 1.22 m spacing of circular antennas on intake #1‐3 excitation voltage AVE5
26
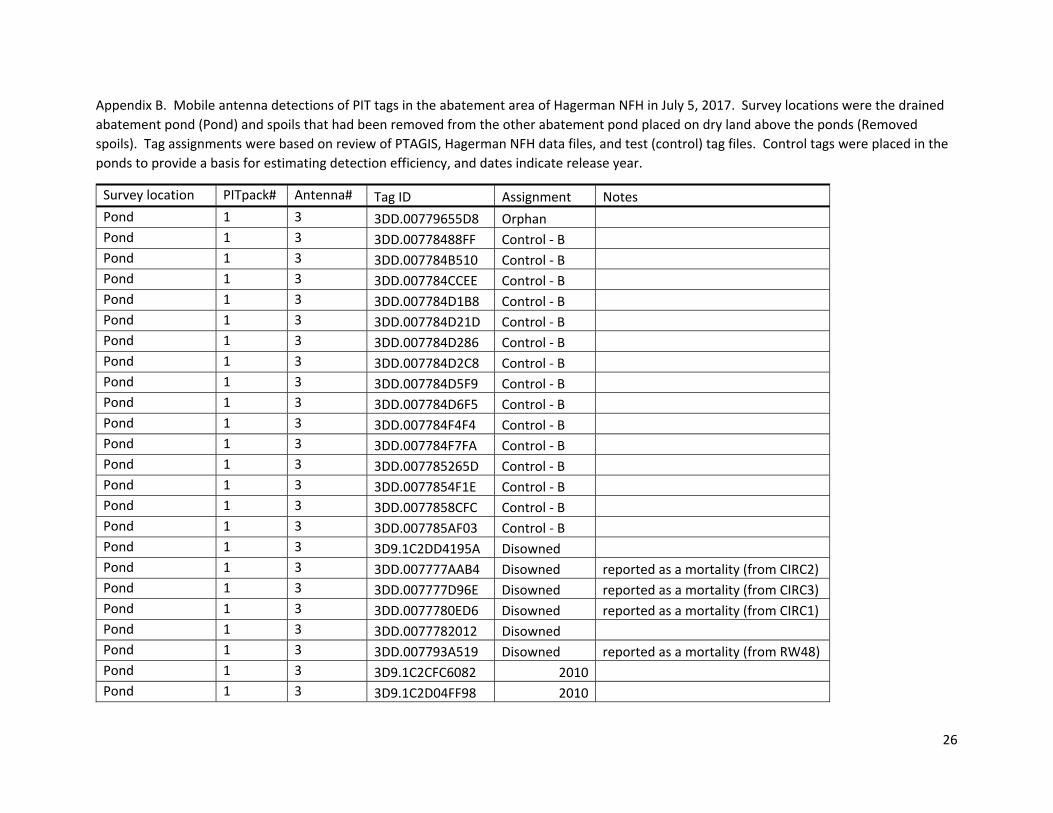
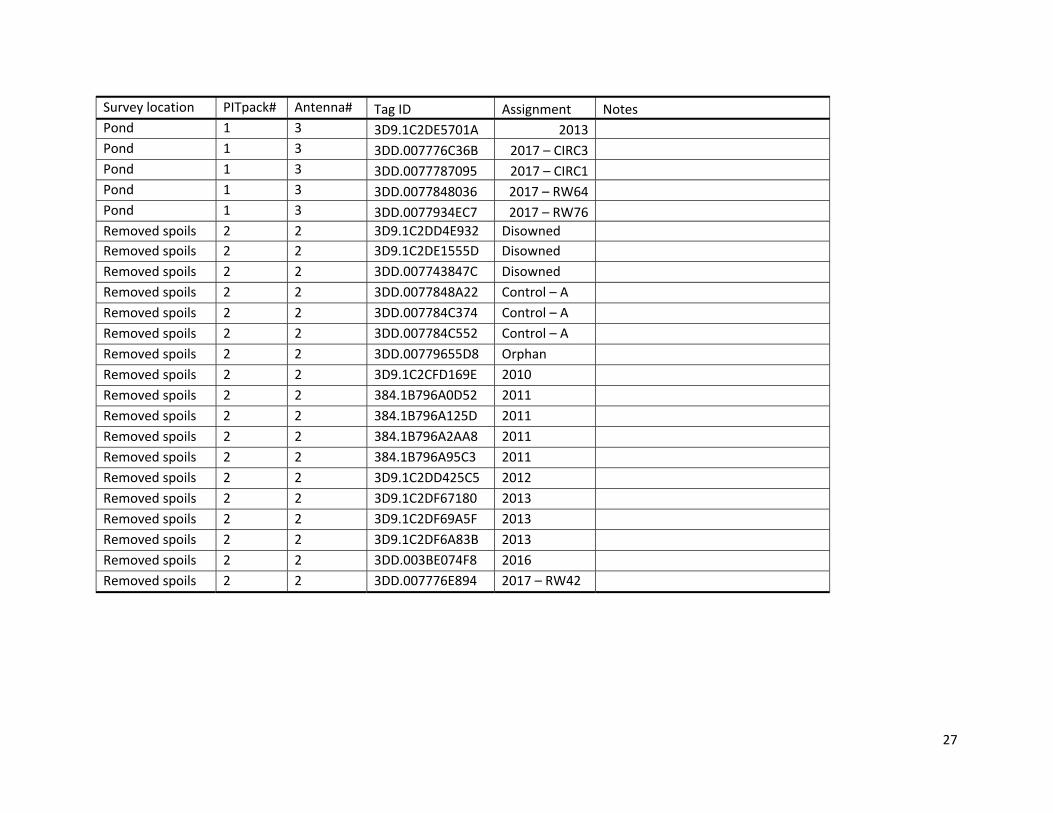
Appendix B. Mobile antenna detections of PIT tags in the abatement area of Hagerman NFH in July 5, 2017. Survey locations were the drained
abatement pond (Pond) and spoils that had been removed from the other abatement pond placed on dry land above the ponds (Removed
spoils). Tag assignments were based on review of PTAGIS, Hagerman NFH data files, and test (control) tag files. Control tags were placed in the
ponds to provide a basis for estimating detection efficiency, and dates indicate release year.
Survey location PITpack# Antenna# Tag ID Assignment Notes
Pond 1 3 3DD.00779655D8 Orphan Pond 1 3 3DD.00778488FF Control ‐ B Pond 1 3 3DD.007784B510 Control ‐ B Pond 1 3 3DD.007784CCEE Control ‐ B Pond 1 3 3DD.007784D1B8 Control ‐ B Pond 1 3 3DD.007784D21D Control ‐ B Pond 1 3 3DD.007784D286 Control ‐ B Pond 1 3 3DD.007784D2C8 Control ‐ B Pond 1 3 3DD.007784D5F9 Control ‐ B
Pond 1 3 3DD.007784D6F5 Control ‐ B
Pond 1 3 3DD.007784F4F4 Control ‐ B Pond 1 3 3DD.007784F7FA Control ‐ B Pond 1 3 3DD.007785265D Control ‐ B Pond 1 3 3DD.0077854F1E Control ‐ B Pond 1 3 3DD.0077858CFC Control ‐ B Pond 1 3 3DD.007785AF03 Control ‐ B Pond 1 3 3D9.1C2DD4195A Disowned Pond 1 3 3DD.007777AAB4 Disowned reported as a mortality (from CIRC2)
Pond 1 3 3DD.007777D96E Disowned reported as a mortality (from CIRC3)
Pond 1 3 3DD.0077780ED6 Disowned reported as a mortality (from CIRC1)
Pond 1 3 3DD.0077782012 Disowned Pond 1 3 3DD.007793A519 Disowned reported as a mortality (from RW48)
Pond 1 3 3D9.1C2CFC6082 2010 Pond 1 3 3D9.1C2D04FF98 2010
27
Survey location PITpack# Antenna# Tag ID Assignment Notes
Pond 1 3 3D9.1C2DE5701A 2013 Pond 1 3 3DD.007776C36B 2017 – CIRC3 Pond 1 3 3DD.0077787095 2017 – CIRC1 Pond 1 3 3DD.0077848036 2017 – RW64 Pond 1 3 3DD.0077934EC7 2017 – RW76 Removed spoils 2 2 3D9.1C2DD4E932 Disowned
Removed spoils 2 2 3D9.1C2DE1555D Disowned
Removed spoils 2 2 3DD.007743847C Disowned
Removed spoils 2 2 3DD.0077848A22 Control – A
Removed spoils 2 2 3DD.007784C374 Control – A
Removed spoils 2 2 3DD.007784C552 Control – A
Removed spoils 2 2 3DD.00779655D8 Orphan
Removed spoils 2 2 3D9.1C2CFD169E 2010
Removed spoils 2 2 384.1B796A0D52 2011
Removed spoils 2 2 384.1B796A125D 2011
Removed spoils 2 2 384.1B796A2AA8 2011
Removed spoils 2 2 384.1B796A95C3 2011
Removed spoils 2 2 3D9.1C2DD425C5 2012
Removed spoils 2 2 3D9.1C2DF67180 2013
Removed spoils 2 2 3D9.1C2DF69A5F 2013
Removed spoils 2 2 3D9.1C2DF6A83B 2013
Removed spoils 2 2 3DD.003BE074F8 2016
Removed spoils 2 2 3DD.007776E894 2017 – RW42

U.S. Fish & Wildlife Service Abernathy Fish Technology Center Longview, Washington, 98632 Phone:360-425-6072 https://www.fws.gov/aftc/