Embed Size (px)
Citation preview

BearWorks BearWorks
MSU Graduate Theses
Spring 2020
Evaluating Correlations between the PEAK Equivalence and Evaluating Correlations between the PEAK Equivalence and
Transformation Assessments with Intelligence Quotient Scores Transformation Assessments with Intelligence Quotient Scores
and the Relational Acquisition of Skills in Children with Autism and the Relational Acquisition of Skills in Children with Autism
Hannah L. Wallace Missouri State University, [email protected]
As with any intellectual project, the content and views expressed in this thesis may be
considered objectionable by some readers. However, this student-scholar’s work has been
judged to have academic value by the student’s thesis committee members trained in the
discipline. The content and views expressed in this thesis are those of the student-scholar and
are not endorsed by Missouri State University, its Graduate College, or its employees.
Follow this and additional works at: https://bearworks.missouristate.edu/theses
Part of the Applied Behavior Analysis Commons
Recommended Citation Recommended Citation Wallace, Hannah L., "Evaluating Correlations between the PEAK Equivalence and Transformation Assessments with Intelligence Quotient Scores and the Relational Acquisition of Skills in Children with Autism" (2020). MSU Graduate Theses. 3495. https://bearworks.missouristate.edu/theses/3495
This article or document was made available through BearWorks, the institutional repository of Missouri State University. The work contained in it may be protected by copyright and require permission of the copyright holder for reuse or redistribution. For more information, please contact [email protected].

EVALUATING CORRELATIONS BETWEEN THE PEAK EQUIVALENCE AND
TRANSFORMATION ASSESSMENTS WITH INTELLIGENCE QUOTIENT SCORES
AND THE RELATIONAL ACQUISITION OF SKILLS IN CHILDREN WITH AUTISM
A Master’s Thesis
Presented to
The Graduate College of
Missouri State University
TEMPLATE
In Partial Fulfillment
Of the Requirements for the Degree
Master of Science, Psychology
By
Hannah Lauren Wallace
May 2020

ii
EVALUATING CORRELATIONS BETWEEN THE PEAK EQUIVALENCE AND
TRANSFORMATION ASSESSMENTS WITH INTELLIGENCE QUOTIENT SCORES
AND THE RELATIONAL ACQUISITION OF SKILLS IN CHILDREN WITH AUTISM
Psychology
Missouri State University, May 2020
Master of Science
Hannah Lauren Wallace
ABSTRACT
The purpose of the present study was to evaluate correlations between PEAK Equivalence and
Transformation assessment scores to Intelligence Quotient (IQ) scores in children with autism.
An assessment called the Relational Acquisition of Skills in Children with autism (RASC) was
created as a pilot test. This method was used to test relational responding in young children with
autism. The scores of this assessment were correlated with scores obtained using PEAK
Equivalence and Transformation assessments and IQ. It was found that PEAK Equivalence and
Transformation assessments had a strong positive correlation with IQ. No significant relationship
between the Relational Acquisition of Skills in Children with autism and the PEAK Equivalence
and Transformation assessments or IQ was found.
KEYWORDS: autism, derived relational responding, match to sample, PEAK, RASC, stimulus
pairing observation procedure
iii
EVALUATING CORRELATIONS BETWEEN THE PEAK EQUIVALENCE AND
TRANSFORMATION ASSESSMENTS WITH INTELLIGENCE QUOTIENT SCORES
AND THE RELATIONAL ACQUISITION OF SKILLS IN CHILDREN WITH AUTISM
By
Hannah Lauren Wallace
A Master’s Thesis
Submitted to the Graduate College
Of Missouri State University
In Partial Fulfillment of the Requirements
For the Degree of Master of Science, Psychology
May 2020
Approved:
Jordan Belisle, Ph.D., Thesis Committee Chair
Dana Paliliunas, Ph.D., Committee Member
Wayne Mitchell, Ph.D., Committee Member
Julie Masterson, Ph.D., Dean of the Graduate College
In the interest of academic freedom and the principle of free speech, approval of this thesis
indicates the format is acceptable and meets the academic criteria for the discipline as
determined by the faculty that constitute the thesis committee. The content and views expressed
in this thesis are those of the student-scholar and are not endorsed by Missouri State University,
its Graduate College, or its employees.
iv
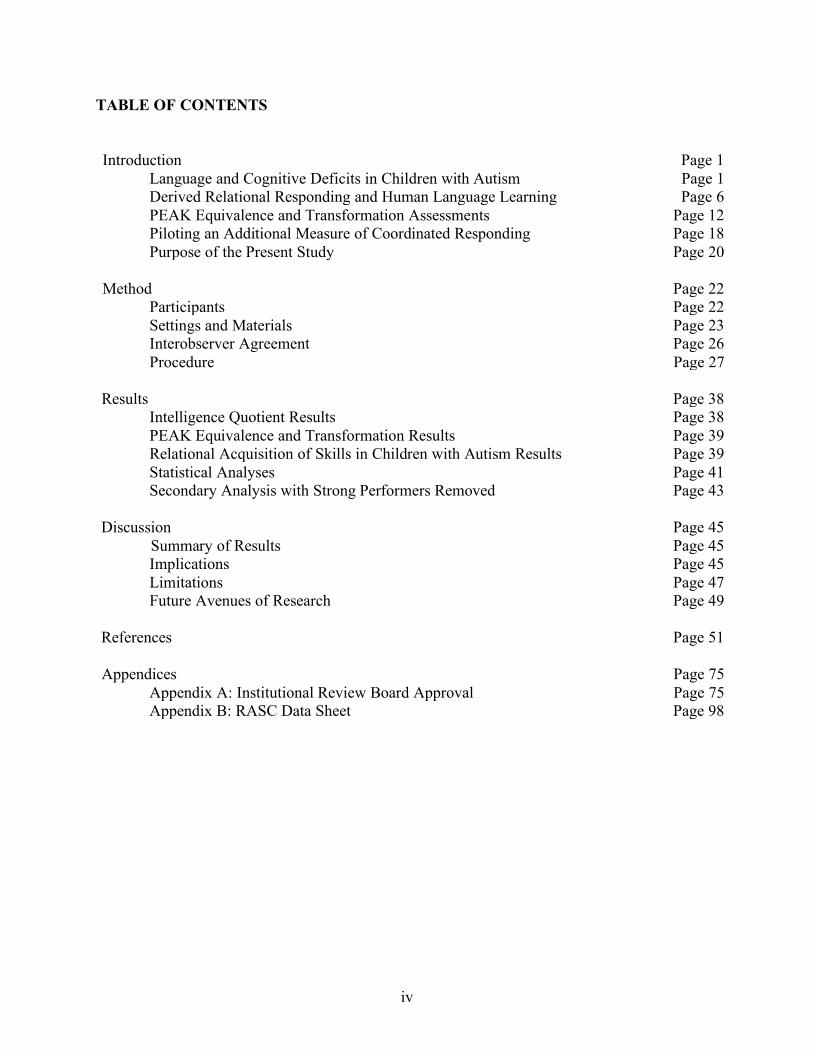
TABLE OF CONTENTS
Introduction Page 1
Language and Cognitive Deficits in Children with Autism Page 1
Derived Relational Responding and Human Language Learning Page 6
PEAK Equivalence and Transformation Assessments Page 12
Piloting an Additional Measure of Coordinated Responding Page 18
Purpose of the Present Study Page 20
Method Page 22
Participants Page 22
Settings and Materials Page 23
Interobserver Agreement Page 26
Procedure Page 27
Results Page 38
Intelligence Quotient Results Page 38
PEAK Equivalence and Transformation Results Page 39
Relational Acquisition of Skills in Children with Autism Results Page 39
Statistical Analyses Page 41
Secondary Analysis with Strong Performers Removed Page 43
Discussion Page 45
Summary of Results Page 45
Implications Page 45
Limitations Page 47
Future Avenues of Research Page 49
References Page 51
Appendices Page 75
Appendix A: Institutional Review Board Approval Page 75
Appendix B: RASC Data Sheet Page 98
v
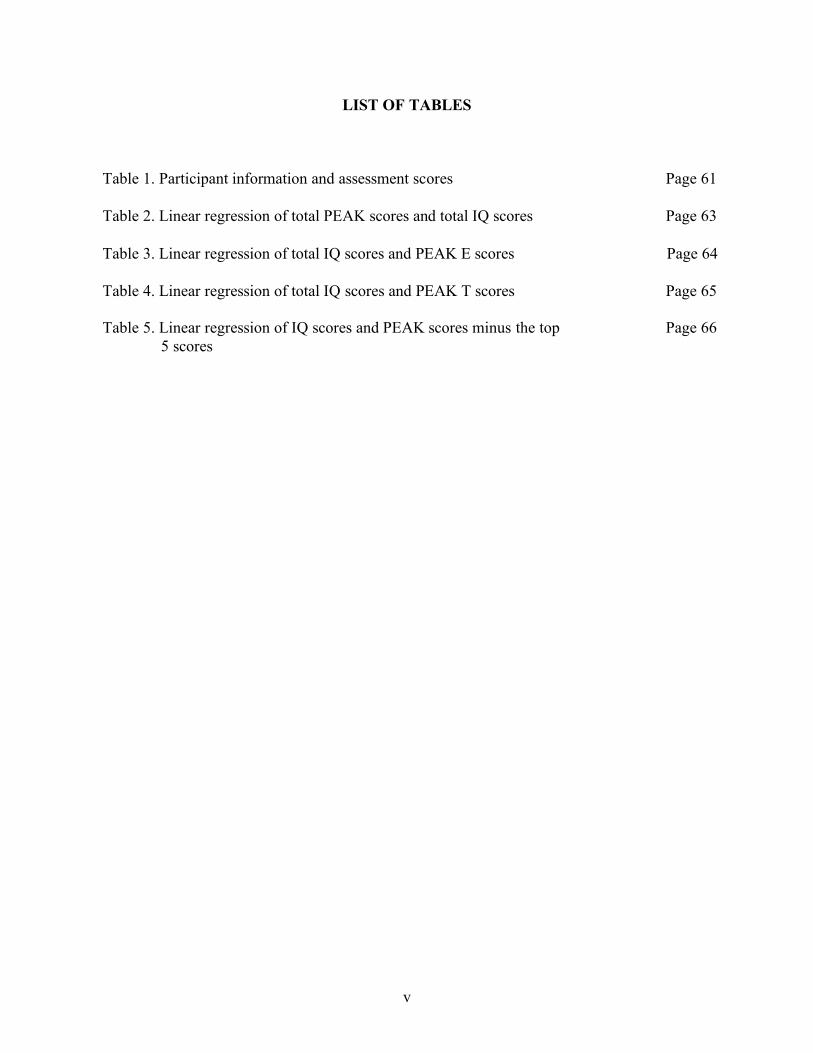
LIST OF TABLES
Table 1. Participant information and assessment scores Page 61
Table 2. Linear regression of total PEAK scores and total IQ scores Page 63
Table 3. Linear regression of total IQ scores and PEAK E scores Page 64
Table 4. Linear regression of total IQ scores and PEAK T scores Page 65
Table 5. Linear regression of IQ scores and PEAK scores minus the top
5 scores
Page 66

vi
LIST OF FIGURES
Figure 1. Pearson correlation matrix between all assessments Page 67
Figure 2. Pearson correlation matrix between total IQ and PEAK E Page 68
Figure 3. Pearson correlation matrix between total IQ and PEAK T Page 69
Figure 4. Graph of correlations between IQ and PEAK Page 70
Figure 5. Graph of correlations between IQ and PEAK E Page 71
Figure 6. Graph of correlations between IQ and PEAK T Page 72
Figure 7. Pearson correlation matrix between IQ and PEAK minus the
top 5 scores
Page 73
Figure 8. Graph of correlations between IQ and PEAK minus the top 5
scores
Page 74

1
INTRODUCTION
Language and Cognitive Deficits in Children with Autism
Individuals with autism share common deficits in language and cognitive development
(Kelley, Paul, Fein, & Naigles, 2006; Yeung, Han, Sze, & Chan, 2016). A defining feature of
this disorder is diminished communication, including both vocal and non-vocal communication
(American Psychiatric Association, 2000; Kelley et al., 2006). The Wisconsin Card Sorting Test
was created to measure cognitive flexibility. Using this test, many researchers found that
children with autism spectrum disorder (ASD) demonstrate greater perseveration than their
typically developing peers (Goldstein, Johnson, & Minshew, 2002; Lopez, Lincoln, Ozonoff, &
Lai, 2005; Minshew, Meyer, & Goldstein, 2002; Shu, Lung, Tien, & Chen, 2001; Tsuchiya, Oki,
Yahara, & Fujieda, 2005; Van Eylen, Boets, Steyaert, Evers, Wagemans, & Noens, 2011; Verté,
Geurts, Roeyers, Oosterlaan, & Sergeant, 2006; Williams & Jarrold, 2013; Kaland, Smith, &
Mortensen, 2007). Researchers who have used other measurement tools found that individuals
with ASD show difficulty with tasks involving shifting conceptual sets (shape to line), even
though their ability to shift perceptual sets (shape to shape) was intact (Brady, Schwean,
Saklofske, McCrimmon, Montgomery, & Thorne, 2013; Hughes, Russell, & Robbins, 1994;
Ozonoff, Cook, Coon, Dawson, Joseph, Klin, McMahon, Minshew, Munson, Pennington,
Rogers, Spense, Tager-Flusburg, Volkmar, & Wrathall, 2004). Yeung, Han, Sze, and Chan have
found that children with ASD have less complex shifting skills, specifically shifting conceptual
sets, compared to neurotypical children due to deficits in cognitive flexibility (2016). According
to Pennington & Ozonoff (1996), these skills enable a child to complete tasks efficiently.

2
Individuals with autism also show more global deficits in cognitive functioning and
executive functioning (Barkley, 1997a; Barkley 1997b; Pennington & Ozonoff, 1996; Russell,
1997). Executive functions have many different definitions but are most commonly described
processes that are necessary in maintaining problem solving and enable self-control (Denckla,
1996; Lezak, 1995; Pennington & Ozonoff, 1996; Welsh & Pennington, 1988). Encompassed in
executive functions are metacognitive domains that include cognitive flexibility, fluency,
planning, response inhibition, and working memory (Ozonoff, 1997; Pennington & Ozonoff,
1996; Reader, Harris, Schuerholz, & Denckla, 1994; Tranel, Anderson, & Benton, 1994).
Deficits in cognitive flexibility are thought to be a fundamental distinguishing feature of ASD
(Yeung et al., 2016). The frontal lobe is the primary mediator of cognitive flexibility (Stuss &
Knight, 2013). Abnormalities in the frontal lobe have consistently been found in children with
ASD (Chan, Cheung, Han, Sze, Leung, Man, & To, 2009; Chan, Han, Leung, Wong, & Cheung,
2011). Similar abnormalities are found in patients who have damage to their frontal lobe
(Damasio & Maurer, 1978; Stuss & Benson, 1984). Barkley (1997a, b) and Russell (1997) found
executive functioning deficits to be perhaps the core deficit associated with ASD. With that
being said, there are differing kinds of deficits and differing profoundness of deficits within
certain executive functioning domains. When the brain damage occurred, where the brain
damage occurred, and the severity of the damage could account for the differences. It was
thought that an executive functioning profile could be used to distinguish different childhood
disorders (Pennington & Ozonoff, 1996). However, research conducted by Geurts, Verté,
Oosterlaan, Roeyers, & Sergeant (2004) found that creating executive functioning profiles, due
to measurement complexity, would be more complicated than originally thought.

3
A potential solution to the language and cognitive deficits in children with autism is
intensive language training. According to the American Psychiatric Association (2013), delays in
language development is an early indicator of ASD. Early intensive interventions based on the
principles of Applied Behavior Analysis have been shown to improve common autism deficits
(Kelley et al., 2006). Included in these are reduced problem behaviors, increased language skills,
increased cognitive skills, and increased social interactive skills (Harris & Handleman, 2000;
Jocelyn, Casiro, Beattie, Bow, & Kneisz, 1998; Lord, 1996). Programs for these children should
address the unique deficits of the individual, have low ratios between implementors and students,
include the student’s family, be in session for more than 20 hours per week, and provide up to
date assessments and treatment goals according to Educating Children with Autism (2001).
Research conducted by Lovaas (1987) showed differences in young children with autism
between those who received intensive behavioral interventions and those who did not. Lovaas
(1987) hypothesized that by creating and intensive learning environment, the individuals
involved in this research study would be able to generalize treatment environments and be better
able to maintain gains made. Thus, allowing some of the participants to catch up to their
neurotypical peers academically by first grade. Subjects involved in this study showed similar
scoring on pretreatment assessments. Lovaas (1987) found that children with autism who were
involved in intensive behavioral treatments scored significantly better on the follow up
assessments than the children with autism who did not. An average difference of 31 points was
found between the 2 groups. Lovaas (1987) also found that 47% of the individuals receiving
intensive treatment “achieved recovery”, meaning that their post-intervention IQ scores fell in
the normal range and they successfully completed first grade in regular education settings.
4
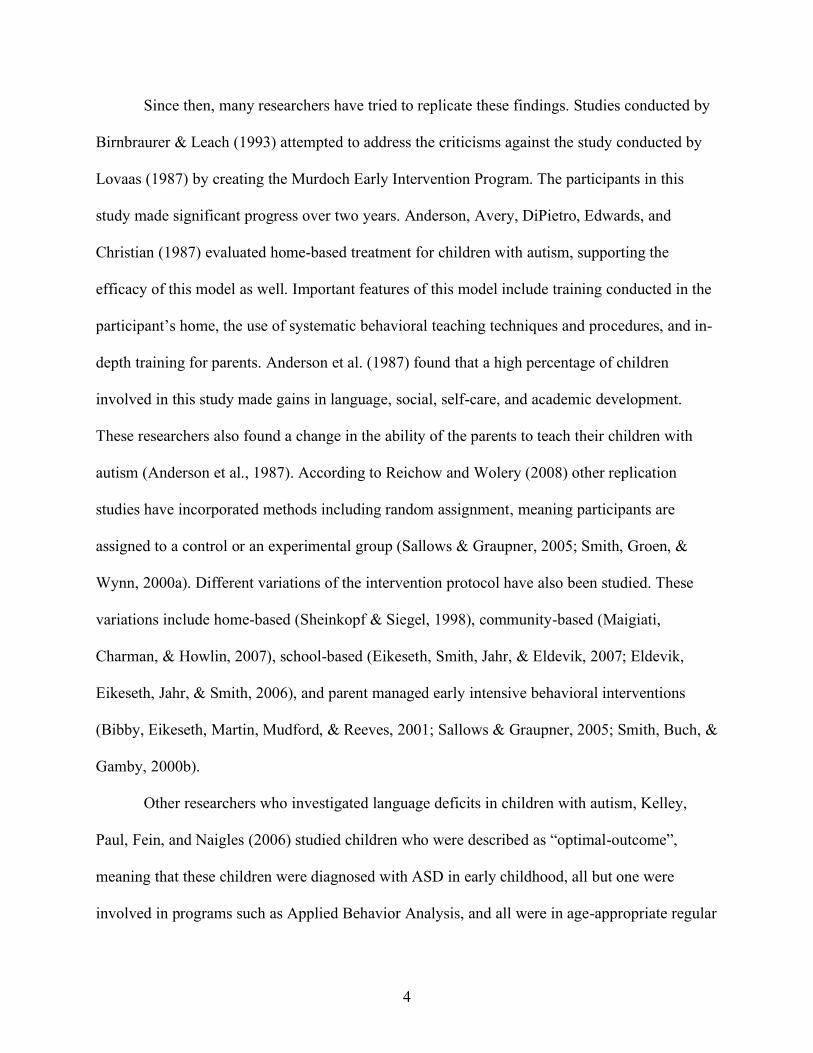
Since then, many researchers have tried to replicate these findings. Studies conducted by
Birnbraurer & Leach (1993) attempted to address the criticisms against the study conducted by
Lovaas (1987) by creating the Murdoch Early Intervention Program. The participants in this
study made significant progress over two years. Anderson, Avery, DiPietro, Edwards, and
Christian (1987) evaluated home-based treatment for children with autism, supporting the
efficacy of this model as well. Important features of this model include training conducted in the
participant’s home, the use of systematic behavioral teaching techniques and procedures, and in-
depth training for parents. Anderson et al. (1987) found that a high percentage of children
involved in this study made gains in language, social, self-care, and academic development.
These researchers also found a change in the ability of the parents to teach their children with
autism (Anderson et al., 1987). According to Reichow and Wolery (2008) other replication
studies have incorporated methods including random assignment, meaning participants are
assigned to a control or an experimental group (Sallows & Graupner, 2005; Smith, Groen, &
Wynn, 2000a). Different variations of the intervention protocol have also been studied. These
variations include home-based (Sheinkopf & Siegel, 1998), community-based (Maigiati,
Charman, & Howlin, 2007), school-based (Eikeseth, Smith, Jahr, & Eldevik, 2007; Eldevik,
Eikeseth, Jahr, & Smith, 2006), and parent managed early intensive behavioral interventions
(Bibby, Eikeseth, Martin, Mudford, & Reeves, 2001; Sallows & Graupner, 2005; Smith, Buch, &
Gamby, 2000b).
Other researchers who investigated language deficits in children with autism, Kelley,
Paul, Fein, and Naigles (2006) studied children who were described as “optimal-outcome”,
meaning that these children were diagnosed with ASD in early childhood, all but one were
involved in programs such as Applied Behavior Analysis, and all were in age-appropriate regular

5
education classes receiving no special educational services. In this study, participants were tested
for syntactic, lexical semantic, morphological, and pragmatic ability with multiple standardized
tasks. The researchers conducting this study found that children with autism preformed as well as
the control group on standardized vocabulary assessments. Children with autism preformed less
well on other standardized subtests but still scored within the normal range for their
chronological age. Children with autism also scored more poorly than the control group on Verb
Argument Structure task, the Categorical Induction task target questions, the Theory of Mind
task, the Mental Verb task, and certain parts of the Narrative task dealing with pragmatics
(Kelley et al., 2006).
Language and executive functioning skills are important for the progress of individuals
with autism. Traditional ABA approaches using direct contingency learning have been effective
in teaching these skills. However, these core deficits may run deeper. More contemporary
approaches involving learning in the absence of direct reinforcement need to be incorporated in
teaching. Methods such as stimulus equivalence and Relational Frame Theory provide this type
of learning.
Many traditional Applied Behavior Analysis (ABA) programs use the Verbal Behavior
Milestones and Placement Program (VB-MAPP; Sundberg, 2008) as a tool to identify the
deficits in language in children with autism. The VB-MAPP was created around the core
principles of Skinner’s verbal behavior (Skinner, 1957). The VB-MAPP assesses an individual’s
verbal skills across three developmental milestones (0-18 months, 18-30 month, and 30-48
months). The skills assessed increase in difficulty across the milestones. This assessment has
been commonly used to measure the verbal repertoire in individuals with autism (Dixon, Belisle,
Stanley, Rowsey, Daar, Szekely, 2014a).
6
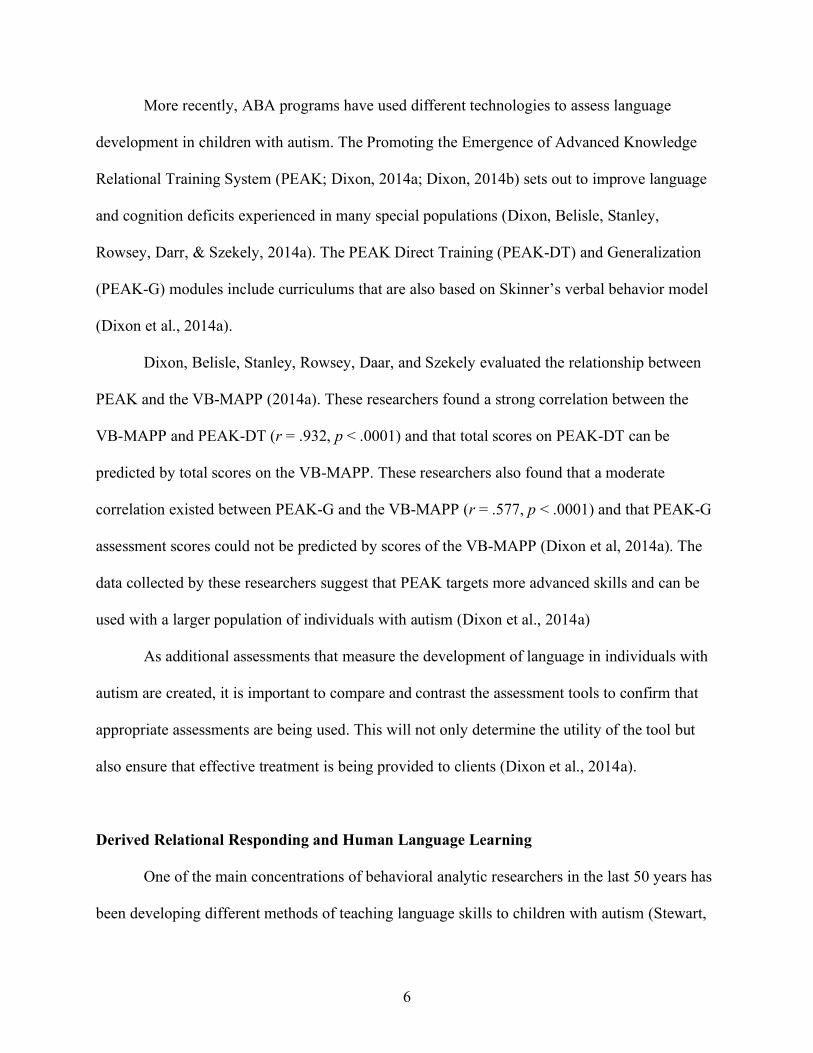
More recently, ABA programs have used different technologies to assess language
development in children with autism. The Promoting the Emergence of Advanced Knowledge
Relational Training System (PEAK; Dixon, 2014a; Dixon, 2014b) sets out to improve language
and cognition deficits experienced in many special populations (Dixon, Belisle, Stanley,
Rowsey, Darr, & Szekely, 2014a). The PEAK Direct Training (PEAK-DT) and Generalization
(PEAK-G) modules include curriculums that are also based on Skinner’s verbal behavior model
(Dixon et al., 2014a).
Dixon, Belisle, Stanley, Rowsey, Daar, and Szekely evaluated the relationship between
PEAK and the VB-MAPP (2014a). These researchers found a strong correlation between the
VB-MAPP and PEAK-DT (r = .932, p < .0001) and that total scores on PEAK-DT can be
predicted by total scores on the VB-MAPP. These researchers also found that a moderate
correlation existed between PEAK-G and the VB-MAPP (r = .577, p < .0001) and that PEAK-G
assessment scores could not be predicted by scores of the VB-MAPP (Dixon et al, 2014a). The
data collected by these researchers suggest that PEAK targets more advanced skills and can be
used with a larger population of individuals with autism (Dixon et al., 2014a)
As additional assessments that measure the development of language in individuals with
autism are created, it is important to compare and contrast the assessment tools to confirm that
appropriate assessments are being used. This will not only determine the utility of the tool but
also ensure that effective treatment is being provided to clients (Dixon et al., 2014a).
Derived Relational Responding and Human Language Learning
One of the main concentrations of behavioral analytic researchers in the last 50 years has
been developing different methods of teaching language skills to children with autism (Stewart,
7
McElwee, & Ming, 2013). Considerable progress has been made in developing successful
programs that teach these skills (Stewart et al., 2013). Outcome studies involving these new
programs have shown that participants have gained language skills and earned higher IQ scores
(Lovaas, 1987; McEachin, Smith, & Lovaas, 1993). In the area of language generativity,
however, success has been described as subtle (Stewart et al., 2013). Skinner’s Verbal Behavior
(1957) has gained attention in the field of behavior analysis and beyond for over 50 years
(Dymond, O’Hora, Whelan, & O’Donovan, 2006; Petursdottir & Devine; 2017). Dixon, Small,
& Rosales (2007) stated that it is imperative for the field of Applied Behavior Analysis to move
past the studies of verbal operants and create innovative methods in which to do so. Although
direct contingency has been successful in directly teaching skills in children with autism, we as a
field, could be missing the mark when it comes to teaching executive functioning skills.
Language generativity has been defined as the ability to generate sentences that have
never been said previously and to understand the meaning of those sentences that have never
been heard previously (Hayes, Barnes-Holmes, & Roche, 2001a). Language generativity has
been shown to be major part of the development of functional communication. Establishing this
generative language in children with language deficits has been shown to be a challenge. In
children with autism, for example, responding is said to be memorized and inflexible even with
involvement in early intensive behavioral interventions (EIBI; Greer & Ross, 2008; Lord &
McGee, 2001). Novel responding is credited to generalization. Lovaas (1981) explained that
generalization skills are imperative for successful teaching because all behaviors cannot be built
in every situation. Williams and Williams (2010) also suggested that every response in every
circumstance does not have to be taught to humans because of response generalization. Language
generativity involves responding that has never been trained. Because of this, language

8
generativity has been linked specifically with response generalization. Untrained responding is
used as a progress marker and is acknowledged within assessment tools including the VB-MAPP
(Sundberg, 2008) and the Assessment of Basic Language and Learning Skills (ABLLS;
Sundberg & Partington, 1998). However, generalization may not account for all or even most of
the generative language skills that people typically demonstrate (Hayes et al., 2001a). For
example, if a person is taught that a CUG is the same as a dolphin, the person may also describe
CUG as an aquatic animal that is highly intelligent. The person may request to travel to see a
CUG, tact CUG, or if asked “what is something else you can call a dolphin,” engage in the
intraverbal “Cug.” It is unlikely, however, that the person has obtained direct reinforcement for
any of these responses, and the word CUG does not contain formal similarity to the word
“dolphin,” which is requisite for stimulus generalization. Therefore, an alternative account may
be needed for generative verbal behavior that is referential or symbolic in nature (Critchfield,
Barnes-Holmes, & Dougher, 2018).
Relational responding is the main process involved in human abilities involving language
and cognition according to Relational Frame Theory (RFT; Hayes et al., 2001a). These abilities
range from something as simple as naming a favorite object to understanding more complex
processes such involving abstract dimensions such as those found in oppositional frames
(Barnes-Holmes, Barnes-Holmes, & Mchugh, 2004). Hayes, Barnes-Holmes, and Roche (2001a)
have found that RFT offers an account of verbal and cognitive processes, in humans, that is both
behavioral and functional and provides the possibility of connecting these processes with
programs designed to teach individuals with language and cognition deficits (Barnes-Holmes,
Barnes-Holmes, & Cullinan, 2001). Programs designed using nonarbitrary relational responding
and arbitrary relational responding have the potential to increase both language and cognitive

9
skills in individuals with these deficits. Relating can be defined as the process of responding to
one stimulus in terms of another stimulus. Nonarbitrary relational responding, according to RFT,
is controlled by formal properties of the specific stimulus. Because of this, it is not considered a
verbal process. However, RFT argues that applicable arbitrary relational responding is
considered a verbal process. This is because formal properties of the stimulus become under the
control of different contextual features. RFT also argues that arbitrary relational responses could
influence responding on other stimuli when presented appropriately (Hayes, Fox, Gifford,
Wilson, Barnes-Holmes, & Healy, 2001b). In language interactions, children are exposed to
several examplars of name- object relations. An example of this would be when a child is shown
the object doll, the word “doll” will be said by the caregiver. Reinforcement occurs when the
child turns toward the doll. For the reverse, the caregiver might ask “Where’s the doll?”. When
the child turns towards the doll, reinforcement will be given. Object-name and name-object
relations are trained in young children, but many other bidirectional relations emerge without
specific training. This form of naming history, according to RFT, establishes that bidirectional
relations (name-object relations) accurately predict the emergence of both object-name and
name-object relations. Therefore, the skill that arises is said to be generalized and can be applied
to many names and objects. According to RFT’s training history, if a child has mastered a
specific name-object relation, the result will likely be that the child will also learn the derived
relation object-name (Barnes-Holmes et al., 2004).
Two defining features of relational responding are mutual entailment and combinatorial
entailment. These features explain relations that have been derived between no less than 2
stimuli. A third feature is needed to explain the changes that happen in the function of a
particular stimulus because of its involvement in relations derived with other stimuli. RFT refers

10
to this as the transformation of functions. An example of this would be if a child was shown two
identical containers and told that container B was better than container A, the child will most
likely be more excited about being given container B. The child still derived better-worse
relations between the two containers even without having experience with either one (Roche &
Barnes, 1997; Roche, Barnes-Holmes, Barnes-Holmes, Smeets, & McGeady, 2000). The
function of container B was transformed by the better-than relation with container A. This means
that container B will produce more approach functions than container A (Barnes-Holmes et al.,
2004).
There are several reasons to believe that language and cognitive training developed from
an RFT account may serve to reinforce or strengthen language and executive functioning deficits
observed in children with autism. First, neurological research comparing children with autism to
typically developing peers during executive functioning tasks suggests that involvement of
frontal lobe and the parietal lobe may be impacted in children with autism. Second, research
evaluating neural activity during stimulus equivalence tasks using an fMRI show that the frontal
lobe and parietal lobe are active; however, these same areas are not active throughout direct
contingency learning (Laurer & Belisle, 2019).
Behavioral research has demonstrated a relationship between intelligence and derived
relational responding using verbal behavior models. This suggests that the same skills suspected
in higher cognitive function are assessed by PEAK as well as IQ and that similar results will be
consistent across implementers (Dixon, Whiting, Rowsey, & Belisle, 2014b). Dixon, Whiting,
Rowsey, and Belisle evaluated the relationship between PEAK-DT, which is based on a verbal
behavior model, and intelligence (2014b). These researchers found that participant age did not
correlate with PEAK-DT scores or IQ scores. They did find, however, that although a strong
11
positive correlation was observed, the relationship appeared curvilinear wherein extreme high
and low scores on the verbal behavior assessment could account entirely for the strong positive
relation of the correlation (r = .759, p < .01) (Dixon et al., 2014b).
In another study, members of this same team (Dixon, Belisle, & Stanley, 2018) examined
the relationship between derived relational responding using the PEAK Equivalence Pre-
Assessment and IQ, obtaining a stronger correlation coefficient and a strong fit for the linear
model (r = .887, p < .01). These researchers found a strong significant correlation between both
the PEAK-E-PA total scores and raw IQ scores, and the PEAK-E-PA total scores and full-scale
IQ (Dixon et al., 2018). Further, although verbal operants may be correlated with intelligence
test scores, a hierarchical multiple regression conducted by Belisle, Dixon, and Stanley (2018)
suggests that this relationship is moderated, or accounted for, by the ability of participants to
derive relations. Meaning individuals who are able to make derived relations perform better on
standardized IQ tests (Belisle et al., 2018).
Treatment effectiveness research is also starting to highlight the potential utility of RFT
treatment models to promote gains in executive functioning. Research conducted by Cassidy,
Roche, and Hayes (2011) set out to test the effectiveness of multiple-exemplar relational training
and raising children’s IQ. In the first experiment, four neurotypical children were subjected to
multiple exemplar training and the relational frames of more than, less than, opposite, and same.
The Wechsler Intelligence Scale for Children (WISC-IIIUK; Wechsler, 1992) was measured at
baseline, after stimulus equivalence training, and after relational frame training. The participants
in the experimental group showed a rise in Full Scale IQ, Verbal IQ, and Performance IQ after
stimulus equivalence training and another significant rise after training relational frames when
compared to the control group. These researchers found that 12 of 12 participants improved at

12
least 1 standard deviation, 11 of 12 improved more than two standard deviations, and 7 of 12
scores improved more than three standard deviations. In the second experiment, eight children
with different educational and behavioral issues were introduced to multiple exemplar-based
training of relational frames. IQ was tested using the WISC (IV-UK). Researchers found that IQ
scores rose by one standard deviation for seven of the eight participants showing statistically
significant improvement for the group, suggesting important implications for intellectual skills
and support the idea of RFT that derived relational responding fluency is, in fact, related to IQ
(Cassidy et al., 2011).
PEAK Equivalence and Transformation Assessments
The ability of humans to make equivalence relations is embedded in language (Dixon,
2015). Many researchers view equivalence relations as the essential element of language.
Relating stimuli in ways including verbally, vocally, and symbolically is the core of real
language. Manding, tacting, and responding intraverbally are not a part of fully functional
language. They are, however, the start of skills that grow into skills that are more complex
(Dixon, 2015). It has been said that humans are the only organism on the earth that can make
these equivalent type of relations. Children, at a very young age, begin to make these relations,
but nonhumans do not (Dixon, 2015). PEAK was created as a tool for consumers, allowing them
to train relations with children in a systematic way.
There are four main stimulus relation components in the Equivalence Module of PEAK.
They are reflexivity, transitivity, symmetry, and equivalence. These relations are presented to the
learner in varying levels difficulty. This is said to establish strong and flexible responses that are

13
not tied to specific stimuli involved in a program. The main goal is not to teach what to relate, it
is to teach how to respond relationally. PEAK includes a pre-assessment and an assessment to
test a child’s ability to derive equivalence relations. The Stimulus Equivalence Pre-Assessment
was designed with skills to focus on during the PEAK Equivalence Assessment. The Pre-
Assessment was not designed to replace the full assessment, but rather gauge the child’s existing
repertoire of relational skills. The Pre-Assessment assesses the child’s ability to derive relations
across four different types of relations and three difficulty levels. The Pre-Assessment is made
up of two test programs for each of the four different types of relations. Each program includes
arbitrary stimuli to test if the child is able to derive relational responding to any stimuli
presented, even if the child has never interacted with such stimuli before (Dixon 2015).
Dixon, Belisle, and Stanley (2018) found a positive correlation between the PEAK-E pre-
assessment and IQ (raw and full scale) scores in children with autism and other related
disabilities in which higher IQ scores result in higher PEAK-E-PA scores. These results support
relational accounts of language and cognition and suggest a relationship between intelligence and
derived relational responding (Dixon et al., 2018). Training guided by PEAK-E may also be
efficacious in establishing more complex forms of behavior than traditionally targeted within
applied behavior analytic research. Dixon, Belisle, Stanley, Speelman, Rowsey, Kime, and Daar
(2016) evaluated the efficacy of one of the programs of PEAK- E in supporting the development
of untrained responding skills in intraverbals and labeling. The results showed that training put in
place was effective for teaching the participants to respond receptively and engage in derived
categorical responding. The data gathered are consistent with research suggesting that discrete
trial training is an effective way to teach individuals to respond categorically (e.g. Braam &
Poling, 1983; Luciano, 1986; Partington & Bailey, 1993).

14
Belisle, Dixon, and Stanley (2018) found a significant relationship between intelligence
and derived relational responding in children with autism. These results were extended by testing
the degree to which results on the PEAK Equivalence Pre-assessment mediated the relationship
between IQ and the PEAK Direct Training Assessment, suggesting that the PEAK Equivalence
Pre-Assessment had greater predictive utility of IQ scores (Belisle et al., 2018). They found
positive correlations between the PEAK Direct Training Assessment and IQ (full scale IQ r =
.66, p < .01; raw IQ r = .80, p < .01) and the PEAK Equivalence Pre-Assessment and IQ (full
scale r = .85, p < .01; raw IQ r = .89, p < .01). However, the PEAK Equivalence Pre-assessment
results could explain this relationship. These findings suggest that derived responding provides a
behavioral explanation of intelligence and Skinner’s elementary operants (Belisle et al., 2018). In
a study conducted by McKeel and Matas (2017) the PEAK equivalence module was used to
teach relations between stimuli to adults with autism. A gustatory sensory modality program was
implemented. Different stimuli were selected to be probed before the initial training. Gustatory
stimuli were first trained to a picture. Then, a picture was trained to a spoken word. Once a
participant reached mastery criteria, responding was examined to determine if relations were
derived after training. These researchers found that the participants obtained mastery criterion
during training sessions. The participants were also able to relate stimuli without being directly
trained. The results of this study are important for demonstrating the usefulness of the PEAK
equivalence module in teaching relations in individuals with developmental disabilities as well as
support the notion that equivalence relations could be trained outside of using the typical visual
to visual or verbal to visual stimuli (Rehfeldt, 2011).
The ultimate goal of the Transformation Module of PEAK is to transform the language
and cognitive skills of the child beyond what was possible with the previous PEAK modules
15
(Dixon, 2016). This PEAK module targets relational learning to complete the child’s repertoire.
Relational responding allows individuals to derive meaning from the different stimuli that are
interacted with. Skills taught in this module include concept formation, problem solving, and
perspective taking. These skills are considered to be absent from other ABA programs focused
on language training (Dixon, 2016). Another goal included in the Transformation Module in
PEAK is to test the relational complexity exhibited by the child. This module will increase the
complexity of the skills using the PEAK-T curriculum. Research has exposed that relational
skills in children can positively effect intelligence scores, school performance, and social-
emotional success (Dixon, 2016). PEAK includes a pre-assessment for transformation. The
Transformation Pre-Assessment consists of two subtest, expressive and receptive. These
evaluations will allow the thorough consideration of verbal and selection abilities the child
possesses in isolation. This provides an assessment of the strength of the child’s repertoire. Also,
the pre-assessment gauges the child’s complexity skills. This information will help the clinician
know where to begin in future programming (Dixon, 2016). The assessment included in the
PEAK Transformation Module is the Language and Cognition Comprehensive Assessment
Version 1.0 (LCCA1). This assessment is used as an information summary of the current skills
the child possesses across all PEAK modules. This is an important document and should be
referenced when putting together insurance authorizations, medical reports, Individualized
Education Plans (IEP), and progress reports. The LCCA1 shows the current skills of the child as
well as provides a comparison of that child to a group of neurotypical peers for the first two
modules of PEAK (Dixon, 2016). Research conducted by Belisle, Dixon, Stanley, Munoz, and
Darr (2016) set out to gauge the effectiveness of relational training procedures in teaching
children with autism single reversal deictic responding. Deictic relational responding occurs

16
when a relationship is formed in the perspective of the speaker (Montoya-Rodríguez, Molina,
and McHugh, 2016), such as I-you, now-then, and here-there. This study targeted I-You
relations. This is because skills in perspective-taking appear to develop first (Howlin Baron-
Cohen, & Hadwin, 1999). In the study, researchers directly taught a single relation. The opposite
relation was tested periodically for untrained development. To test transfer of function, test
probes were conducted similarly with a second set stimuli. This research was the first to show
relations, derivations, and transfers in adolescents with autism. The researchers of this study
found that single-reversal bidirectional frames, after the direct training of one relation, can be
derived. All three participants involved in this study exhibited a transfer of stimulus function
after the You and I relations were mastered (Belisle et al., 2016).
Dixon, Paliliunas, Barron, Schmick, and Stanley (2019) studied the effects of traditional
ABA therapy and post -Skinnerian techniques on IQ scores in children with autism. Traditional
ABA therapy has been shown to be effective in improving intelligence, verbal behavior, and
language repertoires by using direct contingency-based training. Also, RFT has been shown to
lead to IQ gains in children with autism (Dixon et al., 2019). RFT uses derived relational
responding instead of the antecedent-behavior-consequence model when teaching novel skills.
For this study, researchers used a randomized control trial to compare verbal behavior techniques
involved in traditional ABA therapy, post-Skinnerian techniques that were added to
comprehensive ABA methods, and a control group (Dixon et al., 2019). These researchers found
that acquisition of skills improved across both experimental groups when compared to the
control group. The highest IQ gains were found in the comprehensive ABA group. The data
suggest that ABA providers could have an advantage by adding nontraditional techniques into
teaching language and cognitive skills (Dixon et al., 2019).

17
There is substantial empirical evidence that support PEAK as being a successful tool for
teaching children with ASD language and cognitive skills. For example, Reed and Luiselli
(2016) called PEAK “…conceptually sound, psychometrically robust, and an innovative
advancement of conventional ABA tactics…” (p. 210). One potential advantage of the PEAK-E
and PEAK-T pre-assessments is that they can provide a measure of growth in derived relational
responding as a higher-order operant behavior (Healy, Barnes-Holmes, & Smeets, 2000). As
learners progress though PEAK programming, improvements in derived relational responding
may be observed as improved scores within the pre-assessments. Currently, PEAK-E and PEAK-
T provide the only systematic and standardized measure of derived relational responding.
Limitations of the PEAK-E and PEAK-T pre-assessments include pre-assessments possibly
leading to training to the test and pre-assessments not being direct measures of performance. For
example, a learner may achieve a score of 4/6 for the Symmetry subtest of the PEAK-E
assessment, but “4” is not a direct measure of behavior. We can infer the 4 is greater than 3 and
less than 5, but what precisely 4 refers to is unknown. Traditional approaches to behavior
analysis emphasize measuring directly the behavior of interest, such as time spent on a task or
frequency of self-injury. Currently, there are no quantitative methods to measure derived
relational responding as a generalized operant directly. Obtaining a direct measure that correlates
with the PEAK could provide a valid estimate for use as a predictor or outcome measure within
stimulus equivalence and RFT research. Creating this measure is of interest to current
researchers.

18
Piloting an Additional Measure of Coordinated Responding
One approach could be to obtain “relational deceleration,” or the weakening of derived
relational responding as a function of class size. Belisle & Dixon (2020) provided a model of
relational deceleration as: Rp = Rm / Rv, where Rp represents the strength of relations contained
within a class, Rm represents mass or resistance, and Rv are the number of nodes. Without
knowledge of Rm, we can infer from this equation that as Rv increases (i.e., additional nodes),
the overall strength of the class decreases (Rp). Although individuals with autism have shown
deficits in derived relational responding in general, these deficits appear to become more
pronounced within larger classes. And, this finding corresponds with neurological research
suggesting primary differences may occur when tasks become more complex. Belisle and Dixon
(2020) demonstrated in a basic experiment with college student participants that nodal distance
was inversely related to response accuracy as a measure of response strength, corresponding with
prior research stemming from a stimulus equivalence account (Belisle & Dixon, 2020). Although
these authors elected to use response accuracy, neurological research suggests that a decrease in
fluency as a function of task complexity may be more sensitive to detecting differences, and
therefore may be more appropriate as a measure of relational deceleration.
The Relational Acquisition of Skills in Children with autism (RASC) assessment was
created to show the decay of relating across nodal distance. We expected that as nodes increase,
the ability to derive relations decreases. Directly trained relations will first be established using a
stimulus pairing observation procedure (SPOP). After the relation has been directly trained, a
match to sample (MTS) procedure will be used to test the participant on the symmetrical relation.
This procedure will continue for three classes of stimuli with three members in each class.
Fluency was recorded for participants who mastered a relation. This new measure will be pilot

19
tested with children who have autism. The scores obtained from this new measure were
compared against PEAK E, PEAK T, and IQ scores.
SPOP has received attention form behavior analytic research in past years (e.g. Leader &
Barnes-Holmes, 2001; Leader, Barnes-Holmes, & Smeets, 1996; Smyth, Barnes-Holmes, &
Forsyth, 2006). Recently, SPOP has been examined in the development of language skills (e.g.
Byrne, Rehfeldt, & Aguirre, 2014; Rosales, Rehfeldt, & Huffman, 2012; Vallinger-Brown &
Rosales, 2014). In the study conducted by Solares and Fryling (2018) three children with ASD
were exposed to SPOP instructions. These researchers found that after SPOP instructions, the
participant’s scores for tact and listener responses increased and remained increased during
maintenance. These results were inconsistent with the study conducted by Byrne, Rehfeldt, and
Aguirre (2014), in which the participants did not master the criteria after being exposed to SPOP
instruction (Solares & Fryling, 2018).
MTS testing involves relating different stimuli together because of previous
environmental reinforcement. Matching stimuli such as a picture of an item with the written
word (Sidman & Tailby, 1982). Researchers have found that children with ASD are successful at
learning stimuli relations after MTS training. It has also shown that receptive and expressive
language skills emerge for some participants who undergo MTS training (Carr, Wilkinson,
Blackman, & McIlvane, 2000; McLay, Sutherland, Church, & Tyler-Merrick, 2013). There are,
however, variations in the results of these research studies. Some researchers have found that
children with ASD who have higher verbal skills before MTS training acquire untrained relations
more quickly compared to children with lower verbal skills (O’Conner, Rafferty, Barnes-
Holmes, & Barnes-Holmes, 2009). Some children who have autism need modifications to the

20
teaching conditions to be able to develop relations. In these situations, the extent of training is
highly variable (Cuvo & Riva, 1980; Murphy & Barnes-Holmes, 2010).
Bejno, Johansson, Ramnero, Gimaldi, & Cepeda (2018) examined the effects of MTS
training on verbal responding. The participants were 6 children who have been diagnosed with
autism. These children had varying levels of skills. The purpose of the study was to investigate if
MTS training would improve in the development of untrained receptive and expressive language
responses, and also to determine if previous verbal skills influence learning and retention. These
researchers found that all participants involved increased their matching skills to some degree
during the study. Participants with higher verbal skills at the beginning of the study developed
responses more quickly than other participants. This lends support that MTS training can be
helpful for children with autism in acquiring untrained language responses (Bejno et al., 2018).
Clayton and Hayes (2004) also found that exposure to MTS training resulted in a higher number
of correct responses while testing derived relations (Clayton & Hayes, 2004). The RASC
assessment uses an MTS procedure to test a symmetrical relation that has previously been
trained.
Fluency has been said to lead to the successful generalization of skills that are more
complex (O’Brien, Tiernan, & Holloway, 2017). Strength of relating will be measured as
fluency. It has been hypothesized that fluency decays over nodal distance.
Purpose of the Present Study
The present study (a) extended previous research by evaluating the relationship between
PEAK Equivalence and PEAK Transformation with IQ scores in children who have autism and
(b) created and pilot tested the RASC with the same pool of participants. The PEAK assessment

21
battery has been correlated positively with several constructs related to executive functioning and
language supporting the empirical and clinical utility of this tool. An additional advantage of the
PEAK assessment battery is that curricular programming can be developed directly from this
tool. Deficits in IQ are common in children with autism, so we compared the accuracy of full
scale IQ estimates to total PEAK scores. We anticipated strong, positive correlation between
PEAK and IQ scores since, although these measures are different, they are of the same general
concept. The scores of the piloted RASC assessment were correlated with both PEAK and IQ
scores to determine the validity of this new measure.
22
METHOD
Participants
Twenty-one children between the ages of two years and six years with a diagnosis of
autism were recruited from ABA service providers in Missouri. Of the 21 participants, six were
female and 15 were male. The average age of the participants included in this study was 3.95
years with a standard deviation of 0.97.
Most of the children recruited were already receiving ABA services, however, some were
on the waitlists to get into those services. Out of the 21 participants included in this study, 18
attended an ABA preschool class. This classroom had a morning session and an afternoon
session. The morning session had ten children in attendance. The afternoon session had eight
children in attendance. Both sessions were led by one teacher and three classroom aids. The
classroom incorporated natural environment teaching and group activities. Each child in the
program was pulled aside one at a time to work with a staff member on discrete trial targets. The
remaining three participants were not receiving ABA services.
Each child involved in this study had a diagnosis of autism. Additional diagnoses of
Down syndrome, Oppositional defiant disorder, sensory processing disorder, developmental
delays, and speech delays were reported. Children with all behavior ranges were included in this
study. Behaviors including physical refusal, physical aggression, verbal refusal, screaming, and
elopement were also reported. However, if behaviors became severe, the assessments were
discontinued. Assessments were discontinued if the participant engaged in physical aggression
towards self or implementor or if discontinue criteria was met for the specific assessment.

23
The average IQ score for the participants included in this study was 54 with a standard
deviation of 19.26. The average PEAK E score for these participants was 3 with a standard
deviation of 4.39. The average PEAK T score for the participants included in this study was 8
with a standard deviation of 15.77.
Other studies that have compared the relationship between IQ and PEAK have used
children who have ASD as well as other forms of disabilities. However, studies conducted by
Dixon, Whiting, Rowsey, and Belisle (2014b) and Dixon, Belisle, and Stanley (2018) used a
much larger number of participants (64) as well as higher age ranges (five years to 22 years and
four years to 16 years).
Settings and Materials
The WPPSI-IV subtests, PEAK Equivalence Pre-Assessment, PEAK Transformation Pre-
Assessment, and the RASC assessment were either conducted at Missouri State University in a
2.44 m x 1.22 m treatment room in Hill Hall or in a quiet 0.61 m x 0.91 m corner of a classroom
that was separated from the rest of class by dividers. The treatment room at Missouri State
University was able to be viewed through a two-way mirror in an adjoining room. Present in the
treatment room was a table and two chairs positioned across from each other. A shelf with an
array of reinforcers (toys, edibles, iPad mini) was also present in the room. The participants
assessed at Missouri State University were allowed to bring highly reinforcing items from home
to work for. An iPad mini was mounted on the wall positioned to view the top of the table. This
iPad recorded the session through zoom to be viewed on a computer located in the adjoining
room. Parents of the participants, as well as other graduate students were seated in the adjoining
room and watched the session. Items included in the corner of the classroom included a table,

24
three chairs, and a Mac Book. Edible reinforcers and age appropriate toys were also available for
the participant to work for.
The Wechsler Preschool and Primary Scale of Intelligence (WPPSI-IV) short form was
used to test intelligence. Assessors used the WPPSI-IV for all participants. These participants
were tested using the Information, Matrix Reasoning, and Picture Memory subtests of the
WPPSI-IV. These subtests were administered in the treatment room or in a secluded corner of
the classroom. The materials needed for the WPPSI-VI included picture stimuli for the
participant’s to be able to select a correct response, scoring sheets for all subtests, and a writing
utensil to score participant responses.
The Information subtest of the WPPSI-IV is included in the Verbal Comprehension
Index. This subtest measures a participant’s capacity to acquire information, retain information,
and retrieve information. The participant either selected a picture in an array of 4 that best
answered a question or answered a question verbally about a variety of topics. For the questions
that needed picture stimuli, the assessor used the stimuli book for the information subtest. The
page that corresponded to the item number on the data sheet was presented to the participant.
The Matrix Reasoning subtest of the WPPSI-IV is included in the Fluid Reasoning Index.
This subtest measures a participant’s broad visual intelligence, fluid intelligence, perceptual
organization, knowledge of part-whole relations, classification and special capacity, and
processing. In this subtest, the participant was asked to select one of four possible stimuli that
completed the unfinished matrix that was presented. The stimuli book for this subtest was used to
present the unfinished matrices, as well as the four possible stimuli choices to the participant.
The assessor presented the page that corresponded to the item number on the data sheet.

25
The Picture Memory subtest of the WPPSI-IV is included in the Working Memory Index.
This subtest measures visual working memory. In this subtest, a participant viewed a page of
stimuli for a specified amount of time. The participant then selected the pictures he previously
viewed from a number of options provided on a response page. The assessor used the stimuli
book from this subtest to present the page that corresponded to the item number on the data
sheet.
The PEAK Equivalence Pre-assessment was used to test derived equivalence relations
(reflexive, symmetrical, transitive, and equivalence) between stimuli. The short form version of
this pre-assessment was used for this study. Materials needed for the implementation of the
PEAK Equivalence Pre-Assessment included the stimuli flip book, the assessor’s script, and data
sheets. The stimuli flip book contains the stimuli needed for the participant to give a correct
response to any given question. This book was placed on the table, directly in front of the
participant. The assessor’s script provided the assessor with the correct verbal instructions to
give to the participant for every question on the PEAK Equivalence Pre-Assessment. The script
was followed verbatim by the assessor. The script also provided the assessor with the correct
answer. Space was provided on the scoring sheet for the assessor to mark if the participant
answered the question correctly or incorrectly. The assessor’s script as well as the data sheet
were hidden from the view of the participant. Other materials needed for this assessment
included a timer for the assessor to time participant breaks and a variety or reinforcers for the
child to work for (edibles, toys in the treatment room, or toys brought by the child).
The materials needed for the PEAK Transformation Pre-Assessment were similar to the
materials above. A stimulus book that included the stimuli needed for the child to give a correct
response to any given question was sitting on the table directly in front of the participant. A

26
script for the assessor to follow was also present in the room but hidden from the participant’s
view. Other materials present in the room for this assessment included a timer to time breaks
taken by the participant and reinforcers for the child to work for.
The materials needed for the method to measure fluency and obtain the deceleration
coefficient included a Surface Pro for the participant to view the stimuli, a printed data sheet, and
a writing utensil for the assessor to record participant responses as correct or incorrect. The data
sheet that was created for this method is shown in Appendix 2. This assessment had three classes
of stimuli with three members in each class. Class A stimuli consisted of pictures of merged
animals (two different animals merged together), the class B stimuli consisted of arbitrary
consonant vowel consonant (CVC) words, and the class C stimuli consisted of non-primary
colors. These stimuli were presented using a Microsoft PowerPoint presentation on a Surface
Pro. Various reinforcers were present in the room and available for the participant.
Interobserver Agreement
IOA was calculated for 67% (42 out of 63) of all assessments implemented. Agreement
occurred when the observer and the assessor both marked a correct or incorrect response for
assessment items. The percent agreement for all assessments was calculated by taking the total
number of agreements (694) and dividing by the total number of agreements plus the total
number of disagreements (702) and multiplying by 100. The total percent agreement for all
assessments implemented was 99%. These results were then broken down by assessment type.
IOA was calculated for 76% (16 out of 21) of IQ assessments. Percent agreement was calculated
by taking the total number of agreements (317) and dividing by the total number of agreements
plus the total number of disagreements (317) and multiplying by 100. The percent of agreement

27
for the IQ assessments was 100%. Next, IOA was calculated for 29% (6 out of 21) of the PEAK
assessments. Percent agreement was calculated by taking the total number of agreements (169)
and dividing by the total number of agreements plus disagreements (175) and multiplying by
100. The percent agreement for the PEAK assessments was 97%. Then, IOA was calculated for
95% (20 out of 21) of the RASC assessments. Percent agreement was calculated by taking the
total number of agreements (208) and dividing by the total number of agreements plus the total
number of disagreement (210) and multiplying by 100. The percent agreement for the RASC
assessment was 99%.
Procedure
Prior to the start of assessing the participants, the study was approved by Missouri State
University’s institutional review board, IRB-FY2020-33, on August 29, 2019 (Appendix A).
Each of these assessments were conducted by graduate level students who were trained to
criterion by Dr. Jordan Belisle, PhD, BCBA. Before a participant could be assessed, an intake
packet was given to the parents. Included in the packet was a consent form, an informational
sheet, PEAK Direct Training indirect assessment, PEAK Generalization indirect assessment, and
a Questions About Behavioral Function (QABF) indirect assessment. The assessments could not
begin until the consent form was signed. Once consent was obtained, an observational preference
assessment was conducted for each participant to determine reinforcers for the participants to
work for. Once the reinforcers were identified, the assessor began implementing the assessments
in a randomized order. Breaks were given to the participants periodically through the two-hour
session. During the session, participants would complete the WPPSI-IV Information, Matrix

28
Reasoning, and Picture Memory subtests, the PEAK Equivalence Pre-assessment, and the
Transformation Pre-assessment receptive subtest, and the RASC assessment.
The WPPSI-IV Information, Matrix Reasoning, and Picture Memory subtests were used
for all participants. For the Information subtest, the assessor was positioned directly in front of
the participant. Participants were presented with picture stimuli. A piece of paper with four
different stimuli printed on it was presented to the participant. The assessor would then ask a
question about one of the pictures presented. For example, the assessor would present the
pictures of a sandwich, a doll, a ball, and a house. The assessor would then say, “Show me what
you can eat.” This process continued for three more trials. After these trials, only verbal items
were used. For example, the assessor would ask the participant a question like “Show me your
knee? Touch it.” or “How many eyes do you have?”. Each item on this subtest was scored a 0 or
a 1 depending on participant responses. If the participant scored a 0 on three consecutive trials,
the subtest was discontinued.
For the Matrix Reasoning subtest, the assessor stayed positioned directly in front of the
participant. The assessor presented an incomplete matrix to the participant. Stimuli to complete
the matrix were also presented. The assessor would then say, “Look at these pictures”. The
assessor then pointed to the response options and then to the incomplete matrix while saying
“Which one here goes here.” The participant selected a correct response by touching or pointing
to the stimulus that completed the matrix. This subtest began with three sample items. For the
sample items, the assessor provided feedback for the participant responses. If the participant
selected an incorrect response on a sample question, the assessor corrected the participant and
showed the correct response. Participant responses were scored either a 0 or 1. The assessor no
longer provided feedback after the sample questions. The items in this subtest became more

29
difficult as the test continued. If the child selected three incorrect responses in a row, the
assessment was discontinued.
For the Picture Memory subtest, the assessor stayed positioned directly in front of the
participant. The assessor would present a page to the participant. The page would have one or
more items printed on it. The assessor would wait three seconds and then turn the page. The
second page would have two or more items presented on it, including the items from the first
page. Once the second page was presented, the assessor would say “What did you see?”. The
participant would touch or point to the correct item or items in the array. This subtest began with
a sample question. The assessor could provide the participant feedback on the sample question
only. Six items were to follow in the same manner as the first sample question. After the six
items, another sample question would be presented. For this sample item the assessor would
present the stimuli to the participant and wait five seconds. The assessor used the same procedure
as the previous items by turning the page to the array of stimuli and asking, “What did you see?”.
Each item in this subtest would either be scored a 1 for correct responses or a 0 for incorrect
responses. The participants must select all correct stimuli for an item to be scored as correct. This
assessment was discontinued after three consecutive scores of 0.
The PEAK Equivalence Pre-Assessment contains 48 items that assess the four different
types of derived responding (reflexive, symmetrical, transitive, and equivalence). Each type of
responding has a subtest that includes 12 items. Participant’s scores could range from 0-12 for
each of the subtests. The scores for the four different subtests were combined for a total PEAK
Equivalence Pre-Assessment score ranging from 0-48. Each subtest contains six skills that are
labeled “basic”, “intermediate” or “advanced” based on complexity. These six skills were tested
one time. The score was then multiplied by two to create a maximum score of 12. Visual and
30
auditory stimuli were included in the assessment to evaluate derived relations. Visual stimuli
included arbitrary pictures and arbitrary text. Auditory stimuli included arbitrary vocal words.
For each item on the assessment, the assessor followed a script verbatim. Relations were shown
to the participant and then tested using sequential presentation or match-to-sample. During a
sequential presentation arrangement, the participant was presented with a comparison stimulus.
A different comparison stimulus was followed sequentially. The assessor then provided a verbal
statement indicating whether the sample stimulus was the same as the comparison stimulus or
not. The same stimulus was presented again by the assessor. This was followed sequentially by a
different comparison stimulus. The assessor provided another verbal statement that indicated
whether the sample stimulus was the same as the comparison stimulus or not. Following this, a
prior comparison stimulus was presented as a sample stimulus as well as a corresponding
comparison stimulus by the assessor. The assessor then asked, “Were those the same?” If
corresponding stimuli were presented, the participant would respond with “yes” for a correct
response. If unrelated stimuli are presented, the participant would respond with “no” for a correct
response. For match-to-sample tasks, a sample stimulus, as well as two comparison stimuli, were
presented. The assessor pointed to the sample stimulus and then to the comparison stimulus and
said, “This is the same as this”. The assessor would then present one of the previously presented
comparison stimuli as a sample stimulus. Two comparison stimuli were also presented. The
assessor would then point to the sample stimulus while saying “Find the same.” If the participant
pointed to the comparison stimulus that corresponds to the sample stimulus, a correct response
would have been recorded.
For reflexivity testing, the stimuli that were related are formally identical. For all other
relational tests, the related stimuli were arbitrary. This means that the stimuli used had no formal

31
similarities and it was very unlikely that the participants would have had a reinforcement history
with those specific stimuli. Tasks included in the reflexivity subtest of the PEAK Equivalence
Pre-assessment were matching identical stimuli. Tasks included in the symmetry subtest
involved the participant making a correct bidirectional response after being presented with a
relation between two stimuli. For example, the participant was told that stimulus A was the same
as stimulus B. The participant was then tested to see if stimulus A was selected when presented
with stimulus B. For testing transitivity relations, the assessor presented two relations to the
participant. A third derived relations would then be tested. For example, the participant was told
that stimuli A-B and stimuli B-C are the same. Stimulus A was then presented, and a correct
response was scored if the participant selected stimulus C demonstrating the relation between the
two stimuli. For testing equivalence relations, the participant was presented with three relations.
A fourth derived relation would be tested. For example, a participant was told that A-B, B-C, and
A-C. Stimulus C was then presented. A correct response was scored if the participant selected
stimulus A. If the participant earned a score of 0 for two consecutive items, the participant would
move on to the next relation type. The assessor would not provide reinforcement or feedback to
the participant throughout this assessment.
The PEAK Transformation Pre-assessment receptive subtest was also used in this study.
This subtest includes six relational frames that have 16 items each. Any reinforcers, such as
feedback, praise, or tangibles, were not provided to the participant during this assessment. This
assessment was conducted with no consequences for participant responses. To help maintain the
attention of the participants, the assessor could have offered the participant a break or a snack
after the completion of a certain number of items.

32
The receptive subtest of the PEAK Transformation Pre-assessment follows a structure of
presenting increasingly difficult questions within each frame. In this subtest, the participant used
selection-based responses to answer the questions presented. The assessor delivered instructions
to the participant verbatim from the assessor’s script. If the participant answered three
consecutive questions incorrectly, the assessor moved on to the next frame. The items in this
subtest had only one correct response. This means the items were scored as 0 or 1. The assessor
used data sheets and a writing utensil to record participant responses. Also, included in this
subtest were practice and instructional items. The practice items helped familiarize the
participant to the layout of the assessment, as well as, the expected method of responding.
Providing the learner with feedback and correcting errors, if any, made by the participant was
appropriate for the assessor to provide during practice questions. This occurred at the beginning
of each section included in the subtest. Instructional items provided the learner with information
needed for test items. These items were presented several times in a row to the participant. The
participant would not make a response for the instructional items, and therefore, these items were
not included in the participant score.
The RASC assessment consisted of 3 classes of stimuli. Each class contained 3 members
(A 1-3, B 1-3, and C1-3). A Surface Pro was used to train and test relations. To train A to B, a
SPOP procedure was used. A picture of the A1 animal combination stimulus was presented to
the participant. While the stimulus was presented, an audio recording of the corresponding CVC
B1 stimulus was played. For example, the participant was shown a picture of the cow baby
drawing (A1) while the audio recording said “RUQ” (B1). Next, a picture of the A2 animal
combination stimulus was presented to the participant and the corresponding CVC B2 audio

33
recording was played. Then, a picture of the A3 animal combination stimulus was presented to
the participant and the corresponding CVC B3 audio recording was played.
After each A to B relation has been trained once, the participant was tested on relating B1
to A1 using an MTS procedure. For this test, stimuli A1, A2, and A3 were presented to the
participant simultaneously. While these stimuli were presented an audio recording that stated
“find RUQ” (B1) was played. The participant made a selection by touching or pointing to one of
the stimuli presented. If the participant touched multiple stimuli, the assessor said, “pick one”.
This test repeated for two more trials. In each trial, the A stimuli were presented in a random
order. If the participant selected the correct response for all three trials, the participant moved on
in the assessment. If the participant did not select the correct response, the participant went back
to the A-B training. This process could have occurred up to two more times. If the participant
was unable to relate B1 to A1 after the third A to B training, the assessment was discontinued.
If the participant was able to relate B1-A1, the participant was represented with the SPOP
procedure to train A-B stimuli relations before moving on to the B2&3 to A2&3 test. For this
test, a MTS procedure was used. The participant was presented with the A1, A2, and A3 stimuli
simultaneously. An audio recording of the directive “Find WEX” (B2) or “Find SAZ” (B3) was
played in a random order (three trials of B2-A2 and three trials of B3-A3). The participant
selected a response by touching or pointing to an A stimulus. If the participant touched multiple
stimuli, the assessor could have said “pick one”. If the participant selected the correct response
for all six trials, the assessment continued. If the participant did not select the correct response
for all six trials, the assessment was discontinued.
In the next section of this assessment, the participant was trained to relate the C stimuli to
the corresponding B stimuli using a SPOP procedure. To do this, the participant was presented

34
with the non-primary color C1 stimulus. While the stimulus was presented, an audio recording of
the corresponding CVC B1 stimulus was played. For example, the participant was shown the
non-primary color magenta (C1) while an audio recording saying “RUQ” (B1) was played. Next,
the non-primary color C2 stimulus was presented to the participant while an audio recording of
the CVC B2 stimulus was played. Then, the participant was presented with the non-primary
color C3 stimulus while an audio recording of the CVC B3 stimulus was played. After training
the C stimuli to the B stimuli, the participant was tested on the B1 to C1 relation. For this test,
the participant was presented with the C1, C2, and C3 stimuli simultaneously while an audio
recording that stated “Find RUQ” (B1) was played. The participant made a selection by touching
or pointing to a picture of a C stimulus. If the participant touched multiple stimuli, the assessor
could have said “pick one”. This test repeated for two more trials. In each trial, the C stimuli
were presented in a random order. If the participant did not select the correct response for all
three trials, the participant went back to the training of C-B. This process could have occurred up
to two more times. If the participant did not select the correct response for all three trials of the
B1-C1 test after the C-B relation has been trained three times, the assessment was discontinued.
If the participant was able to select the correct response for all three trials after the B1-C1
relation had been tested one to three times, the participant was represented with the SPOP
training of the C-B stimuli relations before moving on to the B2&3 to C2&3 test. For this test, a
MTS procedure was used. The participant was presented with the C1, C2, and C3 stimuli
simultaneously. An audio recording of the directive “Find WEX” (B2) or “Find SAZ” (B3) was
played in a random order (three trials of B2-C2 and three trials of B3-C3). The participant
selected a response by touching or pointing to a C stimulus. If the participant touched multiple
stimuli, the assessor could have said “pick one”. If the participant selected the correct response

35
for all six trials, the assessment continued. If the participant did not select the correct response
for all six trials, the assessment was discontinued.
For the next section of the assessment, the participant was represented with the SPOP
procedure to train A-B and B-C relations. To do this, the participant was presented with a picture
of an animal combination A stimulus or a picture of a non-primary color C stimulus in a random
order. While the participant was presented with a stimulus, an audio recording of the
corresponding CVC B stimulus was played. For example, the participant was shown a picture of
an elephant butterfly (A2) or a picture of teal (C2) while the corresponding CVC audio recording
of “WEX” (B2) was played. After the training, the participant moved on to a transitivity test
which determined if a relation could be made for the A1 stimulus to the C1 stimulus. For this
test, a MTS procedure was used. The participant was presented with the C1, C2, and C3 stimuli
simultaneously. These stimuli appeared at the bottom of the screen. An audio recording of the
directive “find” was played followed by the timed appearance and disappearance of the A1
stimulus. The participant was presented with three trials of this test. In each trial the C stimuli
were presented in a random order. The participant made a selection by touching or pointing to
the correct C stimulus. If the participant selected multiple stimuli, the assessor could have said
“pick one”. If the participant selected the correct response for all three trials the assessment
continued. If the participant did not pick the correct response for all three trials the assessment
was discontinued.
If the participant was able to move on in the assessment, another MTS transitivity test
was presented. This tested the relation between the A2&3 stimuli to the C2&3 stimuli. For this
test, the participant was presented with the C1, C2, and C3 stimuli simultaneously. These stimuli
appeared at the bottom of the screen. An audio recording of the directive “find” was played

36
followed by the timed appearance and disappearance of the A2 or A3 stimuli. The participant
was presented with six trials of this test. In each trial the C stimuli were presented in a random
order at the bottom of the screen. The A stimuli also appeared and disappeared in a random
order. The participant made a selection by touching or pointing to the correct C stimulus. If the
participant selected multiple stimuli, the assessor could have said “pick one”. If the participant
selected the correct response for all six trials the assessment continued. If the participant did not
pick the correct response for all six trials the assessment was discontinued.
If the participant was able move on to the last section of the assessment, the C2&3 to
A2&3 relations were tested using a MTS procedure. For this test, the participant was presented
with the A1, A2, and A3 stimuli simultaneously. These stimuli appeared at the bottom of the
screen. An audio recording of the directive “find” was played followed by the timed appearance
and disappearance of the C2 or C3 stimuli. The participant was presented with 6 trials of this
test. In each trial the A stimuli were presented in a random order at the bottom of the screen. The
C stimuli also appeared and disappeared in a random order. The participant made a selection by
touching or pointing to the correct C stimulus. If the participant selected multiple stimuli, the
assessor could have said “pick one”.
Participant responses were recorded as correct or incorrect on the data sheet shown in
Appendix B. Total fluency of a relation was also recorded on the data sheet. To record fluency,
the implementation of the RASC assessment was recorded with an iPad through Zoom. The
assessor watched the video to record the amount of time that passed from the end of the Sd to the
participant response. This time was recorded on the participant data sheet. If the participant was
able to derive a relation after being tested, the time it took for the participant to master that

37
specific relation was calculated and recorded as the total fluency for that relation. It was
hypothesized that this will show the decay of fluency across nodal distance for each participant.
38
RESULTS
Intelligence Quotient Results
The participants’ scores for each assessment can be found in Table 1. To calculate IQ
scores for the participants in this study, researchers used three of the subtests included in the
WPPSI-IV. The three subtests were Information, Matrix Reasoning, and Picture Memory. The
raw scores for the Information subtest ranged from 0 to 23. The mean score for this subtest was 5
and the standard deviation was 6.97 across the participants included in this study. The raw scores
for the Matrix Reasoning subtest ranged from 0 to 15. The mean score for this subtest was 2 and
the standard deviation was 4.44 across the participants included in this study. The raw scores for
the Picture Memory subtest ranged from 0 to 14. The mean score for this subtest was 2 and the
standard deviation was 3.89 across the participants included in this study. The raw scores for
these subtests were converted into scaled scores for each participant. The scaled scores for the
Information subtest ranged from 1 to 15 across the participants included in this study. The mean
score for this subtest was 3 with a standard deviation of 4.11. The scaled scores for the Matrix
Reasoning subtest ranged from 1 to 12 across the participants included in this study. The mean
score for this subtest was 3 and the standard deviation was 3.88. The scaled scores for the Picture
Memory subtest ranged from 1 to 10 across the participants included in this study. The mean
score for this subtest was 2 and the standard deviation was 2.63. Once the scaled scores were
calculated, the scaled scores of each subtest were added together for each participant. The
assessor then used a conversion table to convert the sum of the scaled scores to calculate a full
scale IQ estimate for each participant (Sattler, Dumont, & Coalson, 2016). The full scale IQ
estimates ranged from 43 to 108. Due to time constraints, participant 19 was unable to receive an

39
IQ score. For this participant, IQ was calculated using the PEAK Equivalence score. An equation
used by Dixon, Belisle, & Stanley (2018) was used to calculate this full scale IQ score (y =
1.2436x + 49.131. Given that x = 8, total full scale estimated IQ for that participant was 59. The
mean total IQ estimate for the participants included in the study was 54. The standard deviation
for these participants was 19.26.
PEAK Equivalence and Transformation Results
To calculate scores for PEAK Equivalence and PEAK Transformation the assessor added
the participant’s correct number of responses. Because only the receptive PEAK Transformation
pre-assessment was implemented, the assessor added the participant’s correct number of
responses and multiplied that total by two. The PEAK E scores ranged from 0 to16 for the
participants included in this study. The participants’ mean score for PEAK E was 3 and the
standard deviation was 4.39. The PEAK T scores ranged from 0 to 60 for the participants
included in this study. Their mean PEAK T score was 8 and the standard deviation was 15.77.
Total PEAK scores were calculated for each participant by adding their PEAK E and PEAK T
scores together. Total PEAK scores ranged from 0 to 72 for the participants included in this
study. The mean total PEAK score was 11 with a standard deviation of 18.77. Many of the
participants included in this study were able to derive reflexive relations but were unable to
derive symmetrical relations.
Relational Acquisition of Skills in Children with Autism Results
For the RASC assessment, seven out of 21 participants (33%) mastered the B1-A1
relation when tested after being trained on the A-B relation. Of these seven participants, four
40
(57%) mastered the relation after being trained once, two (29%) mastered the relation after being
trained twice, and one (14%) mastered the relation after being trained a third time. Out of the
seven participants who moved on to the second relation, three (43%) mastered the B2 & 3 to A2
&3 relation after being represented with the A1-B1 training. Out of the three participants who
moved on to the next relation, two (67%) mastered the B1-C1 relation after being trained on the
C-B relation. Both participants (100%) mastered the relation after being trained one time. Of the
two remaining participants, only one (50%) mastered the B2 & 3 to C2 & 3 relation after being
represented with the C-B training. This participant also mastered the A1-C1 relation after being
trained on the C-A relation, the A2 & 3- C2-3 after being represented with the C-A relation, and
the C2 &3-A2 & 3 relation. Therefore, only one participant was able to complete the entire
assessment such that obtaining a difference between the symmetry and transitivity rate was not
possible for most subjects. These data were therefore omitted from the remainder of the analyses.
The data from this participant are however described below to aid in the development of future
testing models because this was a pilot evaluation of this method.
To measure fluency for the RASC assessment, the time between the end of the Sd and the
participant’s response (latency) was measured. For the B1-A1 relation, there were three trials in
which the participant had to respond correctly to master the relation. If the participant mastered
the B1-A1 relation the three latency times were added together to measure the total fluency of
that relation. If the participant mastered multiple relations, the latency times were added for each
relation that was mastered. That number was then divided by the number of relations that the
participant mastered. For example, participant 2 mastered three relations. The first relation took
the participant 30.66 seconds to master. The second relation took the participant 15.78 seconds to
master. The third relation took the participant 17.8 seconds to master. These three times were

41
then added together to show that the participant mastered three relations in 64.24 seconds. This
time was then divided by the number of relations the participant mastered (3), to get an average
fluency score. This participant’s average fluency was calculated as 21.41 seconds. The
participants included in this study who were unable to master the first relation, thus
discontinuing this assessment, scored a 0 for average fluency. Average fluency for all
participants in this study ranged from 0 to 54.05 seconds.
Statistical Analyses
A Pearson correlation measures the statistical relationship between two variables. Values
.70 and above are said to have strong positive correlations and values .29 and below are said to
have weak positive correlations. A Pearson correlation matrix was created for the scores of the
assessments implemented in this study. Figure 1 shows this Matrix. Correlations between the
assessments ranged from r = .16 to r = .95. For the Information subtest, a strong positive
correlation was found with the total IQ estimate (r = .95) and a moderate positive correlation was
found with the Picture Memory subtest (r = .59). For Matrix Reasoning, a strong positive
correlation was found with the total IQ estimate (r = .88) and a moderate correlation was found
with Picture Memory (r = .44). A strong positive correlation was found between Picture Memory
and the total estimated IQ (r = .70). A moderate positive correlation was found between Picture
Memory and Matrix Reasoning (r = .44). For total estimated 1Q, a strong positive correlation
was found with Information (r = .95) and a strong positive correlation was with Picture Memory
(r = .70). A strong positive correlation was found between PEAK total score and total estimated
IQ (r = .94) and a moderate positive correlation was found between PEAK total score and
Picture Memory (r = .66). When RASC scores were added to the correlation matrix, it showed

42
that the RASC had a strong positive correlation with Matrix Reasoning (r = .78), moderate
correlations with Information (r = .54), total IQ estimates (r = .49), and total PEAK score
estimates (r = .57), and a weak positive correlation with Picture Memory. A Pearson correlation
matrix was also created to correlate total estimated IQ scores and PEAK Equivalence scores
(Figure 2) and to correlate total estimated IQ scores and PEAK Transformation scores (Figure 3).
These matrices’ indicate a moderate positive correlation of 0.68 between total estimated IQ
scores and PEAK Equivalence scores and a strong positive correlation of 0.93 between total
estimated IQ scores and PEAK Transformation scores.
Linear regressions were ran between the participants’ total PEAK scores and total
estimated IQ scores (Table 2), the total estimated IQ scores and the PEAK Equivalence scores
(Table 3), and the total estimated IQ scores and the PEAK Transformation scores (Table 4). An
equation for a linear regression was calculated and graphed. For total PEAK scores and total
estimated IQ the equation was y= 1.013*x + 43.62 (Figure 4). For total estimated IQ scores and
PEAK Equivalence scores the equation was y= 3.061*x + 45.90 (Figure 5). For total estimated
IQ scores and PEAK Transformation scores the equation was y= 1.202*x + 44.78 (Figure 6).
Data were then graphed using these equations. We found that PEAK Equivalence had the
strongest correlation with total estimated IQ scores while PEAK Transformation had the weakest
correlation with total estimated IQ scores. These equations help determine the relationship
between the assessments being correlated. A positive relationship will produce a line that slopes
upward, a negative relationship will produce a line that slopes downward, and if no relationship
is found, a flat line will be produced.
The r-squared values were calculated for each correlation. The r-squared values range
from 0 to 1. The r-squared value for the correlation between total PEAK scores and total

43
estimated IQ scores was r = .88. The r-squared value for the correlation between total estimated
IQ scores and PEAK E scores was r = .47. The r-squared value for the correlation between total
estimated IQ scores and PEAK T scores was r = .86. High r-squared values account for more
variance in the data. A visual display of high r-squared values will show data points that are
closer to the line of regression than low r-squared values.
According to these data presented, researchers found strong correlations between PEAK
scores and total estimated IQ, thus agreeing with extensive research that had been conducted on
the relationship between PEAK and IQ. It was also found that the RASC assessment was not a
sensitive enough measure to correlate with PEAK scores or total IQ estimates.
Secondary Analysis with Strong Performers Removed
Upon further investigation of these data, data points belonging to the strongest
performers were eliminated. Additional analyses were ran on the new data set. Table 5 shows a
Pearson Matrix Correlation between total estimated IQ scores and total PEAK scores minus the
top five scores. A weak positive correlation between these assessments was found. A linear
regression was then run on these data. The equation of a line that was calculated from these data
is shown in Figure 7. The equation Y = 0.08696*X + 44.22 was used to graph this correlation
(Figure 8). The P value for this correlation was p = .691. The r-squared value for this correlation
was r = .01.
When the top 5 performers’ scores were eliminated from the data set, correlations
between total estimated IQ and total PEAK scores weakened. Total PEAK scores for these
learners had a higher variance than their IQ scores, thus showing differences between learners. It
has been discussed that the WPPSI-IV might not be appropriate for those early learners who are

44
highly impacted by ASD due to the restricted range of IQ scores and the high estimation of total
IQ. Research conducted by Scattone, Raggio, and May discusses the importance of using
multiple assessments when trying to calculate IQ for individuals with autism (2012).

45
DISCUSSION
Summary of Results
Total PEAK scores and total estimated IQ scores were shown to be related by strong
positive correlations. The highest positive relationship was found between total PEAK scores
and total estimated IQ scores (r = .94). A moderate positive relationship was found between total
estimated IQ scores and PEAK E scores (r = .68). A high positive relationship was found
between total estimated IQ scores and PEAK T scores (r = .93). These results extend previous
research that has been conducted on the relationship between PEAK and IQ. However, when the
top 5 performers’ scores were eliminated from the data set, the relationship between total
estimated IQ and total PEAK scores changed significantly (r = .11). For these participants, total
PEAK scores had a higher variance than their IQ scores. This shows the differences between
learners at a lower level. For the WPPSI-IV a participant who has a total raw score of 0 across
the three subtest used in this study and a participant who has a total raw score of 5 across the
three subtest used in this study both receive a total estimated IQ of 43. A more sensitive measure
of intelligence would be beneficial for children with more severe intellectual disabilities.
After the pilot test of the RASC assessment, it was determined that it was not sensitive
enough to show a correlation with PEAK and IQ. More research needs to be conducted on the
RASC assessment to create a more reliable assessment procedure.
Implications
This study found that total estimated IQ scores have a strong positive correlation with
PEAK scores. This finding replicates findings in previous studies that have evaluated the

46
correlation between PEAK and IQ. Researchers such as Dixon, Whiting, Rowsey, and Belisle
(2014b) have suggested that the PEAK assessment and IQ test target several of the same skills.
This means that these assessments will consistently yield similar results (Dixon et al., 2014b).
Dixon, Belisle, and Stanley (2018) suggest that IQ and derived relational responding are related.
They propose that IQ and derived relational responding are rooted in human language and
cognition. The results of their study showed that individuals who performed better on IQ
assessments also demonstrated higher levels of derived relational responding (Dixon et al.,
2018).
When these data from the present study were visually inspected, it was noticed that the
top five participant scores were outliers. When the top five performers scores were eliminated
from the data, the correlations between total PEAK scores and total IQ estimates significantly
weakened. This result shows that the IQ and PEAK still correlate. The participant scores that
were included after the top five scores were eliminated showed low scores on PEAK E, PEAK T,
and the IQ subtests. This further supports the research suggesting IQ and PEAK are related
constructs.
Differences in intelligence and derived relational responding were difficult to detect in
lower scores on the IQ and PEAK E and PEAK T assessments. Because of this, more sensitive
measures are needed. Scattone, Raggio, and May (2012) discuss using multiple assessments
when trying to calculate IQ for individuals with autism. In doing so, a more sensitive measure of
IQ can be determined. This is especially beneficial for individuals who score low on IQ or other
assessments. The RASC assessment was created to be a more sensitive measure of derived
relational responding.

47
The RASC assessment was initially created to become a quantitative method to directly
measure derived relational responding as a generalized operant. It was our goal for this measure
to correlate with PEAK. If this method correlated with PEAK, it could be used to guide PEAK
implementers on what the ability level of a particular child is, as well as, where to start the child
in PEAK programming. It was thought that the RASC assessment would be a faster assessment
tool that would be as reliable as the PEAK E and PEAK T preassessments at scoring a child’s
ability to derive relations.
The RASC assessment, however, seemed to be a less sensitive measure of derived
relational responding. A floor effect was found in the scores for this assessment. A floor effect
occurs when the questions are too difficult for the population of individuals being assessed. In
this study, 18 of the 21 participants scored a 0 on this assessment. Two participants scored a 1 on
this assessment. One participant scored a 4 on this assessment. Changes could be made on the
RASC assessment to make it a more sensitive measure. Changing the stimuli that was used could
be a possible solution. For example, complex animal combination stimuli could be changed to a
basic symbol (i.e. @, #, or %). or a shape (i.e. trapezoid, pentagon, or chevron). Different
procedures to train and test relations could also be used. Using the SPOP procedure to train
relations and the MTS procedure to test relations could occur more times before discontinuing a
relation, however, this will take more time to assess individuals.
Limitations
Although this study agrees with previous research conducted on the correlation between
the PEAK Relational Training System and IQ, many limitations were found. One limitation of
this present study was the number of participants assessed. In this study, the minimum number of

48
participants were assessed. Although we did assess the minimum number of participants, having
a larger number of participants would better support the correlation between total estimated IQ
scores, PEAK E, and PEAK T scores.
The second limitation of the present study was the age range of the participants. This
study included participants between the ages of two years to six years. Some of these learners
lacked prerequisite skills, such as sitting in a chair, attending to different materials, and pointing,
that are required for the completion of these assessments. Assessing more participants who are
above the age of six could potentially show correlations between total estimated IQ scores,
PEAK E scores, and PEAK T scores for participants who receive higher scores on the
assessments. Assessing children who score higher on PEAK and IQ using the RASC, could
potentially show a positive correlation between these three assessments. This data would further
support the idea to research and expand upon the method of obtaining the d coefficient.
The third limitation of the present study were the unwanted behaviors exhibited by the
participants. Data from the participants who showed unwanted behaviors were included in this
study. Final scores on the assessments might not accurately reflect the ability of the participant if
the assessment was discontinued due to unwanted behavior instead of inaccurate responding.
The fourth limitation of the present study was that the IQ tests were implemented by
trained graduate students. IQ test are usually only administered by licensed psychologists,
however the results of the IQ tests were not disclosed to participant’s family or used for any
other purpose other than obtaining correlations between total estimated IQ scores, PEAK E
scores, and PEAK T scores.
The fifth limitation of this present study in the high minimum IQ score for the
participants. The WPPSI-IV subtests of Information, Matrix Reasoning, and Picture Memory

49
were used for all participants regardless of age. As discussed previously, a participant that scored
a total of 0 for all three subtests used in this study and a participant that scored a total of 5 for all
three subtest used in this study both received the same estimated IQ score of 43. This could be
due to the subtests used, however, it still shows that the WPPSI-IV might not be an accurate
measure for the participants included in this study.
The final limitation of the present study was the floor effect of the scores obtained on the
RASC assessment. A floor effect occurs when most of the participants’ scores fall near the
bottom. This suggests that the directives could have been too difficult for the group of
participants we assessed. Fluency as a measure included in the RASC assessment was unable to
be graphed. This occurred because not enough of the participants mastered relations, causing a
low number of data points. Because of this, we were unable to measure the decay of fluency
across nodal distance.
Future Avenues of Research
Future avenues of research could include replicating the study with a larger and a higher
age range of participants to determine if the assessment correlations would correspond to the
correlations found in this study. Age classifications such as early learners, school aged,
adolescents, etc. could be used to compare the correlations between IQ and PEAK assessments.
This could show if stronger correlations occur within a particular age group. These data could
also be displayed by looking at ranges of test scores. Researchers determine if there is a specific
point in which the correlation between derived relational responding and IQ begin to deteriorate.
These participants could also be assessed using the RASC assessment. Researchers could
compare the results of the RASC in the same manner, looking to see if RASC scores show an

50
increasing correlation with IQ and PEAK as the age of the participants increase or as scores on
the IQ and PEAK assessments increase.
A second avenue of future research could include replicating the study with participants
who do not display unwanted behavior during testing and compare it to participant who do
display unwanted behaviors during testing. Researchers determine if the correlations between IQ
and PEAK differ between the two groups, potentially showing the negative affect unwanted
behavior has on assessment scores.
A third avenue of future research could examine the differences in IQ scores using
different tools that measure intelligence. Researchers could then determine the most sensitive
measure of IQ and if different methods of determining IQ are more beneficial in certain
populations.
Future research could also include creating a more sensitive version of the RASC
assessment by creating different stimuli or using alternative procedures to implement the
assessment. Scores from the new RASC assessment can be correlated with IQ and PEAK scores
to determine if the new RASC assessment has a strong positive correlation with IQ and PEAK
scores. This could help create a better assessment while combating floor effects found in the
present study. These different research opportunities will better strengthen the hypothesis
presented in this study.

51
REFERENCES
American Psychiatric Association. (2000). Diagnostic and statistical manual of mental disorders
(4th text rev. ed.). Washington, DC: American Psychiatric Association
American Psychiatric Association. (2013). Diagnostic and statistical manual of mental disorders
(DSM-V) (5th ed.). Washington, DC: American Psychiatric Association
Anderson, S. R., Avery, D. L., DiPietro, E. K., Edwards, G. L., & Christian, W. P. (1987).
Intensive home-based intervention with autistic children. Education & Treatment of
Children, 10, 353-366.
Barkley, R. A. (1997a). Behavioral inhibition, sustained attention, and executive functions:
Constructing a unifying theory of ADHD. Psychological Bulletin, 121(1), 65–94.
http://dx.doi.org/10.1037/0033-2909.121.1.65
Barkley, R. A. (1997b). Adhd and the nature of self-control. New York: Guilford Press.
Barnes-Holmes, D., Barnes-Holmes, Y., & Cullinan, V. (2001). Education. In S. C. Hayes, D.
Barnes-Holmes, & B. Roche (Eds.) Relational frame theory: A post-Skinnerian account
of human language and cognition (pp 181-196). New York: Plenum.
Barnes-Holmes, Y., Barnes-Holmes, D., & Mchugh, L. (2004). Teaching derived relational
responding to young children. Journal of Early and Intensive Behavior Intervention, 1(1),
3–12. http://dx.doi.org/10.1037/h0100275
Bejno, H., Johansson, S., Ramnero, J., Grimaldi, L., & Cepeda, R. (2018). Emergent Language
Responses Following Match-to-Sample Training among Children with Autism Spectrum
Disorder. International Journal of Psychology and Psychological Therapy, 18, 1–14.
Belisle, J., & Dixon, M. R. (2020). Relational Density Theory: Nonlinearity of Equivalence
Relating Examined through Higher-Order Volumetric-Mass-Density. Perspectives on
Behavior Science. doi: 10.1007/s40614-020-00248-w
Belisle, J., Dixon, M. R., & Stanley, C. R. (2018). The Mediating Effects of Derived Relational
Responding on the Relationship Between Verbal Operant Development and IQ. Behavior
Analysis in Practice, 11(4), 411–416. http://dx.doi.org/10.1007/s40617-018-0215-2
Belisle, J., Dixon, M. R., Stanley, C. R., Munoz, B., & Daar, J. (2016). Teaching foundational
perspective-taking skilss to children with autism using the PEAK-T curriculum: Single-
reversal "I-You" deictic frames. Journal of Applied Behavior Analysis, 49, 1–5.
http://dx.doi.org/10.1002/jaba.324

52
Bibby, P., Eikeseth, S., Martin, N. T., Mudford, O. C., & Reeves, D. (2001). Progress and
outcomes for children with autism receiving parent-managed intensive
interventions. Research in Developmental Disabilities, 22, 425–447.
Birnbrauer, J. S., & Leach, D. J. (1993). The Murdoch Early Intervention Program After 2
Years. Behaviour Change, 10(2), 63–74. http://dx.doi.org/10.1017/s0813483900005556
Braam, S. J., & Poling, A. (1983). Development of intraverbal behavior in mentally retarded
individuals through transfer of stimulus control procedures: Classification of verbal
responses. Applied Research in Mental Retardation, 4(4), 279–302.
http://dx.doi.org/10.1016/0270-3092(83)90030-9
Brady, D. I., Schwean, V. L., Saklofske, D.H., McCrimmon, A. W., Montgomery, J. M., &
Thorne, J. K. (2013). Conceptual and perceptual set-shifting executive abilities in young
adults with Asperger’s syndrome. Research in Autism Spectrum Disorders, 7, 1631-1637.
http://dx.doi.org/10.1016/j.rasd.2013.09.009
Byrne, B. L., Rehfeldt, R. A., & Aguirre, A. A. (2014). Evaluating the Effectiveness of the
Stimulus Pairing Observation Procedure and Multiple Exemplar Instruction on Tact and
Listener Responses in Children with Autism. The Analysis of Verbal Behavior, 30(2),
160–169. http://dx.doi.org10.1007/s40616-014-0020-0
Carr, D., Wilkinson, K. M., Blackman, D., & McIlvane, W. J. (2000). Equivalence classes in
individuals with minimal verbal repertoires. Journal of the Experimental Analysis of
Behavior, 74(1), 101–114. http://dx.doi.org/10.1901/jeab.2000.74-101
Cassidy, S., Roche, B., & Hayes, S. C. (2011). A Relational Frame Training Intervention to
Raise Intelligence Quotients: A Pilot Study. The Psychological Record, 61(2), 173–198.
http://dx.doi.org/10.1007/bf03395755
Chan, A. S., Cheung, M.-C., Han, Y. M., Sze, S. L., Leung, W. W., Man, H. S., & To, C. Y.
(2009). Executive function deficits and neural discordance in children with Autism
Spectrum Disorders. Clinical Neurophysiology, 120(6), 1107–1115.
http://dx.doi.org/10.1016/j.clinph.2009.04.002
Chan, A. S., Han, Y. M., Leung, W. W.-M., Leung, C., Wong, V. C., & Cheung, M.-C. (2011).
Abnormalities in the anterior cingulate cortex associated with attentional and inhibitory
control deficits: A neurophysiological study on children with autism spectrum
disorders. Research in Autism Spectrum Disorders, 5(1), 254–266.
http://dx.doi.org/10.1016/j.rasd.2010.04.007
Clayton, M. C., & Hayes, L. J. (2004). A comparison of Match-to-Sample and Respondent-Type
training of equivalence classes. The Psychological Record, 54(4), 579–602.
http://dx.doi.org/10.1007/bf03395493

53
Critchfield, T. S., Barnes-Holmes, D., & Dougher, M. J. (2018). Editorial: What Sidman Did --
Historical and Contemporary Significance of Research on Derived Stimulus
Relations. Perspectives on Behavior Science, 41(1), 9–32.
http://dx.doi.org/10.1007/s40614-018-0154-9
Cuvo, A. J., & Riva, M. T. (1980). Generalization and transfer between comprehension and
production: a comparison of retarded and nonretarded persons. Journal of Applied
Behavior Analysis, 13(2), 315–331. http://dx.doi.org/10.1901/jaba.1980.13-315
Damasio, A. R., & Maurer, R. G. (1978). A Neurological Model for Childhood Autism. Archives
of Neurology, 35(12), 777–786.
http://dx.doi.org/10.1001/archneur.1978.00500360001001
Denckla, M, B. (1996). A theory and model of executive function: A neuropsychological
perspective. In G. R. Lyon, & N. A. Kransnegor (Eds.), Attention, memory, and executive
function (pp. 263-277). Baltimore, MD: Paul H. Brookes Pub. Co.
Dixon, M. R. (2014a). The PEAK Relational Training System: Direct Training Module.
Carbondale, IL: Shawnee Scientific Presschildren, 1997-2008. Pediatrics, 127(6), 1034-
1042.
Dixon, M. R. (2014b). The PEAK Relational Training System: generalization module.
Carbondale: Shawnee Scientific Press.
Dixon, M. R. (2015). P.E.A.K. relational training system: equivalence. Carbondale, IL: Shawnee
Scientific Press, LLC.
Dixon, M. R. (2016). P.E.A.K relational training system: Transformation. Carbondale, IL:
Shawnee Scientific Press, LLC.
Dixon, M. R., Belisle, J., & Stanley, C. R. (2018). Derived Relational Responding and
Intelligence: Assessing the Relationship Between the PEAK-E Pre-assessment and IQ
with Individuals with Autism and Related Disabilities. The Psychological Record, 68(4),
419–430. http://dx.doi.org/10.1007/s40732-018-0284-1
Dixon, M. R, Belisle, J., Stanley, C., Rowsey, K., Daar, J. H., & Szekely, S. (2014a). Toward a
behavior analysis of complex language for children with autism: Evaluating the
relationship between PEAK and the VB-MAPP. Journal of Developmental and Physical
Disabilities, 27(2), 223–233. https://doi.org/10.1007/s10882-014-9410-4
Dixon, M. R., Belisle, J., Stanley, C. R., Speelman, R. C., Rowsey, K. E., Kime, D., & Daar, J.
H. (2016). Establishing derived categorical responding in children with disabilities using
the PEAK-E curriculum. Journal of Applied Behavior Analysis, 50(1), 134–145.
http://dx.doi.org/10.1002/jaba.355

54
Dixon, M. R., Paliliunas, D., Barron, B. F., Schmick, A. M., & Stanley, C. R. (2019).
Randomized Controlled Trial Evaluation of ABA Content on IQ Gains in Children with
Autism. Journal of Behavioral Education. http://dx.doi.org/10.1007/s10864-019-09344-7
Dixon, M. R., Small, S. L., & Rosales, R. (2007). Extended analysis of empirical citations with
Skinner’s Verbal Behavior: 1984–2004. The Behavior Analyst, 30(2), 197–209.
http://dx.doi.org/10.1007/bf03392155
Dixon, M. R., Whiting, S. W., Rowsey, K., & Belisle, J. (2014b). Assessing the relationship
between intelligence and the PEAK relational training system. Research in Autism
Spectrum Disorders, 8(9), 1208–1213. http://dx.doi.org/10.1016/j.rasd.2014.05.005
Dymond, S., O’Hora, D., Whelan, R., & O’Donovan, A. (2006). Citation Analysis of Skinner’s
Verbal Behavior: 1984–2004. The Behavior Analyst, 29(1), 75–88.
http://dx.doi.org/10.1007/bf03392118
Eikeseth, S., Smith, T., Jahr, E., & Eldevik, S. (2007). Outcome for Children with Autism who
Began Intensive Behavioral Treatment Between Ages 4 and 7. Behavior
Modification, 31(3), 264–278. http://dx.doi.org/10.1177/0145445506291396
Eldevik, S., Eikeseth, S., Jahr, E., & Smith, T. (2006). Effects of Low-Intensity Behavioral
Treatment for Children with Autism and Mental Retardation. Journal of Autism and
Developmental Disorders, 36(2), 211–224. http://dx.doi.org/10.1007/s10803-005-0058-x
Geurts, H. M., Verté, S., Oosterlaan, J., Roeyers, H., & Sergeant, J. A. (2004). How specific are
executive functioning deficits in attention deficit hyperactivity disorder and
autism? Journal of Child Psychology and Psychiatry, 45(4), 836–854.
http://dx.doi.org/10.1111/j.1469-7610.2004.00276.x
Goldstein, G., Johnson, C. R., & Minshew,N. J. (2002). Attentional processes in autism. Journal
of Autism and Developmental Disorders, 31, 433-440.
http://dx.doi.org/10.1023/A:1010620820786
Greer, R. D., & Ross, D. E. (2008). Verbal behavior analysis: Inducing and expanding new
verbal capabilities in children with language delays. New York, NY: Allyn & Bacon.
Harris, S. L., & Handleman, J. S. (2000). Age and IQ at intake as predictors of placement for
young children with autism: A four-to six-year follow-up. Journal of Autism and
Developmental Disorders, 30, 137–142.
Hayes, S. C., Barnes-Holmes, D., & Roche, B. (2001a). Relational Frame Theory: A post-
Skinnerian account of human language and cognition. New York: Plenum Press.
Hayes, S. C., Fox, E., Gifford, E.V., Wilson, K. G., Barnes-Holmes, D., & Healy, O. (2001b).
Derived relational responding as learned behavior. In S. C. Hayes, D. Barnes-Holmes, &

55
B. Roche, (Eds.) Relational frame theory: A post-Skinnerian account of human language
cognition, (pp. 21-50). New York: Plenum.
Healy, O., Barnes-Holmes, D., & Smeets, P. M. (2000). Derived relational responding as
generalized operant behavior. Journal of the Experimental Analysis of Behavior, 74(2),
207–227. http://dx.doi.org/10.1901/jeab.2000.74-207
Howlin, P., Baron-Cohen, S., & Hadwin, J. (1999). Teaching children with autism to mind-read:
A practical guide for teachers and parents. West Sussex, UK: Wiley.
Hughes, C., Russell, J., & Robbins, T. W. (1994). Evidence for executive dysfunction in
autism. Neuropsychologia, 32(4), 477–492. http://dx.doi.org/10.1016/0028-
3932(94)90092-2
Jocelyn, L. J., Casiro, O. G., Beattie, D., Bow, J., & Kneisz, J. (1998). Treatment of Children
with Autism: A randomized control trial to evaluate a caregiver-based intervention
program in community day-care centers. Journal of Developmental & Behavioral
Pediatrics, 19(5), 326–334. http://dx.doi.org/10.1097/00004703-199810000-00002
Kaland, N., Smith, L., & Mortensen, E. L. (2007). Brief Report: Cognitive Flexibility and
Focused Attention in Children and Adolescents with Asperger Syndrome or High-
Functioning Autism as Measured on the Computerized Version of the Wisconsin Card
Sorting Test. Journal of Autism and Developmental Disorders, 38(6), 1161–1165.
http://dx.doi.org/10.1007/s10803-007-0474-1
Kelley, E., Paul, J. J., Fein, D., & Naigles, L. R. (2006). Residual Language Deficits in Optimal
Outcome Children with a History of Autism. Journal of Autism and Developmental
Disorders, 36(6), 807–828. http://dx.doi.org/10.1007/s10803-006-0111-4
Laurer, T., & Belisle, J. (2019). Neurological Correlates of Derived Relational Responding and
Autism: A Synthetic Review of the Literature.
Lezak, M. D. (1995). Neuropsychological assessment (3rd edn). New York: Oxford University
Press.
Leader, G., & Barnes-Holmes, D. (2001). Establishing Fraction-Decimal Equivalence Using A
Respondent-Type Training Procedure. The Psychological Record, 51(1), 151–165.
http://dx.doi.org/10.1007/bf03395391
Leader, G., Barnes, D., & Smeets, P. M. (1996). Establishing Equivalence Relations Using a
Respondent-Type Training Procedure. The Psychological Record, 46(4), 685–706.
http://dx.doi.org/10.1007/bf03395192
Lopez, B. R., Lincoln, A. J., Ozonoff, S., & Lai, Z. (2005). Examining the Relationship between
Executive Functions and Restricted, Repetitive Symptoms of Autistic Disorder. Journal

56
of Autism and Developmental Disorders, 35(4), 445–460.
http://dx.doi.org/10.1007/s10803-005-5035-x
Lord, C. (1996). Language in high-functioning adolescents with autism: Questions about
deviance and delay. In D.Cicchetti, & S. L.Toth (Eds.), Adolescence: Opportunities and
challenges. Rochester symposium on developmental psychology. Vol. 7 (pp. 149-165).
Rochester, NY: University of Rochester Press.
Lord, C., & McGee, J. P. (Eds.). (2001). Educating children with autism. Committee on
Educational Interventions for Children With Autism, Division of Behavioral and Social
Sciences and Education, National Research Council. Washington, DC: National
Academy Press.
Lovaas, O. I. (1981). Teaching developmentally disabled children: The me book. Baltimore, MD:
University Park.
Lovaas, O. I. (1987). Behavioral treatment and normal educational and intellectual functioning in
young autistic children. Journal of Consulting and Clinical Psychology, 55(1), 3–9.
http://dx.doi.org/10.1037//0022-006x.55.1.3
Luciano, M. C. (1986). Acquisition, maintenance, and generalization of productive intraverbal
behavior through transfer of stimulus control procedures. Applied Research in Mental
Retardation, 7(1), 1–20. http://dx.doi.org/10.1016/0270-3092(86)90014-7
Magiati, I., Charman, T., & Howlin, P. (2007). A two-year prospective follow-up study of
community-based early intensive behavioural intervention and specialist nursery
provision for children with autism spectrum disorders. Journal of Child Psychology and
Psychiatry, 48(8), 803–812. http://dx.doi.org/10.1111/j.1469-7610.2007.01756.x
McEachin, J. J., Smith, T., & Lovaas, O. I. (1993). Long-term outcome for children with autism
who received early intensive behavioral treatment. American Journal on Mental
Retardation, 97, 359–372.
Mckeel, A., & Matas, J. (2017). Utilizing PEAK Relational Training System to Teach Visual,
Gustatory, and Auditory Relations to Adults with Developmental Disabilities. Behavior
Analysis in Practice, 10(3), 252–260. http://dx.doi.org/10.1007/s40617-017-0194-8
McLay, L. K., Sutherland, D., Church, J., & Tyler-Merrick, G. (2013). The formation of
equivalence classes in individuals with autism spectrum disorder: A review of the
literature. Research in Autism Spectrum Disorders, 7(2), 418–431.
http://dx.doi.org/10.1016/j.rasd.2012.11.002
Minshew, N. J., Meyer, J., & Goldstein, G. (2002). Abstract reasoning in autism: A
disassociation between concept formation and concept
identification. Neuropsychology, 16(3), 327–334. http://dx.doi.org/10.1037//0894-
4105.16.3.327

57
Montoya-Rodríguez, M. M., Molina, F. J., & McHugh, L. (2016). A Review of Relational Frame
Theory Research Into Deictic Relational Responding. The Psychological Record, 67(4),
569–579. http://dx.doi.org/10.1007/s40732-016-0216-x
Murphy, C., & Barnes-Holmes, D. (2010). Establishing Five Derived Mands In Three
Adolescent Boys With Autism. Journal of Applied Behavior Analysis, 43(3), 537–541.
http://dx.doi.org/10.1901/jaba.2010.43-537
National Academy Press. (2001). Educating children with autism. Washington, DC.
O’Brien, M., Tiernan, A. M., & Holloway, J. (2017). Teaching Phonics to Preschool Children
with Autism Using Frequency-Building and Computer-Assisted Instruction. Journal of
Developmental and Physical Disabilities, 30(2), 215–237. doi: 10.1007/s10882-017-
9581-x
O’Connor, J., Rafferty, A., Barnes-Holmes, D., & Barnes-Holmes, Y. (2009). The Role of
Verbal Behavior, Stimulus Nameability, and Familiarity on the Equivalence
Performances of Autistic and Normally Developing Children. The Psychological
Record, 59(1), 53–74. http://dx.doi.org/10.1007/bf03395649
Ozonoff, S. (1997). Components of executive function in autism and other disorders. In J.
Russell (Ed.), Autism as an executive disorder (pp. 179-211). Oxford: Oxford University
Press.
Ozonoff, S., Cook, I., Coon, H., Dawson, G., Joseph, R. M., Klin, A., McMahon, W., Minshew,
N., Munson, J., Pennington, B., Rogers, S., Spence, M., Tager-Flusberg, H., Volkmar, F.,
& Wrathall, D. (2004). Performance on Cambridge Neuropsychological Test Automated
Battery Subtests Sensitive to Frontal Lobe Function in People with Autistic Disorder:
Evidence from the Collaborative Programs of Excellence in Autism Network. Journal of
Autism and Developmental Disorders, 34(2), 139–150.
http://dx.doi.org/10.1023/b:jadd.0000022605.81989.cc
Partington, J. W., & Bailey, J. S. (1993). Teaching intraverbal behavior to preschool
children. The Analysis of Verbal Behavior, 11(1), 9–18.
http://dx.doi.org/10.1007/bf03392883
Pennington, B. F., & Ozonoff, S. (1996). Executive Functions and Developmental
Psychopathology. Journal of Child Psychology and Psychiatry, 37(1), 51–87.
http://dx.doi.org/10.1111/j.1469-7610.1996.tb01380.x
Petursdottir, A. I., & Devine, B. (2017). The impact of Verbal Behavior on the scholarly
literature from 2005 to 2016. The Analysis of Verbal Behavior, 33(2), 212–228.
http://dx.doi.org/10.1007/s40616-017-0089-3

58
Reader, M. J., Harris, E. L., Schuerholz, L. J., & Denckla, M. B. (1994). Attention deficit
hyperactivity disorder and executive dysfunction. Developmental
Neuropsychology, 10(4), 493–512. http://dx.doi.org/10.1080/87565649409540598
Reed, D. D., & Luiselli, J. K. (2016). Promoting the emergence of advanced knowledge: A
review of PEAK Relational Training System: Direct Training Module by Mark R. Dixon.
[Review of the book PEAK Relational Training System: Direct Training Module, by M.
R. Dixon]. Journal of Applied Behavior Analysis, 49, 205-211. https://dx.doi.org/10.
1002/jaba.281
Rehfeldt, R. A. (2011). Toward A Technology Of Derived Stimulus Relations: An Analysis Of
Articles Published In The Journal Of Applied Behavior Analysis, 1992–2009. Journal of
Applied Behavior Analysis, 44(1), 109–119. http://dx.doi.org/10.1901/jaba.2011.44-109
Reichow, B., & Wolery, M. (2008). Comprehensive Synthesis of Early Intensive Behavioral
Interventions for Young Children with Autism Based on the UCLA Young Autism
Project Model. Journal of Autism and Developmental Disorders, 39(1), 23–41.
http://dx.doi.org/10.1007/s10803-008-0596-0
Roche, B., & Barnes, D. (1997). A transformation of respondently conditioned stimulus function
in accordance with arbitrarily applicable relations. Journal of the Experimental Analysis
of Behavior, 67(3), 275–301. http://dx.doi.org/10.1901/jeab.1997.67-275
Roche, B., Barnes-Holmes, D., Barnes-Holmes, Y., Smeets, P. M., & Mcgeady, S. (2000).
Contextual Control over the Derived Transformation of Discriminative and Sexual
Arousal Functions. The Psychological Record, 50(2), 267–291.
http://dx.doi.org/10.1007/bf03395356
Rosales, R., Rehfeldt, R. A., & Huffman, N. (2012). Examining The Utility Of The Stimulus
Pairing Observation Procedure With Preschool Children Learning A Second
Language. Journal of Applied Behavior Analysis, 45(1), 173–177.
http://dx.doi.org/10.1901/jaba.2012.45-173
Russell, J. (1997). Autism as an executive disorder. Oxford: Oxford Univ. Press.
Sallows, G. O., & Graupner, T. D. (2005). Intensive Behavioral Treatment for Children With
Autism: Four-Year Outcome and Predictors. American Journal on Mental
Retardation, 110(6), 417. http://dx.doi.org/10.1352/0895-
8017(2005)110[417:ibtfcw]2.0.co;2
Sattler, J. M., Dumont, R., & Coalson, D. L. (2016). Assessment of children: Wisc-V and Wppsi-
Iv.
Scattone, D., Raggio, D. J., & May, W. (2012). Brief Report: Concurrent Validity of the Leiter-R
and KBIT-2 Scales of Nonverbal Intelligence for Children with Autism and Language

59
Impairments. Journal of Autism and Developmental Disorders, 42(11), 2486–2490.
dx.doi: 10.1007/s10803-012-1495-y
Sheinkopf, S. J., & Siegel, B. (1998). Home-based behavioral treatment of young children with
autism. Journal of Autism and Developmental Disorders, 28, 15–23.
Shu, B.-C., Lung, F.-W., Tien, A. Y., & Chen, B.-C. (2001). Executive Function Deficits in Non-
Retarded Autistic Children. Autism, 5(2), 165–174.
http://dx.doi.org/10.1177/1362361301005002006
Sidman, M., & Tailby, W. (1982). Conditional discrimination vs. matching to sample: an
expansion of the testing paradigm. Journal of the Experimental Analysis of
Behavior, 37(1), 5–22. http://dx.doi.org/10.1901/jeab.1982.37-5
Skinner, B. F. (1957). Verbal behavior. New York: Appleton-Century-Crofts.
Smith, T., Buch, G. A., & Gamby, T. E. (2000b). Parent-directed, intensive early intervention for
children with pervasive developmental disorder. Research in Developmental
Disabilities, 21(4), 297–309. http://dx.doi.org/10.1016/s0891-4222(00)00043-3
Smith, T., Groen, A. D., & Wynn, J. W. (2000a). Randomized Trial of Intensive Early
Intervention for Children With Pervasive Developmental Disorder. American Journal on
Mental Retardation, 105(4), 269–285. http://dx.doi.org/10.1352/0895-
8017(2000)105<0269:rtoiei>2.0.co;2
Smyth, S., Barnes-Holmes, D., & Forsyth, J. P. (2006). A Derived Transfer of Simple
Discrimination and Self-Reported Arousal Functions in Spider Fearful and Non-Spider-
Fearful Participants. Journal of the Experimental Analysis of Behavior, 85(2), 223–246.
http://dx.doi.org/10.1901/jeab.2006.02-05
Solares, L., & Fryling, M. J. (2018). Further Evaluation of the Stimulus Pairing Observation
Procedure with Children with Autism Spectrum Disorder. The Analysis of Verbal
Behavior, 35(1), 85–93. http://dx.doi.org/10.1007/s40616-018-0101-6
Stewart, I., Mcelwee, J., & Ming, S. (2013). Language Generativity, Response Generalization,
and Derived Relational Responding. The Analysis of Verbal Behavior, 29(1), 137–155.
http://dx.doi.org/10.1007/bf03393131
Stuss, D. T., & Benson, D. F. (1984). Neuropsychological studies of the frontal
lobes. Psychological Bulletin, 95(1), 3–28. http://dx.doi.org/10.1037//0033-2909.95.1.3
Stuss, D. T., Knight, R. T. (2013). Principles of frontal lobe function. New York, NY: Oxford
University Press. http://dx.doi.org/10.1093/med/9780199837755.001.0001
Sundberg, M. L. (2008). VB-MAPP: Verbal behavior milestones assessment and placement
program-Guide. Concord, CA: AVB Press

60
Sundberg, M. L., & Partington, J. W. (1998). Teaching language to children with autism or other
developmental disabilities. Pleasant Hill CA.: Behavior Analysts.
Tranel, D., Anderson, S.W., & Benton, A. (1994). Development of the concept of ‘executive
function’ and its relationship to the frontal lobes. In F. Boller & J. Grafman (Eds.),
Handbook of neuropsychology (pp. 125-148). Amsterdam: Elsevier Science.
Tsuchiya, E., Oki, J., Yahara, N., & Fujieda, K. (2005). Computerized version of the Wisconsin
card sorting test in children with high-functioning autistic disorder or attention-
deficit/hyperactivity disorder. Brain and Development, 27(3), 233–236.
http://dx.doi.org/10.1016/j.braindev.2004.06.008
Vallinger-Brown, M., & Rosales, R. (2014). An Investigation of Stimulus Pairing and Listener
Training to Establish Emergent Intraverbals in Children with Autism. The Analysis of
Verbal Behavior, 30(2), 148–159. http://dx.doi.org/10.1007/s40616-014-0014-y
Van Eylen, L., Boets, B., Steyaert, J., Evers, K., Wagemans, J., & Noens, I. (2011). Cognitive
flexibility in autism spectrum disorder: Explaining the inconsistencies? Research in
Autism Spectrum Disorders, 5(4), 1390–1401.
http://dx.doi.org/10.1016/j.rasd.2011.01.025
Verté, S., Geurts, H. M., Roeyers, H., Oosterlaan, J., & Sergeant, J. A. (2006). Executive
Functioning in Children with an Autism Spectrum Disorder: Can We Differentiate
Within the Spectrum? Journal of Autism and Developmental Disorders, 36(3), 351–372.
http://dx.doi.org/10.1007/s10803-006-0074-5
Wechsler, D. (1992). Wechsler intelligence scale for children–Third edition–UK Manual.
London: Psychological Corp, Europe.
Welsh, M. C., & Pennington, B. F. (1988). Assessing frontal lobe functioning in children: Views
from developmental psychology. Developmental Neuropsychology, 4(3), 199–230.
http://dx.doi.org/10.1080/87565648809540405
Williams, B. F., & Williams, R. L. (2010). Effective programs for treating autism spectrum
disorder: applied behavior analysis models. New York, NY: Routledge.
Williams, D., & Jarrold, C. (2013). Assessing Planning and Set-Shifting Abilities in Autism: Are
Experimenter-Administered and Computerised Versions of Tasks Equivalent? Autism
Research, 6(6), 461–467. http://dx.doi.org/10.1002/aur.1311
Yeung, M. K., Han, Y. M. Y., Sze, S. L., & Chan, A. S. (2016). Abnormal frontal theta
oscillations underlie the cognitive flexibility deficits in children with high-functioning
autism spectrum disorders. Neuropsychology, 30(3), 281–295.
http://dx.doi.org/10.1037/neu0000231

61

62

63
Table 2. Linear regression of total PEAK scores and total IQ scores

64
Table 3. Linear regression of total IQ scores and PEAK E scores
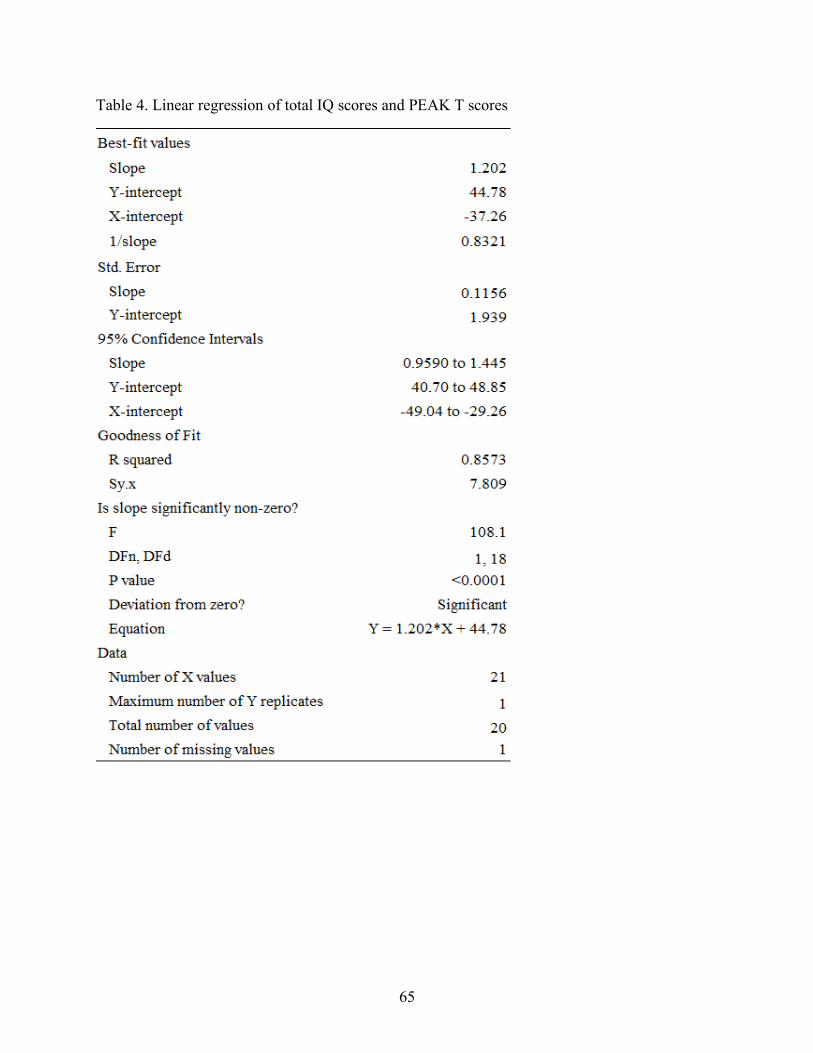
65
Table 4. Linear regression of total IQ scores and PEAK T scores

66
Table 5. Linear regression of IQ scores and PEAK scores minus the top 5 scores

67
Figure 1. Pearson correlation matrix between all assessments

68
1.00
0.68
0.68
1.00
Tota
l IQ
PE
AK
E
Total IQ
PEAK E
-1.0
-0.5
0
0.5
1.0
Figure 2. Pearson correlation matrix between total IQ and PEAK E
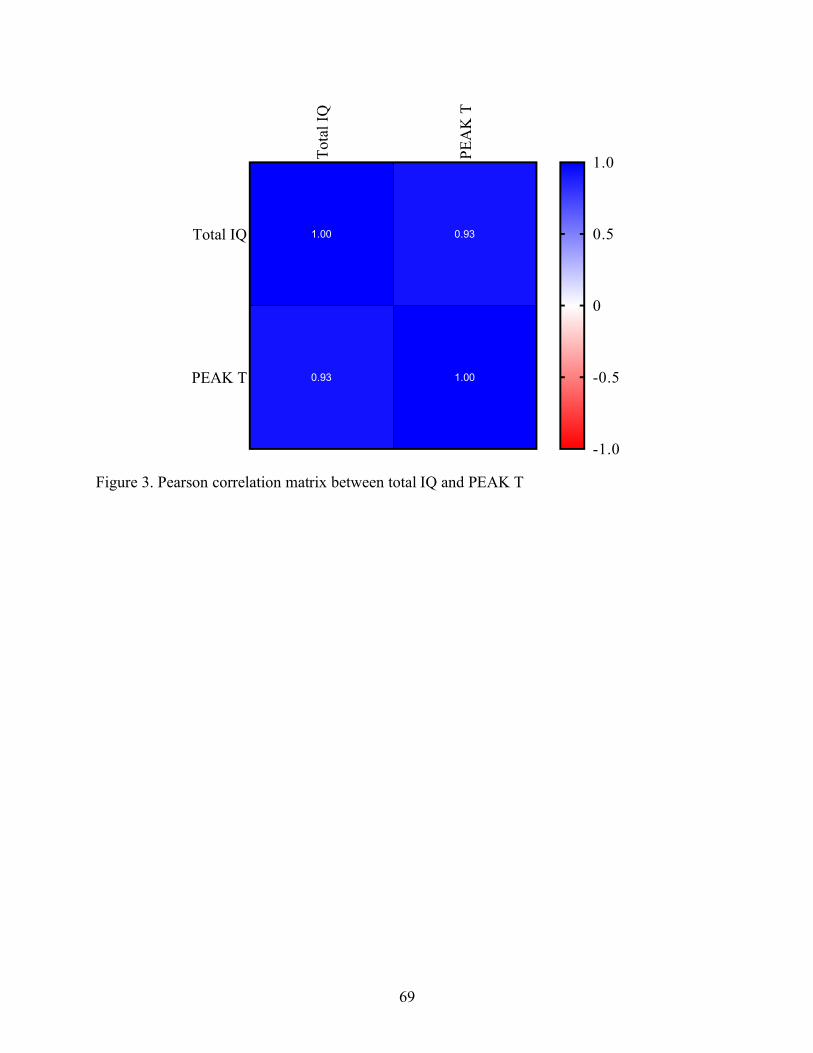
69
1.00
0.93
0.93
1.00
Tota
l IQ
PE
AK
T
Total IQ
PEAK T
-1.0
-0.5
0
0.5
1.0
Figure 3. Pearson correlation matrix between total IQ and PEAK T

70
0 20 40 60 80
40
60
80
100
120
PEAK Total Score
Tota
l E
sim
ated
IQ
Figure 4. Graph of correlations between IQ and PEAK
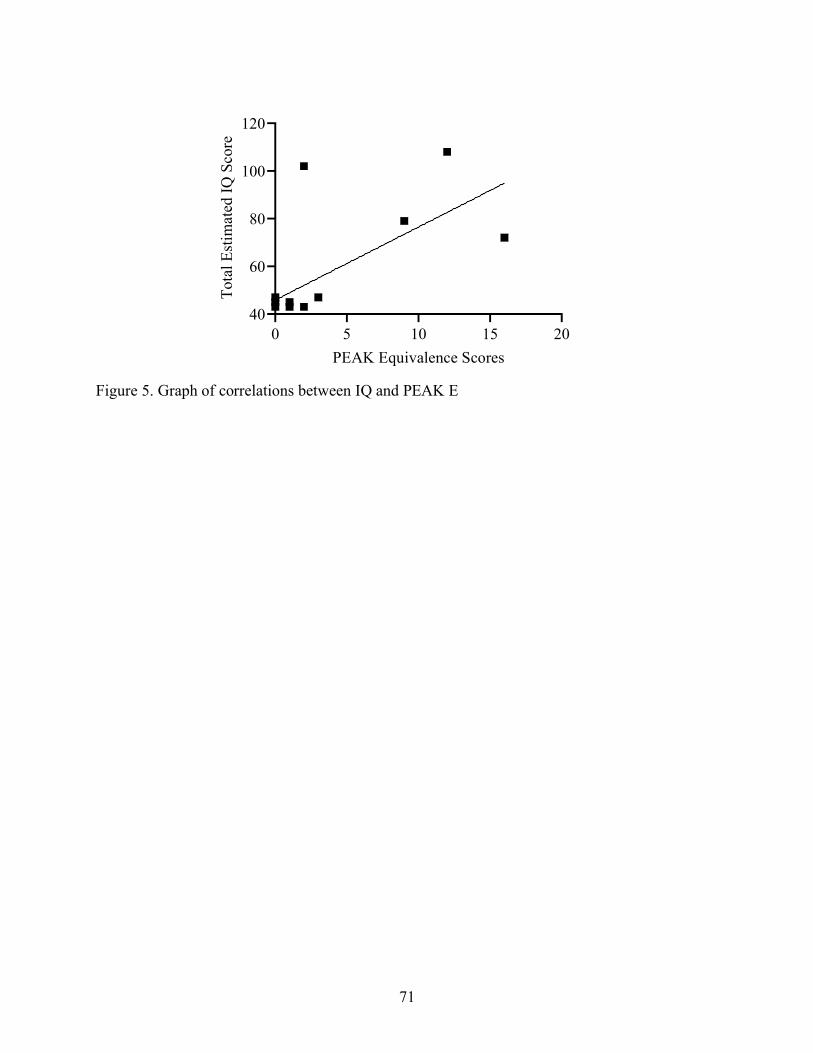
71
0 5 10 15 20
40
60
80
100
120
PEAK Equivalence Scores
Tota
l E
stim
ated
IQ
Sco
re
Figure 5. Graph of correlations between IQ and PEAK E
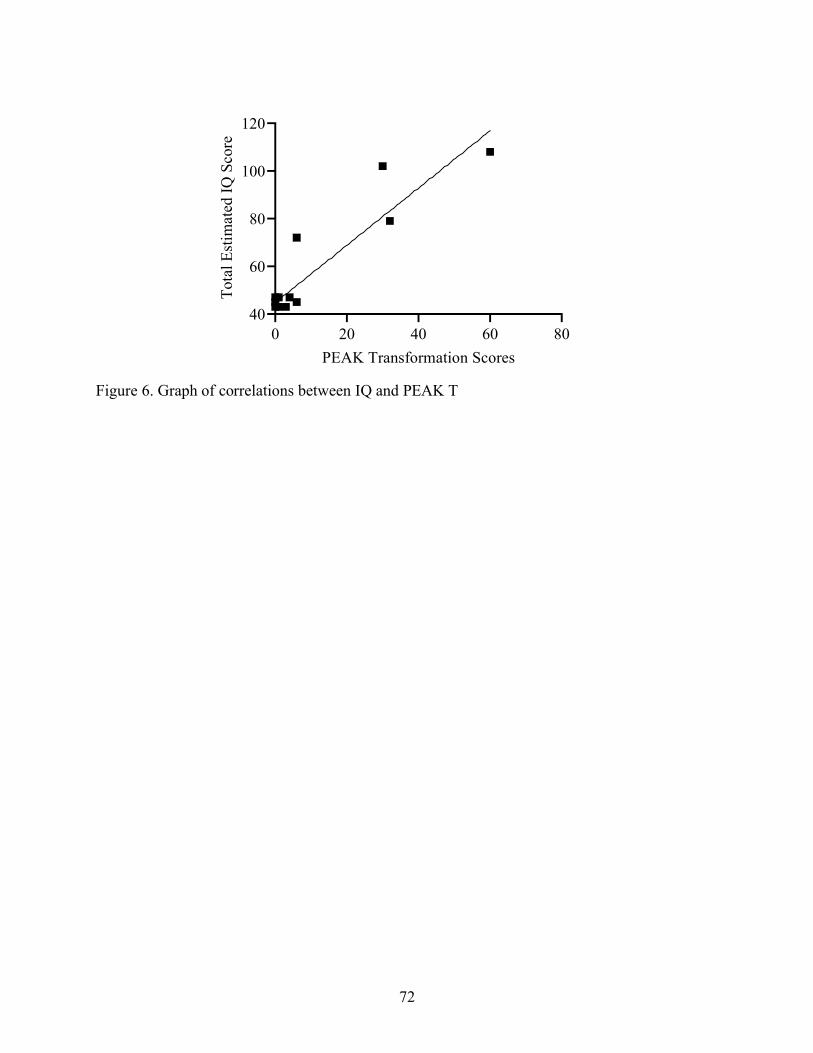
72
0 20 40 60 80
40
60
80
100
120
PEAK Transformation Scores
Tota
l E
stim
ated
IQ
Sco
re
Figure 6. Graph of correlations between IQ and PEAK T

73
1.00
0.11
0.11
1.00
To
tal
IQ
To
tal
PE
AK
Total IQ
Total PEAK
-1.0
-0.5
0
0.5
1.0
Figure 7. Pearson correlation matrix between IQ and PEAK minus the top 5 scores

74
0 2 4 6 8
40
45
50
PEAK total score
Tota
l E
stim
ated
IQ
Figure 8. Graph of correlations between IQ and PEAK minus the top 5 scores
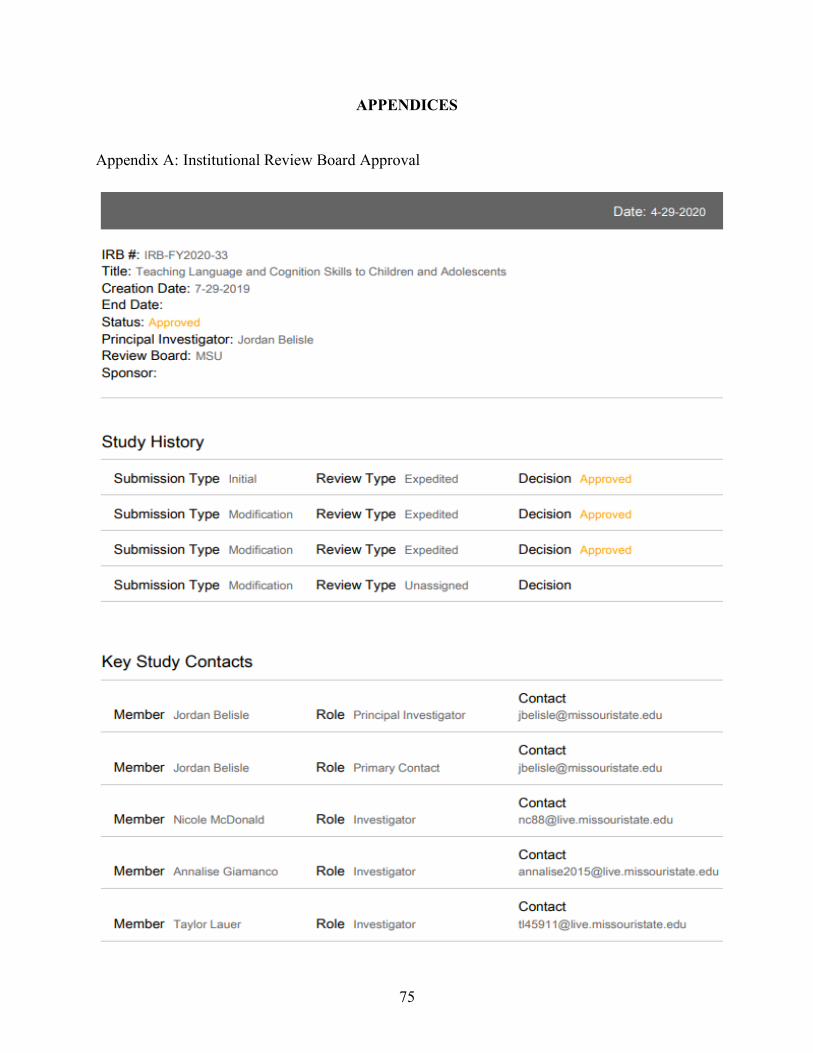
75
APPENDICES
Appendix A: Institutional Review Board Approval

76

77
78

79

80

81

82

83

84

85

86

87
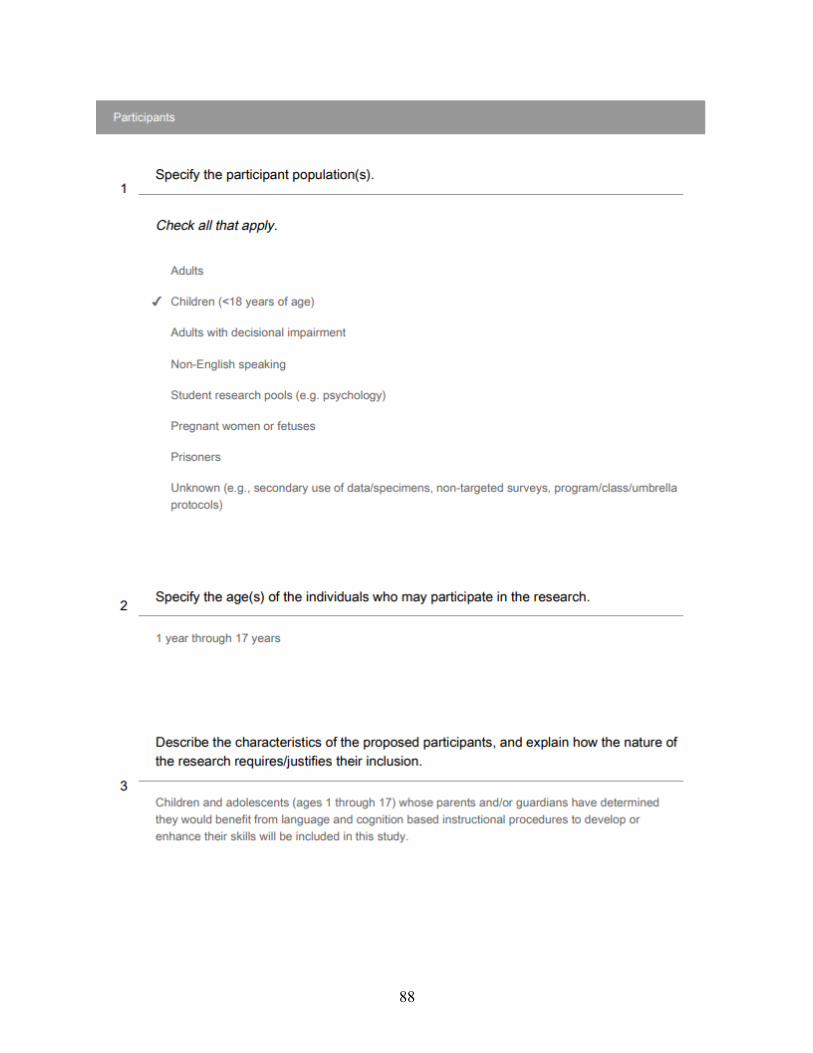
88
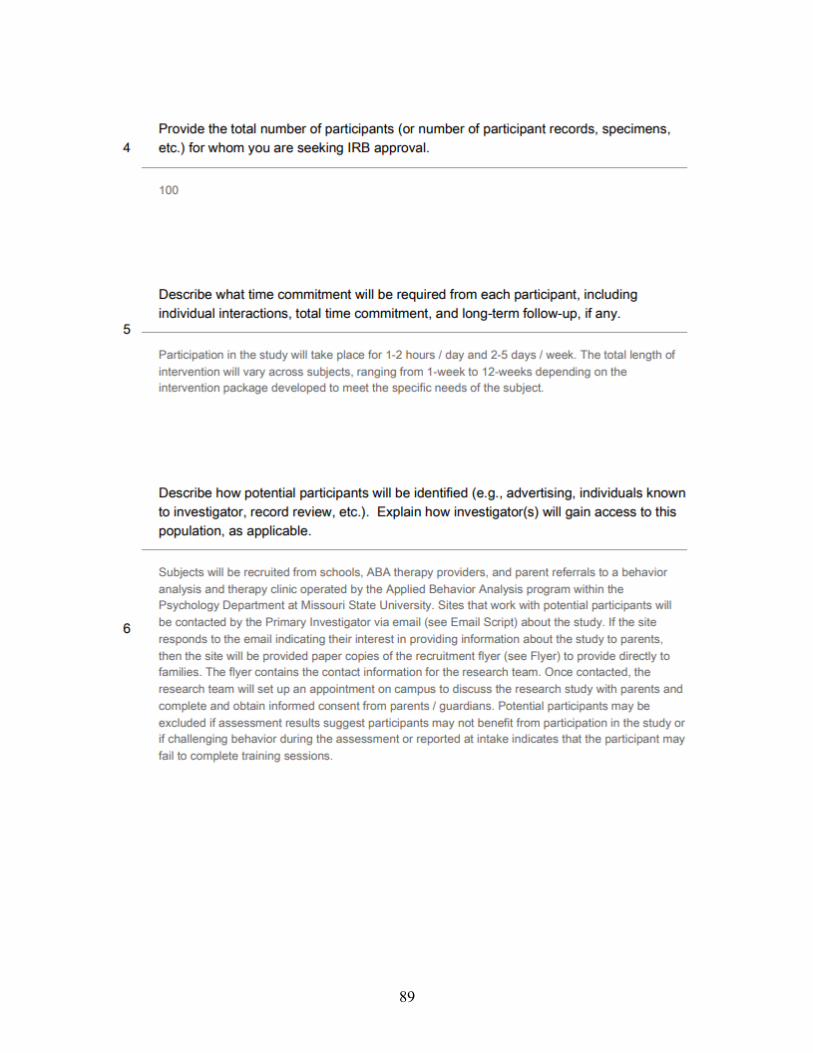
89

90
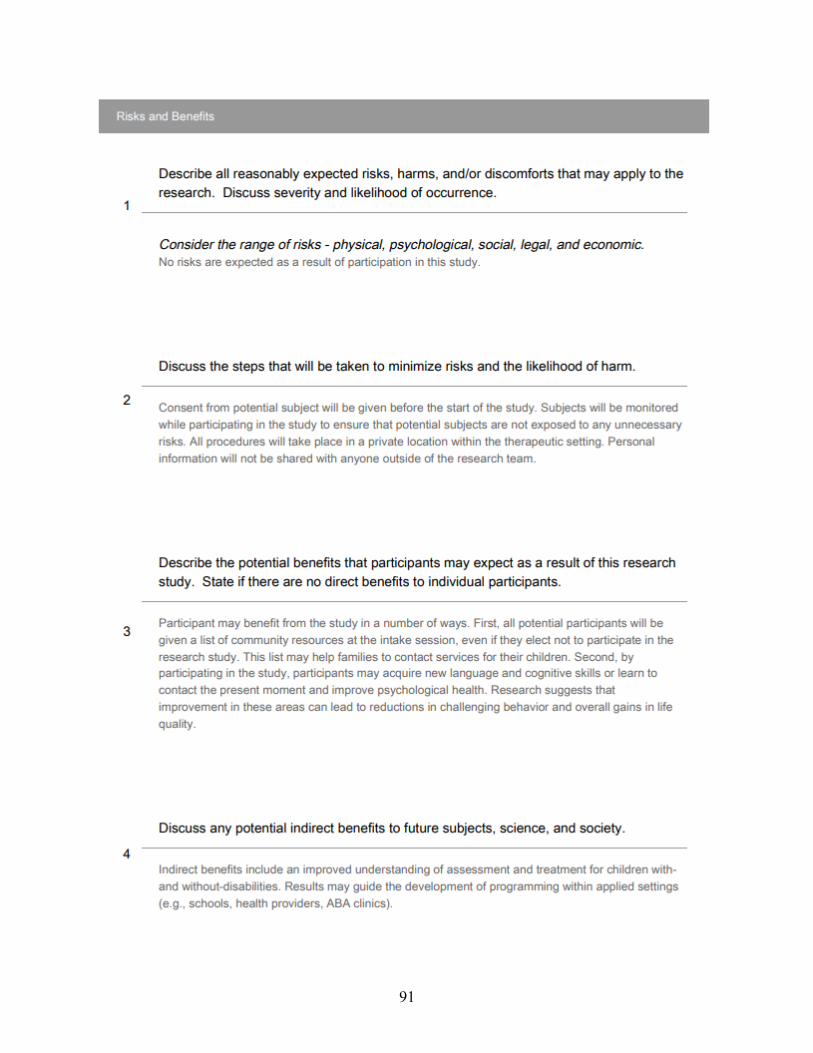
91

92
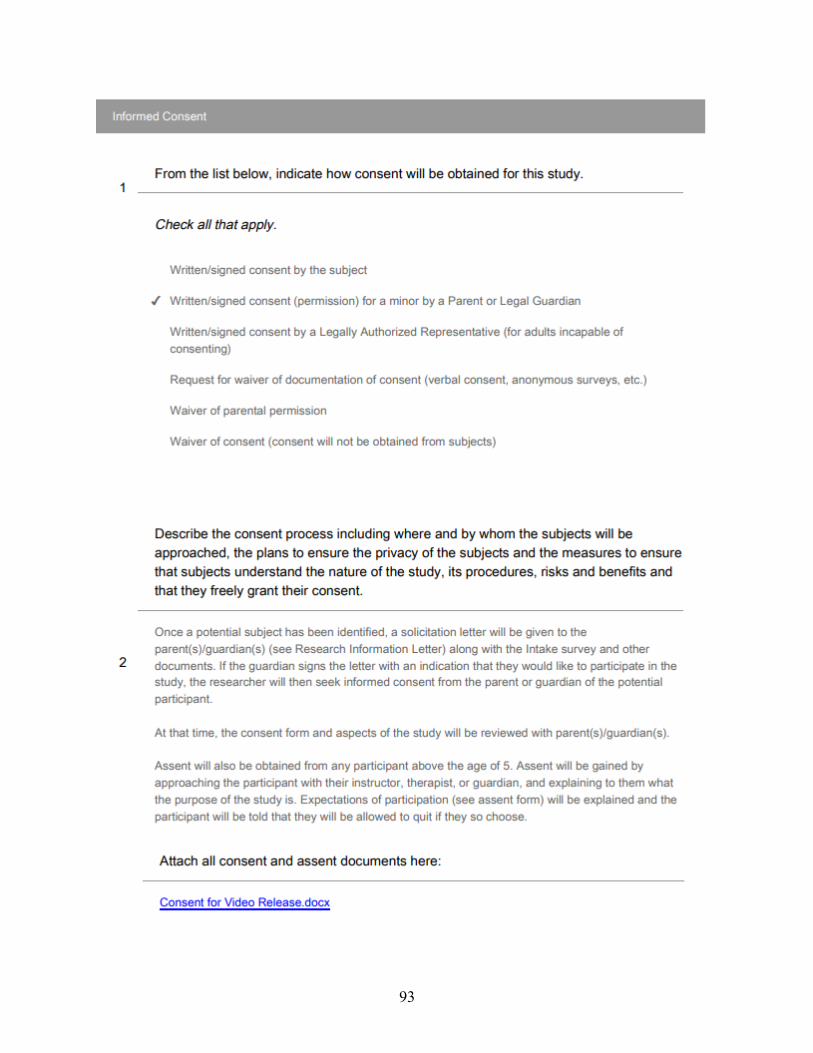
93

94

95

96

97
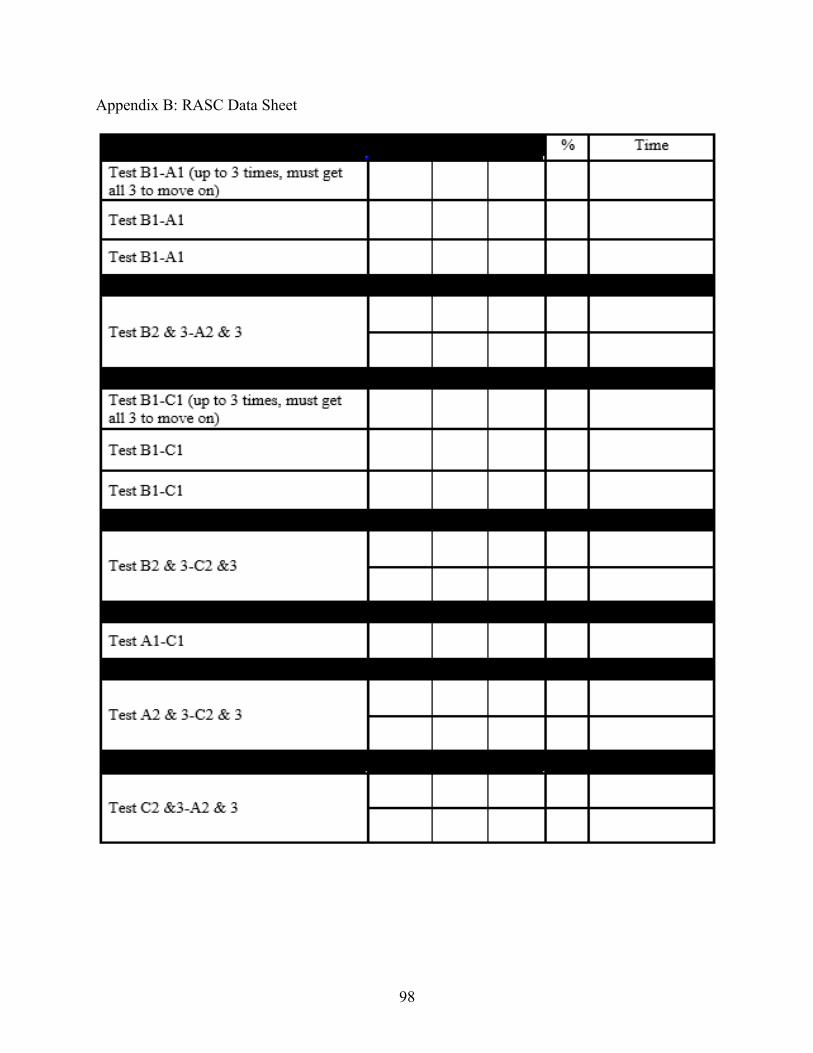
98
Appendix B: RASC Data Sheet