Embed Size (px)
Citation preview
ARTICLE OPEN
Evaluating digital medicine ingestion data from seriouslymentally ill patients with a Bayesian Hybrid ModelJonathan Knights 1, Zahra Heidary1, Timothy Peters-Strickland1 and Murali Ramanathan2
The objective of this work was to adapt and evaluate the performance of a Bayesian hybrid model to characterize objectivetemporal medication ingestion parameters from two clinical studies in patients with serious mental illness (SMI) receiving treatmentwith a digital medicine system. This system provides a signal from an ingested sensor contained in the dosage form to a patient-worn patch and transmits this signal via the patient’s mobile device. A previously developed hybrid Markov-von Mises model wasused to obtain maximum-likelihood estimates for medication ingestion behavior parameters for individual patients. The individualparameter estimates were modeled to obtain distribution parameters of priors implemented in a Markov chain-Monte Carloframework. Clinical and demographic covariates associated with model ingestion parameters were also assessed. We obtainedindividual estimates of overall observed ingestion percent (median:75.9%, range:18.2–98.3%, IQR:32.9%), rate of excess dosingevents (median:0%, range:0–14.3%, IQR:3.0%) and observed ingestion duration. The modeling also provided estimates of theMarkov-dependence probabilities of dosing success following a dosing success or failure. The ingestion-timing deviations weremodeled with the von Mises distribution. A subset of 17 patients (22.1%) were identified as prompt correctors based on Markov-dependence probability of a dosing failure followed by a dosing success of unity. The prompt corrector sub-group had a betteroverall digital medicine ingestion parameter profile compared to those who were not prompt correctors. Our results demonstratethe potential utility of a Bayesian Hybrid Markov-von Mises model for characterizing digital medicine ingestion patterns in patientswith SMI.
npj Digital Medicine (2019) 2:20 ; https://doi.org/10.1038/s41746-019-0095-z
INTRODUCTIONLack of adherence to medication is an important factor thatcontributes to increased healthcare utilization1,2: Among patientswith serious mental illness (SMI)—which includes schizophrenia,bipolar disorder, and major depression—this is of particularconcern, with some reports estimating rates of nonadherence ashigh as 60%.1,3 Within the SMI population, effective pharma-cotherapy is critical for managing the risk of serious potentialadverse events such as relapse of psychosis, recurrence ofsymptoms, poor social functioning, hospitalizations, and suicideattempts.4,5
Conventional methods of inferring medication ingestionadherence to pharmacotherapy are limited in their utility as theyacquire data on surrogate measures associated with medicationingestion events and involve subjectivity. Examples of oldermethods with high subjectivity are patient self-reports, medicationpossession ratio,6 and percentage of days covered.7 Newerapproaches such as electronic blister packs and medication eventmonitoring systems have lower subjectivity; however, thesemethods assume that the interaction with the packaging impliessuccessful ingestions. Pharmacokinetic sampling is sometimesleveraged as an objective measure of general adherence, but issub-optimal in routine clinical practice because it is invasive andprovides only a single snapshot in what may have been manyweeks of ingestion opportunities. Given the limitations ofconventional medication ingestion monitoring systems, there is
a clearly recognized but yet unmet clinical need that digitalmedicine systems are ideally suited to address.Digital medicine, in this context, refers to the combination of an
active pharmaceutical and an ingestible sensor component thatcommunicates to a mobile or web-based application to capturethat a patient has taken their medication at a specific time.8 A coreobjective of digital medicine systems is to improve patientadherence9,10; however, one of their primary advantages overcompeting alternatives is that they provide a signal correspondingto successful medication ingestion events, which can directlyenable timely and impactful interventions by the care team.10
These systems have the potential for a transformative impact onunderstanding medication ingestion behaviors, which could leadto better public health outcomes over time.Given the importance of medication ingestion data for
informing clinical decision making (particularly in SMI) and therising prevalence of risk stratification and predictive models inboth the clinical and population health settings, the successfulapplication of statistical frameworks for describing objectivepatient medication ingestion patterns is of value. This researchapplies a novel Bayesian model to characterize digital medicinedata from two clinical studies in SMI: The model,11–13 which hasnot been extensively investigated in digital medicine, or in SMIpatients, provides informative metrics on medication ingestionpatterns including observed medication ingestion percent, excessdosing, duration of observed treatment, probability of dosing
Received: 5 October 2018 Accepted: 27 February 2019
1Otsuka Pharmaceutical Development & Commercialization, Inc.: 508 Carnegie Center, Princeton, NJ, USA and 2State University of Buffalo at New York, School of Pharmacy andPharmaceutical Sciences, 355 Kapoor Hall, Buffalo, NY 14214, USACorrespondence: Jonathan Knights ([email protected])
www.nature.com/npjdigitalmed
Scripps Research Translational Institute
succeses following dosing successes or failures, and medicationingestion-timing deviations.
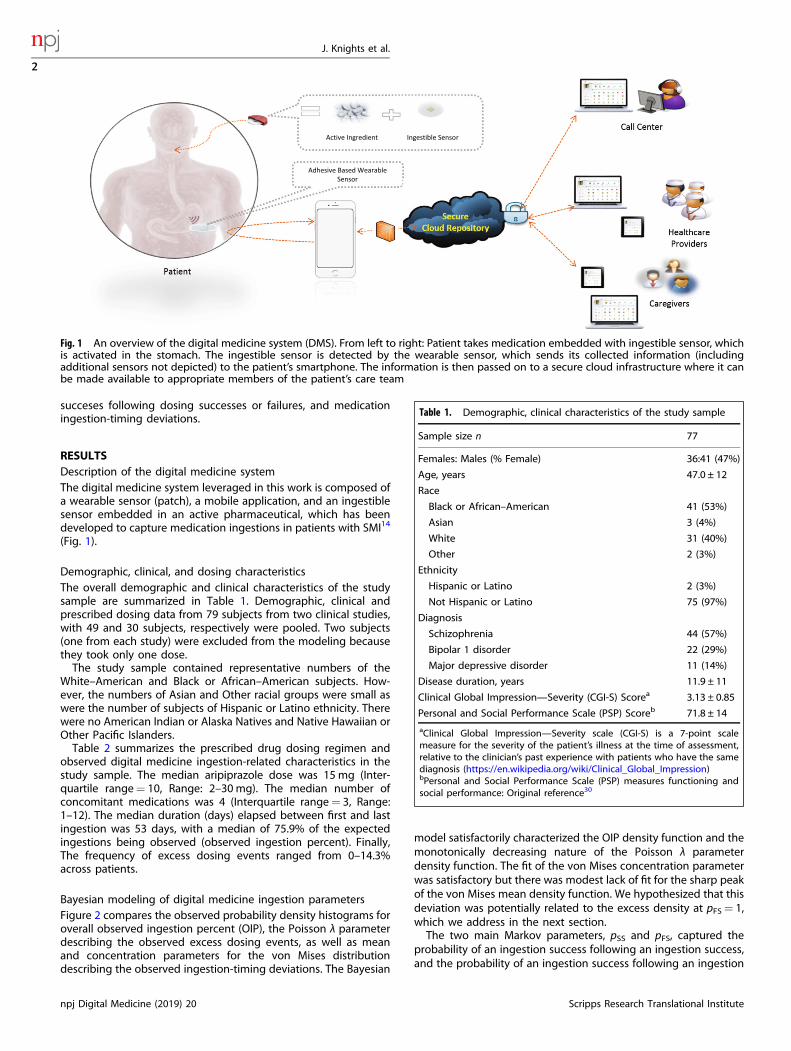
RESULTSDescription of the digital medicine systemThe digital medicine system leveraged in this work is composed ofa wearable sensor (patch), a mobile application, and an ingestiblesensor embedded in an active pharmaceutical, which has beendeveloped to capture medication ingestions in patients with SMI14
(Fig. 1).
Demographic, clinical, and dosing characteristicsThe overall demographic and clinical characteristics of the studysample are summarized in Table 1. Demographic, clinical andprescribed dosing data from 79 subjects from two clinical studies,with 49 and 30 subjects, respectively were pooled. Two subjects(one from each study) were excluded from the modeling becausethey took only one dose.The study sample contained representative numbers of the
White–American and Black or African–American subjects. How-ever, the numbers of Asian and Other racial groups were small aswere the number of subjects of Hispanic or Latino ethnicity. Therewere no American Indian or Alaska Natives and Native Hawaiian orOther Pacific Islanders.Table 2 summarizes the prescribed drug dosing regimen and
observed digital medicine ingestion-related characteristics in thestudy sample. The median aripiprazole dose was 15 mg (Inter-quartile range= 10, Range: 2–30mg). The median number ofconcomitant medications was 4 (Interquartile range= 3, Range:1–12). The median duration (days) elapsed between first and lastingestion was 53 days, with a median of 75.9% of the expectedingestions being observed (observed ingestion percent). Finally,The frequency of excess dosing events ranged from 0–14.3%across patients.
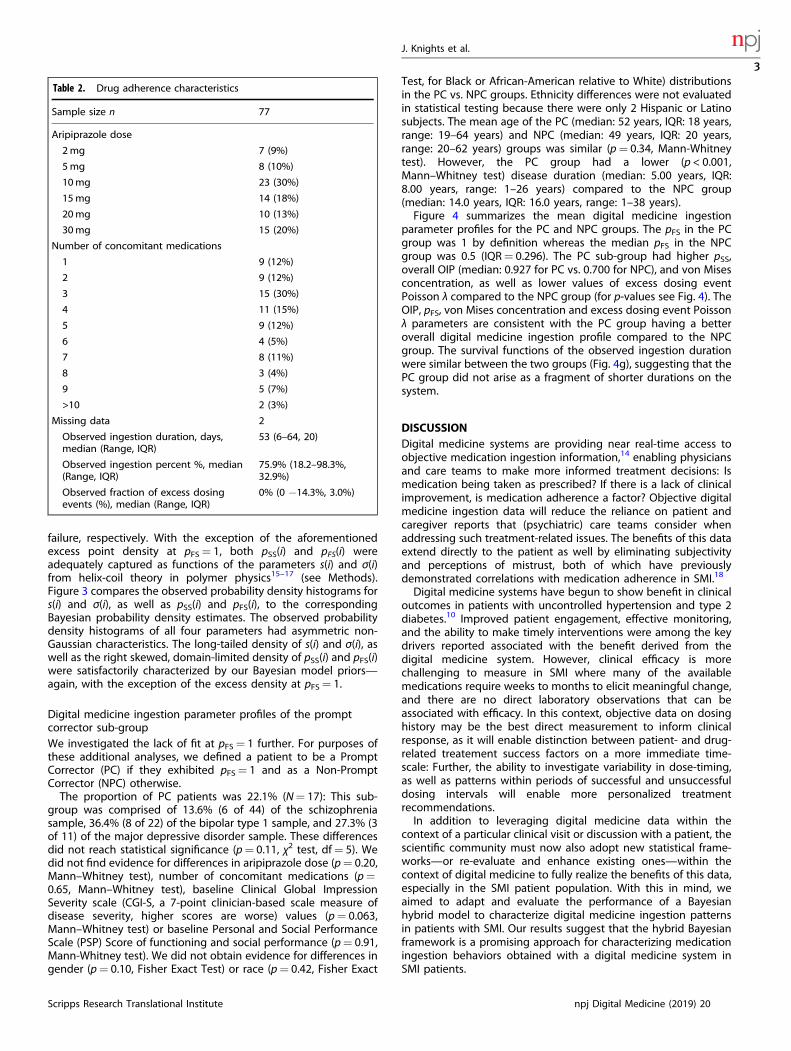
Bayesian modeling of digital medicine ingestion parametersFigure 2 compares the observed probability density histograms foroverall observed ingestion percent (OIP), the Poisson λ parameterdescribing the observed excess dosing events, as well as meanand concentration parameters for the von Mises distributiondescribing the observed ingestion-timing deviations. The Bayesian
model satisfactorily characterized the OIP density function and themonotonically decreasing nature of the Poisson λ parameterdensity function. The fit of the von Mises concentration parameterwas satisfactory but there was modest lack of fit for the sharp peakof the von Mises mean density function. We hypothesized that thisdeviation was potentially related to the excess density at pFS= 1,which we address in the next section.The two main Markov parameters, pSS and pFS, captured the
probability of an ingestion success following an ingestion success,and the probability of an ingestion success following an ingestion
Fig. 1 An overview of the digital medicine system (DMS). From left to right: Patient takes medication embedded with ingestible sensor, whichis activated in the stomach. The ingestible sensor is detected by the wearable sensor, which sends its collected information (includingadditional sensors not depicted) to the patient’s smartphone. The information is then passed on to a secure cloud infrastructure where it canbe made available to appropriate members of the patient’s care team
Table 1. Demographic, clinical characteristics of the study sample
Sample size n 77
Females: Males (% Female) 36:41 (47%)
Age, years 47.0 ± 12
Race
Black or African–American 41 (53%)
Asian 3 (4%)
White 31 (40%)
Other 2 (3%)
Ethnicity
Hispanic or Latino 2 (3%)
Not Hispanic or Latino 75 (97%)
Diagnosis
Schizophrenia 44 (57%)
Bipolar 1 disorder 22 (29%)
Major depressive disorder 11 (14%)
Disease duration, years 11.9 ± 11
Clinical Global Impression—Severity (CGI-S) Scorea 3.13 ± 0.85
Personal and Social Performance Scale (PSP) Scoreb 71.8 ± 14
aClinical Global Impression—Severity scale (CGI-S) is a 7-point scalemeasure for the severity of the patient’s illness at the time of assessment,relative to the clinician’s past experience with patients who have the samediagnosis (https://en.wikipedia.org/wiki/Clinical_Global_Impression)bPersonal and Social Performance Scale (PSP) measures functioning andsocial performance: Original reference30
J. Knights et al.
2
npj Digital Medicine (2019) 20 Scripps Research Translational Institute
1234567890():,;
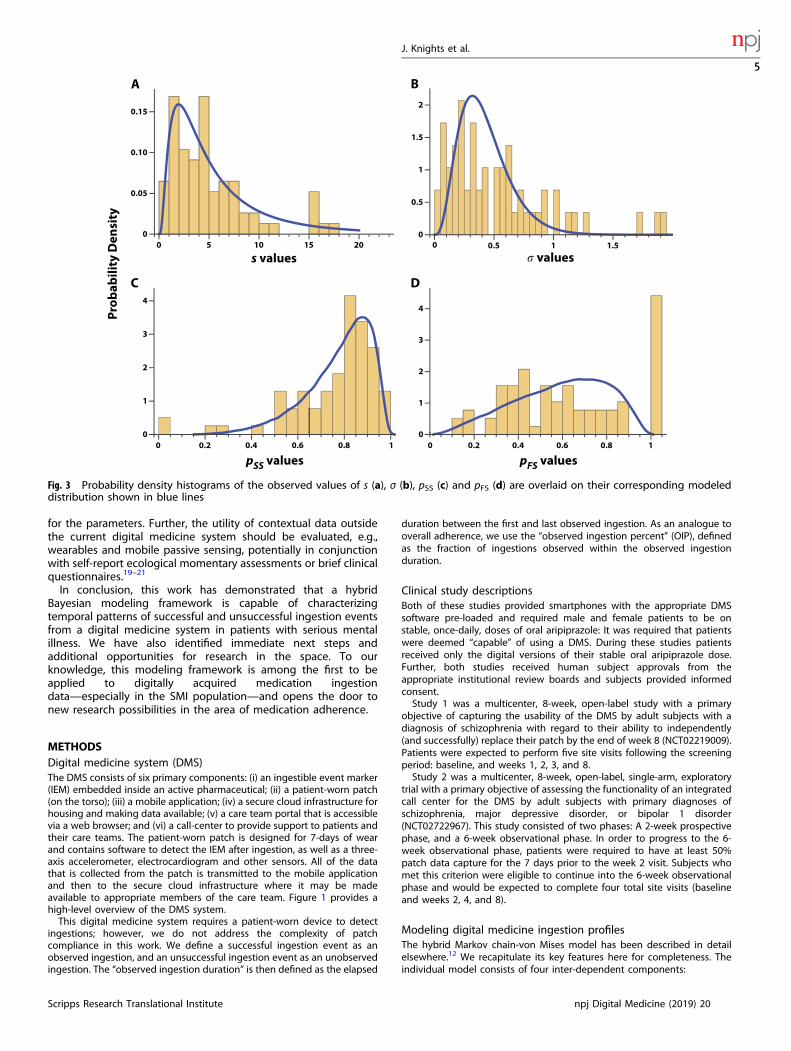
failure, respectively. With the exception of the aforementionedexcess point density at pFS= 1, both pSS(i) and pFS(i) wereadequately captured as functions of the parameters s(i) and σ(i)from helix-coil theory in polymer physics15–17 (see Methods).Figure 3 compares the observed probability density histograms fors(i) and σ(i), as well as pSS(i) and pFS(i), to the correspondingBayesian probability density estimates. The observed probabilitydensity histograms of all four parameters had asymmetric non-Gaussian characteristics. The long-tailed density of s(i) and σ(i), aswell as the right skewed, domain-limited density of pSS(i) and pFS(i)were satisfactorily characterized by our Bayesian model priors—again, with the exception of the excess density at pFS= 1.
Digital medicine ingestion parameter profiles of the promptcorrector sub-groupWe investigated the lack of fit at pFS= 1 further. For purposes ofthese additional analyses, we defined a patient to be a PromptCorrector (PC) if they exhibited pFS= 1 and as a Non-PromptCorrector (NPC) otherwise.The proportion of PC patients was 22.1% (N= 17): This sub-
group was comprised of 13.6% (6 of 44) of the schizophreniasample, 36.4% (8 of 22) of the bipolar type 1 sample, and 27.3% (3of 11) of the major depressive disorder sample. These differencesdid not reach statistical significance (p= 0.11, χ2 test, df= 5). Wedid not find evidence for differences in aripiprazole dose (p= 0.20,Mann–Whitney test), number of concomitant medications (p=0.65, Mann–Whitney test), baseline Clinical Global ImpressionSeverity scale (CGI-S, a 7-point clinician-based scale measure ofdisease severity, higher scores are worse) values (p= 0.063,Mann–Whitney test) or baseline Personal and Social PerformanceScale (PSP) Score of functioning and social performance (p= 0.91,Mann-Whitney test). We did not obtain evidence for differences ingender (p= 0.10, Fisher Exact Test) or race (p= 0.42, Fisher Exact
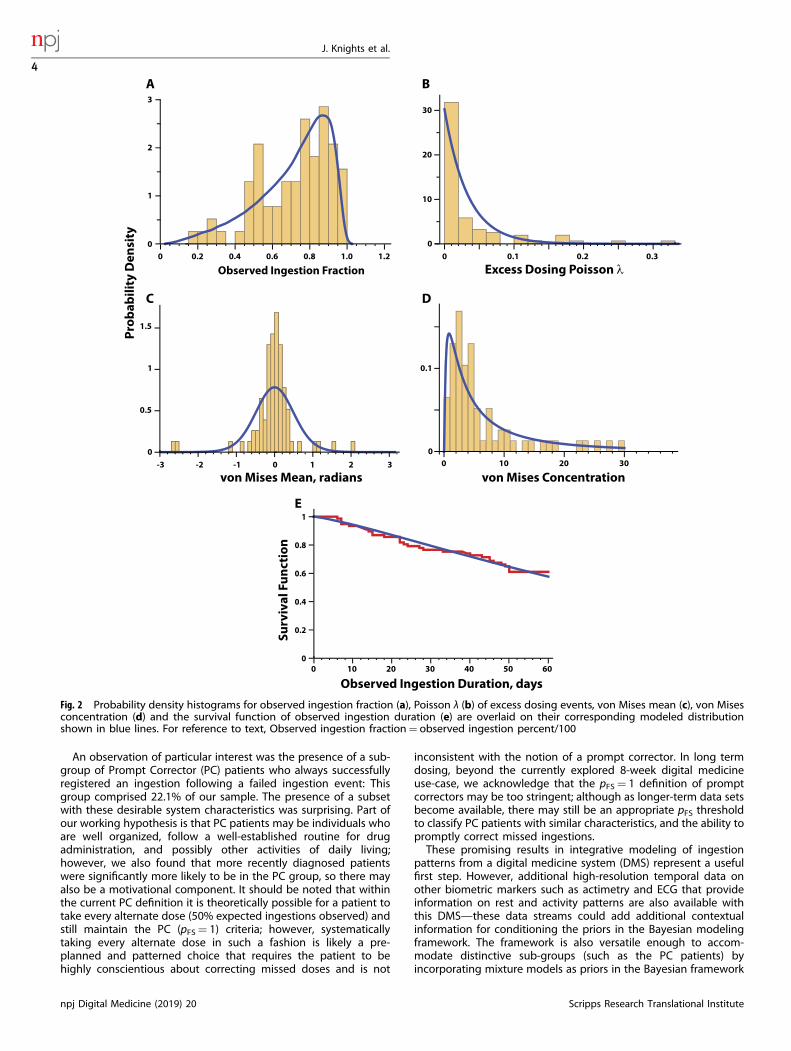
Test, for Black or African-American relative to White) distributionsin the PC vs. NPC groups. Ethnicity differences were not evaluatedin statistical testing because there were only 2 Hispanic or Latinosubjects. The mean age of the PC (median: 52 years, IQR: 18 years,range: 19–64 years) and NPC (median: 49 years, IQR: 20 years,range: 20–62 years) groups was similar (p= 0.34, Mann-Whitneytest). However, the PC group had a lower (p < 0.001,Mann–Whitney test) disease duration (median: 5.00 years, IQR:8.00 years, range: 1–26 years) compared to the NPC group(median: 14.0 years, IQR: 16.0 years, range: 1–38 years).Figure 4 summarizes the mean digital medicine ingestion
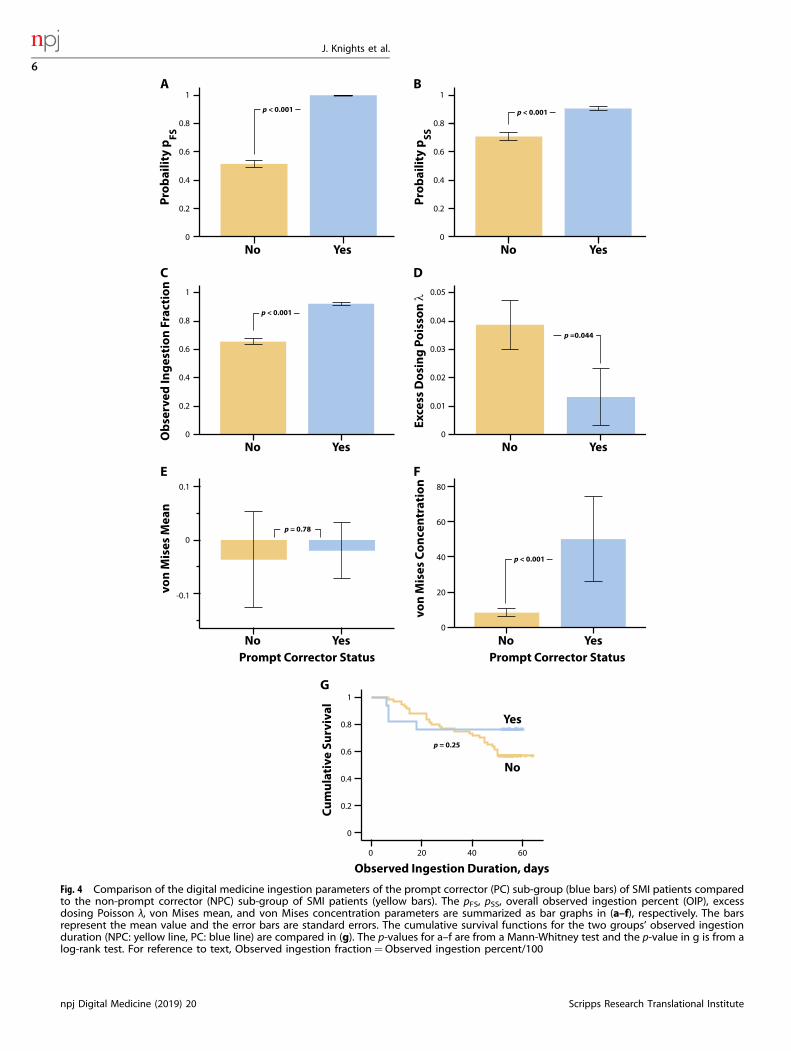
parameter profiles for the PC and NPC groups. The pFS in the PCgroup was 1 by definition whereas the median pFS in the NPCgroup was 0.5 (IQR= 0.296). The PC sub-group had higher pSS,overall OIP (median: 0.927 for PC vs. 0.700 for NPC), and von Misesconcentration, as well as lower values of excess dosing eventPoisson λ compared to the NPC group (for p-values see Fig. 4). TheOIP, pFS, von Mises concentration and excess dosing event Poissonλ parameters are consistent with the PC group having a betteroverall digital medicine ingestion profile compared to the NPCgroup. The survival functions of the observed ingestion durationwere similar between the two groups (Fig. 4g), suggesting that thePC group did not arise as a fragment of shorter durations on thesystem.
DISCUSSIONDigital medicine systems are providing near real-time access toobjective medication ingestion information,14 enabling physiciansand care teams to make more informed treatment decisions: Ismedication being taken as prescribed? If there is a lack of clinicalimprovement, is medication adherence a factor? Objective digitalmedicine ingestion data will reduce the reliance on patient andcaregiver reports that (psychiatric) care teams consider whenaddressing such treatment-related issues. The benefits of this dataextend directly to the patient as well by eliminating subjectivityand perceptions of mistrust, both of which have previouslydemonstrated correlations with medication adherence in SMI.18
Digital medicine systems have begun to show benefit in clinicaloutcomes in patients with uncontrolled hypertension and type 2diabetes.10 Improved patient engagement, effective monitoring,and the ability to make timely interventions were among the keydrivers reported associated with the benefit derived from thedigital medicine system. However, clinical efficacy is morechallenging to measure in SMI where many of the availablemedications require weeks to months to elicit meaningful change,and there are no direct laboratory observations that can beassociated with efficacy. In this context, objective data on dosinghistory may be the best direct measurement to inform clinicalresponse, as it will enable distinction between patient- and drug-related treatement success factors on a more immediate time-scale: Further, the ability to investigate variability in dose-timing,as well as patterns within periods of successful and unsuccessfuldosing intervals will enable more personalized treatmentrecommendations.In addition to leveraging digital medicine data within the
context of a particular clinical visit or discussion with a patient, thescientific community must now also adopt new statistical frame-works—or re-evaluate and enhance existing ones—within thecontext of digital medicine to fully realize the benefits of this data,especially in the SMI patient population. With this in mind, weaimed to adapt and evaluate the performance of a Bayesianhybrid model to characterize digital medicine ingestion patternsin patients with SMI. Our results suggest that the hybrid Bayesianframework is a promising approach for characterizing medicationingestion behaviors obtained with a digital medicine system inSMI patients.
Table 2. Drug adherence characteristics
Sample size n 77
Aripiprazole dose
2mg 7 (9%)
5mg 8 (10%)
10mg 23 (30%)
15mg 14 (18%)
20mg 10 (13%)
30mg 15 (20%)
Number of concomitant medications
1 9 (12%)
2 9 (12%)
3 15 (30%)
4 11 (15%)
5 9 (12%)
6 4 (5%)
7 8 (11%)
8 3 (4%)
9 5 (7%)
>10 2 (3%)
Missing data 2
Observed ingestion duration, days,median (Range, IQR)
53 (6–64, 20)
Observed ingestion percent %, median(Range, IQR)
75.9% (18.2–98.3%,32.9%)
Observed fraction of excess dosingevents (%), median (Range, IQR)
0% (0 −14.3%, 3.0%)
J. Knights et al.
3
Scripps Research Translational Institute npj Digital Medicine (2019) 20
An observation of particular interest was the presence of a sub-group of Prompt Corrector (PC) patients who always successfullyregistered an ingestion following a failed ingestion event: Thisgroup comprised 22.1% of our sample. The presence of a subsetwith these desirable system characteristics was surprising. Part ofour working hypothesis is that PC patients may be individuals whoare well organized, follow a well-established routine for drugadministration, and possibly other activities of daily living;however, we also found that more recently diagnosed patientswere significantly more likely to be in the PC group, so there mayalso be a motivational component. It should be noted that withinthe current PC definition it is theoretically possible for a patient totake every alternate dose (50% expected ingestions observed) andstill maintain the PC (pFS= 1) criteria; however, systematicallytaking every alternate dose in such a fashion is likely a pre-planned and patterned choice that requires the patient to behighly conscientious about correcting missed doses and is not
inconsistent with the notion of a prompt corrector. In long termdosing, beyond the currently explored 8-week digital medicineuse-case, we acknowledge that the pFS= 1 definition of promptcorrectors may be too stringent; although as longer-term data setsbecome available, there may still be an appropriate pFS thresholdto classify PC patients with similar characteristics, and the ability topromptly correct missed ingestions.These promising results in integrative modeling of ingestion
patterns from a digital medicine system (DMS) represent a usefulfirst step. However, additional high-resolution temporal data onother biometric markers such as actimetry and ECG that provideinformation on rest and activity patterns are also available withthis DMS—these data streams could add additional contextualinformation for conditioning the priors in the Bayesian modelingframework. The framework is also versatile enough to accom-modate distinctive sub-groups (such as the PC patients) byincorporating mixture models as priors in the Bayesian framework
Observed Ingestion Fraction
Prob
abili
ty D
ensi
ty
Surv
ival
Fun
ctio
nExcess Dosing Poisson λ
von Mises Mean, radians von Mises Concentration
Observed Ingestion Duration, days
A
C
00
0.2 0.4 0.6 0.8 1.0 1.2
1
2
3
0.1 0.2 0.30
0
10
20
30
-2-3 -1 0 21 30
0.5
1
1.5
0 10 20 300
0.1
B
D
E
100 20 30 40 50 60
0.2
0
0.4
0.6
0.8
1
Fig. 2 Probability density histograms for observed ingestion fraction (a), Poisson λ (b) of excess dosing events, von Mises mean (c), von Misesconcentration (d) and the survival function of observed ingestion duration (e) are overlaid on their corresponding modeled distributionshown in blue lines. For reference to text, Observed ingestion fraction= observed ingestion percent/100
J. Knights et al.
4
npj Digital Medicine (2019) 20 Scripps Research Translational Institute
for the parameters. Further, the utility of contextual data outsidethe current digital medicine system should be evaluated, e.g.,wearables and mobile passive sensing, potentially in conjunctionwith self-report ecological momentary assessments or brief clinicalquestionnaires.19–21
In conclusion, this work has demonstrated that a hybridBayesian modeling framework is capable of characterizingtemporal patterns of successful and unsuccessful ingestion eventsfrom a digital medicine system in patients with serious mentalillness. We have also identified immediate next steps andadditional opportunities for research in the space. To ourknowledge, this modeling framework is among the first to beapplied to digitally acquired medication ingestiondata—especially in the SMI population—and opens the door tonew research possibilities in the area of medication adherence.
METHODSDigital medicine system (DMS)The DMS consists of six primary components: (i) an ingestible event marker(IEM) embedded inside an active pharmaceutical; (ii) a patient-worn patch(on the torso); (iii) a mobile application; (iv) a secure cloud infrastructure forhousing and making data available; (v) a care team portal that is accessiblevia a web browser; and (vi) a call-center to provide support to patients andtheir care teams. The patient-worn patch is designed for 7-days of wearand contains software to detect the IEM after ingestion, as well as a three-axis accelerometer, electrocardiogram and other sensors. All of the datathat is collected from the patch is transmitted to the mobile applicationand then to the secure cloud infrastructure where it may be madeavailable to appropriate members of the care team. Figure 1 provides ahigh-level overview of the DMS system.This digital medicine system requires a patient-worn device to detect
ingestions; however, we do not address the complexity of patchcompliance in this work. We define a successful ingestion event as anobserved ingestion, and an unsuccessful ingestion event as an unobservedingestion. The “observed ingestion duration” is then defined as the elapsed
duration between the first and last observed ingestion. As an analogue tooverall adherence, we use the “observed ingestion percent” (OIP), definedas the fraction of ingestions observed within the observed ingestionduration.
Clinical study descriptionsBoth of these studies provided smartphones with the appropriate DMSsoftware pre-loaded and required male and female patients to be onstable, once-daily, doses of oral aripiprazole: It was required that patientswere deemed “capable” of using a DMS. During these studies patientsreceived only the digital versions of their stable oral aripiprazole dose.Further, both studies received human subject approvals from theappropriate institutional review boards and subjects provided informedconsent.Study 1 was a multicenter, 8-week, open-label study with a primary
objective of capturing the usability of the DMS by adult subjects with adiagnosis of schizophrenia with regard to their ability to independently(and successfully) replace their patch by the end of week 8 (NCT02219009).Patients were expected to perform five site visits following the screeningperiod: baseline, and weeks 1, 2, 3, and 8.Study 2 was a multicenter, 8-week, open-label, single-arm, exploratory
trial with a primary objective of assessing the functionality of an integratedcall center for the DMS by adult subjects with primary diagnoses ofschizophrenia, major depressive disorder, or bipolar 1 disorder(NCT02722967). This study consisted of two phases: A 2-week prospectivephase, and a 6-week observational phase. In order to progress to the 6-week observational phase, patients were required to have at least 50%patch data capture for the 7 days prior to the week 2 visit. Subjects whomet this criterion were eligible to continue into the 6-week observationalphase and would be expected to complete four total site visits (baselineand weeks 2, 4, and 8).
Modeling digital medicine ingestion profilesThe hybrid Markov chain-von Mises model has been described in detailelsewhere.12 We recapitulate its key features here for completeness. Theindividual model consists of four inter-dependent components:
0 0
0
5 10 15 200
0.05
0.10
0.15
0.5 1 1.50
0.5
1
1.5
2
0.2 0.4 0.6 0.8 10
1
2
3
4
00
0.2 0.4 0.6 0.8 1
1
2
3
4
s values
Prob
abili
ty D
ensi
ty
pSS values pFS values
A B
C D
� values
Fig. 3 Probability density histograms of the observed values of s (a), σ (b), pSS (c) and pFS (d) are overlaid on their corresponding modeleddistribution shown in blue lines
J. Knights et al.
5
Scripps Research Translational Institute npj Digital Medicine (2019) 20
Prompt Corrector Status
von
Mis
es M
ean
Obs
erve
d In
gest
ion
Frac
tion
Prob
ailit
y p FS
von
Mis
es C
once
ntra
tion
Exce
ss D
osin
g Po
isso
n λ
Prompt Corrector StatusNo Yes No Yes
No
Yes
Observed Ingestion Duration, days
No Yes No Yes
No
A
Yes No
E F
G
C D
B
Yes
0
0.2
0.4
0.6
0.8
1
Cum
ulat
ive
Surv
ival
0
0.2
0.4
0.6
0.8
1
-0.1
0
0.1
0
0.01
0.02
0.03
0.04
0.05
0
20 40 600
20
40
60
80
0
0.2
0.4
0.6
0.8
1
p < 0.001
p < 0.001
p < 0.001
p = 0.78
p = 0.25
p < 0.001
p =0.044
Prob
ailit
y p SS
0
0.2
0.4
0.6
0.8
1
Fig. 4 Comparison of the digital medicine ingestion parameters of the prompt corrector (PC) sub-group (blue bars) of SMI patients comparedto the non-prompt corrector (NPC) sub-group of SMI patients (yellow bars). The pFS, pSS, overall observed ingestion percent (OIP), excessdosing Poisson λ, von Mises mean, and von Mises concentration parameters are summarized as bar graphs in (a–f), respectively. The barsrepresent the mean value and the error bars are standard errors. The cumulative survival functions for the two groups’ observed ingestionduration (NPC: yellow line, PC: blue line) are compared in (g). The p-values for a–f are from a Mann-Whitney test and the p-value in g is from alog-rank test. For reference to text, Observed ingestion fraction=Observed ingestion percent/100
J. Knights et al.
6
npj Digital Medicine (2019) 20 Scripps Research Translational Institute
1. A two-state Markov chain was used to model the occurrence ofunobserved ingestions (failures) and observed ingestions (suc-cesses).
2. The ingestion-timing deviations were modeled with a von Misesdistribution.
3. Observed ingestion duration was modeled with a Weibull distribu-tion.
4. The frequency of observed excess dosing events was modeled witha Poisson distribution.
Modeling the two-state Markov chain. The short-range dependence ofingestion observations was modeled using a two-state time-homogeneousMarkov chain with transition matrix A:
A ¼ S
F
pSS pSFpFS pFF
� �¼ S
F
pSS 1� pSSpFS 1� pFS
� �
The probability of a success (observed ingestion) following a success atthe preceding dosing event was denoted by pSS, and the probability of asuccess following a failure (unobserved ingestion) at the preceding eventwas denoted by pFS.Maximum-likelihood estimates22 of pSS and pFS were obtained from NSS,
NFS, NFF, and NSF, the frequencies of success followed by success, failurefollowed by success, failure followed by failure and success followed byfailure events, respectively, using:
p̂SS ¼ NSSNSSþNSF
p̂FS ¼ NFSNFSþNFF
The transition matrix Ai used for defining the Markov chain normalizeseach row of Ni in subject i:
Ai ¼S
F
pSSðiÞ pSFðiÞpFSðiÞ pFFðiÞ
� �¼ S
F
pSSðiÞ 1� pSSðiÞpFSðiÞ 1� pFSðiÞ
� �
The parameterization of this model consisted of hyperbolic functions oftwo parameters, s(i) and σ(i), that underlie the helix-coil transition model inpolymer physics,15–17 which has been previously explored as a viablemodel for adherence modeling.13
Ai ¼s ið Þ
1þs ið Þ1
1þs ið ÞσðiÞs ið Þ
1þσðiÞs ið Þ1
1þσðiÞs ið Þ
24
35
The priors for s(i) and σ(i) were:
s ið Þ ¼ ezðiÞ
z ið Þ � Normalðas; bsÞσðiÞ � Gammaðaσ ; bσÞWhere z(i) is an intermediate dummy variable. as and bs represent themean and precision of the normal distribution, respectively, while aσ andbσ represent the shape and scale parameters of the Gamma distribution.
Modeling observed ingestion-timing deviations. The ingestion-timingdeviation of the ith ingestion, δi, was defined as the difference betweenthe actual ingestion time and the closest expected ingestion time. Theprobability density function (PDF) of the ingestion-timing deviations δrelative to τ (the dosing interval) after transformations to angularcoordinates, θ, are assumed to be distributed according to the von Mises(VM) PDF function VM (ψ,ω):
θ ¼ 2πδ
τ� VM ψ;ωð Þ
The VM distribution describes angular random variables, and its PDF p(θ)at angular position θ radians is:
p θð Þ ¼ eω�cos θ�ψð Þ
2πI0 ωð Þ for ψ� π � θ � ψþ π
The ψ(i) is the mean and ω(i) is a measure of how concentrated theingestion-timing deviation angles are around the mean in subject i; Io is the
Bessel function of order zero.The R circular statistics package23 was used to obtain maximum
likelihood estimates for ψ and ω for each subject. The prior for the vonMises location parameter ψ(i) was a von Mises distribution. The prior forthe von Mises concentration parameter ω(i) was assumed to follow a log-normal distribution.
ψðiÞ � vonMisesðaψ; bψÞωðiÞ � LogNormalðaω; bωÞWhere aψ and bψ are the same VM parameters as above, and the aω and bωrepresent the mean and precision of the log-normal prior, respectively.
Modeling observed excess dosing eventsIn this analysis, an excess dosing event was defined as more than oneingestion observed in a given day for a given patient. The distribution ofobserved excess dosing events was modeled with a Poisson distribution.Maximum-likelihood estimation was used to calculate Poisson rateparameter λ(i) for subject i, whose prior in the population was assumedto follow an exponential distribution with rate parameter aλ:
λðiÞ � ExponentialðaλÞ
Modeling observed ingestion durationObserved ingestion duration was defined as the number of dosingintervals between the first observed ingestion and the last observedingestion. For once-daily expected dosing, NTotal[i], the total number ofprescribed dosing events for the ingestion duration, would be numericallyequivalent to the familiar time-on-treatment for subject i.The total number of prescribed dosing events for the observed ingestion
duration NTotal[i] was modeled using a Weibull distribution with shapeparameter υ and scale parameter κ:
NTotal ½i� � Weibull υ; κð ÞThe Weibull density, Weibull(υ,κ), with shape parameter υ and scale
parameter κ, is defined with proportional hazards parameterization for arandom variable x as:
Weibull υ; κð Þ ¼ xυ�1e�ðx=κÞυ
The Weibull parameters were estimated using the maximum-likelihoodmethod in Mathematica (Wolfram Research, Champaign, IL). MCMCmodeling was not used because υ, the Weibull shape parameter, showspoor mixing.24
Markov chain Monte Carlo implementationMathematica (Wolfram Research, Champaign, IL) was used for estimatingindividual level parameters. Both SPSS (IBM, Armonk, NY) and the Rstatistics program were used for exploratory statistical analyses.23,25
Bayesian analysis was conducted using the well-established MarkovChain Monte Carlo (MCMC) method in the RJAGS software (MartynPlummer). To allow the MCMC chains to converge we employed aconservative burn-in phase of 50,000 runs before evaluating any statistics.The MCMC algorithm was implemented for 3 chains each with 200,000runs and thinning interval of 2.The MCMC runs were analyzed with the CODA package.26 Add-on code
for analyzing the von Mises distribution in RJAGS was developed by ColinStoneking and Klaus Oberauer (Department of Cognitive Psychology,University of Zurich, Switzerland).Convergence and mixing were assessed using multiple approaches.
First, visual inspection of parameter trace plots was conducted forevidence of poor mixing. The Gelman-Rubin-Brooks plot, which showsthe evolution of Gelman and Rubin’s shrink factor as the number ofiterations increases,27 and the Gelman and Rubin multiple sequenceconvergence diagnostic were also examined.27–29 The Gelman-Rubinstatistic was less than 1.05.For visual predictive checks, the empirical density functions were
computed from the histogram data. The density plots from RJAGsimulations were compared to the empirical density functions. Histogramdensities were visually overlaid on the estimated density function to obtaina visual reference.The Bayesian analyses were conducted on a MacBook Pro laptop
computer running the OS X Yosemite operating system version 10.10.3.
J. Knights et al.
7
Scripps Research Translational Institute npj Digital Medicine (2019) 20
Analyses of the prompt corrector sub-groupFollowing the identification of this sub-group of patients, we defined apatient to be a PC if they exhibited a pFS= 1 and as a NPC otherwise.Mann-Whitney tests were used to compare model ingestion-relatedparameters of the PC group to those of the NPC group. The frequenciesof PC patients in the schizophrenia, bipolar type 1, and major depressivedisorder populations of SMI were compared using the χ2 test. The survivalfunctions of the observed ingestion duration were compared using theKaplan-Meier log-rank test. These analyses were conducted using IBM SPSSStatistics software (version 24, IBM Corp., Armonk, NY).
Code AvailabilityBased on the proprietary nature of modifications made to the code toaccommodate the digital medicine data, it may not be made available inall cases for a period of at least five years from publication. Requests foraccess to source code must be made on an individual basis to thecorresponding author and would require evaluation on an individual basis.The authors made the appropriate materials available to the editorial staffduring the review process for verification of results.
DATA AVAILABILITYBased on the proprietary nature of the data, it may not be made available for a periodof at least 5 years from publication. Requests would require evaluation on anindividual basis. The authors made the appropriate materials available to the editorialstaff during the review process for verification of results.
ACKNOWLEDGEMENTSThe authors would like to acknowledge the support and insight of the Otsuka digitalmedicine team. This work was funded by Otsuka Pharmaceutical Development andCommercialization.
AUTHOR CONTRIBUTIONSJ.K. drafted the article and all authors provided comments and revisions. J.K. andT.P.S. were involved in the collection of the clinical data. All authors were involved inthe overall design of the project. M.R. implemented the base Bayesian methodologyand executed the analysis.
ADDITIONAL INFORMATIONCompeting interests: J.K, Z.H, and T.P.S. are all employees of Otsuka PharmaceuticalDevelopment and Commercialization. The remaining author declares no competinginterests.
Publisher’s note: Springer Nature remains neutral with regard to jurisdictional claimsin published maps and institutional affiliations.
REFERENCES1. Kane, J. M., Kishimoto, T. & Correll, C. U. Non-adherence to medication in patients
with psychotic disorders: epidemiology, contributing factors and managementstrategies. World Psychiatry 12, 216–226 (2013).
2. Cutler, D. M. & Everett, W. Thinking outside the pillbox—medicationadherence as a priority for health care reform. N. Engl. J. Med. 362, 1553–1555(2010).
3. Valenstein, M. et al. Antipsychotic adherence over time among patients receivingtreatment for schizophrenia: a retrospective review. J. Clin. Psychiatry 67,1542–1550 (2006).
4. Velligan, D. I., Sajatovic, M., Hatch, A., Kramata, P. & Docherty, J. P. Why dopsychiatric patients stop antipsychotic medication? A systematic review of rea-sons for nonadherence to medication in patients with serious mental illness.Patient Prefer. Adherence 11, 449–468 (2017).
5. El-Mallakh, P. & Findlay, J. Strategies to improve medication adherence inpatients with schizophrenia: the role of support services. Neuropsychiatr. Dis.Treat. 11, 1077–1090 (2015).
6. Andrade, S. E., Kahler, K. H., Frech, F. & Chan, K. A. Methods for evaluation ofmedication adherence and persistence using automated databases. Pharma-coepidemiol. Drug Saf. 15, 565–574 (2006).
7. Nau, D. P. Proportion of Days Covered (PDC) as a Preferred Method of MeasuringMedication Adherence. (Pharmacy Quality Alliance, Springfield, VA, 2012).
8. European Medicines Agency. Committee for Medicinal Products for Human Use(CHMP). Qualification Opinion on Ingestible Sensor System For Medication Adher-ence as Biomarker For Measuring Patient Adherence To Medication In Clinical Trials.Background Information as Submitted by the Applicant. (2016).
9. Torjensen, I. Devising ways to improve medicines adherence. Pharm. J. 295, 7883(2015).
10. Frias, J. et al. Effectiveness of digital medicines to improve clinical outcomes inpatients with uncontrolled hypertension and type 2 diabetes: prospective, open-label, cluster-randomized pilot clinical trial. J. Med. Internet Res. 19, e246 (2017).
11. Fellows, K., Stoneking, C. J. & Ramanathan, M. Bayesian population modeling ofdrug dosing adherence. J. Pharmacokinet. Pharmacodyn. 42, 515–525 (2015).
12. Fellows, K. et al. A hybrid Markov chain-von Mises density model for the drug-dosing interval and drug holiday distributions. AAPS J. 17, 427–437 (2015).
13. Wong, D., Modi, R. & Ramanathan, M. Assessment of Markov-dependent sto-chastic models for drug administration compliance. Clin. Pharmacokinet. 42,193–204 (2003).
14. FDA. FDA approves pill with sensor that digitally tracks if patients have ingestedtheir medication. 2018 (2017). https://www.fda.gov/NewsEvents/Newsroom/PressAnnouncements/ucm584933.htm. Accessed 13 Feb 2019.
15. Cantor, C. R., Wollenzien, P. L. & Hearst, J. E. Structure and topology of 16Sribosomal RNA. An analysis of the pattern of psoralen crosslinking. Nucleic AcidsRes. 8, 1855–1872 (1980).
16. Cantor, C. R. & Schimmel, P. R. The Behavior of Biological Macromolecules.(W.H. Freeman, San Francisco, California, USA, 1980).
17. Zimm, B. H. & Bragg, J. K. Theory of the phase transition between helix andrandom coil in polypeptide chains. J. Chem. Phys. 31, 526–535 (1959).
18. De Las Cuevas, C., de Leon, J., Peñate, W. & Betancort, M. Factors influencingadherence to psychopharmacological medications in psychiatric patients: a struc-tural equation modeling approach. Patient Prefer. Adherence 11, 681–690 (2017).
19. Barnett, I. et al. Relapse prediction in schizophrenia through digital phenotyping:a pilot study. Neuropsychopharmacology 43, 1660–1666 (2018).
20. Onnela, J.-P. & Rauch, S. L. Harnessing smartphone-based digital phenotyping toenhance behavioral and mental health. Neuropsychopharmacology 41,1691–1696 (2016).
21. Ghandeharioun, A. et al. Objective assessment of depressive symptoms withmachine learning and wearable sensors data. in 2017 Seventh InternationalConference on Affective Computing and Intelligent Interaction (ACII) 325–332(IEEE, San Antonio, Texas, USA, 2017).
22. Rajarshi, M. B. Markov chains and their extensions. in Statistical Inference forDiscrete Time Stochastic Processes 19–38 (Springer, India, 2012). https://doi.org/10.1007/978-81-322-0763-4.
23. Agostinelli, A. & Lund, U. Circular Statistics (version 0.4-7) (2013).24. Plummer, M. & Eacker, D. Weibull Model: Problem With Slow Mixing and Effective
Sample. (2015). http://sourceforge.net/p/mcmc-jags/discussion/610036/thread/d5249e71/. Accessed 13 Feb 2019.
25. R Core Team. R: A Language and Environment for Statistical Computing. R Foun-dation for Statistical Computing. (2014).
26. Plummer, M., Best, N., Cowles, K. & Vines, K. CODA: convergence diagnosis andoutput analysis for MCMC. R. News 6, 7–11 (2006).
27. Brooks, S. P. & Gelman, A. General methods for monitoring convergence ofiterative simulations. J. Comput. Graph. Stat. 7, 434–455 (1998).
28. Gelman, A., Carlin, J. B., Stern, H. S. & Rubin, D. B. Bayesian Data Analysis. Texts inStatistical Science. (CRC Press, Boca Raton, Florida, USA, 2004).
29. Gelman, A. & Rubin, D. B. Inference from iterative simulation using multiplesequences. Stat. Sci. 7, 457–511 (1992).
30. Morosini, P. L., Magliano, L., Brambilla, L., Ugolini, S. & Pioli, R. Development,reliability and acceptability of a new version of the DSM‐IV Social and Occupa-tional Functioning Assessment Scale (SOFAS) to assess routine social funtioning.Acta Psychiatr. Scand. 101, 323–329 (2000).
Open Access This article is licensed under a Creative CommonsAttribution 4.0 International License, which permits use, sharing,
adaptation, distribution and reproduction in anymedium or format, as long as you giveappropriate credit to the original author(s) and the source, provide a link to the CreativeCommons license, and indicate if changes were made. The images or other third partymaterial in this article are included in the article’s Creative Commons license, unlessindicated otherwise in a credit line to the material. If material is not included in thearticle’s Creative Commons license and your intended use is not permitted by statutoryregulation or exceeds the permitted use, you will need to obtain permission directlyfrom the copyright holder. To view a copy of this license, visit http://creativecommons.org/licenses/by/4.0/.
© The Author(s) 2019
J. Knights et al.
8
npj Digital Medicine (2019) 20 Scripps Research Translational Institute