Embed Size (px)
Citation preview
EVALUATING LIMEROCK-BASE THICK LIFT
By
JEONGSOO KO
A THESIS PRESENTED TO THE GRADUATE SCHOOL OF THE UNIVERSITY OF FLORIDA IN PARTIAL FULFILLMENT
OF THE REQUIREMENTS FOR THE DEGREE OF MASTER OF ENGINEERING
UNIVERSITY OF FLORIDA
2005

Copyright 2005
by
Jeongsoo Ko

To my family, especially my lovely wife.
iv
ACKNOWLEDGMENTS
I would like to express my sincere gratitude to Dr. Michael C. McVay for the
opportunity to do this project and for my invaluable guidance during the research. I also
wish to express my thanks to Dr. Frank C. Townsend and Dr. Bjorn Birgisson for
teaching the basic concept on which my study is based. I appreciate their time and efforts
they devoted to serving on my supervisory committee.
I also wish to express my gratitude to Dr. Putcha of the FDOT for his financial
support. For supporting installation and measuring of soil properties, I also thank to Mr.
Werner of Ardaman & Associates, Orlando, FL and the Florida State Materials Office. I
deeply appreciate the interest and overall support received from Mr. Tim Relke from
District 2 and Mr. Jack Banning.
I thank the geotechnical group of the Civil and Coastal Engineering Department, at
the University of Florida. I would like to say thank Scott for his help for recommending
this project and for my friendship with Zihong and Lila.
Finally, I thank my wife, Yookyeong for her patience, encouragement, and sacrifice
for 2 years of my graduate study, and I thank my family for their endless love and support.
v
TABLE OF CONTENTS page
ACKNOWLEDGMENTS ................................................................................................. iv
LIST OF TABLES............................................................................................................ vii
LIST OF FIGURES ........................................................................................................... ix
ABSTRACT...................................................................................................................... xii
CHAPTER
1 INTRODUCTION ........................................................................................................1
1.1 General....................................................................................................................1
1.2 Objective.................................................................................................................2
1.3 Scope.......................................................................................................................3
1.3.1 Task 1 ...........................................................................................................3
1.3.2 Task 2 ...........................................................................................................4
1.3.3 Task 3 ...........................................................................................................4
2 COMPACTION BACKGROUND...............................................................................5
2.1 Field Vibratory Compaction ...................................................................................5
2.2 Strength, Moisture and Compactive Effort.............................................................6
2.3 Intelligent Compaction .........................................................................................10
3 TEST SITE AND INSTRUMENTATION ................................................................14
3.1 Materials, Site Layout, and Equipment ................................................................14
3.2 Embedded Instrumentation...................................................................................15
3.2.1 Accelerometers ...........................................................................................17
3.2.2 LVDT .........................................................................................................18
3.2.3 Stress Cell ...................................................................................................18
4 RESULTS AND DISCUSSION.................................................................................20
4.1 Stress Measurements ............................................................................................20
4.2 Compactive Energy vs. Depth ..............................................................................22
4.3 LVDT Strains & Measured Densities...................................................................26
4.4 Measured Dry Densities and Moistures vs. FDOT Specified Values ..................30
vi
4.5 Base Stiffness........................................................................................................33
4.6 Base Strength vs. Depth........................................................................................38
5 SUMMARY, CONCLUSION AND CONCLUSIION ..............................................44
5.1 Summary...............................................................................................................44
5.2 Conclusion ............................................................................................................46
5.3 Recommendation ..................................................................................................47 APPENDIX
A SIEVE ANALYSIS RESULTS..................................................................................48
B MOISTURE CONTENT MEASURED BY NUCLEAR DENSITY PROBE...........58
C OVEN MOISTURE CONTENT RESULTS..............................................................62
D DATA REDUCING....................................................................................................63
D.1 Calculation for Reducing Data ............................................................................63
D.1.1 Stress..........................................................................................................63
D.1.2 Strain..........................................................................................................63
D.1.3 Acceleration...............................................................................................64
D.1.4 Velocity and Displacement from Acceleration Data.................................64
D.1.5 Dynamic Stiffness......................................................................................64
D.2 Using Worksheet after 3 Passes with Vibratory Padfoot Roller in Section 2......65
D.2.1 Raw Data ...................................................................................................65
D.2.2 Reduced Data.............................................................................................66
E RESULTS OF SSG.....................................................................................................70
F RESULTS OF FWD...................................................................................................72
G RESULTS OF ADCP .................................................................................................76
LIST OF REFERENCES...................................................................................................82
BIOGRAPHICAL SKETCH .............................................................................................83
vii
LIST OF TABLES
Table page 4-1. Measured Dry Densities from Nuclear Device within Section 1 ...............................29
4-2. Measured and Computed Dry Densities from Nuclear Device within Section 2.......31
4-3. Measured and Computed Dry Densities from Nuclear Device within Section 3.......32
4-4. FWD Mean and Standard Deviation on Each Section ...............................................36
4-5. SSG Mean and Standard Deviation on Each Section .................................................38
4-6. Summary ADCP Results for Section 1.......................................................................41
4-7. Summary of ADCP Results for Section 2 ..................................................................41
4-8. Summary of ADCP Results for Section 3 ..................................................................41
5-1. Test Sections and Compactors....................................................................................45
A-1. Sample # vs. Location #.............................................................................................48
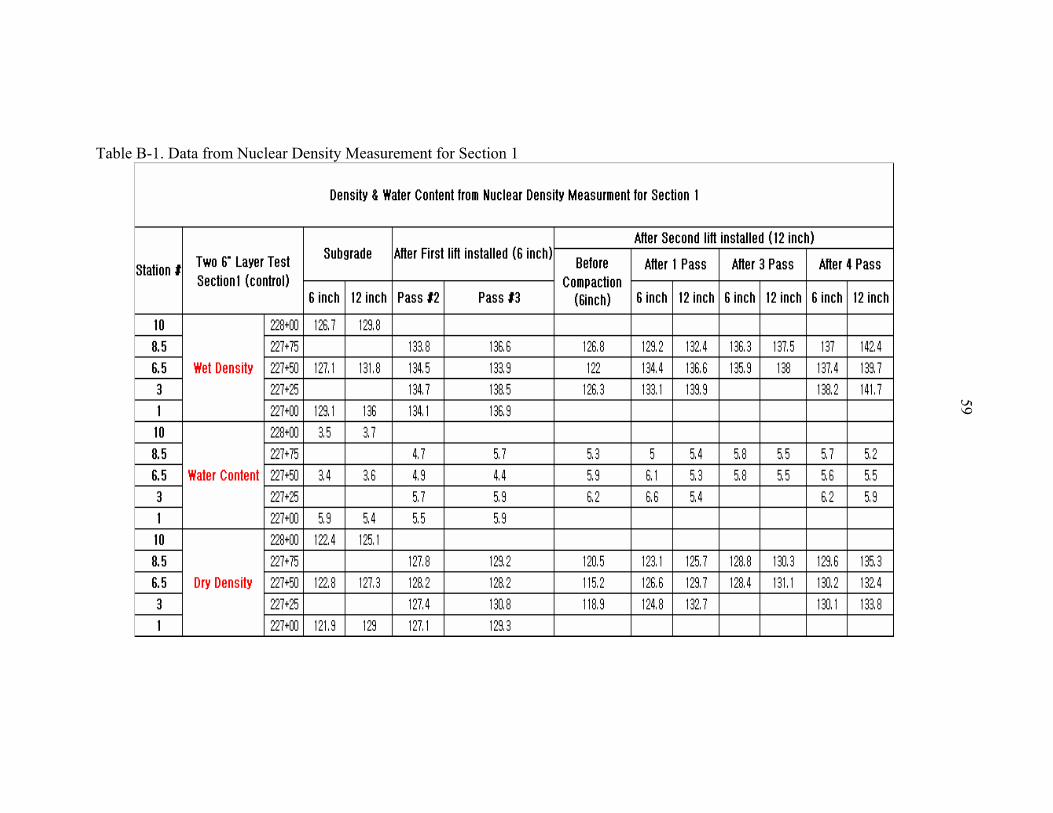
B-1. Data from Nuclear Density Measurement for Section 1............................................59
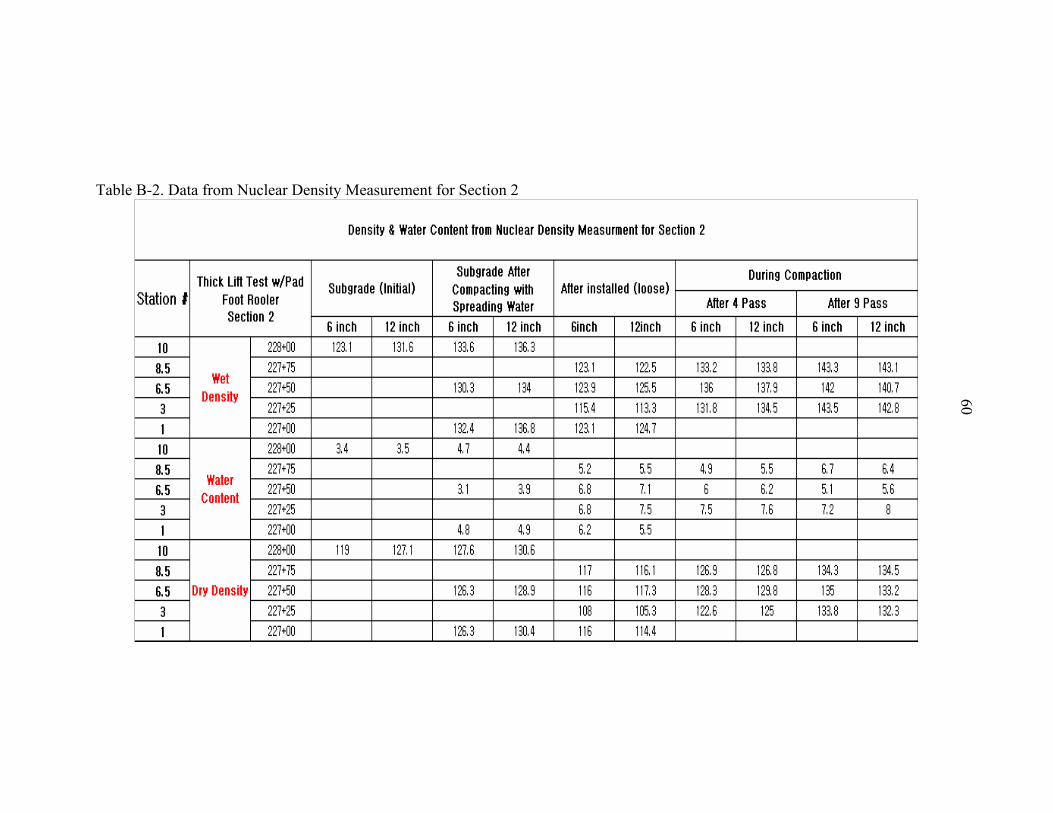
B-2. Data from Nuclear Density Measurement for Section 2............................................60
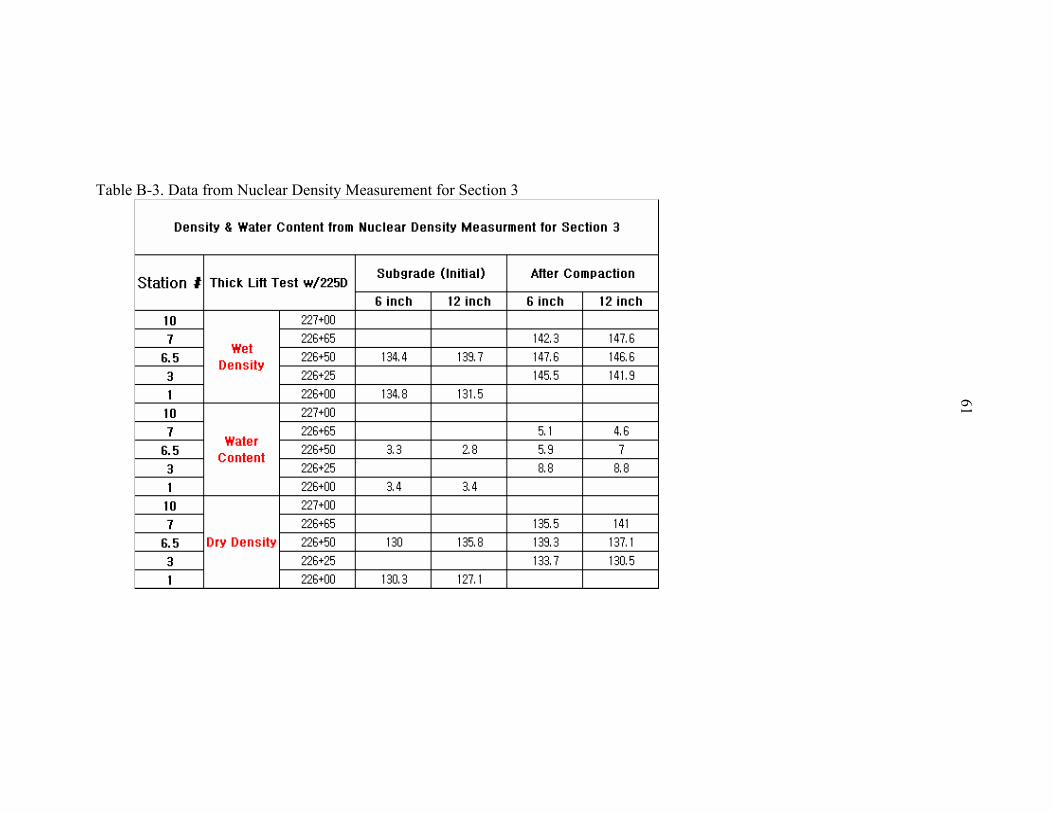
B-3. Data from Nuclear Density Measurement for Section 3............................................61
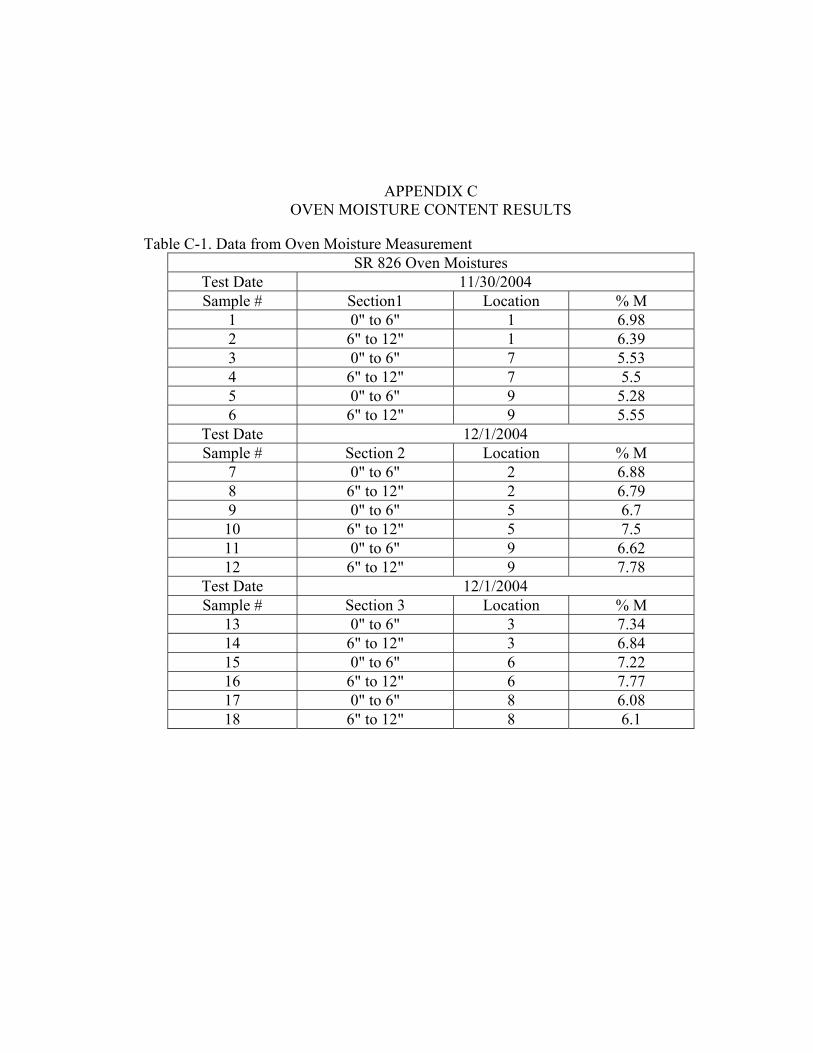
C-1. Data from Oven Moisture Measurement ...................................................................62
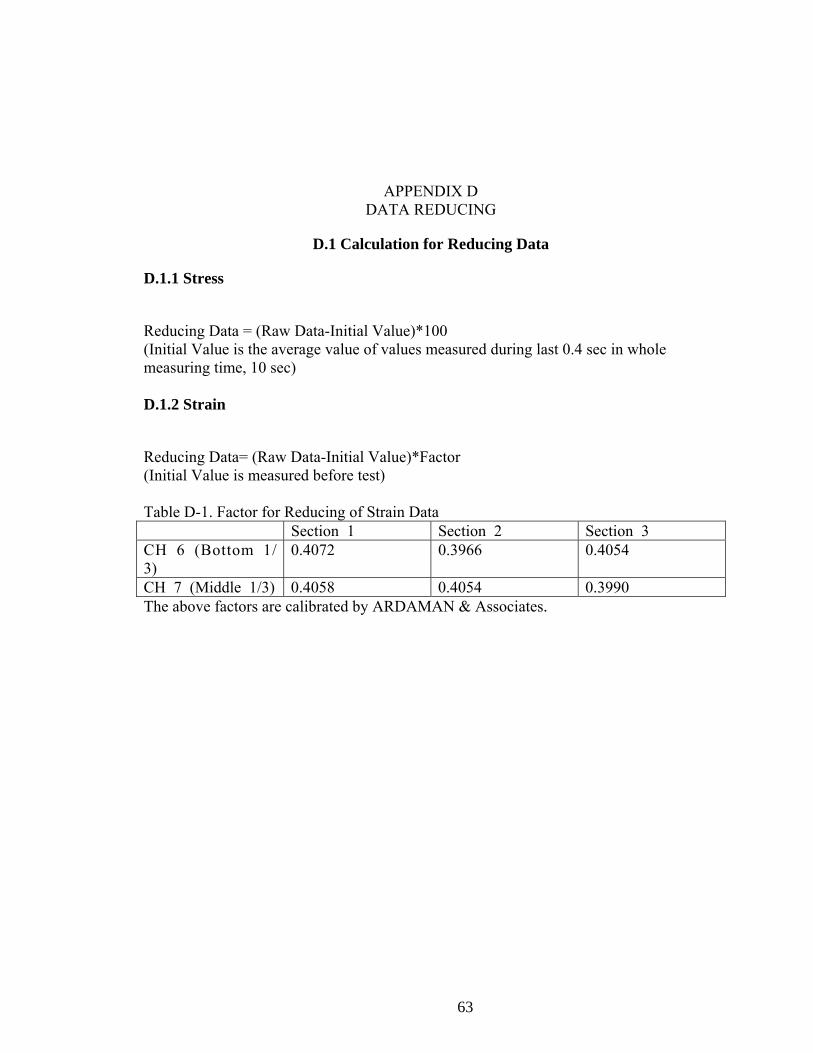
D-1. Factor for Reducing of Strain Data............................................................................63
D-2. Factor for Reducing of Acceleration Data.................................................................64
D-3. Example of Raw Data................................................................................................65
D-4. Example of Reduced Data .........................................................................................66
E-1. SSG Data for Section 1 ..............................................................................................70

viii
E-2. SSG Data for Section 2 ..............................................................................................71
E-3. SSG Data for Section 3 ..............................................................................................71
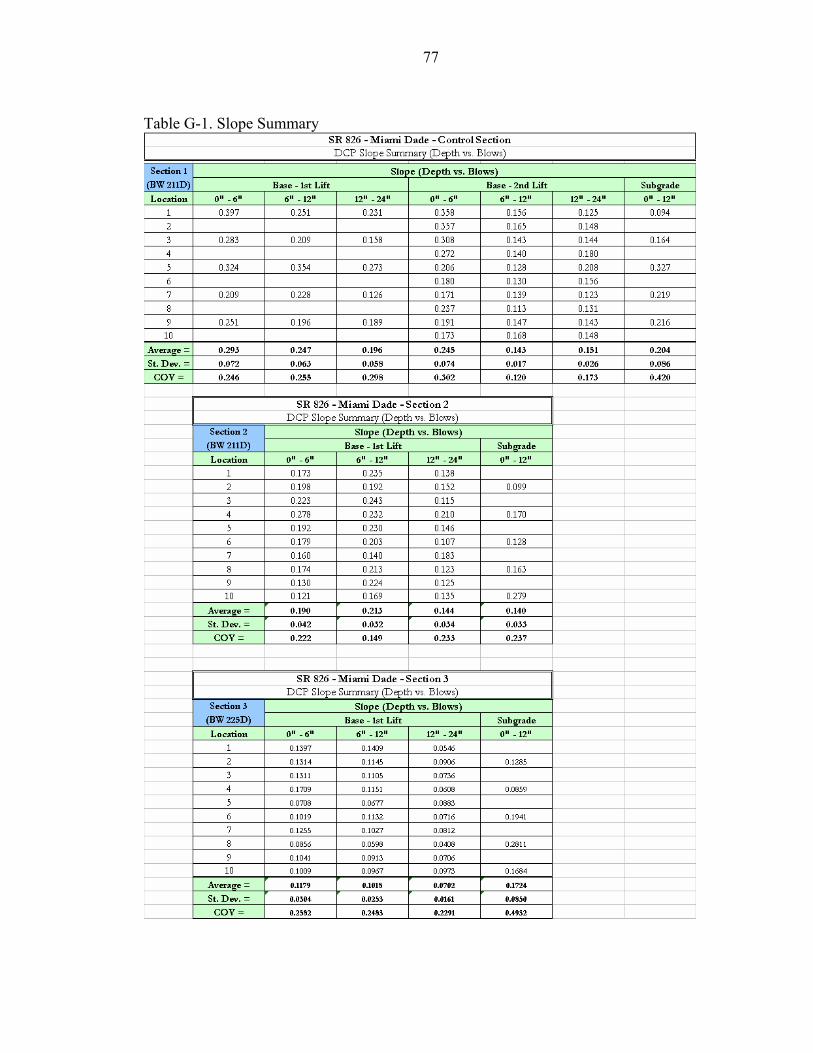
G-1. Slope Summary..........................................................................................................77
G-2. DCPI Summary..........................................................................................................78
ix
LIST OF FIGURES
Figure page 2-1. Relationships between Density, Compaction Energy and Strength vs. Moisture
Content. A) Strength vs. Water content for 25% Strain. B) Strength vs. Water content for 5% Strain. C) Dry Density vs. Water Content (Seed & Chan, 1959)...........................................................................................................................8
2-2. Relationships between Strength Parameter (CBR) vs. Moisture Content and Density vs. Various Compaction Energies (Turnbull & Foster, 1956) ......................9
2-3. The LBR vs. Moisture Content – Compacted to Dry Density of 123pcf .................10
2-4. Conventional Vibratory Roller .................................................................................11
2-5 Variocontrol Vibratory Rollers..................................................................................12
2-6. One Dimensional Model of Compactor and Subsoil................................................12
3-1. Limerock Grain Size Distribution ............................................................................14
3-2. Plan Views of Test Strips at SR-826 ........................................................................16
3-3. Test Section Compactors ..........................................................................................17
3-4. Section 1 Instrumentation – Two 6-inch Lifts..........................................................18
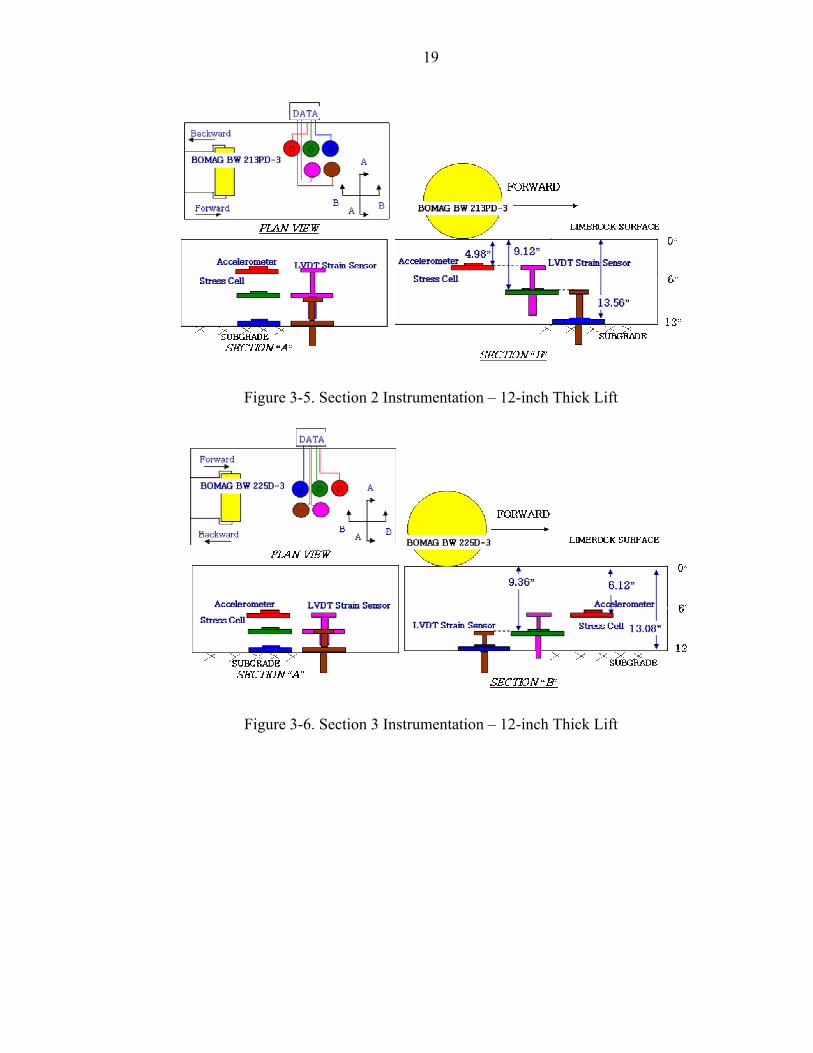
3-5. Section 2 Instrumentation – 12-inch Thick Lift .......................................................19
3-6. Section 3 Instrumentation – 12-inch Thick Lift .......................................................19
4-1. Measured Stress as Function of Time Due to a Passing Vibratory Roller ...............20
4-2. Stress vs. Number of Passes in two 6-inch lift on Section 1 ....................................21
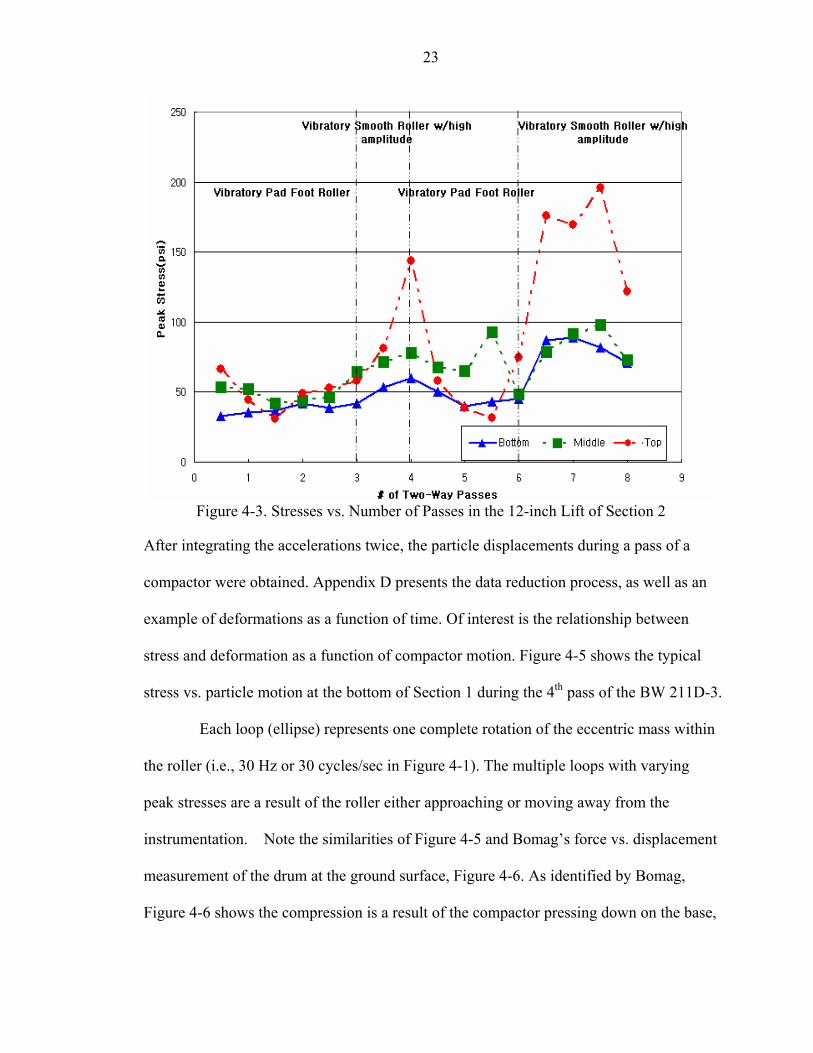
4-3. Stresses vs. Number of Passes in the 12-inch Lift of Section 2 ...............................23
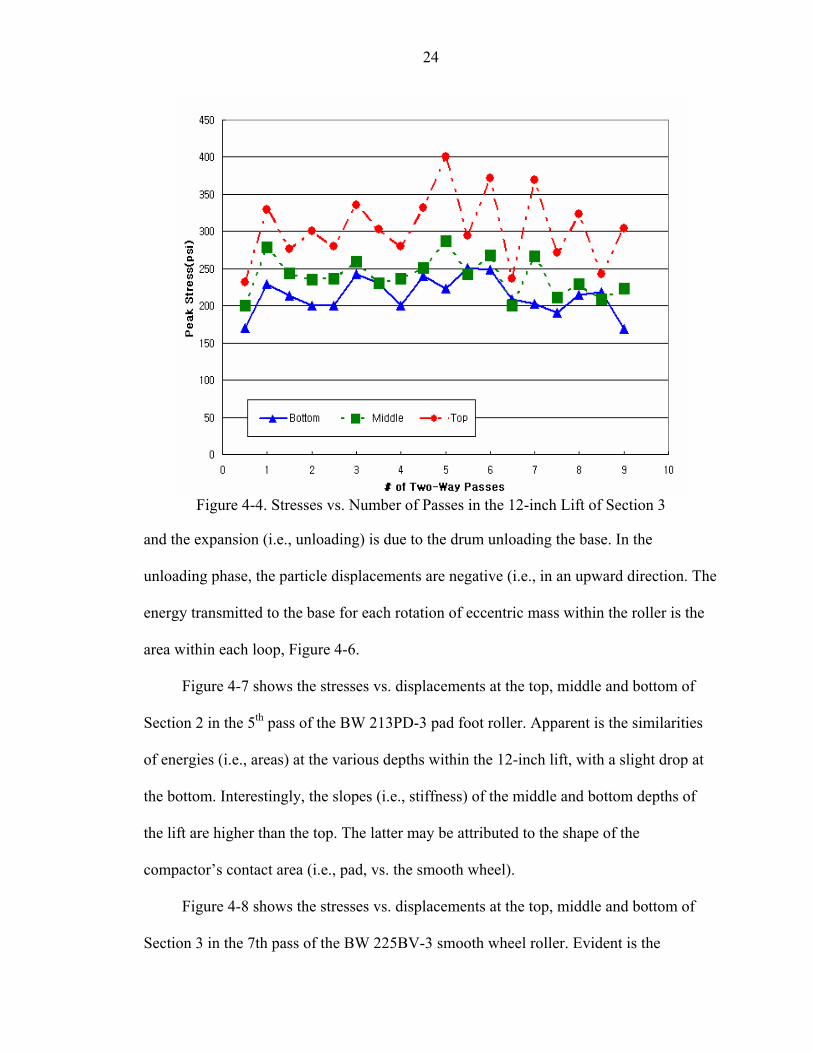
4-4. Stresses vs. Number of Passes in the 12-inch Lift of Section 3 ...............................24
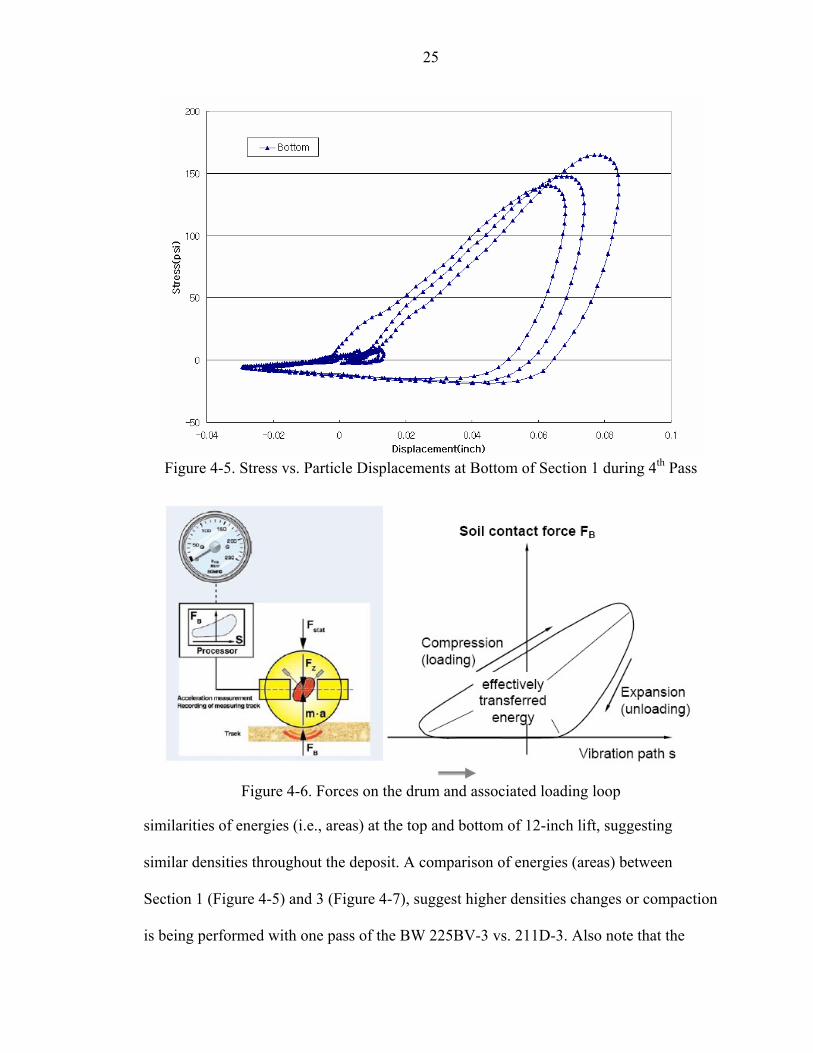
4-5. Stress vs. Particle Displacements at Bottom of Section 1 during 4th Pass ...............25
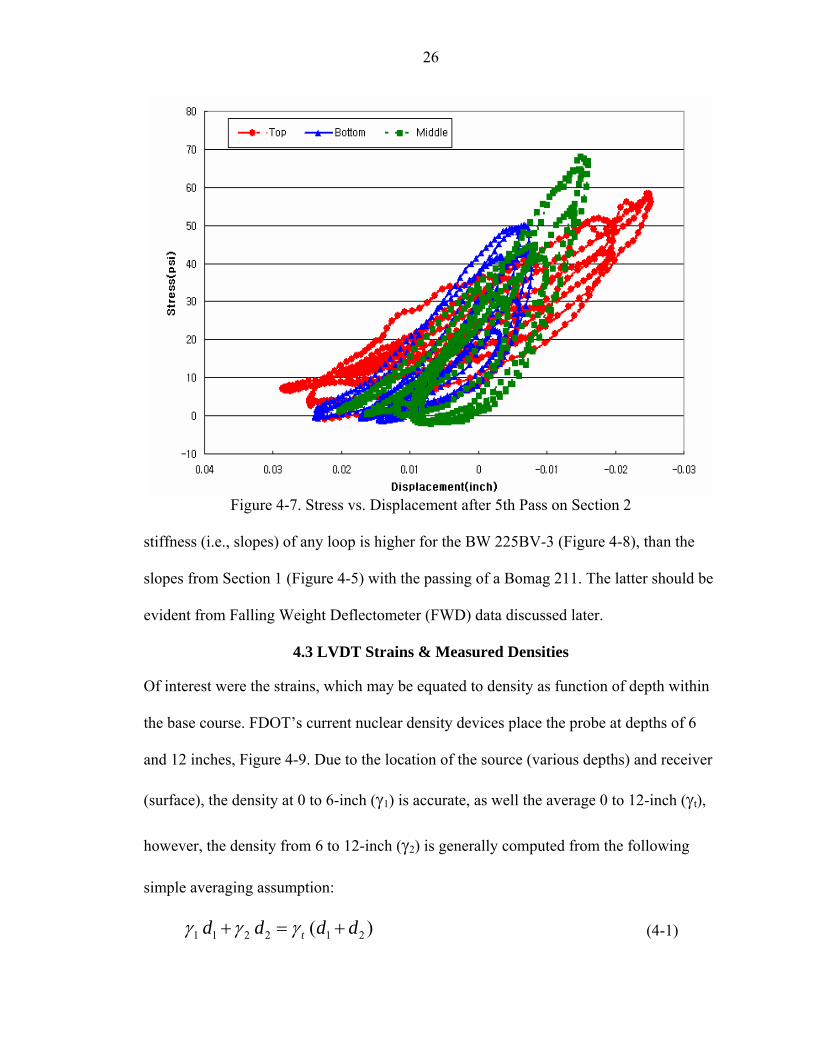
4-6. Forces on the drum and associated loading loop......................................................25
x
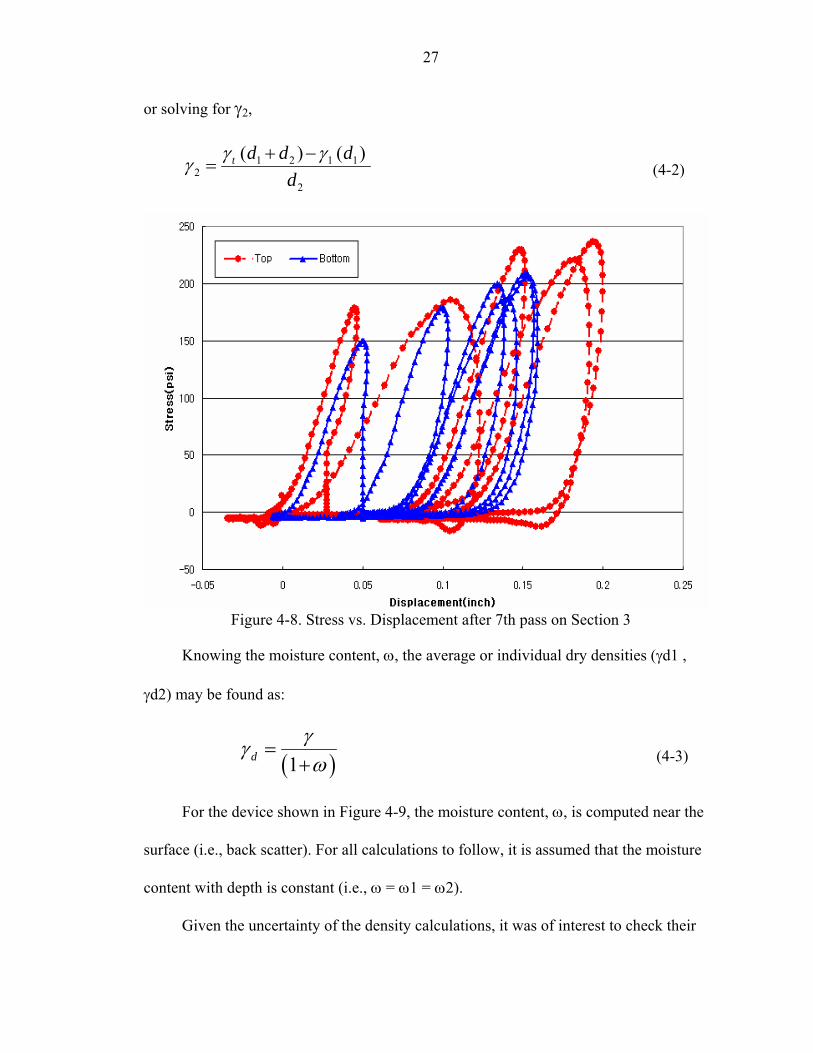
4-8. Stress vs. Displacement after 7th pass on Section 3.................................................27
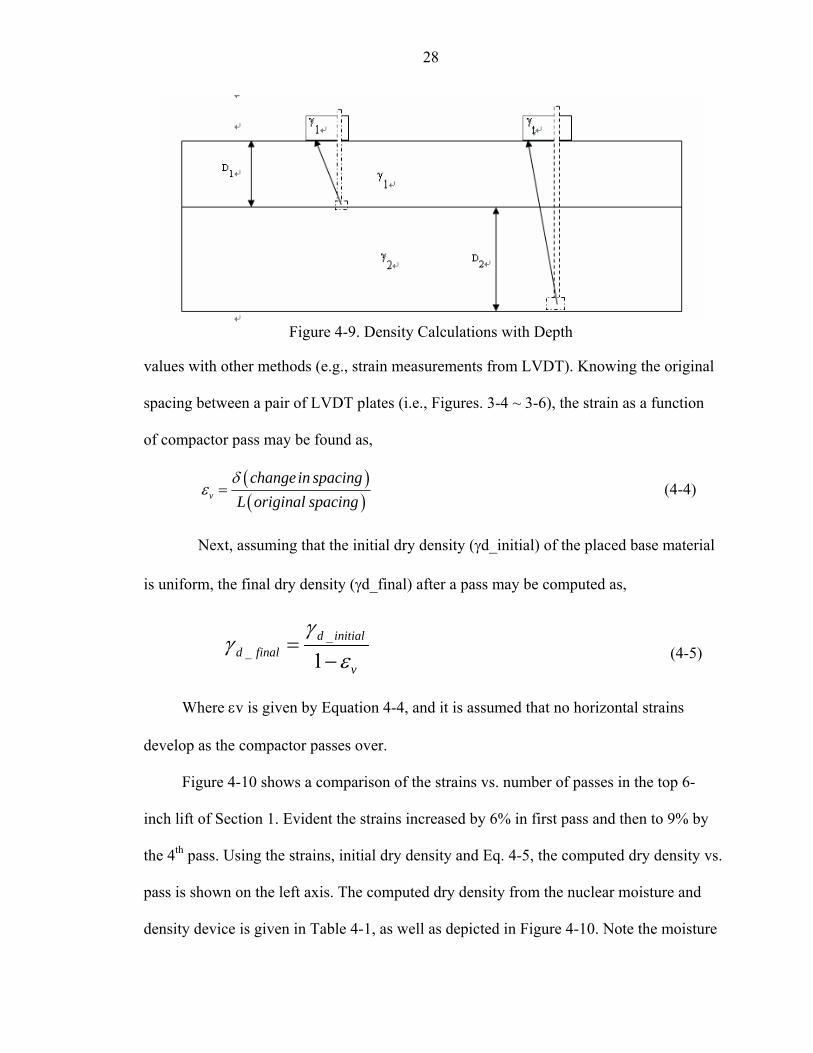
4-9. Density Calculations with Depth..............................................................................28
4-10. Strain from LVDT vs. Dry density from NDP for Section 1 .................................29
4.11 Strain from LVDT vs. Dry density from NDP for Section 2...................................31
4-12 train from LVDT vs. Dry density from NDP for Section 3.....................................32
4-13. Dry densities and Moisture Contents in Section 1 .................................................33
4-14. Dry Densities and Moisture Contents in Section 2.................................................34
4-15. Dry Densities and Moisture Contents in Section 3.................................................35
4-16. Stiffness Measured with FWD in All Sections.......................................................36
4-17. Stiffness measured by SSG in All Sections............................................................38
4-18. Stiffness from FWD & SSG vs. Dynamic Modulus from Vario-System...............39
4-19. Stiffness and Evib Moduli as Function of Depth and Number of Passes ................40
4-20 ADCP Data for Section 1 After 2nd Layer...............................................................41
4-21. ACDP Data for Section 2 .......................................................................................42
4-22. ACDP Data for Section 3 .......................................................................................42
4-23. Comparison ADCP Data from Section 1 and 2......................................................43
4-24. Comparison ADCP Data from Section 1 and 3......................................................43
A-1. Sieve Analysis for S1 and S2...................................................................................49
A-2. Sieve Analysis for S3 and S4...................................................................................50
A-3. Sieve Analysis for S5 and S6...................................................................................51
A-4. Sieve Analysis for S7 and S8...................................................................................52
A-5. Sieve Analysis for S9 and S10.................................................................................53
A-6. Sieve Analysis for S11 and S12...............................................................................54
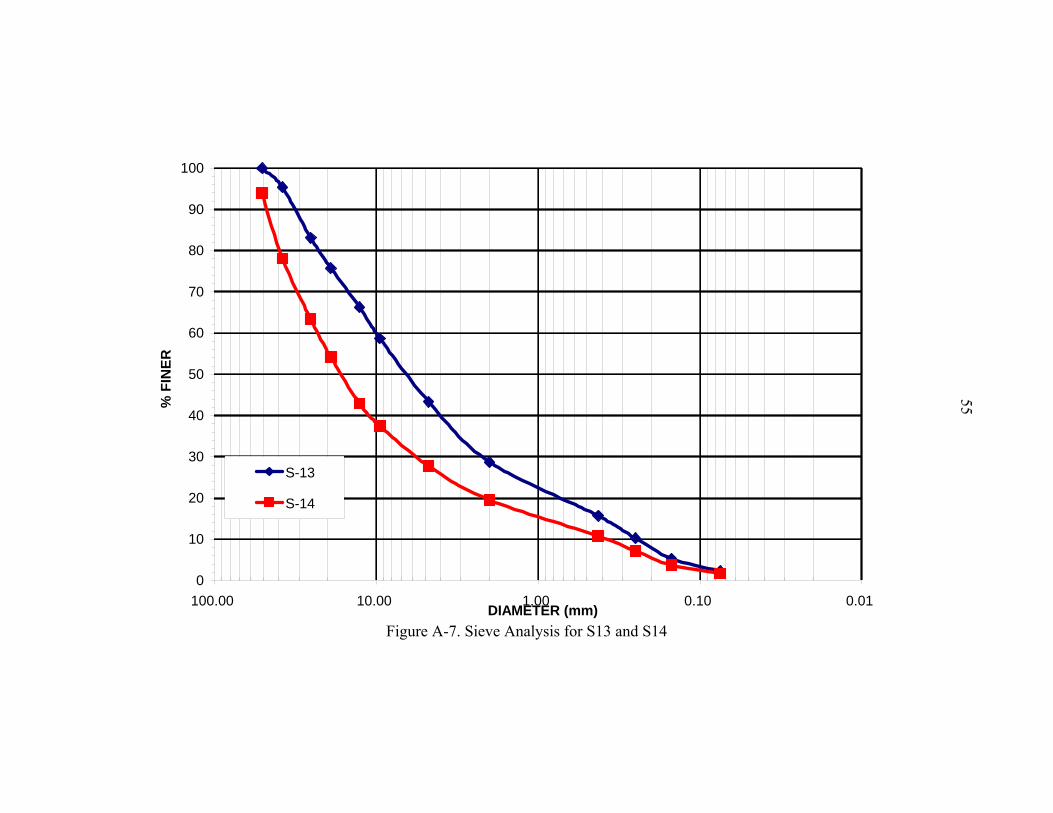
A-7. Sieve Analysis for S13 and S14...............................................................................55
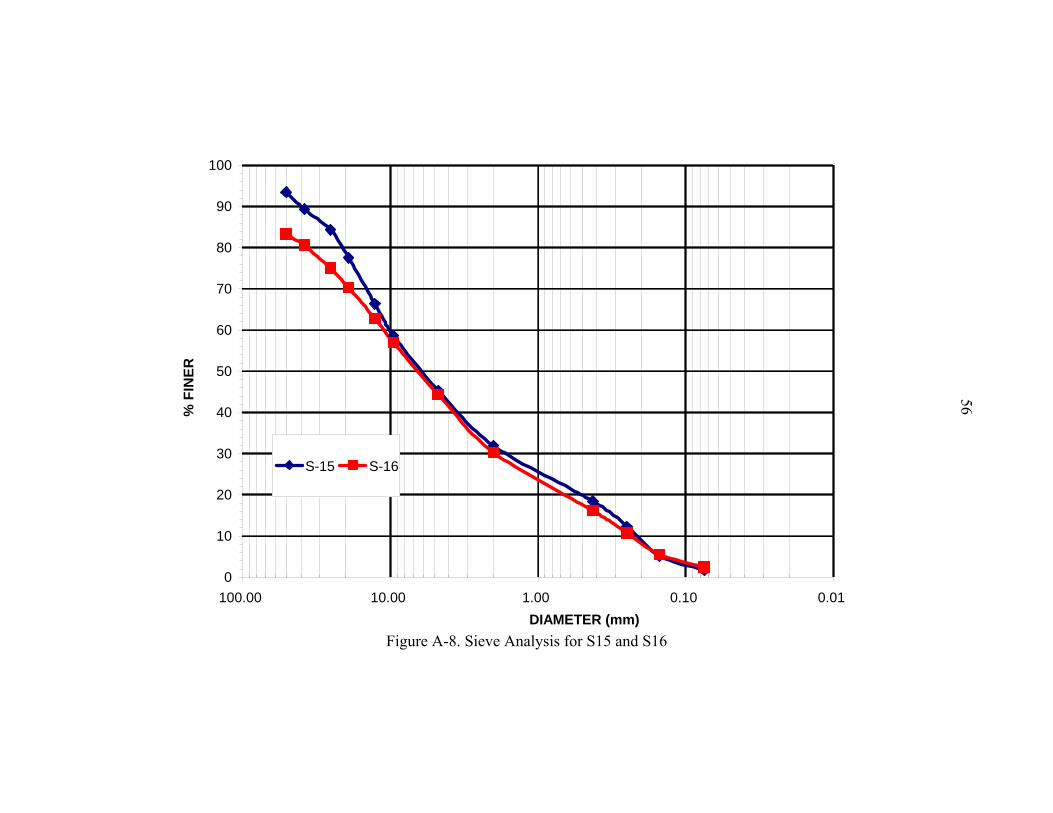
A-8. Sieve Analysis for S15 and S16...............................................................................56
xi
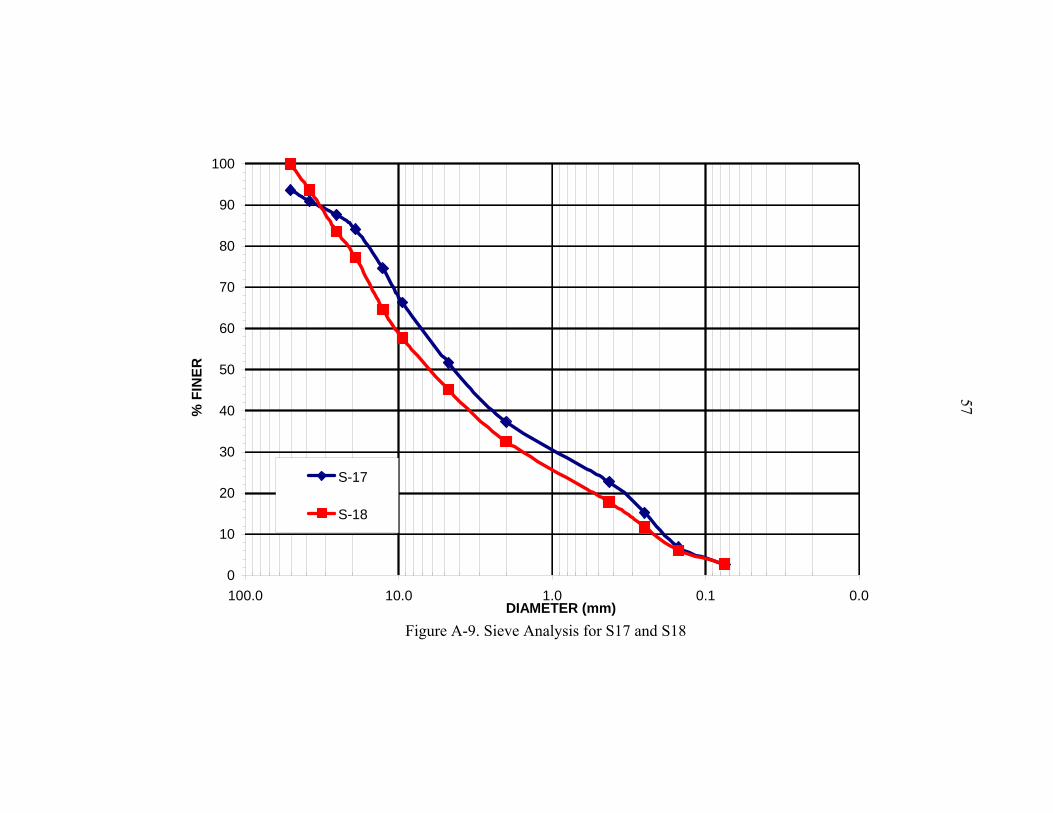
A-9. Sieve Analysis for S17 and S18...............................................................................57
D-1. Stress from Stress Cell vs.Time...............................................................................67
D-2. Displacement from LVDT vs. Time........................................................................68
D-3. Acceleration vs. Time..............................................................................................69
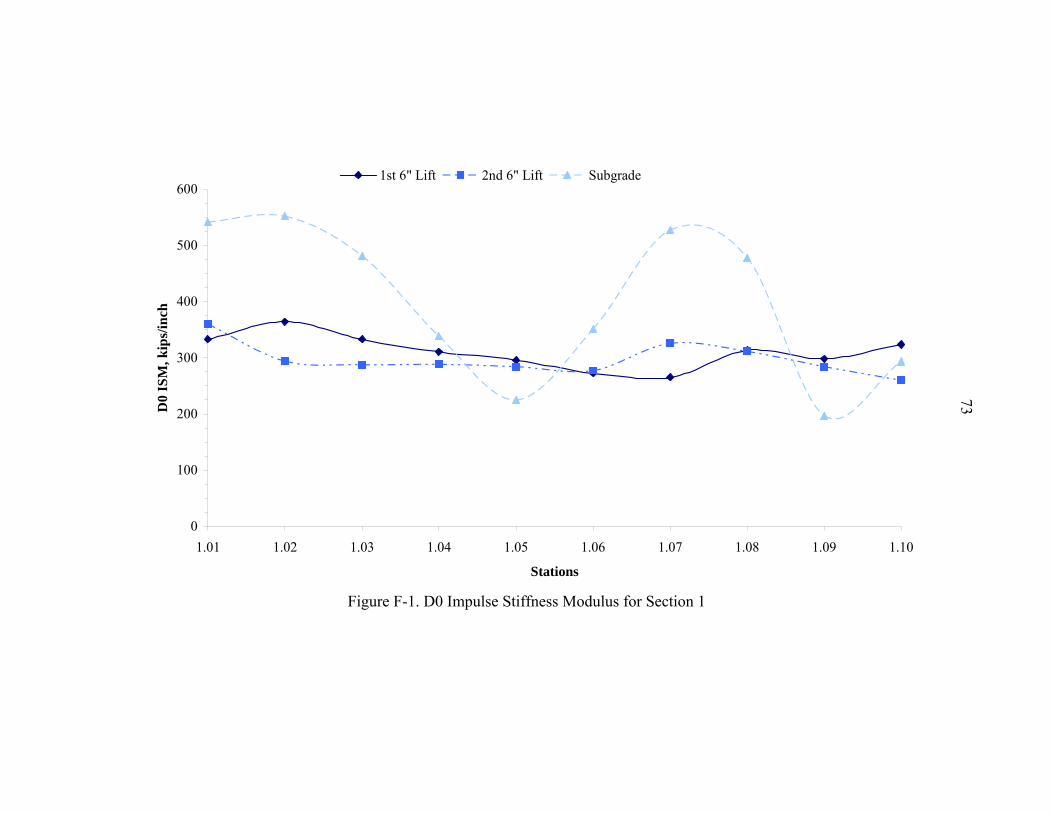
F-1. D0 Impulse Stiffness Modulus for Section 1 ...........................................................73
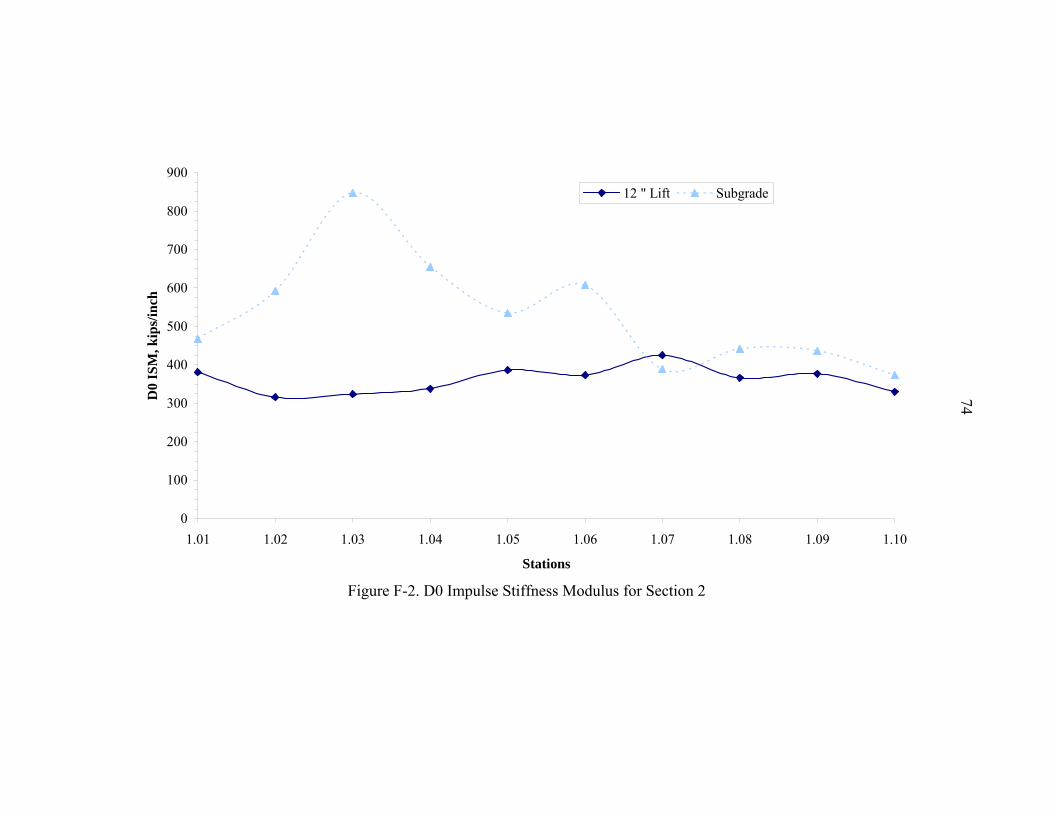
F-2. D0 Impulse Stiffness Modulus for Section 2 ...........................................................74
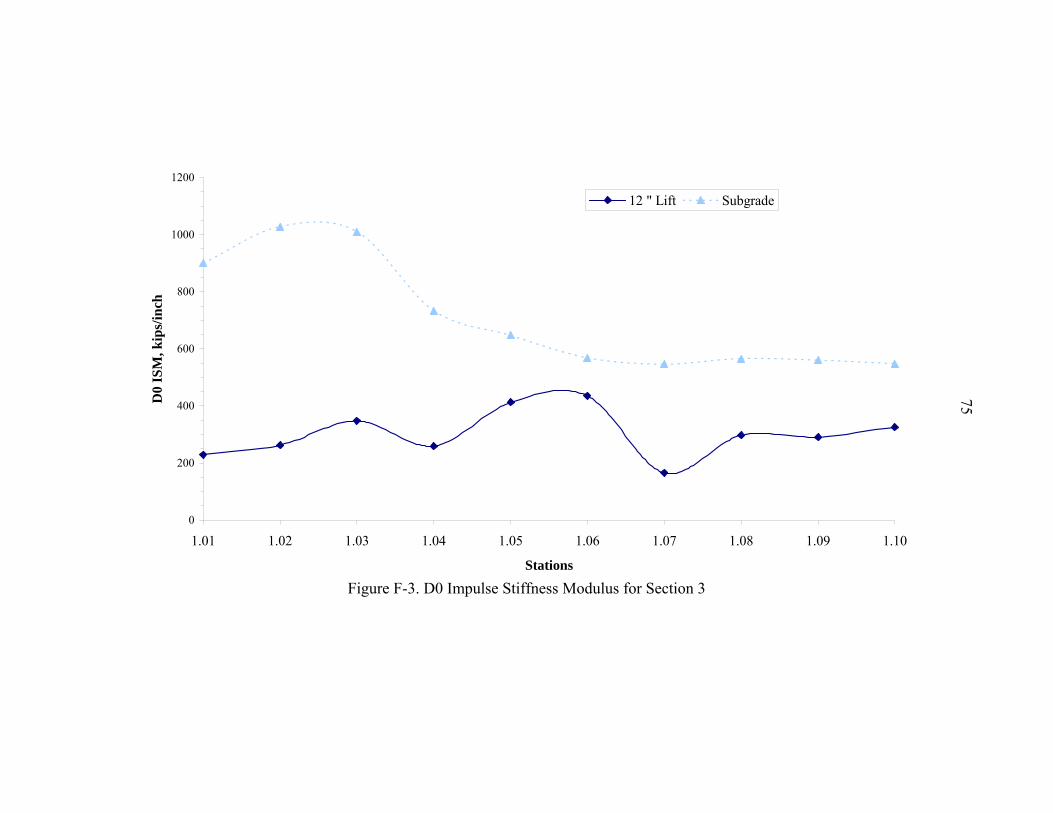
F-3. D0 Impulse Stiffness Modulus for Section 3 ...........................................................75
G-1. Depth vs. Number of Blows for Section 1...............................................................79
G-2. Depth vs. Number of Blows for Section 2...............................................................80
G-3. Depth vs. Number of Blows for Section 3...............................................................81
xii
Abstract of Thesis Presented to the Graduate School of the University of Florida in Partial Fulfillment of the Requirements for the Degree of Master of Engineering
EVALUATING LIMEROCK-BASE THICK LIFT
By
Jeongsoo Ko
August 2005
Chair: Michael C. McVay Major Department: Civil and Coastal Engineering
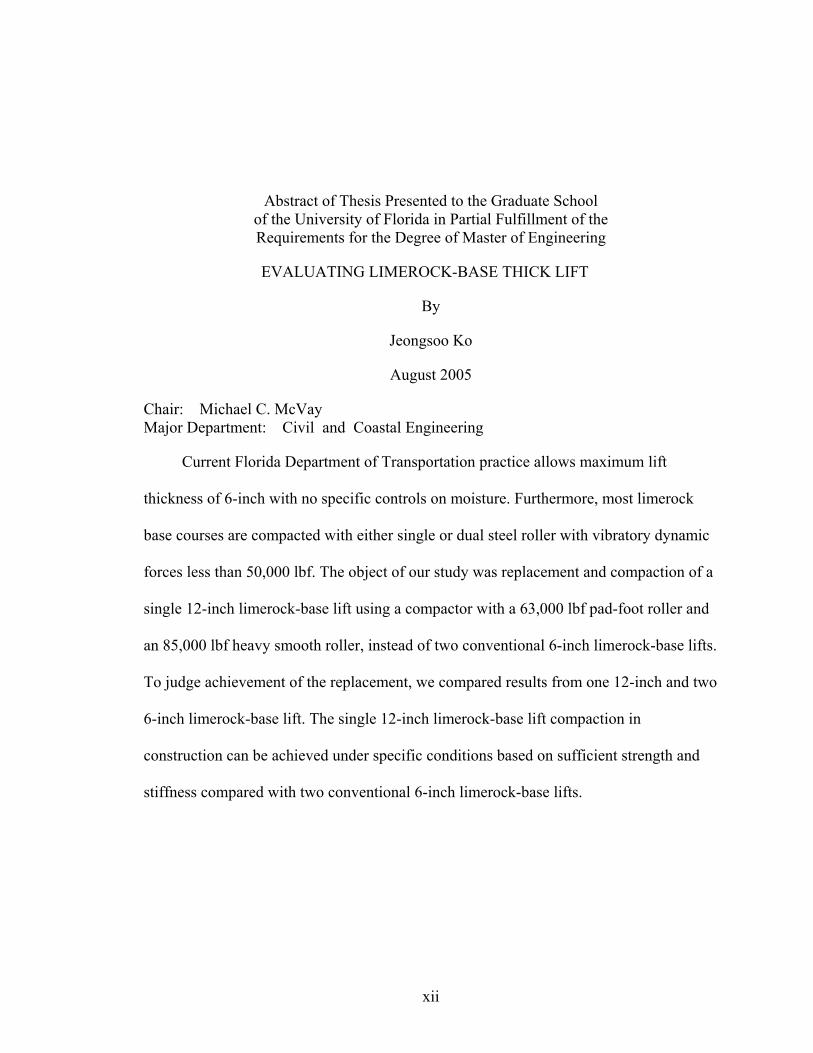
Current Florida Department of Transportation practice allows maximum lift
thickness of 6-inch with no specific controls on moisture. Furthermore, most limerock
base courses are compacted with either single or dual steel roller with vibratory dynamic
forces less than 50,000 lbf. The object of our study was replacement and compaction of a
single 12-inch limerock-base lift using a compactor with a 63,000 lbf pad-foot roller and
an 85,000 lbf heavy smooth roller, instead of two conventional 6-inch limerock-base lifts.
To judge achievement of the replacement, we compared results from one 12-inch and two
6-inch limerock-base lift. The single 12-inch limerock-base lift compaction in
construction can be achieved under specific conditions based on sufficient strength and
stiffness compared with two conventional 6-inch limerock-base lifts.
1
CHAPTER 1 INTRODUCTION
1.1 General
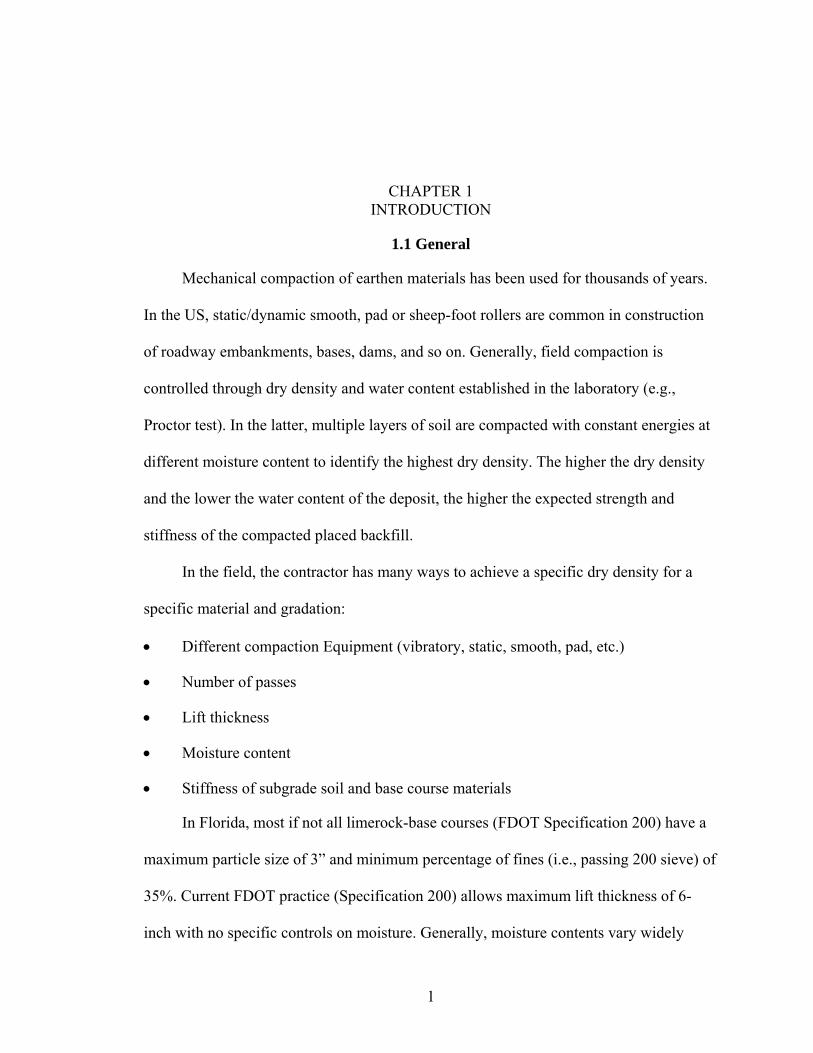
Mechanical compaction of earthen materials has been used for thousands of years.
In the US, static/dynamic smooth, pad or sheep-foot rollers are common in construction
of roadway embankments, bases, dams, and so on. Generally, field compaction is
controlled through dry density and water content established in the laboratory (e.g.,
Proctor test). In the latter, multiple layers of soil are compacted with constant energies at
different moisture content to identify the highest dry density. The higher the dry density
and the lower the water content of the deposit, the higher the expected strength and
stiffness of the compacted placed backfill.
In the field, the contractor has many ways to achieve a specific dry density for a
specific material and gradation:
• Different compaction Equipment (vibratory, static, smooth, pad, etc.)
• Number of passes
• Lift thickness
• Moisture content
• Stiffness of subgrade soil and base course materials
In Florida, most if not all limerock-base courses (FDOT Specification 200) have a
maximum particle size of 3” and minimum percentage of fines (i.e., passing 200 sieve) of
35%. Current FDOT practice (Specification 200) allows maximum lift thickness of 6-
inch with no specific controls on moisture. Generally, moisture contents vary widely
2
based on location (5% south Florida to 14% central Florida and north) of mine-material,
humidity, and so on. Most, if not all limerock-base courses are compacted with either
single or dual steel rollers with vibratory dynamic forces less than 50,000 lbf.
Of strong interest is the feasibility of compacting thicker lifts (e.g., a single 12-inch
lift instead of conventional two 6-inch lifts for roadway base courses). The compacting
single 12-inch lift appeals to contractors because it reduces costs (especially time). For
two conventional 6-inch lifts, the contractor must transport the material, grade it, compact
it and perform quality control (density, moisture, etc.) twice vs. once with a 12-inch lift.
1.2 Objective
Our object was placement and compaction of a single 12-inch limerock-lift instead
of two 6-inch lifts over competent subgrade. We focused on compaction equipment
readily available to contractors, and materials with no special gradation. Successful
placement was judged on similarities of stiffness and strength between the thick lift (12-
inch) and two 6-inch lifts constructed using the same material, conditions, and subgrade
conditions.
To identify the appropriate compaction equipment, passes, moisture, and so on, we
used instrumentation in the base (i.e., stress cells, LVDTs, and accelerometers). The
LVDTs were used to validate densities measured with nuclear devices, and the stress
cells and accelerometers measured stiffness and energies within the compacted fill.
Since thick lift limerock compaction has had minimal application in Florida, we
decided to select a site, materials, and equipment with the potential for success. The
following were selected: 1) vibratory pad foot roller or heavy smooth wheel vibratory
roller; 2) well graded limerock with limited fines at moisture content on dry of optimum
(higher stiffness & strength) and 3) stiff/strong subgrade (LBR > 100).
3
1.3 Scope
The site selected for thick lift compaction study by the FDOT was SR 826 in
Miami Florida, District 4. Located near Miami International Airport, SR 826 has Oolitic
limestone near the surface (i.e., a strong subgrade, LBR>100), with ongoing placement of
conventional 6-inch limerock lifts that were well graded, low fine content, and moisture
content varying from 5 to 9% from the source (i.e., dry of optimum).
After discussion with FDOT, Ardaman & Associates and UF personnel, we decided
to compact three 100-foot test sections. The first section was to be compacted by
conventional means (i.e., two 6-inch lifts, using a typical smooth-wheel vibratory
compactor). The second 100-foot test section used a 12-inch lift, and the vibratory pad-
foot roller (55,000 lbf). The third 100-foot test section also used a 12-inch lift, but
compacted with a heavier smooth-wheel vibratory compactor using intelligent
compaction control. The latter roller can measure soil stiffness, and can vary the applied
vertical dynamic force depending on the preset stiffness (modulus).
For all three sections, we measured vertical stress, acceleration, and strain for each
pass of the roller. We measured nuclear density and moisture content after three or four
passes of the compactor on each section. To measure strength and stiffness, we used
dynamic cone penetration, falling weight deflectometer, and the soil stiffness gauge test
at ten locations along each section. In addition, multiple bag samples were collected both
pre and post compaction from each section, and sieved to identify particle breakage due
to compaction. The following three tasks were completed by FDOT, Ardaman &
Associates, and University of Florida to complete the scope of services.
1.3.1 Task 1
The FDOT District CEI performed laboratory proctor results identifying optimum
4
moisture content and dry densities. The FDOT State Materials Office personnel
performed Falling Weight Deflection (FWD) Testing, Automatic Dynamic Cone
Penetrometer Testing (ADCPT), Soil Stiffness Gage (SSG) testing, bag sampling, and
laboratory sieve analysis of pre and post compacted limerock for the three test sections.
1.3.2 Task 2
Ardaman and Associates placed the instrumentation at multiple depths in each test
section, recorded the data for each pass of compactor, and collected nuclear density, and
moisture measurements for each test section.
1.3.3 Task 3
University of Florida collected all of the measured data (stresses, strains,
accelerations, FWD, ADCP, SSG, etc.) for each section, reduced it (stiffness, moduli,
energies, etc.) and compared sections (i.e., 6-inch lift vs. 12-inch).
5
CHAPTER 2 COMPACTION BACKGROUND
2.1 Field Vibratory Compaction
Typical vibratory compaction equipment includes hand-held plates (i.e., tampers),
and single, and multiple-wheels drum rollers. Our study tested vibrating smooth and pad-
foot rollers.
The basic concept of vibratory roller is to use unbalanced weights to develop
sinusoidal forces. In addition all vibratory rollers (i.e., towed, self-propelled, and/or
tandem) have the static weight (motor, frame, etc.) separated from the vibratory mass
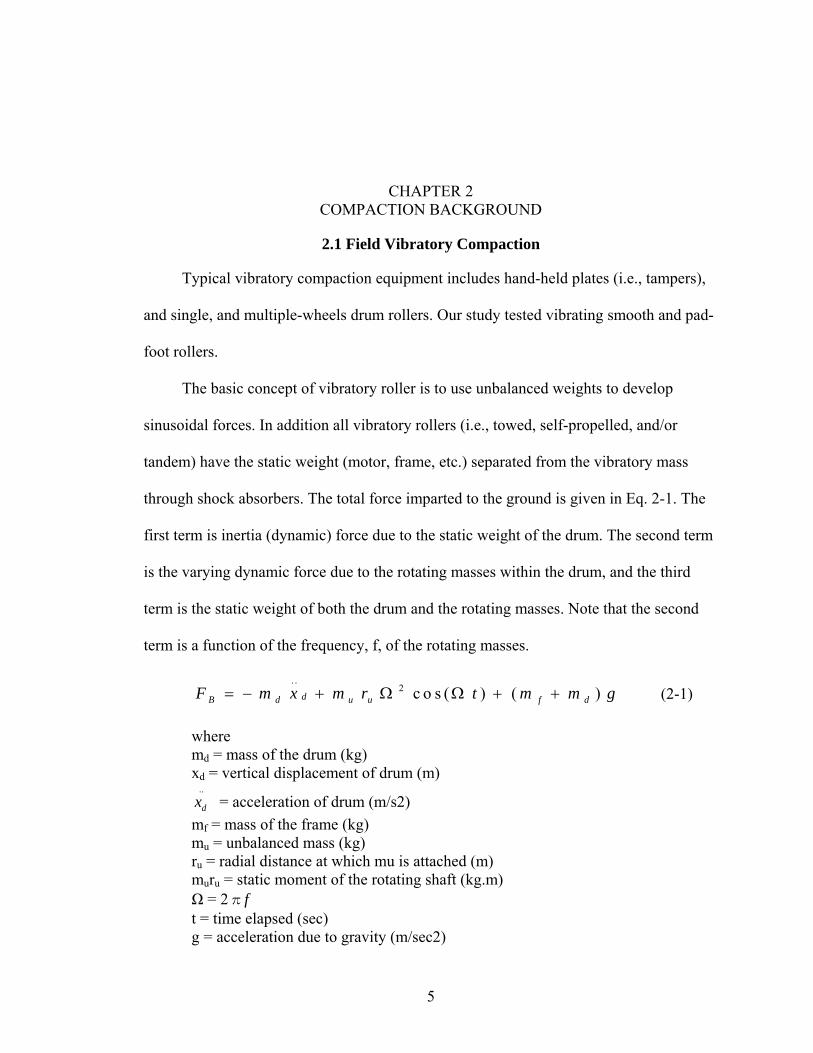
through shock absorbers. The total force imparted to the ground is given in Eq. 2-1. The
first term is inertia (dynamic) force due to the static weight of the drum. The second term
is the varying dynamic force due to the rotating masses within the drum, and the third
term is the static weight of both the drum and the rotating masses. Note that the second
term is a function of the frequency, f, of the rotating masses.
. .2 c o s ( ) ( )dB d u u f dF m x m r t m m g= − + Ω Ω + + (2-1)
where md = mass of the drum (kg) xd = vertical displacement of drum (m)
..
dx = acceleration of drum (m/s2) mf = mass of the frame (kg) mu = unbalanced mass (kg) ru = radial distance at which mu is attached (m) muru = static moment of the rotating shaft (kg.m) Ω = 2πf t = time elapsed (sec) g = acceleration due to gravity (m/sec2)
6
f = frequency of the rotating shaft (Hz)
Generally, the contribution from the second term is much less than that from the
first and third terms. For instance, Forssblad (1965) studied the effect of the vibratory
masses on a vibratory roller’s compaction. By adding 24% of the total roller weight to the
frame, a considerable increase in a soil’s compacted density occurred; however, a similar
change in the drum’s weight did not result in an analogous increase in soil density.
Parsons et al. (1962) focused on accelerating of the vibratory motion (i.e., ..
dx in Eq.
2-1). Besides increasing the dynamic force (Eq. 2-1), Parsons et al. found little effect in
typical 6 to 9-inch thick lifts that could not be accomplished with more passes of the
roller.
Yoo (1978) improved field instrumentation by using inductance coil strain gages
for field compaction studies. Their experiments also varied compactor weight and layer
thickness for gravel-sand mixtures compacted dry (4%) of optimum moisture content.
Both 12-inch and 36-inch thick fills were compacted under various energies and moisture
content. They concluded that the maximum compact layer thickness should be limited to
12-inch (vs. 36-inch) from stiffness and densities measurements with depth. Similarly,
WES (USACE-WES, 1976) carried out compaction on lean clay (PI=13) with various
water contents using a sheep-foot roller. Based on that study, they recommended a
limitation of lift thickness of 7-inch.
2.2 Strength, Moisture and Compactive Effort
Even though field compaction is generally controlled by dry density and moisture
contents, the stiffness and strength of the placed backfill are the properties of interest.
For instance, deflection, rutting, and bearing failure of a base course control its design
7
(i.e., AASHTO 2002). Since stiffness and strength measurements are difficult to perform
on a routine basis in field, they have been equated to a materials density and moisture
content.
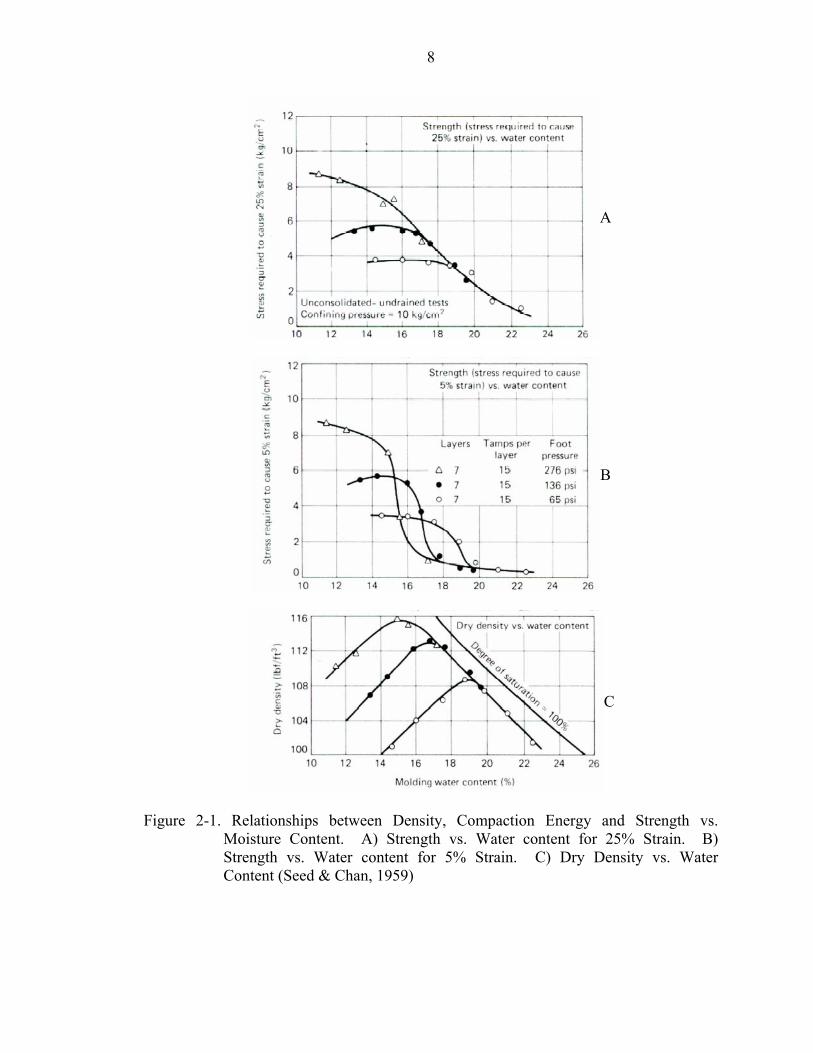
Seed and Chan (1959) were one of the first to study the relationship between
material strength, compaction effort and moisture for fine-grained soils. Their
experiments were performed with Harvard Compaction setup (62.4 cm3 specimen, 0.5-
inch compacting rod with variable spring stiffness). Figure 2-1 shows the change in dry
density (bottom), small strain stiffness (middle) and large strain stiffness (top figure) vs.
moisture content for different compaction energies. Evident from the figure, stiffness, and
density increase with compaction energy for a moisture content dry of optimum. Note the
significant reduction in stiffness for a given compactive effort as the moisture content
passes wet of optimum.
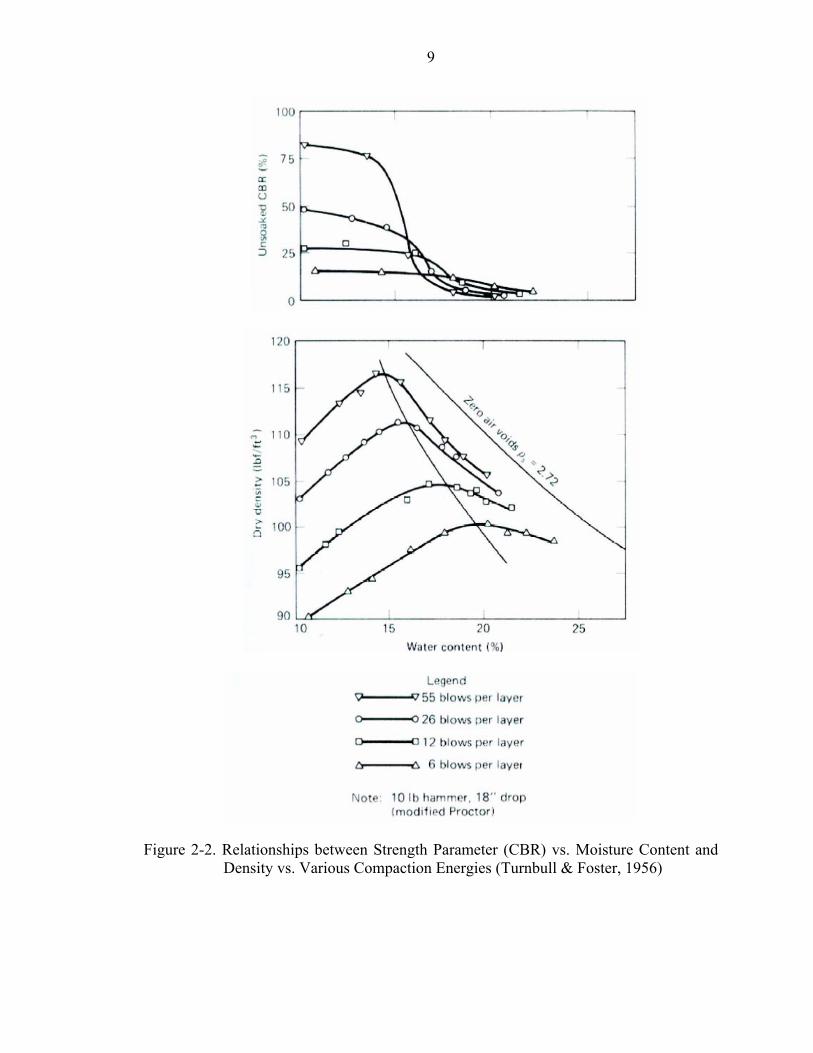
Turnbull and Foster (1956) studied the influence of moisture and compactive effort
on granular soils in Figure 2-2. Instead of performing triaxial compression, they
conducted California Bearing Ratio (CBR). Similar results as shown in Figure 2.1 are
seen in Figure 2.2. Ping et al (1996) has suggested a correlation of 1.25 between the
Florida Limerock Bearing Ratio Test (LBR) and CBR results.
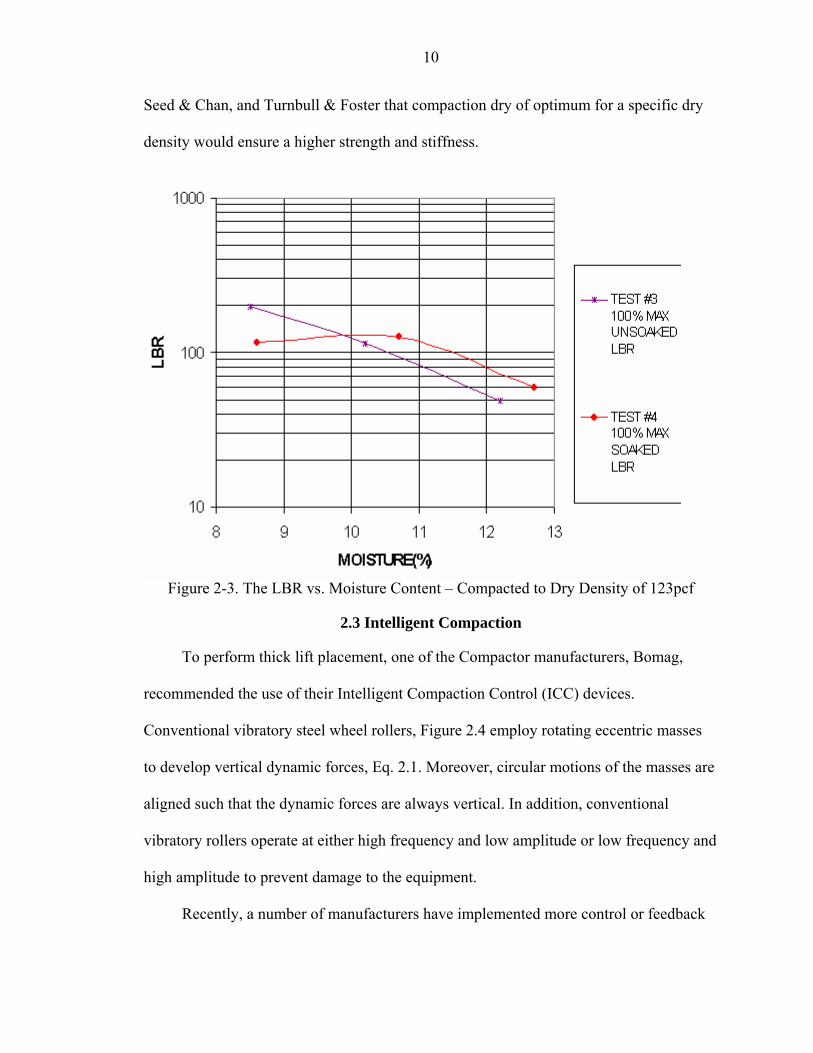
The FDOT State Materials Office (SMO) compacted the Florida limerock to meet
LBR requirements. As part of this research, SMO agreed to compact additional
specimens to a constant dry density (123 pcf) at different moisture contents with
subsequent LBR testing. Figure 2-3 shows variation of LBR value with moisture content
for both soaked and un-soaked samples. Evident is the higher stiffness/strength of the un-
soaked samples dry of optimum (10.5% from standard proctor). The latter agrees with
8
A
B
C
Figure 2-1. Relationships between Density, Compaction Energy and Strength vs. Moisture Content. A) Strength vs. Water content for 25% Strain. B) Strength vs. Water content for 5% Strain. C) Dry Density vs. Water Content (Seed & Chan, 1959)
9
Figure 2-2. Relationships between Strength Parameter (CBR) vs. Moisture Content and Density vs. Various Compaction Energies (Turnbull & Foster, 1956)
10
Seed & Chan, and Turnbull & Foster that compaction dry of optimum for a specific dry
density would ensure a higher strength and stiffness.
Figure 2-3. The LBR vs. Moisture Content – Compacted to Dry Density of 123pcf
2.3 Intelligent Compaction
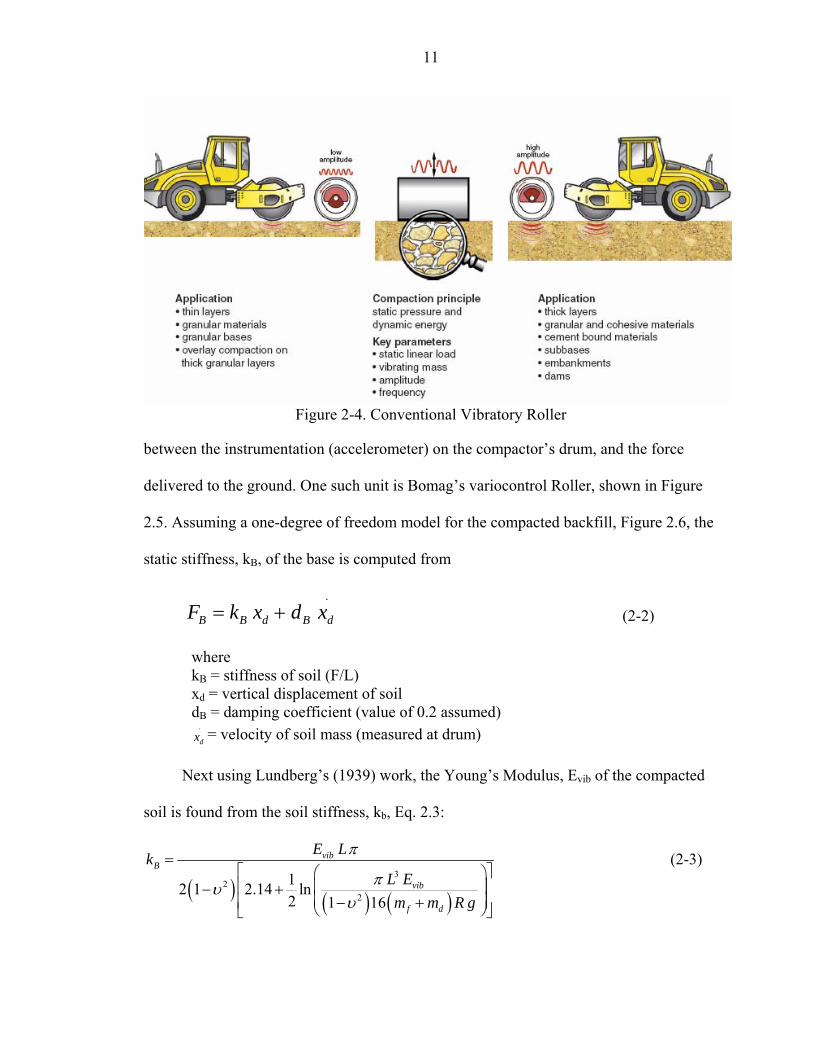
To perform thick lift placement, one of the Compactor manufacturers, Bomag,
recommended the use of their Intelligent Compaction Control (ICC) devices.
Conventional vibratory steel wheel rollers, Figure 2.4 employ rotating eccentric masses
to develop vertical dynamic forces, Eq. 2.1. Moreover, circular motions of the masses are
aligned such that the dynamic forces are always vertical. In addition, conventional
vibratory rollers operate at either high frequency and low amplitude or low frequency and
high amplitude to prevent damage to the equipment.
Recently, a number of manufacturers have implemented more control or feedback
11
Figure 2-4. Conventional Vibratory Roller
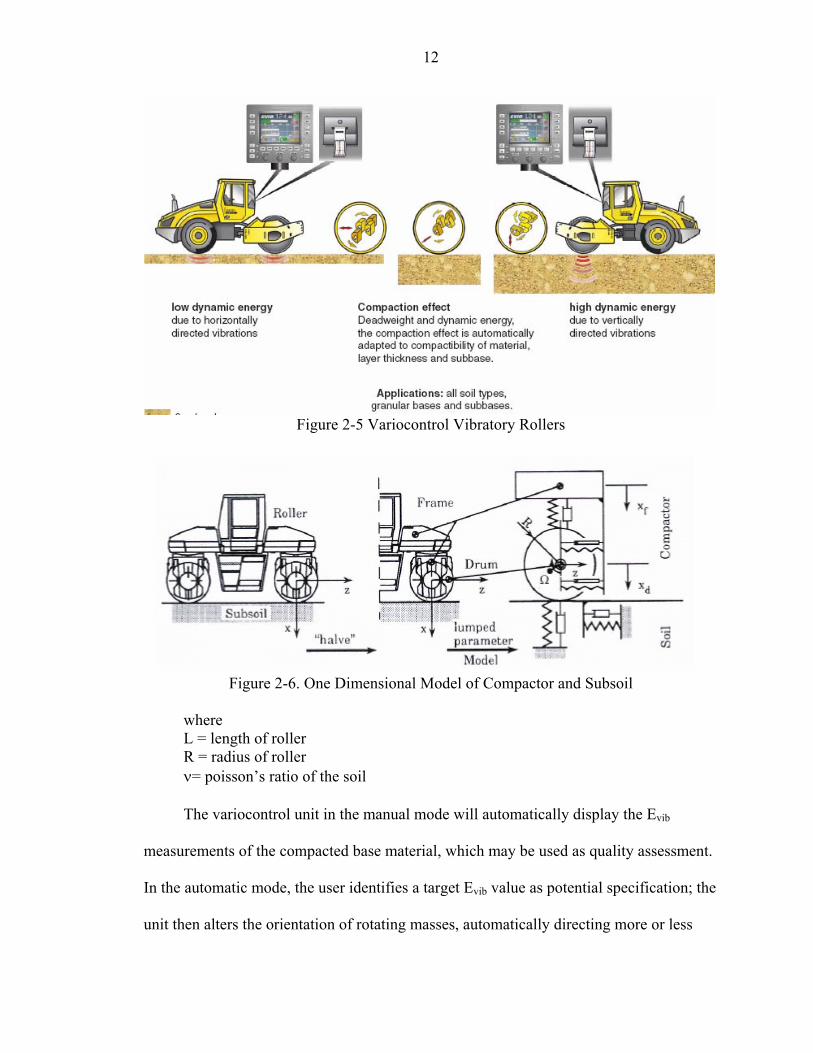
between the instrumentation (accelerometer) on the compactor’s drum, and the force
delivered to the ground. One such unit is Bomag’s variocontrol Roller, shown in Figure
2.5. Assuming a one-degree of freedom model for the compacted backfill, Figure 2.6, the
static stiffness, kB, of the base is computed from
.
B B d B dF k x d x= + (2-2)
where kB = stiffness of soil (F/L) xd = vertical displacement of soil dB = damping coefficient (value of 0.2 assumed)
.
dx = velocity of soil mass (measured at drum)
Next using Lundberg’s (1939) work, the Young’s Modulus, Evib of the compacted
soil is found from the soil stiffness, kb, Eq. 2.3:
( ) ( ) ( )3
22
12 1 2.14 ln2 1 16
vibB
vib
f d
E LkL Em m R g
π
πυυ
=⎡ ⎤⎛ ⎞⎢ ⎥⎜ ⎟− +
⎜ ⎟⎢ ⎥− +⎝ ⎠⎣ ⎦
(2-3)
12
Figure 2-5 Variocontrol Vibratory Rollers
Figure 2-6. One Dimensional Model of Compactor and Subsoil
where L = length of roller R = radius of roller ν= poisson’s ratio of the soil
The variocontrol unit in the manual mode will automatically display the Evib
measurements of the compacted base material, which may be used as quality assessment.
In the automatic mode, the user identifies a target Evib value as potential specification; the
unit then alters the orientation of rotating masses, automatically directing more or less

13
dynamic force into the ground. One of Bomag’s variocontrol units, BW 225BV-3 was
tested at the SR-826 site.
14
CHAPTER 3 TEST SITE AND INSTRUMENTATION
3.1 Materials, Site Layout, and Equipment
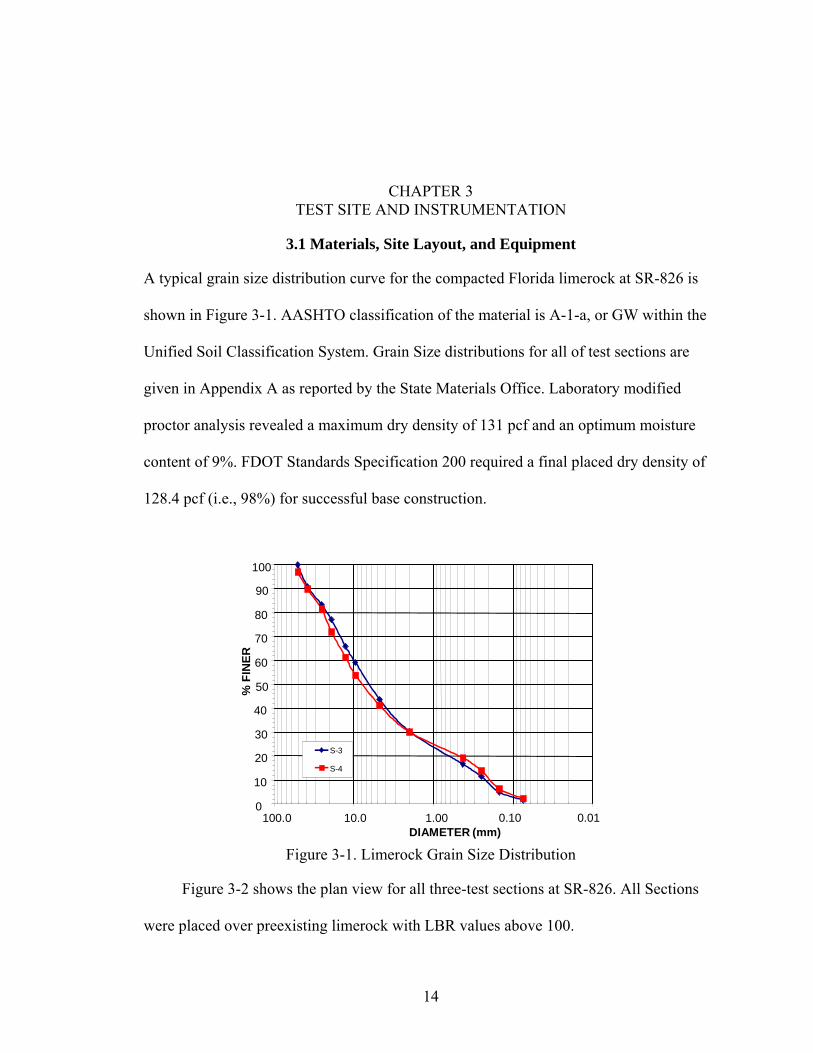
A typical grain size distribution curve for the compacted Florida limerock at SR-826 is
shown in Figure 3-1. AASHTO classification of the material is A-1-a, or GW within the
Unified Soil Classification System. Grain Size distributions for all of test sections are
given in Appendix A as reported by the State Materials Office. Laboratory modified
proctor analysis revealed a maximum dry density of 131 pcf and an optimum moisture
content of 9%. FDOT Standards Specification 200 required a final placed dry density of
128.4 pcf (i.e., 98%) for successful base construction.
0.10DIAMETER (mm)
% F
INER
0
10
20
30
40
50
60
70
80
90
100
0.01 1.0010.0100.0
S-3
S-4
Figure 3-1. Limerock Grain Size Distribution
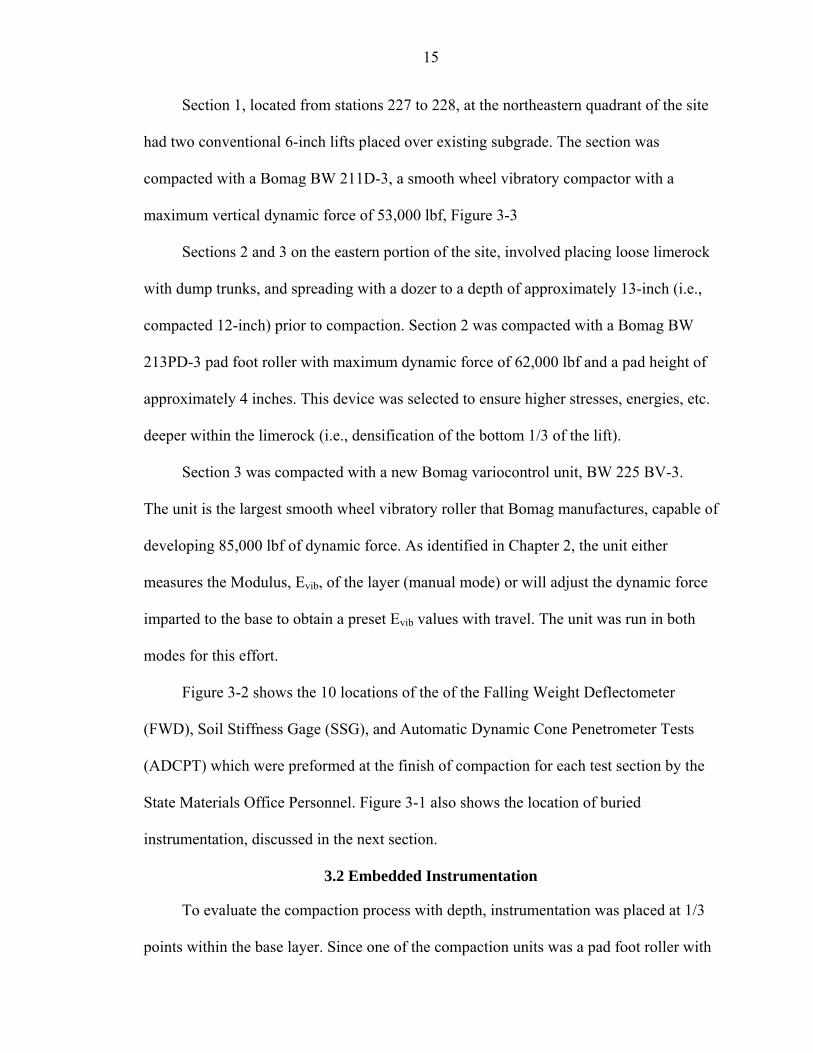
Figure 3-2 shows the plan view for all three-test sections at SR-826. All Sections
were placed over preexisting limerock with LBR values above 100.
15
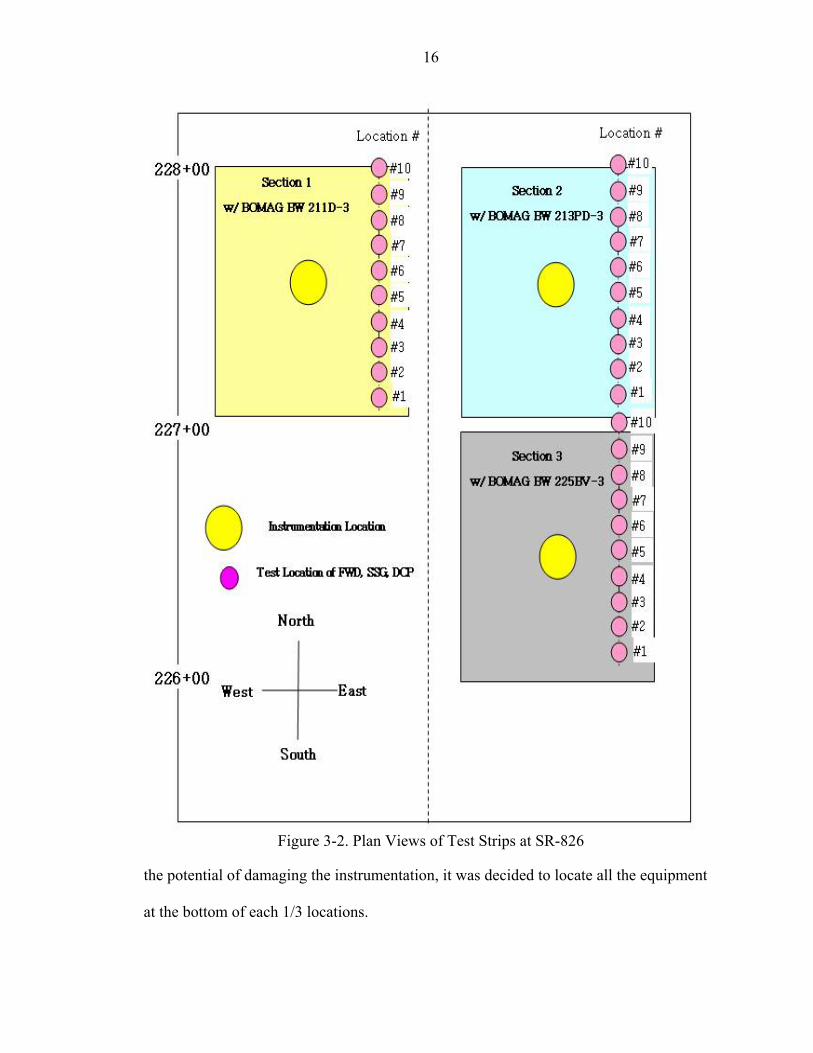
Section 1, located from stations 227 to 228, at the northeastern quadrant of the site
had two conventional 6-inch lifts placed over existing subgrade. The section was
compacted with a Bomag BW 211D-3, a smooth wheel vibratory compactor with a
maximum vertical dynamic force of 53,000 lbf, Figure 3-3
Sections 2 and 3 on the eastern portion of the site, involved placing loose limerock
with dump trunks, and spreading with a dozer to a depth of approximately 13-inch (i.e.,
compacted 12-inch) prior to compaction. Section 2 was compacted with a Bomag BW
213PD-3 pad foot roller with maximum dynamic force of 62,000 lbf and a pad height of
approximately 4 inches. This device was selected to ensure higher stresses, energies, etc.
deeper within the limerock (i.e., densification of the bottom 1/3 of the lift).
Section 3 was compacted with a new Bomag variocontrol unit, BW 225 BV-3.
The unit is the largest smooth wheel vibratory roller that Bomag manufactures, capable of
developing 85,000 lbf of dynamic force. As identified in Chapter 2, the unit either
measures the Modulus, Evib, of the layer (manual mode) or will adjust the dynamic force
imparted to the base to obtain a preset Evib values with travel. The unit was run in both
modes for this effort.
Figure 3-2 shows the 10 locations of the of the Falling Weight Deflectometer
(FWD), Soil Stiffness Gage (SSG), and Automatic Dynamic Cone Penetrometer Tests
(ADCPT) which were preformed at the finish of compaction for each test section by the
State Materials Office Personnel. Figure 3-1 also shows the location of buried
instrumentation, discussed in the next section.
3.2 Embedded Instrumentation
To evaluate the compaction process with depth, instrumentation was placed at 1/3
points within the base layer. Since one of the compaction units was a pad foot roller with
16
Figure 3-2. Plan Views of Test Strips at SR-826
the potential of damaging the instrumentation, it was decided to locate all the equipment
at the bottom of each 1/3 locations.
17
Figure 3-3. Test Section Compactors
Of interest are the stresses, energies, stiffness, and strains with depth as compared
to the observed laboratory response (i.e., proctor, LBR, etc.). For instance, it is expected
that dry densities found in the laboratory would be achievable in the field if similar
energies (compaction) were applied. In addition, comparisons of density at the bottom of
the thick lift computed from nuclear density device vs. measured strains are of interest
(i.e., verification). To accomplish the latter the following instrumentation was installed:
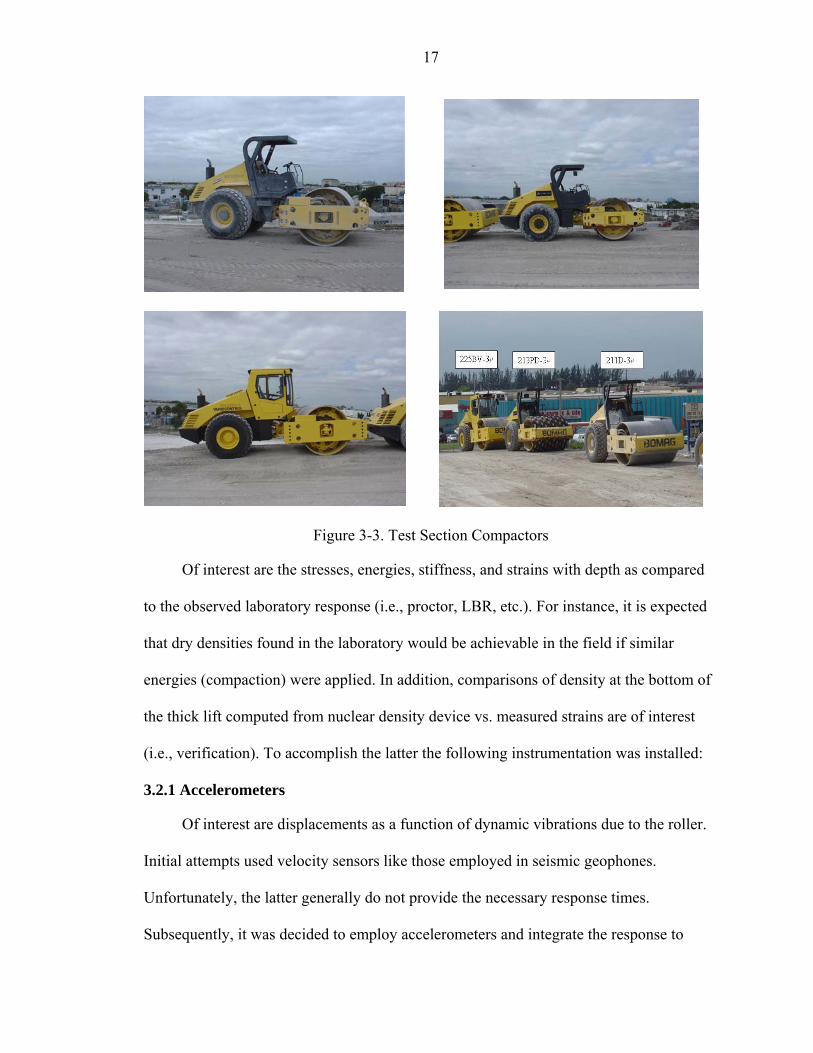
3.2.1 Accelerometers
Of interest are displacements as a function of dynamic vibrations due to the roller.
Initial attempts used velocity sensors like those employed in seismic geophones.
Unfortunately, the latter generally do not provide the necessary response times.
Subsequently, it was decided to employ accelerometers and integrate the response to
18
obtain displacements. To provide accurate, repeatable information, DC accelerometers of
the capacitive resistance type were employed (i.e., capable of 0Hz or 1g response). The
devices were attached or placed in the vicinity of the stress cells.
3.2.2 LVDT
Initially, it was planned to read the LVDTs only after a pass of compactor.
However, from the analog nature of the device and with a sufficiently sampling
frequency with the data acquisition system, the relative displacements or strains may be
obtained during the compaction process. To maintain the location of the devices, as well
as their orientation, the LVDTs had 3-inch plastic plates attached to the top of the LVDT
housing as well end of sensing rod.
3.2.3 Stress Cell
To measure the vertical stress as a function of compactor motion, 12-inch
diameter stress cells were employed. The sensing face was filled with incompressible
fluid and the pore transducer was attached 18-inch from the sensor with steel lines.
Ardaman and Associates calibrated the devices in the laboratory for Florida limerock.
Figure 3-4. Section 1 Instrumentation – Two 6-inch Lifts
19
Figure 3-5. Section 2 Instrumentation – 12-inch Thick Lift
Figure 3-6. Section 3 Instrumentation – 12-inch Thick Lift
20
CHAPTER 4 RESULTS AND DISCUSSION
4.1 Stress Measurements
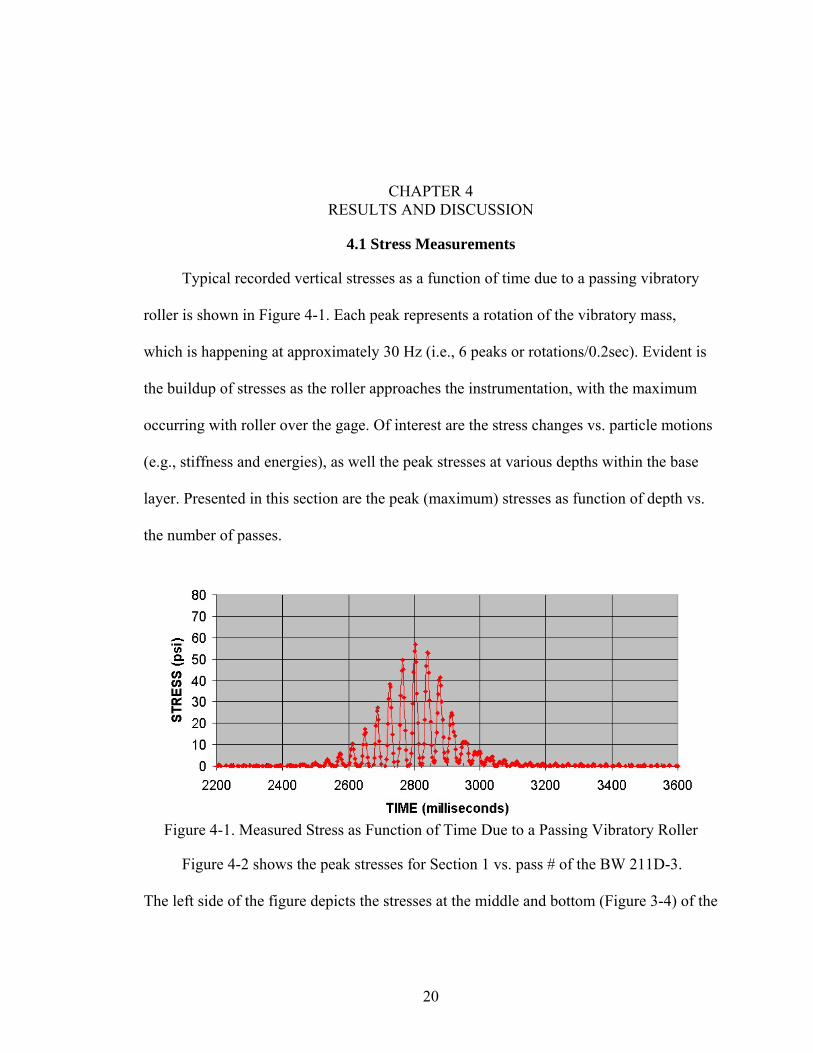
Typical recorded vertical stresses as a function of time due to a passing vibratory
roller is shown in Figure 4-1. Each peak represents a rotation of the vibratory mass,
which is happening at approximately 30 Hz (i.e., 6 peaks or rotations/0.2sec). Evident is
the buildup of stresses as the roller approaches the instrumentation, with the maximum
occurring with roller over the gage. Of interest are the stress changes vs. particle motions
(e.g., stiffness and energies), as well the peak stresses at various depths within the base
layer. Presented in this section are the peak (maximum) stresses as function of depth vs.
the number of passes.
Figure 4-1. Measured Stress as Function of Time Due to a Passing Vibratory Roller
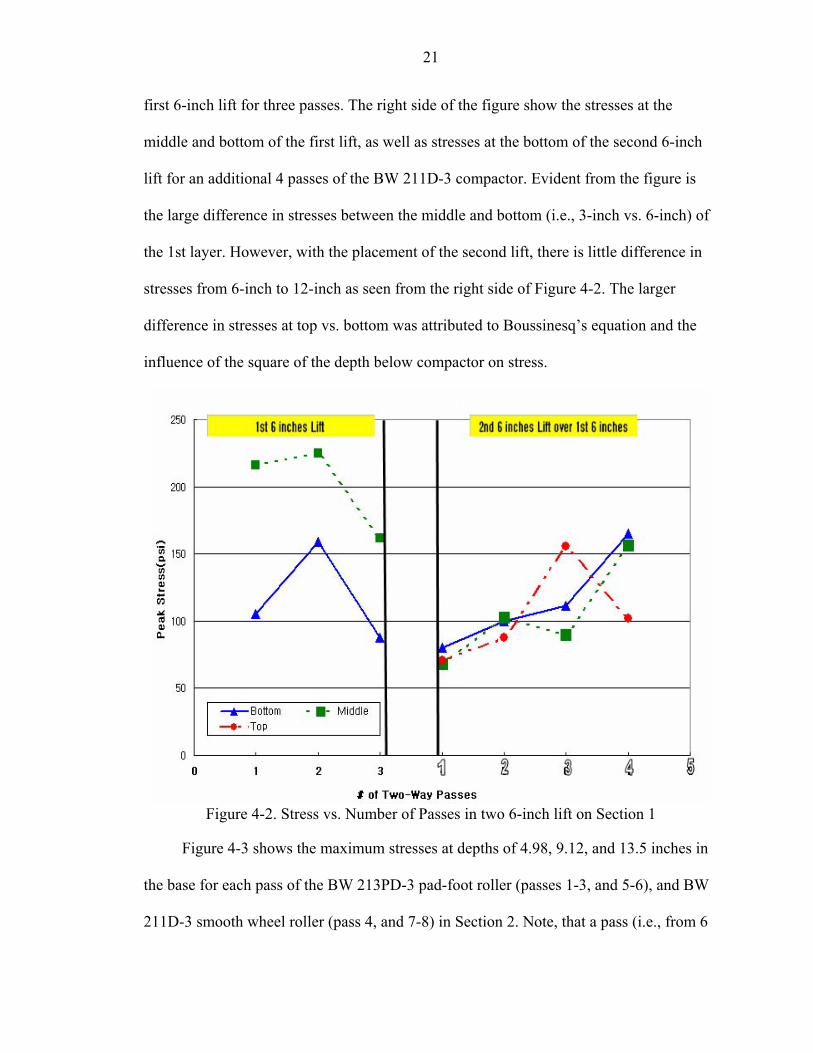
Figure 4-2 shows the peak stresses for Section 1 vs. pass # of the BW 211D-3.
The left side of the figure depicts the stresses at the middle and bottom (Figure 3-4) of the
21
first 6-inch lift for three passes. The right side of the figure show the stresses at the
middle and bottom of the first lift, as well as stresses at the bottom of the second 6-inch
lift for an additional 4 passes of the BW 211D-3 compactor. Evident from the figure is
the large difference in stresses between the middle and bottom (i.e., 3-inch vs. 6-inch) of
the 1st layer. However, with the placement of the second lift, there is little difference in
stresses from 6-inch to 12-inch as seen from the right side of Figure 4-2. The larger
difference in stresses at top vs. bottom was attributed to Boussinesq’s equation and the
influence of the square of the depth below compactor on stress.
Figure 4-2. Stress vs. Number of Passes in two 6-inch lift on Section 1
Figure 4-3 shows the maximum stresses at depths of 4.98, 9.12, and 13.5 inches in
the base for each pass of the BW 213PD-3 pad-foot roller (passes 1-3, and 5-6), and BW
211D-3 smooth wheel roller (pass 4, and 7-8) in Section 2. Note, that a pass (i.e., from 6
22
to 7) has two points (i.e., 6.5 and 7) which represent the compactor traveling from the
south to the north side of the site (i.e., 6.5), and subsequently back from the north to south
side (i.e., 7) of Section 2. Note passes, 4, 7, and 8 with the smooth wheel vibratory
roller were performed to ensure a smooth surface required in nuclear backscatter moisture
monitoring.
Figure 4-3 shows the stresses measured at all three instrumented depths were quite
similar for the pad foot versus the smooth wheel roller. The latter is attributed to the
larger contact area provided by the pads as well as their deeper penetration (i.e., 4-inch
high pads) vs. the smooth wheel roller. Also, note the similarity in stress (150 psi)
reported in Section 2 vs. Section 1 for 1st set of gages for the smooth wheel roller.
Figure 4-4 shows the maximum vertical stresses with depth (6.1, 9.4, and 13
inches) as a function of pass for the heaviest of the smooth wheel rollers (i.e., BW
225BV-3 (85,000 lbf). Apparent from a comparison of Figures 4-2 and 4-4, the stresses
between Sections 1 and 3, are approximately 1.6 times higher in Section 3 versus Section
1 due to increased dynamic force of the BW 225BV-3 (85,000 lbf) vs. BW 211D-3
(53,000 lbf). Also note however, the stresses variations observed in Section 2 for the
smaller smooth wheel roller (i.e., passes 7, 8) in Figure 4-3, do not occur in Section 3 for
the heavier smooth wheel roller. The latter may be due to particle crushing and larger
contact area under the compactor for the heavier roller (BW 225BV-3). Of interest are the
particle motions, which are occurring with the stress changes.
4.2 Compactive Energy vs. Depth
To identify soil particle dynamic movement, and subsequent energy transmissions,
accelerations were monitored with DC (0-100 Hz) piezo-capacitance instruments
attached to the tops of the stress cells at the three depth locations (Figure 3-4, 3-5, & 3-6).
23
Figure 4-3. Stresses vs. Number of Passes in the 12-inch Lift of Section 2
After integrating the accelerations twice, the particle displacements during a pass of a
compactor were obtained. Appendix D presents the data reduction process, as well as an
example of deformations as a function of time. Of interest is the relationship between
stress and deformation as a function of compactor motion. Figure 4-5 shows the typical
stress vs. particle motion at the bottom of Section 1 during the 4th pass of the BW 211D-3.
Each loop (ellipse) represents one complete rotation of the eccentric mass within
the roller (i.e., 30 Hz or 30 cycles/sec in Figure 4-1). The multiple loops with varying
peak stresses are a result of the roller either approaching or moving away from the
instrumentation. Note the similarities of Figure 4-5 and Bomag’s force vs. displacement
measurement of the drum at the ground surface, Figure 4-6. As identified by Bomag,
Figure 4-6 shows the compression is a result of the compactor pressing down on the base,
24
Figure 4-4. Stresses vs. Number of Passes in the 12-inch Lift of Section 3
and the expansion (i.e., unloading) is due to the drum unloading the base. In the
unloading phase, the particle displacements are negative (i.e., in an upward direction. The
energy transmitted to the base for each rotation of eccentric mass within the roller is the
area within each loop, Figure 4-6.
Figure 4-7 shows the stresses vs. displacements at the top, middle and bottom of
Section 2 in the 5th pass of the BW 213PD-3 pad foot roller. Apparent is the similarities
of energies (i.e., areas) at the various depths within the 12-inch lift, with a slight drop at
the bottom. Interestingly, the slopes (i.e., stiffness) of the middle and bottom depths of
the lift are higher than the top. The latter may be attributed to the shape of the
compactor’s contact area (i.e., pad, vs. the smooth wheel).
Figure 4-8 shows the stresses vs. displacements at the top, middle and bottom of
Section 3 in the 7th pass of the BW 225BV-3 smooth wheel roller. Evident is the
25
Figure 4-5. Stress vs. Particle Displacements at Bottom of Section 1 during 4th Pass
Figure 4-6. Forces on the drum and associated loading loop
similarities of energies (i.e., areas) at the top and bottom of 12-inch lift, suggesting
similar densities throughout the deposit. A comparison of energies (areas) between
Section 1 (Figure 4-5) and 3 (Figure 4-7), suggest higher densities changes or compaction
is being performed with one pass of the BW 225BV-3 vs. 211D-3. Also note that the
26
Figure 4-7. Stress vs. Displacement after 5th Pass on Section 2
stiffness (i.e., slopes) of any loop is higher for the BW 225BV-3 (Figure 4-8), than the
slopes from Section 1 (Figure 4-5) with the passing of a Bomag 211. The latter should be
evident from Falling Weight Deflectometer (FWD) data discussed later.
4.3 LVDT Strains & Measured Densities
Of interest were the strains, which may be equated to density as function of depth within
the base course. FDOT’s current nuclear density devices place the probe at depths of 6
and 12 inches, Figure 4-9. Due to the location of the source (various depths) and receiver
(surface), the density at 0 to 6-inch (γ1) is accurate, as well the average 0 to 12-inch (γt),
however, the density from 6 to 12-inch (γ2) is generally computed from the following
simple averaging assumption:
1 1 2 2 1 2( )td d d dγ γ γ+ = + (4-1)
27
or solving for γ2,
1 2 1 12
2
( ) ( )t d d dd
γ γγ + −= (4-2)
Figure 4-8. Stress vs. Displacement after 7th pass on Section 3
Knowing the moisture content, ω, the average or individual dry densities (γd1 ,
γd2) may be found as:
( )1dγγω
=+ (4-3)
For the device shown in Figure 4-9, the moisture content, ω, is computed near the
surface (i.e., back scatter). For all calculations to follow, it is assumed that the moisture
content with depth is constant (i.e., ω = ω1 = ω2).
Given the uncertainty of the density calculations, it was of interest to check their
28
Figure 4-9. Density Calculations with Depth
values with other methods (e.g., strain measurements from LVDT). Knowing the original
spacing between a pair of LVDT plates (i.e., Figures. 3-4 ~ 3-6), the strain as a function
of compactor pass may be found as,
( )( )v
changein spacingL original spacingδ
ε = (4-4)
Next, assuming that the initial dry density (γd_initial) of the placed base material
is uniform, the final dry density (γd_final) after a pass may be computed as,
__ 1
d initiald final
v
γγ
ε=
− (4-5)
Where εv is given by Equation 4-4, and it is assumed that no horizontal strains
develop as the compactor passes over.
Figure 4-10 shows a comparison of the strains vs. number of passes in the top 6-
inch lift of Section 1. Evident the strains increased by 6% in first pass and then to 9% by
the 4th pass. Using the strains, initial dry density and Eq. 4-5, the computed dry density vs.
pass is shown on the left axis. The computed dry density from the nuclear moisture and
density device is given in Table 4-1, as well as depicted in Figure 4-10. Note the moisture
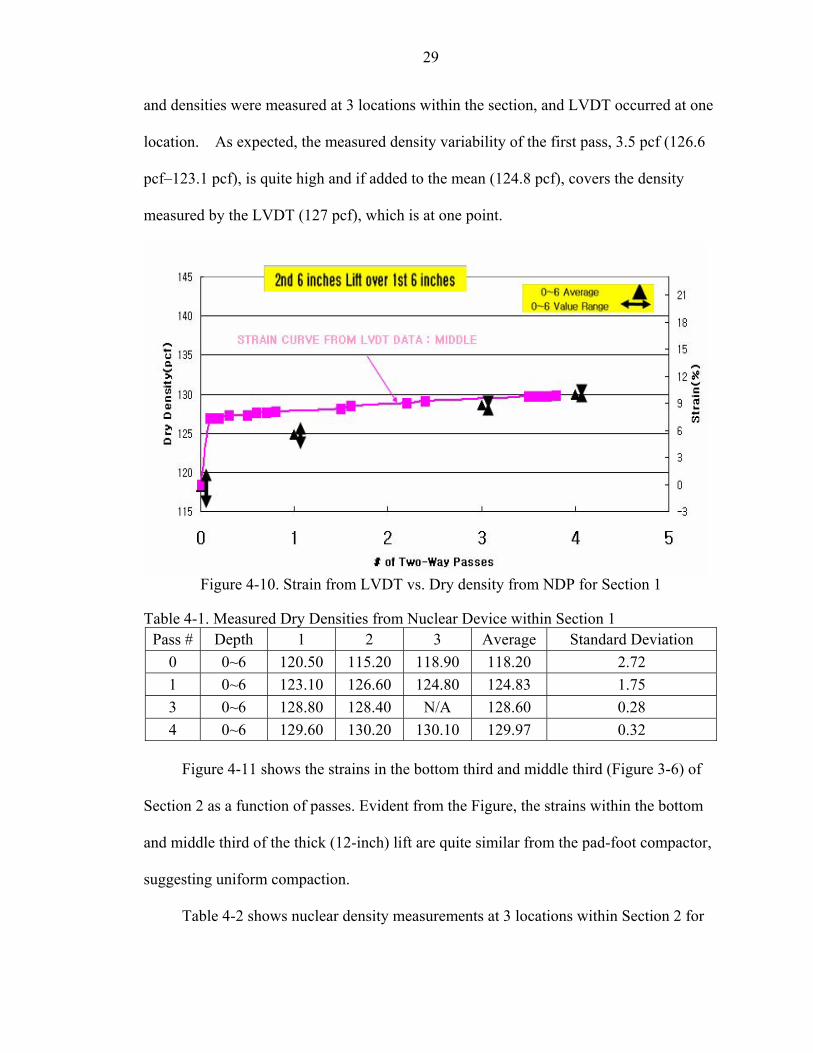
29
and densities were measured at 3 locations within the section, and LVDT occurred at one
location. As expected, the measured density variability of the first pass, 3.5 pcf (126.6
pcf–123.1 pcf), is quite high and if added to the mean (124.8 pcf), covers the density
measured by the LVDT (127 pcf), which is at one point.
Figure 4-10. Strain from LVDT vs. Dry density from NDP for Section 1
Table 4-1. Measured Dry Densities from Nuclear Device within Section 1 Pass # Depth 1 2 3 Average Standard Deviation
0 0~6 120.50 115.20 118.90 118.20 2.72 1 0~6 123.10 126.60 124.80 124.83 1.75 3 0~6 128.80 128.40 N/A 128.60 0.28 4 0~6 129.60 130.20 130.10 129.97 0.32
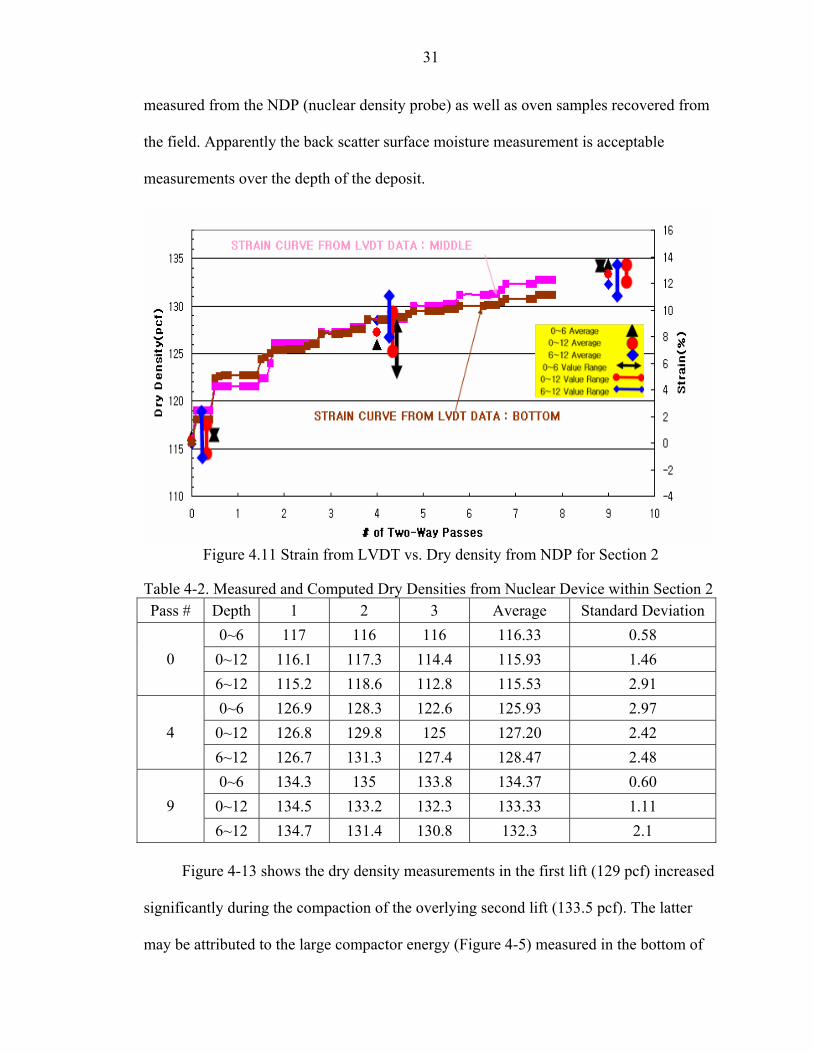
Figure 4-11 shows the strains in the bottom third and middle third (Figure 3-6) of
Section 2 as a function of passes. Evident from the Figure, the strains within the bottom
and middle third of the thick (12-inch) lift are quite similar from the pad-foot compactor,
suggesting uniform compaction.
Table 4-2 shows nuclear density measurements at 3 locations within Section 2 for
30
passes 0, 4, and 9. Note, in order to measure density, the surface of the section had to be
graded and rolled with the vibratory smooth steel compactor (4th and 6th passes). The
table presents the measured values at 6 inches (i.e., 0~6-inch), 12 inches (i.e., 0~12-inch),
as well as the computed value from 6~12-inch based on Eq. 4-2. As expected, the highest
standard deviation occurred within the 6~12-inch zone; however, the variability
decreased with pass, which is good. A comparison between densities measured or
computed from the Troxler nuclear device or strain LVDT sensors were quite favorable.
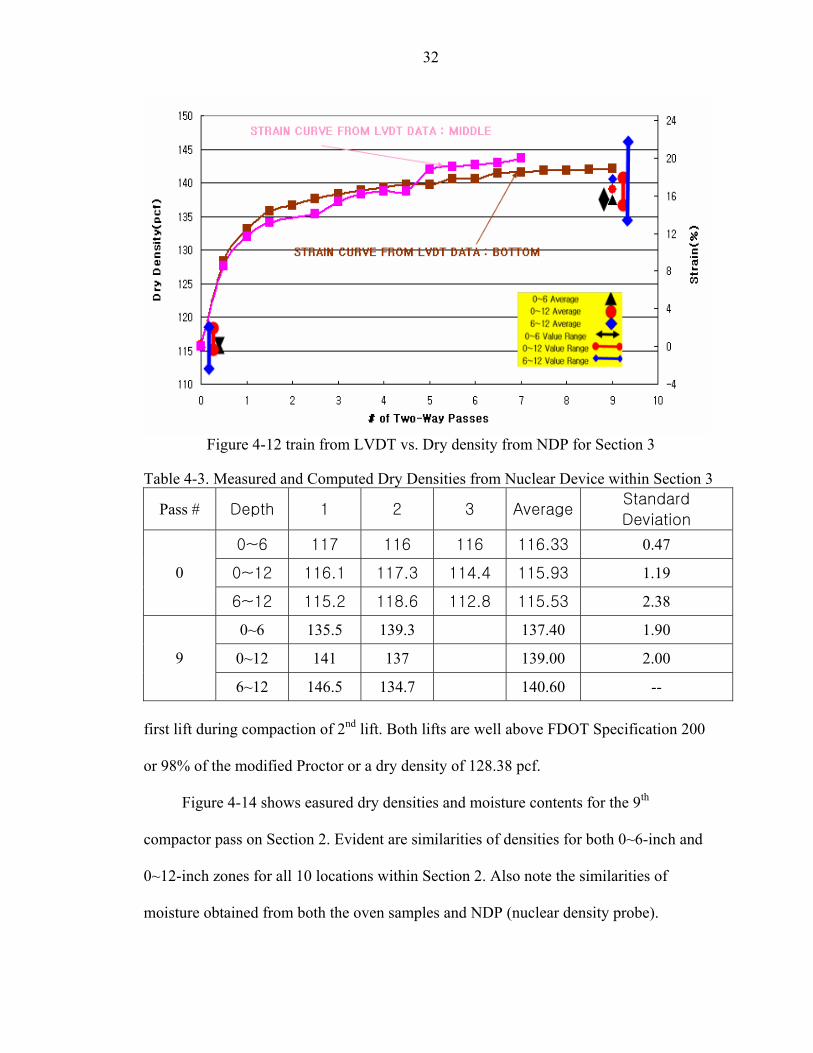
Figure 4.12 shows the measured strains in the bottom and middle third (Figure 3-7)
of Section 3 as a function of compactor pass. Figure 4.12 shows the strains in Section 3
are highest for all sections (max. 20%) due to the dynamic force o f compactor, 85,000
lbf. Also evident, the strains within the bottom and middle third of the thick (12-inch) lift
are very similar, suggesting uniform compaction.
Given in Table 4-3 are nuclear density measurements at 3 locations within the
section for passes 0, and 9. No other densities were collected due to time constraints (end
of day, darkness). Evident from the table, the densities of Section 3 at the end of
compaction were the highest and they agreed with the back computed values from the
LVDT instrumentation, Figure 4-12.
4.4 Measured Dry Densities and Moistures vs. FDOT Specified Values
As identified in section 3.1, Modified Proctor (AASHTO T-180) laboratory
compaction tests were performed on the SR826 base materials. An optimum dry density
of 131 pcf and moisture content of 9% was found. FDOT specification 200 requires a
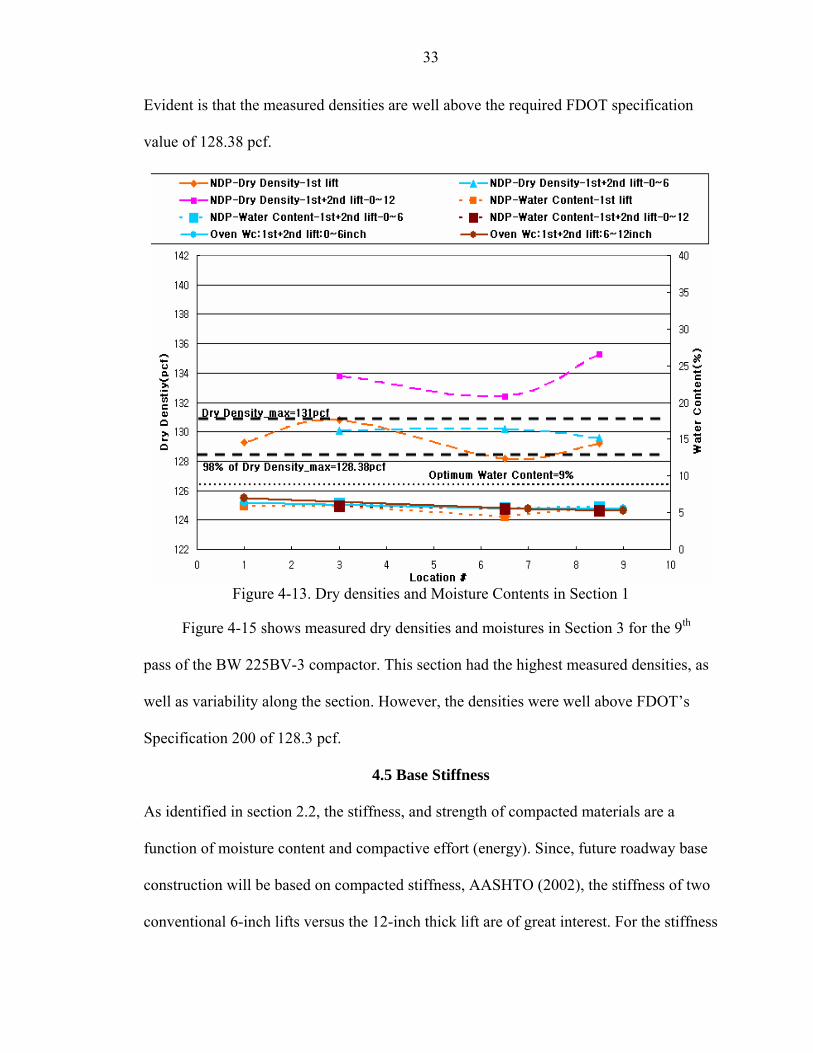
measured field compaction of 98% of T-180 or a dry density of 128.38 pcf. Figure 4-13
shows measured field dry densities from the nuclear density probe (NDP) for the last
passes of lifts 1 and 2 of Section 1. Figure 4-13 also shows the moisture contents
31
measured from the NDP (nuclear density probe) as well as oven samples recovered from
the field. Apparently the back scatter surface moisture measurement is acceptable
measurements over the depth of the deposit.
Figure 4.11 Strain from LVDT vs. Dry density from NDP for Section 2
Table 4-2. Measured and Computed Dry Densities from Nuclear Device within Section 2 Pass # Depth 1 2 3 Average Standard Deviation
0~6 117 116 116 116.33 0.58 0~12 116.1 117.3 114.4 115.93 1.46 0 6~12 115.2 118.6 112.8 115.53 2.91 0~6 126.9 128.3 122.6 125.93 2.97
0~12 126.8 129.8 125 127.20 2.42 4 6~12 126.7 131.3 127.4 128.47 2.48 0~6 134.3 135 133.8 134.37 0.60
0~12 134.5 133.2 132.3 133.33 1.11 9 6~12 134.7 131.4 130.8 132.3 2.1
Figure 4-13 shows the dry density measurements in the first lift (129 pcf) increased
significantly during the compaction of the overlying second lift (133.5 pcf). The latter
may be attributed to the large compactor energy (Figure 4-5) measured in the bottom of
32
Figure 4-12 train from LVDT vs. Dry density from NDP for Section 3
Table 4-3. Measured and Computed Dry Densities from Nuclear Device within Section 3
Pass # Depth 1 2 3 Average Standard
Deviation
0~6 117 116 116 116.33 0.47
0~12 116.1 117.3 114.4 115.93 1.19 0
6~12 115.2 118.6 112.8 115.53 2.38
0~6 135.5 139.3 137.40 1.90
0~12 141 137 139.00 2.00 9
6~12 146.5 134.7 140.60 -- first lift during compaction of 2nd lift. Both lifts are well above FDOT Specification 200
or 98% of the modified Proctor or a dry density of 128.38 pcf.
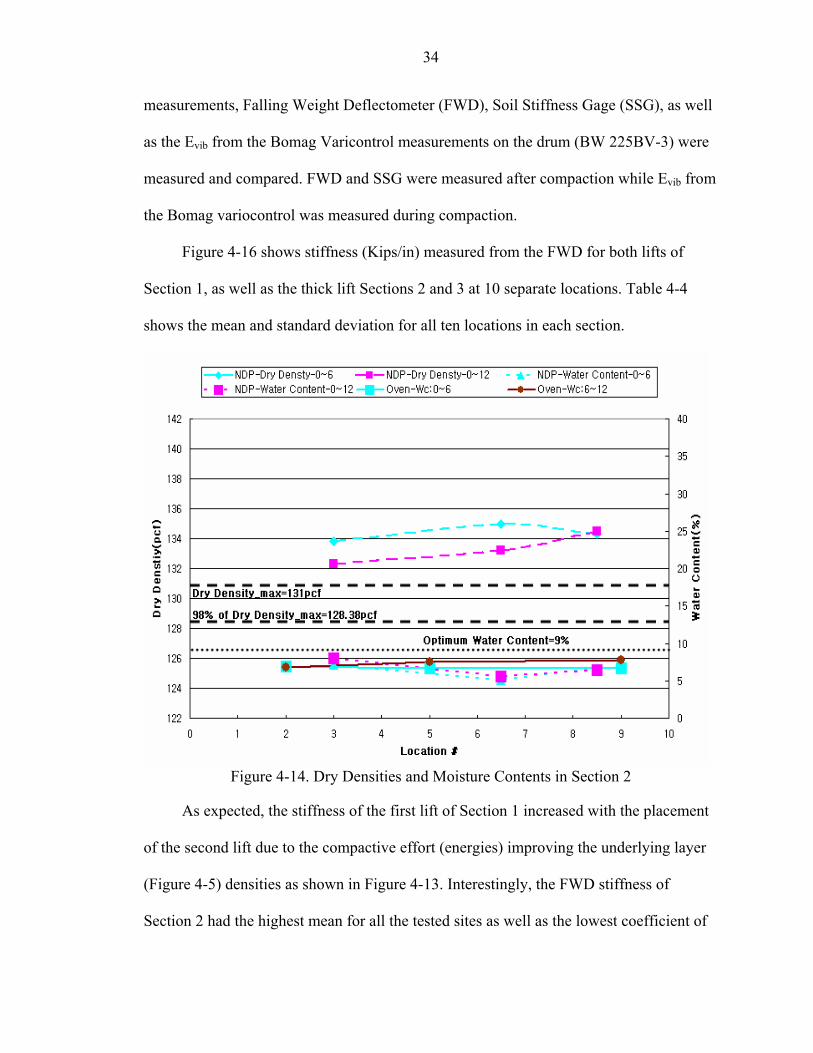
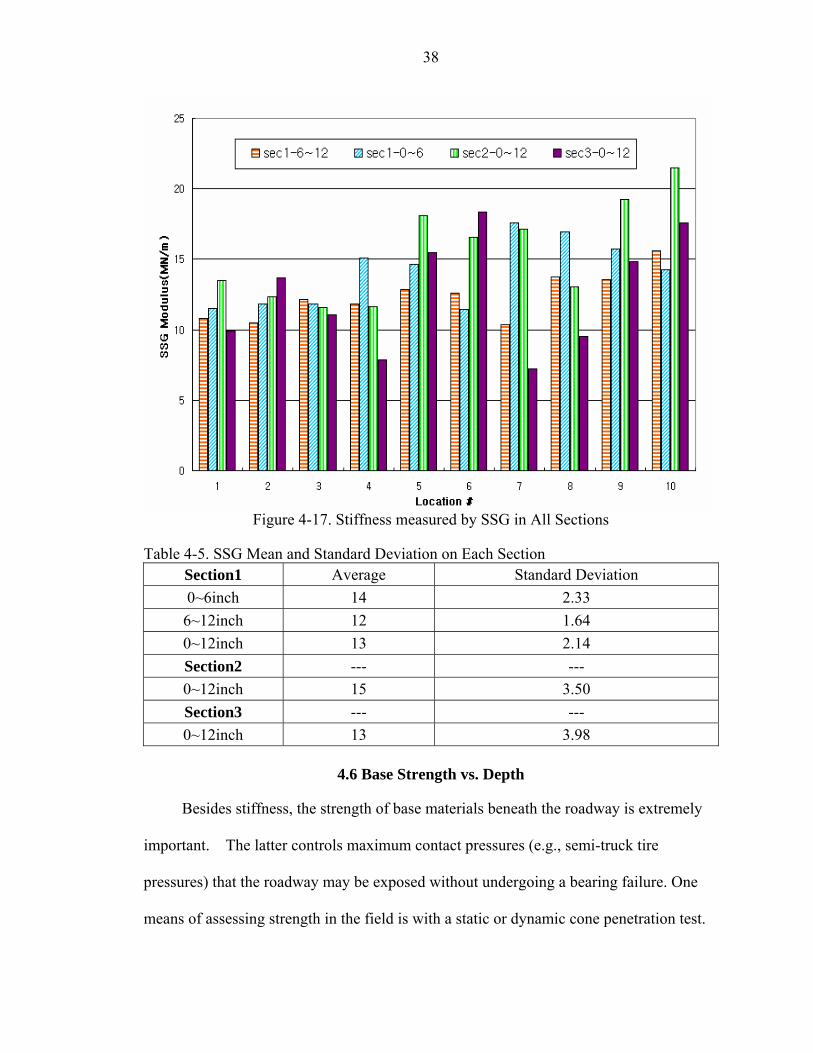
Figure 4-14 shows easured dry densities and moisture contents for the 9th
compactor pass on Section 2. Evident are similarities of densities for both 0~6-inch and
0~12-inch zones for all 10 locations within Section 2. Also note the similarities of
moisture obtained from both the oven samples and NDP (nuclear density probe).
33
Evident is that the measured densities are well above the required FDOT specification
value of 128.38 pcf.
Figure 4-13. Dry densities and Moisture Contents in Section 1
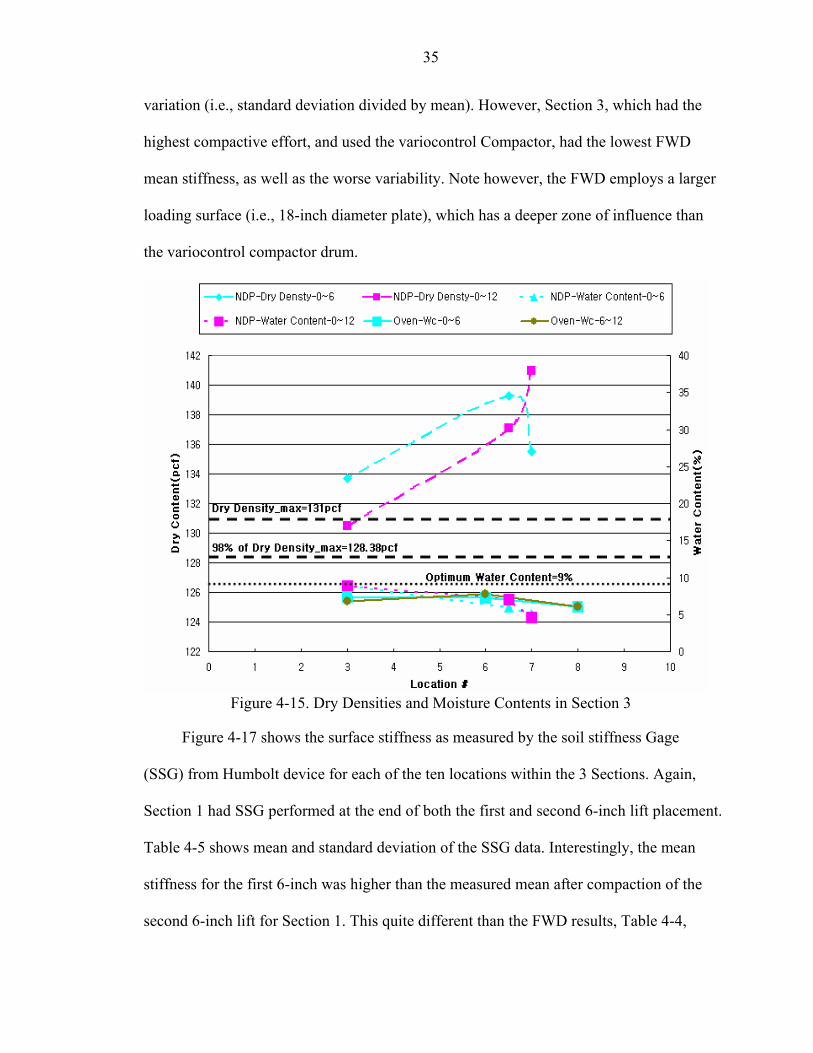
Figure 4-15 shows measured dry densities and moistures in Section 3 for the 9th
pass of the BW 225BV-3 compactor. This section had the highest measured densities, as
well as variability along the section. However, the densities were well above FDOT’s
Specification 200 of 128.3 pcf.
4.5 Base Stiffness
As identified in section 2.2, the stiffness, and strength of compacted materials are a
function of moisture content and compactive effort (energy). Since, future roadway base
construction will be based on compacted stiffness, AASHTO (2002), the stiffness of two
conventional 6-inch lifts versus the 12-inch thick lift are of great interest. For the stiffness
34
measurements, Falling Weight Deflectometer (FWD), Soil Stiffness Gage (SSG), as well
as the Evib from the Bomag Varicontrol measurements on the drum (BW 225BV-3) were
measured and compared. FWD and SSG were measured after compaction while Evib from
the Bomag variocontrol was measured during compaction.
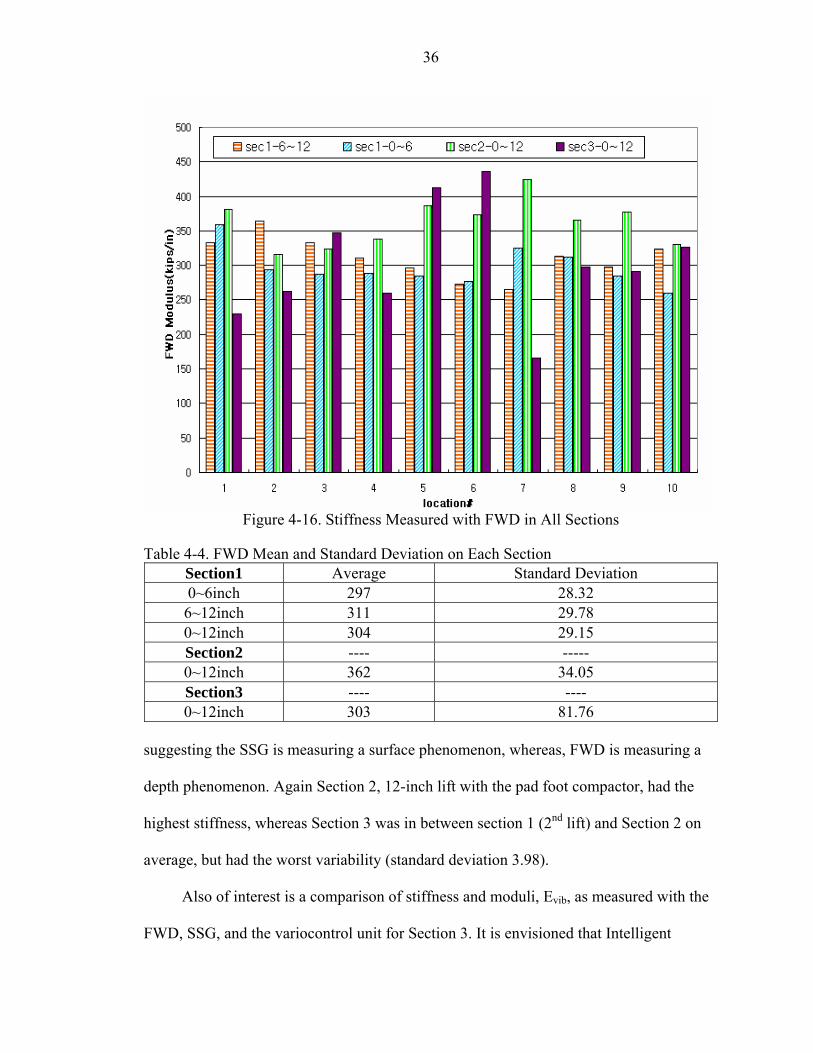
Figure 4-16 shows stiffness (Kips/in) measured from the FWD for both lifts of
Section 1, as well as the thick lift Sections 2 and 3 at 10 separate locations. Table 4-4
shows the mean and standard deviation for all ten locations in each section.
Figure 4-14. Dry Densities and Moisture Contents in Section 2
As expected, the stiffness of the first lift of Section 1 increased with the placement
of the second lift due to the compactive effort (energies) improving the underlying layer
(Figure 4-5) densities as shown in Figure 4-13. Interestingly, the FWD stiffness of
Section 2 had the highest mean for all the tested sites as well as the lowest coefficient of
35
variation (i.e., standard deviation divided by mean). However, Section 3, which had the
highest compactive effort, and used the variocontrol Compactor, had the lowest FWD
mean stiffness, as well as the worse variability. Note however, the FWD employs a larger
loading surface (i.e., 18-inch diameter plate), which has a deeper zone of influence than
the variocontrol compactor drum.
Figure 4-15. Dry Densities and Moisture Contents in Section 3
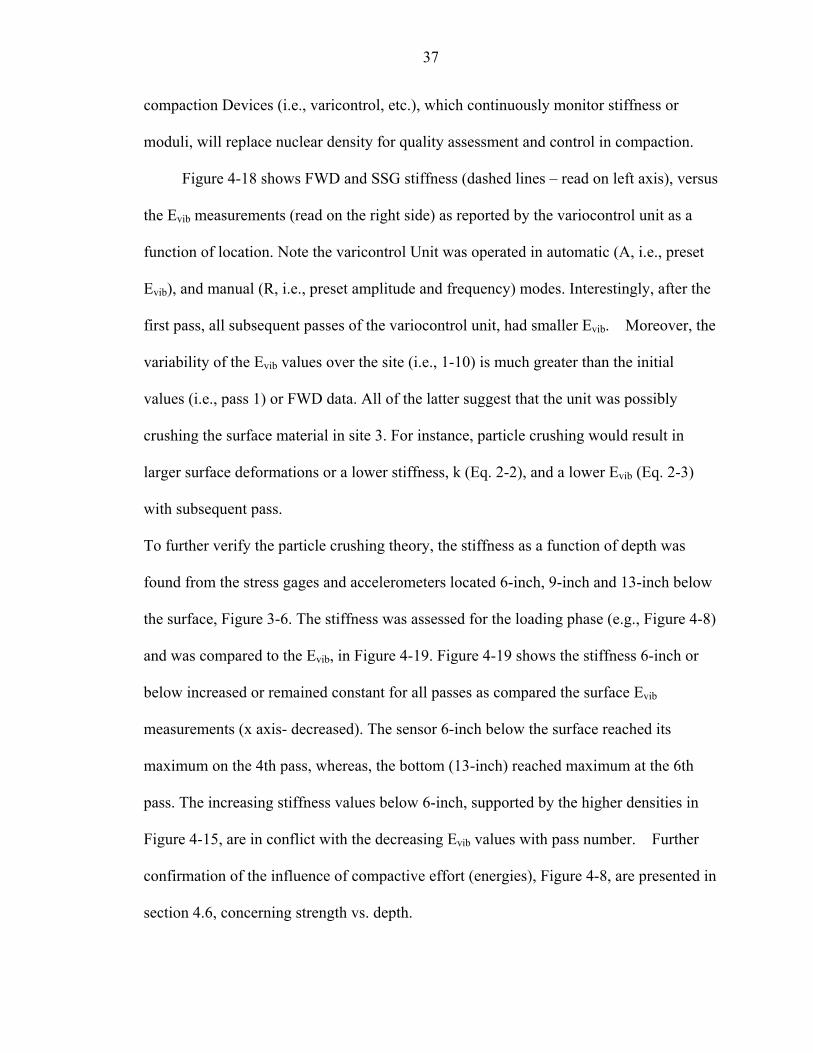
Figure 4-17 shows the surface stiffness as measured by the soil stiffness Gage
(SSG) from Humbolt device for each of the ten locations within the 3 Sections. Again,
Section 1 had SSG performed at the end of both the first and second 6-inch lift placement.
Table 4-5 shows mean and standard deviation of the SSG data. Interestingly, the mean
stiffness for the first 6-inch was higher than the measured mean after compaction of the
second 6-inch lift for Section 1. This quite different than the FWD results, Table 4-4,
36
Figure 4-16. Stiffness Measured with FWD in All Sections
Table 4-4. FWD Mean and Standard Deviation on Each Section Section1 Average Standard Deviation 0~6inch 297 28.32
6~12inch 311 29.78 0~12inch 304 29.15 Section2 ---- ----- 0~12inch 362 34.05 Section3 ---- ---- 0~12inch 303 81.76
suggesting the SSG is measuring a surface phenomenon, whereas, FWD is measuring a
depth phenomenon. Again Section 2, 12-inch lift with the pad foot compactor, had the
highest stiffness, whereas Section 3 was in between section 1 (2nd lift) and Section 2 on
average, but had the worst variability (standard deviation 3.98).
Also of interest is a comparison of stiffness and moduli, Evib, as measured with the
FWD, SSG, and the variocontrol unit for Section 3. It is envisioned that Intelligent
37
compaction Devices (i.e., varicontrol, etc.), which continuously monitor stiffness or
moduli, will replace nuclear density for quality assessment and control in compaction.
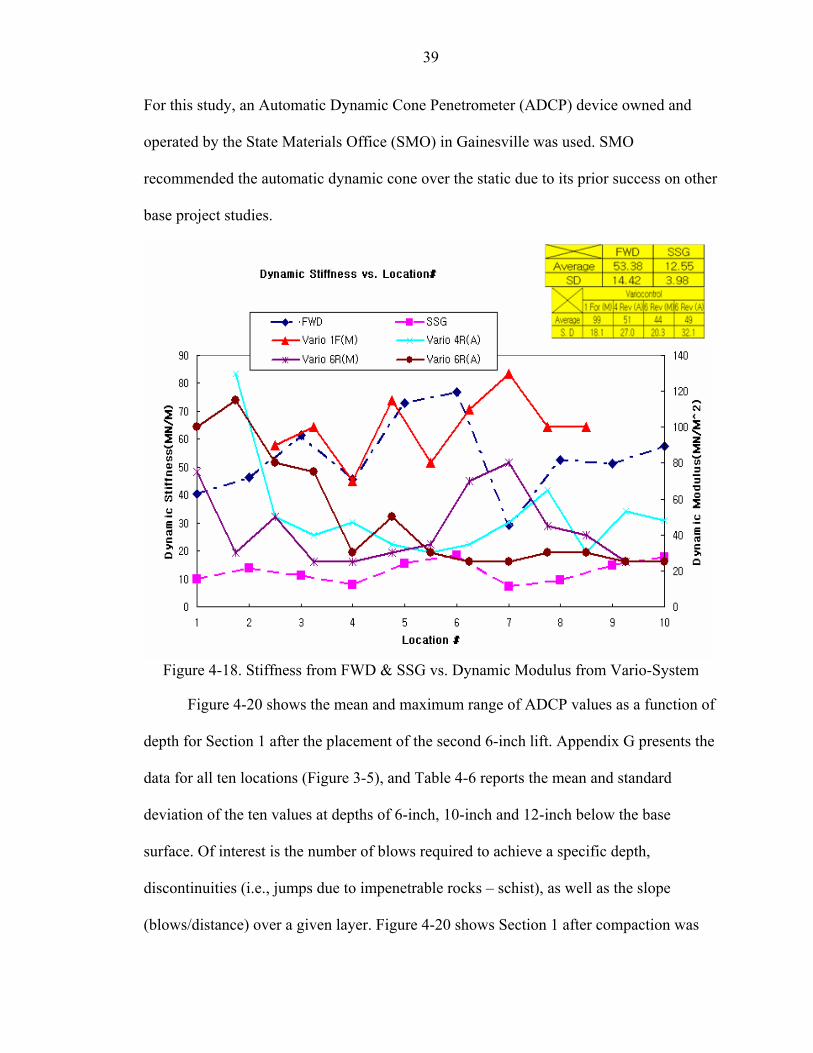
Figure 4-18 shows FWD and SSG stiffness (dashed lines – read on left axis), versus
the Evib measurements (read on the right side) as reported by the variocontrol unit as a
function of location. Note the varicontrol Unit was operated in automatic (A, i.e., preset
Evib), and manual (R, i.e., preset amplitude and frequency) modes. Interestingly, after the
first pass, all subsequent passes of the variocontrol unit, had smaller Evib. Moreover, the
variability of the Evib values over the site (i.e., 1-10) is much greater than the initial
values (i.e., pass 1) or FWD data. All of the latter suggest that the unit was possibly
crushing the surface material in site 3. For instance, particle crushing would result in
larger surface deformations or a lower stiffness, k (Eq. 2-2), and a lower Evib (Eq. 2-3)
with subsequent pass.
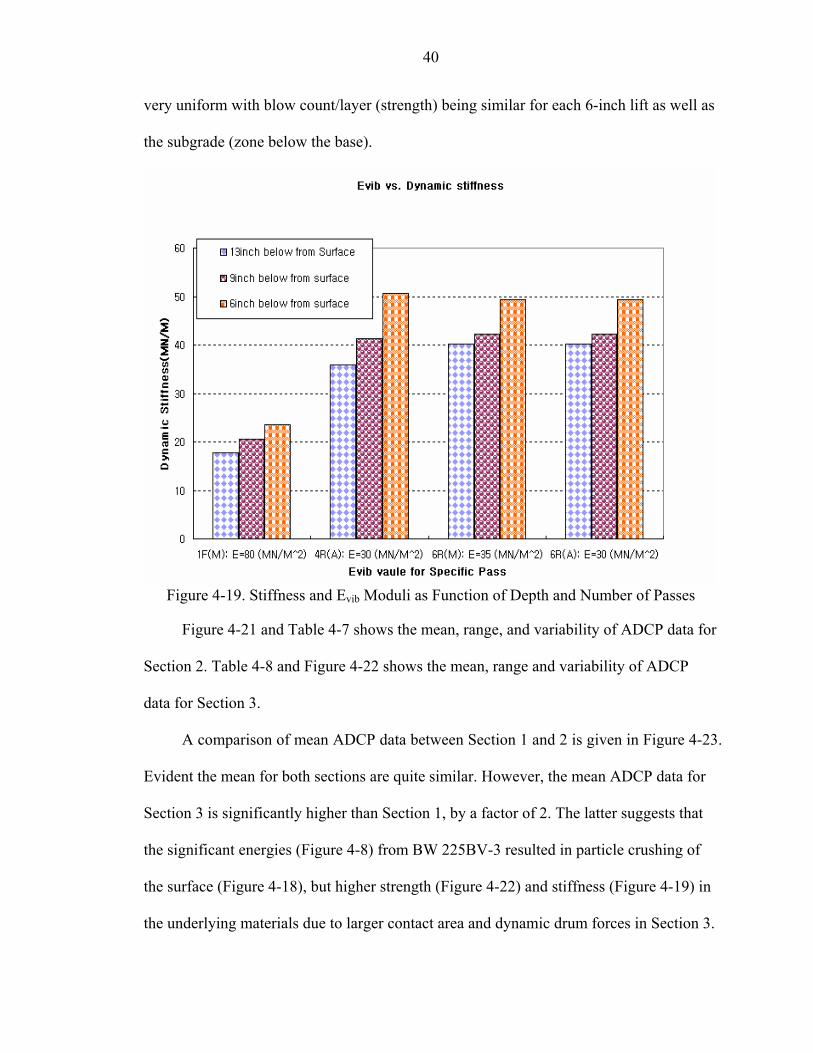
To further verify the particle crushing theory, the stiffness as a function of depth was
found from the stress gages and accelerometers located 6-inch, 9-inch and 13-inch below
the surface, Figure 3-6. The stiffness was assessed for the loading phase (e.g., Figure 4-8)
and was compared to the Evib, in Figure 4-19. Figure 4-19 shows the stiffness 6-inch or
below increased or remained constant for all passes as compared the surface Evib
measurements (x axis- decreased). The sensor 6-inch below the surface reached its
maximum on the 4th pass, whereas, the bottom (13-inch) reached maximum at the 6th
pass. The increasing stiffness values below 6-inch, supported by the higher densities in
Figure 4-15, are in conflict with the decreasing Evib values with pass number. Further
confirmation of the influence of compactive effort (energies), Figure 4-8, are presented in
section 4.6, concerning strength vs. depth.
38
Figure 4-17. Stiffness measured by SSG in All Sections
Table 4-5. SSG Mean and Standard Deviation on Each Section Section1 Average Standard Deviation 0~6inch 14 2.33
6~12inch 12 1.64 0~12inch 13 2.14 Section2 --- --- 0~12inch 15 3.50 Section3 --- --- 0~12inch 13 3.98
4.6 Base Strength vs. Depth
Besides stiffness, the strength of base materials beneath the roadway is extremely
important. The latter controls maximum contact pressures (e.g., semi-truck tire
pressures) that the roadway may be exposed without undergoing a bearing failure. One
means of assessing strength in the field is with a static or dynamic cone penetration test.
39
For this study, an Automatic Dynamic Cone Penetrometer (ADCP) device owned and
operated by the State Materials Office (SMO) in Gainesville was used. SMO
recommended the automatic dynamic cone over the static due to its prior success on other
base project studies.
Figure 4-18. Stiffness from FWD & SSG vs. Dynamic Modulus from Vario-System
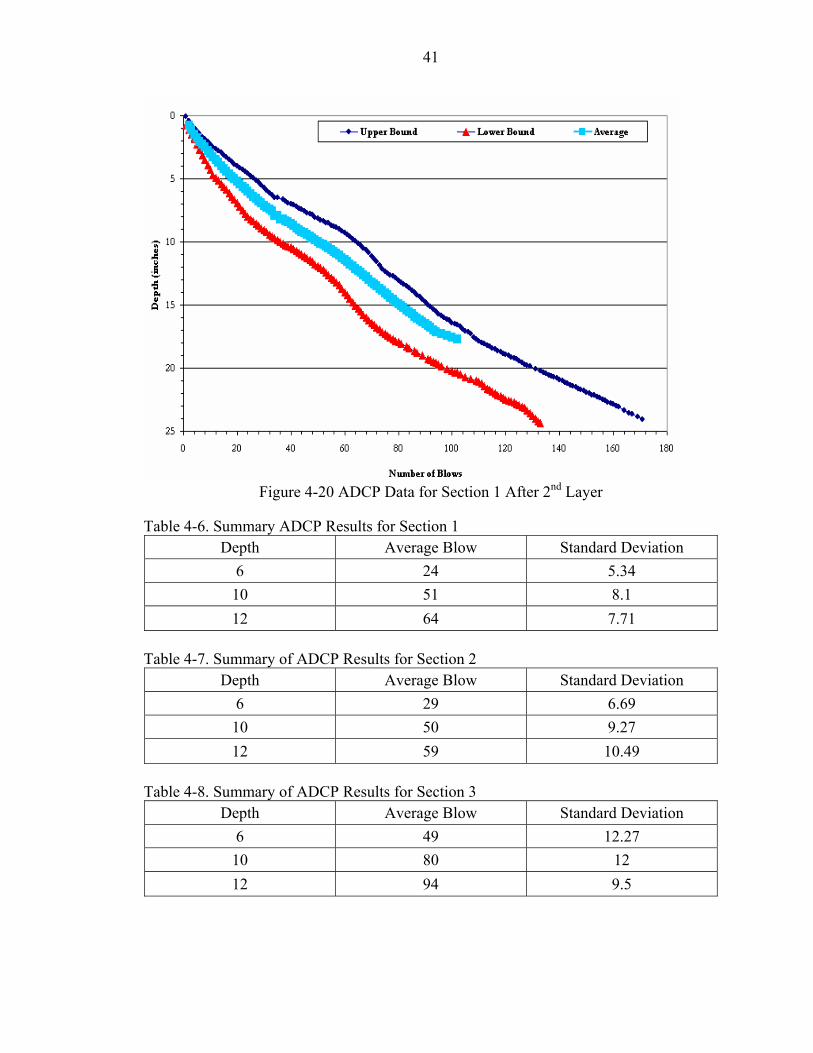
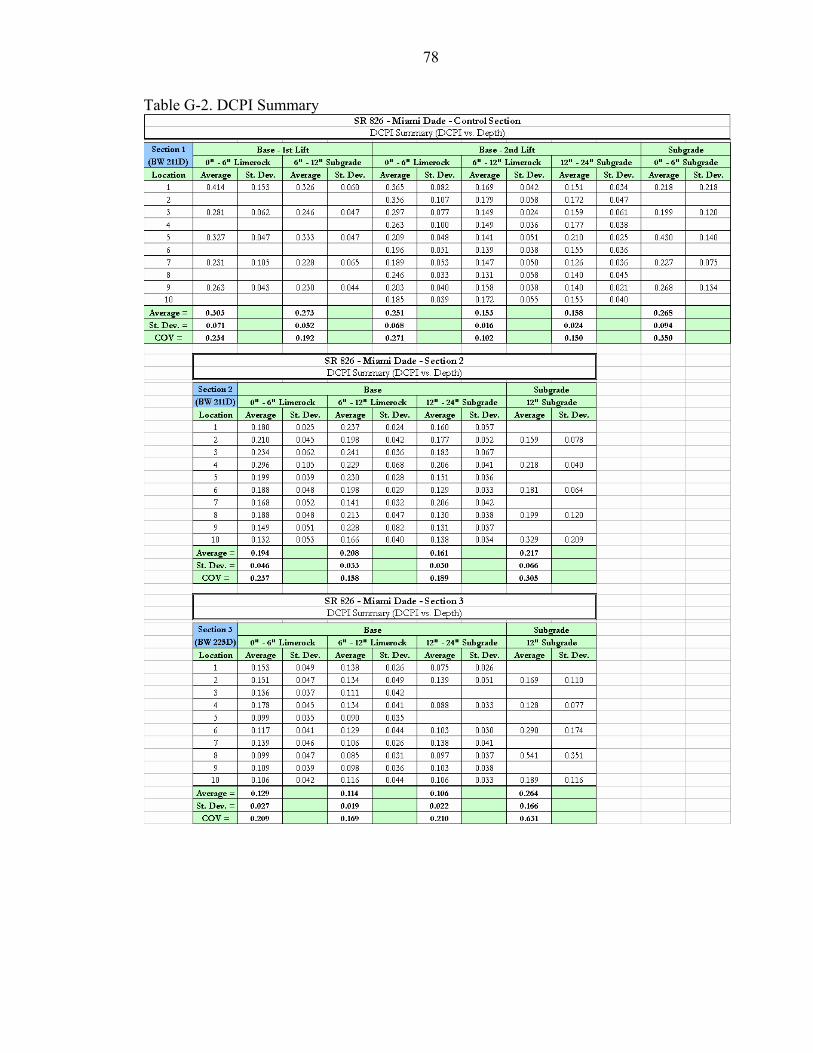
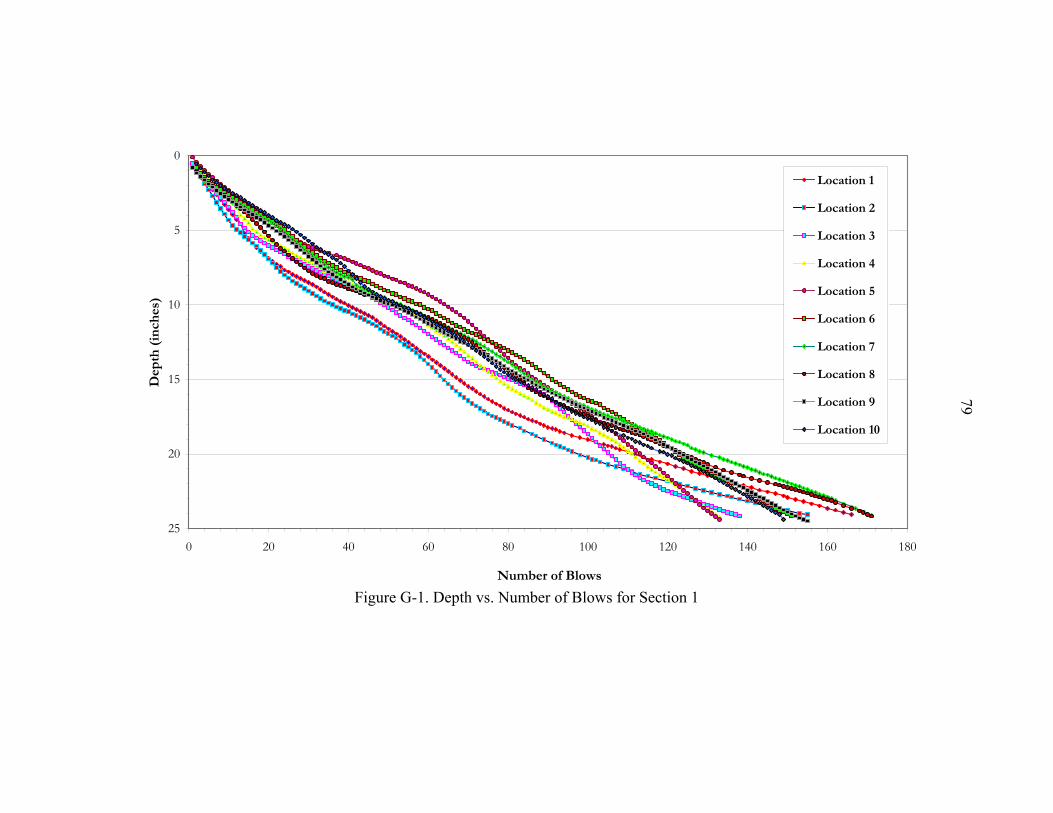
Figure 4-20 shows the mean and maximum range of ADCP values as a function of
depth for Section 1 after the placement of the second 6-inch lift. Appendix G presents the
data for all ten locations (Figure 3-5), and Table 4-6 reports the mean and standard
deviation of the ten values at depths of 6-inch, 10-inch and 12-inch below the base
surface. Of interest is the number of blows required to achieve a specific depth,
discontinuities (i.e., jumps due to impenetrable rocks – schist), as well as the slope
(blows/distance) over a given layer. Figure 4-20 shows Section 1 after compaction was
40
very uniform with blow count/layer (strength) being similar for each 6-inch lift as well as
the subgrade (zone below the base).
Figure 4-19. Stiffness and Evib Moduli as Function of Depth and Number of Passes
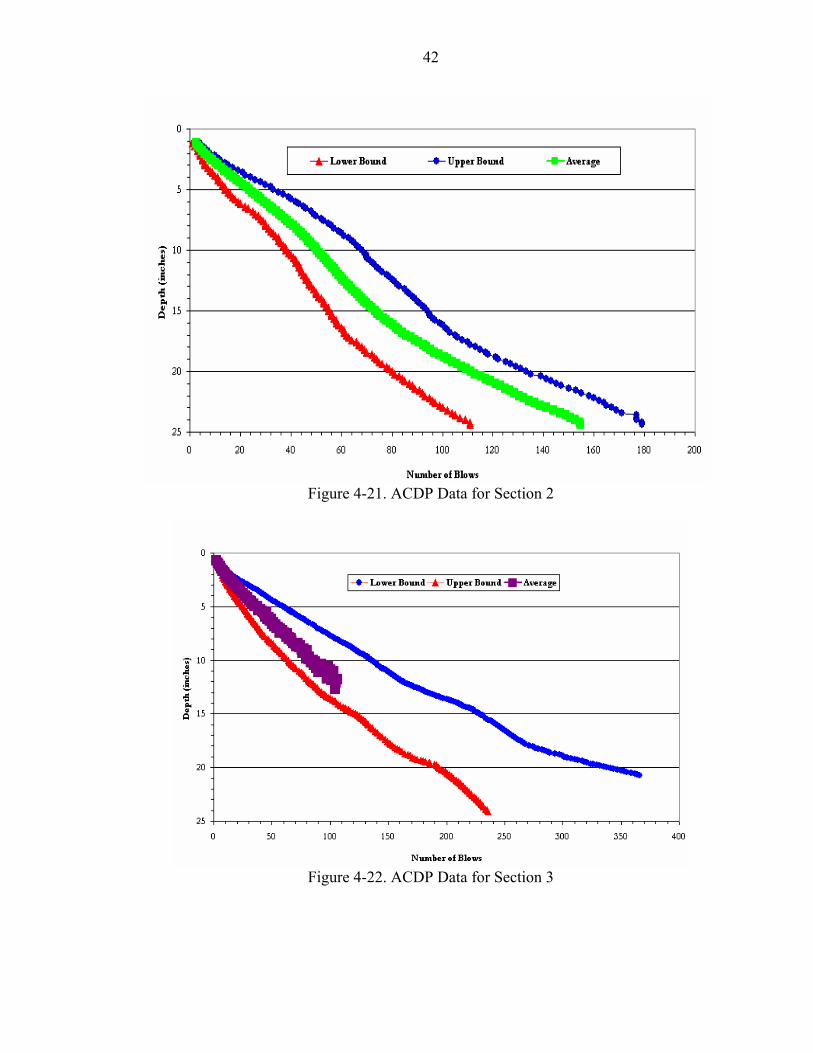
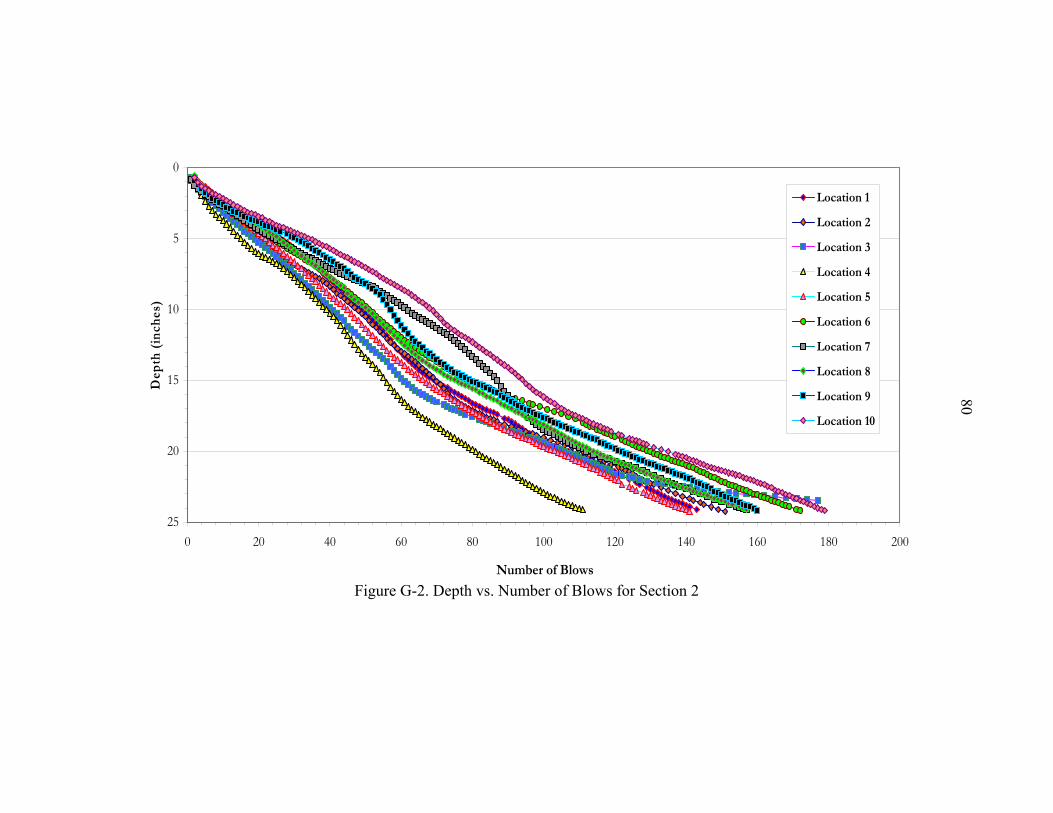
Figure 4-21 and Table 4-7 shows the mean, range, and variability of ADCP data for
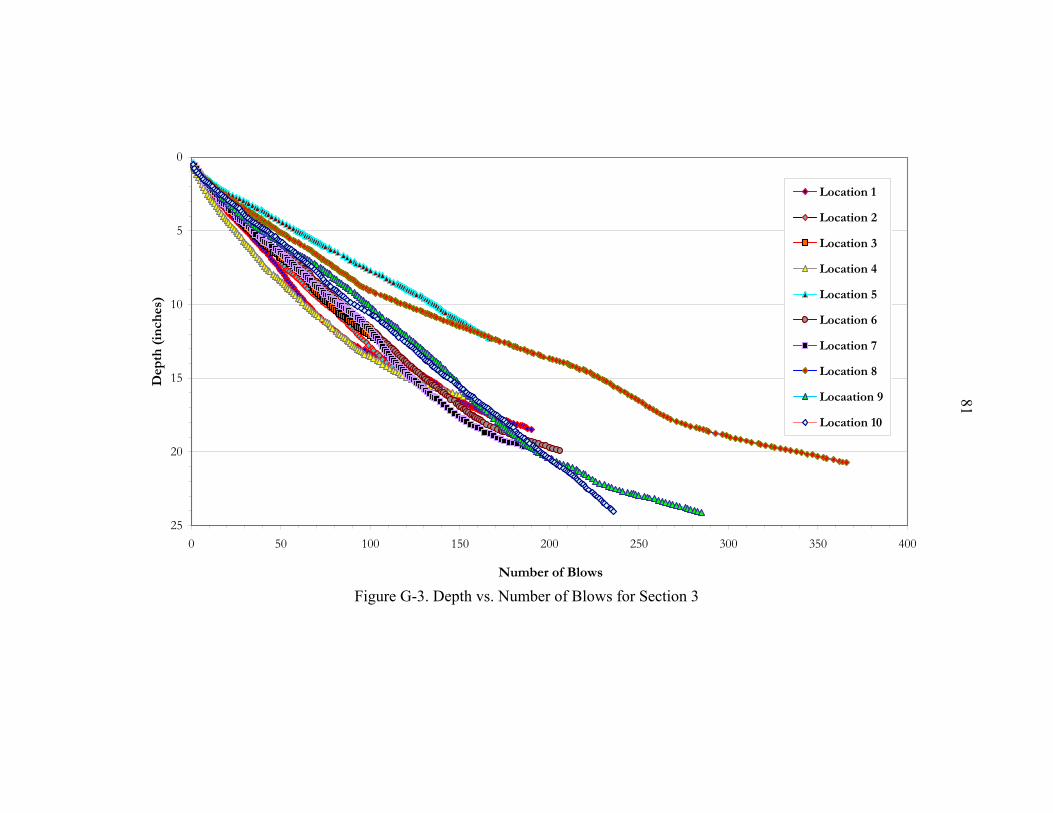
Section 2. Table 4-8 and Figure 4-22 shows the mean, range and variability of ADCP
data for Section 3.
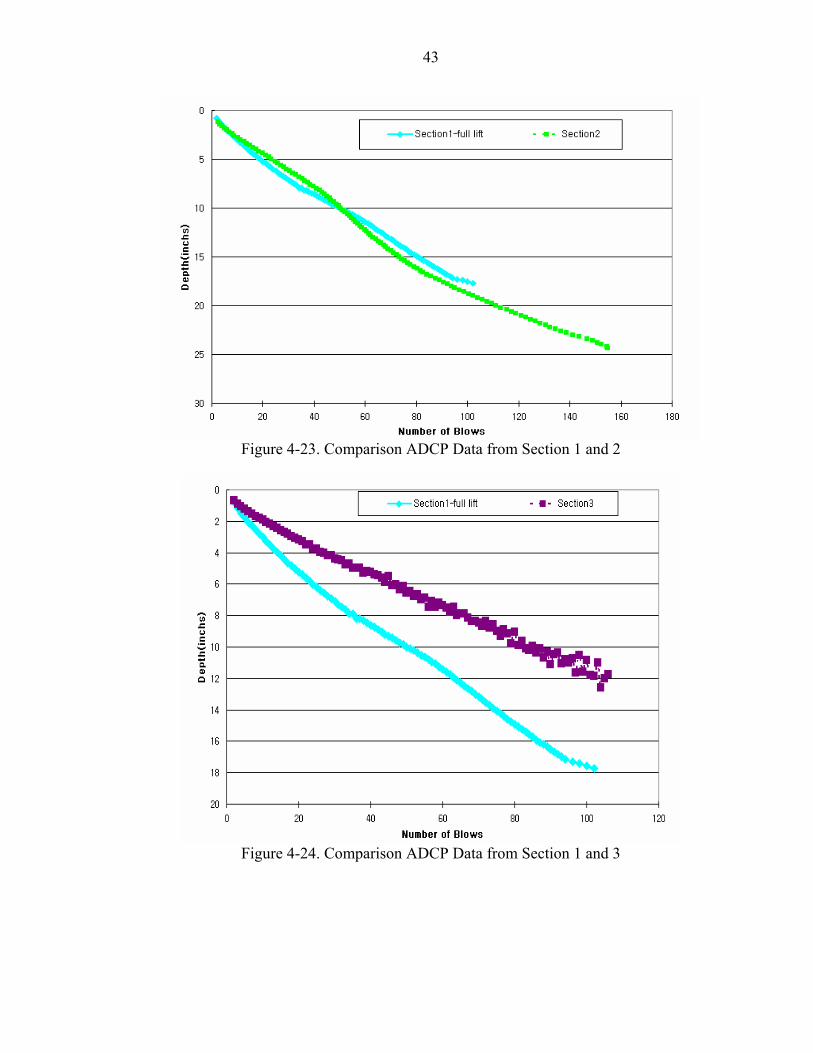
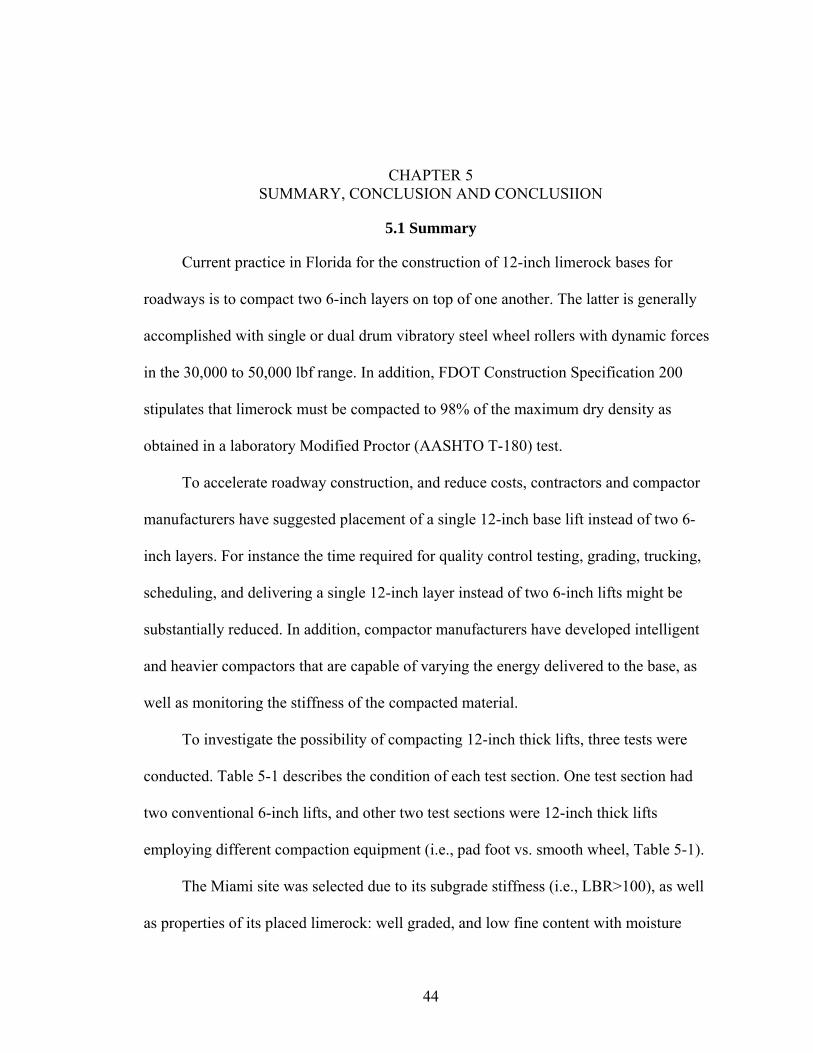
A comparison of mean ADCP data between Section 1 and 2 is given in Figure 4-23.
Evident the mean for both sections are quite similar. However, the mean ADCP data for
Section 3 is significantly higher than Section 1, by a factor of 2. The latter suggests that
the significant energies (Figure 4-8) from BW 225BV-3 resulted in particle crushing of
the surface (Figure 4-18), but higher strength (Figure 4-22) and stiffness (Figure 4-19) in
the underlying materials due to larger contact area and dynamic drum forces in Section 3.
41
Figure 4-20 ADCP Data for Section 1 After 2nd Layer
Table 4-6. Summary ADCP Results for Section 1 Depth Average Blow Standard Deviation
6 24 5.34 10 51 8.1 12 64 7.71
Table 4-7. Summary of ADCP Results for Section 2
Depth Average Blow Standard Deviation 6 29 6.69
10 50 9.27 12 59 10.49
Table 4-8. Summary of ADCP Results for Section 3
Depth Average Blow Standard Deviation 6 49 12.27
10 80 12 12 94 9.5
42
Figure 4-21. ACDP Data for Section 2
Figure 4-22. ACDP Data for Section 3
43
Figure 4-23. Comparison ADCP Data from Section 1 and 2
Figure 4-24. Comparison ADCP Data from Section 1 and 3
44
CHAPTER 5 SUMMARY, CONCLUSION AND CONCLUSIION
5.1 Summary
Current practice in Florida for the construction of 12-inch limerock bases for
roadways is to compact two 6-inch layers on top of one another. The latter is generally
accomplished with single or dual drum vibratory steel wheel rollers with dynamic forces
in the 30,000 to 50,000 lbf range. In addition, FDOT Construction Specification 200
stipulates that limerock must be compacted to 98% of the maximum dry density as
obtained in a laboratory Modified Proctor (AASHTO T-180) test.
To accelerate roadway construction, and reduce costs, contractors and compactor
manufacturers have suggested placement of a single 12-inch base lift instead of two 6-
inch layers. For instance the time required for quality control testing, grading, trucking,
scheduling, and delivering a single 12-inch layer instead of two 6-inch lifts might be
substantially reduced. In addition, compactor manufacturers have developed intelligent
and heavier compactors that are capable of varying the energy delivered to the base, as
well as monitoring the stiffness of the compacted material.
To investigate the possibility of compacting 12-inch thick lifts, three tests were
conducted. Table 5-1 describes the condition of each test section. One test section had
two conventional 6-inch lifts, and other two test sections were 12-inch thick lifts
employing different compaction equipment (i.e., pad foot vs. smooth wheel, Table 5-1).
The Miami site was selected due to its subgrade stiffness (i.e., LBR>100), as well
as properties of its placed limerock: well graded, and low fine content with moisture
45
contents from the mine less than optimum (i.e., 4% ~7% as dry part of 9% as optimum
water content). As identified in the literature and lab (Chapter 2), compacting dry of
optimum results in greater stiffness and strength.
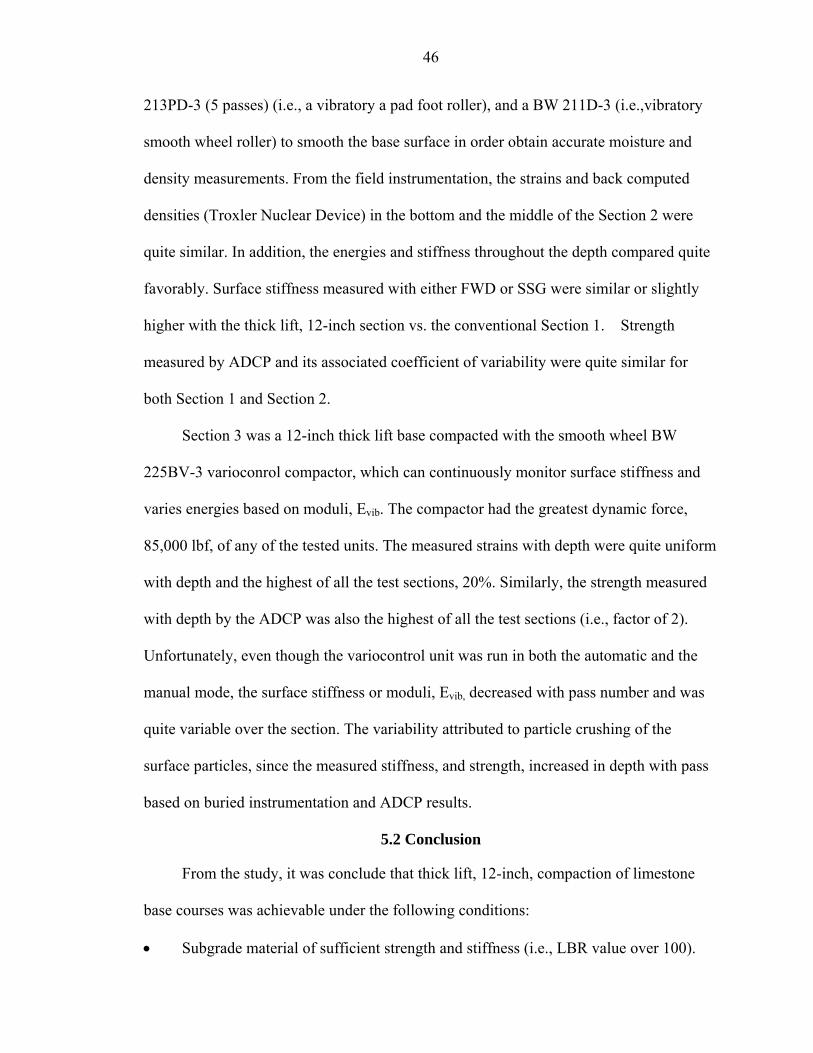
Table 5-1. Test Sections and Compactors
Location Compactor Dynamic
Force (lbf)
Compactor Detail
Applied Lift Thickness
Section 1 BOMAG BW 211D-3 53,000
Vibratory Steel Smooth Roller
used conventionally
Conventional lifts (e.g., two 6-inch)
Section 2 BOMAG BW 213PD-3 62,000 Vibratory Padfoot
Roller 12-inch thick lift
Section 3 BOMAG BW 225BV-3 85,000 Vibratory Smooth
Wheel- ICC Unit 12-inch thick lift
To identify stresses, deformations, and energies within the 6-inch and 12-inch lifts,
stress gages, accelerometers, and LVDT deformation sensors were placed in the top,
middle and bottom third of each placed layer. After compaction of each lift, Falling
Weight Deflectometer (FWD), Soil Stiffness Gage (SSG), and Automatic Dynamic Cone
Penetrometer (ADCP) testing were performed at 10 locations within each site with 1foot
interval. Of interest were the densities, stiffness, and strengths of material as a function
of depth for the two 6-inch vs. 12-inch thick lifts. Also of importance was the Moduli,
Evib, from Bomag’s Intelligent Compaction Control (ICC) unit vs. field measured
stiffness. As expected, the two 6-inch lifts, Section 1, reached 98% of maximum dry
densities within 3 to 5 passes of the conventional smooth steel vibratory compactor.
Strains within the lifts were 6 to 9% with appreciable increase in density occurring within
the lower lift as the upper lift was compacted.
Compaction of Section 2, a 12-inch thick lift, occurred with alternating passes of BW
46
213PD-3 (5 passes) (i.e., a vibratory a pad foot roller), and a BW 211D-3 (i.e.,vibratory
smooth wheel roller) to smooth the base surface in order obtain accurate moisture and
density measurements. From the field instrumentation, the strains and back computed
densities (Troxler Nuclear Device) in the bottom and the middle of the Section 2 were
quite similar. In addition, the energies and stiffness throughout the depth compared quite
favorably. Surface stiffness measured with either FWD or SSG were similar or slightly
higher with the thick lift, 12-inch section vs. the conventional Section 1. Strength
measured by ADCP and its associated coefficient of variability were quite similar for
both Section 1 and Section 2.
Section 3 was a 12-inch thick lift base compacted with the smooth wheel BW
225BV-3 varioconrol compactor, which can continuously monitor surface stiffness and
varies energies based on moduli, Evib. The compactor had the greatest dynamic force,
85,000 lbf, of any of the tested units. The measured strains with depth were quite uniform
with depth and the highest of all the test sections, 20%. Similarly, the strength measured
with depth by the ADCP was also the highest of all the test sections (i.e., factor of 2).
Unfortunately, even though the variocontrol unit was run in both the automatic and the
manual mode, the surface stiffness or moduli, Evib, decreased with pass number and was
quite variable over the section. The variability attributed to particle crushing of the
surface particles, since the measured stiffness, and strength, increased in depth with pass
based on buried instrumentation and ADCP results.
5.2 Conclusion
From the study, it was conclude that thick lift, 12-inch, compaction of limestone
base courses was achievable under the following conditions:
• Subgrade material of sufficient strength and stiffness (i.e., LBR value over 100).
47
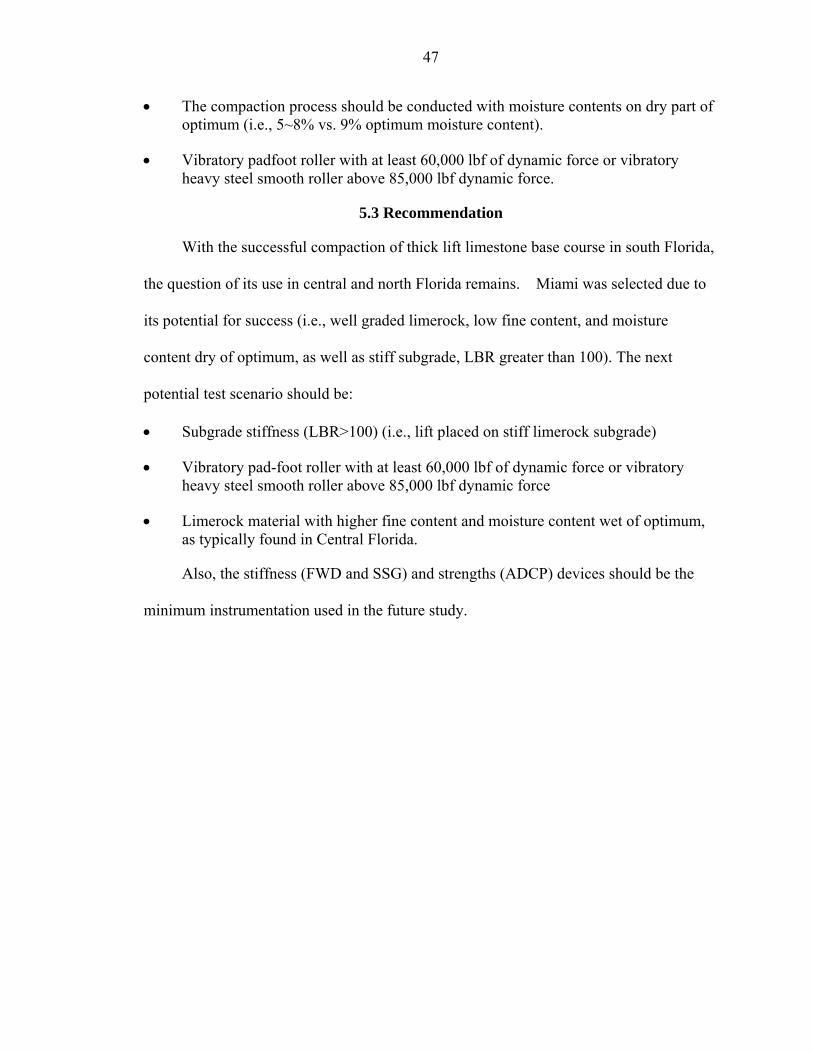
• The compaction process should be conducted with moisture contents on dry part of optimum (i.e., 5~8% vs. 9% optimum moisture content).
• Vibratory padfoot roller with at least 60,000 lbf of dynamic force or vibratory heavy steel smooth roller above 85,000 lbf dynamic force.
5.3 Recommendation
With the successful compaction of thick lift limestone base course in south Florida,
the question of its use in central and north Florida remains. Miami was selected due to
its potential for success (i.e., well graded limerock, low fine content, and moisture
content dry of optimum, as well as stiff subgrade, LBR greater than 100). The next
potential test scenario should be:
• Subgrade stiffness (LBR>100) (i.e., lift placed on stiff limerock subgrade)
• Vibratory pad-foot roller with at least 60,000 lbf of dynamic force or vibratory heavy steel smooth roller above 85,000 lbf dynamic force
• Limerock material with higher fine content and moisture content wet of optimum, as typically found in Central Florida.
Also, the stiffness (FWD and SSG) and strengths (ADCP) devices should be the
minimum instrumentation used in the future study.
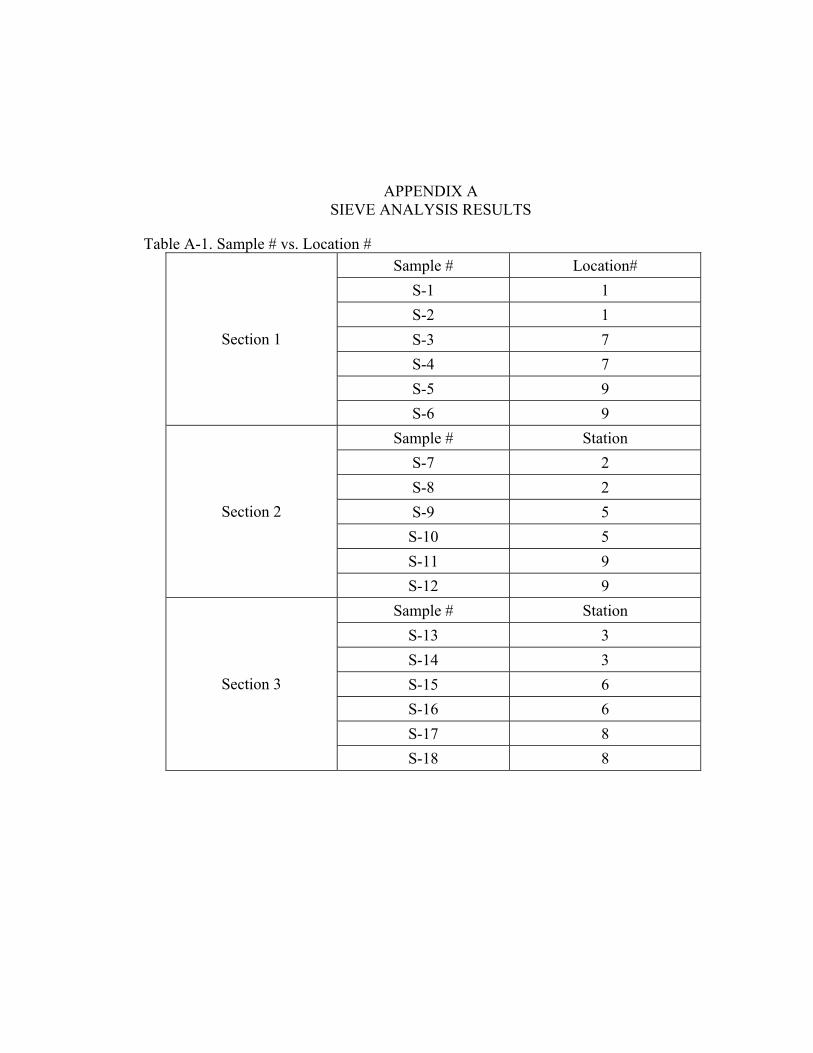
APPENDIX A SIEVE ANALYSIS RESULTS
Table A-1. Sample # vs. Location # Sample # Location#
S-1 1 S-2 1 S-3 7 S-4 7 S-5 9
Section 1
S-6 9 Sample # Station
S-7 2 S-8 2 S-9 5 S-10 5 S-11 9
Section 2
S-12 9 Sample # Station
S-13 3 S-14 3 S-15 6 S-16 6 S-17 8
Section 3
S-18 8
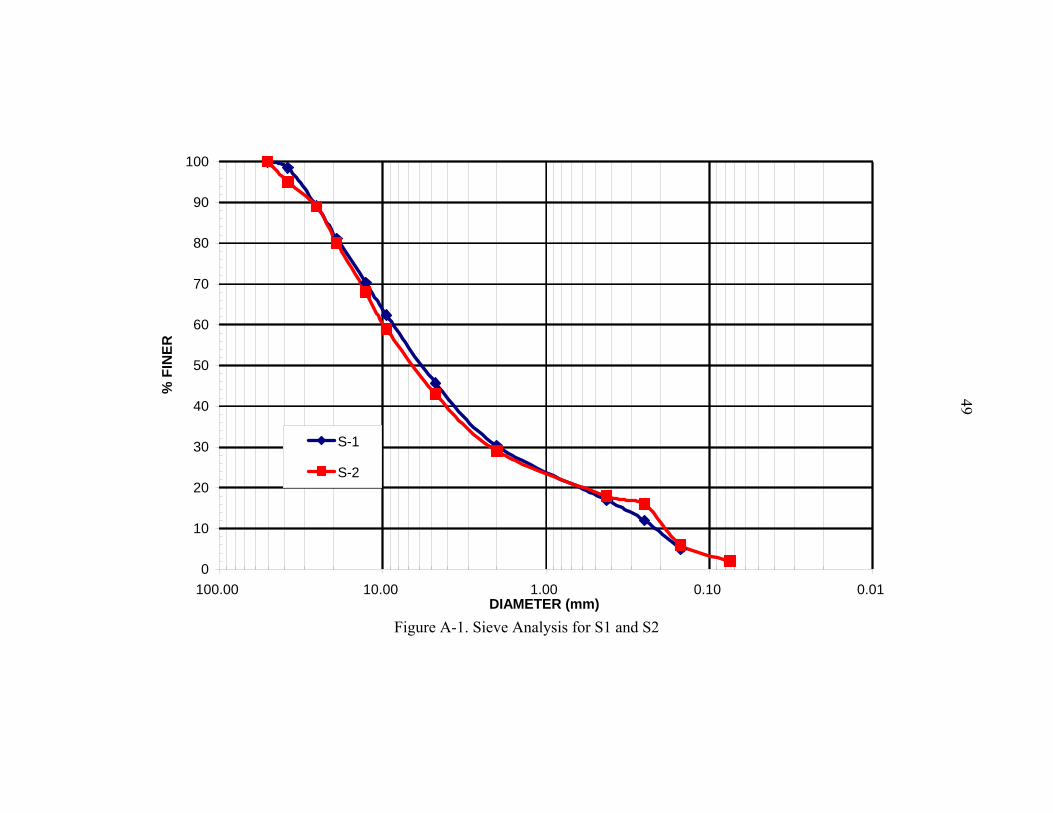
49
Figure A-1. Sieve Analysis for S1 and S2
0
10
20
30
40
50
60
70
80
90
100
0.010.101.0010.00100.00DIAMETER (mm)
% F
INER
S-1
S-2
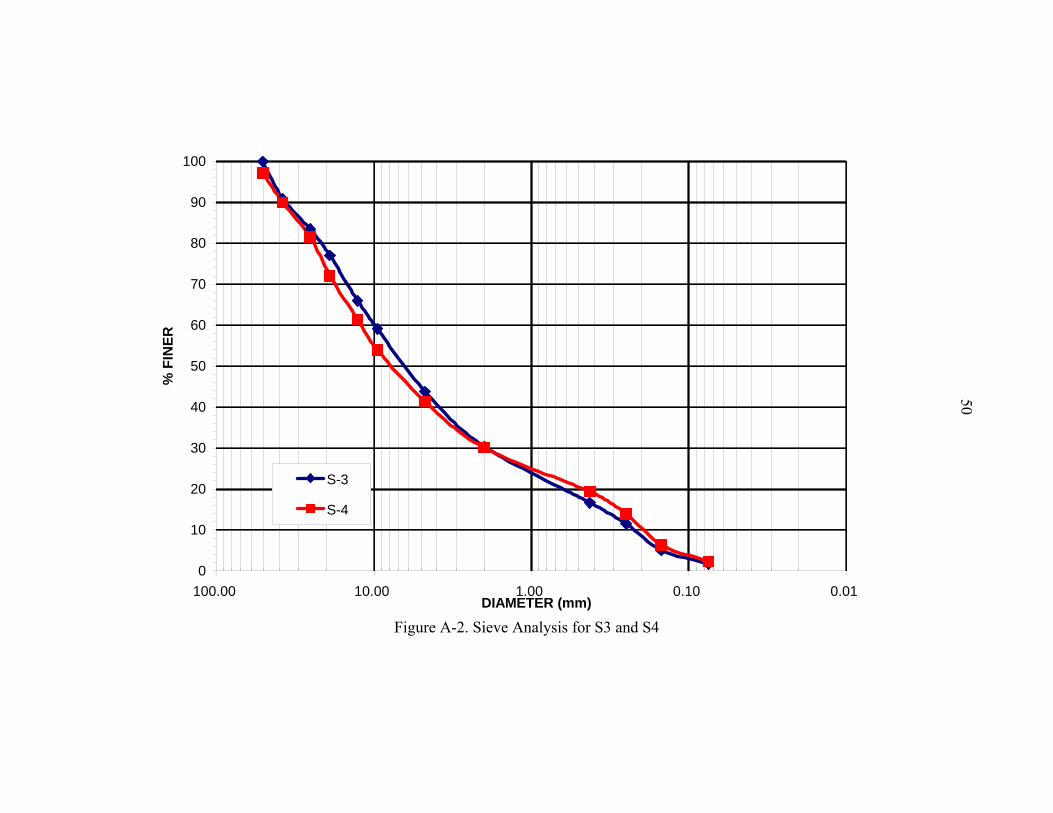
50
Figure A-2. Sieve Analysis for S3 and S4
0
10
20
30
40
50
60
70
80
90
100
0.010.101.0010.00100.00DIAMETER (mm)
% F
INER
S-3
S-4
51
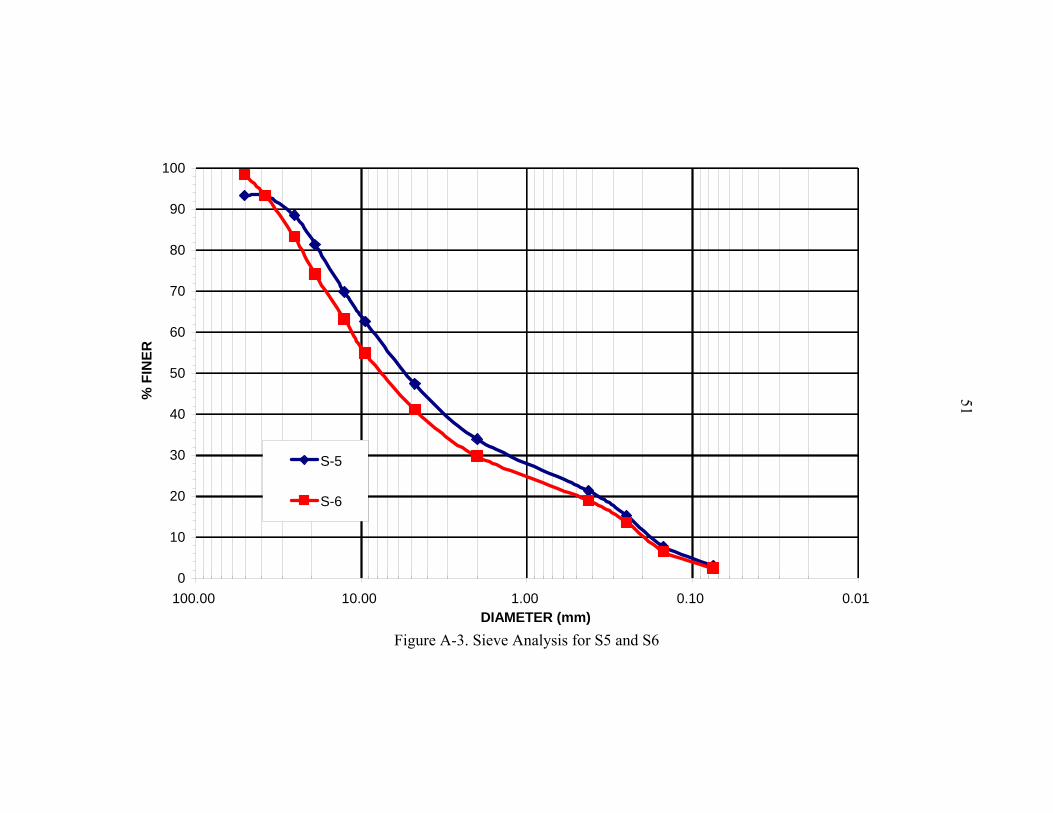
Figure A-3. Sieve Analysis for S5 and S6
0
10
20
30
40
50
60
70
80
90
100
0.010.101.0010.00100.00DIAMETER (mm)
% F
INER
S-5
S-6
52
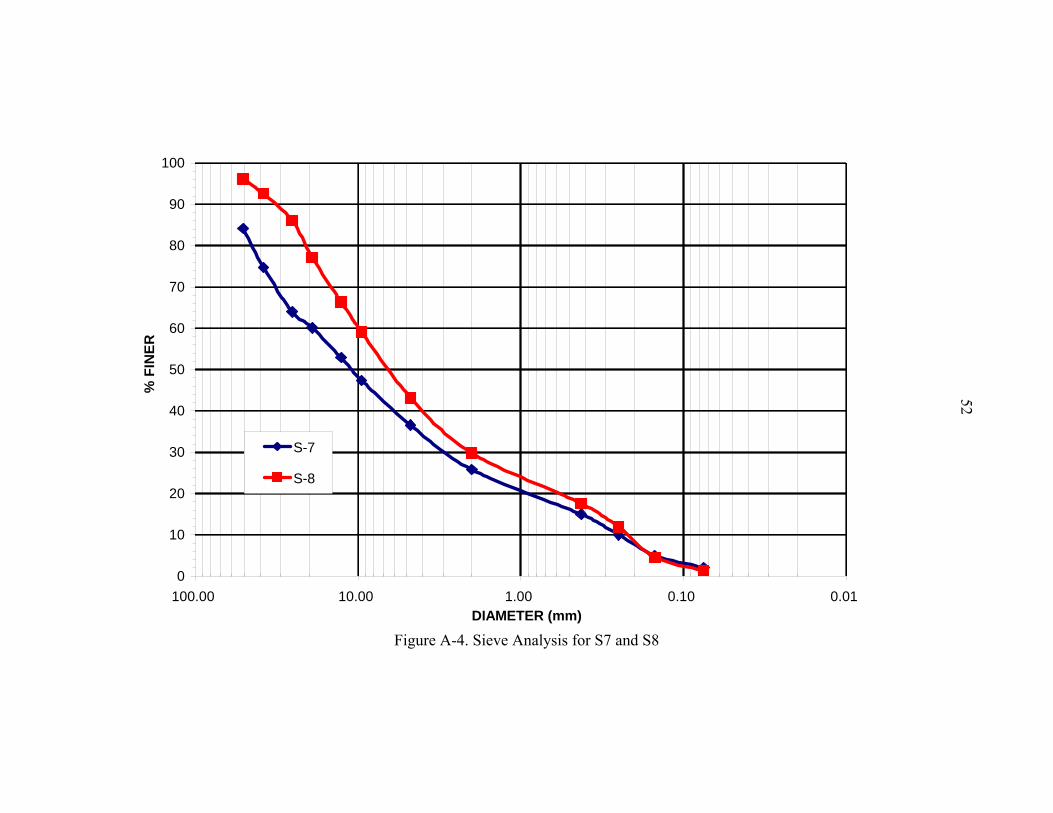
Figure A-4. Sieve Analysis for S7 and S8
0
10
20
30
40
50
60
70
80
90
100
0.010.101.0010.00100.00DIAMETER (mm)
% F
INER
S-7
S-8
53
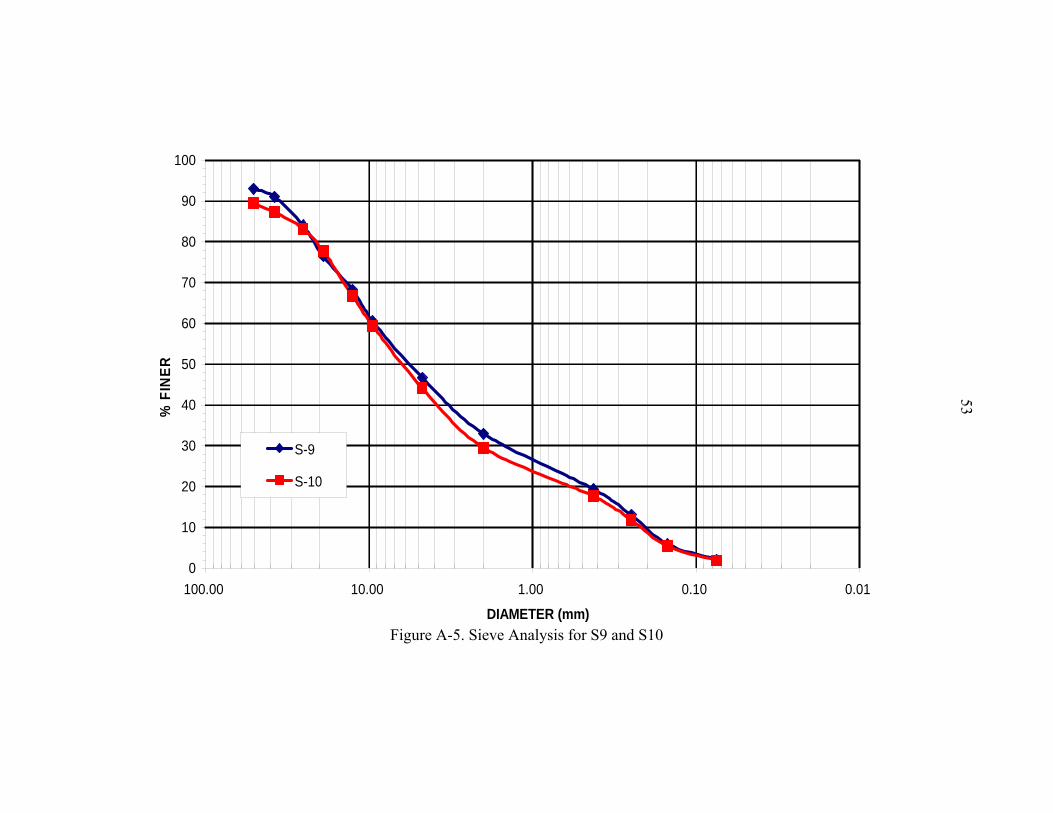
Figure A-5. Sieve Analysis for S9 and S10
0
10
20
30
40
50
60
70
80
90
100
0.010.101.0010.00100.00
DIAMETER (mm)
% F
INER
S-9
S-10
54
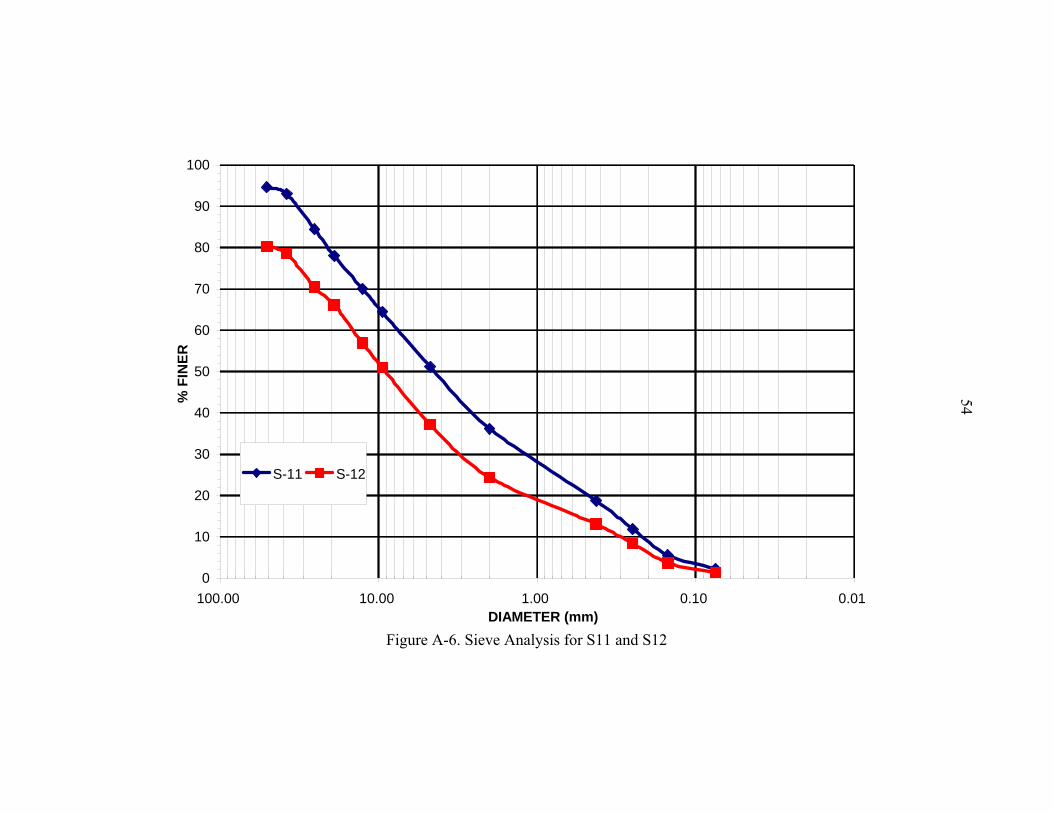
Figure A-6. Sieve Analysis for S11 and S12
0
10
20
30
40
50
60
70
80
90
100
0.010.101.0010.00100.00DIAMETER (mm)
% F
INER
S-11 S-12
55
Figure A-7. Sieve Analysis for S13 and S14
0
10
20
30
40
50
60
70
80
90
100
0.010.101.0010.00100.00 DIAMETER (mm)
% F
INER
S-13
S-14
56
Figure A-8. Sieve Analysis for S15 and S16
0
10
20
30
40
50
60
70
80
90
100
0.010.101.0010.00100.00DIAMETER (mm)
% F
INER
S-15 S-16
57
Figure A-9. Sieve Analysis for S17 and S18
0
10
20
30
40
50
60
70
80
90
100
0.00.11.010.0100.0DIAMETER (mm)
% F
INER
S-17
S-18

APPENDIX B MOISTURE CONTENT MEASURED BY NUCLEAR DENSITY PROBE
59
Table B-1. Data from Nuclear Density Measurement for Section 1
60
Table B-2. Data from Nuclear Density Measurement for Section 2
61
Table B-3. Data from Nuclear Density Measurement for Section 3
APPENDIX C OVEN MOISTURE CONTENT RESULTS
Table C-1. Data from Oven Moisture Measurement SR 826 Oven Moistures
Test Date 11/30/2004 Sample # Section1 Location % M
1 0" to 6" 1 6.98 2 6" to 12" 1 6.39 3 0" to 6" 7 5.53 4 6" to 12" 7 5.5 5 0" to 6" 9 5.28 6 6" to 12" 9 5.55
Test Date 12/1/2004 Sample # Section 2 Location % M
7 0" to 6" 2 6.88 8 6" to 12" 2 6.79 9 0" to 6" 5 6.7
10 6" to 12" 5 7.5 11 0" to 6" 9 6.62 12 6" to 12" 9 7.78
Test Date 12/1/2004 Sample # Section 3 Location % M
13 0" to 6" 3 7.34 14 6" to 12" 3 6.84 15 0" to 6" 6 7.22 16 6" to 12" 6 7.77 17 0" to 6" 8 6.08 18 6" to 12" 8 6.1
APPENDIX D DATA REDUCING
D.1 Calculation for Reducing Data
D.1.1 Stress
Reducing Data = (Raw Data-Initial Value)*100 (Initial Value is the average value of values measured during last 0.4 sec in whole measuring time, 10 sec) D.1.2 Strain
Reducing Data= (Raw Data-Initial Value)*Factor (Initial Value is measured before test) Table D-1. Factor for Reducing of Strain Data Section 1 Section 2 Section 3 CH 6 (Bottom 1/3)
0.4072 0.3966 0.4054
CH 7 (Middle 1/3) 0.4058 0.4054 0.3990 The above factors are calibrated by ARDAMAN & Associates. 63
64
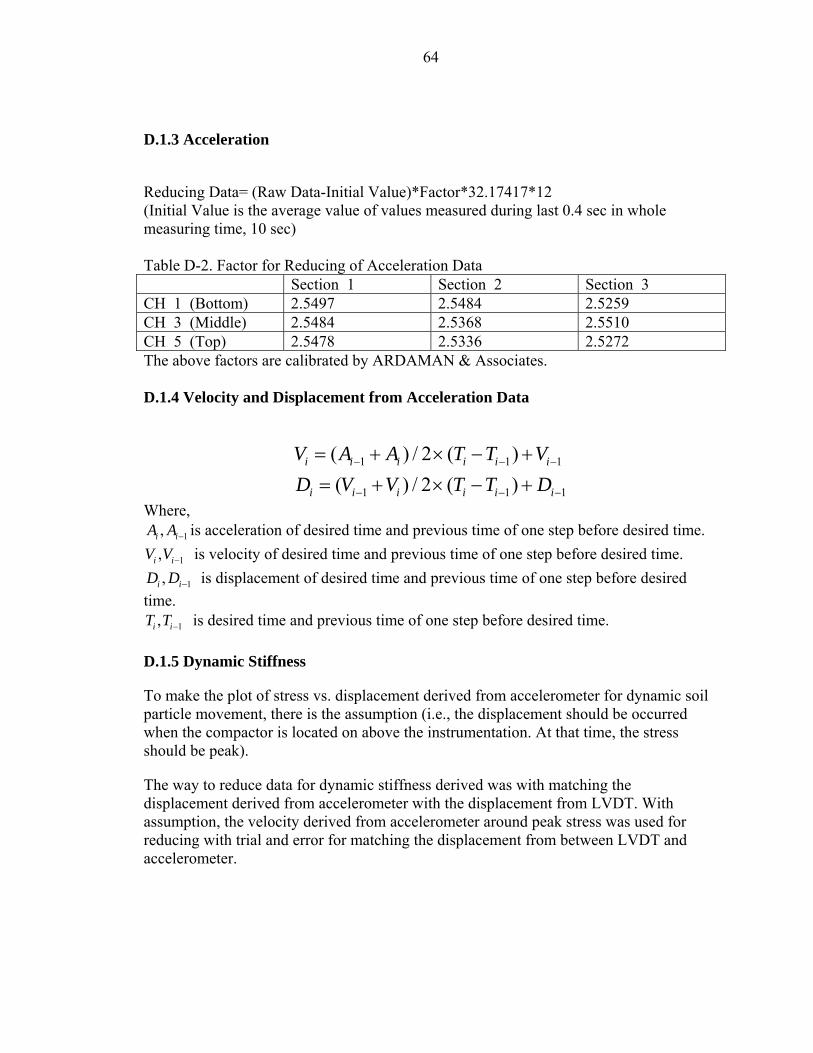
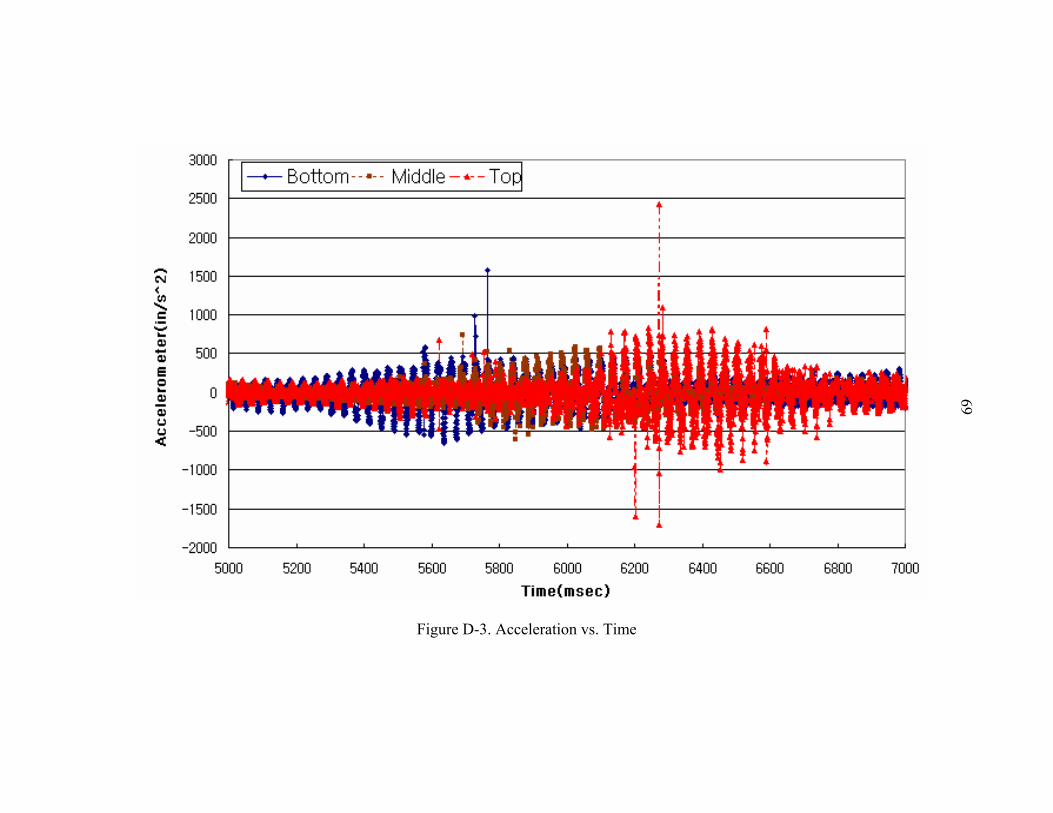
D.1.3 Acceleration
Reducing Data= (Raw Data-Initial Value)*Factor*32.17417*12 (Initial Value is the average value of values measured during last 0.4 sec in whole measuring time, 10 sec) Table D-2. Factor for Reducing of Acceleration Data Section 1 Section 2 Section 3 CH 1 (Bottom) 2.5497 2.5484 2.5259 CH 3 (Middle) 2.5484 2.5368 2.5510 CH 5 (Top) 2.5478 2.5336 2.5272 The above factors are calibrated by ARDAMAN & Associates. D.1.4 Velocity and Displacement from Acceleration Data
1 1 1
1 1 1
( ) / 2 ( )( ) / 2 ( )
i i i i i i
i i i i i i
V A A T T VD V V T T D
− − −
− − −
= + × − +
= + × − +
Where, 1,i iA A − is acceleration of desired time and previous time of one step before desired time.
1,i iV V − is velocity of desired time and previous time of one step before desired time.
1,i iD D − is displacement of desired time and previous time of one step before desired time.
1,i iT T − is desired time and previous time of one step before desired time. D.1.5 Dynamic Stiffness
To make the plot of stress vs. displacement derived from accelerometer for dynamic soil particle movement, there is the assumption (i.e., the displacement should be occurred when the compactor is located on above the instrumentation. At that time, the stress should be peak).
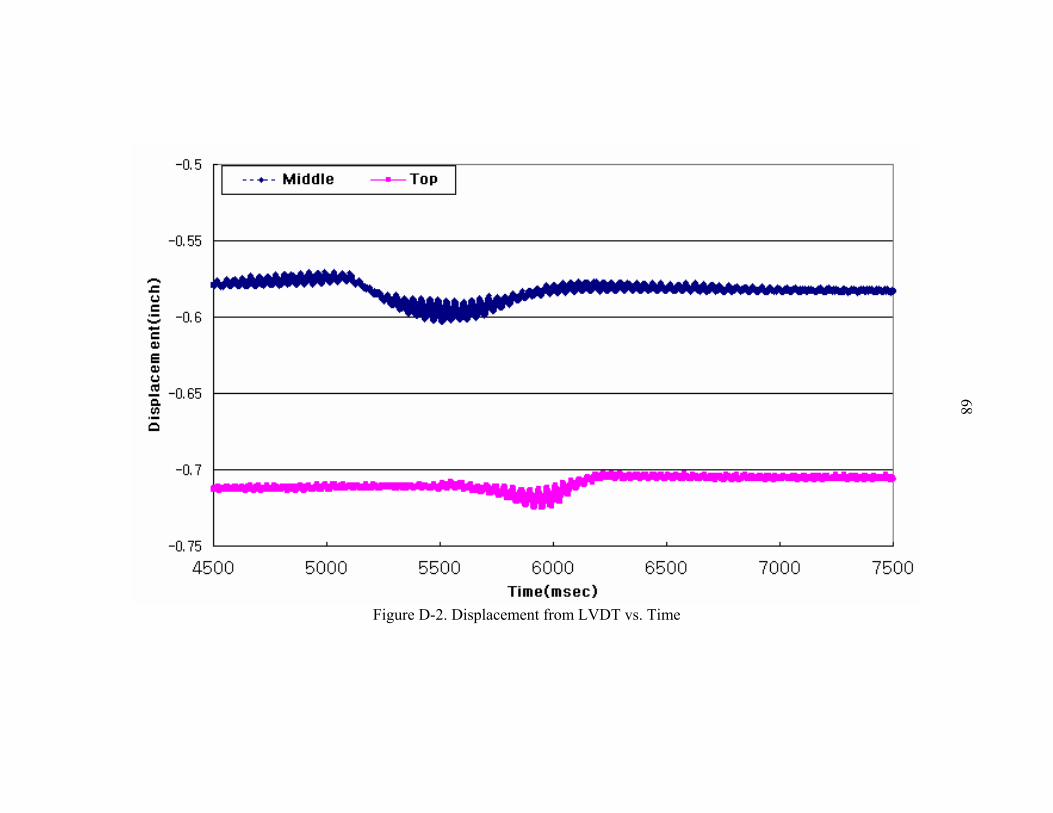
The way to reduce data for dynamic stiffness derived was with matching the displacement derived from accelerometer with the displacement from LVDT. With assumption, the velocity derived from accelerometer around peak stress was used for reducing with trial and error for matching the displacement from between LVDT and accelerometer.
65
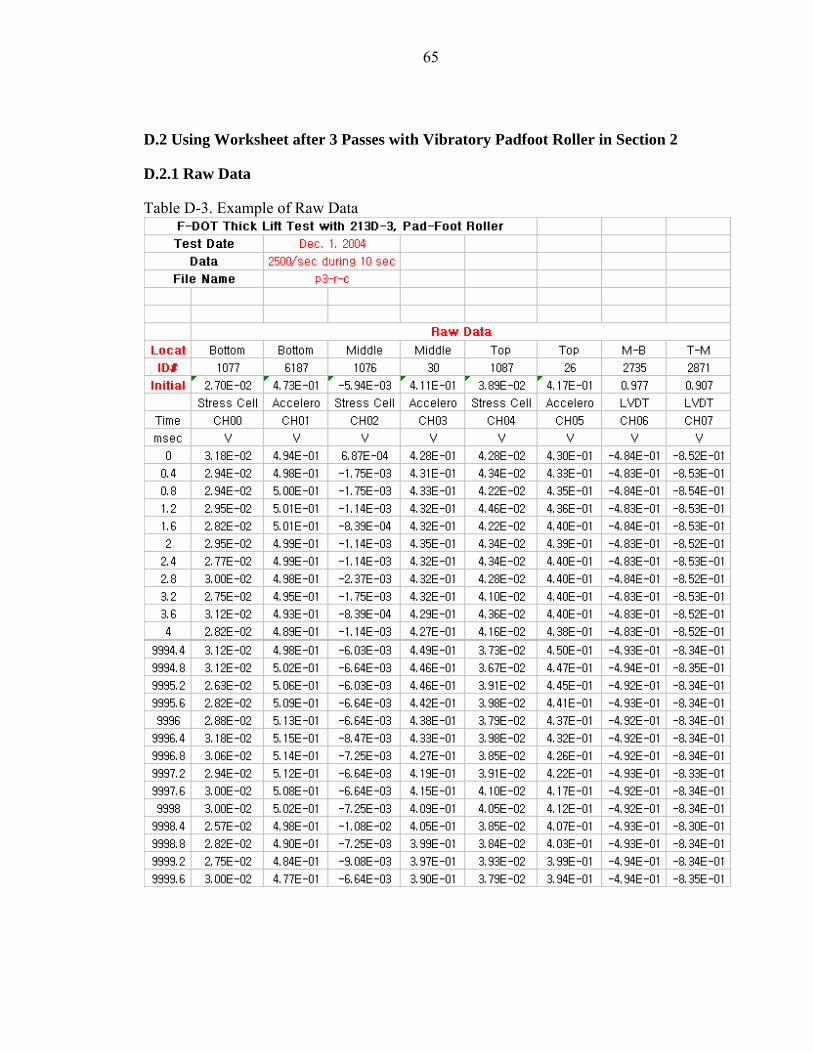
D.2 Using Worksheet after 3 Passes with Vibratory Padfoot Roller in Section 2
D.2.1 Raw Data
Table D-3. Example of Raw Data
66
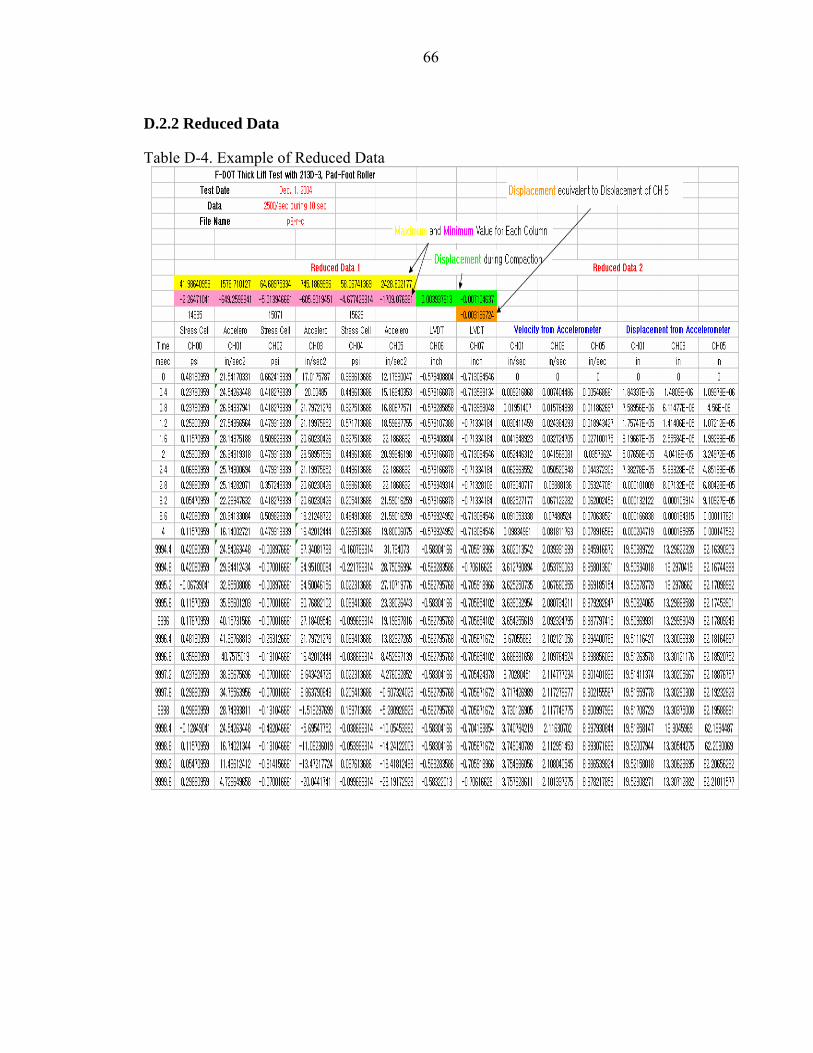
D.2.2 Reduced Data
Table D-4. Example of Reduced Data
67
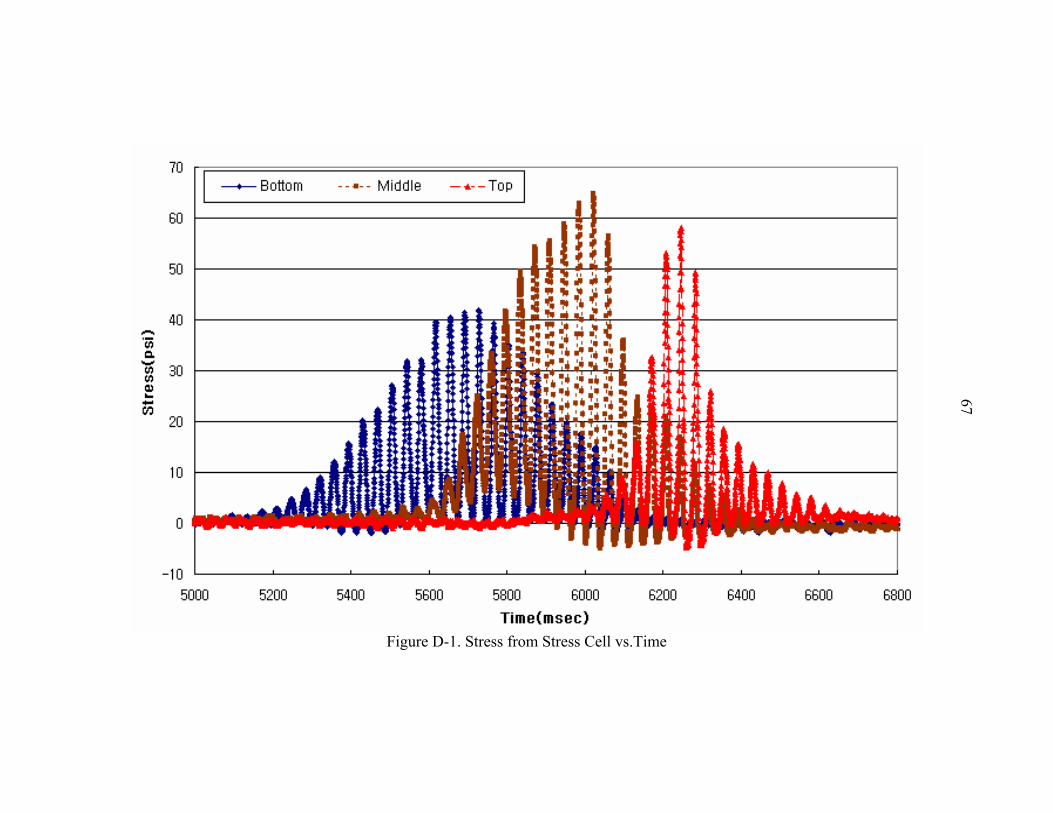
Figure D-1. Stress from Stress Cell vs.Time
68
Figure D-2. Displacement from LVDT vs. Time
69
Figure D-3. Acceleration vs. Time
70
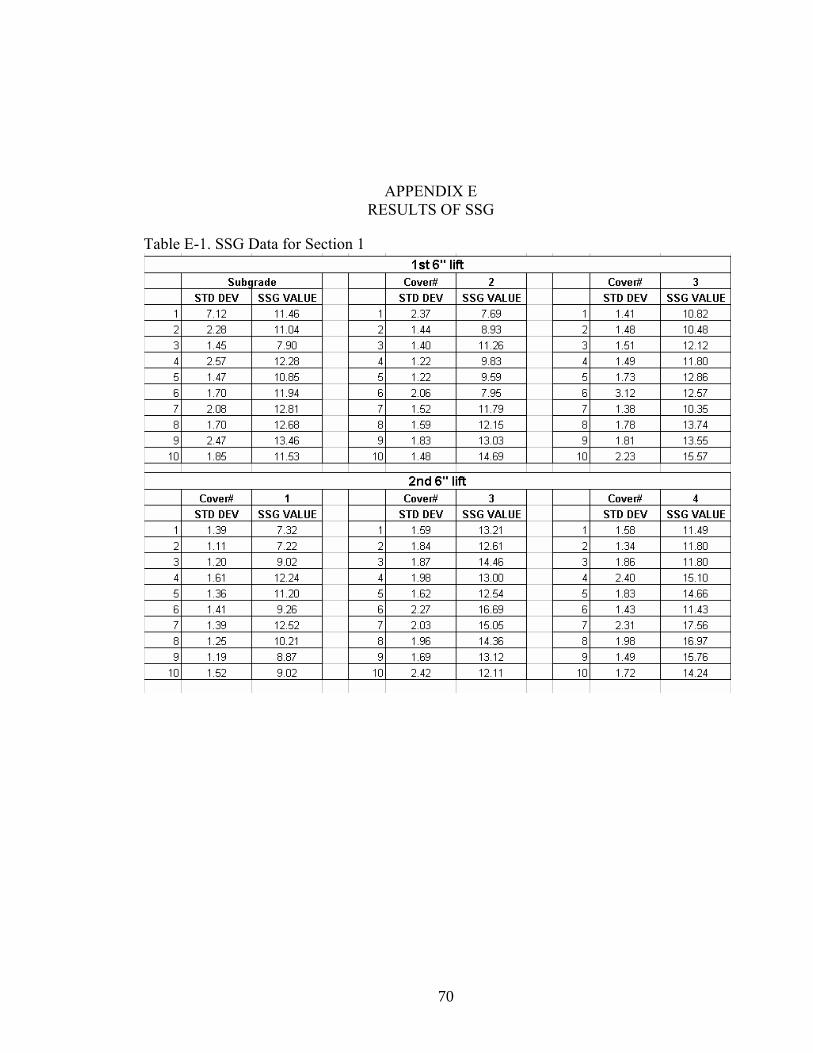
APPENDIX E RESULTS OF SSG
Table E-1. SSG Data for Section 1
71
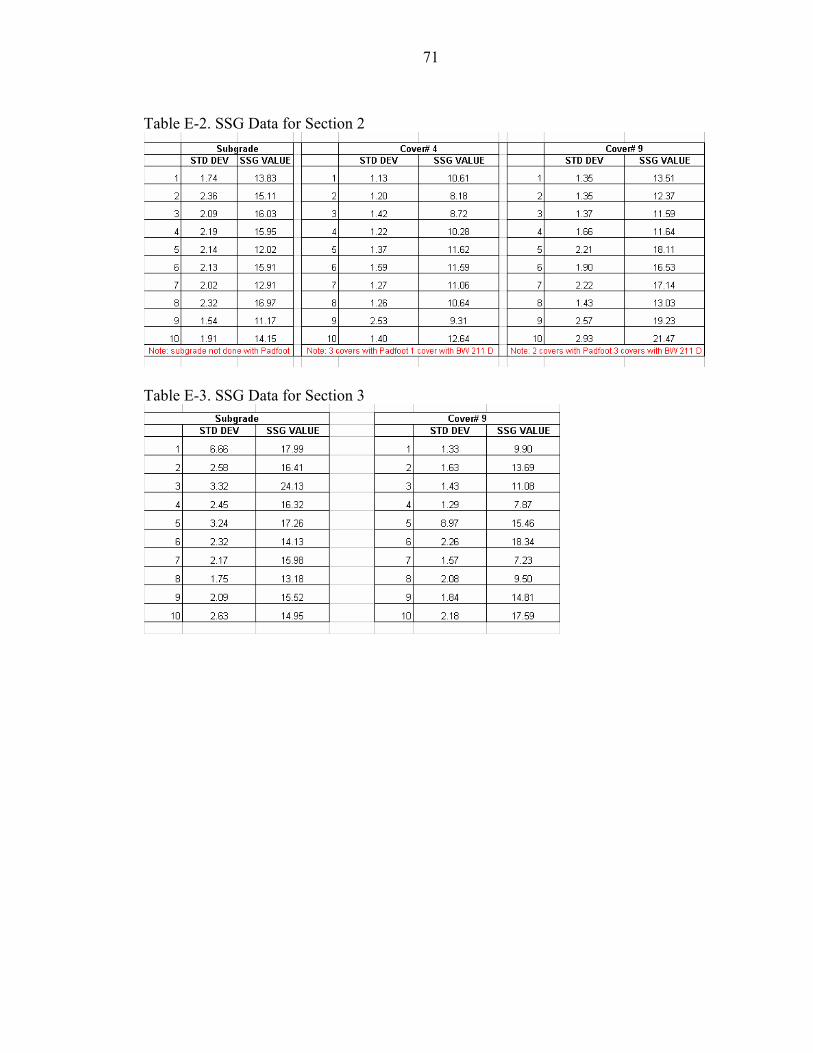
Table E-2. SSG Data for Section 2
Table E-3. SSG Data for Section 3

APPENDIX F RESULTS OF FWD
73
Figure F-1. D0 Impulse Stiffness Modulus for Section 1
0
100
200
300
400
500
600
1.01 1.02 1.03 1.04 1.05 1.06 1.07 1.08 1.09 1.10
Stations
D0
ISM
, kip
s/in
ch1st 6" Lift 2nd 6" Lift Subgrade
74
Figure F-2. D0 Impulse Stiffness Modulus for Section 2
0
100
200
300
400
500
600
700
800
900
1.01 1.02 1.03 1.04 1.05 1.06 1.07 1.08 1.09 1.10
Stations
D0
ISM
, kip
s/in
ch
12 " Lift Subgrade
75
Figure F-3. D0 Impulse Stiffness Modulus for Section 3
0
200
400
600
800
1000
1200
1.01 1.02 1.03 1.04 1.05 1.06 1.07 1.08 1.09 1.10
Stations
D0
ISM
, kip
s/in
ch
12 " Lift Subgrade

APPENDIX G RESULTS OF ADCP
77
Table G-1. Slope Summary
78
Table G-2. DCPI Summary
79
Figure G-1. Depth vs. Number of Blows for Section 1
0
5
10
15
20
250 20 40 60 80 100 120 140 160 180
Number of Blows
Dep
th (
inch
es)
Location 1
Location 2
Location 3
Location 4
Location 5
Location 6
Location 7
Location 8
Location 9
Location 10
80
Figure G-2. Depth vs. Number of Blows for Section 2
0
5
10
15
20
250 20 40 60 80 100 120 140 160 180 200
Number of Blows
Dep
th (
inch
es)
Location 1
Location 2
Location 3
Location 4
Location 5
Location 6
Location 7
Location 8
Location 9
Location 10
81
Figure G-3. Depth vs. Number of Blows for Section 3
0
5
10
15
20
250 50 100 150 200 250 300 350 400
Number of Blows
Dep
th (
inch
es)
Location 1
Location 2
Location 3
Location 4
Location 5
Location 6
Location 7
Location 8
Locaation 9
Location 10
82
LIST OF REFERENCES
Forssblad, L., 1965, “Investigations of Soil Compaction by Vibration” Acta Polytechnica Scandinavia, No. Ci-34, Stockholm.
Forssblad, L.,1977, “Vibratory Compaction in the Construction of Roads, Airfields, Dams, and Other Projects,” Research Report No. 8222, Dynapac, S-171, No. 22, Solna.
Parsons, A.W., Krawczyk, J. and Cross, J.E., Mar.1962, “An Investigation of the performance of an 8.5 ton Vibrating Roller for the Compaction of Soil” Road Research Laboratory Note. LN/64/ AWP.JK.JEC.
Seed, H.B., and Chan, C.K., 1959, “Structure and Strength Characteristics of Compacted Clays”, Journal of the Soil Mechanics and Foundations Division, American Society of Civil Engineers, Vol.85, No. SM5, pp.87~128.
Townsend, F.C. & Anderson, B., 2004, “A Compendium of Ground Modification Techniques,” Research Report BC-354, pp. 16~60. Florida Department of Transportation (FDOT).
Turnbull, W.J., and Foster, C.R., 1956, “Stabilization of Materials by Compaction”, Journal of the Soil Mechanics and Foundations Division, American Society of Civil Engineers, Vol. 82, No.SM2, pp.934-1~934-23.
Yoo, T.S., 1975, “A Theory for Vibratory Compaction of Soil”, Ph.D dissertation University of New York, Buffalo, NY.
83
BIOGRAPHICAL SKETCH
Jeongsoo Ko was born in Gwangju, South Korea. He spent his childhood in that
beautiful city where he finished primary, middle, high school, and university, except
during military service. He was accepted to study civil engineering at Chosun Univerity,
Gwangju, South Korea in 1994. He earned the degree of Engineering Bachelor in March
2002. During undergraduate school, he did 26 months of military service at the border
between South and North Korea.
He realized that his knowledge was far from enough to deal with real work problems.
So he decided to go abroad for advanced education. He was accepted by the Civil and
Coastal Engineering Department at the University of Florida and went to the U.S. in Jury
2003. He had studied and worked on thick lift compaction with Dr. McVay for 1 year.
Including this period, I spent the whole 18 months to study his background in
Geotechnical Engineering. He earned his masters’s degree in August 2005. He plans to
continue there for his Ph.D.