Embed Size (px)
Citation preview

Evaluating Multi-Query Sessions
Evangelos Kanoulas∗, Ben Carterette†, Paul D. Clough∗, Mark Sanderson‡[email protected], [email protected],
[email protected], [email protected]∗ Information School, University of Sheffield, Sheffield, UK
† Department of Computer & Information Sciences, University of Delaware, Newark, DE, USA‡ School of Computer Science & Information Technology, RMIT, Melbourne, Australia
ABSTRACTThe standard system-based evaluation paradigm has focusedon assessing the performance of retrieval systems in servingthe best results for a single query. Real users, however, oftenbegin an interaction with a search engine with a sufficientlyunder-specified query that they will need to reformulate be-fore they find what they are looking for. In this work we con-sider the problem of evaluating retrieval systems over testcollections of multi-query sessions. We propose two familiesof measures: a model-free family that makes no assumptionabout the user’s behavior over a session, and a model-basedfamily with a simple model of user interactions over the ses-sion. In both cases we generalize traditional evaluation met-rics such as average precision to multi-query session evalua-tion. We demonstrate the behavior of the proposed metricsby using the new TREC 2010 Session track collection andsimulations over the TREC-9 Query track collection.
Categories and Subject Descriptors: H.3.4 [Informa-tion Storage and Retrieval] Performance Evaluation
General Terms: Experimentation, Measurement
Keywords: information retrieval, test collections, evalua-tion, sessions
1. INTRODUCTIONEvaluation measures play a critical role in the develop-
ment of retrieval systems, both as measures in compara-tive evaluation experiments and as objective functions foroptimizing system effectiveness. The standard evaluationparadigm has focused on assessing the performance of re-trieval systems in serving the best results for a single query,for varying definitions of “best”: for ad hoc tasks, the mostrelevant results; for diversity tasks, the results that do thebest job of covering a space of information needs; for known-item tasks, the single document the user is looking for. Thereare many test collections for repeatable experiments on these
Permission to make digital or hard copies of all or part of this work forpersonal or classroom use is granted without fee provided that copies arenot made or distributed for profit or commercial advantage and that copiesbear this notice and the full citation on the first page. To copy otherwise, torepublish, to post on servers or to redistribute to lists, requires prior specificpermission and/or a fee.SIGIR’11, July 24–28, 2011, Beijing, China.Copyright 2011 ACM 978-1-4503-0757-4/11/07 ...$5.00.
tasks, and dozens of evaluation measures assessing differentaspects of task effectiveness.
Real users, however, often begin an interaction with asearch engine with a query that they will need to reformulateone or more times before they find what they are looking for.Early studies on web search query logs showed that half ofall Web users reformulated their initial query: 52% of theusers in 1997 Excite data set, 45% of the users in the 2001Excite dataset [15].
The standard evaluation paradigm of single-query test col-lections seems unable to assess the effectiveness of retrievalsystems over sequences of query reformulations. Interactiveevaluation has been employed as an alternative. In inter-active evaluation the user is part of the evaluation cycleand freely interacts with the results of a retrieval system.Measures such as instance recall [11] and session discountedcumulative gain [6] have been proposed to capture the ef-fectiveness of systems in these settings. Even though aninteractive evaluation paradigm can better capture the ac-tual user experience, it is both noisy due to the high degreesof freedom of user interactions and expensive due to its lowreusability and need for many test subjects. Furthermore,conducting interactive comparative evaluation experimentsis by no means an easy task.
The TREC 2010 Session track [7] proposed an experimentfor the evaluation of retrieval systems over multi-query ses-sions. We defined a session as a sequence of reformulationsin the service of satisfying a general information need, andconstructed a test collection of two query reformulations (aninitial and a follow-up query) for each of 150 informationneeds. This collection makes compromises for simplicity andtractability, but it provides a starting point for investigationof questions about test collection-based session evaluation.
In addition to a test collection, new evaluation measuresare necessary as well. Traditional evaluation measures onlycapture per-query effectiveness; they are not necessarily ap-propriate for evaluating the effectiveness of a retrieval sys-tem over a multi-query session. While one could evaluateresults for each query in the session in isolation, it may notbe the case that the system is serving results for each queryindependently. Doing so would lose potentially valuable in-formation about the ability of the system to provide resultsfor the session as a unit, and thus reduce our ability to op-timize system performance across sessions.
Due to the lack of appropriate measures Jarvelin et al. [6]extended the normalized discounted cumulative gain (nDCG)measure to a measure that considers multi-query sessions.The measure—called normalized session discounted cumula-

tive gain (nsDCG)—discounts documents that appear lowerin the ranked list for a given query as well as documentsthat appear after more query reformulations. In a sense thenew model incorporates a cost for reformulating a query aswell as scanning down a ranked list.
The nsDCG measure is computed as follows: for eachquery in a series of reformulations, DCG is computed inisolation of all other queries in the series. Each DCG isthen discounted by a function of the position q of the queryin the series. The measure can evaluate the effectivenessof retrieval systems over multiple queries in an interactiveretrieval scenario, in which a user moves down a rankedlist of documents and at some rank reformulates the query.Since the reformulation points are known (from observingthe users), DCG is computed at those points for each queryand at the stopping point for the last reformulation. Ina test collection of static sessions, however, reformulationpoints are unknown. Using nsDCG requires the selection ofa fixed reformulation cut-off, which clearly does not reflectthe fact that different retrieval results may trigger differentuser behavior. Further, the measure does not model earlyabandonment of a query session; our TREC session collec-tion comes with a fixed number of reformulations, but auser may choose to abandon the session before reaching thelast reformulation (either due to satisfaction or due to frus-tration). A multi-query session measure should be able tomodel such behavior.
Yang and Lad [16] overcame the need to define a fixedreformulation point by defining a session measure as an ex-pectation over a set of possible browsing paths. Based onthis they proposed a measure of expected utility for a multi-query information distillation task. Given a series of m re-formulations the proposed measure accounts for all possiblebrowsing paths that end in the kth reformulation. Eachpath has a certain probability to be realized by a user. Todefine the probability of a user following a certain path Yangand Lad [16] follow the rank biased precision (RBP) frame-work [10], replacing RBP’s stopping condition with a refor-mulation condition. The utility of each path is a function ofthe relevance and novelty of the returned documents beingconsidered. The system effectiveness is then defined as theexpected utility calculated over the aforementioned proba-bilistic space of browsing paths. Though the expected utilitysolves the problem of variable reformulation points, it stilldoes not allow early abandonment of the query session.
In this work we consider the problem of evaluating re-trieval systems over test collections of static multi-query ses-sions. We propose two families of measures: one that makesno assumptions about the user’s behavior over a session,and another with a simple model of user interactions overthe session. In the latter case we provide a general frame-work to accommodate different models of user interactionsin the course of a session, avoiding predefined reformulationcut-offs and allowing early abandonment. In both cases wegeneralize traditional evaluation measures such as averageprecision to multi-query session evaluation.
2. MULTI-QUERY SESSION COLLECTIONAND USER MODEL
We define a session test collection as one with a set of top-ics, each of which consist of a description of an informationneed and a static sequence of m title queries (an initial query
query q1,1 query q1,2 query q1,3
ranking 1 ranking 2 ranking 3d1 N d′1 R d′′1 Rd2 N d′2 R d′′2 Rd3 N d′3 R d′′3 Rd4 N d′4 R d′′4 Rd5 N d′5 R d′′5 Rd6 N d′6 N d′′6 Rd7 N d′7 N d′′7 Rd8 N d′8 N d′′8 Rd9 N d′9 N d′′9 Rd10 N d′10 N d′′10 R... ... ... ... ... ...
Table 1: Example rankings (document IDs and rel-evance judgments) for three queries q1,1, q1,2, q1,3 ina session for topic number 1. Here we assume alldocuments are unique.
and m − 1 reformulations), and judgments of the relevanceof documents to the topics. For simplicity, we assume thatall reformulations are directed towards a single informationneed, so there is a global set of relevant documents of sizeR.1 This definition is similar to those used by Jarvelin etal. [6] and Yang & Lad [16], and it is essentially the defi-nition used for the TREC 2010 Session track in the case ofspecification and generalization reformulations [7].
Following Cooper in his proposal for the expected searchlength measure [5], we assume a user stepping down theranked list of results until some decision point. To this weadd an additional possible action: the decision point can beeither a stopping point for the search, or a point at whichthe user reformulates their query. Thus, a user experiencesresults by either moving down a ranking (i.e. moving fromrank k to rank k + 1 in ranking ~ri) or to the top of thenext ranking by reformulating ( i.e. moving from rank k inranking ~ri to rank 1 in ranking ~ri+1.).
Consider the example in Table 1. A user with a certaininformation need formulates a query and submits it to a re-trieval system. The retrieval system returns a ranked listof documents, ~r1 = (d1, d2, ..., d10, ...). Suppose the user’sfirst decision point occurs at document d5. After seeingthat document, the user decides to reformulate the originalquery and resubmit it to the retrieval system. The retrievalsystem responds with a second ranked list of documents,~r2 = (d′1, d
′1, ..., d
′10, ...). The user reads the documents once
again from top to bottom and abandons the session. If weonly consider the documents the user has examined over thesession of reformulations then a final composite ranked list,~cl, can be composed: ~cl = (d1, d2, . . . , d5, d
′1, d′2, d′3, . . . ).
Given the relevance of the documents in the composite
ranked list ~cl, any traditional evaluation measure can becalculated in the usual manner. We may require assump-tions about the relevance of duplicates, e.g. if d1 and d′2 arethe same relevant document, how they should count towardsthe evaluation measure; we will consider these in Section 5.
1In practice users’ information needs may change during asearch session and over time [1]; assuming it is fixed is amodeling assumption we make for tractability. Some of ourmeasures require this assumption, but it can be relaxed forother measures.
2.1 Evaluation over pathsThe composite list ~cl is the outcome of a series of decisions.
We define a path ω through the results as a series of decisionsto either move down a ranking, reformulate and start atthe top of the next ranking, or abandon the search. Weassume that at least one document—the first one—is viewedin each ranking. A path of length k is a path that resultsin k documents viewed. We denote the set of unique pathsof length k as Ωk, and the set of all unique paths as Ω.A path can be represented as a series of actions, e.g. ω =down, down, ..., reformulate, down, ..., abandon; as a series
of document IDs viewed, e.g. ω = ~cl above; or as a seriesof ranks at which reformulations or abandonment occurred,e.g. ω = 5, .... The three are equivalent in the sense ofproviding complete information about the series of decisions;the last, being most compact, is the one we will use.
Different paths result in different documents being seen,and in many cases different numbers of relevant documents.Precision after k documents viewed may result in very differ-ent values depending on the path chosen: a user that views10 documents in ~r1 (the relevance of which is shown in Ta-ble 1), experiences 0 precision, while one that reformulatesimmediately after the first document in ~r1 and steps down ~r2
until rank 9 experiences precision of 5/10. In an interactiveevaluation scenario where real users interact with the rankedlist of documents returned by a retrieval system, the pointat which a user decides either to reformulate their previousquery or to abandon the search can be explicitly recordedby observation, or implicitly inferred by looking at (for in-stance) the last clicked document. In batch laboratory ex-periments with static sessions, however, the reformulationand stopping points are undefined—there is no user fromwhich to record them. This presents a challenge for definingevaluation measures.
In this work we propose evaluating static sessions by sum-marizing evaluation results over all paths through the re-sults. We will consider two directions: one a “model-free”approach inspired by interpolated precision and recall, theother a model-based approach that explicitly defines prob-abilities for certain actions, then averages over paths. Inboth approaches we would like to make as few assumptionsas possible about the reasons a user reformulates.
2.2 Counting pathsThe number of possible paths grows fairly fast. Consider
a path of length k ending in reformulation number j. Forexample, the paths of length 4 ending at reformulation 2 ared1, d2, d3, d
′1, d1, d2, d
′1, d′2, and d1, d
′1, d′2, d′3. For any
given k and j, we can count the number of possible pathsas follows: imagine a ranking as a list of k documents, thenplace j−1 reformulation points between any two documentsin that list. The number of different places we can insertthem is
`k−1j−1
´, and this is therefore the number of paths of
length k that end at reformulation j.The total number of paths of length k is:
|Ωk| =mX
j=1
k − 1
j − 1
!
This is the definition of elements in the Bernoulli triangle.Its rate of growth is unknown, but it is O(k2) for m = 2 andapproaches 2k−1 as m increases to k. The total number ofpaths of any length is |Ω| =
Pnk=1 |Ωk| = O(2n).
j = 1 j = 2 j = 3 · · ·k = 1 0 – –k = 2 0 1 –k = 3 0 1, 2 2k = 4 0 1, 2, 3 2, 3, 3k = 5 0 1, 2, 3, 4 2, 3, 3, 4, 4, 4· · ·
Table 2: Relevant document counts for differentpaths of length k ending at ranking j from the ex-ample in Table 1.
On the other hand, if we only consider paths that end atreformulation j but continue down ranked list ~rj indefinitely,the number is more manageable. We can enumerate theseby simply iterating over stopping points k1 = 1...|~r1|, andfor each of those over stopping points k2 = 1...|~r2|, and soon. Within the (j− 1)st loop, ω = k1, ..., kk−1 is the pathto that point. This takes |~r1| × |~r2| × · · · × |~rm−1| = O(nm)time, which, while not exactly fast, is at least manageable.
3. MODEL-FREE SESSION EVALUATIONOur first goal is to develop a method for evaluating the
effectiveness of a system over a set of reformulations mak-ing no assumptions about when or why users reformulate.The approach is inspired by interpolated precision: there isno formal user model behind interpolated precision, but itreduces the full evaluation data (precision at every rank) toa manageable set while still providing useful intuition aboutsystem performance, particularly when plotted against re-call values. Likewise, there is no formal user model behindthese measures, but they give some intuition while greatlyreducing the amount of evaluation data, which as we sawabove grows exponentially.
Consider all paths of length k that end at reformulationj. On each of those paths the user will see a certain numberof relevant documents. Let us define a set of relevant countsrR@j, k as the set of counts of relevant documents seen onall such paths.2 In the example in Table 1, there is only onepossible way for a user to see 4 documents without reformu-lating, and none of those documents are relevant; thereforerR@1, 4 = 0. There are three ways for a user to see 4documents over two queries: d1, d2, d3, d
′1; d1, d2, d
′1, d′2;
d1, d′1, d′2, d′3. These paths have 1, 2, and 3 relevant docu-
ments respectively. Therefore rR@2, 4 = 1, 2, 3. All setsrR for j = 1..3 and k = 1..5 are shown in Table 2; the sizeof a set is
`k−1j−1
´as described above.
We can then define session versions of precision and recallby dividing the relevant counts rR@j, k by k (for precision)or R (for recall). We will call these rPC@j, k and rRC@j, k.This gives the session generalization to precision and recall:precision and recall for each possible path through the re-sults. In traditional systems-based evaluation there is onlyone possible path of length k, and precision/recall for thatpath is identical to precision/recall at rank k.
Precision is sometimes interpolated to a particular recallpoint r by finding the first rank at which recall r is achieved,then taking the maximum of all precisions at that rank ordeeper. Let us consider an analogous process for sessions bydefining precision at a particular recall point in a particular
2We use boldface to denote sets and italics to denote scalars.
recall
reformulation
precision
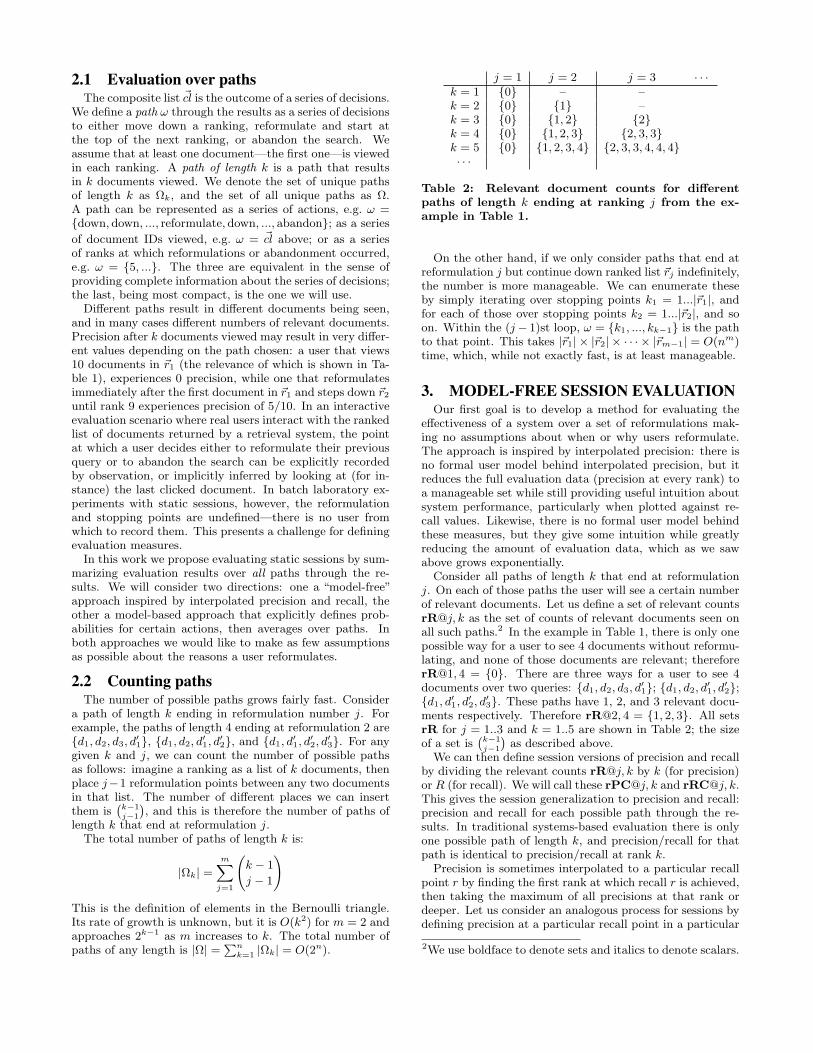
Figure 1: Reformulation precision-recall surface forthe example in Table 1.
0.0 0.2 0.4 0.6 0.8 1.0
0.0
0.2
0.4
0.6
0.8
1.0
ranking 1
recall
prec
isio
n
0.0 0.2 0.4 0.6 0.8 1.0
0.0
0.2
0.4
0.6
0.8
1.0
ranking 2
recall
prec
isio
n
0.0 0.2 0.4 0.6 0.8 1.0
0.0
0.2
0.4
0.6
0.8
1.0
ranking 3
recall
prec
isio
n
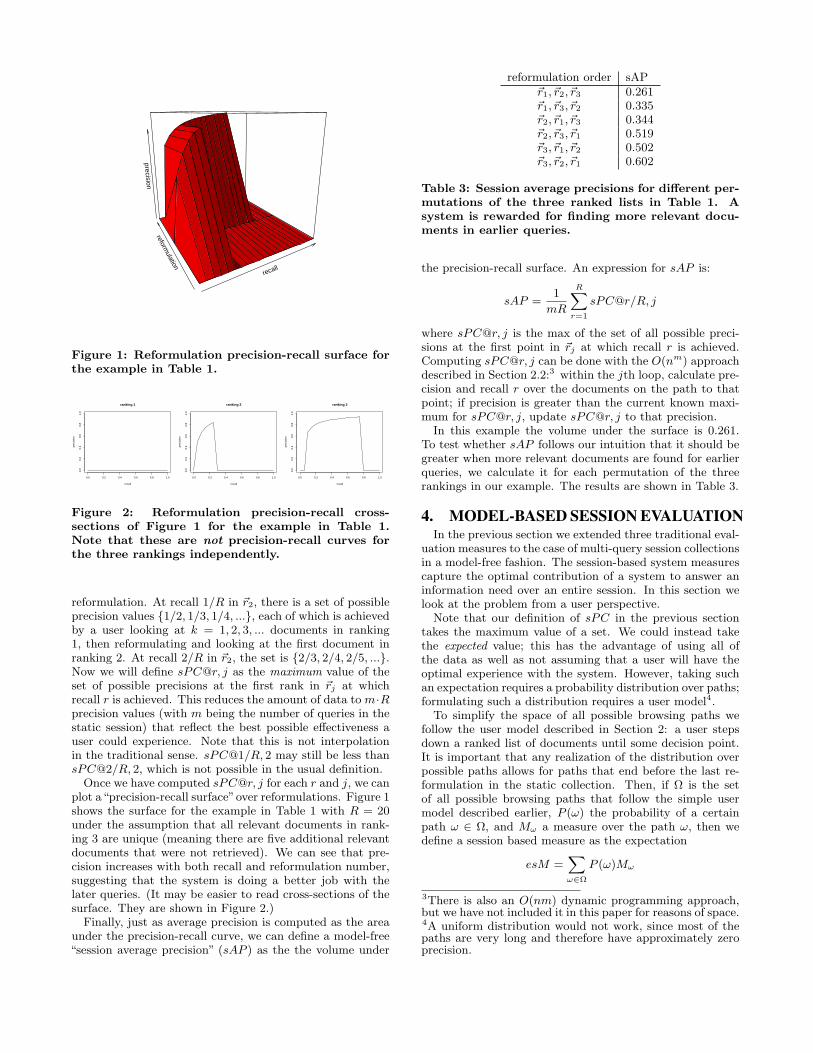
Figure 2: Reformulation precision-recall cross-sections of Figure 1 for the example in Table 1.Note that these are not precision-recall curves forthe three rankings independently.
reformulation. At recall 1/R in ~r2, there is a set of possibleprecision values 1/2, 1/3, 1/4, ..., each of which is achievedby a user looking at k = 1, 2, 3, ... documents in ranking1, then reformulating and looking at the first document inranking 2. At recall 2/R in ~r2, the set is 2/3, 2/4, 2/5, ....Now we will define sPC@r, j as the maximum value of theset of possible precisions at the first rank in ~rj at whichrecall r is achieved. This reduces the amount of data to m·Rprecision values (with m being the number of queries in thestatic session) that reflect the best possible effectiveness auser could experience. Note that this is not interpolationin the traditional sense. sPC@1/R, 2 may still be less thansPC@2/R, 2, which is not possible in the usual definition.
Once we have computed sPC@r, j for each r and j, we canplot a“precision-recall surface”over reformulations. Figure 1shows the surface for the example in Table 1 with R = 20under the assumption that all relevant documents in rank-ing 3 are unique (meaning there are five additional relevantdocuments that were not retrieved). We can see that pre-cision increases with both recall and reformulation number,suggesting that the system is doing a better job with thelater queries. (It may be easier to read cross-sections of thesurface. They are shown in Figure 2.)
Finally, just as average precision is computed as the areaunder the precision-recall curve, we can define a model-free“session average precision” (sAP ) as the the volume under
reformulation order sAP~r1, ~r2, ~r3 0.261~r1, ~r3, ~r2 0.335~r2, ~r1, ~r3 0.344~r2, ~r3, ~r1 0.519~r3, ~r1, ~r2 0.502~r3, ~r2, ~r1 0.602
Table 3: Session average precisions for different per-mutations of the three ranked lists in Table 1. Asystem is rewarded for finding more relevant docu-ments in earlier queries.
the precision-recall surface. An expression for sAP is:
sAP =1
mR
RXr=1
sPC@r/R, j
where sPC@r, j is the max of the set of all possible preci-sions at the first point in ~rj at which recall r is achieved.Computing sPC@r, j can be done with the O(nm) approachdescribed in Section 2.2:3 within the jth loop, calculate pre-cision and recall r over the documents on the path to thatpoint; if precision is greater than the current known maxi-mum for sPC@r, j, update sPC@r, j to that precision.
In this example the volume under the surface is 0.261.To test whether sAP follows our intuition that it should begreater when more relevant documents are found for earlierqueries, we calculate it for each permutation of the threerankings in our example. The results are shown in Table 3.
4. MODEL-BASED SESSION EVALUATIONIn the previous section we extended three traditional eval-
uation measures to the case of multi-query session collectionsin a model-free fashion. The session-based system measurescapture the optimal contribution of a system to answer aninformation need over an entire session. In this section welook at the problem from a user perspective.
Note that our definition of sPC in the previous sectiontakes the maximum value of a set. We could instead takethe expected value; this has the advantage of using all ofthe data as well as not assuming that a user will have theoptimal experience with the system. However, taking suchan expectation requires a probability distribution over paths;formulating such a distribution requires a user model4.
To simplify the space of all possible browsing paths wefollow the user model described in Section 2: a user stepsdown a ranked list of documents until some decision point.It is important that any realization of the distribution overpossible paths allows for paths that end before the last re-formulation in the static collection. Then, if Ω is the setof all possible browsing paths that follow the simple usermodel described earlier, P (ω) the probability of a certainpath ω ∈ Ω, and Mω a measure over the path ω, then wedefine a session based measure as the expectation
esM =Xω∈Ω
P (ω)Mω
3There is also an O(nm) dynamic programming approach,but we have not included it in this paper for reasons of space.4A uniform distribution would not work, since most of thepaths are very long and therefore have approximately zeroprecision.

4.1 Probability of browsing pathsAs noted in Section 2, we can express a path ω as a set
of reformulation points.Let us therefore formulate P (ω =k1, k2, ..., ki) as a joint probability distribution of a userabandoning the session at reformulation i, while reformu-
lating at positions−→ref = k1, k2, ..., ki−1. Note that we do
not include ki, the abandonment cut-off at ranking i, in theprobability. For the sake of generalizing traditional mea-sures, we will assume that once the user arrives at the ithreformulation, they continue down that ranking as far asnecessary to compute the measure.
We express the probability of a path ω as,
P (ω) = P (ri,−→ref) = P (ri) · P (
−→ref|ri)
Here we introduce a simplifying assumption: the reformu-lation position is independent across the ranked lists 1..ri.
Then P (−→ref|ri) can be expressed as,
P (−→ref|ri) = P (k1|ri)P (k2|ri) · · ·P (ki−1|ri)
In general, we could make each reformulation point depen-dent on the reformulation number and possibly even on therelevance of documents in the ranking; in this work we haveelected to keep them independent for simplicity.
For the realization of the probability distribution over dif-ferent browsing paths we follow Moffat and Zobel [10] intheir definition of ranked biased precision and use two geo-metric distributions. The first gives the probability that theith reformulation is the last; it has an adjustable parameterpreform representing the probability that the user reformu-lates again from their current query. They will only arriveat reformulation i if they reformulate i− 1 times, so:
P (ri) = pi−1reform(1− preform)
Similarly, the second distribution gives the probability thatthe kth rank is a stopping or reformulation point with ad-justable parameter pdown. A user will arrive at rank k onlyafter deciding to progress down k − 1 times, so:
P (k) = pk−1down(1− pdown)
The probability of a path is then
P (ri,−→ref) = pi−1
reform(1− preform)
i−1Yj=1
pkj−1
down(1− pdown)
= P (ri)
i−1Yj=1
P (kj)
Our definition of P (ri) may give non-zero probability toa path that is not valid for a particular collection of staticsessions, e.g. one that ends at some point past the last (mth)reformulation in the collection. To address this, we will trun-cate the distribution P (ri) and renormalize it to ensure thatthe probabilities to stop at different reformulations sum to1. To do this we simply renormalize the probabilities from1 to m by Prr ≤ ri = 1− pm
reform. That is,
P ′(ri) =pi−1
reform(1− preform)
1− pmreform
We could similarly truncate and renormalize P (kj). How-ever, paths that extend beyond the last retrieved documentfor a reformulation (typically ranks beyond 1000) will have
very low probability and thus they will not contribute in anysignificant way in the calculation of a measure.
4.2 Expectations over pathsGiven a measure Mω to be computed over the documents
viewed on a particular path ω along with the probability dis-tribution over all paths ω ∈ Ω, we can define a session mea-sure as the expectation of Mω over the probabilistic spaceof paths.
esM = EΩ[M ] =Xω∈Ω
P (ω)Mω
Let us consider a path-averaging generalization to preci-sion at cut-off k. First define PC@k(ω) as the precision ofthe first k documents experienced on path ω. Then:
esPC@k =Xω∈Ω
P (ω)PC@k(ω)
=Xω∈Ω
PC@k(ω)P ′(ri)
i−1Yj=1
P (kj)
PC@k(ω) is the total proportion of relevant documents atranks 1..k1 in ~r1, 1..k2 in ~r2, and so on.
PC@k(ω) =1
k
k1X
j=1
rel1j +
k2Xj=1
rel2j + · · ·+kiX
j=1
relij
!where ki, the abandonment cut-off at ranking i, is equal tok− (k1 + k2 + · · ·+ ki−1). Plugging that into the expressionfor E[PC@k] completes the formula.
Similarly, the expectations of recall after k documents canbe computed as
esRC@k =1
R
Xω∈Ω
RC@k(ω)P ′(ri)
i−1Yj=1
P (kj)
where
RC@k(ω) =1
R
k1X
j=1
rel1j + · · ·+kiX
j=1
relij
!and ki is defined as above.
A path-averaging generalization to average precision is:
esAP =Xω∈Ω
AP (ω)P ′(ri)
i−1Yj=1
P (kj)
where AP (ω) is the average precision of the concatenatedlist of documents on path ω.
We can continue to define any measure this way. We willconclude with a path-averaging generalization to nDCG:
esnDCG@k =Xω∈Ω
nDCG@k(ω)P ′(ri)
i−1Yj=1
P (kj)
where nDCG@k(ω) is the nDCG@k of the concatenated list.All of the above formulations involve summing over paths
ω. In general, summing a function f(ω) over all paths canbe expressed in a brute-force way as:
Xω∈Ω
f(ω) =
|r1|Xk1=1
|r2|Xk2=1
· · ·|ri−1|X
ki−1=1
f(k1, k2, ..., ki−1)
Note that computing it involves on the order of |r1| × |r2| ×· · · × |rm−1| = O(nm) steps.

4.3 Monte Carlo estimationA running time of O(nm) is manageable, but it is not
fast, especially as m grows. Since our model for these mea-sures is fully probabilistic, a faster alternative approach toestimating them uses simulation. A Monte Carlo simulationmethod allows the estimation of a measure via repeated ran-dom sampling. Running a Monte Carlo experiment requiresdefining a domain of possible inputs, generating inputs ran-domly from the domain using specific probability distribu-tions, performing a deterministic computation using the in-puts, and finally aggregating the results of the individualcomputations into the final result.
In the case of the user-model based measures proposedabove, the input space is the ranking ri at which the userabandons the query and the reformulation cut-offs at allprevious queries k1, ..., ki−1.
Each of the above path-averaging measures can be thoughtas the expected outcome of the following random experi-ment:
1. Sample the last reformulation ri from P ′(rj).
2. Sample (k1, k2, ..., ki−1) i.i.d. from P (kj) to form apath ω.
3. Create a ranked list of documents by concatenatingranks 1...k1 from r1, 1...k2 from r2, ..., 1...ki−1 fromri−1, and 1...n from ri. These are the documents seenalong path ω.
4. Output measure M over that ranked list.
This random experiment defines one round of the MonteCarlo experiment. Executing the first two steps requiressampling from a geometric distribution. This can be easilyperformed assuming access to an algorithm that generatespseudo-random numbers uniformly distributed in the inter-val (0, 1). Regarding the distribution of the last reformula-tion, since it is renormalized, we can first partition the inter-val (0, 1) to ((0..P ′(r1)), (P ′(r1)..P ′(r1) + P ′(r2)), · · · , (1 −P ′(rm)..1)). We then use the random number generator toobtain a number in (0, 1), and output j if this number is inthe j-th partition. In the case of the cut-off distribution thesame process can be followed. As mentioned earlier we didnot renormalize this distribution and thus the last partitiondoes not end in 1, however renormalization can be easily per-formed in the case of Monte Carlo by simply rejecting anysample larger than the upper bound of the last partition.
Repeating the process above B times and averaging theresults gives an estimate of the expectation of measure M .For most purposes B = 1000 (which will usually be muchless than nm) should be sufficient; we explore the errors inestimates due to B in Section 6.
5. DUPLICATE DOCUMENTSOur measures to this point make a strong assumption:
that retrieval systems return unique documents for eachquery reformulation. Under this assumption, the concate-
nated ranked list of documents ~cl which corresponds to acertain browsing path ω resembles a typical ranked list ofdocument in the standard evaluation paradigm. We cer-tainly do not expect this assumption to hold in real systems;it is likely that documents retrieved for a second query willoverlap with those retrieved for the first. When relaxing this
assumption,we need to consider how these duplicate docu-ments should be treated from the perspective of the evalua-tion measure.
The first question raised is whether documents repeated inranked lists for subsequent reformulations have any value fora user. Jarvelin et al. [6] noticed that in an empirical inter-active search study conducted by Price et al. [12] searchersoverlooked documents in early queries but recognized themin later reformulations. Due to this, the proposed sDCGmeasure does not give any special treatment to duplicaterelevant documents; it considers them relevant regardless ofthe number of times they have been seen before.
But measures with a recall component (such as averageprecision or recall at k) cannot count duplicates in a soundway. Since there are multiple possible paths through theresults, and these paths could have duplicate relevant doc-uments, it is possible that more than R relevant documentscould be observed along any given path. The computedmeasure may exceed the desired maximum value of 1.
We can instead consider duplicate documents nonrelevantin all cases. This has certain implications as well. For one,penalizing a retrieval system for returning duplicate doc-uments may lead to systems that are less transparent totheir users. Imagine a user that reformulates a query andexpects to see previously observed relevant documents athigher ranks than before. If they are not there, the user mayquestion whether the system can ever be useful to them.
Furthermore, by definition the expected measures rewarda retrieval system that respond in an optimal way to a pop-ulation of users. These different users may very well followdifferent browsing paths. In an actual retrieval setup, a sys-tem can infer whether a document has been observed by auser (e.g. by observing the users’ clicks). In the case of abatch experiment, however, a certain document may be aduplicate for one user but not for another, depending on thebrowsing path each one of them has followed. This informa-tion is hidden in the parameters of the particular evaluationmeasure (which simulates the population of users). Tak-ing these parameters into account a system could respondoptimally by removing the expected duplicate documents.However, the need of such an inference process and a rank-ing function that accounts for the average browsing pathis just an artifact of the batch nature of experiments. Aretrieval system running in the real world will not need toemploy such an algorithm.
Yang and Lad [16] take an approach in between the two ex-tremes. Although they did not explicitly consider the prob-lem of exact duplicates, the proposed measure is a measureof information novelty over multi-query sessions and thus ittakes the typical approach other novelty measures take [4]by defining information nuggets and discounting documents5
that contain the same relevant information nugget.In this work we consider an alternative treatment of du-
plicates inspired by Sakai’s compressed ranked lists [14] andYilmaz & Aslam’s inducedAP [17]. When considering a pathω out of the population of all paths, we construct the con-
catenated list ~cl that corresponds to this path. We thenwalk down the concatenated list and simply remove dupli-cate documents, effectively pushing subsequent documents
5The measure by Yang and Lad [16] was proposed for thetask of information distillation and thus it operates overpassages instead of documents; the same approach howevercould be used for the case of documents.

one rank up. This way, we neither penalize systems for re-peating information possibly useful to the user, nor do wepush unnecessary complexity to the retrieval system side.Further, the measures still reward the retrieval of new rele-vant documents. Note here that such an approach assumesthat a system ranks documents independent of each otherin a ranked list (probabilistic ranking principle [13]). If thisis not true, i.e. if ranking a document depends on previ-ously ranked documents and the retrieval system is agnosticto our removal policy then this may also lead to unsoundevaluation.
6. EXPERIMENTSIn this section we demonstrate the behavior of the pro-
posed measures. There is currently no “gold standard” forsession evaluation measures; our goal in this section is toevaluate whether our measures provide information aboutsystem effectiveness over a session and whether they cap-ture different attributes of performance in a similar way totraditional precision, recall, and average precision. We willcompare our measures to the session nDCG measure pro-posed by Jarvelin et al., though we consider none of these,nor any other measure, to be the one true session measure.
We use two collections towards these goals: (a) the TREC2010 Session track collection [7], and (b) the TREC-8 (1999)Query track collection [2]. Though the latter is not a collec-tion of multi-query sessions, we will find it useful to exploreproperties of our measures. Both of these collections aredescribed in more detail below.
The instantiation of session nDCG@k we use is calculatedas follows: we start by concatenating the top k results fromeach ranked list of results in the session. For each rank i inthe concatenated list, we compute the discounted gain as
DG@i =2rel(i)−1
logb(i+ (b− 1))
where b is a log base typically chosen to be 2. These are thesummands of DCG as implemented by Burges et al. [3] andused by many others. We then apply an additional discountto documents retrieved for later reformulations. For rank ibetween 1 and k, there is no discount. For rank i betweenk+ 1 and 2k, the discount is 1/ logbq(2 + (bq− 1)), where bqis the log base. In general, if the document at rank i camefrom the jth reformulation, then
sDG@i =1
logbq(j + (bq − 1))DG@i
Session DCG is then the sum over sDG@i
sDCG@k =
mkXi=1
2rel(i)−1
logbq(j + (bq − 1)) logb(i+ (b− 1))
with j = b(i − 1)/kc, and m the length of the session. Weuse bq = 4. This implementation resolves a problem presentin the original definition by Jarvelin et al. [6] by which docu-ments in top positions of an earlier ranked list are penalizedmore than documents in later ranked lists.
As with the standard definition of DCG, we can also com-pute an “ideal” score based on an optimal ranking of docu-ments in decreasing order of relevance to the query and thennormalize sDCG by that ideal score to obtain nsDCG@k.
nsDCG@k essentially assumes a specific browsing path:ranks 1 through k in each subsequent ranked list, thereby
giving a path of length mk. Therefore, we set the cut-offsof our expected session measures to mk (with the excep-tion of AP). For the computation of the expected sessionmeasures the parameter pdown is set to 0.8 following therecommendation by Zhang et al. [18]; in expectation, usersstop at rank 5. The parameter preform is set arbitrarily to0.5. With m = 2 reformulations, the probability of a userstopping at the first reformulation is then 67% and mov-ing to the next reformulation 33%, which is not far off thepercentage of users reformulating their initial queries in theExcite logs [15].
6.1 Session track collectionThe Session track collection consists of a set of 150 two-
query sessions (initial query followed by one reformulation).Out of the 150 sessions, 136 were judged. The judged 136topics include 47 for which the reformulation involves greaterspecification of the information need, 42 for which the re-formulation involves more generalization, and 47 for whichthe information need “drifts” slightly. In the case of spec-ification and generalization, both the initial query and itsreformulation represent the same information need, while inthe case of drifting the two queries in the session representtwo different (but related) information needs. Given thatsome of the proposed session measures make the assump-tion of a single information need per session—these are therecall-based measures such as AP and recall at cutoff k—wedrop the 47 drifting sessions from our experiments.
Each participating group submitted runs consisting of threeranked lists of documents:
RL1 ranked results for the initial query;
RL2 ranked results for the query reformulation indepen-dently of the initial query;
RL3 ranked results for the query reformulation when theinitial query was taken into consideration.
Thus, each submission consists of two pairs of runs overthe two-query session: RL1→RL2, and RL1→RL3. Thedocument corpus was the ClueWeb09 collection. Judgingwas based on a shallow depth-10 pool from all submittedranked lists. Kanoulas et al. detail the collection further [7].
Figure 3 shows example precision-recall surfaces for twosubmissions, CengageS10R3 [9] and RMITBase [8]. In bothcases there is a moderate improvement in performance fromthe first query to the second. The decrease in precision israpid in both, but slightly less so in RMITBase. As a result,though CengageS10R3 starts out with higher precisions atlower recalls, the model-free mean sAP s are close: 0.240and 0.225 respectively. In general, these surfaces, like tradi-tional precision-recall curves, provide a good sense of relativeeffectiveness differences between systems and where in theranking they occur.
We use the submitted RL1 and RL2 runs (27 submissionsin total) to compare the proposed model-based measureswith normalized session DCG. nsDCG is computed at cut-off 10. We compute all measures in Section 2 with cut-off2 · 10 = 20 (to ensure the same number of documents areused). Scatter plots of nsDCG@10 versus expected sessionnDCG@20 (esnDCG), PC@20 (esPC), RC@20 (esRC), andAP (esAP) are shown in Figure 4. Each point in the plotcorresponds to a participant’s RL1→RL2 submission; mea-sures are averaged over 89 topics. The strongest correlation

recall
0.00.2
0.40.6
0.8
1.0
refo
rmul
atio
n
1.0
1.2
1.4
1.6
1.8
2.0
precision
0.0
0.2
0.4
0.6
0.8
1.0
recall
0.00.2
0.40.6
0.8
1.0
refo
rmul
atio
n
1.0
1.2
1.4
1.6
1.8
2.0
precision
0.0
0.2
0.4
0.6
0.8
1.0
Figure 3: Precision-recall surfaces for CengageS10R3 and RMITBase.
0.10 0.15 0.20
0.10
0.15
0.20
nsDCG vs. esNDCG
nsDCG
esNDCG
Kendall''s tau : 0.7972
0.10 0.15 0.20
0.10
0.15
0.20
0.25
nsDCG vs. esPC
nsDCG
esPC
Kendall''s tau : 0.7334
0.10 0.15 0.20
0.04
0.06
0.08
0.10
nsDCG vs. esRC
nsDCG
esRC
Kendall''s tau : 0.6987
0.10 0.15 0.20
0.04
0.06
0.08
nsDCG vs. esAP
nsDCG
esAP
Kendall''s tau : 0.5247
Figure 4: Scatter plots of the mean performance of systems in the Session track for the session RL1→RL2.The x-axis is sNDCG@10; the y-axis is expected session nDCG@20 (esnDCG), PC20 (esPC), RC@20 (esRC),and AP (esAP) for the four plots from left to right and top to bottom.
is between esnDCG and snDCG (as expected). Interestingly,esAP strongly disagrees with snDCG; this demonstrates thatesAP measures different aspects of system effectiveness oversessions than snDCG. Table 4 shows τ correlations betweenall the expected measures as well as the model-free sAP;overall the correlations are within the range expected for
these measures with a relatively small number of input sys-tems. They are high relative to random orderings, but lowenough that it is clear that all the measures are capturingdifferent aspects of effectiveness. esAP and sAP do not cor-relate very well, but recall that sAP is based on maximumswhile esAP is based on averages.

Kendall’s tau correlationesRC esAP esnDCG sAP
esPC 0.88 0.79 0.93 0.78esRC 0.80 0.84 0.87esAP 0.72 0.78
esnDCG 0.74
Table 4: Kendall’s tau correlation across the fourexpected session measures and sAP.
6.2 Query track collectionThe Query track [2] was an effort to understand the system-
query-topic interaction often observed in IR experiments,where certain systems perform well for certain queries butunder-perform for others. A set of 50 topics (topics 51-100from the TREC-1 collection) was provided to participants;they responded with a set of queries for each topic. The con-structed queries were in one of the following forms, (a) veryshort: 2-4 words based on the topic and few relevance judg-ments; (b) sentences: 1-2 sentences using the topic and fewrelevant documents; (c) sentences+feedback: 1-2 sentencesusing only the relevant documents; and (d) weighted terms.Overall 23 query sets were produced, each consisting of 50queries corresponding to the 50 topics of TREC-1. Partici-pants ran their retrieval systems over each of the query setsand submitted results for each system for each query set.We use subsets of the 23 query sets and the submitted runsto simulate query sessions.
The goal of our first experiment is to empirically verifythat the proposed measures reward early retrieval of relevantdocuments in the session. In this experiment we simulatefour sets of session retrieval algorithms over 50 two-querysessions. The first simulated algorithm (“good”–“good”) per-forms well on both the initial query and its reformulationin a hypothetical query session; the second (“good”–“bad”)performs well on the initial query but not on its reformu-lation, the third (“bad”–“good”) does not perform well onthe initial query but does on its reformulation, and the last(“bad”–“bad”) does not perform well on either queries.
To simulate these algorithms, we note that the systemsparticipating in the Query track performed particularly wellon short queries (with an average MAP of 0.227), while theydid not perform well on the sentence-feedback queries (av-erage MAP of 0.146) [2]. Taking this into consideration wesimulate the best algorithm using runs over two short formu-lations of the same query. In particular, the nine runs overthe query set named INQ1a with simulated reformulationresults from the nine runs over query set INQ1b (with aver-age MAP equal to 0.110 and 0.127 respectively, as computedby trec_eval) simulated a set of systems performing wellboth over the initial query of a hypothetical session and itsreformulation. We simulate the worst system by runs overtwo sentence-feedback formulations. In particular the runsover query set INQ3a with reformulations being the runsover query set INQ3b (with average MAP 0.078 and 0.072respectively) simulated a set of systems that performed wellneither over the initial nor over the reformulated query. Theother two combinations—INQ1a to INQ3b and INQ3a toINQ1b—simulated medium performance systems.6
What we expect to observe in this simulation is that ses-
6The query sets INQ1a, INQ1b, INQ3a, INQ3b were man-ually constructed by students at UMass Amherst [2].
Average mean session measuresesMPC@20 esMRC@20 esMAP
“good”–“good” 0.378 0.036 0.122“good”–“bad” 0.363 0.034 0.112“bad”–“good” 0.271 0.023 0.083“bad”–“bad” 0.254 0.022 0.073
Table 5: esPC@20, esRC@20, and esAP, each aver-aged over nine Query track systems simulating foursession retrieval systems.
sion measures reward the “good”–“good” simulated systemsthe most, followed by the “good”–“bad”, the “bad”–“good”and finally the “bad”–“bad” systems. Table 5 shows the av-erage mean session scores produced by three of the expectedsession measures over the four simulated sets of retrieval al-gorithms. The results verify the behavior of the proposedmeasures. This is the exact same behavior we observed forthe sAP measure in Table 3.
We conclude by testing the accuracy of the Monte Carlomethod in computing the expected session measures. Wesimulated a two-query session by randomly selecting twosets of query formulations and their corresponding runs andforming a session from those. We run our O(nm) exact al-gorithm along with the Monte Carlo method. For the latterwe use B = 10, B = 100 and B = 1000 trials. The resultsare illustrated in the left-hand plot in Figure 5, showing thehigh accuracy of the Monte Carlo simulation even with asfew as 10 repetitions. Obviously, the accuracy of the methoddepends on the length of the session together with the setparameters pdown and preform. We did not test for differentparameters, however we did repeat the same process over 3-query sessions. The results are illustrated at the right-handside plot in Figure 5. There is somewhat more variance buteven with B = 10 the results are very accurate.
7. CONCLUSIONSIn this work we considered the problem of evaluating re-
trieval systems over static query sessions. In our effort tomake as few assumptions about user behavior over a ses-sion as possible, we proposed two families of measures: amodel-free family inspired by interpolated precision, and amodel-based family with a simple model of user interactiondescribed by paths through ranked results. With a novel ses-sion test collection and a session collection simulated fromexisting data, we showed that the measure behaviors cor-respond to our intuitions about their traditional counter-parts as well as our intuitions about systems that are ableto find more relevant documents for queries earlier in thesession. The measures capture different aspects of systemperformance, and also capture different aspects than whatis captured by the primary alternative, snDCG.
They are surely other ways to generalize traditional eval-uation measures and paradigms to session evaluation thanthose we have presented. Our goal with this work is to de-fine measures as intuitively as possible while keeping modelsof user behavior simple. In the future we will want to con-sider explicit models of when and why users reformulate: isit based on the relevance of the documents they see? Does itdepend on how many times they have already reformulated?Are they willing to go deeper down the ranking for a laterreformulation than an earlier one?

+xo
+xo
+xo
+xo+xo
+xo
+xo
+xo
+xo
+xo+xo
+xo
+xo+xo
+xo
+xo
+xo
+xo
+xo+xo
+xo
+xo+xo
+xo
+xo
+xo
+xo+xo
+xo
+xo
+xo+xo
+xo
+xo
+xo
+xo
+xo+xo
+xo
+xo+xo
+xo
+xo
+xo
+xo
0.25 0.30 0.35 0.40 0.45 0.50
0.25
0.30
0.35
0.40
0.45
0.50
2-query sessions
expected session AP (esAP) -- exact method
expe
cted
ses
sion
AP
(esA
P) -
- Mon
te C
arlo
+xo
B=10 -- tau=0.957B=100 -- tau=0.981B=1000 -- tau=0.983 +xo +
xo
+xo
+xo+xo
+xo
+xo
+xo
+xo
+xo+xo
+xo
+xo+xo
+xo
+xo
+xo
+xo
+xo+xo+
xo
+xo+xo
+xo
+xo
+xo
+xo
+xo+xo
+xo
+xo+xo
+xo
+xo
+xo
+xo
+xo
+xo
+xo
+xo+xo
+xo
+xo
+xo
+xo
0.35 0.40 0.45
0.30
0.35
0.40
0.45
3-query sessions
expected session AP (esAP) -- exact method
expe
cted
ses
sion
AP
(esA
P) -
- Mon
te C
arlo
+xo
B=10 -- tau=0.896B=100 -- tau=0.947B=1000 -- tau=0.97
Figure 5: Exact method versus Monte Carlo in the computation of expected session AP (esAP) for B = 10,B = 100 and B = 1000, for 2 and 3 query sessions.
There are many cases we have not explicitly considered.“Drifting” information needs, which were part of the TREC2010 Session track, may require special treatment for eval-uation since the set of relevant documents can change asthe need drifts. Furthermore, there are many examples ofsessions in which a query and its results serve to guide theuser in selecting future queries rather than immediately pro-vide relevant documents; while we can apply our measuresto these types of sessions, they are clearly not designed tomeasure a system’s effectiveness at completing them.
Deeper understanding of session measures and their rela-tionship to the user experience will come from future workon session test collections, application to “real” sessions inquery log data, and extensive experimentation and analysis.We plan to continue all these lines of research in the future.
8. ACKNOWLEDGMENTSWe gratefully acknowledge the support provided by the
European Commission grant FP7-PEOPLE-2009-IIF-254562and FP7/2007-2013-270082 and by the University of DelawareResearch Foundation (UDRF).
9. REFERENCES[1] M. J. Bates. The design of browsing and berrypicking
techniques for the online search interface. Online review,13(5):407–431, 1989.
[2] C. Buckley and J. A. Walz. The trec-8 query track. In TheEighth Text REtrieval Conference Proceedings (TREC1999), 1999.
[3] C. J. C. Burges, R. Ragno, and Q. V. Le. Learning to rankwith nonsmooth cost functions. In B. Scholkopf, J. C. Platt,T. Hoffman, B. Scholkopf, J. C. Platt, and T. Hoffman,editors, NIPS, pages 193–200. MIT Press, 2006.
[4] C. L. Clarke, M. Kolla, G. V. Cormack, O. Vechtomova,A. Ashkan, S. Buttcher, and I. MacKinnon. Novelty anddiversity in information retrieval evaluation. In SIGIR ’08:Proceedings of the 31st annual international ACM SIGIRconference on Research and development in informationretrieval, pages 659–666, New York, NY, USA, 2008. ACM.
[5] W. S. Cooper. Expected search length: a single measure ofretrieval effectiveness based on the weak ordering action ofretrieval systems. American Documentation, 19:30–41,1968.
[6] K. Jarvelin, S. L. Price, L. M. L. Delcambre, and M. L.Nielsen. Discounted cumulated gain based evaluation ofmultiple-query ir sessions. In ECIR, pages 4–15, 2008.
[7] E. Kanoulas, B. Carterette, P. Clough, and M. Sanderson.Session track overview. In The Nineteenth Text REtrievalConference Notebook Proceedings (TREC 2010), December2010.
[8] S. Kharazmi, F. Scholer, and M. Wu. RMIT University atTREC 2010: Session track. In Proceedings of TREC, 2010.
[9] B. King and I. Provalov. Cengage learning at the TREC2010 Session track. In Proceedings of TREC, 2010.
[10] A. Moffat and J. Zobel. Rank-biased precision formeasurement of retrieval effectiveness. ACM Trans. Inf.Syst., 27(1):1–27, 2008.
[11] P. Over. Trec-7 interactive track report. In The SeventhText REtrieval Conference Proceedings (TREC 1998),pages 33–39, 1998.
[12] S. Price, M. L. Nielsen, L. M. L. Delcambre, andP. Vedsted. Semantic components enhance retrieval ofdomain-specific documents. In M. J. Silva, A. H. F.Laender, R. A. Baeza-Yates, D. L. McGuinness, B. Olstad,Ø. H. Olsen, and A. O. Falcao, editors, CIKM, pages429–438. ACM, 2007.
[13] S. E. Robertson. The probability ranking principle in IR.Journal of Documentation, 33(4):294–304, 1977.
[14] T. Sakai. Alternatives to bpref. In SIGIR ’07: Proceedingsof the 30th annual international ACM SIGIR conferenceon Research and development in information retrieval,pages 71–78, New York, NY, USA, 2007. ACM.
[15] D. Wolfram, A. Spink, B. J. Jansen, and T. Saracevic. Voxpopuli: The public searching of the web. JASIST,52(12):1073–1074, 2001.
[16] Y. Yang and A. Lad. Modeling expected utility ofmulti-session information distillation. In L. Azzopardi,G. Kazai, S. E. Robertson, S. M. Ruger, M. Shokouhi,D. Song, and E. Yilmaz, editors, ICTIR, pages 164–175,2009.
[17] E. Yilmaz and J. A. Aslam. Estimating average precisionwith incomplete and imperfect judgments. In P. S. Yu,V. Tsotras, E. Fox, and B. Liu, editors, Proceedings of theFifteenth ACM International Conference on Informationand Knowledge Management, pages 102–111. ACM Press,November 2006.
[18] Y. Zhang, L. A. Park, and A. Moffat. Click-based evidencefor decaying weight distributions in search effectivenessmetrics. Inf. Retr., 13:46–69, February 2010.