Embed Size (px)
Citation preview

EVALUATING TACTICAL COMBAT CASUALTY CARE TRAINING TREATMENTS EFFECTS ON COMBAT MEDIC TRAINEES IN LIGHT OF SELECT HUMAN
DESCRIPTIVE CHARACTERISTICS
by
TERESITA M. SOTOMAYOR B.S. University of Puerto Rico, 1986
M.S. George Washington University, 1993
A dissertation submitted in partial fulfillment of the requirements for the degree of Doctor of Philosophy in Modeling and Simulation
in the College of Engineering and Computer Science at the University of Central Florida
Orlando, FL
Fall Term 2008
Major Professor: Michael Proctor

ii
© 2008 Teresita Sotomayor
iii
ABSTRACT
The use of military forces in urban operations has increased considerably over the past
years. As illustrated by the current conflict in Iraq, the Army finds itself fighting its toughest
battles in urban areas facing unconventional forces. Soldiers face many threats in hostile fire
environments, whether conducting large-scale mechanized warfare, low-intensity conflicts, or
operations other than war. Through 1970, there has been no demonstrable reduction in battlefield
mortality rate as a percentage of all casualties since data was kept since before the Civil War. For
that period of time, nearly all the reduction in overall mortality rate occurred through reduced
mortality in Hospital Chain. As of 1970, about 90 percent of all combat deaths occur before a
casualty reaches a definitive care facility.
Tactical Combat Casualty Care (TCCC), also known as TC3, is the pre-hospital care
rendered to a casualty in a combat environment. The application of TCCC principles during a
tactical combat environment has proven highly effective and is a major reason why combat
deaths in latest conflicts (Operation Iraqi Freedom and Operation Enduring Freedom) are lower
than in any other conflict in the history of the United States.
The Army continues to emphasize reducing battlefield mortality rate. Current tools and
methods used for initial skills and sustainment training of combat medics throughout the Army
are insufficient. New technologies are needed to provide medics with greater opportunities to
develop and test their decision making and technical medical skills in multiple, COE-relevant,
training scenarios.
In order to address some of these requirements, the U.S. Army Research Development
and Engineering Command, Simulation and Training Technology Center (RDECOM-STTC) is
iv
developing the 68W – Tactical Combat Casualty Care Simulation (TC3 Sim) for the US Army
Medical Department (AMEDD) Center & School at Fort Sam Houston. The Army is considering
the use of the TC3 Sim game as a tool to improve the training of individual Soldiers as well as
improve the readiness of combat medics.
It is the intent of this research to evaluate the effectiveness of instructional games in
general and the use of the TC3 game in particular for teaching the concepts of tactical combat
casualty care. Experiments will be conducted to evaluate the training effectiveness of this tool in
supporting the 68W10 Healthcare Specialist Course program of instruction (POI). The goal of
this research is to address important questions such as: Is this game an effective tool to train
Soldiers the aspects of TC3? Can knowledge gain through the use of the simulation be
transferred into task related situations? How can this tool be incorporated in the current POI in
order to increase training effectiveness?

v
To mom and dad: Thanks for your example, support, and unconditional love.
To Harry, Francisco Javier and Cristina Elena: Every day you inspire me and give me strength to
continue my journey.

vi
ACKNOWLEDGMENTS
I will like to acknowledge those who through this journey provided support, guidance and
assistance. I will like to thank my husband and children for their support, prayers and words of
encouragement. Many thanks to Dr. Michael Proctor for his mentorship and invaluable support.
To my committee members, Dr. Paula Durlach, Dr. Peter Kincaid, Dr. Pamela McCauley-Bush,
and Dr. Neal Finkelstein for their invaluable guidance and advice. Special thanks to Don Parsons
for his expertise in Tactical Combat Casualty Care and most of all for opening the right doors
and making things happen. Thanks to Dawn Riddle for her guidance and expertise. Many thanks
to the Medical Team at RDECOM STTC (Beth Pettitt, Jack Norfleet, Sandra Dickinson and Bill
Pike) for their constant support. Thanks to Angel Rodriguez for providing the right opportunities.
Thanks to Maria Bauer for her constant encouragement. Thanks to my family and friends for
their understanding and loyalty; and above all, thanks to God for providing me the strength and
courage needed to complete this endeavor.
vii
TABLE OF CONTENTS
LIST OF FIGURES ....................................................................................................................... xi
LIST OF TABLES....................................................................................................................... xiii
LIST OF TABLES....................................................................................................................... xiii
CHAPTER ONE: INTRODUCTION............................................................................................. 1
Modeling, Simulation, and Games in Training........................................................................... 4
Training the Army Combat Medics ............................................................................................ 6
Tactical Combat Casualty Care .................................................................................................. 8
The Tactical Combat Casualty Care Simulation (TC3 Sim) ................................................ 13
Capabilities of TC3 Sim........................................................................................................ 14
Description of the GAP............................................................................................................. 16
CHAPTER TWO: LITERATURE REVIEW............................................................................... 18
Simulations, Games, and Instructional Games ......................................................................... 18
Today’s Learning Community.................................................................................................. 32
Training Effectiveness of Games.............................................................................................. 38
Summary of Literature Review................................................................................................. 50
Research Gap ............................................................................................................................ 51
CHAPTER THREE: METHODOLOGY ..................................................................................... 53
Training Effectiveness Evaluation Approach ........................................................................... 53
User Profile ............................................................................................................................... 57
Participants............................................................................................................................ 58
Instructional Media ................................................................................................................... 59
viii
Multimedia: TC3 Traditional Power Point Training ............................................................ 59
Interactive: TC3 Courseware ................................................................................................ 60
Experiential: TC3 Game Based Simulation.......................................................................... 65
Instructional Media Validation ............................................................................................. 67
Methodology............................................................................................................................. 68
Research Questions............................................................................................................... 71
Research Hypotheses ............................................................................................................ 72
TC3 Training......................................................................................................................... 74
Level 1 Evaluation: User Reaction to the TC3 Training ...................................................... 75
Level II Evaluation: Knowledge Acquisition with the TC3 Training .................................. 77
Level III Evaluation (Transfer) to TC3 Sim ......................................................................... 78
Self-Efficacy Evaluation....................................................................................................... 79
Motivation Evaluation .......................................................................................................... 80
Evaluation ................................................................................................................................. 81
Pilot Test Results .................................................................................................................. 81
Assessing Reaction (Level I) ................................................................................................ 90
Assessing Knowledge Acquisition (Level II) ....................................................................... 91
Assessing Skill Transfer (Level III)...................................................................................... 92
Assessing Self Efficacy......................................................................................................... 92
Assessing Motivation............................................................................................................ 93
CHAPTER FOUR: EXPERIMENT RESULTS........................................................................... 94
Data Collection ......................................................................................................................... 94
Training Effectiveness Evaluation Audience Profile............................................................ 95
ix
Level I Evaluation – User Reaction to TC3 Training ......................................................... 108
Level II Evaluation – Knowledge Acquisition ................................................................... 124
Level III Evaluation – Skill Transfer .................................................................................. 132
Self-Efficacy Evaluation..................................................................................................... 137
Motivation Evaluation ........................................................................................................ 140
CHAPTER FIVE: SUMMARY OF FINDINGS AND CONCLUSIONS, RESEARCH
LIMITATIONS, LESSONS LEARNED AND FUTURE RESEARCH........................ 148
Research Relevance ................................................................................................................ 148
Summary of Findings and Conclusions .................................................................................. 149
Level I Reaction.................................................................................................................. 150
Level II Knowledge Acquisition......................................................................................... 150
Level III Skill Acquisition .................................................................................................. 152
Self-Efficacy ....................................................................................................................... 153
Motivation........................................................................................................................... 153
Experimental Limitations........................................................................................................ 154
Resources ............................................................................................................................ 155
Subjects ............................................................................................................................... 155
Experimental Methodology ................................................................................................ 156
Games ................................................................................................................................. 157
Lessons Learned...................................................................................................................... 157
Recommended Future Research ............................................................................................. 158
APPENDIX A: CONSENT FORM............................................................................................ 161
APPENDIX B: DEMOGRAPHIC SURVEY............................................................................. 165
x
APPENDIX C: PRE-POST TEST VERSION A........................................................................ 168
APPENDIX D: TIMING AND ACTIVITIES FORM – POWERPOINT TRAINING TIME
DATA ............................................................................................................................. 172
APPENDIX E: TIMING AND ACTIVITIES FORM – COURSEWARE TRAINING TIME
DATA ............................................................................................................................. 174
APPENDIX F: TIMING AND ACTIVITIES FORM – COURSEWARE AND GAME
TRAINING TIME DATA .............................................................................................. 176
APPENDIX G: PRE-POST TEST VERSION B........................................................................ 178
APPENDIX H: REACTION SURVEY – POST-TRAINING ................................................... 182
APPENDIX I: TRANSFER SCENARIO................................................................................... 185
APPENDIX J: REACTION SURVEY – POST-TRANSFER ................................................... 190
APPENDIX K: MOTIVATION SURVEY – POWERPOINT .................................................. 192
APPENDIX L: MOTIVATION SURVEY – COURSEWARE ................................................. 195
APPENDIX M: MOTIVATION SURVEY – GAME................................................................ 198
APPENDIX N: UCF IRB APPROVAL ..................................................................................... 201
LIST OF REFERENCES............................................................................................................ 203
xi
LIST OF FIGURES
Figure 1: Demonstrable Reduction in Mortality Rate (retrieved from ATTAPS website on June
30, 2006) ............................................................................................................................. 2
Figure 2: Combat Casualties Killed in Action (KIA) ..................................................................... 2
Figure 3: Top Ten Causes of Death in Operation Iraqi Freedom ................................................... 3
Figure 4: Monthly Statistics of Fatalities Caused by IEDs............................................................ 3
Figure 5: Interface Buttons ........................................................................................................... 61
Figure 6: Text Box Pop-up ........................................................................................................... 62
Figure 7: Short Answer Question ................................................................................................. 63
Figure 8: Multiple-Choice Question ............................................................................................. 64
Figure 9: End-of-Lesson Quiz Question ....................................................................................... 65
Figure 10: Treating the Wounded ................................................................................................. 67
Figure 11: Missing Pictures .......................................................................................................... 89
Figure 12: Incorrect Feedback ...................................................................................................... 90
Figure 13: Age Distribution of the Entire Sample Population...................................................... 95
Figure 14: Gender Distribution of the Sample Population ........................................................... 96
Figure 15: Combat Medic Experience .......................................................................................... 97
Figure 16: Combat Operations Experience................................................................................... 98
Figure 17: Video Game Experience.............................................................................................. 98
Figure 18: Distribution of Video Game Hours on a Typical Week............................................ 100
Figure 19: First Person Video Game Ability .............................................................................. 101
Figure 20: Computer Ability....................................................................................................... 102

xii
Figure 21: Distribution of Computer Time on a Typical Week.................................................. 104
Figure 22: Level of Education Distribution ................................................................................ 105
Figure 23: Ethnicity Distribution ................................................................................................ 106
xiii
LIST OF TABLES
Table 1: Kirkpatrick (1959) Training Effectiveness Evaluation Model ....................................... 54
Table 2: TC3 Target Audience Profile.......................................................................................... 58
Table 3: Experimental Timetable.................................................................................................. 71
Table 4: Proposed Experimental Configuration ........................................................................... 83
Table 5: Pilot Test Data Technical Issues and Actions................................................................. 85
Table 6: Knowledge Test – Observations and Actions Taken after Analysis of Pilot Data......... 87
Table 7: Transfer Task – Observations and Actions Taken after Analysis of Pilot Data............. 88
Table 8: Final Experimental Configuration .................................................................................. 94
Table 9: Gender and Generation Categorization .......................................................................... 96
Table 10: Average Number of Years of Civilian Medical Experience......................................... 98
Table 11: Descriptive Characteristics of Subjects without Video Game Experience................... 99
Table 12: First Person Video Game and Computer Ability Self Assessment ............................ 102
Table 13: Level of Education Gender and Generation Frequency ............................................. 105
Table 14: Ethnicity Frequency.................................................................................................... 106
Table 15: Sample Population Profile .......................................................................................... 107
Table 16: Overall Reaction to Training ...................................................................................... 110
Table 17: Overall Reaction between Treatments........................................................................ 111
Table 18: Benefit to Training – Learning Objectives Met.......................................................... 112
Table 19: Benefit to Training – Learning Objectives Met – Analysis between Treatments ...... 114
Table 20: Benefit to Training – Inclusion in POI ....................................................................... 115
Table 21: Benefit to Training – Inclusion in POI – Analysis between Treatments.................... 116
xiv
Table 22: Usability – Ease of Use............................................................................................... 117
Table 23: Usability Ease of Use – Analysis between Treatments .............................................. 118
Table 24: System Usability – Instructor Support........................................................................ 120
Table 25: System Usability – Instructor Support – Analysis between Treatments .................... 121
Table 26: System Usability – Instructor Support........................................................................ 122
Table 27: Gender Analysis.......................................................................................................... 123
Table 28: Pre Test Data Analysis between Treatments .............................................................. 125
Table 29: Pre and Post Test ANOVA for TC3 Training Groups................................................ 126
Table 30: Pre-Post Test Gain Scores ANOVA and ANCOVA Data Analysis........................... 126
Table 31: Pre-Post Test Gain Scores ANOVA between Treatments Data Analysis .................. 127
Table 32: Content Training Time Data Analysis........................................................................ 130
Table 33: Content Training Time between Treatments Data Analysis....................................... 131
Table 34: Training Time and Pre Post Gain Scores.................................................................... 132
Table 35: Transfer Scenario Scores Data Analysis..................................................................... 133
Table 36: Training Time and Transfer Test Scores .................................................................... 136
Table 37: Self-Efficacy Scores after Training Data Analysis..................................................... 138
Table 38: Self-Efficacy Scores after Transfer Task Data Analysis ............................................ 138
Table 39: Self-Efficacy after Training and Pre Post Gain Scores .............................................. 139
Table 40: Self-Efficacy after Transfer Task and Transfer Task Scores...................................... 140
Table 41: Intrinsic Motivation Scores after Training Data Analysis.......................................... 141
Table 42: Intrinsic Motivation, Pre-Post Gain Scores, and Transfer Task Scores Correlation
Analysis........................................................................................................................... 142
Table 43: Extrinsic Motivation Scores after Training Data Analysis......................................... 143
xv
Table 44: Extrinsic Motivation, Pre-Post Gain Scores, and Transfer Task Scores Correlation
Analysis........................................................................................................................... 144
Table 45: Summary of Collected Data........................................................................................ 145
Table 46: Game as a Secondary Activity Analysis..................................................................... 146
1
CHAPTER ONE: INTRODUCTION
The use of military forces in urban operations has increased considerably over the past
years. As illustrated by the current conflict in Iraq, the Army finds itself fighting its toughest
battles in urban areas facing unconventional forces. Soldiers face many threats in hostile fire
environments, whether conducting large-scale mechanized warfare, low-intensity conflicts, or
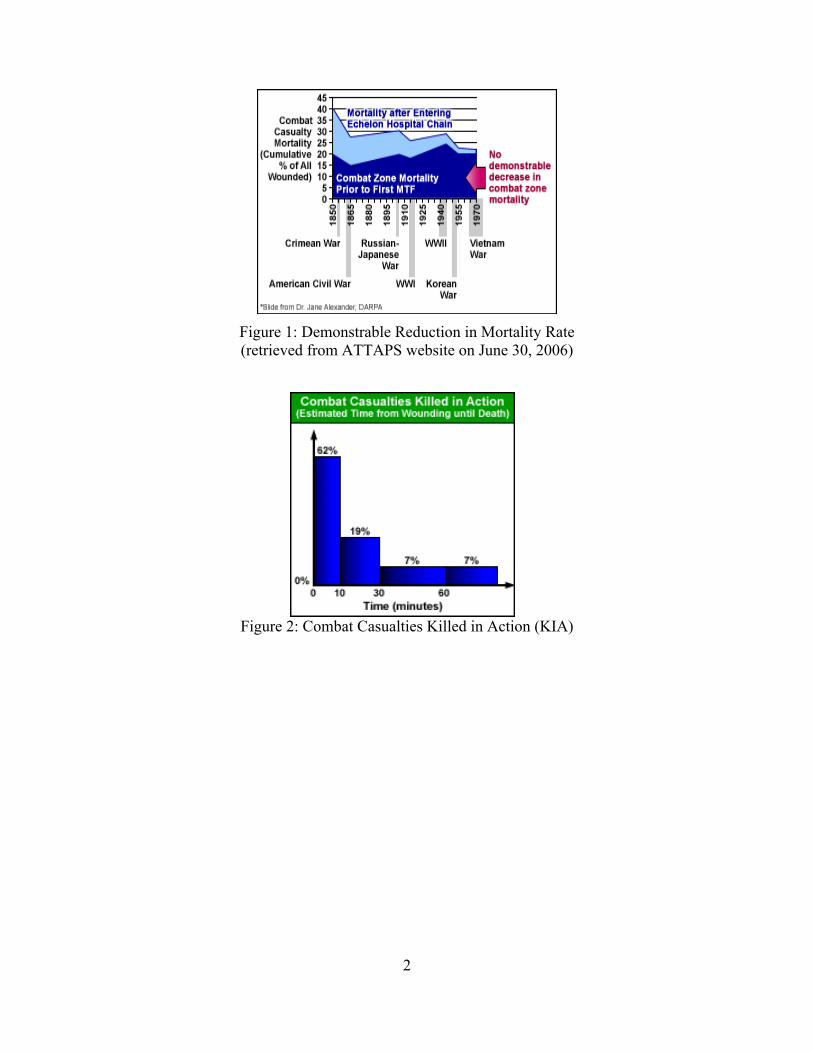
operations other than war. Through 1970, there has been no demonstrable reduction in mortality
rate as a percentage of casualties on the battlefield since before the Civil War as depicted in
Figure 1. As seen in Figure 2, as of 1970 about 90 percent of all combat deaths occur before a
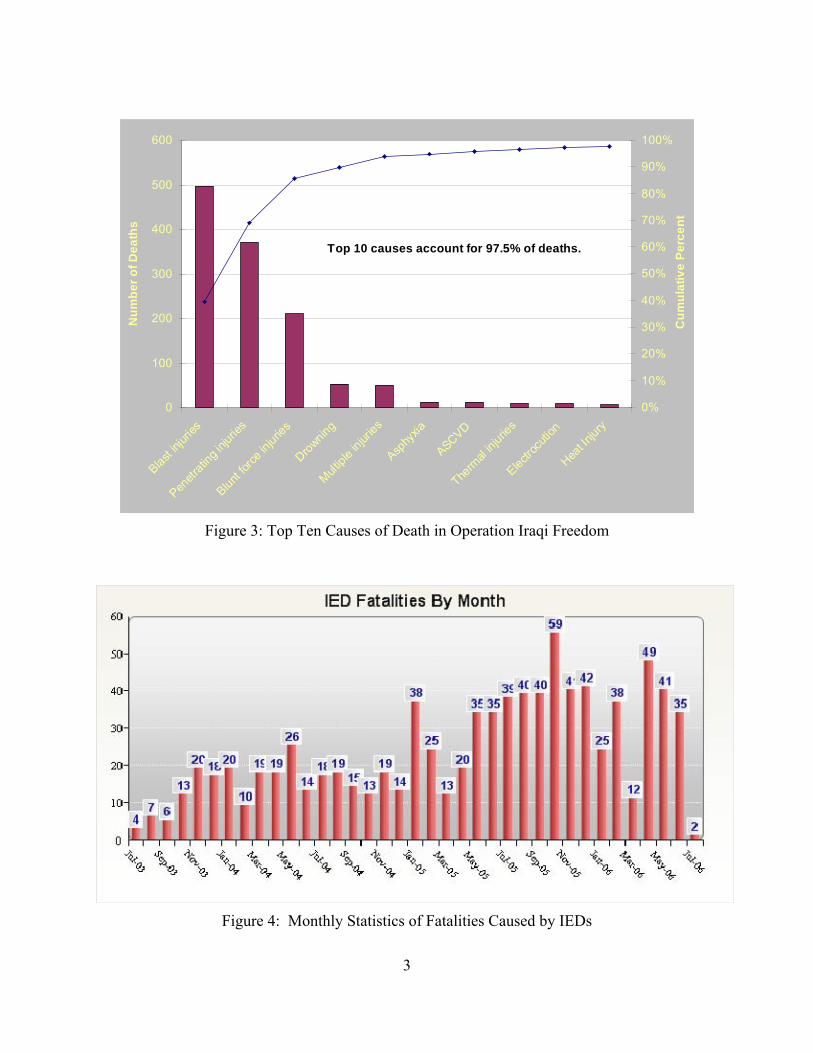
casualty reaches a definitive care facility (Parsons 2006). Figure 3 provides statistics regarding
the top ten causes of death in Operation Iraqi Freedom (Parsons 2006, Training Materials). In
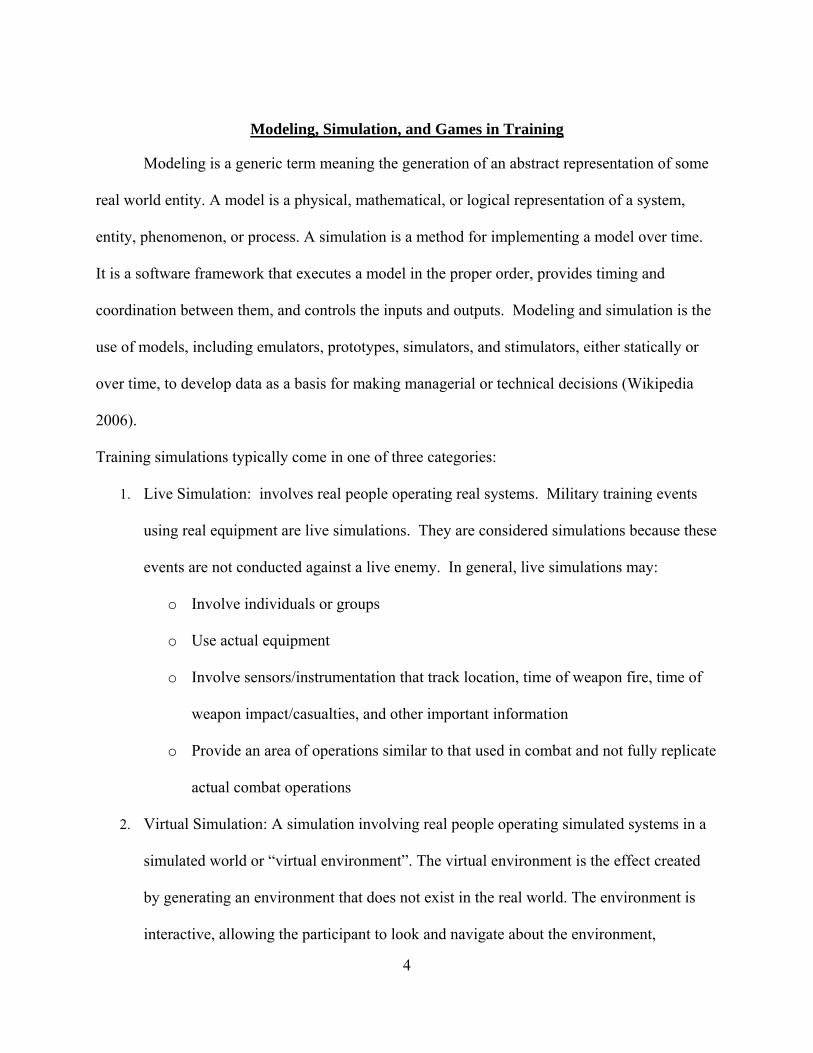
Iraq, the use of Improvised Explosive Devices (IEDs) by enemy forces has become a challenge
and has worsened the situation. IEDs are designed to kill or incapacitate personnel and mostly
are victim-activated (Global Information 2006). The amount of casualties due to these devices is
increasing. Recent statistics show, that in the past, 40 to 60 percent of the attacks began with an
IED with direct fire attacks immediately following the detonation of the device. Figure 4 shows
IED fatalities by month from July 2003 until June 2006 (ICCC 2006). This is the situation our
Soldiers are facing constantly and the Army needs to be able to train in these urban scenarios as
well as conduct realistic mission planning and mission rehearsal. Modeling and simulation plays
a big role in the development and refinement of Army tactics, techniques and procedures (DoD
Modeling and Simulation Master Plan, 1995). One group that can greatly benefit from this kind
of training is the military medical personnel. The primary mission of all military medical
personnel in the combat field is to treat the wounded and save lives.
2
Figure 1: Demonstrable Reduction in Mortality Rate (retrieved from ATTAPS website on June 30, 2006)
Figure 2: Combat Casualties Killed in Action (KIA)
3
Figure 3: Top Ten Causes of Death in Operation Iraqi Freedom
Figure 4: Monthly Statistics of Fatalities Caused by IEDs
0
100
200
300
400
500
600
Blast in
jurie
s
Penet
ratin
g in
jurie
s
Blunt
forc
e inj
urie
s
Drownin
g
Mult
iple
injur
ies
Asphy
xia
ASCVD
Therm
al in
jurie
s
Electr
ocut
ion
Heat I
njury
Nu
mb
er
of
De
ath
s
0%
10%
20%
30%
40%
50%
60%
70%
80%
90%
100%
Cu
mu
lati
ve
Pe
rce
nt
Top 10 causes account for 97.5% of deaths.
4
Modeling, Simulation, and Games in Training
Modeling is a generic term meaning the generation of an abstract representation of some
real world entity. A model is a physical, mathematical, or logical representation of a system,
entity, phenomenon, or process. A simulation is a method for implementing a model over time.
It is a software framework that executes a model in the proper order, provides timing and
coordination between them, and controls the inputs and outputs. Modeling and simulation is the
use of models, including emulators, prototypes, simulators, and stimulators, either statically or
over time, to develop data as a basis for making managerial or technical decisions (Wikipedia
2006).
Training simulations typically come in one of three categories:
1. Live Simulation: involves real people operating real systems. Military training events
using real equipment are live simulations. They are considered simulations because these
events are not conducted against a live enemy. In general, live simulations may:
o Involve individuals or groups
o Use actual equipment
o Involve sensors/instrumentation that track location, time of weapon fire, time of
weapon impact/casualties, and other important information
o Provide an area of operations similar to that used in combat and not fully replicate
actual combat operations
2. Virtual Simulation: A simulation involving real people operating simulated systems in a
simulated world or “virtual environment”. The virtual environment is the effect created
by generating an environment that does not exist in the real world. The environment is
interactive, allowing the participant to look and navigate about the environment,
5
enhancing the immersion effect. Virtual simulations inject human-in-the-loop in a central
role by exercising motor control skills, decision skills, or communication skills.
3. Constructive Model or Simulation: Models and simulations that involve simulated people
operating simulated systems. Real people stimulate (make inputs) to such simulations,
but are not involved in determining the outcomes. Constructive simulation is often
referred to as "wargaming" since it bears some resemblance to table-top war games in
which players command armies of Soldiers and equipment which move around a board.
The categorization of simulation into live, virtual, and constructive is problematic
(Wikipedia 2006), because there is no clear division between these categories. The degree of
human participation in the simulation is infinitely variable, as is the degree of equipment realism.
This categorization of simulations also suffers by excluding a category for simulated people
working real equipment, for example smart vehicles. Even though live training has been the
preferred method of military preparedness, it involves large amounts of time, people, money, and
resources. Simulation and virtual training can be used to augment live training. In addition,
when life training is limited due to monetary, time or operational constraints, simulation systems
can help fill the training gap.
The Army, in an effort to improve effectiveness and efficiency of training at all levels is
looking to make use of simulation to train its units and leaders. In fact, the Department of
Defense (DoD) has identified the need to restructure the entire process of training as stated in the
DoD Training Transformation Plan (Department of Defense, 2004 page 2), “The dramatic
transformation of America’s strategic environment continues its significant impact on our
military forces and its demand for an equally dramatic transformation in how we prepare forces
for combat and non combat operations… we need to transform the way we train.”
6
The US Army faces budget and time constraints, therefore, new ways need to be
identified in an effort to provide effective and relevant training taking into account limited
resources. One area that the Army is looking into is the use of PC based training as well as
gaming technology. Desktop simulations and digital game-based technologies have earned much
attention for their potential as training tools. Hays (2005) provided the following definition of a
game: “A game is an artificially constructed, competitive activity with a specific goal, a set of
rules and constraints that is located in a specific context. A game is not reality. It is a
constructed activity that resembles portions of reality. It provides a competitive environment for
a player by challenging him or her to reach a goal. The purpose of the game (e.g., enjoyment,
information, instruction, etc) helps define the goals, rules, and context of the game.” The
physical realism and interactivity of the emerging gaming technologies could be utilized to
develop cognitive skills. Prior research indicates that higher levels of learning motivation are
associated with digital game-based technologies (Baxter, Ross, Phillips, Shafer, & Fowlkes,
2004).
Training the Army Combat Medics
As a nation at war, the initial skills medical training for Army combat medics has shift
focus from textbook procedures to realistic, battlefield-centric missions as outlined in the
Operational Needs Statement (ONS) for Medical Simulation Training Centers for Combat
Lifesavers (CLS) and Tactical Combat Casualty Care (TC3) Training. The Department of
Combat Medic Training (DCMT) at the U.S. Army Medical Department Center and School
serves as the proponent for the 68W Health Care Specialist and the Army Emergency Medical
Service (EMS). The Army combat medics, also known as 68W, provide in many cases the first
7
line of medical support and assistant to injured Soldiers in the battlefield. DCMT provides the
Army with highly motivated and disciplined 68W, Health Care Specialists (Combat Medics)
who are National Registry Emergency Medical Technician-Basic (EMT-B) certified. These
Soldier medics possess the additional necessary medical skills to sustain the force, survive the
battlefield and accomplish the mission to "Conserve the Fighting Strength.” (AMMED, 2006).
Pre-hospital care continues to be the most important aspect of battlefield medicine.
Newly assigned combat medics attend the 16-week, 68W10 Healthcare Specialist Course at Fort
Sam Houston, TX. The course supports both active Army and reserve component Soldiers. The
instructors use a variety of instructional development strategies to effectively prepare Soldier
medics for administering care and saving lives on the battlefield.
The course is designed to train junior enlisted Soldiers to perform emergency medical
treatment and routine patient care duties in the field as well as in military treatment facilities.
The major training components include combat trauma, invasive procedures, Force Health
protection, evacuation, CBRNE (chemical, biological, radiological/nuclear and explosive), and
support of care which encompasses some basic nursing skills. The course is taught as part of a
16-week, residence training program and requires 440 hours of classroom training, 192 hours of
situational training exercises and 128 hours of field training exercises. The course also prepares
students to pass the test requirements of the National Registry of Emergency Medical
Technicians – Basic (EMT-B) as a foundation for the Health Care Specialist (Fowler, Smith &
Litteral, 2005).
Soldier medics are preparing for these missions by participating in more field exercises
with an emphasis on mass casualties and patient evacuation. Classroom instruction provides
Soldiers with the basic knowledge and skills; however, current classroom and field instruction
8
lack the ability to provide all Soldiers with an opportunity to test their skills in multiple, COE
(Current Operating Environment) relevant, training scenarios.
Even though the current Died-of-Wounds rate for Operation Iraqi Freedom is at a
historically low rate, Soldiers continue to die from the three main causes: Hemorrhage, Airway
Compromise, and Tension Pneumothorax. Operations in Afghanistan and Iraq have identified
gaps in the training of combat medics. Improvements in the way medics are trained in Tactical
Combat Casualty Care, particularly in regards to the three main causes of death, can further
reduce the number of battlefield deaths and therefore have a direct impact on mission
accomplishment. The goal is to improve medical care at the point of the wounding. If a casualty
survives long enough to reach a care facility, his chance of survival increases.
Tactical Combat Casualty Care
Tactical Combat Casualty Care, also known as TC3, is the pre-hospital care rendered to a
casualty in a combat environment (CALL, 2006). The application of TC3 principles during a
tactical combat environment has proven highly effective and is a major reason why combat
deaths in latest conflicts (Operation Iraqi Freedom and Operation Enduring Freedom) are lower
than in any other conflict in the history of the United States.
Most medical providers and medics train in a traditional civilian trauma care setting.
Trauma care training for military corpsmen and medics has been based primarily on the
principles taught in the Advanced Trauma Life Support (ATLS) course (Mosby 2003). ATLS
provides a standardized approach to the management of trauma that has proved very successful
when used in the setting of a hospital emergency department.

9
The challenge is that the principles of TC3 are fundamentally different from those of
traditional civilian trauma care. These differences are based on the unique patterns and types of
wounds that are suffered in combat and the tactical conditions medical personnel encounters
during combat. Several factors that affect casualty care during combat and differentiate that from
a civilian hospital setting include the following:
Hostile fire may be present which prevents the treatment of the casualty.
Medical equipment is limited to that carried by mission personnel.
Tactical considerations may dictate that mission completion take precedence over
casualty care.
Time until casualty evacuation is highly variable (from minutes to hours or days).
Casualty evacuation may not be possible based on the tactical situation.
To be successful, medical providers must have skills and training oriented to combat
trauma care, as opposed to civilian trauma care and unfortunately, many military medical
providers and medics lack this type of experience. In a combat environment, the pre-hospital
period is the most critical time to care for any casualty. According to the Center for Army
Lessons Learned, up to 90 percent of combats deaths occur before a casualty can reach a medical
treatment facility. This is the main reason why it becomes critical to treat a combat casualty at
the point of injury, prior to evacuation and arrival at a medical facility.
In a combat environment, casualties will generally fall into three categories:
Casualties who will die regardless of receiving any medical intervention.
Casualties who will live regardless of receiving any medical intervention.
Casualties who will die if they do not receive timely and appropriate medical
intervention.
10
In addition, it has been determined that combat deaths result from the following:
31 % of the fatalities are due to a penetrating head trauma
25 % of the fatalities are due to a surgically uncorrectable torso trauma
10 % of the fatalities are due to potentially correctable surgical trauma
9 % of the fatalities are due to exsanguinations
7 % of the fatalities are due to a mutilating blast trauma
5 % of the fatalities are due to Tension Pneumothorax (PTX)
1 % of the fatalities are due to airway obstruction/injury
12 % of the fatalities are due problems with the wounds, mainly infection and shock
Deaths associated with exsanguinations, Tension Pneumothorax (PTX), and airway
obstruction/injury account for 15 % of the fatalities. These deaths could be avoided with timely
intervention at the point of injury. Specifically, it has been estimated that of all preventable
deaths, 90 % can be avoided with the application of a tourniquet, in the case of an extremity
hemorrhage, the immediate treatment of a PTX, and the establishment of a stable airway.
TC3 addresses the Casualties who will die if they do not receive timely and appropriate
medical intervention, particularly injuries associated with exsanguinations, Tension
Pneumothorax (PTX), and airway obstruction/injury. TC3 is structured so that correct
intervention is performed at the correct time in order to meet the three important goals of field
care: treat the casualty, prevent additional casualties and complete the mission.
There are three distinct phases of care in combat casualty management. Each phase has
its own characteristics and limitations and the care provided under each phase depends directly
on those limitations. The following is a description of each phase:

11
Care Under Fire – this phase is characterized by the care rendered at the point of injury
when both the medic and the casualty are subjected to effective hostile fire. There is
extremely high risk of additional injuries from hostile fire for both the medic and the
casualty. Available medical equipment is limited to that carried by the medic and the
casualty. The major considerations during this phase of care are suppression of hostile
fire, moving the casualty to a safe position and treatment of immediate life-threatening
hemorrhage. Casualty care during this phase is complicated since the medical equipment
available for care is limited and unit’s personnel will be directly engaged with hostile fire
preventing them from assisting the casualty with treatment and evacuation. Also, the
tactical situation prevents the medic or medical provider from performing a detailed
examination or definite treatment of casualties. If the situation occurs at night time,
which frequently occurs, the medical provider has to deal with severe visual limitations
while treating the casualty.
Tactical Field Care – this phase is characterized by the care rendered by the medic once
both the medic and the casualty are no longer under effective hostile fire. It also applies
to those situations in which an injury has occurred on a mission, but there has been no
hostile fire. Available medical equipment is still limited to that carried into the field by
mission personnel. Time to evacuation may vary from minutes to hours. During this
phase care is directed toward more in-depth evaluation and treatment of the casualty
focusing on those conditions not addressed during the care under fire phase. The risk of
hostile fire has been reduced but still exists; therefore in some cases tactical field care
will consist of rapid treatment of wounds with the expectation of reengagement with
hostile forces at any time. The need to avoid undertaking nonessential evaluation and
12
treatment is critical in such situations. The medical equipment available is still limited to
what has been brought into the field by mission personnel. The time available for
treatment is highly variable and the time prior to evacuation, or possible engagement with
hostile forces, can range from a few minutes to hours. Medics must take care to partition
supplies and equipment in the event of prolonged evacuation wait times.
Combat CASEVAC Care- CASEVAC is the evacuation of combat casualties from the
battlefield. This phase is characterized by the care rendered once the casualty has been
evacuated and picked up by an aircraft, vehicle or boat for transportation to a higher
echelon of care. Additional equipment and medical personnel that has been pre-staged
should be available. This phase is a continuation of care rendered during the tactical field
care, but with the addition of medical personnel and equipment that may be brought with
the evacuation asset. The arrival of additional personnel is important for several reasons:
the medic can be one of the casualties, there may be multiple casualties exceeding
medic’s capability to care simultaneously, and additional medical personnel, such as
physicians and other specialists, provide greater expertise. The additional medical
equipment brought by the evacuation assets serves several purposes: medical re-supply
may be accomplished and more advanced medical equipment (blood products, fluids,
electronic monitoring devices, oxygen, etc.) may be used.
The tools and methods currently used for initial skills and sustainment training are
insufficient for training combat medics throughout the Army. New technologies are needed to
provide medics with greater opportunities to develop and test their decision making and technical
medical skills in multiple, COE-relevant, training scenarios.
13
In order to address some of these requirements, the U.S. Army Research Development
and Engineering Command, Simulation and Training Technology Center (RDECOM-STTC)
executed a three-year (FY04-06), joint Army Technology Objective (ATO) with the US Army
Medical Research and Materiel Command (MRMC), entitled Advanced Medic Training
Technologies. The goal of the research was to produce enhanced tools, techniques, and
procedures enabling the Army to field and maintain better trained medics, reduce the costs of
training, and improve the ability to save lives on the battlefield.
In fulfilling this ATO, the US Army RDECOM-STTC forged a partnership with the US
Army Medical Department (AMEDD) Center & School, the Department of Combat Medic
Training (DCMT) at Fort Sam Houston, TX, and the Army Research Institute (ARI) to develop
and implement new technologies to support simulation-based training environments for Army
combat medics. The TC3 Game-Based Simulation is a prototype application that was developed
through this partnership. This game-based simulation leverages technology developed through
previous research sponsored by the RDECOM-STTC, the Joint ADL Co-Laboratory’s prototype
program, and other associated research for the National Guard Bureau Civil Support Team
Trainer (CSTT). It combines advanced interactive training techniques, Advanced Distributed
Learning technologies, and immersive 3D/Virtual simulations to provide the required knowledge
and skills to significantly improve the training of Army combat medics.
The Tactical Combat Casualty Care Simulation (TC3 Sim)
Military trainers are becoming increasingly interested in using games to train their units.
One of these games is the 68W-Tactical Combat Casualty Care Simulation (TC3 Sim). TC3 Sim
is comprised of a Desktop Simulation and Courseware for Individual training of the Tactics,
14
Techniques and Procedures (TTPs) associated with Tactical Combat Casualty Care. TC3 Sim
provides a deliberate focus on training objectives by simulating realistic casualties within a
tactical combat environment set up to provide cues and conditions to support the principles of
TC3. The TC3 simulation merges Advanced Distributed Learning technologies and commercial
gaming technologies to provide individual and collective training in an immersive 3D
environment. The main purpose of this courseware is to provide the knowledge, skills, and
practice necessary to students to help them understand the differences between trauma
management in the United States and trauma management in a foreign country during wartime.
The 68W – TC3 Sim was developed for the US Army Medical Department (AMEDD)
Center & School at Fort Sam Houston in partnership with the US Army Research, Development
and Engineering Command’s Simulation & Training Technology Center (RDECOM-STTC).
The courseware is based on the same systematic approach for Basic and Advanced Trauma Life
Support (BTLS, ATLS) that is used for Emergency Medical Technicians (EMTs). However, it
will incorporate tactical situations that will require departures from these established principles
as dictated by the principles of Tactical Combat Casualty Care (TC3).
Capabilities of TC3 Sim
“Learn by doing” – Combat Medics and Combat Lifesavers may practice and train
together in the same 3D environment from geographically different locations.
A Standards-Based Architecture allows tracking and assessment of student performance
through any SCORM (Shareable Content Object Reference Model) conformant Learning
Management System.
15
Standardized Curriculum - conforms to Basic and Advanced Trauma Life Support
courses (BTLS, ATLS) and the Emergency Medical Technician Basic Course (EMT-B)
Cost Effective – All assets used to develop the 68W-TC3 Simulation are tagged with
meta-data so that they can be reused and repurposed for other training applications.
Modular Development - Deliver complex information to a diverse, geographically
dispersed audience in a short period of time
Simulation Subsystem – Accurate casualty models within tactical combat scenarios drive
the interactions between the student, the simulated environment and other entities.
Individual and Collective Training – Provide practical feedback and hands-on experience
in situations that cannot easily be practiced using live scenarios.
After Action Review – Feedback in the form of an “after action review” will be
supported by the ability to replay the entire simulation in varying levels of detail
Portability – Simulations may be accessed online or may be installed on an existing
network for use in the classroom. Also the students have the capability to run the
software from their PCs.
Human Performance Assessment Modeling to allow both skill-based and knowledge-
based assessments.
The TC3 simulation provides the opportunity of improving the training of Army combat
medics through the use of virtual Field Training Exercises in which each Soldier will play the
role of a combat medic in a variety of contextual situations. The training is centered on TC3
tasks such, as accessing casualties, prioritizing treatment (triage), treating casualties and
preparing casualties for evacuation. The use of this relatively low-cost training tool is expected
16
to improve the training of the Soldiers and improve the readiness of combat medics throughout
the Army.
The TC3 simulation is being designed for use in the following capacities for initial and
sustainment training (Fowler, Smith & Litteral, 2005):
1. When used in a classroom environment at the AMEDD Center & School, the TC3
simulation will provide an opportunity for student medics to assume key positions and
perform their duties under the guidance of an instructor. This approach also allows
instructors to pause the simulation to discuss key points within the context of a lecture.
2. The AMEDD Center & School may install the TC3 simulation in one of their Learning
Resource Centers. It is expected that this will foster independent learning by encouraging
students to learn for themselves based on their understanding of how and why new
knowledge and skills learned in the 68W10 Healthcare Specialist course are related to
their own experiences in the TC3 simulation.
3. The TC3 simulation may eventually be deployed as a distance-learning tool for
sustainment training. Programs such as this are numerous in the civilian sector of
emergency medicine. However, very few of them meet the needs of the Army or meet the
stringent requirements of the Continuing Education Coordinating Board of Emergency
Medical Services (CECBEMS).
Description of the GAP
The linear battlefield limits the number of trained medical personnel attached to
maneuver elements. There is a need to fill the gap with some type of medical capability at the
individual Soldier level in order to improve the survivability of the Soldier in combat. As sited
17
by retired Lieutenant Colonel Donald L. Parsons (Parsons, 2006), “improving care at the point of
wounding is the best medicine. The process has to start long before Soldiers ever see the
battlefield and the first step is training and then more training.”
There is a growing advocacy for the use of instructional games as a tool to provide
cognitive skills. However, the decision to use these kinds of games is often made on the basis of
“leaps of faith” instead of empirical data that could measure the effectiveness of instructional
games. Although previous research has demonstrated that some games can indeed provide
effective learning for a variety of learners, this does not guarantee that the use of a particular
game on a specific instructional task could be effective (Hays 2005).
The Army is currently pursuing the use of instructional games in an effort to improve
effectiveness in training. There are some advantages to this concept when compared to live,
virtual and constructive simulations. If developed to be run on a PC, games provide a low cost
alternative to training. They can be distributed easily, and so there is potential to minimize time
and logistics. If the Soldier has access to a PC, he or she could play the game any time,
anywhere.
The Army is considering the use of the TC3 Sim game as a tool to improve training of
individual Soldiers and improve the readiness of combat medics. It is the intent of this research
to evaluate the effectiveness of this instructional game in teaching the concepts of tactical
combat casualty care. Experiments will be conducted to evaluate the training effectiveness of
this tool in supporting the 68W10 Healthcare Specialist Course program of instruction (POI).
The goal of this research is to address an important question: Can instructional games encourage
learning? i.e., is this game an effective tool to train Soldiers the aspects of TC3?
18
CHAPTER TWO: LITERATURE REVIEW
The literature review below takes on an interdisciplinary focus in the quest to identify
limitations of current research in training effectiveness analysis of instructional games used for
training. The potential of using games to encourage learning has been the focus of much
literature recently published in the areas of education, learning and training. Many have tried to
answer the question: Can instructional games encourage learning? An overview of the
terminology used in the field regarding instructional games, today’s learning community and
current research done in the area of training effectiveness evaluations using instructional games
will be presented. Several Technical Reports as well as a thesis are discussed. A summary of
the review will tie all interdisciplinary subjects together and a discussion on the research gap will
be presented.
Simulations, Games, and Instructional Games
In literature on instructional games, the terms simulations, games, simulation-games,
digital game-based, and computer games are used interchangeably (Greenblat & Duke, 1981;
Dorn, 1989; Prensky, 2001; Mitchell & Savill-Smith, 2004; Hays, 2005). It is important to
understand the difference between terminology and the characteristics and categories of
instructional games for the purposes of this research.
According to Hays (Hays, 2005) “all simulations are based on models of reality”. A
model is “a physical, mathematical, or logical representation of a system, entity, phenomenon, or
process” (Department of Defense, 1997, pg. 138). A simulation is “a method for implementing a
model over time” (Department of Defense, 1997, pg. 160). It is a software framework that
19
executes a model in the proper order, provides timing and coordination between them, and
controls the inputs and outputs.
Cunningham (1984) defined simulation as “a device for replacing some aspect of reality
for purposes of experimentation, prediction, evaluation, or learning.” (pg. 215)
After an extensive literature review, Dorn (1989) provided definitions of game,
simulation and simulation games. He defined game as “any contest or play among adversaries or
players operating under constraints or rules for an objective or goal” (pg. 2); simulation as “an
operating representation of central features of reality” (pg. 2); simulation game as “activities
undertaken by players whose actions are constrained by a set of explicit rules particular to that
game and by a predetermined end point. The elements of the game constitute a more or less
accurate representation or model of some external reality with which players interact by playing
roles in much the same way as they would interact with reality itself”(pg. 3).
Games are a powerful information technology different to previous technologies such as
television (Carsten & Beck, 2005). Games are interactive (Birnbaum, 1982). Game’s powerful
interactivity reinforces particular behaviors: individual control, trial- and- error, and constant
change. In fact Costikyan (2002, pg. 11) stressed the fact that every game is interactive and the
phrase “interactive game” is a redundancy. In fact his definition of a game was stated as “an
interactive structure of endogenous meaning that requires players to struggle towards a goal”
(2002, pg. 22). He explains that he uses the phrase “endogenous meaning” to highlight the fact
that the meaning of a game is internal to the structure of the game and does not have any
meaning outside the game itself. Costikyan (2002, pg. 26) discussed Mark Leblanc’s Taxonomy
of game pleasures to look at what it is about games that people find compelling. According to
Leblanc there are eight categories of pleasure in a game:
20
Sensation – good visuals (graphics), good audio and sometimes tactile elements (game
controls) provide sensory pleasure.
Fantasy – an environment that fosters dispension of disbelieve.
Narrative – games should support a sense of drama.
Challenge – the amount of struggle that will captivate the players desire to engage with
the game.
Fellowship – shared intense experiences breed a sense of fellowship.
Discovery – revealing hidden information.
Expression – games provides a player with a way to express themselves and also allow
them to choose how they present themselves in the context of the game.
Masochism – submission to a game’s structure.
According to Leemkuil et al (2000) a simulation is a type of system that is very close to
games. They reiterate that simulations resemble games in that both contain a model of some kind
of system and they provide opportunities to the learners to input information/actions and observe
the consequences of their actions.
According to Garris, et al (2002), some of the key features of simulations are “that they
represent real-world systems; they contain rules and strategies that allow flexible and variable
simulation activity to evolve; and the cost of error for participants is low, protecting them from
the more severe consequences of mistakes.”
Garris, et al, (2002) identified six key dimensions that characterize games in contrast to
simulations. They argue that simulations that incorporate these features become game-like
simulations:
21
Fantasy – “Games represent an activity that is separate from real life in that there is no
activity outside the game that literally corresponds. Games involve imaginary worlds;
activity inside these worlds has no impact on the real world; and when involved in a
game, nothing outside the game is relevant.”(pg. 447)
Rules/goals – “Although game activity takes place apart from the real world, it occurs in
a fixed space and time period with precise rules governing game play.”(pg. 448)
Sensory stimuli – “Games imply the temporary acceptance of another type of reality. This
imaginary world disrupts the stability of normal sensations and perceptions and allows
the user to experience a distortion of perception that is not readily experienced in the real
world.”(pg. 449) User’s attention can be captivated by sound effects, dynamic graphics,
and other sensory stimuli.
Challenge – “Goals should be clearly specified, yet the possibility of obtaining that goal
should be uncertain. Games should employ progressive difficulty levels, multiple goals,
and a certain amount of informational ambiguity to ensure an uncertain outcome.
Performance feedback and score keeping allows the individual to track progress toward
desired goals. Finally, goals must be meaningful to the individual. Linking activities to
valued personal competencies, embedding activities within absorbing fantasy scenarios,
or engaging competitive or cooperative motivations can serve to make goals meaningful.”
(pg. 450)
Mystery - “mystery evokes curiosity in the individual” (pg. 450) and previous research
has indicated that curiosity is one of the primary factors that drive learning.
Control – “Control refers to the exercise of authority or the ability to regulate, direct, or
command something.” (pg.451)
22
In discussing the advantages of simulations over real-life tasks, Tomlinson and Masuhara
(2000) found that simulations are more economical, they make certain kinds of interactions more
accessible for observation and measurement, they help with the introduction of complex subjects,
and they allow the participants to be exposed to situations that they had never previously
encountered in their working environment.
Dempsey, et al, (1996, p. 3) defined a game as “a set of activities involving one or more
players. It has goals, constraints, payoffs, and consequences. A game is rule-guided and artificial
in some respects. Finally a game involves some aspects of competition, even if competition is
with oneself.”
Later on Hays (2006) defined the term game as “an artificially constructed, competitive
activity with a specific goal, a set of rules and constraints that is located in a specific context.”
He stated that there are four parts to this definition:
1. “Artificially constructed” – a game is a representation of reality, i.e. it is not real. A game
is a simulation and when a game is used for instructional purposes it is important that the
user understand the context of use.
2. “Competitive activity” – a simulation can be regarded as a game only if it includes
competition.
3. “Specific goal” – which is established by both rules and constraints.
4. “Located in a specific context” – a game for instructional purpose must meet specific
training goals.
Squire (2005) in describing a game noted that “they provide situated experiences in
which players are immerse in complex, problem solving tasks. Good games teach players more
than just facts; they provide ways of seeing and understanding problems and, critically, supply
23
opportunities to “become” different kinds of people”. According to his research, digital games
are routinely listed as the most influential medium by people under the age of 35. He stresses the
fact that games are a powerful socializing force and that those who play computer and video
games have different attitudes about work, play and their co-workers than do their peers.
Roger Caillois (1957) in his book “Games and Men” identified several characteristics that
define a game (Wikipedia, 2007):
Fun
Separate: enclosed in time and space
Uncertain : outcome is unforeseeable
Non-productive
Governed by rules: specific to the activity and different from everyday life
Fictitious: it takes the setting in a different reality
Csikszentmihalyi as noted by Hays (2005) discussed how Roger Caillois classified games
into four classes depending on the experience that they provide:
Agnostic Games- games involving competition (i.e. sports/athletic events)
Aleatory Games - games involving element of chance (i.e. dice, cards)
Vertigo or Ilinix Games – games that alter the person’s consciousness by scrambling
ordinary perception (i.e. riding the merry-go-round)
Mimicry Games – games that allow the creation of alternative realities (i.e. arts in
general – theater, dance)
A game can include a combination of these experiences and can be played in a variety of
mediums but it is important to note that it is the characteristics not the medium in which it is
24
played that define a game. Even though most games are intended for enjoyment they can be
designed for instruction as long as they support specific instructional objectives (Hays 2005).
Hays (2007) provided definition for different types of games and reiterated the fact that a
game could be a combination of several different game types:
Simulation-based Games – a simulation that incorporate game like activities (i.e. role-
playing games, computer and video games)
Individual or Group Games – games where the individual or a group of people compete
against a skill standard.
Games of Skill – games requiring certain skills ( i.e. board games, word games, games of
physical skills, and instructional games)
Games of Chance – games based on chance (i.e. dice games, card games, and lottery type
games)
Tailored Games – games that have been modified to include specific task characteristics
and constraints.
Hybrid Games – a game that is a combination of different types of games. Simulation
Game is the most often encountered hybrid.
Björk and Holopainen (2003) developed a conceptual model to identify the elements
commonly found in games. Their intent was to create a model that could describe games as an
activity. They identified four different categories that describe different aspects of the activity:
Holistic Components – those that describe the overall activity of the game:
o Game Instance – every time a game is played it is different to other instances in
terms of the constitution of the players, the place where it is played (location),
external requirements and limitation, or the experience of the players.
25
o Game Session – is the activity defined by the time spent on playing a game
instance.
o Play Session - distinct periods of game play activity that when combined
constitute a game session.
Bounding components – those that describe the meaning of the activity and what is
allowed within the activity:
o Rules – that dictates the flow of the game. Rules can be endogenous (explicitly
stated as being part of the game) or exogenous (not formally inscribed or
enforceable within the game).
o Modes of play – constructs to define boundaries between activities within the
larger activity of playing a game.
o Goals and Sub-goals – plans and actions of players during a game play or session
are geared towards achieving a goal. In complex games goals are often split into
smaller sub-goals.
Temporal components - those that describe the unfolding of the activity:
o Actions – the state of the game can only be changed by the player’s actions.
Actions can be continuous (being temporally defined by measure game time) or
discrete (being temporally defined by its relation to other actions).
o Events – discrete points in the game play where the state of the game changes.
o Closures- a change of game state triggered by the completion of a goal or sub-
goal.
o End Conditions - specify the game state of when a closure occurs.
o Evaluation Functions – determines the outcome of an event.
26
Objective components – physical and logical objects that maintain the game state or
provide functionality such as randomizing, score keeping or time keeping:
o Players – logical components that perform actions can be interpreted as having
strategies and goals, and can enter or leave the game.
o Interface – means of accessing the game.
o Games Components – physical and logical components of games that help
maintain and inform players about the current state of the game.
Leemkuil, et al. (2000) provided a definition of game and a list of characteristics based
on a literature study. Their definition states that “Games are competitive, situated (learning
environments) based on a set of rules and/or an underlying model, in which, under certain
constraints, some goal state must be reached. Games are situated in a specific context that makes
them (more or less) realistic, appealing and motivating for the players. Important elements that
are related to the situatedness of games are validity/fidelity, complexity, risk, uncertainty,
surprise, unexpected events, role play, access to information, and the representation form of the
game”. They defined the following characteristics of games:
Reaching Goal States - an important feature of a game is that some kind of goal has to be
reached. The goals could be: reaching a certain level of proficiency/efficiency, solving
problems, or becoming the best amongst other players or competitors.
Constraints, rules, and incentives – each game consists of rules that define actions that
could be taken and goals of the game.
Competition – games require a sense of accomplishment in terms of “winning” or
“losing”. This is accomplished by either beating players/teams/system or outperforming
players/teams/yourself.
27
Situatedness of Games – games are situated in a specific context that determines how
realistic, appealing and motivating it is for the players. Amongst the criteria used to
determine the correspondence between “reality” and the game situation are the
complexity, risk/uncertainty, roles, and type of interactions.
Prensky (2001, p. 118-119) identified six key structural elements in computer games that
when combined strongly engages the gamer: rules, goals and objectives, outcomes and feedback,
conflict/competition/challenge/opposition, interaction, representation or story. He provided the
following insights on why games engage:
“Games are a form of fun” – They provide the player with “enjoyment and pleasure”.
“Games are a form of play” – They provide the player with “intense and passionate
involvement”.
“Games have rules” – They provide the player with “structure.”
“Games have goals” – They provide the player with “motivation.”
“Games are interactive” – They provide a sense of “doing.”
“Games have outcomes and feedback” – They provide a “learning” experience.
“Games are adaptive” – They provide “flow.”
“Games have win states” – They provide the learner with “ego gratification.”
“Games have conflict/competition/challenge/opposition” – They provide “adrenaline.”
“Games have problem solving” – That sparks people’s “creativity.”
“Games have interaction” – They encourage participation in “social groups.”
“Games have representation and story” – They provide “emotion.”
28
Garris et al (2002) describe the motivational process in the context of a game cycle.
According to the authors, the game play triggers repeated cycles of user judgments, behavior,
and feedback. They provide the following description of each step within the cycle as follows:
User judgments – “As users initiate game play, they make subjective judgments
regarding whether the game is fun, interesting, and engaging. These judgments are
typically represented by self-reports of interest and engagement, enjoyment, and feelings
of mastery.” (pg. 452)
User behavior – “The affective judgments that are formed from initial and ongoing game
play determine the direction, intensity, and quality of further behavior. Motivated learners
more readily choose to engage in target activities, they pursue those activities more
vigorously, and they persist longer at those activities than do less motivated learners.”
(pg. 453)
System feedback – “Feedback is a critical component of the judgment-behavior-feedback
cycle. Individual judgments and behavior are regulated by comparisons of feedback to
standards or goals.” (pg. 454)
In explaining the role of gaming in education and training Becker (1980) expressed that
“Education and training are specific kinds of communication. Educational research has shown
that inductive approaches are superior, although only slightly, to deductive approaches. Gaming
is excellently suited for inductive teaching and training, allowing for a deductive input in later
stages of the communication process.”
According to Hays (2007) “an instructional game is specifically designed or modified to
meet training objectives. It meets these objectives by including rules, constraints, and activities
that closely replicate the constraints of the real- world task that is being trained. An instructional
29
game must be incorporated into a training program in a manner that ensures that trainees
understand the training objectives of the game, and receive detailed feedback about their
performance in the game and how their performance supported their training objectives”. He
noted that instructional games should be considered a training aid tool rather than a stand-alone
training method. If used as a stand-alone training tool, the game must be designed such that all
instructional capabilities provided by the trainer are incorporated.
When considering instructional games Hays (2007) further classify games by the type of
task to be trained:
Skills and Procedures Training Games – games geared towards helping individuals learn
specific skills and procedures.
Action Games – games that require the trainee to react to specific situations and engage
in real-time actions.
Role-playing Games – game that allows the trainee to practice specific activities that are
required for a certain task.
Strategy Games – games were the trainee is required to practice strategy skills.
Rice (2007) in his article “Assessing Higher Order Thinking in Video Games” defined
the characteristics comprising advanced gaming products that could be used for educational
purposes by identifying those elements that would lead to higher cognitive processing. Bloom’s
Taxonomy (1956) in the cognitive domain defines order thinking levels to be, from lower to
higher: Knowledge, comprehension, application, analysis, synthesis, and evaluation. Rice (2007)
defined Cognitive Virtual Interactive Environment (VIE) as software products designed to
encourage higher order thinking by users. Virtual requires the use of complex three-dimensional
graphics to create a meaningful virtual reality experience, Interactive requires extensive user
30
interaction while playing the game, and Environment indicates the context within which the
game takes place. According to Rice the difference between simple computer games (those
promoting only knowledge and comprehension) and cognitive VIEs is that the former provide
sufficient complex interactions that would promote higher order thinking to take place.
According to Dorn (1989), in order for simulation games to meet instructional goals, they
should be designed and used properly to meet specific instructional purposes. Instructional
games should be selected such that they accomplish specific training requirements goals and they
should be accompanied with discussions, lectures and other methods of instruction. They should
be incorporated in the program of instruction to support specific instructional event, not at
random. Finally, feedback should be incorporated as a structured and guided activity such that
learning can be fostered and the experience can be meaningful to training.
According to Garris et al (2002), debriefing is the most critical aspect of experiential
learning using simulation/gaming since the debriefing process allows the user to transform game
events into learning experiences: “Debriefing is the review and analysis of events that occurred
in the game itself.” (pg. 454), further, “Debriefing provides a link between what is represented in
the simulation/gaming experience and the real world. It allows the participant to draw parallels
between game events and real-world events” (pg. 454).
de Freitas and Jarvis (2006) presented a framework that highlights the importance of four
main aspects of “game-based learning” to be considered when developing games for instruction
or training. According to the authors, “game-based learning” is to be considered synonymous
with “serious games,” that is, a digital game with a specified educational or training purpose. The
four main aspects of a “serious game” in their framework are the following:
31
Context – context of the game and usage is essential to the effectiveness of the game in
the training environment. Contextual factors include: where a game will be used and
technical support availability.
Learner Specification – user profile needs to be developed to understand the
characteristics, learning preferences and cognitive styles of the targeted group of learners.
Representation – this relates to how levels of immersion, fidelity, and interactivity are
integrated into the game application such that it is effective and provides the required
level of engagement.
Pedagogical model or approach used – Need to consider the learning theory and
approaches behind the application (i.e. associative, cognitive, and situative perspectives)
in order to ensure that the game is used effectively to support specified learning
outcomes.
Greenblat (1973) noted that simulation games “represent modes of getting students to
learn by provoking inquiry rather than by “feeding” information”. She discussed that the beliefs
in the potency of games as tools for pedagogical use stem from several sources to include the
following statements:
“the view that the mind is an instrument to be developed rather than a receptacle to be
filled”
“modes of teaching are needed which will help to develop people who are excited about
learning”
“the desire to develop modes of promoting engagement and curiosity”
“the idea that students learn not because learning is a goal in and of itself, but because
learning leads to a goal achievement”
32
“the belief that learners learn to act by acting” in an interactive way.
“students must learn to examine the social world, picking out relevant variables and
examining their nature and consequences”
In discussing why computer games should be used for learning, Mitchell and Savill-
Smith (2004, p.17) presented the following reasons:
With visual and spatial aesthetics games are seductive and provide excitement.
Games motivate via entertainment.
Games provide an interactive environment.
Games provide an immersive experience.
Hays and Singer (1989) discussed potential ways of using games as instructional tools.
They observed that games could be used to provide instructional information on specific
knowledge and skills and could be used to transmit facts, teach skills, and provide insights.
de Freitas and Oliver (2006) stressed the importance of identifying learners specification
when considering using games as a tool. Questions such as: who is the learner? What is their
background and learning history? What are the learning styles and preferences? Who is the
learner group? How can the learner group be best supported? need to be asked to support the use
of gaming tools. The following section will try to address some of these questions in an effort to
understand the characteristics of today’s learning community.
Today’s Learning Community
According to Prensky (Prensky 2001, p. 1-19) learners have changed in some
fundamentally important ways. The majority of the people who are learning today grew up in an
era full of radical changes and innovations in technology. Today’s generation was raised
33
surrounded by an incredible array of new technologies (internet, cellular phones, video games,
laptops …). He believes that one of the reasons educators are not more successful in educating
and training the young workforce is due the fact that “we are working hard to educate a new
generation in old ways.” Statistics show (Rideout et al., 2005) that children between the ages of
8 through 18 spend more than an hour a day using the computer for recreational use with video
games being the top activity. This tremendous amount of time spent playing computer games
during their formative years have led them to be “hard wired” in a different way compared to
previous generations.
According to Abell (2000) trainers need to consider that within the adult learner
population there are nested generational subgroups such as Generation X (born between 1965
and 1976) and Generation Y (born between 1977 and1995). Learners within those generations
tend to have high expectations for the quality of technology-based instruction they receive. Their
needs include the inclination for independent learning experiences that incorporate fast-paced
and visually intensive instruction, frequent interactions with corresponding feedback, and strong
desire to experience a sense of accomplishment. Sacks’s (1998) research found that nearly half
of the college students in his sample valued entertainment as their number one trait in an
instructor. He reiterates that this is due to the fact that Generation X has been engulfed in
entertainment since birth. According to Cohen (as cited by Abell 2000) Generation X prefer fast
paced presentation full of information and with a combination of entertainment. In addition
Generation X wants to receive frequent feedback and a daily sense of accomplishments. They
prefer experiential assignments therefore trainers must use tools that will expose them to
grabbing/sustaining situations allowing learners to react and reflect upon their experiences. In
his research Cohen noted that Generation X prefer visual images in comparison to written word.
34
According to statistics presented, 41 percent of 18-24 year olds did not read a book that was not
required for school. Cohen predicted that Generation Y would present the same characteristics
as Generation X but more intense.
According to Prensky (2001), education can be improved by creating new ways of
learning that will fit with the new generation’s world, style and capabilities. Game based
learning is an alternative that is being used to enhance the learning process that appeals to people
from the “games generation.”
Sixty nine percent of American heads of households play computer and video games
(ESA, 2007). The average game player age is 33 and adult’s gamers have been playing an
average of 12 years and fifty-three percent of game players expect to be playing as much or more
ten years from now than they do today (ESA, 2007).
According to Greenfield as cited by Prensky (2001, p. 20-42) skills developed as a result
of playing video games go far beyond hand-eye coordination skills. Among Greenfield’s
findings:
Playing video games enhances players’ skills at divided attention tasks, such as
monitoring multiple locations simultaneously. Therefore, players get faster at responding
to both expected and unexpected stimuli.
Playing video games augments skills of “rule discovery” through observation, trial and
error, and hypothesis testing, i.e., the thought process behind scientific thinking.
Prensky also eluded to the fact that today’s trainers (mostly in the late 30s, 40s and 50s)
raised in a pre-digital era have a different dynamic when compared to the trainees (20s and early
30s) who have been influenced by interactive technologies such as video and computer games
and the internet. For this generation traditional training and schooling does not engage them.
35
Among his observations, the following are the ten main cognitive style changes that he has
observed in the Games Generation compared to earlier generations:
1. Twitch speed vs. Conventional speed – The Games Generation has more experience
processing information quickly. Trainers should create training experiences that exploits
the ability of twitch speed but at the same time incorporates content that is important and
useful.
2. Parallel processing vs. linear processing – The Game Generation feels more comfortable
doing more than one thing at the same time. Trainers should identify ways to enhance
parallel processing in their training allowing exposure to more information at once.
3. Graphics first vs. text first – The Game Generation has been exposed to high-quality and
highly expressive graphics with little or no accompanying text since childhood. This has
acutely sharpened their visual sensitivity. They find it more natural to begin with visuals
and to mix text and graphics in a richly meaningful way.
4. Random access vs. step-by-step – The ability to hypertext has encourage a less sequential
information structure. This new form of information structure has allowed the Game
Generation to be aware and able to make connections in order to follow infinite paths
instead of restricting them to a single path.
5. Connected vs. standalone – The Games Generation has been raised in an era were
internet connectivity is available anytime, anywhere, at almost no cost. As a result,
Games Generation people are not constraint by their physical location and tend to think
differently about how to get information and solve problems.
6. Active vs. passive – The Game Generation are more fearless when interacting with
software. They are not afraid to explore the capabilities of software in contrast with the
36
previous generation which are more reluctant to interact. Being exposed at an early age to
games, they are use to play with software, hitting every key if necessary, until they figure
out the available features of the software.
7. Play vs. work – The Game Generation has been exposed to many types of logic, spatial
relationships, and other complex thinking tasks that have been embedded in the games
they are used to play since childhood. They are very much an intellectual-problem-
solving oriented generation. Trainers should support the development of new game
interfaces to help the new generation learn in their own cognitive style.
8. Payoff vs. patience – The Game Generation has been exposed to interactions that excel at
giving feedback and the payoff for any action taken is typically extremely clear. This has
led to a huge intolerance on their part for things that don’t pay off at the level expected.
9. Fantasy vs. reality – The Game Generation has been exposed to more realistic graphics.
Current computer capabilities have made possible bringing fantasy to life. Fantasy
elements from the past as well as from the future pervades in their lives. Digital Game-
based learning that incorporate fantasy trades should be incorporated by trainers to
enhance the learning experience.
10. Technology-as-friend vs. technology-as-foe – To the Game Generation computer is a
necessary tool. They grew up using computers to play, relax and have fun. Trainers
should continually seek ways to communicate, transfer information and build necessary
skills via the media (computer and games) this generation willingly engage in.
To succeed in training the Game Generation (Carsten & Beck, 2005), the training
curriculum should be created such that:
37
Leans heavily on trial and error
Includes the opportunity of learning from peers
Allows for people to take risks in a safe environment
Allows for players to achieve a skill that is meaningful and perceived as having value.
Carsten and Beck (2005) reached these conclusions based on the results of a study of
2,500 Americans, mainly business professionals. The group included a wide range of ages,
women as well as men, with all levels of gaming experience. They used questions to explore how
gamers (defined as those who had grown up playing video games) think and feel about their
work compared to non-gamers.
Kirkley, Tomblin and Kirkley (2005) in citing Beck and Wade, the authors of Got Game,
state that there are clear distinction between those who grew up playing video games and those
who did not. According to the authors, the gamers use more open communication methods,
creative problem solving strategies, and take more risk.
For training to be effective, organizations need to adapt their training programs to give
gamers new ways of learning to harvest their potential (Carstens &Beck, 2005) by introducing
more interactive tools.
It has been argued that young Soldiers, those belonging to the “digital” generation, might
respond positively to the introduction of video games in a training environment. Belanich et al
conducted a series of research efforts to investigate this claim. US Army Soldiers across various
ranks were surveyed. They found that “contrary to popular belief” most Soldiers do not engage
in video game play regularly. The authors recommend assessing training audience’s prior
experience with video games before introducing an instructional game in the training
38
environment. In addition Soldiers without experience should be given ample preparatory
practice time before engaging in training that incorporates video games.
Training Effectiveness of Games
For several decades, the benefits of games have been debated (Clark (1983), Kozma
(1994)). Claims that games can increase the motivation and interest of trainees, improvement of
learning and improvement of attitudes towards a particular subject matter are amongst them.
Several authors (Greenblat (1973), Bredemeier and Greenblat (1981), Dorn (1989), Whiteley and
Faria (1989), Leemkuil, Jong, and Ootes (2000), Randel, Morris, Wetzel and Whitehill (1992),
and Mitchell and Savill-Smith (2004)) have presented extensive reviews of the literature on
simulation games for teaching and learning trying to provide a better understanding of those
claims in terms of available empirical data. Recently Hays (2005; 2006) updated those findings
with more recent data.
Greenblat (1973) provided a comprehensive review of claims and evidence for teaching
with simulation games. The two interrelated problems discussed are the following:
Empirical evidence to systematically test claims of favorable outcomes is very limited.
Even though the empirical evidence concerning the consequence of teaching with
simulations is still limited, utilization is spreading rapidly.
In order to research the claims and evidence of games as instructional tools she reviewed
books, published and unpublished articles, newsletters, and advertisements from games’
publishers. She organized the numerous propositions found in her research in six distinct
categories: (a) Motivation and interest, (b) Cognitive learning, (c) Changes in the character of
39
later course work, (d) Affective learning re subject matter, (e) General affective learning, and (f)
Changes in classroom structure and relations.
She found that most of the evidence is largely anecdotal. Few of the reports had followed
systematic testing of the hypotheses hence a lack of empirical evidence. Even though she
indicated that simulation games could deliver effective cognitive and conceptual learning, the
greatest amount of discussion centered in the claim about the increase of motivation and interest,
but still a great deal anecdotal information was provided. In fact she indicated that the cognitive
learning that takes place is “learning of principles and procedural sequences and the acquisition
of referents for concepts rather than factual information” (Greenblat, 1973) She attributed the
lack of support that the data collected provide due to methodological shortcomings of the studies.
Many of the research studies suffered from poor research design:
Lack of pre-test precluded measurement of change
Lack of control groups
Failure to consider Hawthorne effects
Poor criteria for accepting or rejecting hypothesis
Poor sampling techniques – unrepresentative subjects and heterogeneous nature of some
samples (people of differing ages and academic backgrounds)
Lack of control for relevant student characteristics (gamers vs non-gamers)
Wiebenga (2005) expressed that little attempt is being made to conduct empirical
research regarding the effectiveness of games in training resulting in a critical gap between
theory and practice that needs to be addressed.
In his discussion on what are simulation games designed to do and teach, Dorn (1989)
identified the following claims that appeared repeatedly in literature:
40
The use of simulation games will increase student’s motivation to learn and their interest
in learning.
Simulation games can be used to change and improve student’s attitudes toward self,
environment, and classroom learning.
Simulation games will deliver effective cognitive and conceptual learning.
Simulation games can enhance cooperation, interaction, and communication between
students.
Simulation games will change classroom structures by promoting a more relaxed,
friendly, and warm climate
He concluded that after 25 years of evaluation of simulation games, still opinions
regarding its effectiveness varies considerably. According to Dorn, the evidence was considered
to be ambiguous, enthusiastic, impressionistic, and subjective. He agreed with Greenblat’s
(1973) assessment that many reasons for the contradictory and inconclusive results of these
studies is due to methodological flaws in the research evaluation. Dorn alluded to the fact that
cognitive learning takes place in simulation games but it seems to be difficult to specify or
articulate. His assessment of the evaluation research literature can be summarized as “A
substantial amount of consistent research shows that simulation games do increase students’
interest and motivation, that they can be effective in changing some attitudes, and that they are at
least as effective as more conventional pedagogy in teaching cognitive learning” (Dorn 1989).
Dorn believes that simulations are based on the model of experiential learning rather than
on the model of information processing. According to this model, learners first act on a particular
instance of the application, then they attempt to understand the effects of their behaviors and
decisions in that particular instance, then seek to understand the general principles that apply,
41
and finally apply those principles to new circumstances such that the learning is useful in future
context.
Prenski (2001, p. 14) believes that the two factors that make game-based learning a
success are the motivation of the game combined with a learning methodology that “ is fast,
effective, and definitely un-school like”.
Randel, Morris, Wetzel and Whitehill (1992) provided a review of literature comparing
the instructional effectiveness of games to conventional classroom instruction over a period of 28
years. They focused on empirical data instead of teachers judgments. Among the conclusions
they reached based on their research:
Out of the subject areas that they examined (social sciences, math, language arts, logic
physics, biology, retention over time, and interest), math was the one that showed the
greatest percentage of results favoring games as an instructional tool.
Games rated as more interesting compared to conventional instruction.
When trying to demonstrate the effects of games, careful consideration must be given to
the selection of measurements. The test for effectiveness should match what the game is
teaching.
When evaluating games, the experimental designs used must be more rigorous.
Experimental designs should reduce confounding variables such as Hawthorne effects,
teacher biases, different times for treatments, etc.
Subject matter areas where very specific content can be targeted are more likely to show
beneficial effects for gaming.
42
Leemkuil, Jong, and Ootes (2000) conducted a study to examine the theoretical analyses
and empirical results in the area of instructional use of games and simulations. They reviewed 66
studies. A summary of their findings is as follows:
The areas that show beneficial effects for gaming are those were the subject matter have
very specific content that can be targeted and objectives precisely defined.
Simulation/games show greater retention over time than conventional classroom
instruction.
Students reported more interest in simulation and game activities than in more
conventional activities.
They noted that “ The educational goals of games depend on the setting in which they are
used and can be very diverse like: development of consciousness and motivation, training skills,
development of knowledge and insight, training in communication and co-operation, integration
of learning experiences, and assessment. Much of the work on the evaluation of games has been
anecdotal, descriptive or judgmental, but there are some indications that they are effective and
are superior to case-studies in producing knowledge gains. However, there is general consensus
that learning with interactive environments such as games, simulations, and adventures is not
effective when no instructional measures or support is added.”
Mitchell and Savill-Smith (2004) conducted a review of literature on the use of computer
and video games for learning. Among the questions that guided their research the two that are
relevant to this research are:
Why use computer games for learning?
How have computer games been used?
43
On citing Randel, who provided a review of studies done up to 1991 in terms of
effectiveness of games and conventional classroom instruction, he found that there are
differences observed depending on the educational areas were the games were used with best
results found in the areas of math, physics and language arts. According to Randel, simulation
games require active participation which affords opportunities for the learning material to be
integrated into cognitive structures.
Among the conclusions drawn from their research, the beneficial effects of gaming are
most likely to be found when specific content is targeted and the objectives of the training are
specifically defined. In addition, it was also noted that in many studies performed, the students
reported more interest in the game activities than in traditional classroom instruction.
Mitchell and Savill-Smith (2004) concluded that the literature base that addresses the use
of computer games for learning remains small and further research is needed that particularly
focuses on the potential use of computer games for learning by young adults.
de Freitas (2004) found that games and simulations can significantly support
differentiated learning assisting learner groups with diverse learning abilities and approaches.
Her research also found that games and simulations can support learners with skills-based needs.
Spelman (2002) conducted a study to gather empirical evidence on the effectiveness of
simulations in ESL writing instruction. The results showed that the use of simulations proved to
work as well as the traditional method of instruction in increasing the writing competency of
English as Second Language (ESL) composition students and proved superior to the traditional
method in the evaluation of writing samples. Also, the use of simulations proved superior in
lowering anxiety and in increasing the students’ perception of the usefulness of the class.
44
Baxter, Ross, Phillips, Shafer and Fowlkes (2004) conducted a pilot study to examine the
training utility of a game-based tactical decision-making simulation when compared to the
traditional paper-based Tactical Decision Games used in the USMC Infantry Platoon Sergeant
Course. In evaluating the strengths and weaknesses of both approaches, they found that the
approaches were complementary to one another. The game-based instructional tool was superior
on the timing of operations and team coordination while the paper-based intervention enhanced
mental stimulation, planning, and command level decision making. Both trainees and instructors
emphasized the utility of combining both approaches. The game-based intervention was deemed
to have motivational properties when compared to the paper-based intervention, but it was noted
that care must be taken when designing game interfaces such that they are intuitive and require
little learning as possible. They stressed the need for instructor support when using game-based
tools for both exercise control and feedback on student performance.
Hays (2005) conducted a review of literature on instructional games with a focus on the
empirical research on the instructional effectiveness of games. One hundred and five articles
were documented in the report. Of those, 48 articles provided empirical data on the effectiveness
of instructional games. After reviewing the empirical research on the value of games on
instructional effectiveness he concluded that:
Empirical research that has been conducted on instructional games is fragmented since it
includes a gamma of different factors such as different tasks, age groups, and different
types of games. Also the research contains ill-defined terms and methodological flaws.
No evidence was found to indicate that games are the preferred instructional method in
all situations.
45
An instructional game will only be effective if it is design to meet specific instructional
objectives and used as it was intended.
If a game is to be incorporated in a program of instruction, it should include debriefing
and feedback so the learners understand what happened during the game and how the
events and activities of the game support the instructional objectives.
The use of a game should be accompanied with instructional support on how to use the
game. This will allow the learners to focus on the instructional information instead of
focusing on the interfaces and requirements of the game.
Caution should be used when generalizing the results of a study conducted with one age
group to another age group.
Some of the research is biased by the evaluator’s interest in “proving” the effectiveness
of the game specifically if the evaluator is who developed the game.
A lot of the research failed to use control groups that would allow comparison of the
results to other instructional methods.
No clear and detailed description of the instructional game was provided specifically on
characteristics that made it a “game.”
Additionally, Hays stated that “the control of the learning experience is an essential
feature of instruction. Without this control, we cannot be sure that the student learned what is
required from a given instructional product”. He states that instruction as a minimum should
include the following elements:
Specific instructional objectives – these objectives are defined by task requirements.
Meaningful interaction – the learner should have the opportunity to interact with the
instructional content in a meaningful way.
46
Performance Assessment – learner’s performance needs to be assessed to determine if
learning of the intended content occurred.
Feedback – the results of the assessment needs to be presented to the learner in a timely
manner to ensure that correct actions are reinforced and incorrect actions are remediated.
In his summary regarding use of games for health care education (Hays 2005) most of the
studies reviewed did not provide information regarding the instructional effectiveness of the
games. In studies that attempted to collect empirical data failed to include control groups that
would allow comparison of the results to other instructional methods.
Westbrook and Braithwaite (2001) evaluated a web-based educational game on health
care system designed to promote information-seeking skills and collaborative interaction among
students. They conducted the evaluation using pre and post game questionnaires and focus group
discussions. The results demonstrated the effectiveness of the game in improving learning
outcomes. The evaluation only addressed the usability of the game and student achievements of
specific learning outcomes. Transfer of the knowledge was not addressed in the study.
In his master’s thesis Litteral (2005) wanted to explore if computer based learning could
provide deeper synthesis of information than conventional stand and deliver lecture when
considering students from the X Generation. In addition, he hypothesized the following:
Computer game base learning can facilitate more learning styles than traditional lecture
instruction alone.
Computer game based learning motivates students to learn more, with a competitive
game approach to learning.
The initial game based system targeted for the study was the TC3 Simulation. Due to
project delay, the game was not at a maturity level required to perform the evaluation. An
47
alternative simulation system was used to conduct the experiment. Even though the participants
came from the targeted population, bias introduced by the instructors and the lack of time
available for the students to interact with the game did not allowed for conclusive results. In
addition, most of the data was qualitative in nature since it was based on a pass fail criteria that
was based on instructor observation and evaluation of a hands on task. In his summary, Litteral
emphasized the need to conduct more experimentation with special emphasis on quantitative
data.
According to Bae (2002) descriptive characteristics of trainees (personality level,
motivation level, goal level, general aptitude, age, education, and experience level) can influence
training process. He emphasizes the fact that examination of trainee characteristics has great
potential for enhancing the understanding of why training is effective. According to the author,
few studies on trainee characteristics have reviewed variables such as age, educational
qualifications and experience.
Ferdig (2007) identifies the fact that there are still a need for more research in the area of
educational gaming and areas such as students gender, age and race should be looked at as well
as game genres (first person shooter, role-playing, action, adventure, etc.).
Mishra and Foster (2007) reiterate that the claims about games for learning lack
substantial research. They conducted a literature review and found that research should focus on
content, game genre and appropriate populations. They stressed the fact that empirical studies in
authentic settings should be conducted to validate earlier claims. They also emphasized the fact
that content and genre cannot be overlooked in the research. According to the authors, research
should separate game genres and examine what can be learned in them. Large volumes of media
comparison studies indicate that in general no significant difference exists between distance
48
learning and traditional classroom learning (Liu and Schwen, 2006). The authors go to indicate
that those studies lack quality and have inconclusive results. Even though learning preferences
do exist, how much influence they actually have when it comes to learning is unanswered
(Santos 2006).
Amr (2007) argues that educational games can be an effective tool for educational
purpose as long as the game incorporates certain features such as immediate feedback,
interactivity, and sufficient challenge. According to Amr, if the game incorporates too many
multimedia components (for example, adding irrelevant sounds and music) allowing for
distractions will impact negatively the learning outcome. He stressed the need for more research
in the areas of the student’s attitudes towards game, gender, and game skillfulness.
Egenfeldt-Nielsen (2007) conducted research regarding the use of computer games in
education. Of the 20 studies reviewed, even though there was an overwhelming support that
students can learn from games, none of the studies actually compared computer games to other
teaching methods or activities.
According to Rice (2007) computer video games are an emerging instructional medium
that offer strong degree of cognitive efficiencies for experiential learning. Rice (2007) and
Egenfeldt-Nielsen (2007) both agree that even though educational games have shown promise in
an educational setting, research needs to address pedagogical considerations such as: what would
a well-designed educational game look like? In addition since assessment is generally text-based
there is a need to explore questions such as: Can engagement in computer game action lead to
higher text-based achievement?
Concerns that games used for training not necessarily increase knowledge was identified
by Wiebenga (2005). According to the author, the people who play the games are more
49
interested in winning and beating the game than they are to learn and apply new skills. When
trying to evaluate the effectiveness of a game, it is important to understand the target audience.
Participants need to be assessed in terms of:
Attitudes towards the content being taught and the use of games
Knowledge
Motivation
Brown, et al (2005) examined direct and interaction effects of learner’s characteristics
(cognitive ability, prior knowledge, prior experience, and motivation) and classroom
characteristics on learning. They compared traditional classroom instruction with instruction via
videoconferencing. Results suggest that students with low motivation benefited from small and
from non-videoconference classes. Learners with high levels of motivation to learn did not
perform differently across any of the instructional environments. According to the authors
(Brown, et al, 2005), most models of training effectiveness suggest that both situational and
individual factors have effects on training outcomes.
Lessons learned from additional literature in training effectiveness evaluations regarding
methodological inadequacies can be summarized as follows:
Many researchers have underutilized the techniques of randomization, control groups and
control of the treatment variable. (Butler et al, 1988)
When designing test questions for performance evaluation, they need to be phrased
similar to the context presented to the trainer. (Wash, et al, 2006)
When designing an experiment, need to control a block of time that will allow the trainee
to complete both context and game time. (Wash, et al, 2006)
50
One of the variables that should be controlled is the level of entry knowledge. (Wash, et
al, 2006)
Treatment time for both control group and treatment should be the same. (Batchelder and
Rachal, 2000)
When designing the experiment, introduce the game in the same way it is expected to be
used in the program of instruction.(Batchelder and Rachal, 2000)
Hidden variables such as the attitude of trainers towards the game and attitudes of the
trainees towards the instruments used to measure performance can impact the results of
the experiment.(Batchelder and Rachal, 2000)
Summary of Literature Review
The potential of using games to encourage learning has been the focus of many literature
research recently published. Many have tried to answer the question: Can instructional games
encourage learning?
In a quest to find the answer, it was clear that a better understanding of the characteristics
of games used for instructional purposes was needed. A great deal of research has concluded
that games motivate and interest individuals. Many claim that motivation and interest are key
elements in learning. Some of the characteristics that support that motivation and interest
include: interactive, goal oriented, entertainment, competition, immersive, and adaptive.
Another area that needed to be researched was the characteristics of the new generation
of trainees. Several authors identified the need to understand the characteristics, learning
preferences and cognitive styles of the targeted group of learners. It is clear that the generation
of students that has been exposed to innovative technology since their early years tend to have
51
high expectations for the quality of technology-based instruction they receive. Their needs
include the inclination for independent learning experiences that incorporate fast-paced and
visually intensive instruction, frequent interactions with corresponding feedback, and strong
desire to experience a sense of accomplishment.
Finally a review of research done in the area of training effectiveness evaluations using
instructional games was conducted in order to understand the current state of claims and
evidence of games as instructional tools. Most of the evidence presented is anecdotal and
subjective. Data collected to support empirical evidence is flawed due to methodological
shortcomings of the studies.
Research Gap
One statement is prevalent in most of the literature reviewed, that is, that in terms of the
claim that games can improve learning, there is very weak empirical support. Many of the
studies performed in an effort to collect empirical data suffered from poor experimental design.
Some of the shortcomings are the following:
Lack of pre-test precluded measurement of change
Lack of control groups
Failure to consider Hawthorne effects
Poor criteria for accepting or rejecting hypothesis
Poor sampling techniques – unrepresentative subjects and heterogeneous nature of some
samples (people of differing ages and academic backgrounds)
Lack of control for relevant student characteristics (gamers vs. non-gamers)
Lack of instructor support and performance feedback
52
Evaluations performed by developers who are biased towards proving the effectiveness
of the game.
No clear and detailed description of the instructional game used in the evaluation
There is a great deal of emphasis in literature regarding the need to conduct more
experimentation with special emphasis on quantitative data. In particular, further research is
needed that particularly focuses on the potential use of computer games for learning by young
adults. Several authors identified a need for more research in the areas of the student’s attitudes
towards game, gender, age, educational qualifications, experience, student’s attitudes and race,
as well as, game genres. In addition, special focus should be placed on methodology used when
designing the experiment to prevent shortcomings presented in the literature review. It is the
intent of this research to look at the relationships that exist between student’s age, educational
qualifications, experience, and attitudes towards computer games and their performance using a
game based simulation. In addition, the extent to which changes in trainee knowledge, skills and
attitudes transfer back to task related situations will be evaluated. In an effort to draw empirical
results, effectiveness of the simulation will be compared to traditional modes of instruction.
53
CHAPTER THREE: METHODOLOGY
As indicated above, the particular gap in the literature that this research focuses on is the
potential use of computer games as experiential tools for learning by Soldiers who for the most
part are essentially young adults. This includes game genres and student attitudes towards game,
gender, age, educational qualifications, experience, and race. Further this research methodology
is being designed to prevent shortcomings in past research identified in the literature review
above.
Limitations on methodology arise primarily from scope. Limitations result in terms of
evaluation, subjects, and games considered. Each topic is discussed in turn below concluding
with proposed methodology and evaluation approach and protocols.
Training Effectiveness Evaluation Approach
The main purpose of a training program is to impart the acquisition of knowledge, skills,
and competencies. Evaluating a particular training program is a challenging task. In 1959,
Kirkpatrick presented what is today one of the most well known models for training
effectiveness evaluation (Kirkpatrick, 1959). In his model, summarized in Table 1, Kirkpatrick
proposes to evaluate the effectiveness of a training program at multiple levels. Level I, Reaction
Criteria, evaluates the participant’s reaction to the training program, Level II, Learning Criteria,
evaluates if there has been any increase in knowledge or capability as a consequence of
completing the training program, Level III, Behavioral Criteria, evaluates any changes in
behavior on the job as a result of the training program, and Level IV, Results Criteria, evaluates
the effect on the organization resulting from the training program.
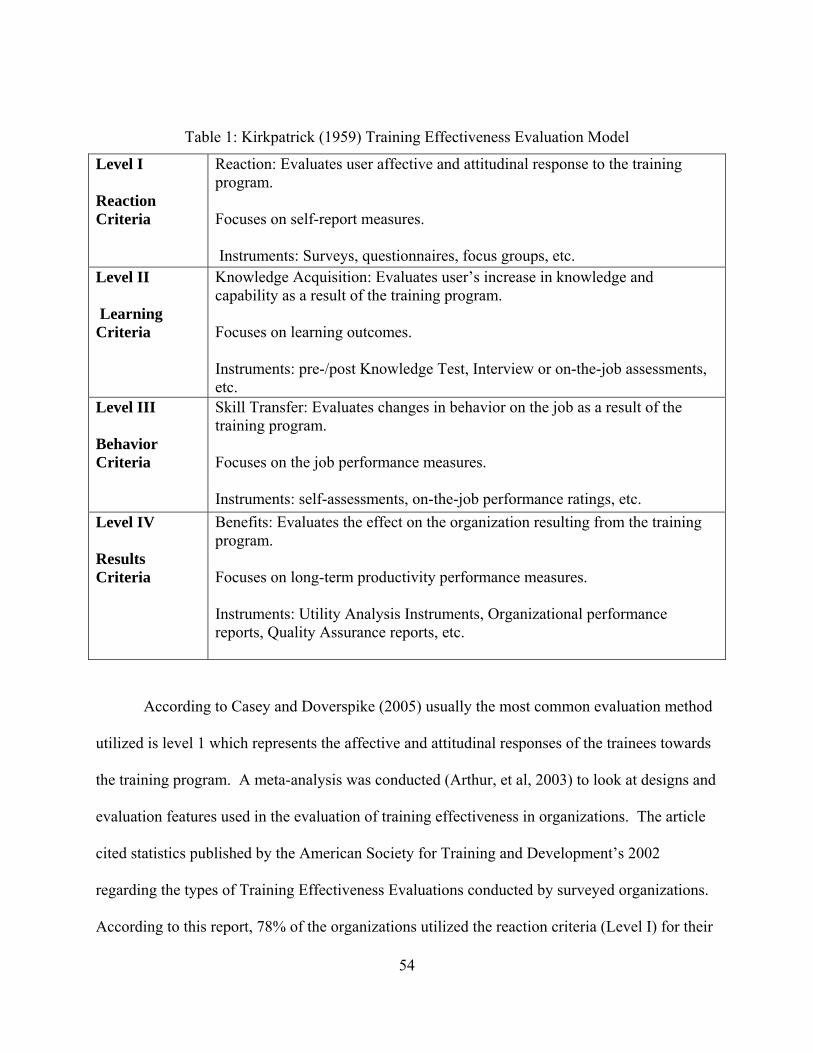
54
Table 1: Kirkpatrick (1959) Training Effectiveness Evaluation Model
Level I Reaction Criteria
Reaction: Evaluates user affective and attitudinal response to the training program. Focuses on self-report measures. Instruments: Surveys, questionnaires, focus groups, etc.
Level II Learning Criteria
Knowledge Acquisition: Evaluates user’s increase in knowledge and capability as a result of the training program. Focuses on learning outcomes. Instruments: pre-/post Knowledge Test, Interview or on-the-job assessments, etc.
Level III Behavior Criteria
Skill Transfer: Evaluates changes in behavior on the job as a result of the training program. Focuses on the job performance measures. Instruments: self-assessments, on-the-job performance ratings, etc.
Level IV Results Criteria
Benefits: Evaluates the effect on the organization resulting from the training program. Focuses on long-term productivity performance measures. Instruments: Utility Analysis Instruments, Organizational performance reports, Quality Assurance reports, etc.
According to Casey and Doverspike (2005) usually the most common evaluation method
utilized is level 1 which represents the affective and attitudinal responses of the trainees towards
the training program. A meta-analysis was conducted (Arthur, et al, 2003) to look at designs and
evaluation features used in the evaluation of training effectiveness in organizations. The article
cited statistics published by the American Society for Training and Development’s 2002
regarding the types of Training Effectiveness Evaluations conducted by surveyed organizations.
According to this report, 78% of the organizations utilized the reaction criteria (Level I) for their
55
evaluation, 32% of the organizations used learning criteria measures (Level II), 9% used
behavioral criteria measures (Level III), and 7% used results criteria measures (Level IV).
Klein (2002) expanded Kirkpatrick’s (1959) four level model of evaluation to include a fifth
level: Societal Consequences. Societal Consequences is the extent to which the intervention
impacts the larger environmental and social systems (Kaufman & Keller, 1994). It is the
objective of this research to evaluate the training effectiveness using a game-based simulation
developed to train combat medics the principles of TC3 tasks following Kirkpatrick’s (1959)
four level model comparing it to multimedia and interactive modes of instruction. The first three
levels will be evaluated: Reaction, Knowledge Acquisition, and Skill Transfer. Once the Soldiers
leave medic training and are assigned to their new duty stations, due to scattering of these medics
to various units around the world, it is extremely difficult to evaluate the impact of organization
performance by the TC3 training program.
Peterson and Arnn (2005) presented a model of human performance that incorporated
self-efficacy and motivation as factors that contributes to Human Performance. The model
presented is the following:
Human Performance = f (self-efficacy X ability X motivation) + situational factors
Where:
Self-efficacy – refers to people’s judgments of their own competence to complete a
specific task. It is the individual’s conviction about his/her ability to successfully execute
a specific task within a given context.
Ability – the capacity to perform some task or cognition. It is a combination of a person’s
talent, learning, and experience. People with lesser talent can still learn a specific ability
through training and practice.
56
Motivation – is the willingness to perform. It could be intrinsic in nature were the
individual is seeking for emotional reward (praise or recognition) or extrinsic in nature
were the individual is seeking a tangible reward (monetary, promotion).
Situational factors –among some of the Situational factors that have a powerful influence
on people’s motivation and their ability to perform and complete a specific task we have:
task-related information, tools and equipment, materials and supplies, task training,
support from others, time availability, and environment.
This model indicates that self-efficacy, ability, and motivation are critical components of
human performance and situational factors also impact performance. In addition to evaluating
training effectiveness up to level III, it is the intent of this research to look at the roles self-
efficacy and motivation play in a game-based environment. It is not within the scope of this
research to validate the model of Human Performance cited above.
Self-efficacy affects the goals people set for themselves, their actions and emotions, their
persistence through difficult tasks and challenges, and their choices and decisions. Self Efficacy
has proven to be an important factor in the area of academic achievement in traditional learning
settings, but its role in e-learning environments is still in its infancy (Hodges 2008). Research
has suggested that people with high self efficacy typically manifest higher confidence levels.
Lanigan’s (2008) research found low correlation between self efficacy and actual skills but
stresses the need to examine self efficacy and skills tests in order to explore more in depth the
relationship between the two. Training quality may affect efficacy since mastery is more likely to
be achieved if the training provides thorough instruction, opportunities to practice to meet stated
standards, with feedback focused on skills learned and goals achieved. Research in various fields
of study has validated the concept of self-efficacy as the foundation for human actions. Further
57
research in this area can provide resources and self-efficacy measures to enhance task
performance (Peterson and Arnn, 2005).
Motivation has been defined as the desire or willingness to engage in a task. Motivation
refers to an individual’s choice to engage in an activity and the intensity of effort or persistence
in that activity. The motivated learners are enthusiastic, focused and engaged. They are
interested in and enjoy what they are doing, they try hard, and they persist over time (Garris,
Ahlers, and Driskell, 2002). Behaviors can be intrinsically or extrinsically motivated and both
play a role in determining how motivated a person in doing a specific task is. However, students
that are intrinsically motivated are more likely to show a higher conceptual understanding of the
material and use more problem solving skills (Green and Sulbaran, 2006). The ultimate goal is to
motivate people not just because an activity is interesting in itself but also because they value the
activity as important.
User Profile
According to Bae (2002) descriptive characteristics of trainees (personality level,
motivation level, goal level, general aptitude, age, education, and experience level) can influence
training process. He emphasizes the fact that examination of trainee characteristics has great
potential for enhancing the understanding of why training is effective. According to the author,
few studies on trainee characteristics have reviewed variables such as age, educational
qualifications and experience. The audience available for this research involves Soldiers
participating in the 68 W Tactical Combat Casualty Care (TC3) Program of Instruction (POI).
This audience typically consists of young, new recruits between the ages of 18 and 21 years of
age and older more experienced medics who have not received TC3 training in their the formal
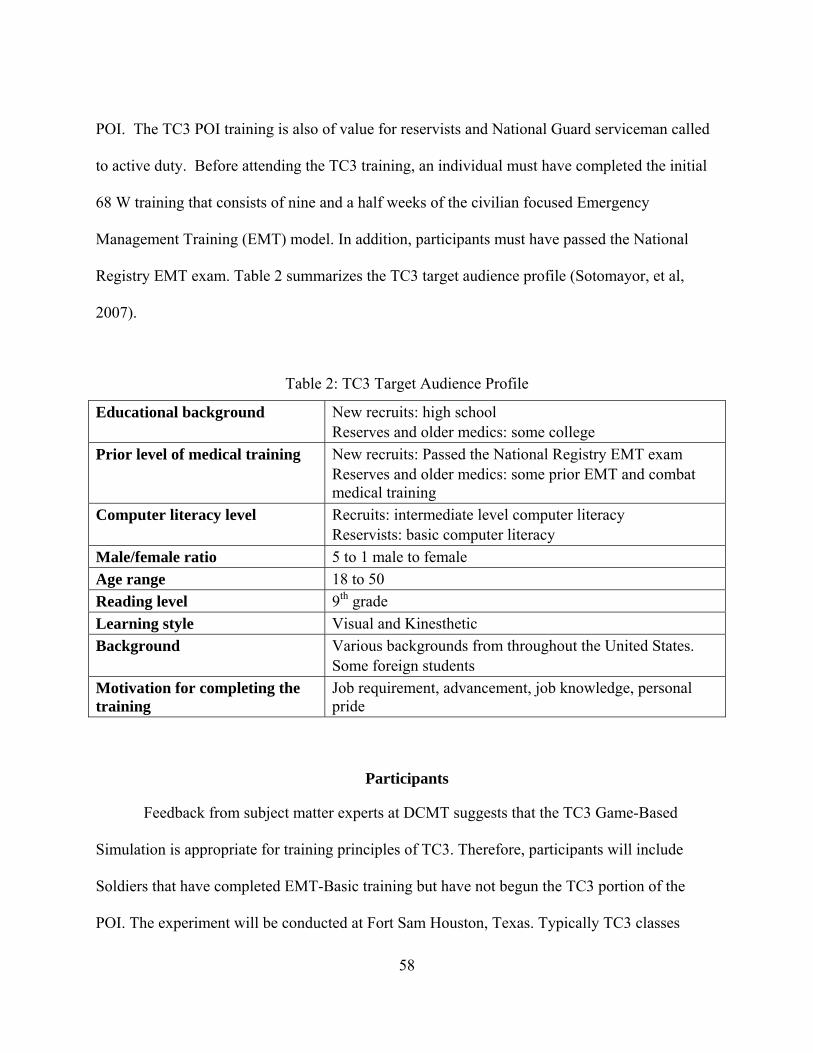
58
POI. The TC3 POI training is also of value for reservists and National Guard serviceman called
to active duty. Before attending the TC3 training, an individual must have completed the initial
68 W training that consists of nine and a half weeks of the civilian focused Emergency
Management Training (EMT) model. In addition, participants must have passed the National
Registry EMT exam. Table 2 summarizes the TC3 target audience profile (Sotomayor, et al,
2007).
Table 2: TC3 Target Audience Profile
Educational background New recruits: high school Reserves and older medics: some college
Prior level of medical training New recruits: Passed the National Registry EMT exam Reserves and older medics: some prior EMT and combat medical training
Computer literacy level Recruits: intermediate level computer literacy Reservists: basic computer literacy
Male/female ratio 5 to 1 male to female
Age range 18 to 50
Reading level 9th grade
Learning style Visual and Kinesthetic
Background Various backgrounds from throughout the United States. Some foreign students
Motivation for completing the training
Job requirement, advancement, job knowledge, personal pride
Participants
Feedback from subject matter experts at DCMT suggests that the TC3 Game-Based
Simulation is appropriate for training principles of TC3. Therefore, participants will include
Soldiers that have completed EMT-Basic training but have not begun the TC3 portion of the
POI. The experiment will be conducted at Fort Sam Houston, Texas. Typically TC3 classes
59
begin every 2 to 3 weeks. Each class consists of approximately 400 students. Voluntary
participation will be requested and participants will be recruited after completing EMT-B. The
current 68 W MOS male to female ratio is approximately 5:1. Similar ratio is expected to be
observed during the experiment. An identification number will be assigned to each participant in
order to protect their privacy. This number will be utilized through the experiment.
As part of the evaluation the participants will be asked to complete a demographics
survey included in Appendix A. Data regarding educational level, age, gender and experience
will be collected to be analyzed.
Instructional Media
TC3 training has three defined media sets available for instruction: (1) Multimedia: Self-
paced, Power Point with Video Clips (2) Interactive: Self-served, computer-based courseware,
and (3) Experiential: Self-served, computer-based, interactive courseware with simulation game.
These media sets can be mixed and matched to supplement one another. Each media set is
discussed in turn below.
Multimedia: TC3 Traditional Power Point Training
The traditional TC3 training consists of power point based training on three subjects of
tactical combat casualty care: Hemorrhage Control, Airway Management, and Breathing. The
material presented in the power point training was adapted from current training materials
obtained from instructors at Fort Sam Houston. Video Clips are embedded in the PowerPoint to
demonstrate procedures and provide additional content related information. In the current
program of instruction at DCMT an instructor utilizes the PowerPoint slides to facilitate delivery
60
of TC3 principles. Normally the slides are not available to the students for their individual use.
They are used by the instructor as a tool to deliver instruction.
Interactive: TC3 Courseware
The TC3 interactive courseware provides knowledge, skills, and practice of TC3
principles. It was developed as distant learning tool to support sustainment training. Soldiers
have the capability to download the courseware from the Joint Knowledge Online (JKO)
website. JKO is a portal system sponsored by the United States Joint Forces Command that
utilizes advanced distributed learning technology to deliver courseware and learning tools to
support training of individual warfighters. Each module discusses in detail the Tactical Field
Care principles and operations in the areas of tactical field care and care under fire. A variety of
interactive presentation methods and screen layouts have been incorporated in the TC3
Courseware in order to simulate a classroom setting with effective immediate feedback from the
instructor.
The basic interface consists of video player-like function keys at the bottom of the screen.
The user can move forward by clicking the “forward” arrow on the extreme right. To move to the
previous screen, the user must click the “back” arrow located on the extreme left. The user has
the capability to pause and return to play using the “play/pause” button or can replay using the
“replay” button. The user can also go to a specific screen by specifying the screen number. See
Figure 5 for the interface buttons.
Hyperlinks are used to present more in depth information regarding a specific topic.
Special ‘explore-it’ screens allow the user to click an image or roll over text to display additional
information in the form of images, video, or text. Figure 6 shows the yellow text box that pops

61
up when the mouse pointer is rolled over “endotracheal intubation” as an example of the
interactivity built within the courseware.
Figure 5: Interface Buttons

62
Figure 6: Text Box Pop-up
A “Your Thoughts” screen was integrated into the courseware. This feature provides the
ability to enter the user’s thoughts on a particular issue and then compare it to TC3 doctrine.
Figure 7 demonstrates a Short Answer question: The slide shown is actually the one right after
the question was answered. Notice that the user’s answer from the previous slide can be recalled
to compare it with the correct answer. Multiple choice activities provide the user with situations
or questions where he or she must use acquired knowledge or previous experience to select from
a set of choices. The user must select the answer by left click on the answer and click on the
submit button. See Figure 8 for an example of a Multiple Choice question. Every question is
provided with a response immediately after it is answered. If questions are answered incorrectly,

63
the program will automatically skip to the previous relevant few slides to explain the correct
answer.
Figure 7: Short Answer Question

64
Figure 8: Multiple-Choice Question
At the end of each module the user is presented with Lesson-level quizzes with two to
five questions. These questions are related to the identified learning objectives. The courseware
automatically provides immediate feedback and remediation based on user inputs to the system.
See Figure 9 for an end-of-lesson quiz question.
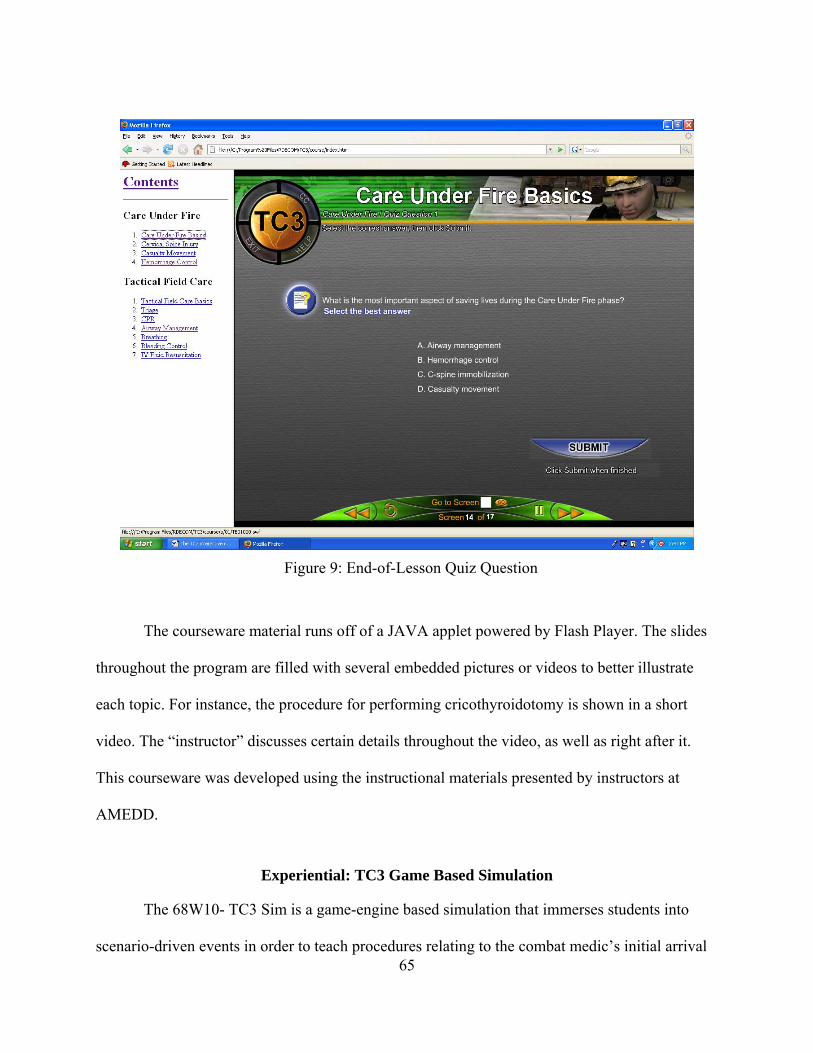
65
Figure 9: End-of-Lesson Quiz Question
The courseware material runs off of a JAVA applet powered by Flash Player. The slides
throughout the program are filled with several embedded pictures or videos to better illustrate
each topic. For instance, the procedure for performing cricothyroidotomy is shown in a short
video. The “instructor” discusses certain details throughout the video, as well as right after it.
This courseware was developed using the instructional materials presented by instructors at
AMEDD.
Experiential: TC3 Game Based Simulation
The 68W10- TC3 Sim is a game-engine based simulation that immerses students into
scenario-driven events in order to teach procedures relating to the combat medic’s initial arrival
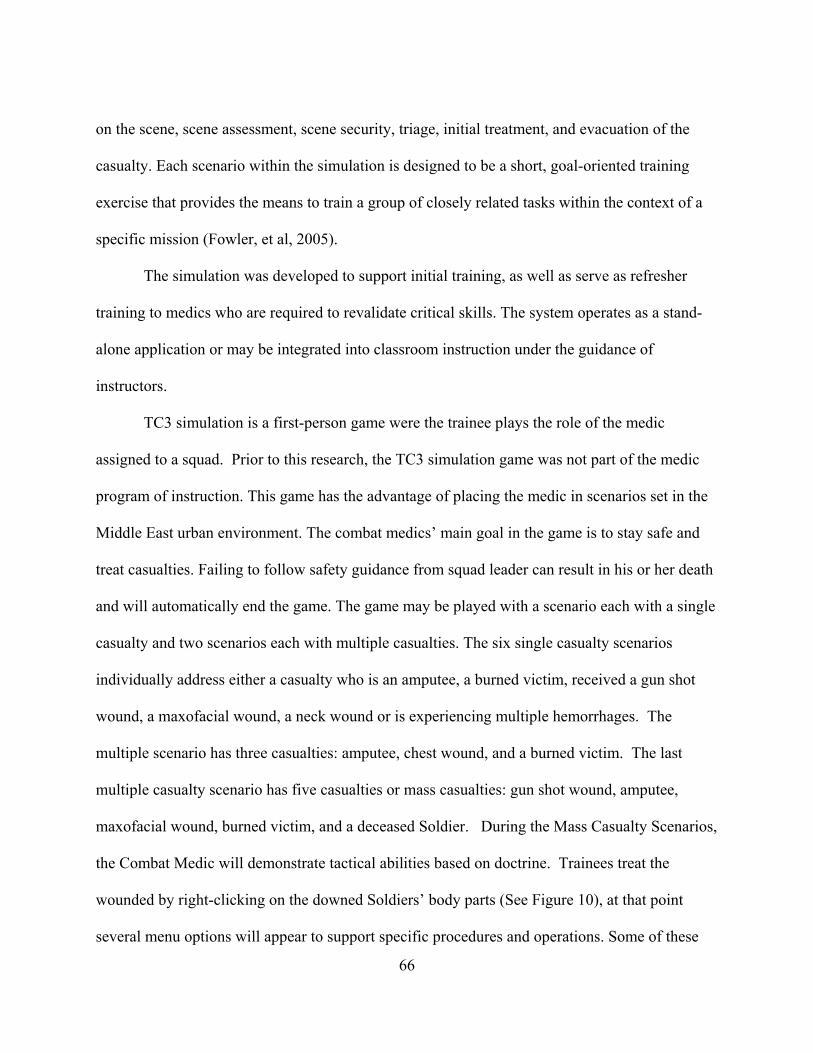
66
on the scene, scene assessment, scene security, triage, initial treatment, and evacuation of the
casualty. Each scenario within the simulation is designed to be a short, goal-oriented training
exercise that provides the means to train a group of closely related tasks within the context of a
specific mission (Fowler, et al, 2005).
The simulation was developed to support initial training, as well as serve as refresher
training to medics who are required to revalidate critical skills. The system operates as a stand-
alone application or may be integrated into classroom instruction under the guidance of
instructors.
TC3 simulation is a first-person game were the trainee plays the role of the medic
assigned to a squad. Prior to this research, the TC3 simulation game was not part of the medic
program of instruction. This game has the advantage of placing the medic in scenarios set in the
Middle East urban environment. The combat medics’ main goal in the game is to stay safe and
treat casualties. Failing to follow safety guidance from squad leader can result in his or her death
and will automatically end the game. The game may be played with a scenario each with a single
casualty and two scenarios each with multiple casualties. The six single casualty scenarios
individually address either a casualty who is an amputee, a burned victim, received a gun shot
wound, a maxofacial wound, a neck wound or is experiencing multiple hemorrhages. The
multiple scenario has three casualties: amputee, chest wound, and a burned victim. The last
multiple casualty scenario has five casualties or mass casualties: gun shot wound, amputee,
maxofacial wound, burned victim, and a deceased Soldier. During the Mass Casualty Scenarios,
the Combat Medic will demonstrate tactical abilities based on doctrine. Trainees treat the
wounded by right-clicking on the downed Soldiers’ body parts (See Figure 10), at that point
several menu options will appear to support specific procedures and operations. Some of these
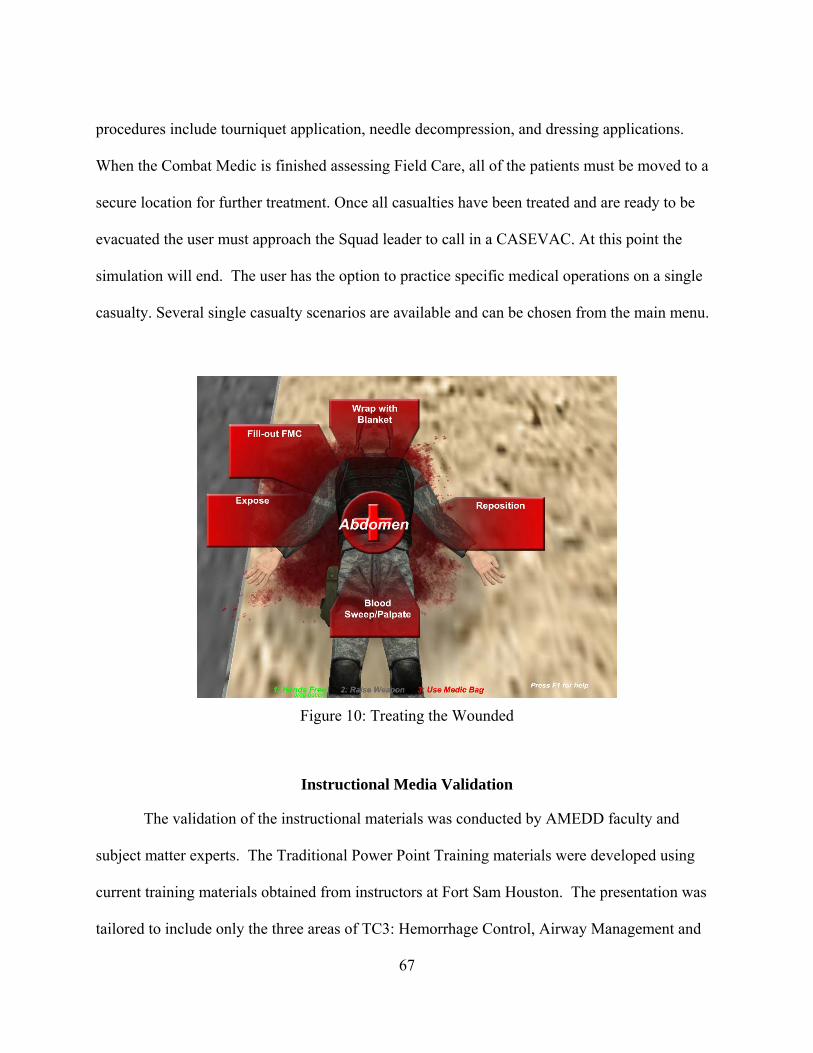
67
procedures include tourniquet application, needle decompression, and dressing applications.
When the Combat Medic is finished assessing Field Care, all of the patients must be moved to a
secure location for further treatment. Once all casualties have been treated and are ready to be
evacuated the user must approach the Squad leader to call in a CASEVAC. At this point the
simulation will end. The user has the option to practice specific medical operations on a single
casualty. Several single casualty scenarios are available and can be chosen from the main menu.
Figure 10: Treating the Wounded
Instructional Media Validation
The validation of the instructional materials was conducted by AMEDD faculty and
subject matter experts. The Traditional Power Point Training materials were developed using
current training materials obtained from instructors at Fort Sam Houston. The presentation was
tailored to include only the three areas of TC3: Hemorrhage Control, Airway Management and
68
Breathing. The presentation was reviewed by a faculty member for content validation. The
material presented in the TC3 Courseware was validated through its development. Several
design reviews were conducted as part of the courseware development with AMEDD subject
matter experts to ensure validity of the content presented. The TC3 Game-Based Simulation
validation was conducted in phases. The first prototype was evaluated by both instructors and
students at Fort Sam Houston. Feedback on the content and interfaces were documented and
prioritized based on available resources, changes were incorporated, and a second evaluation was
conducted with instructors to validate the simulation. Feedback from experienced medics and
trainers suggests the TC3 Sim, at the current stage of development, is appropriate for training the
fundamentals of TC3.
Methodology
The main objective of this training effectiveness evaluation is to evaluate the
effectiveness of the TC3 Game-Based Simulation in supporting the learning of tactical combat
casualty care principles. This study will examine three levels of Kirkpatrick’s Model: User
Reaction (Level 1), Knowledge Acquisition (Level 2), and Skills Transfer (Level III). The
experimental study will be conducted at AMEDD, Ft. Sam Houston, Texas. The experimental
study will be preceded by a pilot study also to be conducted at Ft. Sam Houston. The following
is an outline of the effort followed by a description of the activities under each phase:
1. Pilot Study – To collect preliminary data using the materials and procedures designed for
the TEE and to validate the instruments and make any necessary adjustments to materials
and procedures before the formal event.
2. Experimental Study
69
a. Independent Variables – Training Type (Three Experimental Groups – Power
point based TC3 Training (currently used in the Program of Instruction), TC3
Computer-Based Courseware and a third condition in which participants receive
TC3 Computer-Based Courseware and Game-Based Simulation). The block of
time available for training will be the same for the three experimental groups.
b. Dependent Variables – reaction scores, pre/post test scores, gain scores, transfer
task score, self-efficacy scores, and motivation scores.
c. Participants – Soldiers attending the 68W training at Fort Sam Houston, Texas,
assigned randomly to three experimental groups.
d. Materials
i. Adult Informed Consent Form (Appendix A).
ii. Demographic Survey (Appendix B) – The questionnaire will obtain
participant specific information regarding, e.g., gender, age, yrs in medical
MOS w/in army, previous civilian medical experience, amount and type of
gaming experience, education, and race.
iii. Traditional PowerPoint Training of material covered in the TC3 course.
iv. TC3 Computer-Based Courseware – Computer based presentation of three
modules: Hemorrhage Control, Airway Management, and Breathing.
v. TC3 Game-Based Simulation Training – Computer based presentation of
three modules (Hemorrhage Control, Airway Management, and Breathing)
and TC3 game based training scenarios with single casualties
corresponding to the material covered in the courseware.
70
vi. Pre/Post Tests (Appendices C and G) – Two versions available to avoid
potential learning effects of the pre-test.
vii. Timing and Activities Form (Appendices D, E, and F) – to collect user
content training time, game time, and activities engaged after completing
required content training. The forms are specific to the type of training:
PPT, Courseware, and Courseware/Game.
viii. Reaction Surveys (Appendices H and J) to collect subjective reaction to
training experience and perceived self-efficacy after going through the
training and completing the transfer task.
ix. Transfer Scenario (Appendix I) – Paper and pencil based scenarios.
x. Motivation Survey (Appendices K, L, and M) – Trainee Self Report
Questionnaires designed to obtain subjective trainee self reports of
intrinsic and extrinsic motivation.
e. Procedures
i. Completely Randomized Experimental Design – Participants assigned
randomly to one of the three training conditions: PPT, Courseware, and
Courseware/Game.
ii. Location: Ft. Sam’s Learning Resource Labs and classrooms.
iii. Groups using the courseware and game-based simulation will receive a
familiarization training consisting of a tutorial for interaction with the
courseware and simulation. Participants will also have access to a usability
guide for the simulation that will define the function keys required to
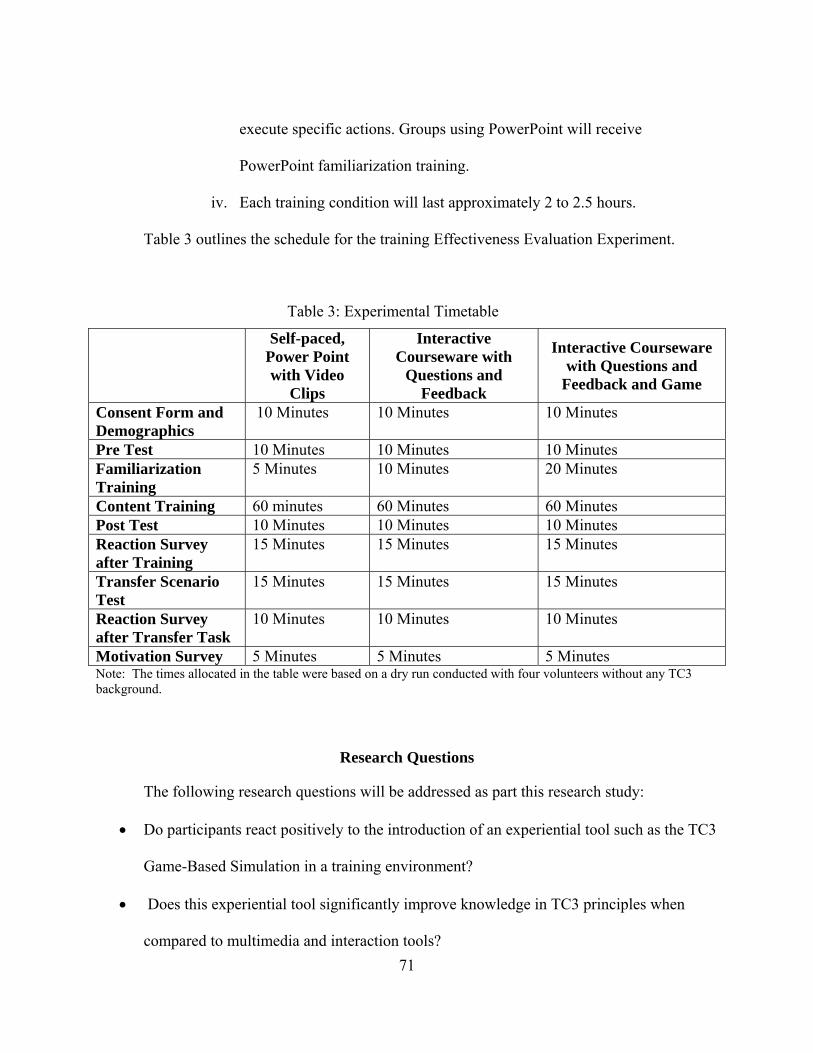
71
execute specific actions. Groups using PowerPoint will receive
PowerPoint familiarization training.
iv. Each training condition will last approximately 2 to 2.5 hours.
Table 3 outlines the schedule for the training Effectiveness Evaluation Experiment.
Table 3: Experimental Timetable
Self-paced, Power Point with Video
Clips
Interactive Courseware with
Questions and Feedback
Interactive Courseware with Questions and
Feedback and Game
Consent Form and Demographics
10 Minutes 10 Minutes 10 Minutes
Pre Test 10 Minutes 10 Minutes 10 Minutes Familiarization Training
5 Minutes 10 Minutes 20 Minutes
Content Training 60 minutes 60 Minutes 60 Minutes Post Test 10 Minutes 10 Minutes 10 Minutes Reaction Survey after Training
15 Minutes 15 Minutes 15 Minutes
Transfer Scenario Test
15 Minutes 15 Minutes 15 Minutes
Reaction Survey after Transfer Task
10 Minutes 10 Minutes 10 Minutes
Motivation Survey 5 Minutes 5 Minutes 5 Minutes Note: The times allocated in the table were based on a dry run conducted with four volunteers without any TC3 background.
Research Questions
The following research questions will be addressed as part this research study:
Do participants react positively to the introduction of an experiential tool such as the TC3
Game-Based Simulation in a training environment?
Does this experiential tool significantly improve knowledge in TC3 principles when
compared to multimedia and interaction tools?
72
Does this experiential tool significantly improve critical thinking skills?
Does this experiential tool significantly enhance trainee self efficacy?
Does this experiential tool significantly enhance trainee intrinsic and extrinsic
motivation?
Research Hypotheses
The research hypotheses derive from the research questions discussed above. Measuring
reaction is the first step in evaluating training effectiveness (Kirkpatrick (1959), Kaufman and
Keller (1994), Wiebenga (2005)). Reaction to training will be assessed with the following
proposed hypothesis:
Do participants react positively to the introduction of an experiential tool such as the TC3
Game-Based Simulation in a training environment?
o H1: Reaction score for the TC3 Game-Based Simulation training group will be
significantly higher than reaction scores for other training treatment groups.
One method used for measuring knowledge change, i.e. knowledge gained by participants
as a consequence of the training intervention (Kirkpatrick’s Level II), is the administration of pre
and post tests (Dimitrov and Rumrill 2003, Wiebenga 2005). Knowledge Acquisition will be
addressed with the following hypotheses:
Does the TC3 Game-Based Simulation training significantly improve training
knowledge?
o H2: Knowledge post test scores for the TC3 Game-Based Simulation training
group will be significantly higher than their knowledge pretest scores.
73
o H3: Pre-post test gain scores for the TC3 Game-Based Simulation training group
will be significantly higher than Pre-post test gain scores for other TC3 training
treatment groups.
o H4: Content training time for the TC3 Game Based Simulation training group will
be significantly less that the content training time for other TC3 training treatment
groups.
According to Wiebenga (2005) the best way to ensure transfer of knowledge
(Kirkpatrick’s Level III) is to make sure the game incorporates situations that are close to what
they are encountered in a job or task related situation. Skills transfer will be assessed using a
paper and pencil based scenario exercise that incorporates job related tasks and will be
administered after training. The following hypothesis addresses skill transfer:
Does TC3 Game-Based Simulation training significantly improve critical thinking skills?
o H5: Transfer Scenario test scores for the TC3 Game-Based Simulation training
group will be significantly higher than Transfer Scenario test scores for other TC3
training treatment groups.
In addition, Wiebenga (2005) states that both the participant’s attitude towards the
content being taught as well as the game used needs to be evaluated. Therefore, in addition to
evaluating training effectiveness up to level III, the roles self efficacy and motivation play in a
game-based environment will be assessed with the following hypotheses:
Does TC3 game based Simulation significantly enhance trainee self-efficacy?
o H6: Self-Efficacy scores for the TC3 Game-Based Simulation training group will
be significantly higher than self-efficacy scores for other TC3 training treatment
groups.
74
Does TC3 game based Simulation significantly enhance trainee intrinsic and extrinsic
motivation?
o H7: Intrinsic Motivation scores for the TC3 Game-Based Simulation training
group will be significantly higher than Intrinsic Motivation scores for other TC3
training treatment groups.
o H8: Extrinsic Motivation scores for the TC3 Game-Based Simulation training
group will be significantly higher than Extrinsic Motivation scores for other TC3
training treatment groups.
TC3 Training
All participants will be administered a pre-test prior to TC3 training. Participants will be
randomly assigned to one of three training treatment groups: Power point based TC3 Training
(currently used in the Program of Instruction), TC3 Computer-Based Courseware and a third
condition in which participants receive TC3 Computer-Based Courseware and Game-Based
Simulation. A number will be assigned to each participant to protect their privacy. The TC3
Courseware and the TC3 Game-Based Simulation training groups will receive familiarization
training which will consist of a brief tutorial for interaction with the courseware and the game-
based simulation. The TC3 Courseware and the TC3 Game-Based Simulation training groups
will also have access to a usability guide which will define the keys required to execute specific
actions. A computer/power point familiarization period will be provided to the Power point
based TC3 Training group. All groups will be provided with training in three areas of TC3:
Hemorrhage Control, Airway Management and Breathing. Although TC3 training obviously
includes more than these three topic areas, given the scope of the evaluation and resources
75
available, a selection of topics critical to 68 W job performances was necessary. In order to select
the modules for the experiment, subject matter expertise from AMEDD was consulted. Another
consideration taken into account was the fact that the TC3 game based simulation contains
training scenarios involving single casualties with injuries corresponding to the material
available in the selected courseware modules. The TC3 Game-Based Simulation training group
will complete single casualty scenarios in the game. In the scenarios, the trainee will assume the
role of a combat medic assigned to a light infantry squad operating in an urban environment
somewhere in the Middle East. After training the group will be asked to complete a post-test,
reaction and motivation surveys, and paper and pencil based scenarios.
Level 1 Evaluation: User Reaction to the TC3 Training
In order to measure user reaction to the TC3 training, the groups will be asked to provide
feedback via survey questionnaires after completing the training. The groups will be asked to
provide feedback on three different areas: Overall Student Reaction to Training Treatment,
Learning Benefit of each Training Treatment, and Usability of the System used by each Training
Treatment.
Overall Reaction
In order to assess the overall reaction to the TC3 training, participants in each group will
be asked to rate the training on a 1 to 5 Likert Scale (1=Poor, 2=Fair, 3=Good, 4=Very Good,
and 5=Excellent) based on their experience with the assigned TC3 training treatment (see
Appendix H).
76
Benefit to Training
Benefit to training will be assessed in two different dimensions: Learning objectives met
and inclusion of the training instructional media in the current POI.
To assess reaction to instructional media being effective in incorporating training
objectives, participants in each group will be asked to provide feedback using a 1 to 5 Likert
Scale (1=Strongly Disagree, 2=Disagree, 3=Neutral, 4=Agree, and 5=Strongly Agree) for six
training objectives in the areas of hemorrhage control, airway management, and breathing (see
Appendix H).
In order to assess reaction regarding inclusion of the training instructional media in the
current program of instruction, participants in each group will be asked to provide feedback
using a Likert Scale from 1 to 7 (1= “Not at all” agree, 4 = “Somewhat” agree, and 7 = “Very
Much” agree with the assertion) based on their experience using the instructional media. See
Appendices K, L, and M: Question number 6.
System Usability
The usability of an interactive system can be defined, in part, in terms of how easily a
user can access and use the intended functionality of the system to meet task objectives.
Interactive systems should be designed such that they are intuitive, effective, and subjectively
acceptable to users (Nielsen 1993)]. System usability will be assessed in two different
dimensions: Ease of use and Need for Instructor Support.
In order to assess reaction regarding ease of use, each group will be asked if the training
was clear and easy to follow. Participants in each group will be asked to provide feedback using
77
a 1 to 5 Likert Scale (1=Strongly Disagree, 2=Disagree, 3=Neutral, 4=Agree, and 5=Strongly
Agree). See Appendix H.
In order to assess reaction regarding the need for instructor support to make the TC3
training beneficial to them, participants in each group will be asked to provide feedback using a
Likert Scale from 1 to 7 (1= “Not at All” agree, 4 = “Somewhat” agree, and 7 = “Very Much”
agree with the assertion) based on their experience using the instructional media. See Appendices
K, L, and M: Question number 5.
Level II Evaluation: Knowledge Acquisition with the TC3 Training
Level II skills acquisition will be evaluated by examining changes between pre and post
training test scores. Pre-tests will be administered in order to determine if any differences exist
between the experimental groups regarding prior to training knowledge. One of the main goals of
this research is to determine if the use of instructional games enhances the acquisition of
knowledge. Dependent variables that will be examined are pre training test score, post training
test score, and a pre/post training gain score. All training content, as well as, the pre and post
tests were reviewed by AMEDD faculty to ensure content validity.
Subjects with Traditional Power Point Training
The experimental group with traditional power point training will have a power point
familiarization overview prior to conducting the training. The group will have one hour to
complete the training on the three main areas of TC3: Hemorrhage Control, Airway Management
and Breathing. After training is completed, participants in the group will be asked to take a post
test.
78
Subjects with TC3 Courseware Training
The experimental group with courseware training will have a courseware familiarization
overview prior to conducting the training. The group will have one hour to complete three
modules of the interactive courseware: Hemorrhage Control, Airway Management and
Breathing. After training is completed, participants in the group will be asked to take a post test.
Subjects with TC3 Courseware and Game Based Simulation Training
The experimental group with courseware and game based simulation training will have
an interface familiarization overview prior to conducting the training. In addition, a usability
guide will be provided for reference on how to use the different function keys in the simulation.
The group will have one hour to complete the training on the three main areas of TC3
(Hemorrhage Control, Airway Management and Breathing) as well as playing the game. The
participants in the group will complete three single scenarios that correspond to the content
covered. After action review will be provided after completing each single scenario. After
training is completed, participants in the group will be asked to take a post test.
Level III Evaluation (Transfer) to TC3 Sim
According to Hardre and Chen (2005) transfer is the ability to extend or apply learned
knowledge and skills to various situations. Learning experiences produce differential effects on
memory and transfer processes. Transfer depends on: initial learning (specifically deep level
understanding) of the domain of application and the match between elements in the learning and
performance situations. Information delivery and practice to support transfer and development
interact with individual differences (in particular prior knowledge and strategies). The transfer
of skills to other task related situations will be evaluated by examining post training performance
79
on another simulation. Idealistically, the evaluation of skills transfer should have been done in a
field training exercise, but constraints in resources (not enough SMEs to evaluate performance
per individual) and the necessary amounts of subjects to conduct appropriate data analysis is
beyond the scope of this effort. Instead of evaluating Soldier’s performance on a field exercise, a
TC3 paper and pencil based scenario provided by AMEDD subject matter experts will be
utilized. The participants in all treatment groups will be asked to read two TC3 scenarios and
answer eleven questions. A transfer task score will be calculated based on percentage of correct
answers.
Self-Efficacy Evaluation
In an effort to study the role of self efficacy in student’s performance in a game based
environment, participants in each training group will be ask to answer questions on perceived
self efficacy as part of the reaction surveys (Appendices H and J) after training and after
completing the transfer task.
After completing the training and post test, participants in each group will be asked if
they felt confident that they would be able to perform back on the job the tasks associated with
the training objectives in the area of Hemorrhage Control, Airway Management and Breathing.
They will be asked to provide feedback using a 1 to 5 Likert Scale (Strongly Disagree = 1,
Disagree = 2, Neutral = 3, Agree =4, and Strongly Agree = 5). See Appendix H.
After completing the transfer task scenarios, participants in each group will be asked if
they felt that the training enabled them to complete the scenarios and apply the principles
associated to the training objectives. They will be asked to provide feedback using a Likert Scale
80
from 1 to 5 (Strongly Disagree=1, Disagree=2, Neutral=3, Agree=4, and Strongly Agree=5). See
Appendix J.
Motivation Evaluation
As part of the Motivation Survey (Appendices K, L, and M) 4 statements were included
to gather data regarding intrinsic and extrinsic motivation. Two of the statements assess intrinsic
motivation (i.e. the learner engages in an activity because it is interesting or enjoyable) and the
other two assess extrinsic motivation (i.e. the learner engages in the activity because he or she
desires the outcome and values it as important). The statements were taken from The Intrinsic
Motivation Inventory (IMI) survey instrument. IMI is a multidimensional measurement device
intended to assess participant’s subjective experience related to a target activity in an
experimental setting. The questionnaire was developed by Edward L. Deci, and Richard M. Ryan
and is based on the Self-Determination Theory. The instrument is a seven-point Likert Scale
survey that assesses seven different constructs that are attributed to motivation. The constructs
assessed include 1) Interest/Enjoyment, 2) perceived competence, 3) effort/importance, 4)
pressure/tension, 5) perceived choice, 6) value/usefulness, and 7) relatedness. The validity and
reliability of this instrument have been established and past research suggests that inclusion or
exclusion of specific subscales does not affect its reliability or validity (Deci & Ryan, 2005).
The statements were selected from the two constructs that are relevant to this study:
Interest/Enjoyment and value/usefulness.
After completing the training, participants in each group will be asked to answer two
questions to assess intrinsic motivation (Appendices K, L, and M; Question number 1 and 2).
They will be asked to provide feedback using a Likert Scale from 1 to 7 (1= “Not at All” agree, 4
81
= “Somewhat” agree, and 7 = “Very Much” agree with the assertion) based on their experience
using the assigned training media.
In addition to measuring intrinsic and extrinsic motivation it is important to look at other
characteristics of motivated learners such as interest and persistence. As part of this research the
time the user spent on task will be collected as a possible indication of motivation for all
treatments, as well as, the number of iterations a user chooses to go through the training. For the
experimental group that will be doing the courseware and game training the time spent going
over the courseware and the time spent playing the game will be collected. Also, for the group
playing the game it will be of benefit to collect the number of iterations a user goes through the
game (playing different scenarios).
Evaluation
The sample size required for this study is being estimated using Power Analysis. Using a
power analysis table (Cohen,1992) it is anticipated that for a medium effect size, alpha level of
0.5, for the intervention to achieve power of .8 the minimum sample size required is 52
participants per treatment group. Each incoming class at AMEDD contains approximately 400
trainees. Since participation in the study is voluntary and resources to conduct the experiment are
limited, it is expected that the required sample size will be obtained from multiple classes.
Pilot Test Results
A pilot Study was conducted to validate the instruments, coordinate resources, and make
any necessary changes to materials and procedures. The main purpose of the pilot study was to
finalize logistics in preparation for the TEE. The Pilot Test was conducted on March 19, 2008 at
the Department of Combat Medic Training in Fort Sam Houston, Texas. A total of 30 Soldiers
82
participated during the pilot test. Ten Soldiers were assigned to each experimental group:
Traditional PowerPoint training, TC3 Courseware training, and TC3 Courseware/Game Based
Simulation Training.
Resources
The main purpose of the pilot test was to dry run the test protocols to include procedures
and materials and to assess and coordinate the resources needed for the formal TEE. Fort Sam
Houston has several Learning Research Centers (LRCs) that have approximately 60 computers
each available for training. Early assessment of the resources identified the fact that the
computers could not support running the Game. Coordination to send 20 laptops to support the
TEE was accomplished prior to the pilot test. The original plan for the formal TEE prior to the
pilot test was to run each session with 60 computers: 20 Gaming laptops to support the TC3
Courseware/Game Based Simulation Training, 20 computers from LRC1 to support Traditional
PowerPoint training and 20 computers from the LRC2 to support TC3 Courseware training. Each
session would accommodate 20 Soldiers per treatment. Three sessions were deemed appropriate
to collect the necessary amount of data points (at least 156 per Power Analysis) to support data
analysis.
During the pilot test ten computers were set up to support the experiment. Since each
condition had slightly different instructions and familiarization procedures, the data was
collected over three sessions each corresponding to the type of training. The first condition was
Traditional PowerPoint training followed by the TC3 Courseware condition, and ending with the
TC3 Courseware/Game Based Simulation Training. During coordination with Fort Sam
management, two important issues were identified: only one LRC would be available to support
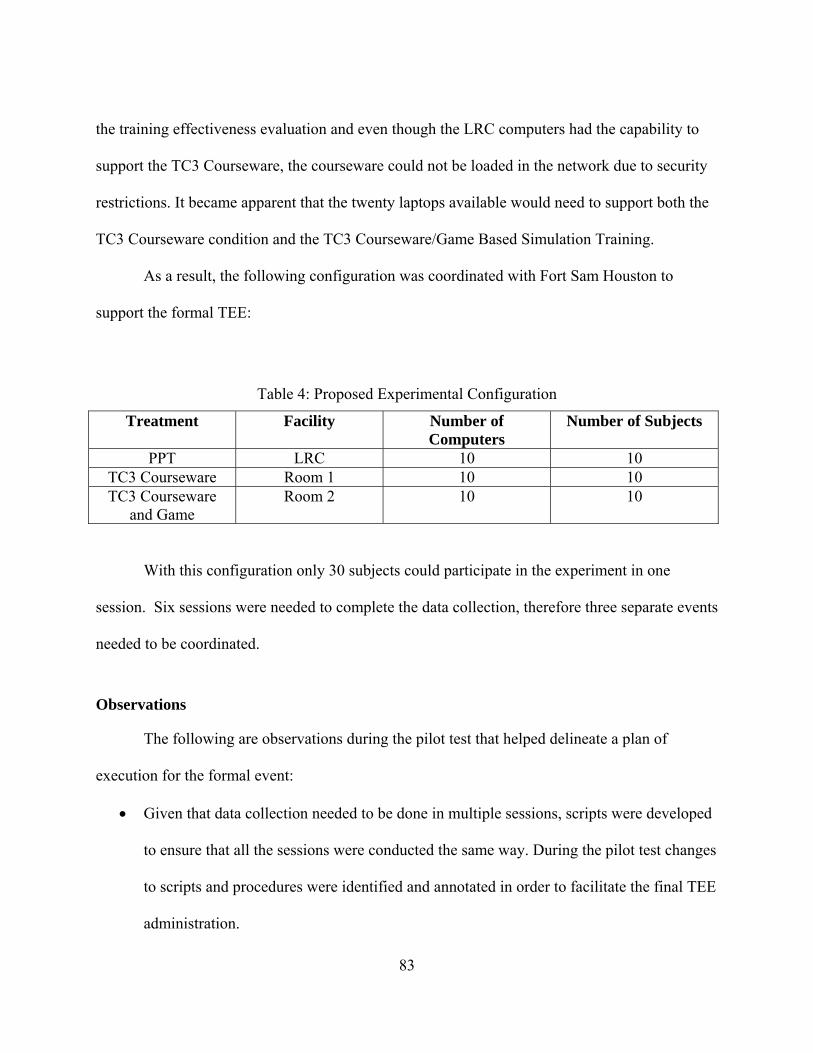
83
the training effectiveness evaluation and even though the LRC computers had the capability to
support the TC3 Courseware, the courseware could not be loaded in the network due to security
restrictions. It became apparent that the twenty laptops available would need to support both the
TC3 Courseware condition and the TC3 Courseware/Game Based Simulation Training.
As a result, the following configuration was coordinated with Fort Sam Houston to
support the formal TEE:
Table 4: Proposed Experimental Configuration
Treatment Facility Number of Computers
Number of Subjects
PPT LRC 10 10 TC3 Courseware Room 1 10 10 TC3 Courseware
and Game Room 2 10 10
With this configuration only 30 subjects could participate in the experiment in one
session. Six sessions were needed to complete the data collection, therefore three separate events
needed to be coordinated.
Observations
The following are observations during the pilot test that helped delineate a plan of
execution for the formal event:
Given that data collection needed to be done in multiple sessions, scripts were developed
to ensure that all the sessions were conducted the same way. During the pilot test changes
to scripts and procedures were identified and annotated in order to facilitate the final TEE
administration.
84
Due to the aggressive POI that the combat medics currently have to complete, the
window of opportunity provided by Fort Sam to access the Soldiers for the experiment is
one day per training class. On this day the Soldiers take their EMT-Basic exam in the
morning. In that day access to the students were granted mid morning and early
afternoon. 30 Soldiers could complete the training in the morning and 30 students could
complete another session in the afternoon. Plans were made to complete data collection
in three separate visits to Fort Sam.
During the pilot some of the Soldiers communicated that they were asked to volunteer to
play a 20 min video game. It was clear that coordination with the trainers that were
responsible to recruit participants needed to be done to ensure that they communicate the
objective of the study more clearly.
The experiment was somewhat tedious on participants. Fatigue was an obvious factor
and this could affect the results of the experiment.
Lessons Learned
Since each condition has slightly different instructions and familiarization procedures, the
experiment needs to be conducted in three separate rooms – one condition per room.
Due to the tight schedule, a minimum of 6 people are needed to conduct the TEE with
adequate support. Dry runs need to be conducted to bring the research team up to speed
on what they should expect from the event as well as assign responsibilities.
Coordination of the experiment needs to be done at all levels to include recruiting
personnel. This is important to ensure volunteer participation and to better manage
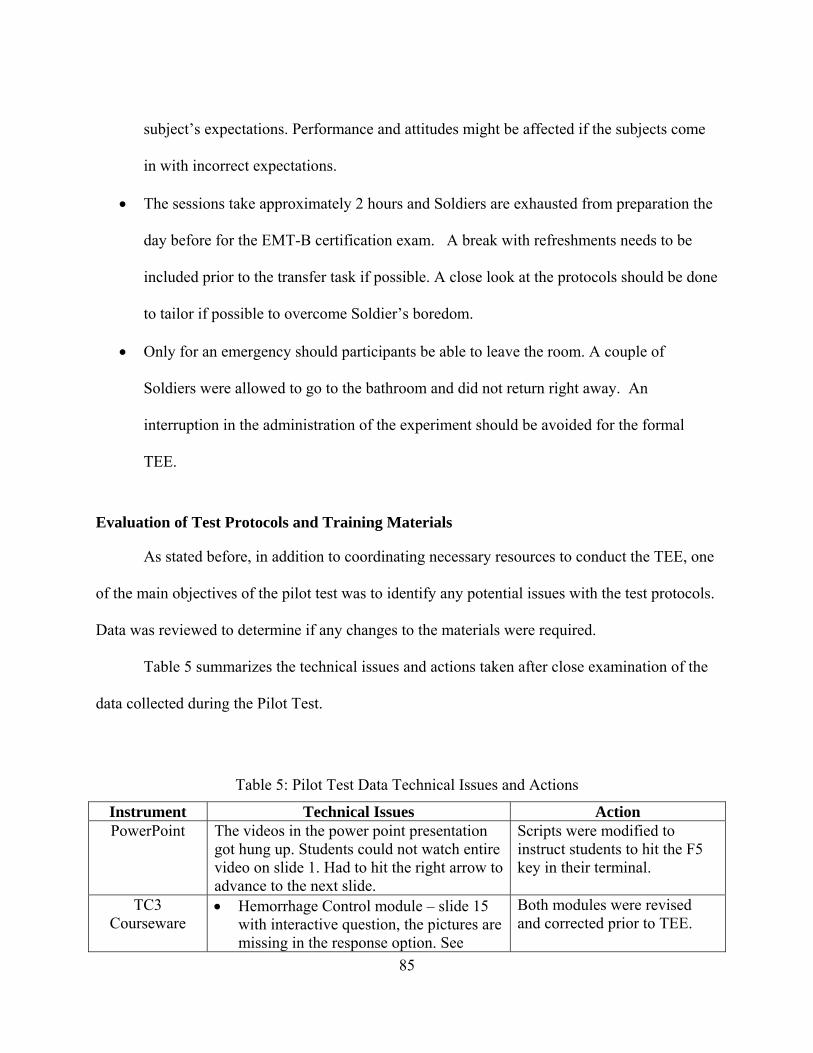
85
subject’s expectations. Performance and attitudes might be affected if the subjects come
in with incorrect expectations.
The sessions take approximately 2 hours and Soldiers are exhausted from preparation the
day before for the EMT-B certification exam. A break with refreshments needs to be
included prior to the transfer task if possible. A close look at the protocols should be done
to tailor if possible to overcome Soldier’s boredom.
Only for an emergency should participants be able to leave the room. A couple of
Soldiers were allowed to go to the bathroom and did not return right away. An
interruption in the administration of the experiment should be avoided for the formal
TEE.
Evaluation of Test Protocols and Training Materials
As stated before, in addition to coordinating necessary resources to conduct the TEE, one
of the main objectives of the pilot test was to identify any potential issues with the test protocols.
Data was reviewed to determine if any changes to the materials were required.
Table 5 summarizes the technical issues and actions taken after close examination of the
data collected during the Pilot Test.
Table 5: Pilot Test Data Technical Issues and Actions
Instrument Technical Issues Action PowerPoint The videos in the power point presentation
got hung up. Students could not watch entire video on slide 1. Had to hit the right arrow to advance to the next slide.
Scripts were modified to instruct students to hit the F5 key in their terminal.
TC3 Courseware
Hemorrhage Control module – slide 15 with interactive question, the pictures are missing in the response option. See
Both modules were revised and corrected prior to TEE.

86
Instrument Technical Issues Action screenshot in Figure 11.
Airway Mgmt – slide 21. Participant selected ‘B’ When unable to obtain an airway. And feedback read… ‘Great job! The NPA is the best standard airway…’ This is not the correct feedback. See screenshot in Figure 12.
TC3 Game This condition seemed pretty intense for participants. During the Pilot test this was the last condition and was done late in the afternoon. Need to assess if this is related to the amount of material? Length of time? Time of day?
A decision was made to only run two sessions per day of training, one in the morning and one in early afternoon. All the conditions per session will be done in parallel.
A video to introduce the interface of the game was created to help students familiarize with the tool.
A hand on practice using the burn victim scenario was added as part of the familiarization training to make sure each Soldier got familiar with the interface before doing their content training.
Consent Form Realized that a couple of Soldiers were younger than 18 years of age. Per IRB direction, subjects need to be 18 years or older.
Scripts were modified to address the age of the subjects and excuse any person younger than 18.
Demographics When asked how many hours they spent playing games and in the computer on a typical week most of the Soldiers reported spending no time even though they considered themselves at the intermediate or expert levels. Soldiers reported that they have been on intense training for several months and might not have access to computers.
When asked for Duty Position most of them answered “68 W” which is their current MOS.
The question was change to read “ Thinking over the last six months”
Duty Position Question was deleted from Survey as it does not provide meaningful information.
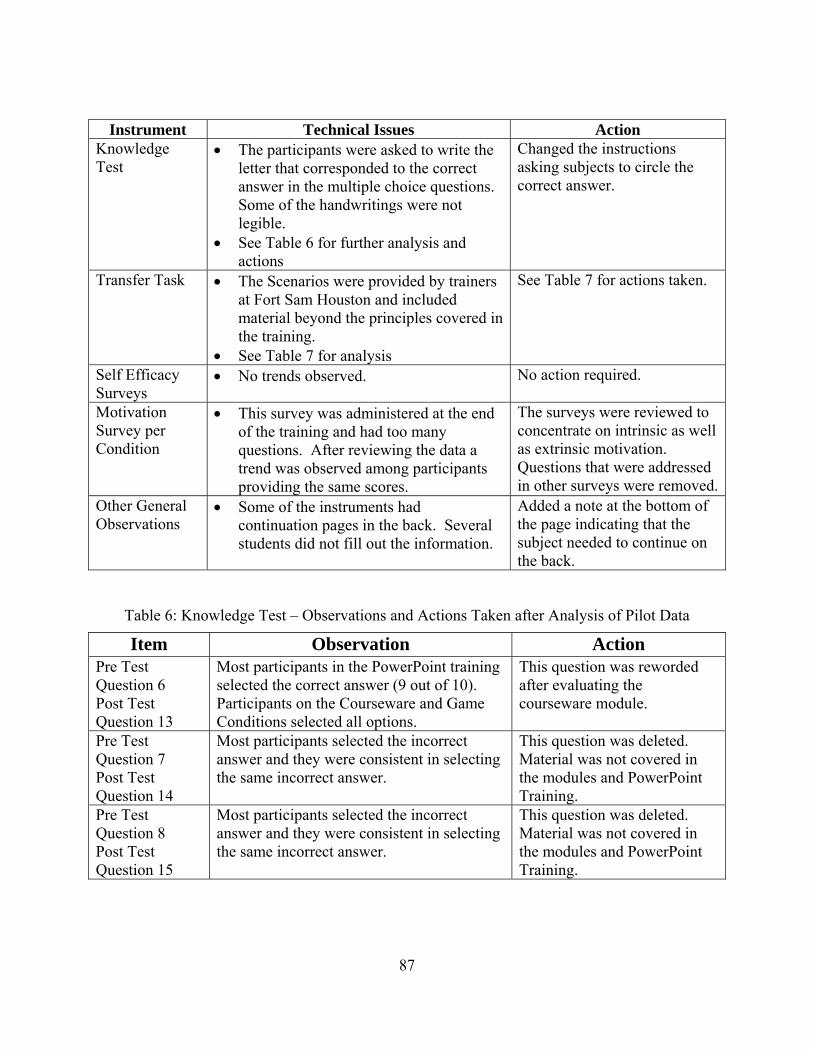
87
Instrument Technical Issues Action Knowledge Test
The participants were asked to write the letter that corresponded to the correct answer in the multiple choice questions. Some of the handwritings were not legible.
See Table 6 for further analysis and actions
Changed the instructions asking subjects to circle the correct answer.
Transfer Task The Scenarios were provided by trainers at Fort Sam Houston and included material beyond the principles covered in the training.
See Table 7 for analysis
See Table 7 for actions taken.
Self Efficacy Surveys
No trends observed. No action required.
Motivation Survey per Condition
This survey was administered at the end of the training and had too many questions. After reviewing the data a trend was observed among participants providing the same scores.
The surveys were reviewed to concentrate on intrinsic as well as extrinsic motivation. Questions that were addressed in other surveys were removed.
Other General Observations
Some of the instruments had continuation pages in the back. Several students did not fill out the information.
Added a note at the bottom of the page indicating that the subject needed to continue on the back.
Table 6: Knowledge Test – Observations and Actions Taken after Analysis of Pilot Data
Item Observation Action Pre Test Question 6 Post Test Question 13
Most participants in the PowerPoint training selected the correct answer (9 out of 10). Participants on the Courseware and Game Conditions selected all options.
This question was reworded after evaluating the courseware module.
Pre Test Question 7 Post Test Question 14
Most participants selected the incorrect answer and they were consistent in selecting the same incorrect answer.
This question was deleted. Material was not covered in the modules and PowerPoint Training.
Pre Test Question 8 Post Test Question 15
Most participants selected the incorrect answer and they were consistent in selecting the same incorrect answer.
This question was deleted. Material was not covered in the modules and PowerPoint Training.
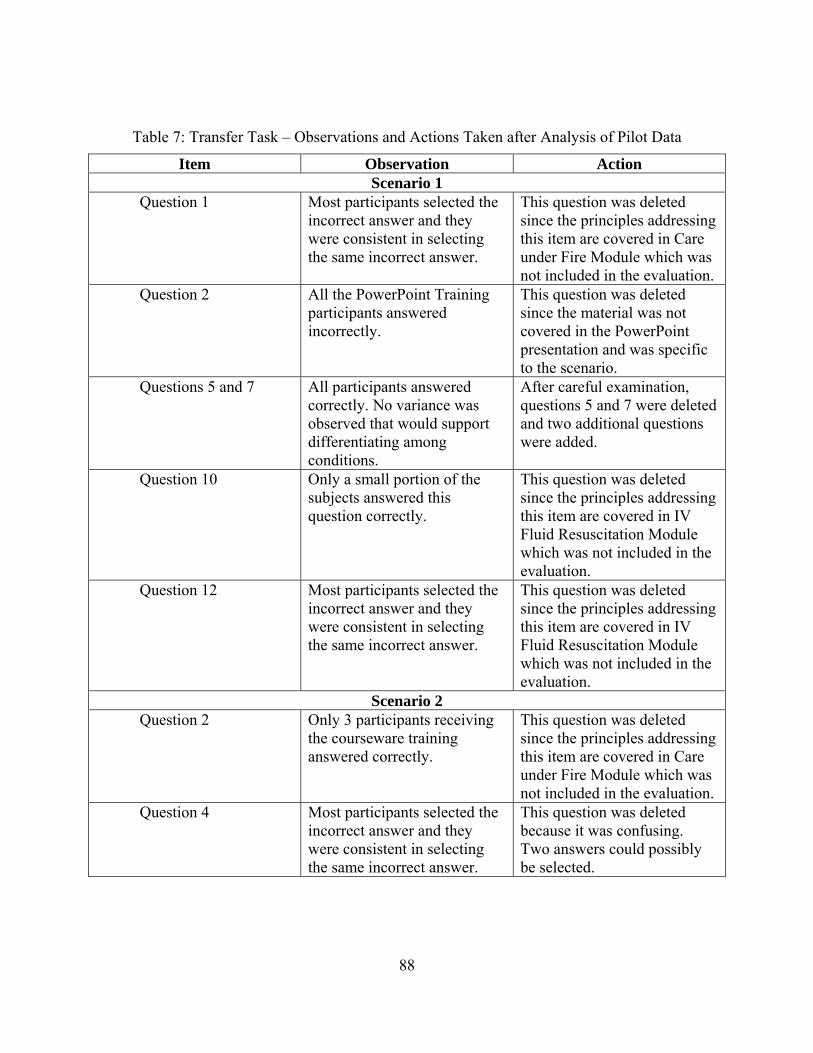
88
Table 7: Transfer Task – Observations and Actions Taken after Analysis of Pilot Data
Item Observation Action Scenario 1
Question 1 Most participants selected the incorrect answer and they were consistent in selecting the same incorrect answer.
This question was deleted since the principles addressing this item are covered in Care under Fire Module which was not included in the evaluation.
Question 2 All the PowerPoint Training participants answered incorrectly.
This question was deleted since the material was not covered in the PowerPoint presentation and was specific to the scenario.
Questions 5 and 7 All participants answered correctly. No variance was observed that would support differentiating among conditions.
After careful examination, questions 5 and 7 were deleted and two additional questions were added.
Question 10 Only a small portion of the subjects answered this question correctly.
This question was deleted since the principles addressing this item are covered in IV Fluid Resuscitation Module which was not included in the evaluation.
Question 12 Most participants selected the incorrect answer and they were consistent in selecting the same incorrect answer.
This question was deleted since the principles addressing this item are covered in IV Fluid Resuscitation Module which was not included in the evaluation.
Scenario 2 Question 2 Only 3 participants receiving
the courseware training answered correctly.
This question was deleted since the principles addressing this item are covered in Care under Fire Module which was not included in the evaluation.
Question 4 Most participants selected the incorrect answer and they were consistent in selecting the same incorrect answer.
This question was deleted because it was confusing. Two answers could possibly be selected.
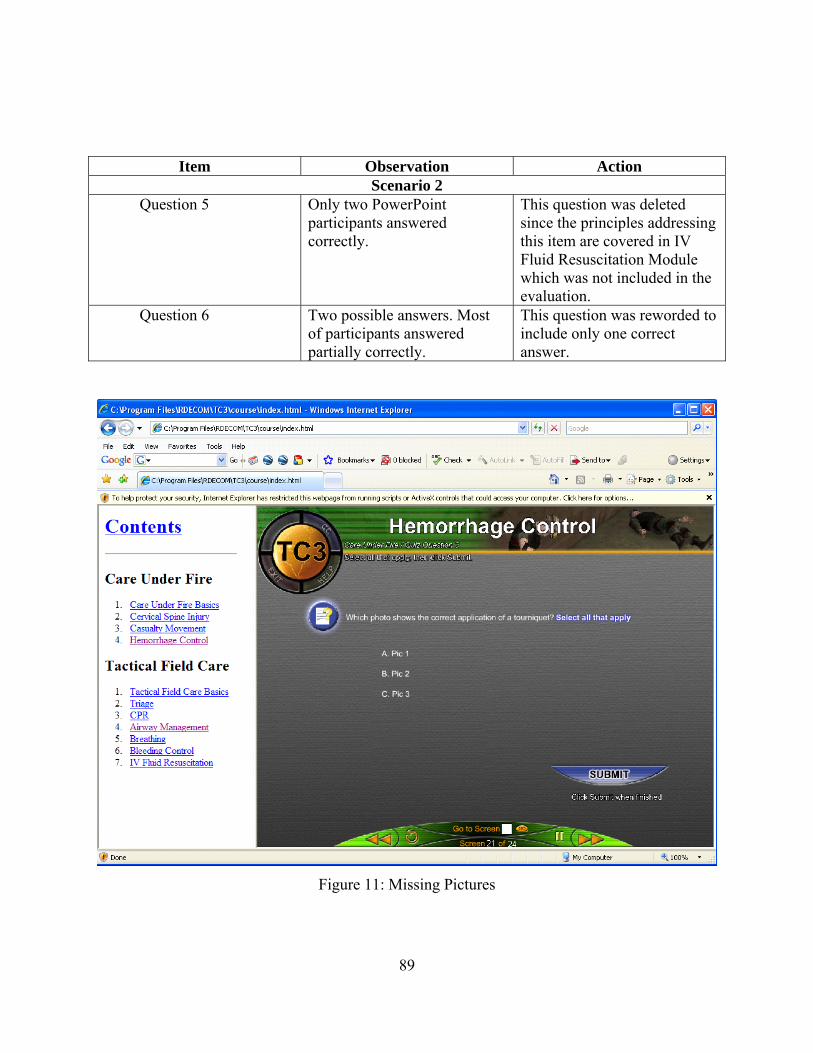
89
Item Observation Action Scenario 2
Question 5 Only two PowerPoint participants answered correctly.
This question was deleted since the principles addressing this item are covered in IV Fluid Resuscitation Module which was not included in the evaluation.
Question 6 Two possible answers. Most of participants answered partially correctly.
This question was reworded to include only one correct answer.
Figure 11: Missing Pictures
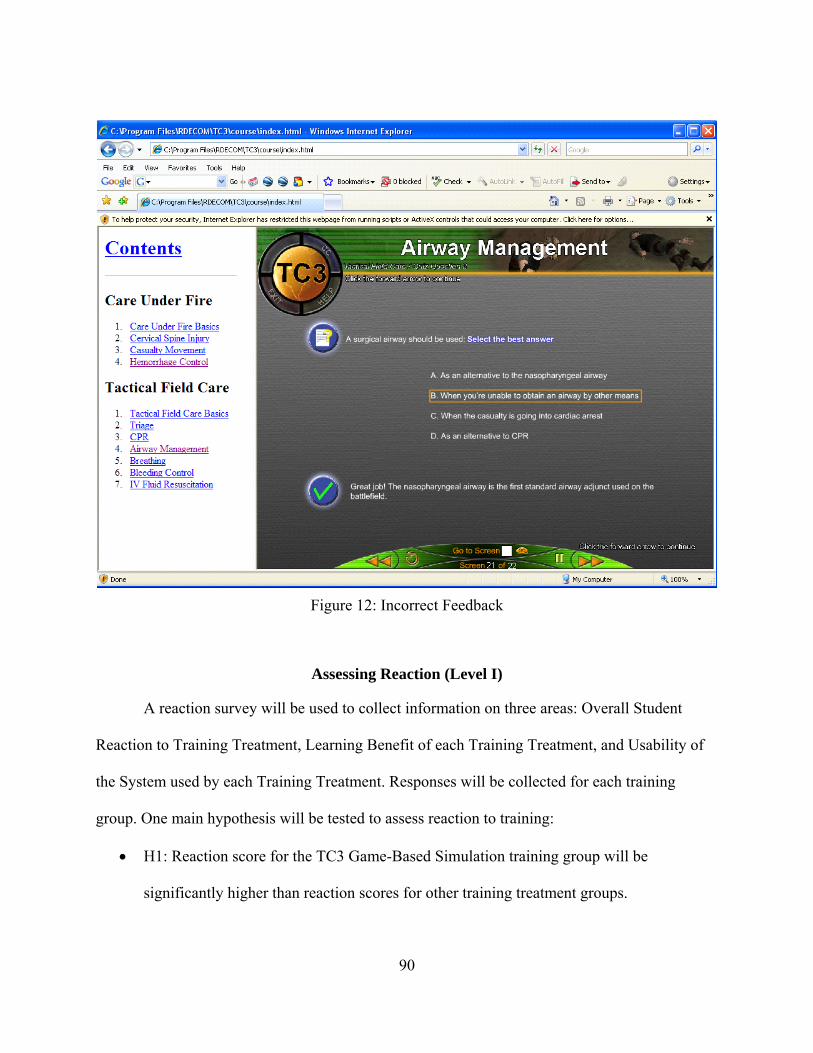
90
Figure 12: Incorrect Feedback
Assessing Reaction (Level I)
A reaction survey will be used to collect information on three areas: Overall Student
Reaction to Training Treatment, Learning Benefit of each Training Treatment, and Usability of
the System used by each Training Treatment. Responses will be collected for each training
group. One main hypothesis will be tested to assess reaction to training:
H1: Reaction score for the TC3 Game-Based Simulation training group will be
significantly higher than reaction scores for other training treatment groups.
91
To test H1, a one-way ANOVA for completely randomized designs will be performed to
determine if reaction scores for the TC3 Game-Based Simulation training group are significantly
higher that reaction scores for other training treatment groups. The relationship of the reaction
scores to performance on post test and transfer task will be investigated. In addition,
relationships between these variables and prior experience, gender, and age will be examined.
Pearson correlation analysis will be performed to explore the relationship between these
variables.
Assessing Knowledge Acquisition (Level II)
Two main Hypotheses will be tested to assess if the TC3 Game-Based simulation
significantly improve post training knowledge and decision-making skills. Another hypothesis
will be tested to explore content training time between training treatments:
H2: Knowledge post test scores for the TC3 Game-Based Simulation training group will
be significantly higher than their knowledge pretest scores.
H3: Pre-post test gain scores for the TC3 Game-Based Simulation training group will be
significantly higher than pre-post test gain scores for other TC3 training treatment
groups.
H4: Content training time for the TC3 Game-Based Simulation training group will be
significantly less than the content training time for other TC3 training treatment groups.
To test H2, a one-way ANOVA for completely randomized designs will be performed to
determine if pre test scores significantly differ from post test scores for the TC3 game based
simulation group. To test H3, either Analysis of Variance (ANOVA) or Analysis of Covariance
(ANCOVA) using pre-tests as covariates are appropriate statistical methods for comparing
92
groups were there is both pre-test and post-test data (Dimitrov and Rumrill, 2003). According to
the authors, when using completely randomized designs, ANCOVA can reduce error variance
and could guard against systematic bias. If after the analysis, we fail to reject H3, a t-test or one
way ANOVA will be used to test differences between training treatment groups. The hypothesis
testing will be done with pre-post training gain scores. The same analysis will be done to test H4.
Assessing Skill Transfer (Level III)
One hypothesis will be tested in order to assess if the TC3 Game-Based Simulation
transfer to performance outside of the TC3 game based simulation training scenarios:
H5: Transfer Scenario test scores for the TC3 Game-Based Simulation training group will
be significantly higher than Transfer Scenario test scores for other TC3 training treatment
groups.
To test H5, a one-way ANOVA for completely randomized designs will be performed to
determine if transfer scores the TC3 Game-Based Simulation training group significantly differs
from transfer scores for participants receiving other TC3 training treatments. The hypothesis
testing will be done with transfer task scores obtained from the transfer task paper and pencil
scenarios.
Assessing Self Efficacy
One hypothesis will be tested in order to assess if the TC3 Game-Based Simulation
training system significantly enhances trainee self-efficacy:
H6: Self-Efficacy scores for the TC3 Game-Based Simulation training group will be
significantly higher than self-efficacy scores for other TC3 training treatment groups.
93
To test H6, a one-way ANOVA for completely randomized designs will be performed to
determine if there are any significant differences in self efficacy scores between treatments. The
hypothesis testing will be done with self-efficacy scores obtained after training and after
completion of the transfer task paper and pencil scenarios.
Assessing Motivation
Two main hypotheses will be tested to assess intrinsic and extrinsic motivation:
H7: Intrinsic Motivation scores for the TC3 Game-Based Simulation training group will
be significantly higher than Intrinsic Motivation scores for other TC3 training treatment
groups.
H8: Extrinsic Motivation scores for participants receiving TC3 Game-Based Simulation
training will be significantly higher than Extrinsic Motivation scores for other TC3
training treatment groups.
To test H7 and H8, a one-way ANOVA for completely randomized designs will be
performed to determine if there are any significant differences in intrinsic and extrinsic
motivation scores between treatments. The hypothesis testing will be done with intrinsic and
extrinsic motivation scores obtained from responses to the Motivation Survey.
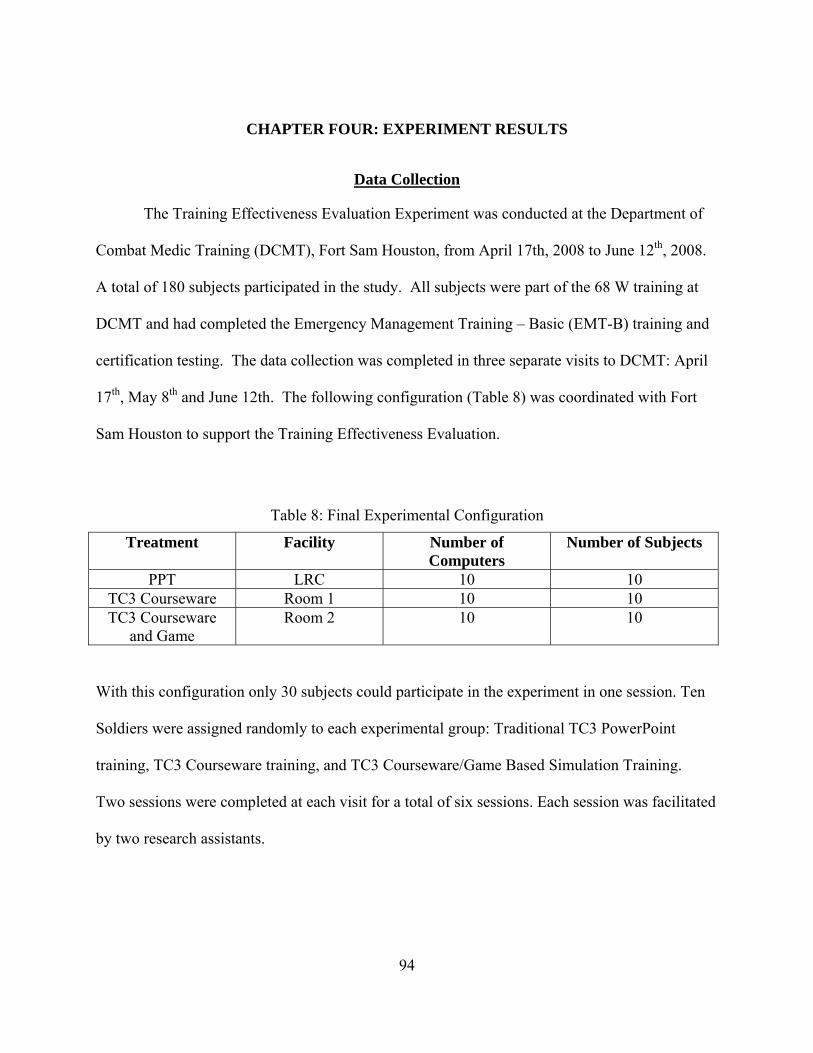
94
CHAPTER FOUR: EXPERIMENT RESULTS
Data Collection
The Training Effectiveness Evaluation Experiment was conducted at the Department of
Combat Medic Training (DCMT), Fort Sam Houston, from April 17th, 2008 to June 12th, 2008.
A total of 180 subjects participated in the study. All subjects were part of the 68 W training at
DCMT and had completed the Emergency Management Training – Basic (EMT-B) training and
certification testing. The data collection was completed in three separate visits to DCMT: April
17th, May 8th and June 12th. The following configuration (Table 8) was coordinated with Fort
Sam Houston to support the Training Effectiveness Evaluation.
Table 8: Final Experimental Configuration
Treatment Facility Number of Computers
Number of Subjects
PPT LRC 10 10 TC3 Courseware Room 1 10 10 TC3 Courseware
and Game Room 2 10 10
With this configuration only 30 subjects could participate in the experiment in one session. Ten
Soldiers were assigned randomly to each experimental group: Traditional TC3 PowerPoint
training, TC3 Courseware training, and TC3 Courseware/Game Based Simulation Training.
Two sessions were completed at each visit for a total of six sessions. Each session was facilitated
by two research assistants.
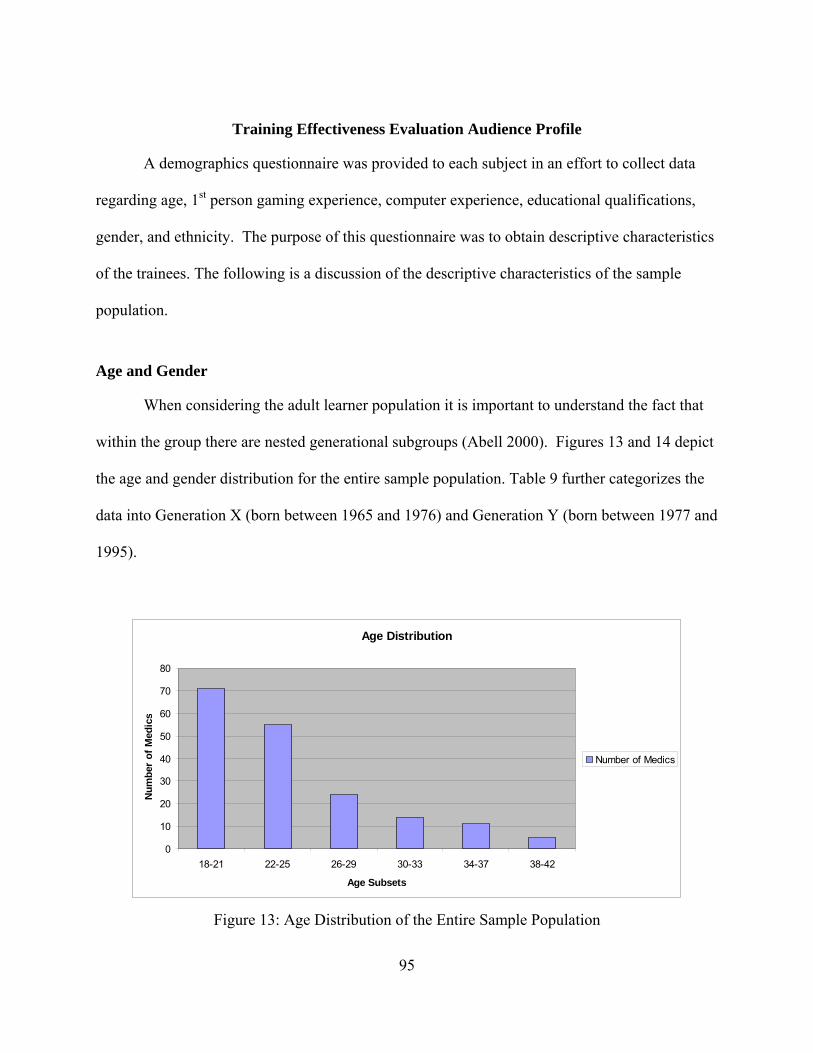
95
Training Effectiveness Evaluation Audience Profile
A demographics questionnaire was provided to each subject in an effort to collect data
regarding age, 1st person gaming experience, computer experience, educational qualifications,
gender, and ethnicity. The purpose of this questionnaire was to obtain descriptive characteristics
of the trainees. The following is a discussion of the descriptive characteristics of the sample
population.
Age and Gender
When considering the adult learner population it is important to understand the fact that
within the group there are nested generational subgroups (Abell 2000). Figures 13 and 14 depict
the age and gender distribution for the entire sample population. Table 9 further categorizes the
data into Generation X (born between 1965 and 1976) and Generation Y (born between 1977 and
1995).
Age Distribution
0
10
20
30
40
50
60
70
80
18-21 22-25 26-29 30-33 34-37 38-42
Age Subsets
Nu
mb
er o
f M
edic
s
Number of Medics
Figure 13: Age Distribution of the Entire Sample Population
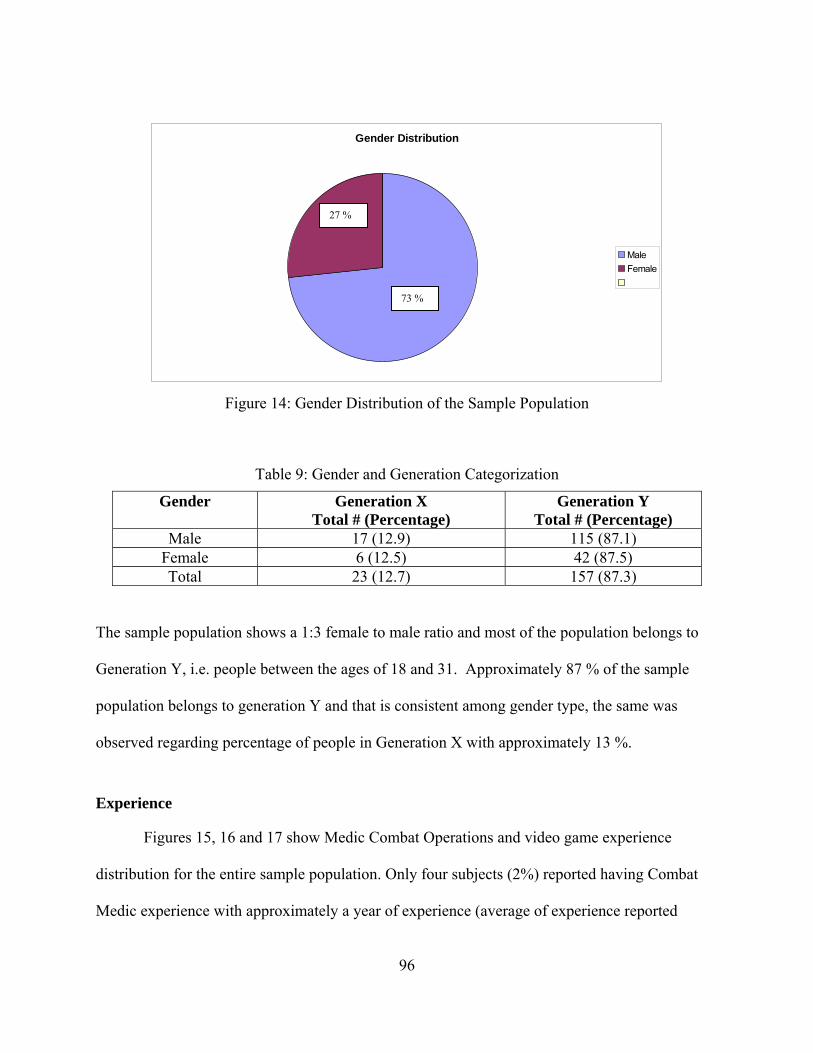
96
Gender Distribution
Male
Female
Figure 14: Gender Distribution of the Sample Population
Table 9: Gender and Generation Categorization
Gender Generation X Total # (Percentage)
Generation Y Total # (Percentage)
Male 17 (12.9) 115 (87.1) Female 6 (12.5) 42 (87.5) Total 23 (12.7) 157 (87.3)
The sample population shows a 1:3 female to male ratio and most of the population belongs to
Generation Y, i.e. people between the ages of 18 and 31. Approximately 87 % of the sample
population belongs to generation Y and that is consistent among gender type, the same was
observed regarding percentage of people in Generation X with approximately 13 %.
Experience
Figures 15, 16 and 17 show Medic Combat Operations and video game experience
distribution for the entire sample population. Only four subjects (2%) reported having Combat
Medic experience with approximately a year of experience (average of experience reported
27 %
73 %

97
equals to 1.06 years). The average age of these four individuals is 25 years with standard
deviation of 3.46 (24, 24, 30 and 22). Ninety two percentage (166 subjects) of the participants
reported not having any combat operations experience. The average age of the people with
combat experience (14 subjects) is approximately 26 (25.79) with a standard deviation of 5.56.
Only two subjects were older than 31 years of age. These numbers are also consistent with the
distribution among Generation X and Generation Y. When asked if they had any civilian medical
experience 53 subjects (30 percent of the sample population) responded as having some type of
medical background in a civilian setting. Table 10 provides a summary of the average number of
years reported on three categories: EMT, Emergency Room, and Other. When asked to describe
the type of duty under “Other” category subjects included the following list of occupational
areas: Paramedic, Physical Therapy, Occupational therapy, Emergency Medical Services,
Certified Nursing Assistant, and First Responders.
Medic Experience
Experience
No Experience
Figure 15: Combat Medic Experience
98 %
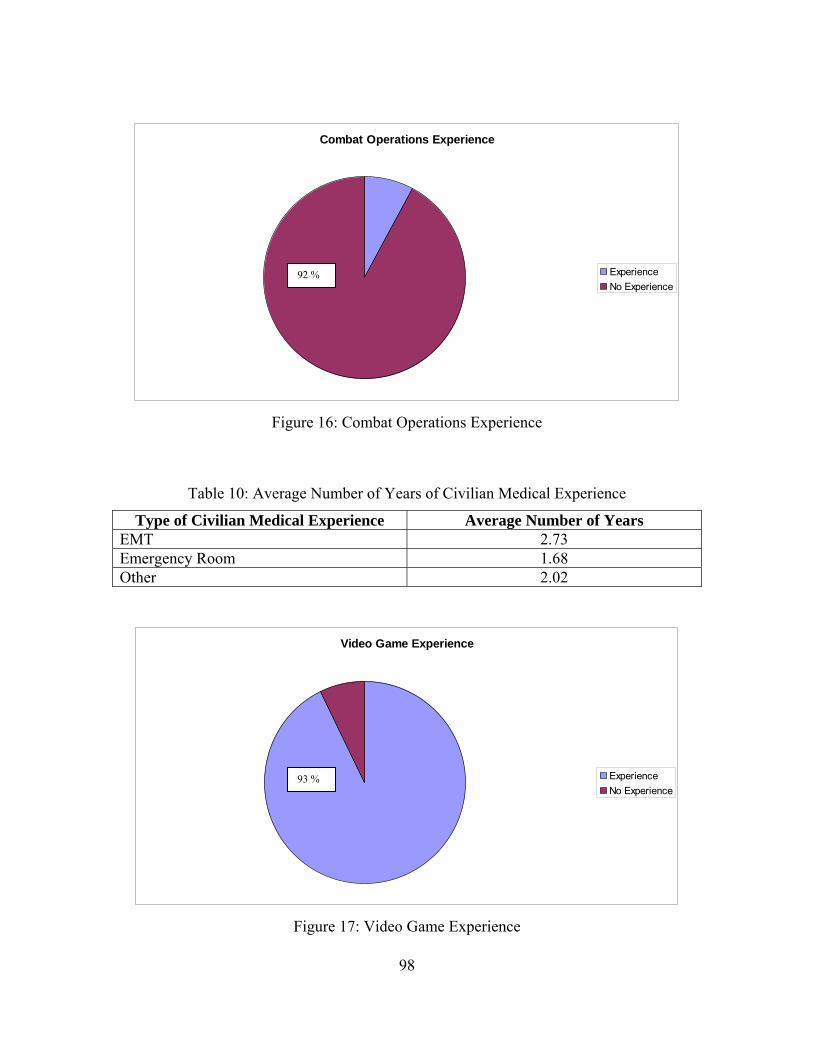
98
Combat Operations Experience
Experience
No Experience
Figure 16: Combat Operations Experience
Table 10: Average Number of Years of Civilian Medical Experience
Type of Civilian Medical Experience Average Number of Years EMT 2.73 Emergency Room 1.68 Other 2.02
Video Game Experience
Experience
No Experience
Figure 17: Video Game Experience
92 %
93 %
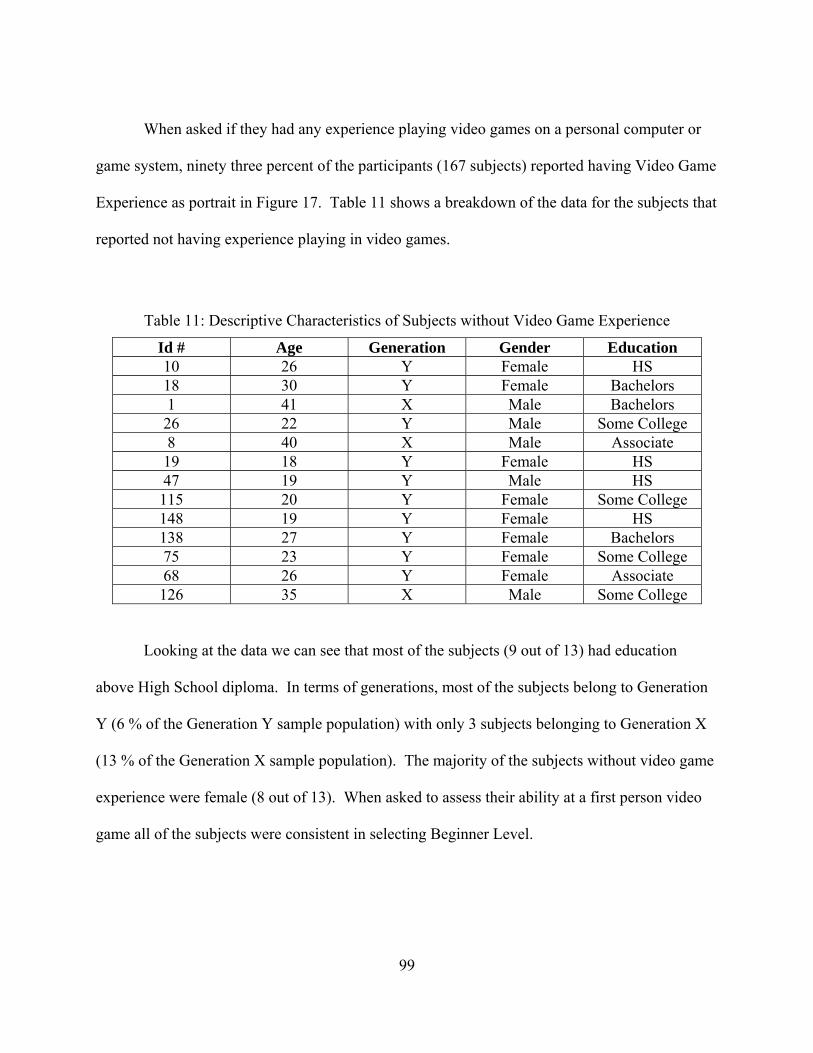
99
When asked if they had any experience playing video games on a personal computer or
game system, ninety three percent of the participants (167 subjects) reported having Video Game
Experience as portrait in Figure 17. Table 11 shows a breakdown of the data for the subjects that
reported not having experience playing in video games.
Table 11: Descriptive Characteristics of Subjects without Video Game Experience
Id # Age Generation Gender Education 10 26 Y Female HS 18 30 Y Female Bachelors 1 41 X Male Bachelors 26 22 Y Male Some College 8 40 X Male Associate 19 18 Y Female HS 47 19 Y Male HS 115 20 Y Female Some College 148 19 Y Female HS 138 27 Y Female Bachelors 75 23 Y Female Some College 68 26 Y Female Associate 126 35 X Male Some College
Looking at the data we can see that most of the subjects (9 out of 13) had education
above High School diploma. In terms of generations, most of the subjects belong to Generation
Y (6 % of the Generation Y sample population) with only 3 subjects belonging to Generation X
(13 % of the Generation X sample population). The majority of the subjects without video game
experience were female (8 out of 13). When asked to assess their ability at a first person video
game all of the subjects were consistent in selecting Beginner Level.
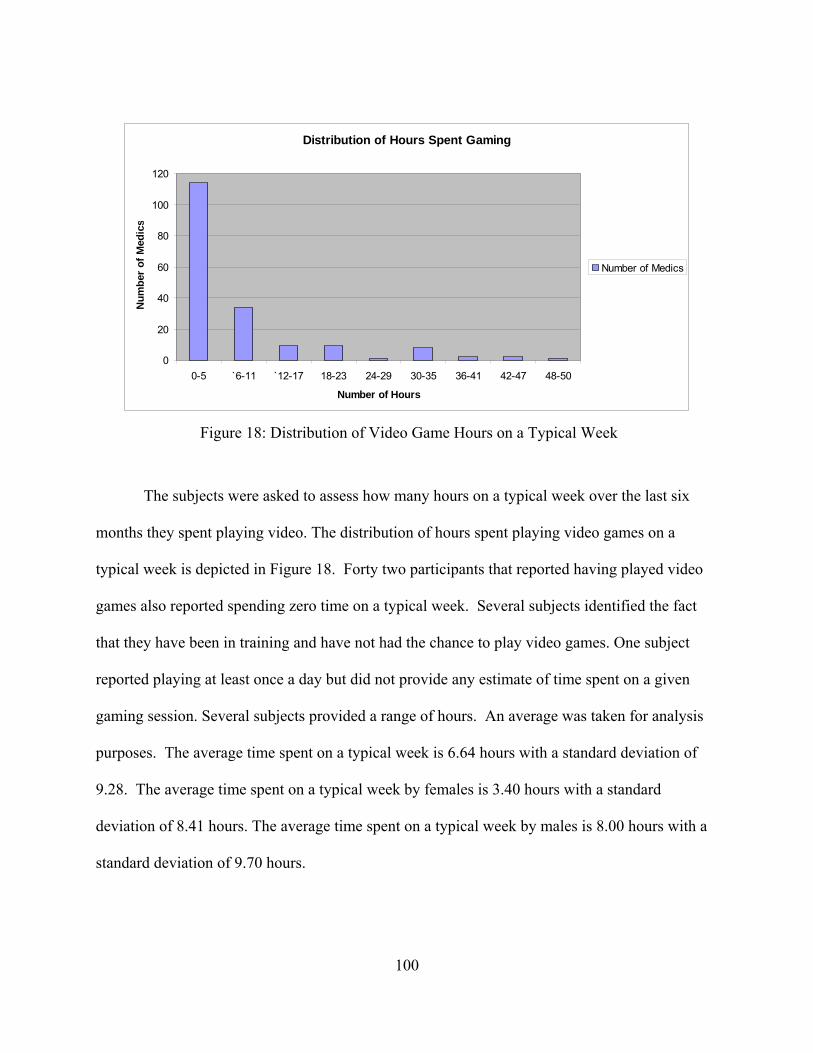
100
Distribution of Hours Spent Gaming
0
20
40
60
80
100
120
0-5 `6-11 `12-17 18-23 24-29 30-35 36-41 42-47 48-50
Number of Hours
Nu
mb
er o
f M
edic
s
Number of Medics
Figure 18: Distribution of Video Game Hours on a Typical Week
The subjects were asked to assess how many hours on a typical week over the last six
months they spent playing video. The distribution of hours spent playing video games on a
typical week is depicted in Figure 18. Forty two participants that reported having played video
games also reported spending zero time on a typical week. Several subjects identified the fact
that they have been in training and have not had the chance to play video games. One subject
reported playing at least once a day but did not provide any estimate of time spent on a given
gaming session. Several subjects provided a range of hours. An average was taken for analysis
purposes. The average time spent on a typical week is 6.64 hours with a standard deviation of
9.28. The average time spent on a typical week by females is 3.40 hours with a standard
deviation of 8.41 hours. The average time spent on a typical week by males is 8.00 hours with a
standard deviation of 9.70 hours.
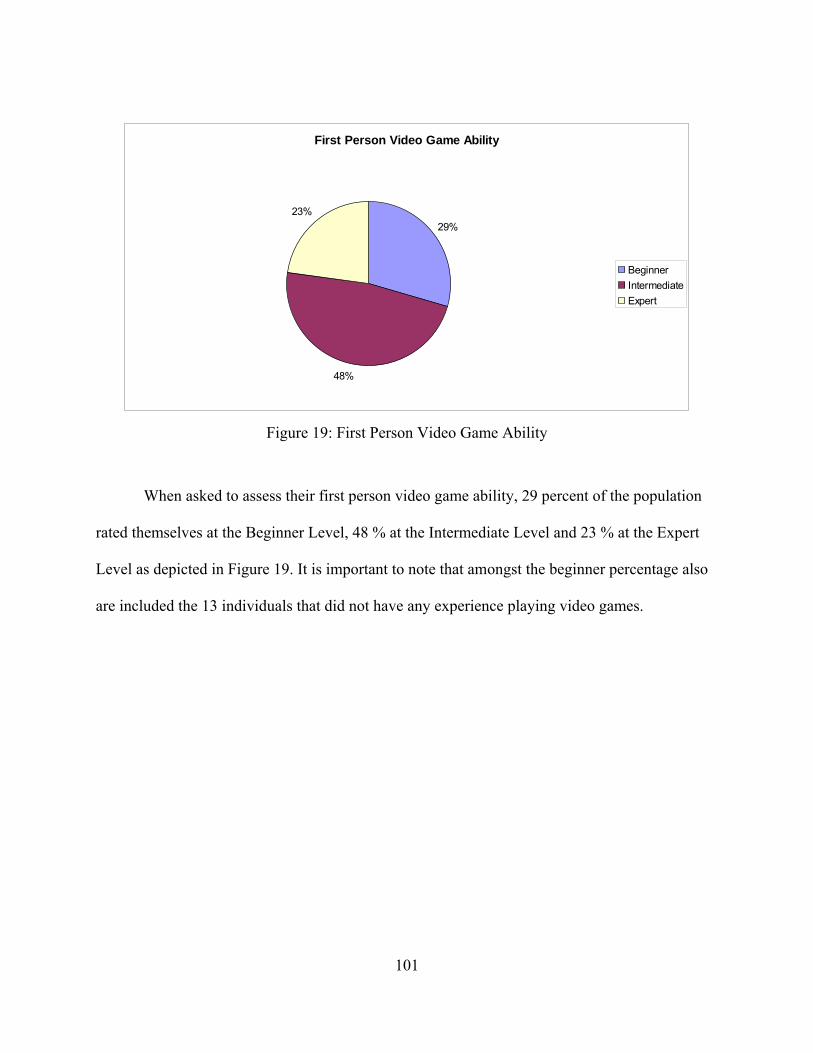
101
First Person Video Game Ability
29%
48%
23%
Beginner
Intermediate
Expert
Figure 19: First Person Video Game Ability
When asked to assess their first person video game ability, 29 percent of the population
rated themselves at the Beginner Level, 48 % at the Intermediate Level and 23 % at the Expert
Level as depicted in Figure 19. It is important to note that amongst the beginner percentage also
are included the 13 individuals that did not have any experience playing video games.
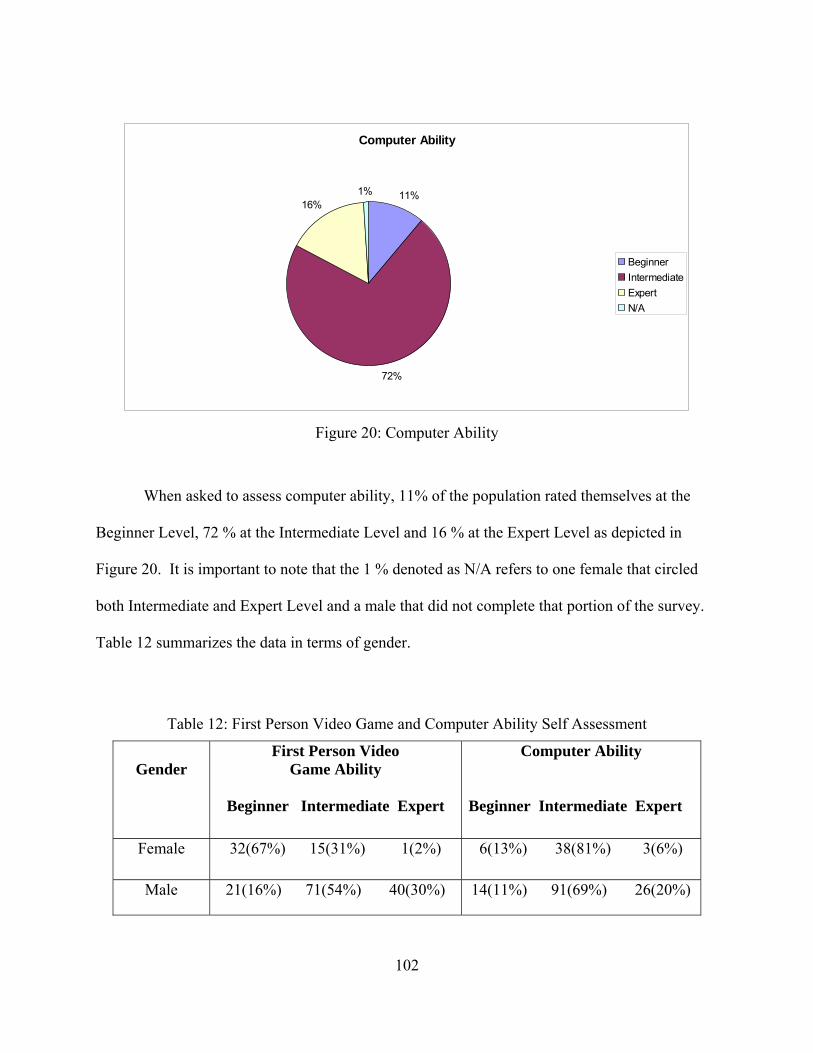
102
Computer Ability
11%
72%
16%1%
Beginner
Intermediate
Expert
N/A
Figure 20: Computer Ability
When asked to assess computer ability, 11% of the population rated themselves at the
Beginner Level, 72 % at the Intermediate Level and 16 % at the Expert Level as depicted in
Figure 20. It is important to note that the 1 % denoted as N/A refers to one female that circled
both Intermediate and Expert Level and a male that did not complete that portion of the survey.
Table 12 summarizes the data in terms of gender.
Table 12: First Person Video Game and Computer Ability Self Assessment
Gender
First Person Video Game Ability
Beginner Intermediate Expert
Computer Ability Beginner Intermediate Expert
Female 32(67%) 15(31%) 1(2%) 6(13%) 38(81%) 3(6%)
Male 21(16%) 71(54%) 40(30%) 14(11%) 91(69%) 26(20%)
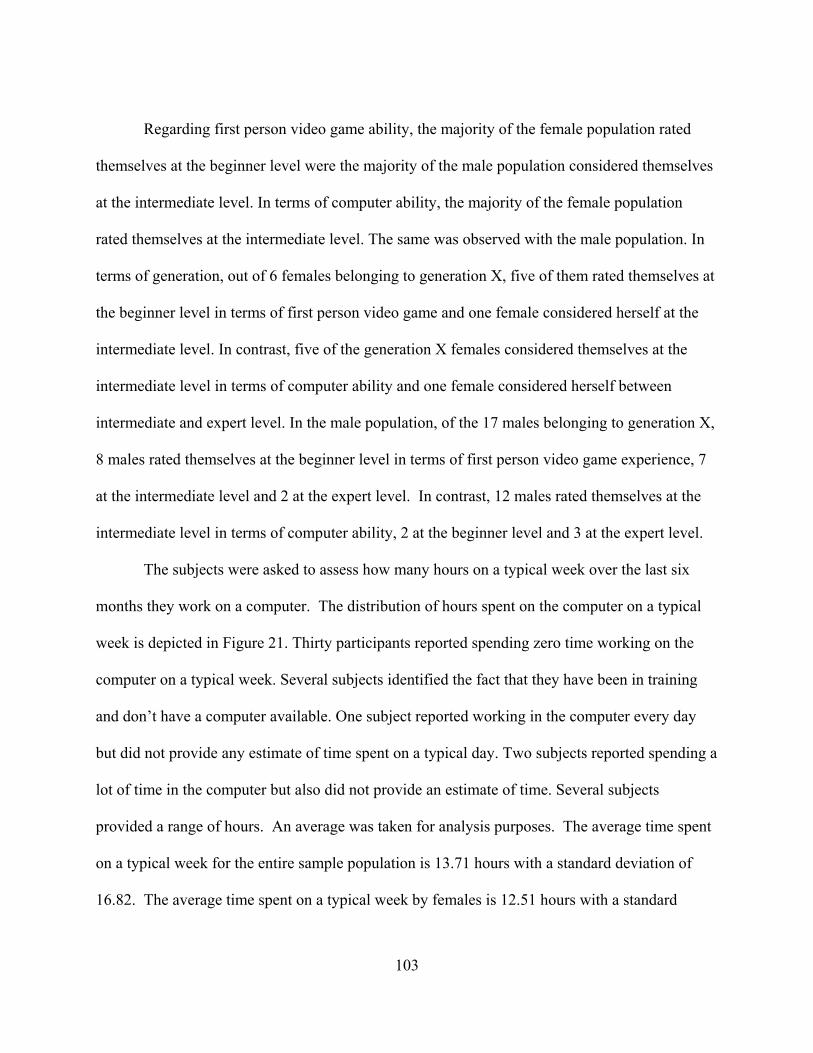
103
Regarding first person video game ability, the majority of the female population rated
themselves at the beginner level were the majority of the male population considered themselves
at the intermediate level. In terms of computer ability, the majority of the female population
rated themselves at the intermediate level. The same was observed with the male population. In
terms of generation, out of 6 females belonging to generation X, five of them rated themselves at
the beginner level in terms of first person video game and one female considered herself at the
intermediate level. In contrast, five of the generation X females considered themselves at the
intermediate level in terms of computer ability and one female considered herself between
intermediate and expert level. In the male population, of the 17 males belonging to generation X,
8 males rated themselves at the beginner level in terms of first person video game experience, 7
at the intermediate level and 2 at the expert level. In contrast, 12 males rated themselves at the
intermediate level in terms of computer ability, 2 at the beginner level and 3 at the expert level.
The subjects were asked to assess how many hours on a typical week over the last six
months they work on a computer. The distribution of hours spent on the computer on a typical
week is depicted in Figure 21. Thirty participants reported spending zero time working on the
computer on a typical week. Several subjects identified the fact that they have been in training
and don’t have a computer available. One subject reported working in the computer every day
but did not provide any estimate of time spent on a typical day. Two subjects reported spending a
lot of time in the computer but also did not provide an estimate of time. Several subjects
provided a range of hours. An average was taken for analysis purposes. The average time spent
on a typical week for the entire sample population is 13.71 hours with a standard deviation of
16.82. The average time spent on a typical week by females is 12.51 hours with a standard
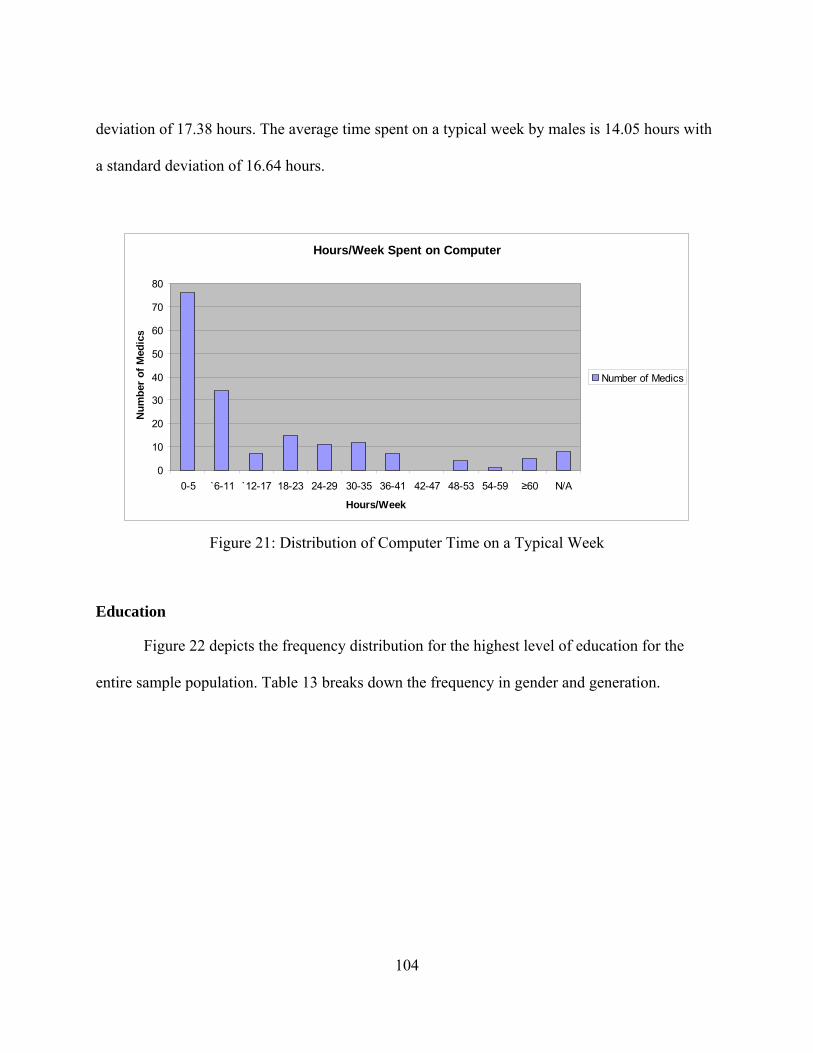
104
deviation of 17.38 hours. The average time spent on a typical week by males is 14.05 hours with
a standard deviation of 16.64 hours.
Hours/Week Spent on Computer
0
10
20
30
40
50
60
70
80
0-5 `6-11 `12-17 18-23 24-29 30-35 36-41 42-47 48-53 54-59 ≥60 N/A
Hours/Week
Nu
mb
er o
f M
edic
s
Number of Medics
Figure 21: Distribution of Computer Time on a Typical Week
Education
Figure 22 depicts the frequency distribution for the highest level of education for the
entire sample population. Table 13 breaks down the frequency in gender and generation.
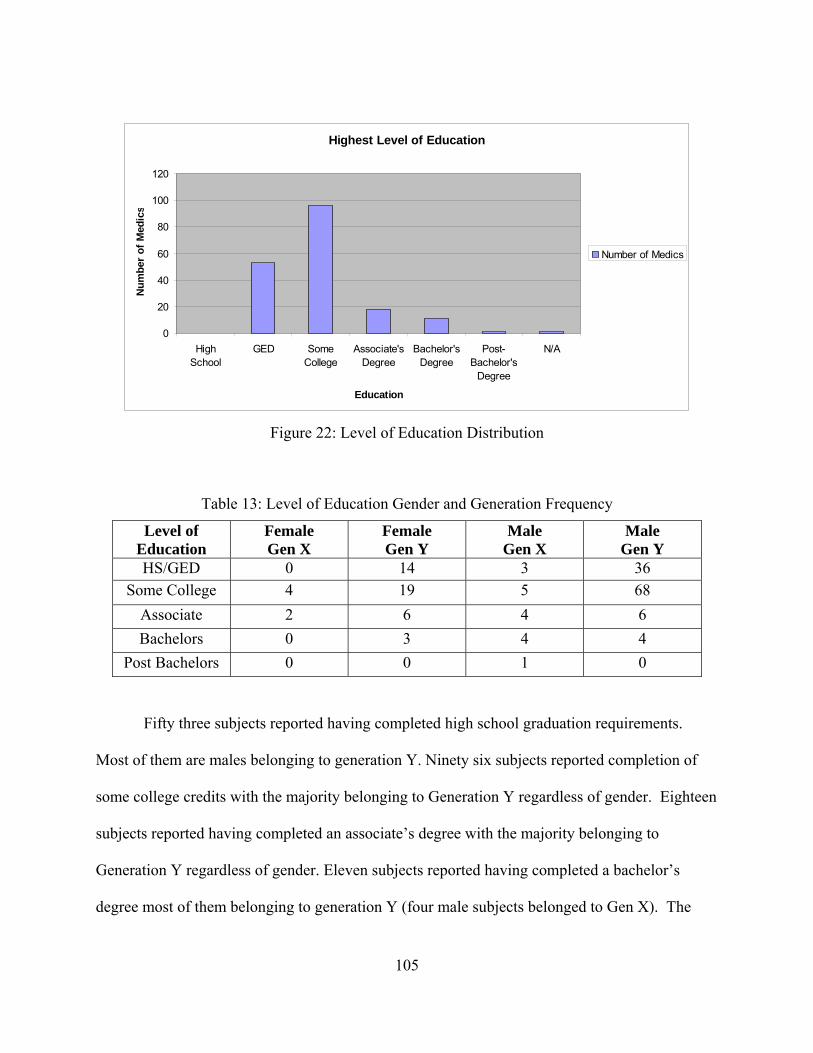
105
Highest Level of Education
0
20
40
60
80
100
120
HighSchool
GED SomeCollege
Associate'sDegree
Bachelor'sDegree
Post-Bachelor's
Degree
N/A
Education
Nu
mb
er o
f M
edic
s
Number of Medics
Figure 22: Level of Education Distribution
Table 13: Level of Education Gender and Generation Frequency
Level of Education
Female Gen X
Female Gen Y
Male Gen X
Male Gen Y
HS/GED 0 14 3 36
Some College 4 19 5 68
Associate 2 6 4 6
Bachelors 0 3 4 4
Post Bachelors 0 0 1 0
Fifty three subjects reported having completed high school graduation requirements.
Most of them are males belonging to generation Y. Ninety six subjects reported completion of
some college credits with the majority belonging to Generation Y regardless of gender. Eighteen
subjects reported having completed an associate’s degree with the majority belonging to
Generation Y regardless of gender. Eleven subjects reported having completed a bachelor’s
degree most of them belonging to generation Y (four male subjects belonged to Gen X). The
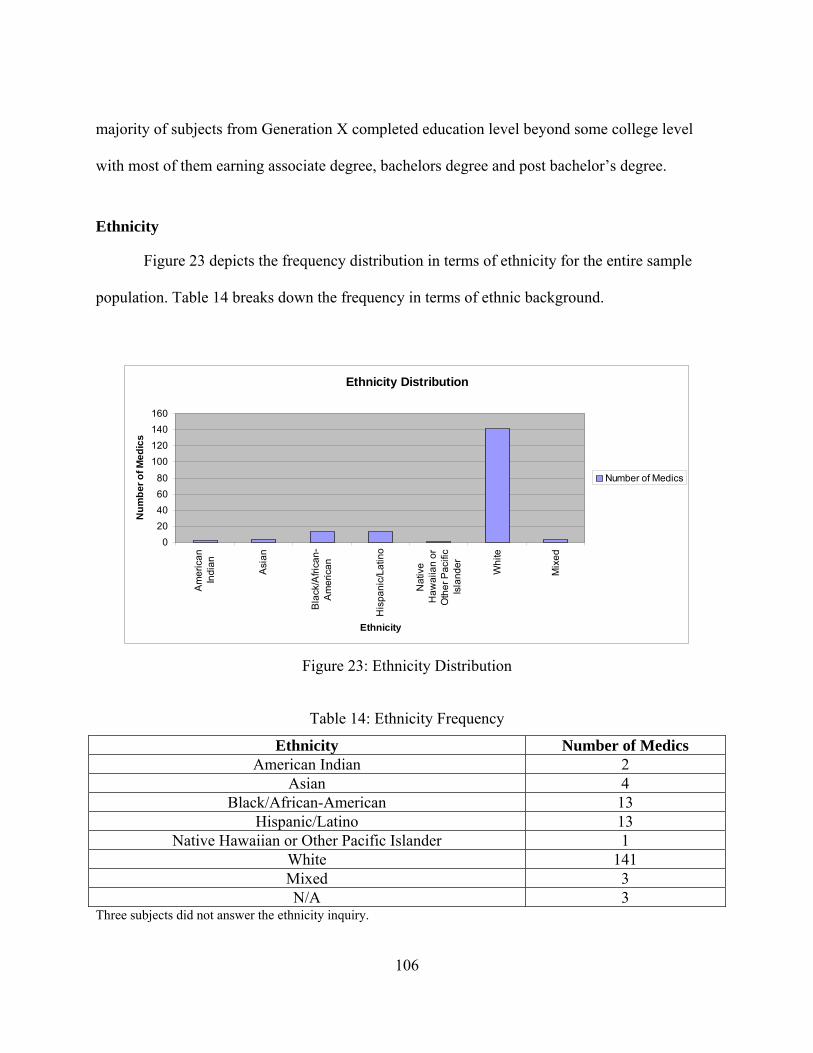
106
majority of subjects from Generation X completed education level beyond some college level
with most of them earning associate degree, bachelors degree and post bachelor’s degree.
Ethnicity
Figure 23 depicts the frequency distribution in terms of ethnicity for the entire sample
population. Table 14 breaks down the frequency in terms of ethnic background.
Ethnicity Distribution
0
20
40
60
80
100
120
140
160
Am
eri
can
Ind
ian
Asi
an
Bla
ck/A
fric
an
-A
me
rica
n
His
pa
nic
/La
tino
Na
tive
Ha
wa
iian
or
Oth
er
Pa
cific
Isla
nd
er
Wh
ite
Mix
ed
Ethnicity
Nu
mb
er
of
Me
dic
s
Number of Medics
Figure 23: Ethnicity Distribution
Table 14: Ethnicity Frequency
Ethnicity Number of Medics American Indian 2
Asian 4 Black/African-American 13
Hispanic/Latino 13 Native Hawaiian or Other Pacific Islander 1
White 141 Mixed 3 N/A 3
Three subjects did not answer the ethnicity inquiry.
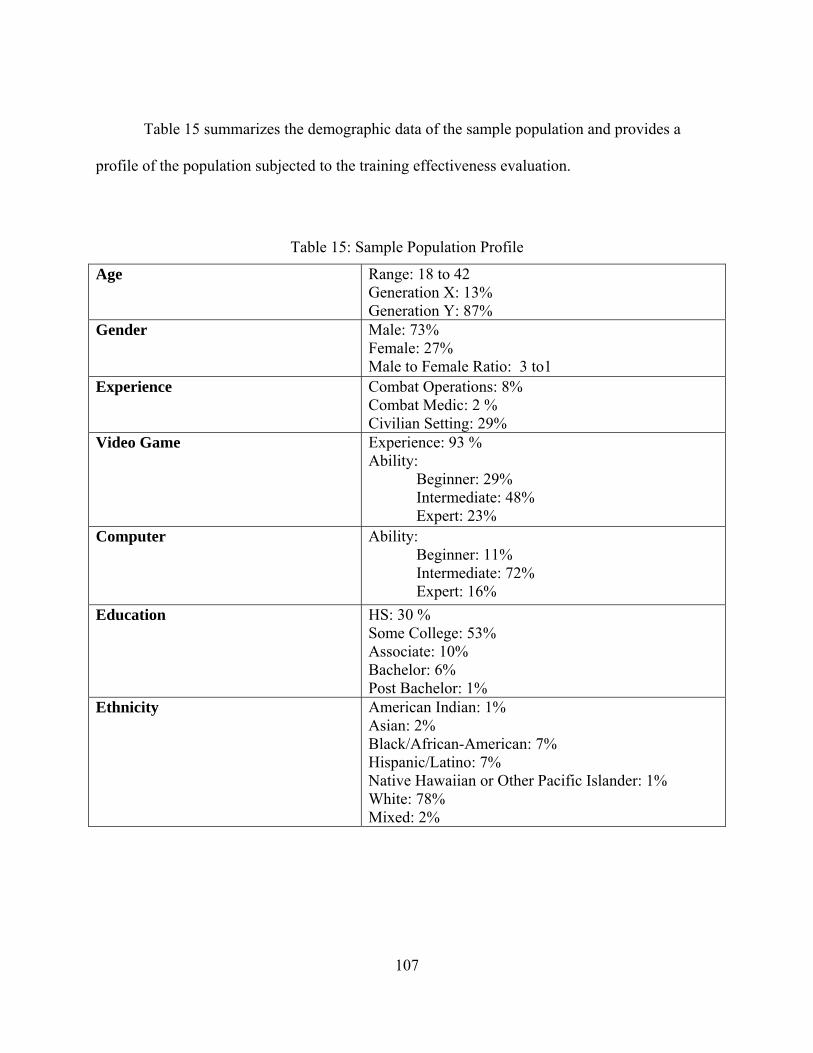
107
Table 15 summarizes the demographic data of the sample population and provides a
profile of the population subjected to the training effectiveness evaluation.
Table 15: Sample Population Profile
Age Range: 18 to 42 Generation X: 13% Generation Y: 87%
Gender Male: 73% Female: 27% Male to Female Ratio: 3 to1
Experience Combat Operations: 8% Combat Medic: 2 % Civilian Setting: 29%
Video Game Experience: 93 % Ability: Beginner: 29% Intermediate: 48% Expert: 23%
Computer Ability: Beginner: 11% Intermediate: 72% Expert: 16%
Education HS: 30 % Some College: 53% Associate: 10% Bachelor: 6% Post Bachelor: 1%
Ethnicity American Indian: 1% Asian: 2% Black/African-American: 7% Hispanic/Latino: 7% Native Hawaiian or Other Pacific Islander: 1% White: 78% Mixed: 2%
108
Level I Evaluation – User Reaction to TC3 Training
In order to assess Medic trainees’ reaction to TC3 training treatment, the participating
Medic trainees were asked to provide feedback via survey questions on three different areas:
Overall Student Reaction to Training Treatment, Learning Benefit of each Training Treatment,
and Usability of the System used by each Training Treatment. The reaction of 171 individuals
was analyzed. The inputs from 9 individuals were omitted due to missing data. One individual
was excused for being 17 years of age. Two individuals were excused after completing portion
of the training: one became ill and the other Soldier assisted the sick Soldier. The rest of the
missing data was due to incomplete surveys.
To investigate the relationship that descriptive characteristics have in terms of reaction to
training and performance on pre-post test and transfer task, as hypothesized by Bae (2002), a
simple correlation analysis was performed. Descriptive characteristics categories used in this
research were: age, medical experience and level of education. The Pearson product moment
coefficient of correlation, r, was calculated. The coefficient of correlation provides a
quantitative measure of the strength of the linear relationship or “association” between two
variables. The purpose of this analysis was not to imply causality but to look if there was a
linear trend between the variables and the nature of the association between the variables. In
addition, the null hypothesis of ρ = 0 (no linear relationship), were ρ is an estimate of the sample
correlation coefficient r, was tested. The values of r near zero observed indicate that there is
almost no linear correlation between the variables but does not mean that there is no correlation
at all since there might be a non linear correlation between the variables. Also, other factors may
contribute to the relationship between the variables that were not considered in the analysis since
only simple correlation analysis was performed. These correlations are not part of the

109
experimental design and therefore do not have the power over avoiding Type II error as
described by Cohen (1992).
One main hypothesis was tested to assess reaction towards the TC3 training:
H1: Reaction scores for theTC3 Game-Based Simulation training group will be
significantly higher than reaction scores for other TC3 training treatment groups.
In order to investigate if there was any differences in reaction to training between
treatments, a one way analysis of variance (ANOVA) was performed using α = 0.05 (Critical
value of the F statistic = 3.00) to compare treatment means in terms of post training reaction in
the different areas.
Data Collected to Analyze Hypothesis One: Level I Overall Student Reaction to Training
After receiving the TC3 training treatments, the participating Medic trainees were asked
to rate the training on a Likert Scale from 1 to 5 (Poor = 1, Fair =2, Good = 3, Very Good = 4,
and Excellent = 5). See Appendix H.
Table 16 provides results of the correlation analysis per treatment group with highlighted
(*) statistical reactions. Table 17 provides results of the one way ANOVA using α = 0.05 to
investigate hypothesis H1.
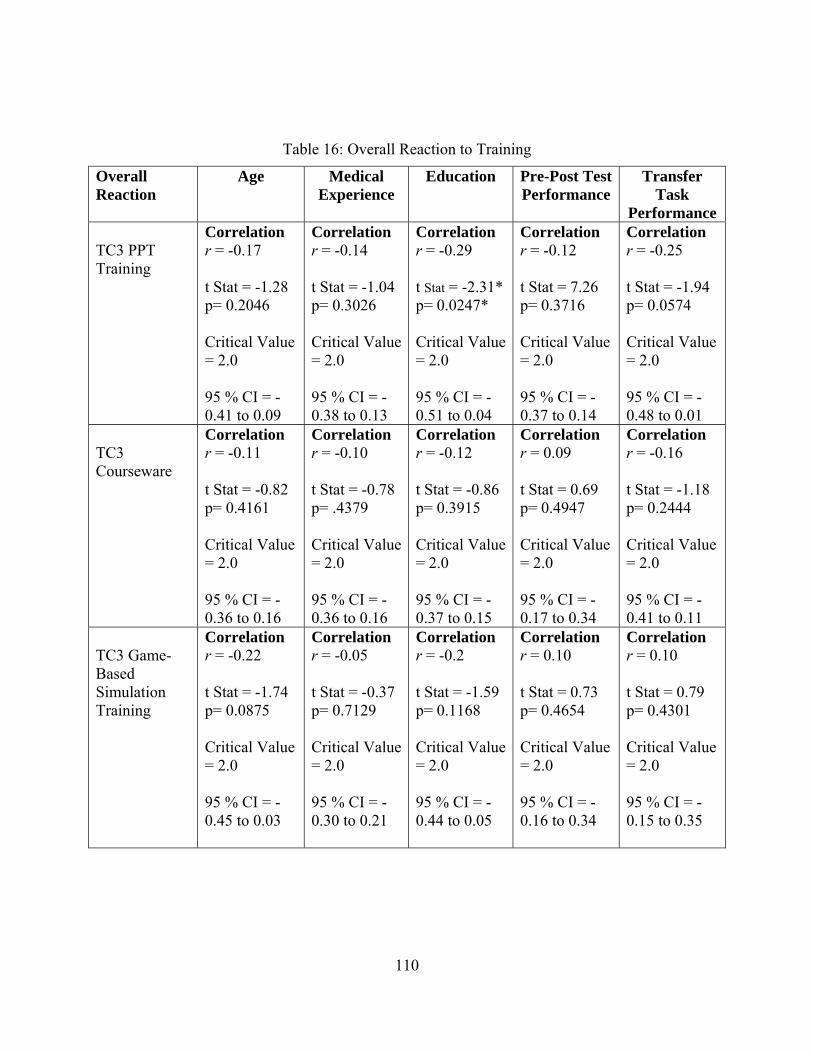
110
Table 16: Overall Reaction to Training
Overall Reaction
Age Medical Experience
Education Pre-Post Test Performance
Transfer Task
Performance TC3 PPT Training
Correlation r = -0.17 t Stat = -1.28 p= 0.2046 Critical Value = 2.0 95 % CI = -0.41 to 0.09
Correlation r = -0.14 t Stat = -1.04 p= 0.3026 Critical Value = 2.0 95 % CI = -0.38 to 0.13
Correlation r = -0.29 t Stat = -2.31* p= 0.0247* Critical Value = 2.0 95 % CI = -0.51 to 0.04
Correlation r = -0.12 t Stat = 7.26 p= 0.3716 Critical Value = 2.0 95 % CI = -0.37 to 0.14
Correlation r = -0.25 t Stat = -1.94 p= 0.0574 Critical Value = 2.0 95 % CI = -0.48 to 0.01
TC3 Courseware
Correlation r = -0.11 t Stat = -0.82 p= 0.4161 Critical Value = 2.0 95 % CI = -0.36 to 0.16
Correlation r = -0.10 t Stat = -0.78 p= .4379 Critical Value = 2.0 95 % CI = -0.36 to 0.16
Correlation r = -0.12 t Stat = -0.86 p= 0.3915 Critical Value = 2.0 95 % CI = -0.37 to 0.15
Correlation r = 0.09 t Stat = 0.69 p= 0.4947 Critical Value = 2.0 95 % CI = -0.17 to 0.34
Correlation r = -0.16 t Stat = -1.18 p= 0.2444 Critical Value = 2.0 95 % CI = -0.41 to 0.11
TC3 Game-Based Simulation Training
Correlation r = -0.22 t Stat = -1.74 p= 0.0875 Critical Value = 2.0 95 % CI = -0.45 to 0.03
Correlation r = -0.05 t Stat = -0.37 p= 0.7129 Critical Value = 2.0 95 % CI = -0.30 to 0.21
Correlation r = -0.2 t Stat = -1.59 p= 0.1168 Critical Value = 2.0 95 % CI = -0.44 to 0.05
Correlation r = 0.10 t Stat = 0.73 p= 0.4654 Critical Value = 2.0 95 % CI = -0.16 to 0.34
Correlation r = 0.10 t Stat = 0.79 p= 0.4301 Critical Value = 2.0 95 % CI = -0.15 to 0.35
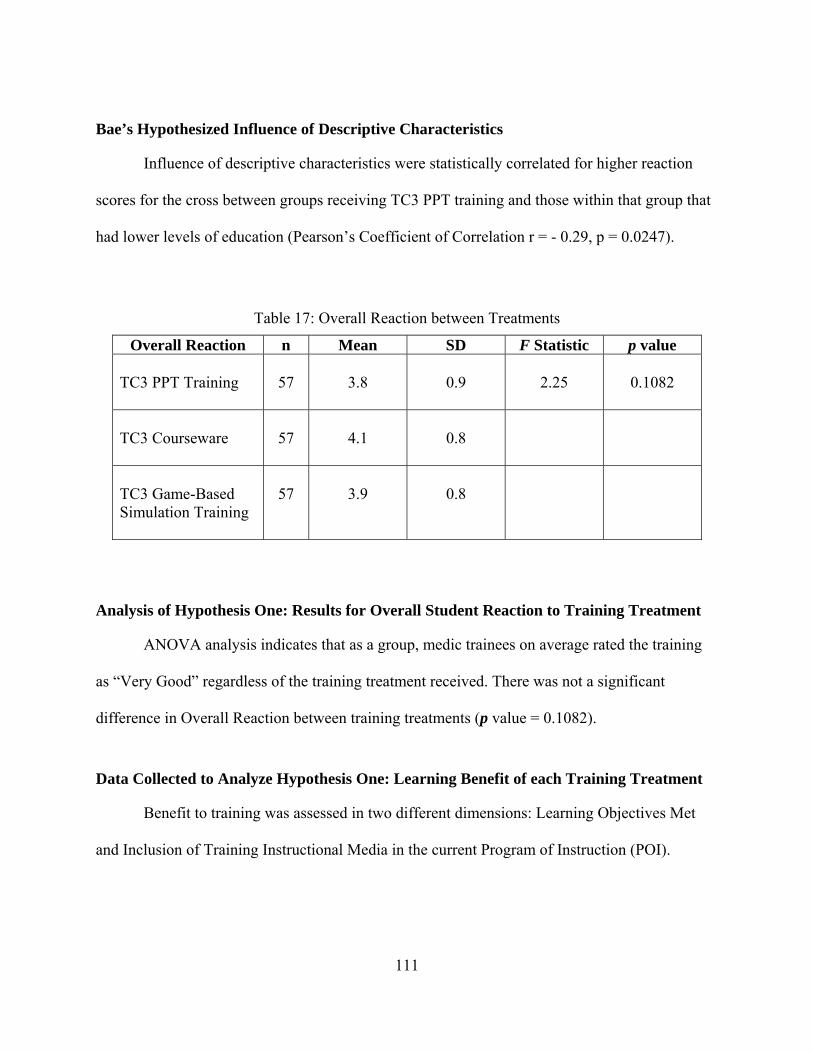
111
Bae’s Hypothesized Influence of Descriptive Characteristics
Influence of descriptive characteristics were statistically correlated for higher reaction
scores for the cross between groups receiving TC3 PPT training and those within that group that
had lower levels of education (Pearson’s Coefficient of Correlation r = - 0.29, p = 0.0247).
Table 17: Overall Reaction between Treatments
Overall Reaction n Mean SD F Statistic p value TC3 PPT Training
57
3.8
0.9
2.25
0.1082
TC3 Courseware
57
4.1
0.8
TC3 Game-Based Simulation Training
57
3.9
0.8
Analysis of Hypothesis One: Results for Overall Student Reaction to Training Treatment
ANOVA analysis indicates that as a group, medic trainees on average rated the training
as “Very Good” regardless of the training treatment received. There was not a significant
difference in Overall Reaction between training treatments (p value = 0.1082).
Data Collected to Analyze Hypothesis One: Learning Benefit of each Training Treatment
Benefit to training was assessed in two different dimensions: Learning Objectives Met
and Inclusion of Training Instructional Media in the current Program of Instruction (POI).
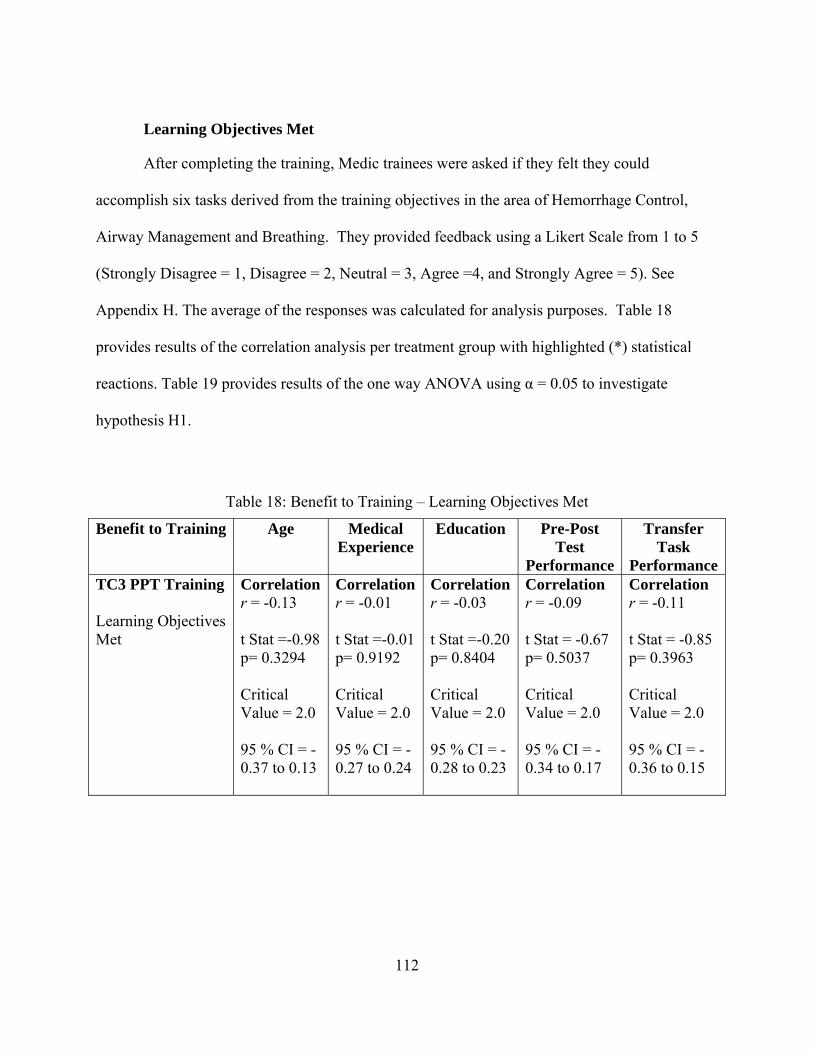
112
Learning Objectives Met
After completing the training, Medic trainees were asked if they felt they could
accomplish six tasks derived from the training objectives in the area of Hemorrhage Control,
Airway Management and Breathing. They provided feedback using a Likert Scale from 1 to 5
(Strongly Disagree = 1, Disagree = 2, Neutral = 3, Agree =4, and Strongly Agree = 5). See
Appendix H. The average of the responses was calculated for analysis purposes. Table 18
provides results of the correlation analysis per treatment group with highlighted (*) statistical
reactions. Table 19 provides results of the one way ANOVA using α = 0.05 to investigate
hypothesis H1.
Table 18: Benefit to Training – Learning Objectives Met
Benefit to Training Age Medical Experience
Education Pre-Post Test
Performance
Transfer Task
PerformanceTC3 PPT Training Learning Objectives Met
Correlation r = -0.13 t Stat =-0.98 p= 0.3294 Critical Value = 2.0 95 % CI = -0.37 to 0.13
Correlationr = -0.01 t Stat =-0.01 p= 0.9192 Critical Value = 2.0 95 % CI = -0.27 to 0.24
Correlationr = -0.03 t Stat =-0.20 p= 0.8404 Critical Value = 2.0 95 % CI = -0.28 to 0.23
Correlation r = -0.09 t Stat = -0.67 p= 0.5037 Critical Value = 2.0 95 % CI = -0.34 to 0.17
Correlation r = -0.11 t Stat = -0.85 p= 0.3963 Critical Value = 2.0 95 % CI = -0.36 to 0.15
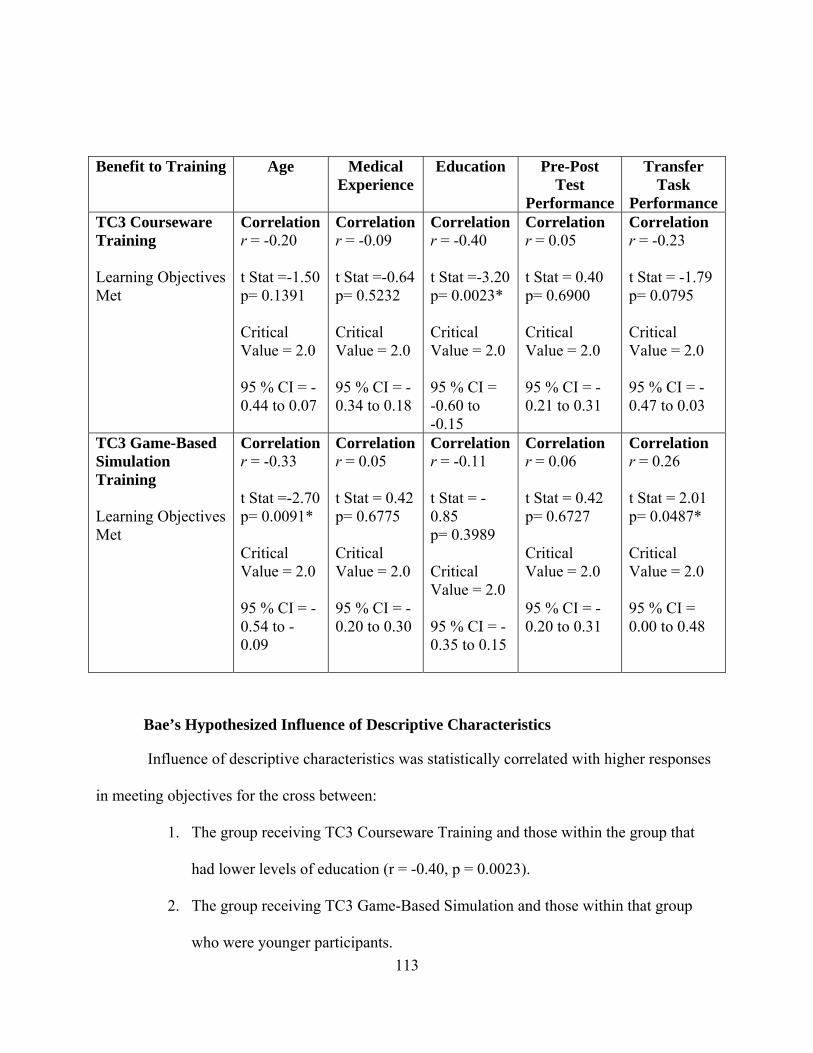
113
Benefit to Training Age Medical Experience
Education Pre-Post Test
Performance
Transfer Task
PerformanceTC3 Courseware Training Learning Objectives Met
Correlation r = -0.20 t Stat =-1.50 p= 0.1391 Critical Value = 2.0 95 % CI = -0.44 to 0.07
Correlationr = -0.09 t Stat =-0.64 p= 0.5232 Critical Value = 2.0 95 % CI = -0.34 to 0.18
Correlationr = -0.40 t Stat =-3.20 p= 0.0023* Critical Value = 2.0 95 % CI = -0.60 to -0.15
Correlation r = 0.05 t Stat = 0.40 p= 0.6900 Critical Value = 2.0 95 % CI = -0.21 to 0.31
Correlation r = -0.23 t Stat = -1.79 p= 0.0795 Critical Value = 2.0 95 % CI = -0.47 to 0.03
TC3 Game-Based Simulation Training Learning Objectives Met
Correlation r = -0.33 t Stat =-2.70 p= 0.0091* Critical Value = 2.0 95 % CI = -0.54 to - 0.09
Correlationr = 0.05 t Stat = 0.42 p= 0.6775 Critical Value = 2.0 95 % CI = -0.20 to 0.30
Correlationr = -0.11 t Stat = -0.85 p= 0.3989 Critical Value = 2.0 95 % CI = -0.35 to 0.15
Correlation r = 0.06 t Stat = 0.42 p= 0.6727 Critical Value = 2.0 95 % CI = -0.20 to 0.31
Correlation r = 0.26 t Stat = 2.01 p= 0.0487* Critical Value = 2.0 95 % CI = 0.00 to 0.48
Bae’s Hypothesized Influence of Descriptive Characteristics
Influence of descriptive characteristics was statistically correlated with higher responses
in meeting objectives for the cross between:
1. The group receiving TC3 Courseware Training and those within the group that
had lower levels of education (r = -0.40, p = 0.0023).
2. The group receiving TC3 Game-Based Simulation and those within that group
who were younger participants.
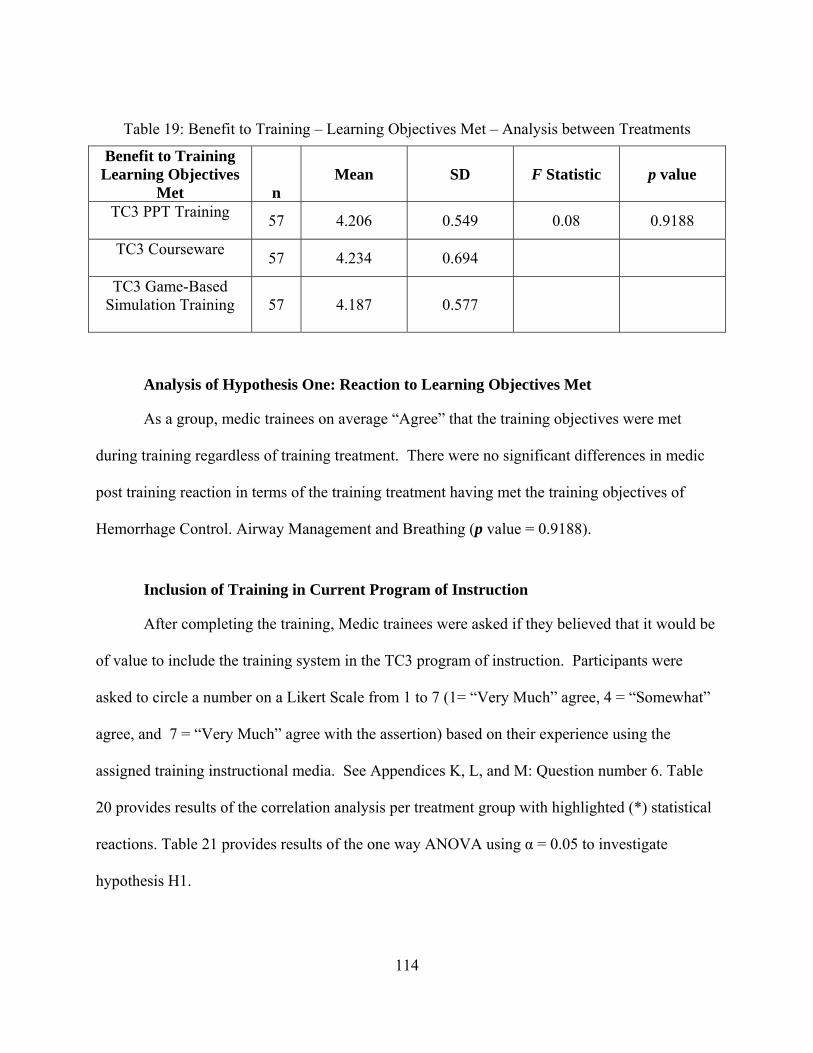
114
Table 19: Benefit to Training – Learning Objectives Met – Analysis between Treatments
Benefit to Training Learning Objectives
Met
n Mean SD F Statistic p value
TC3 PPT Training
57 4.206 0.549 0.08 0.9188
TC3 Courseware
57 4.234 0.694
TC3 Game-Based Simulation Training
57 4.187 0.577
Analysis of Hypothesis One: Reaction to Learning Objectives Met
As a group, medic trainees on average “Agree” that the training objectives were met
during training regardless of training treatment. There were no significant differences in medic
post training reaction in terms of the training treatment having met the training objectives of
Hemorrhage Control. Airway Management and Breathing (p value = 0.9188).
Inclusion of Training in Current Program of Instruction
After completing the training, Medic trainees were asked if they believed that it would be
of value to include the training system in the TC3 program of instruction. Participants were
asked to circle a number on a Likert Scale from 1 to 7 (1= “Very Much” agree, 4 = “Somewhat”
agree, and 7 = “Very Much” agree with the assertion) based on their experience using the
assigned training instructional media. See Appendices K, L, and M: Question number 6. Table
20 provides results of the correlation analysis per treatment group with highlighted (*) statistical
reactions. Table 21 provides results of the one way ANOVA using α = 0.05 to investigate
hypothesis H1.
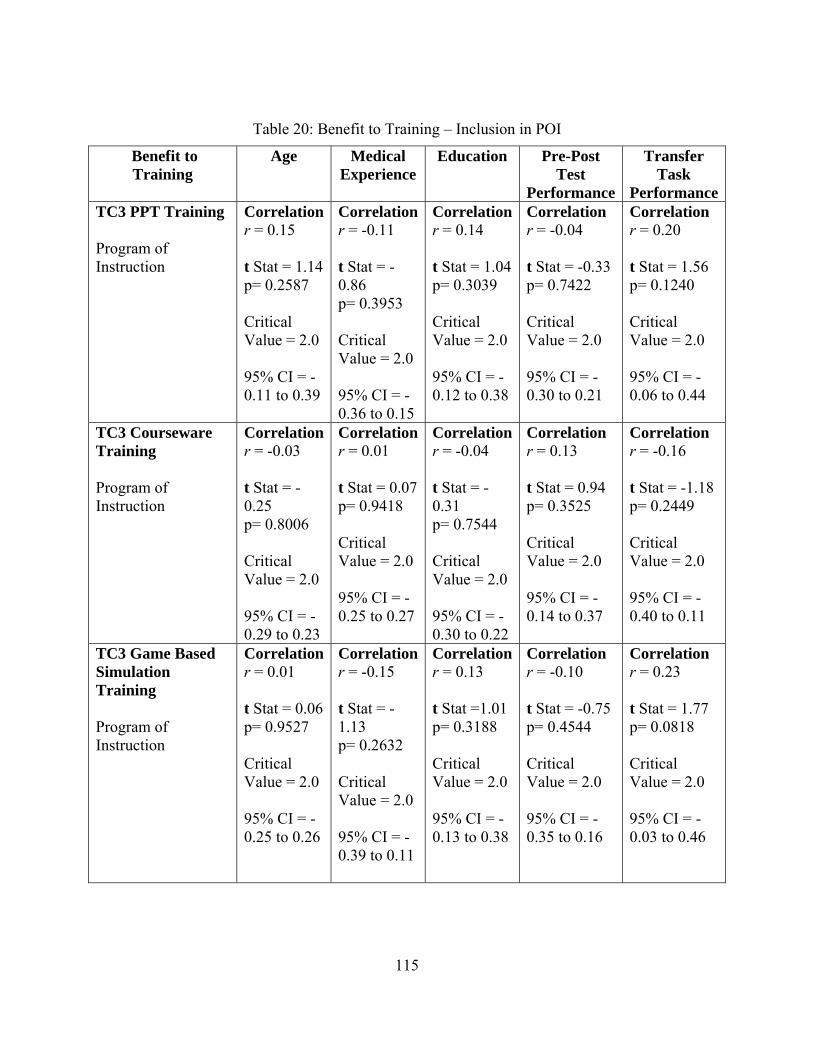
115
Table 20: Benefit to Training – Inclusion in POI
Benefit to Training
Age Medical Experience
Education Pre-Post Test
Performance
Transfer Task
PerformanceTC3 PPT Training
Program of Instruction
Correlation r = 0.15 t Stat = 1.14 p= 0.2587 Critical Value = 2.0 95% CI = -0.11 to 0.39
Correlationr = -0.11 t Stat = -0.86 p= 0.3953 Critical Value = 2.0 95% CI = -0.36 to 0.15
Correlationr = 0.14 t Stat = 1.04 p= 0.3039 Critical Value = 2.0 95% CI = -0.12 to 0.38
Correlation r = -0.04 t Stat = -0.33 p= 0.7422 Critical Value = 2.0 95% CI = -0.30 to 0.21
Correlation r = 0.20 t Stat = 1.56 p= 0.1240 Critical Value = 2.0 95% CI = -0.06 to 0.44
TC3 Courseware Training
Program of Instruction
Correlation r = -0.03 t Stat = -0.25 p= 0.8006 Critical Value = 2.0 95% CI = -0.29 to 0.23
Correlationr = 0.01 t Stat = 0.07 p= 0.9418 Critical Value = 2.0 95% CI = -0.25 to 0.27
Correlationr = -0.04 t Stat = -0.31 p= 0.7544 Critical Value = 2.0 95% CI = -0.30 to 0.22
Correlation r = 0.13 t Stat = 0.94 p= 0.3525 Critical Value = 2.0 95% CI = -0.14 to 0.37
Correlation r = -0.16 t Stat = -1.18 p= 0.2449 Critical Value = 2.0 95% CI = -0.40 to 0.11
TC3 Game Based Simulation Training Program of Instruction
Correlation r = 0.01 t Stat = 0.06 p= 0.9527 Critical Value = 2.0 95% CI = -0.25 to 0.26
Correlationr = -0.15 t Stat = -1.13 p= 0.2632 Critical Value = 2.0 95% CI = -0.39 to 0.11
Correlationr = 0.13 t Stat =1.01 p= 0.3188 Critical Value = 2.0 95% CI = -0.13 to 0.38
Correlation r = -0.10 t Stat = -0.75 p= 0.4544 Critical Value = 2.0 95% CI = -0.35 to 0.16
Correlation r = 0.23 t Stat = 1.77 p= 0.0818 Critical Value = 2.0 95% CI = -0.03 to 0.46
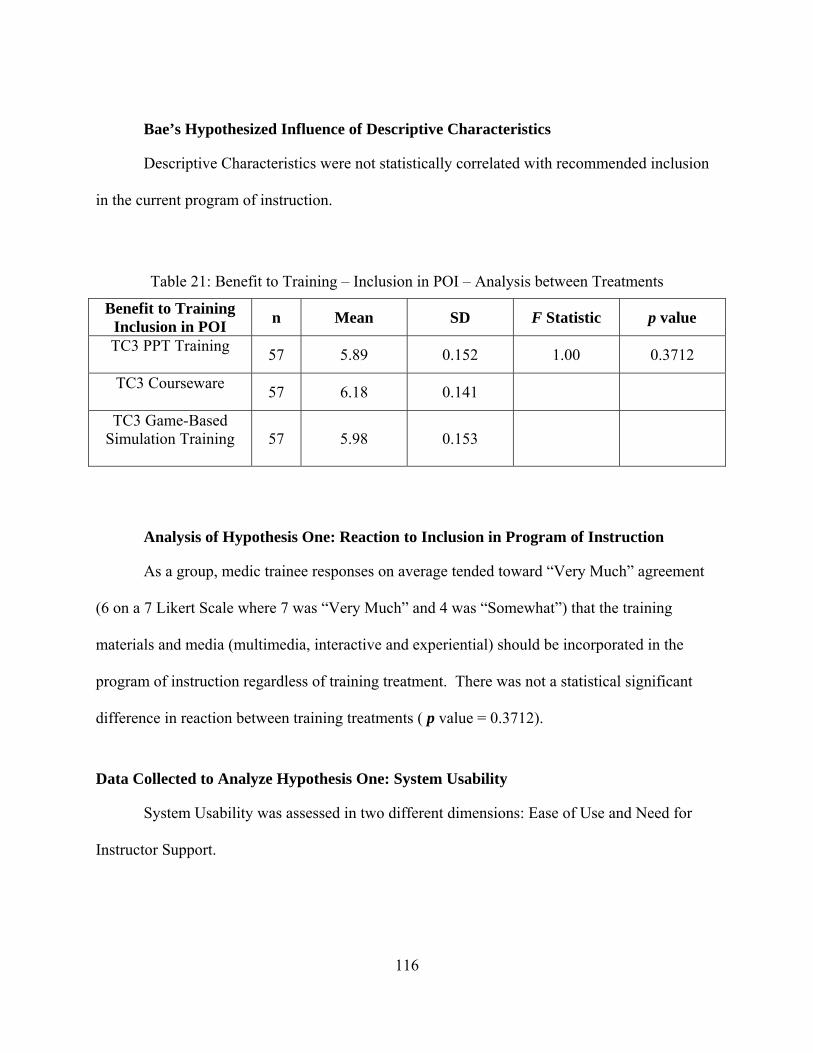
116
Bae’s Hypothesized Influence of Descriptive Characteristics
Descriptive Characteristics were not statistically correlated with recommended inclusion
in the current program of instruction.
Table 21: Benefit to Training – Inclusion in POI – Analysis between Treatments
Benefit to Training Inclusion in POI
n Mean SD F Statistic p value
TC3 PPT Training
57 5.89 0.152 1.00 0.3712
TC3 Courseware
57 6.18 0.141
TC3 Game-Based Simulation Training
57 5.98 0.153
Analysis of Hypothesis One: Reaction to Inclusion in Program of Instruction
As a group, medic trainee responses on average tended toward “Very Much” agreement
(6 on a 7 Likert Scale where 7 was “Very Much” and 4 was “Somewhat”) that the training
materials and media (multimedia, interactive and experiential) should be incorporated in the
program of instruction regardless of training treatment. There was not a statistical significant
difference in reaction between training treatments ( p value = 0.3712).
Data Collected to Analyze Hypothesis One: System Usability
System Usability was assessed in two different dimensions: Ease of Use and Need for
Instructor Support.
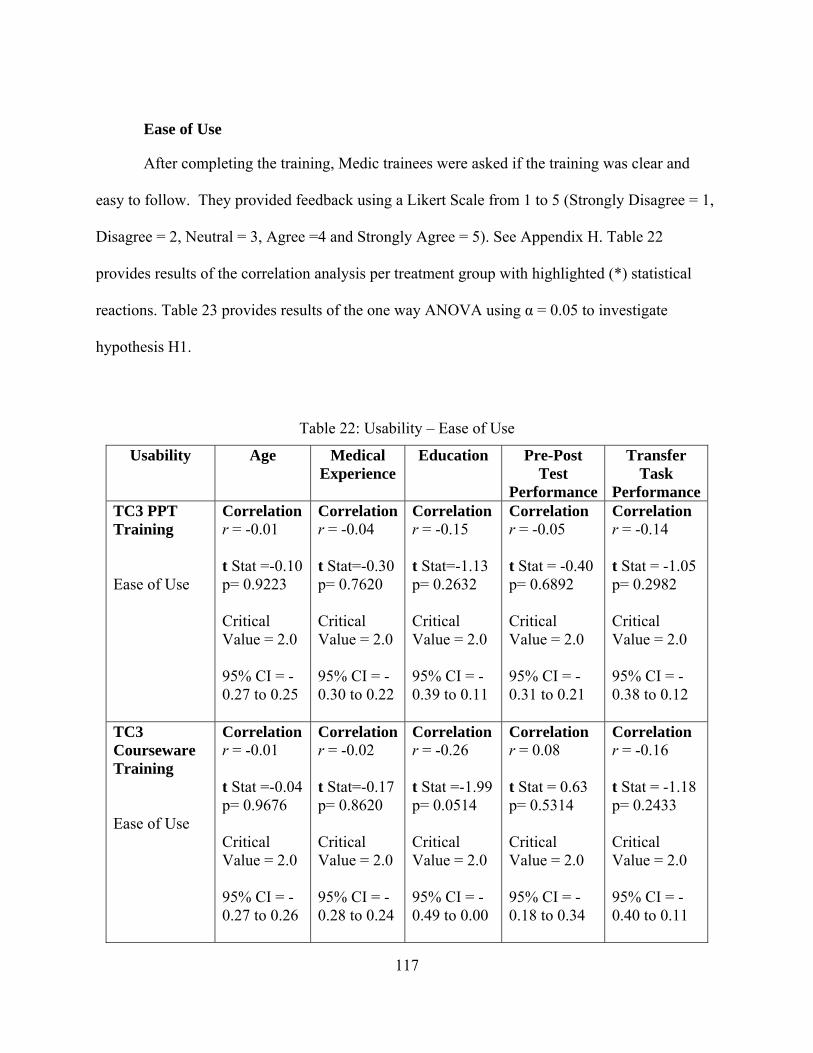
117
Ease of Use
After completing the training, Medic trainees were asked if the training was clear and
easy to follow. They provided feedback using a Likert Scale from 1 to 5 (Strongly Disagree = 1,
Disagree = 2, Neutral = 3, Agree =4 and Strongly Agree = 5). See Appendix H. Table 22
provides results of the correlation analysis per treatment group with highlighted (*) statistical
reactions. Table 23 provides results of the one way ANOVA using α = 0.05 to investigate
hypothesis H1.
Table 22: Usability – Ease of Use
Usability
Age Medical Experience
Education Pre-Post Test
Performance
Transfer Task
PerformanceTC3 PPT Training Ease of Use
Correlation r = -0.01 t Stat =-0.10 p= 0.9223 Critical Value = 2.0 95% CI = -0.27 to 0.25
Correlationr = -0.04 t Stat=-0.30 p= 0.7620 Critical Value = 2.0 95% CI = -0.30 to 0.22
Correlation r = -0.15 t Stat=-1.13 p= 0.2632 Critical Value = 2.0 95% CI = -0.39 to 0.11
Correlation r = -0.05 t Stat = -0.40 p= 0.6892 Critical Value = 2.0 95% CI = -0.31 to 0.21
Correlation r = -0.14 t Stat = -1.05 p= 0.2982 Critical Value = 2.0 95% CI = -0.38 to 0.12
TC3 Courseware Training Ease of Use
Correlation r = -0.01 t Stat =-0.04 p= 0.9676 Critical Value = 2.0 95% CI = -0.27 to 0.26
Correlationr = -0.02 t Stat=-0.17 p= 0.8620 Critical Value = 2.0 95% CI = -0.28 to 0.24
Correlation r = -0.26 t Stat =-1.99 p= 0.0514 Critical Value = 2.0 95% CI = -0.49 to 0.00
Correlation r = 0.08 t Stat = 0.63 p= 0.5314 Critical Value = 2.0 95% CI = -0.18 to 0.34
Correlation r = -0.16 t Stat = -1.18 p= 0.2433 Critical Value = 2.0 95% CI = -0.40 to 0.11
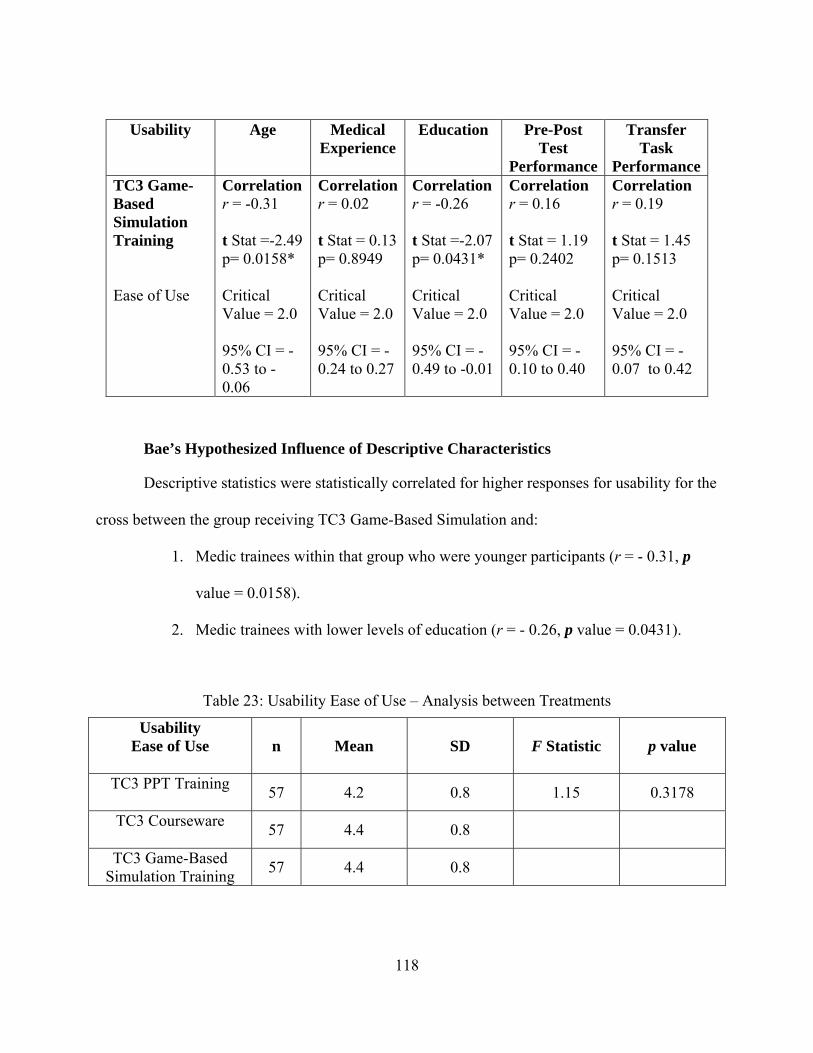
118
Usability
Age Medical Experience
Education Pre-Post Test
Performance
Transfer Task
PerformanceTC3 Game-Based Simulation Training Ease of Use
Correlation r = -0.31 t Stat =-2.49 p= 0.0158* Critical Value = 2.0 95% CI = -0.53 to -0.06
Correlationr = 0.02 t Stat = 0.13 p= 0.8949 Critical Value = 2.0 95% CI = -0.24 to 0.27
Correlation r = -0.26 t Stat =-2.07 p= 0.0431* Critical Value = 2.0 95% CI = -0.49 to -0.01
Correlation r = 0.16 t Stat = 1.19 p= 0.2402 Critical Value = 2.0 95% CI = -0.10 to 0.40
Correlation r = 0.19 t Stat = 1.45 p= 0.1513 Critical Value = 2.0 95% CI = -0.07 to 0.42
Bae’s Hypothesized Influence of Descriptive Characteristics
Descriptive statistics were statistically correlated for higher responses for usability for the
cross between the group receiving TC3 Game-Based Simulation and:
1. Medic trainees within that group who were younger participants (r = - 0.31, p
value = 0.0158).
2. Medic trainees with lower levels of education (r = - 0.26, p value = 0.0431).
Table 23: Usability Ease of Use – Analysis between Treatments
Usability Ease of Use
n Mean SD F Statistic p value
TC3 PPT Training
57 4.2 0.8 1.15 0.3178
TC3 Courseware
57 4.4 0.8
TC3 Game-Based Simulation Training
57 4.4 0.8

119
Analysis of Hypothesis One: Reaction to Ease of Use
As a group, medic trainees on average “Agree” that the training system was easy to use
regardless of the training treatment received. There was no significant difference in reaction
between training treatments ( p value = 0.3178).
Instructor Support
After completing the training, Medic trainees were asked if they felt that an instructor
was necessary to make their TC3 training beneficial to them. Participants were asked to circle a
number on a Likert Scale from 1 to 7 (1= “Very Much” agree, 4 = “Somewhat” agree, and 7 =
“Very Much” agree with the assertion) based on their experience using the assigned training
media. See Appendix K, L, and M: Question number 5. Table 24 provides results of the
correlation analysis per treatment group with highlighted (*) statistical reactions. Table 25
provides results of the one way ANOVA using α = 0.05 to investigate hypothesis H1.
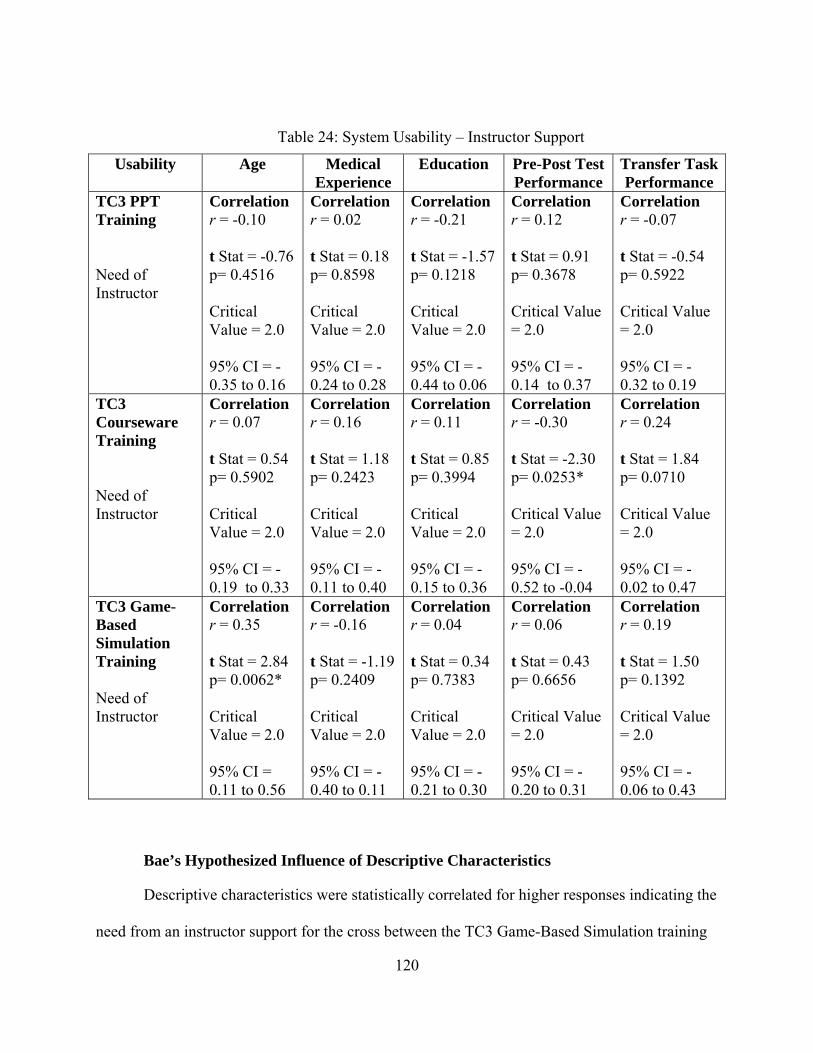
120
Table 24: System Usability – Instructor Support
Usability
Age Medical Experience
Education Pre-Post Test Performance
Transfer Task Performance
TC3 PPT Training Need of Instructor
Correlation r = -0.10 t Stat = -0.76 p= 0.4516 Critical Value = 2.0 95% CI = -0.35 to 0.16
Correlation r = 0.02 t Stat = 0.18 p= 0.8598 Critical Value = 2.0 95% CI = -0.24 to 0.28
Correlation r = -0.21 t Stat = -1.57 p= 0.1218 Critical Value = 2.0 95% CI = -0.44 to 0.06
Correlation r = 0.12 t Stat = 0.91 p= 0.3678 Critical Value = 2.0 95% CI = -0.14 to 0.37
Correlation r = -0.07 t Stat = -0.54 p= 0.5922 Critical Value = 2.0 95% CI = -0.32 to 0.19
TC3 Courseware Training Need of Instructor
Correlation r = 0.07 t Stat = 0.54 p= 0.5902 Critical Value = 2.0 95% CI = -0.19 to 0.33
Correlation r = 0.16 t Stat = 1.18 p= 0.2423 Critical Value = 2.0 95% CI = -0.11 to 0.40
Correlation r = 0.11 t Stat = 0.85 p= 0.3994 Critical Value = 2.0 95% CI = -0.15 to 0.36
Correlation r = -0.30 t Stat = -2.30 p= 0.0253* Critical Value = 2.0 95% CI = -0.52 to -0.04
Correlation r = 0.24 t Stat = 1.84 p= 0.0710 Critical Value = 2.0 95% CI = -0.02 to 0.47
TC3 Game-Based Simulation Training Need of Instructor
Correlation r = 0.35 t Stat = 2.84 p= 0.0062* Critical Value = 2.0 95% CI = 0.11 to 0.56
Correlation r = -0.16 t Stat = -1.19 p= 0.2409 Critical Value = 2.0 95% CI = -0.40 to 0.11
Correlation r = 0.04 t Stat = 0.34 p= 0.7383 Critical Value = 2.0 95% CI = -0.21 to 0.30
Correlation r = 0.06 t Stat = 0.43 p= 0.6656 Critical Value = 2.0 95% CI = -0.20 to 0.31
Correlation r = 0.19 t Stat = 1.50 p= 0.1392 Critical Value = 2.0 95% CI = -0.06 to 0.43
Bae’s Hypothesized Influence of Descriptive Characteristics
Descriptive characteristics were statistically correlated for higher responses indicating the
need from an instructor support for the cross between the TC3 Game-Based Simulation training
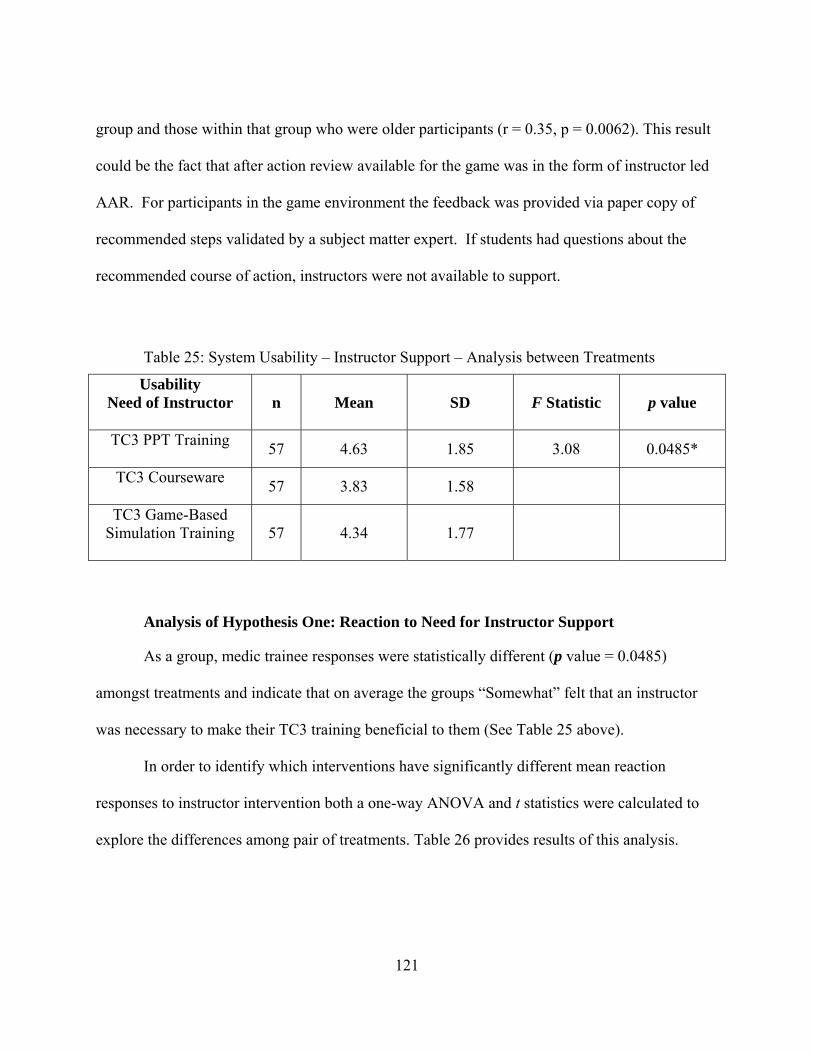
121
group and those within that group who were older participants (r = 0.35, p = 0.0062). This result
could be the fact that after action review available for the game was in the form of instructor led
AAR. For participants in the game environment the feedback was provided via paper copy of
recommended steps validated by a subject matter expert. If students had questions about the
recommended course of action, instructors were not available to support.
Table 25: System Usability – Instructor Support – Analysis between Treatments
Usability Need of Instructor
n Mean SD F Statistic p value
TC3 PPT Training
57 4.63 1.85 3.08 0.0485*
TC3 Courseware
57 3.83 1.58
TC3 Game-Based Simulation Training
57 4.34 1.77
Analysis of Hypothesis One: Reaction to Need for Instructor Support
As a group, medic trainee responses were statistically different (p value = 0.0485)
amongst treatments and indicate that on average the groups “Somewhat” felt that an instructor
was necessary to make their TC3 training beneficial to them (See Table 25 above).
In order to identify which interventions have significantly different mean reaction
responses to instructor intervention both a one-way ANOVA and t statistics were calculated to
explore the differences among pair of treatments. Table 26 provides results of this analysis.
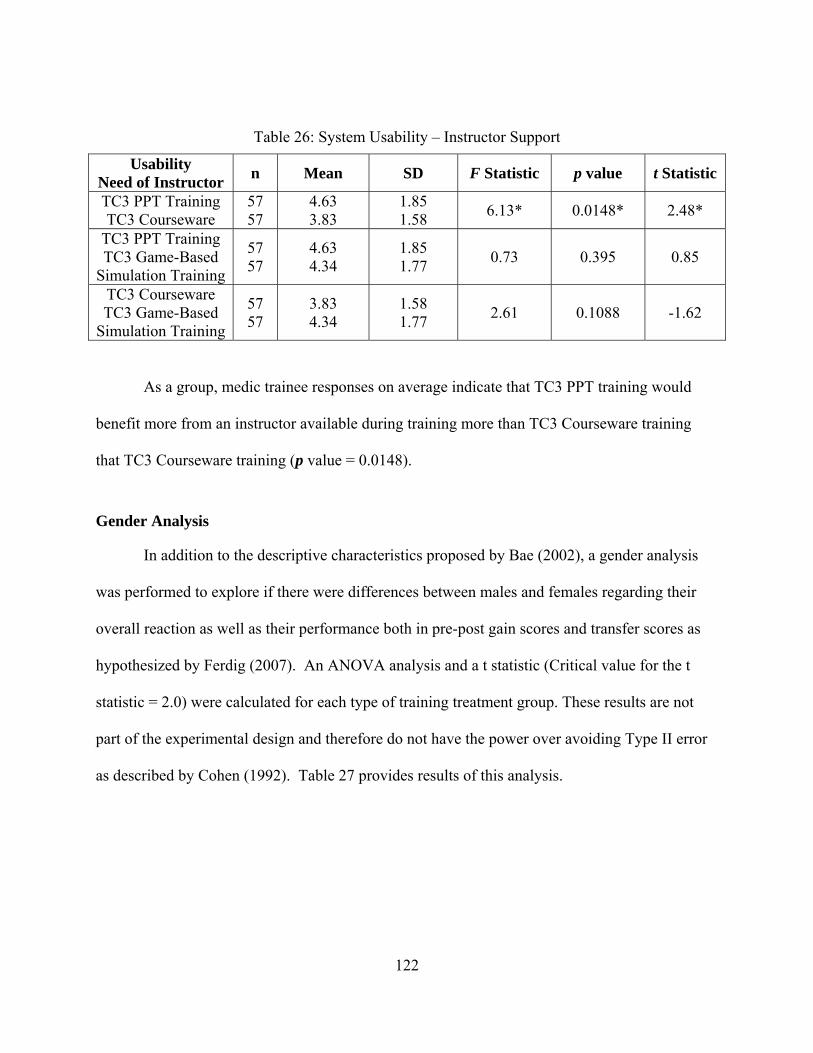
122
Table 26: System Usability – Instructor Support
Usability Need of Instructor
n Mean SD F Statistic p value t Statistic
TC3 PPT Training TC3 Courseware
57 57
4.63 3.83
1.85 1.58
6.13* 0.0148* 2.48*
TC3 PPT Training TC3 Game-Based
Simulation Training
57 57
4.63 4.34
1.85 1.77
0.73 0.395 0.85
TC3 Courseware TC3 Game-Based
Simulation Training
57 57
3.83 4.34
1.58 1.77
2.61 0.1088 -1.62
As a group, medic trainee responses on average indicate that TC3 PPT training would
benefit more from an instructor available during training more than TC3 Courseware training
that TC3 Courseware training (p value = 0.0148).
Gender Analysis
In addition to the descriptive characteristics proposed by Bae (2002), a gender analysis
was performed to explore if there were differences between males and females regarding their
overall reaction as well as their performance both in pre-post gain scores and transfer scores as
hypothesized by Ferdig (2007). An ANOVA analysis and a t statistic (Critical value for the t
statistic = 2.0) were calculated for each type of training treatment group. These results are not
part of the experimental design and therefore do not have the power over avoiding Type II error
as described by Cohen (1992). Table 27 provides results of this analysis.
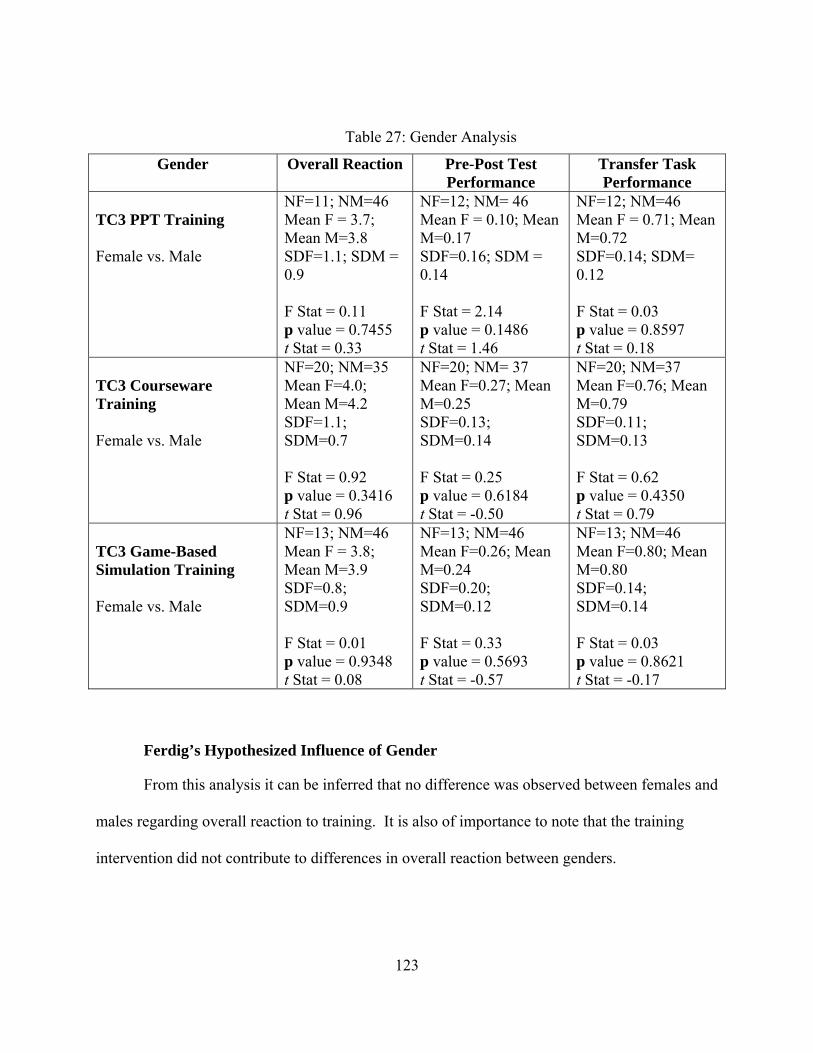
123
Table 27: Gender Analysis
Gender Overall Reaction Pre-Post Test Performance
Transfer Task Performance
TC3 PPT Training Female vs. Male
NF=11; NM=46 Mean F = 3.7; Mean M=3.8 SDF=1.1; SDM = 0.9 F Stat = 0.11 p value = 0.7455 t Stat = 0.33
NF=12; NM= 46 Mean F = 0.10; Mean M=0.17 SDF=0.16; SDM = 0.14 F Stat = 2.14 p value = 0.1486 t Stat = 1.46
NF=12; NM=46 Mean F = 0.71; Mean M=0.72 SDF=0.14; SDM= 0.12 F Stat = 0.03 p value = 0.8597 t Stat = 0.18
TC3 Courseware Training Female vs. Male
NF=20; NM=35 Mean F=4.0; Mean M=4.2 SDF=1.1; SDM=0.7 F Stat = 0.92 p value = 0.3416 t Stat = 0.96
NF=20; NM= 37 Mean F=0.27; Mean M=0.25 SDF=0.13; SDM=0.14 F Stat = 0.25 p value = 0.6184 t Stat = -0.50
NF=20; NM=37 Mean F=0.76; Mean M=0.79 SDF=0.11; SDM=0.13 F Stat = 0.62 p value = 0.4350 t Stat = 0.79
TC3 Game-Based Simulation Training Female vs. Male
NF=13; NM=46 Mean F = 3.8; Mean M=3.9 SDF=0.8; SDM=0.9 F Stat = 0.01 p value = 0.9348 t Stat = 0.08
NF=13; NM=46 Mean F=0.26; Mean M=0.24 SDF=0.20; SDM=0.12 F Stat = 0.33 p value = 0.5693 t Stat = -0.57
NF=13; NM=46 Mean F=0.80; Mean M=0.80 SDF=0.14; SDM=0.14 F Stat = 0.03 p value = 0.8621 t Stat = -0.17
Ferdig’s Hypothesized Influence of Gender
From this analysis it can be inferred that no difference was observed between females and
males regarding overall reaction to training. It is also of importance to note that the training
intervention did not contribute to differences in overall reaction between genders.
124
Level II Evaluation – Knowledge Acquisition
A Pre test was administered to each participant prior to training. The purpose of the pre
test was to measure prior knowledge and to determine if there were any differences between
treatment sample populations. After the subjects completed the training a post test was
administered.
Two main Hypotheses were tested to assess if the TC3 Game-Based Simulation
significantly improve post training knowledge and decision-making skills. Another hypothesis
was tested to explore content training time between training treatments:
H2: Knowledge post test scores for the TC3 Game-Based Simulation training group will
be significantly higher than their knowledge pretest scores.
H3: Pre-post test gain scores for the TC3 Game-Based Simulation training group will be
significantly higher than pre-post test gain scores for other TC3 training treatment
groups.
H4: Content training time for the TC3 Game-Based Simulation training group will be
significantly less than the content training time for other TC3 training treatment groups.
Data Collected to Analyze Hypotheses Two and Three: Level II Knowledge Acquisition
In order to measure acquisition of knowledge, a gain score was calculated subtracting the
pre test score from the post test score. The knowledge acquisition of 179 individuals was
analyzed. One individual was excused for being 17 years of age and did not complete any of the
training. In an effort to determine if there were any differences in pre-training knowledge in
participants between treatments, a one way ANOVA was performed using α = 0.05. In addition,
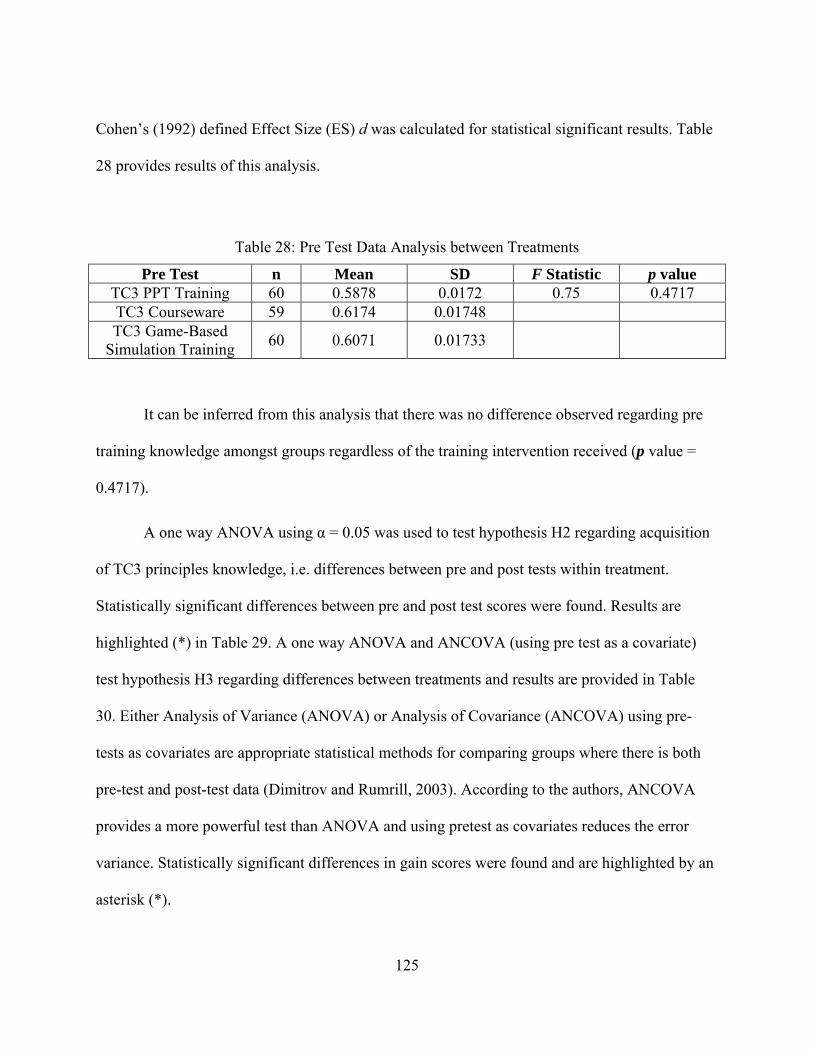
125
Cohen’s (1992) defined Effect Size (ES) d was calculated for statistical significant results. Table
28 provides results of this analysis.
Table 28: Pre Test Data Analysis between Treatments
Pre Test n Mean SD F Statistic p value TC3 PPT Training 60 0.5878 0.0172 0.75 0.4717 TC3 Courseware 59 0.6174 0.01748 TC3 Game-Based
Simulation Training 60 0.6071 0.01733
It can be inferred from this analysis that there was no difference observed regarding pre
training knowledge amongst groups regardless of the training intervention received (p value =
0.4717).
A one way ANOVA using α = 0.05 was used to test hypothesis H2 regarding acquisition
of TC3 principles knowledge, i.e. differences between pre and post tests within treatment.
Statistically significant differences between pre and post test scores were found. Results are
highlighted (*) in Table 29. A one way ANOVA and ANCOVA (using pre test as a covariate)
test hypothesis H3 regarding differences between treatments and results are provided in Table
30. Either Analysis of Variance (ANOVA) or Analysis of Covariance (ANCOVA) using pre-
tests as covariates are appropriate statistical methods for comparing groups where there is both
pre-test and post-test data (Dimitrov and Rumrill, 2003). According to the authors, ANCOVA
provides a more powerful test than ANOVA and using pretest as covariates reduces the error
variance. Statistically significant differences in gain scores were found and are highlighted by an
asterisk (*).
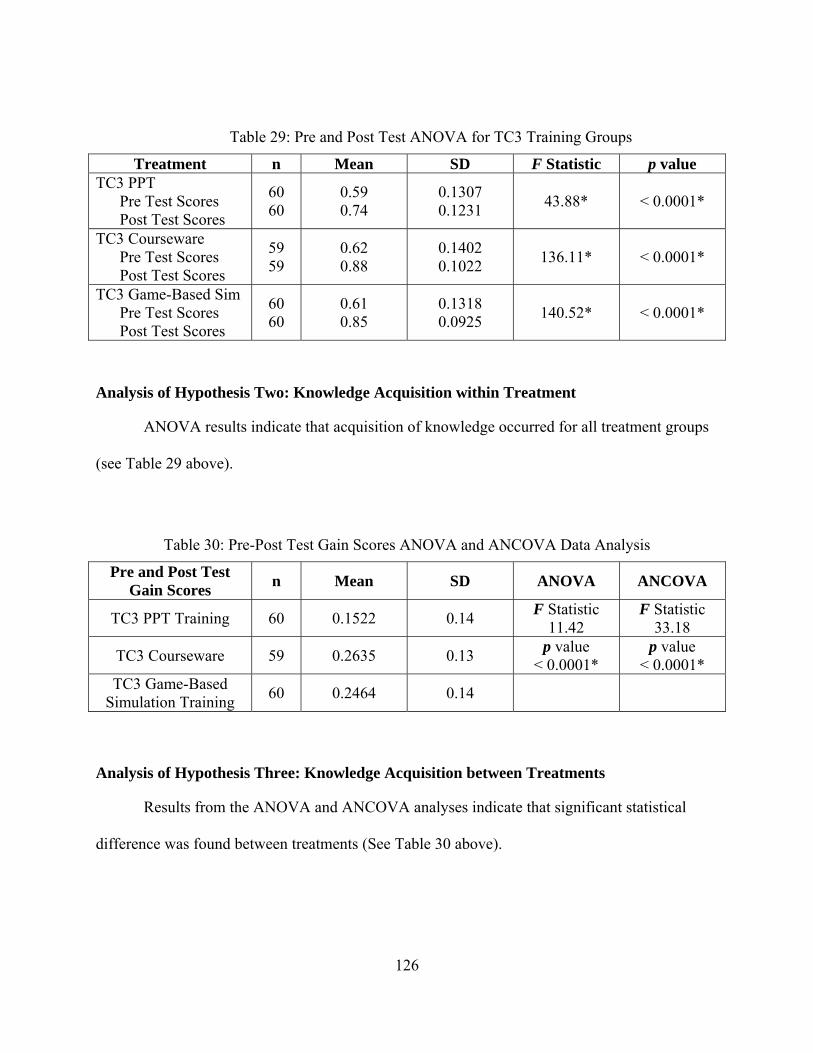
126
Table 29: Pre and Post Test ANOVA for TC3 Training Groups
Treatment n Mean SD F Statistic p value TC3 PPT Pre Test Scores Post Test Scores
60 60
0.59 0.74
0.1307 0.1231
43.88* < 0.0001*
TC3 Courseware Pre Test Scores Post Test Scores
59 59
0.62 0.88
0.1402 0.1022
136.11* < 0.0001*
TC3 Game-Based Sim Pre Test Scores Post Test Scores
60 60
0.61 0.85
0.1318 0.0925
140.52* < 0.0001*
Analysis of Hypothesis Two: Knowledge Acquisition within Treatment
ANOVA results indicate that acquisition of knowledge occurred for all treatment groups
(see Table 29 above).
Table 30: Pre-Post Test Gain Scores ANOVA and ANCOVA Data Analysis
Pre and Post Test Gain Scores
n Mean SD ANOVA ANCOVA
TC3 PPT Training 60 0.1522 0.14 F Statistic
11.42 F Statistic
33.18
TC3 Courseware 59 0.2635 0.13 p value
< 0.0001* p value
< 0.0001* TC3 Game-Based
Simulation Training 60 0.2464 0.14
Analysis of Hypothesis Three: Knowledge Acquisition between Treatments
Results from the ANOVA and ANCOVA analyses indicate that significant statistical
difference was found between treatments (See Table 30 above).
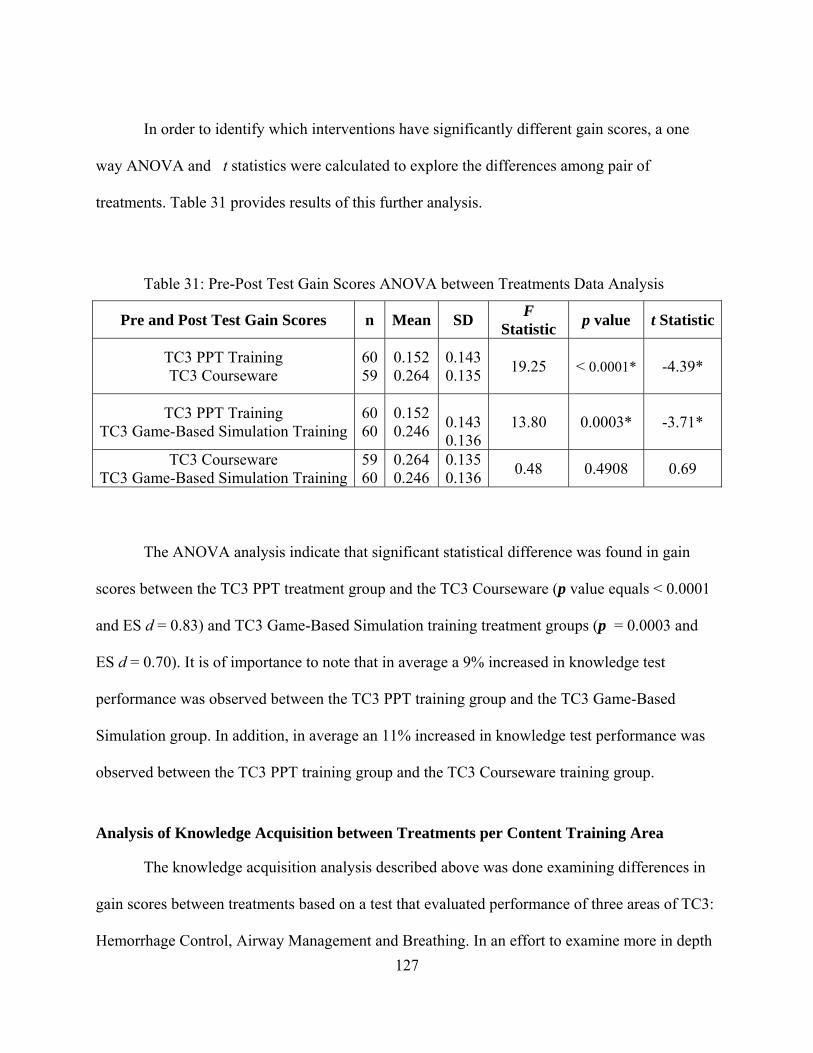
127
In order to identify which interventions have significantly different gain scores, a one
way ANOVA and t statistics were calculated to explore the differences among pair of
treatments. Table 31 provides results of this further analysis.
Table 31: Pre-Post Test Gain Scores ANOVA between Treatments Data Analysis
Pre and Post Test Gain Scores n Mean SD F
Statistic p value t Statistic
TC3 PPT Training TC3 Courseware
6059
0.152 0.264
0.1430.135
19.25
< 0.0001*
-4.39*
TC3 PPT Training TC3 Game-Based Simulation Training
6060
0.152 0.246
0.1430.136
13.80 0.0003* -3.71*
TC3 Courseware TC3 Game-Based Simulation Training
5960
0.264 0.246
0.1350.136
0.48 0.4908 0.69
The ANOVA analysis indicate that significant statistical difference was found in gain
scores between the TC3 PPT treatment group and the TC3 Courseware (p value equals < 0.0001
and ES d = 0.83) and TC3 Game-Based Simulation training treatment groups (p = 0.0003 and
ES d = 0.70). It is of importance to note that in average a 9% increased in knowledge test
performance was observed between the TC3 PPT training group and the TC3 Game-Based
Simulation group. In addition, in average an 11% increased in knowledge test performance was
observed between the TC3 PPT training group and the TC3 Courseware training group.
Analysis of Knowledge Acquisition between Treatments per Content Training Area
The knowledge acquisition analysis described above was done examining differences in
gain scores between treatments based on a test that evaluated performance of three areas of TC3:
Hemorrhage Control, Airway Management and Breathing. In an effort to examine more in depth
128
the differences observed between the treatment groups regarding acquisition of knowledge, an
analysis was performed to explore if difference in content training modules (i.e. Hemorrhage
Control, Airway Management and Breathing) were observed between treatment groups. For each
participant, percentages of missed questions in each content area were calculated. A one way
ANOVA using α = 0.05 was used to explore differences between treatment groups in the areas of
Hemorrhage Control, Airway Management and Breathing. Statistically significant differences
were found between treatment groups. The following is a summary of findings per content
training module:
Hemorrhage Control – no significant difference was found in percentage of missed
questions between treatment groups (p = 0.3609) in the area of hemorrhage control.
Airway Management - the ANOVA analysis indicates that significant statistical
difference was found in percentage of missed questions between the TC3 PPT and the
TC3 Courseware ( p = 0.0002 and ES d = 0.59) treatment groups. The TC3 Courseware
treatment group experienced a 16 % decrease in percentage of missed questions from
what was observed in the TC3 PPT treatment group. Also, significant statistical
difference was found in percentage of missed questions between the TC3 Courseware and
TC3 Game-Based Simulation treatment groups (p = 0.0277 and ES d = 0.44) in the area
of airway management. The TC3 Courseware treatment group experienced an 8%
decrease in percentage of missed questions from what was observed in the TC3 Game-
Based Simulation treatment group.
Breathing - the ANOVA analysis indicate that significant statistical difference was found
in percentage of missed questions between the TC3 PPT treatment group and the TC3
Courseware ( p < 0.0001 and ES d = 1.37) and TC3 Game-Based Simulation ( p < 0.0001
129
and ES d = 0.37) training treatment groups. The TC3 Courseware treatment group
experienced a 23 % decrease in percentage of missed questions from what was observed
in the TC3 PPT treatment group. The TC3 Game-Based Simulation treatment group
experienced a 20 % decrease in percentage of missed questions from what was observed
in the TC3 PPT treatment group. No significant difference was found in percentage of
missed questions between the TC3 Courseware and TC3 Game-Based Simulation
treatment groups (p = 0.2865) in the area of breathing.
Ferdig’s Hypothesized Influence of Gender
Gender analysis indicates no difference between females and males regarding
performance in knowledge test (See Table 27 above).
Relationship between Reaction to Training and Performance in Knowledge Test
Medic trainees responses were statistically correlated for the TC3 Courseware training
group with higher gain scores and lower scores of reaction towards needing an instructor during
training (r = -0.30, p = 0.0253). See Table 24 above. This is of significance since the courseware
training system was developed as a distance learning tool to support medic sustainment training.
Data Collected to Analyze Hypothesis Four: Differences in Content Training Time between Treatments
In an effort to look more in-depth at the differences observed between the TC3 PTT
Training group, TC3 Courseware Training group and TC3 Game-Based Simulation Training
group, an analysis of Content Training Time was performed to test H4. Each participant was
asked to record the time they spent on content training (See Appendices D, E and F).
Participants in the TC3 PPT training group recorded the time they spent going over the
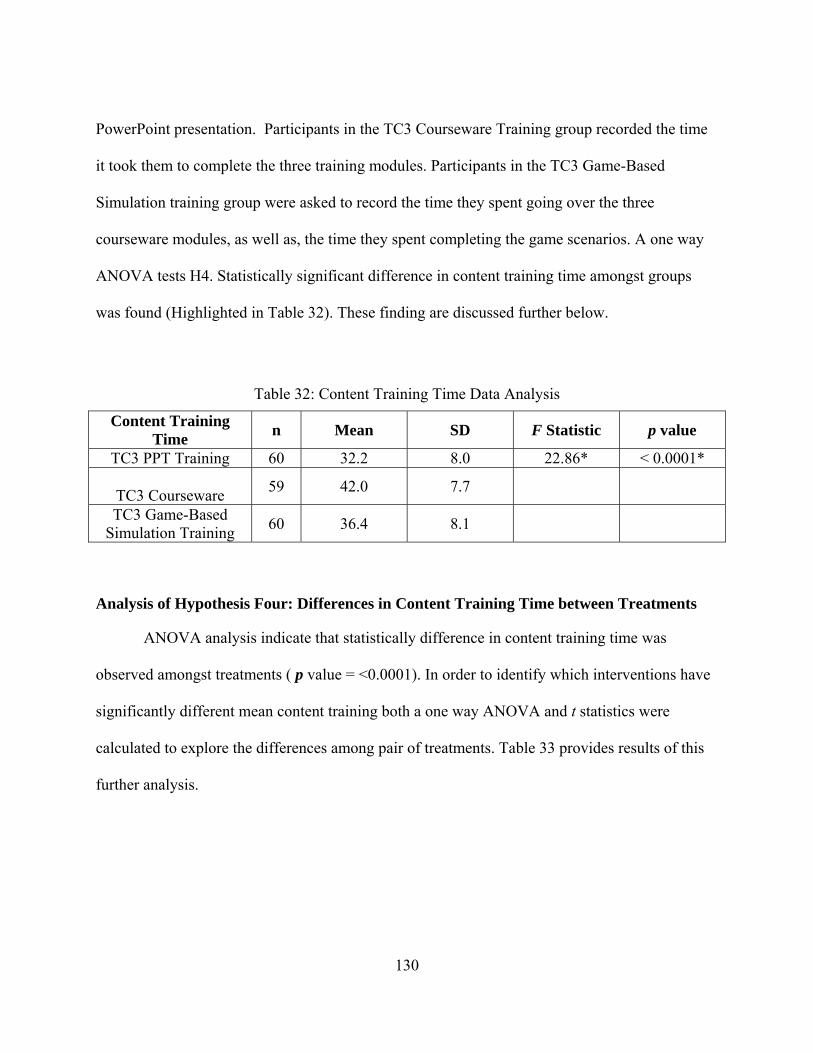
130
PowerPoint presentation. Participants in the TC3 Courseware Training group recorded the time
it took them to complete the three training modules. Participants in the TC3 Game-Based
Simulation training group were asked to record the time they spent going over the three
courseware modules, as well as, the time they spent completing the game scenarios. A one way
ANOVA tests H4. Statistically significant difference in content training time amongst groups
was found (Highlighted in Table 32). These finding are discussed further below.
Table 32: Content Training Time Data Analysis
Content Training Time
n Mean SD F Statistic p value
TC3 PPT Training 60 32.2 8.0 22.86* < 0.0001*
TC3 Courseware 59 42.0 7.7
TC3 Game-Based Simulation Training
60 36.4 8.1
Analysis of Hypothesis Four: Differences in Content Training Time between Treatments
ANOVA analysis indicate that statistically difference in content training time was
observed amongst treatments ( p value = <0.0001). In order to identify which interventions have
significantly different mean content training both a one way ANOVA and t statistics were
calculated to explore the differences among pair of treatments. Table 33 provides results of this
further analysis.
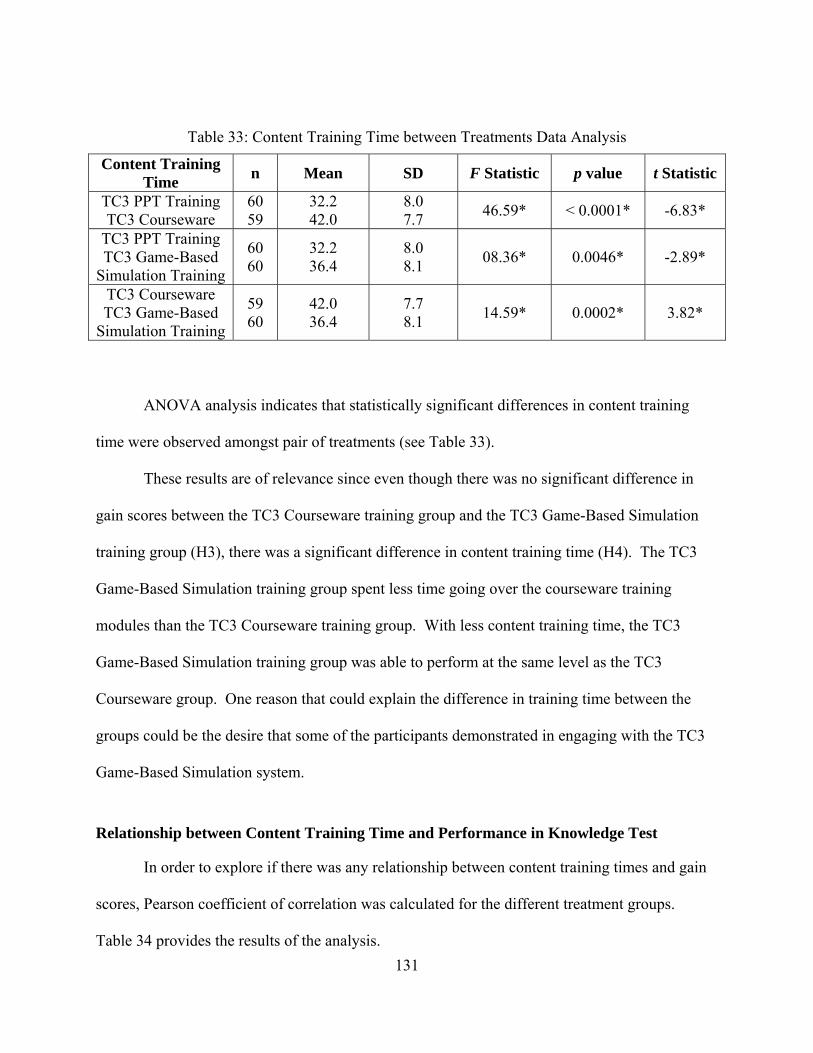
131
Table 33: Content Training Time between Treatments Data Analysis
Content Training Time
n Mean SD F Statistic p value t Statistic
TC3 PPT Training TC3 Courseware
60 59
32.2 42.0
8.0 7.7
46.59* < 0.0001* -6.83*
TC3 PPT Training TC3 Game-Based
Simulation Training
60 60
32.2 36.4
8.0 8.1
08.36* 0.0046* -2.89*
TC3 Courseware TC3 Game-Based
Simulation Training
59 60
42.0 36.4
7.7 8.1
14.59* 0.0002* 3.82*
ANOVA analysis indicates that statistically significant differences in content training
time were observed amongst pair of treatments (see Table 33).
These results are of relevance since even though there was no significant difference in
gain scores between the TC3 Courseware training group and the TC3 Game-Based Simulation
training group (H3), there was a significant difference in content training time (H4). The TC3
Game-Based Simulation training group spent less time going over the courseware training
modules than the TC3 Courseware training group. With less content training time, the TC3
Game-Based Simulation training group was able to perform at the same level as the TC3
Courseware group. One reason that could explain the difference in training time between the
groups could be the desire that some of the participants demonstrated in engaging with the TC3
Game-Based Simulation system.
Relationship between Content Training Time and Performance in Knowledge Test
In order to explore if there was any relationship between content training times and gain
scores, Pearson coefficient of correlation was calculated for the different treatment groups.
Table 34 provides the results of the analysis.
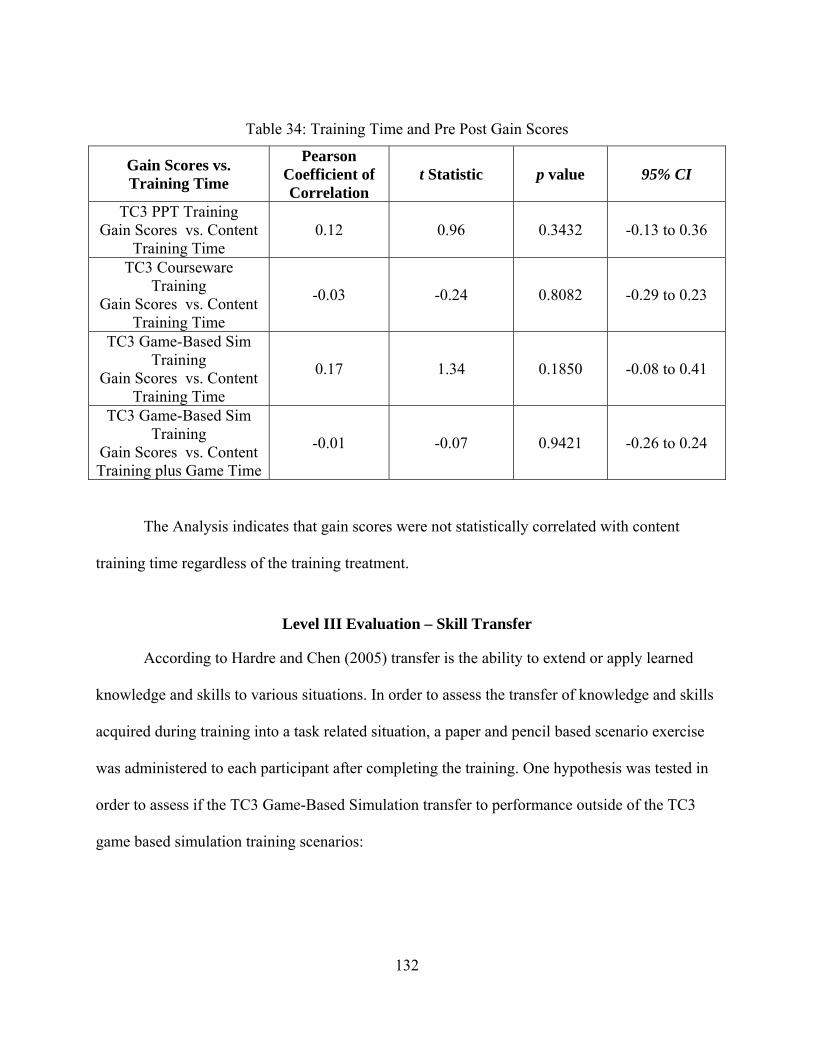
132
Table 34: Training Time and Pre Post Gain Scores
Gain Scores vs. Training Time
Pearson Coefficient of Correlation
t Statistic p value 95% CI
TC3 PPT Training Gain Scores vs. Content
Training Time 0.12 0.96 0.3432 -0.13 to 0.36
TC3 Courseware Training
Gain Scores vs. Content Training Time
-0.03 -0.24 0.8082 -0.29 to 0.23
TC3 Game-Based Sim Training
Gain Scores vs. Content Training Time
0.17 1.34 0.1850 -0.08 to 0.41
TC3 Game-Based Sim Training
Gain Scores vs. Content Training plus Game Time
-0.01 -0.07 0.9421 -0.26 to 0.24
The Analysis indicates that gain scores were not statistically correlated with content
training time regardless of the training treatment.
Level III Evaluation – Skill Transfer
According to Hardre and Chen (2005) transfer is the ability to extend or apply learned
knowledge and skills to various situations. In order to assess the transfer of knowledge and skills
acquired during training into a task related situation, a paper and pencil based scenario exercise
was administered to each participant after completing the training. One hypothesis was tested in
order to assess if the TC3 Game-Based Simulation transfer to performance outside of the TC3
game based simulation training scenarios:
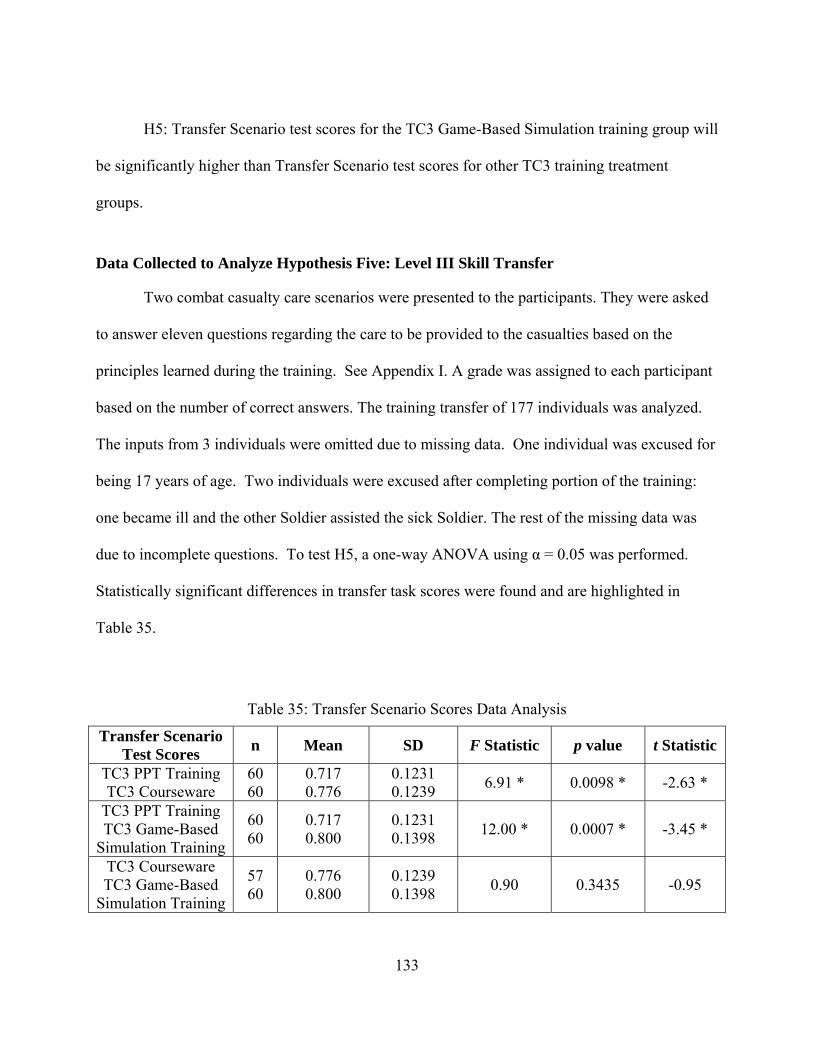
133
H5: Transfer Scenario test scores for the TC3 Game-Based Simulation training group will
be significantly higher than Transfer Scenario test scores for other TC3 training treatment
groups.
Data Collected to Analyze Hypothesis Five: Level III Skill Transfer
Two combat casualty care scenarios were presented to the participants. They were asked
to answer eleven questions regarding the care to be provided to the casualties based on the
principles learned during the training. See Appendix I. A grade was assigned to each participant
based on the number of correct answers. The training transfer of 177 individuals was analyzed.
The inputs from 3 individuals were omitted due to missing data. One individual was excused for
being 17 years of age. Two individuals were excused after completing portion of the training:
one became ill and the other Soldier assisted the sick Soldier. The rest of the missing data was
due to incomplete questions. To test H5, a one-way ANOVA using α = 0.05 was performed.
Statistically significant differences in transfer task scores were found and are highlighted in
Table 35.
Table 35: Transfer Scenario Scores Data Analysis
Transfer Scenario Test Scores
n Mean SD F Statistic p value t Statistic
TC3 PPT Training TC3 Courseware
60 60
0.717 0.776
0.1231 0.1239
6.91 * 0.0098 * -2.63 *
TC3 PPT Training TC3 Game-Based
Simulation Training
60 60
0.717 0.800
0.1231 0.1398
12.00 * 0.0007 * -3.45 *
TC3 Courseware TC3 Game-Based
Simulation Training
57 60
0.776 0.800
0.1239 0.1398
0.90 0.3435 -0.95
134
Analysis of Hypothesis Five: Skill Transfer
ANOVA analysis indicates that the TC3 Courseware and theTC3 Game-Based
Simulation training groups scored higher in the transfer task test (p value = 0.0007 & ES d =
0.50 and p value = 0.0007 & ES d = 0.60 respectively) than the TC3 PPT training group. No
significant difference was found for the game-based simulation training group and the TC3
Courseware training group. It is of importance to note that in average a 9% increased in transfer
scenario performance was observed between the TC3 PPT training group and the TC3 Game-
Based Simulation group.
Analysis of Skill Transfer Performance between Treatments per Content Training Area
The skill transfer analysis described above was done examining differences in transfer
test scores between treatments based on a test that evaluated skill transfer performance in three
areas of TC3: Hemorrhage Control, Airway Management and Breathing. In an effort to examine
more in depth the differences observed between the treatment groups regarding skill transfer, an
analysis was performed to explore if difference in performance in the areas of Hemorrhage
Control, Airway Management and Breathing were observed between treatment groups. For each
participant, percentages of missed questions in each content area were calculated. A one way
ANOVA using α = 0.05 was used to explore differences in skill transfer performance between
treatment groups in the areas of Hemorrhage Control, Airway Management and Breathing.
Statistically significant differences were found between treatment groups. The following is a
summary of findings:
Hemorrhage Control – the ANOVA analysis indicate that significant statistical difference
was found in percentage of missed questions in the transfer test between the TC3 PPT
135
treatment group and the TC3 Courseware ( p = 0.0495 and ES d = 0.33) and TC3 Game-
Based Simulation ( p = 0.0015 and ES d = 0.65) training treatment groups. The TC3
Courseware treatment group experienced a 7 % decrease in percentage of missed
questions from what was observed in the TC3 PPT treatment group. The TC3 Game-
Based Simulation treatment group experienced an 11 % decrease in percentage of missed
questions from what was observed in the TC3 PPT treatment group. No significant
difference was found in percentage of missed questions between the TC3 Courseware and
TC3 Game-Based Simulation treatment groups (p = 0.3394) in the area of hemorrhage
control.
Airway Management - the ANOVA analysis indicate that significant statistical
difference was found in percentage of missed questions between the TC3 Game-Based
Simulation treatment group and the TC3 Courseware ( p = 0.0032 and ES d = 0.57) and
TC3 PPT ( p =0.0002 and ES d = 0.73) training treatment groups. The TC3 Game-Based
Simulation treatment group experienced a 24 % decrease in percentage of missed
questions from what was observed in the TC3 PPT treatment group. The TC3 Game-
Based Simulation treatment group experienced a 20 % decrease in percentage of missed
questions from what was observed in the TC3 Courseware treatment group. No
significant statistical difference was found in percentage of missed questions between the
TC3 PPT and TC3 Courseware treatment groups (p = 0.3703) in the area of airway
management.
Breathing - the ANOVA analysis indicate that no significant difference was found in
percentage of missed questions between treatment groups (p = 0.7184) in the area of
breathing.
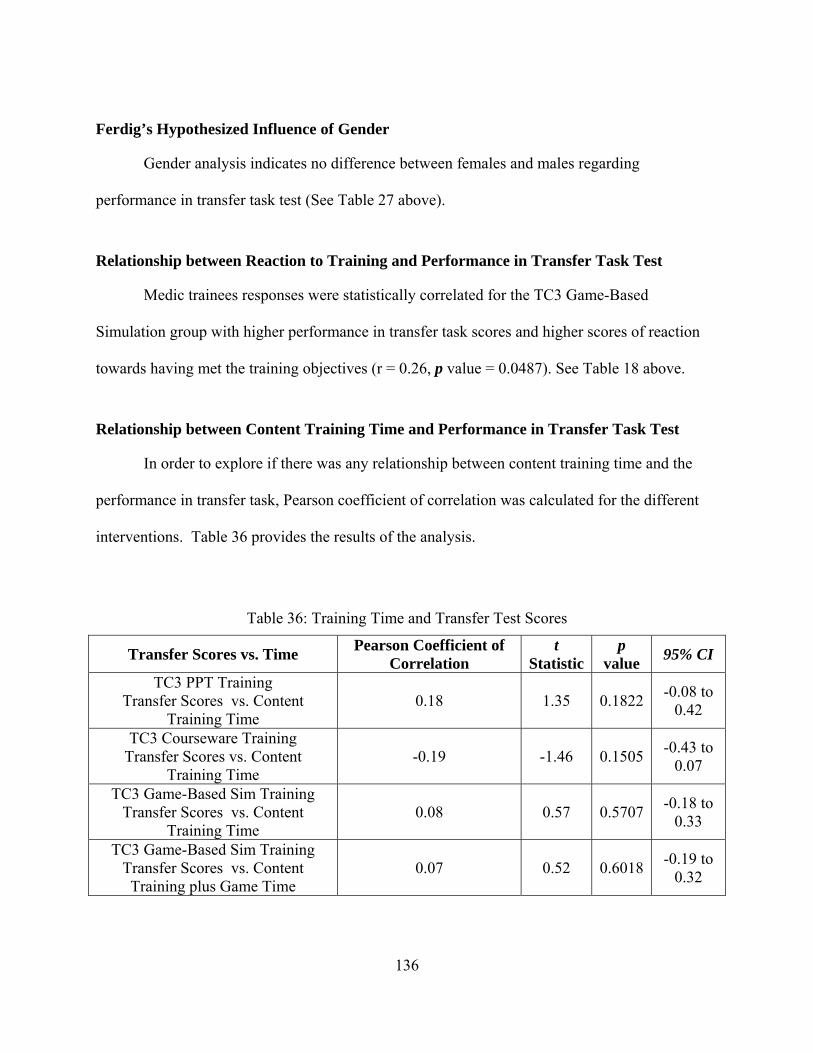
136
Ferdig’s Hypothesized Influence of Gender
Gender analysis indicates no difference between females and males regarding
performance in transfer task test (See Table 27 above).
Relationship between Reaction to Training and Performance in Transfer Task Test
Medic trainees responses were statistically correlated for the TC3 Game-Based
Simulation group with higher performance in transfer task scores and higher scores of reaction
towards having met the training objectives (r = 0.26, p value = 0.0487). See Table 18 above.
Relationship between Content Training Time and Performance in Transfer Task Test
In order to explore if there was any relationship between content training time and the
performance in transfer task, Pearson coefficient of correlation was calculated for the different
interventions. Table 36 provides the results of the analysis.
Table 36: Training Time and Transfer Test Scores
Transfer Scores vs. Time Pearson Coefficient of
Correlation t
Statistic p
value 95% CI
TC3 PPT Training Transfer Scores vs. Content
Training Time 0.18 1.35 0.1822
-0.08 to 0.42
TC3 Courseware Training Transfer Scores vs. Content
Training Time -0.19 -1.46 0.1505
-0.43 to 0.07
TC3 Game-Based Sim Training Transfer Scores vs. Content
Training Time 0.08 0.57 0.5707
-0.18 to 0.33
TC3 Game-Based Sim Training Transfer Scores vs. Content Training plus Game Time
0.07 0.52 0.6018 -0.19 to
0.32
137
The Analysis indicates that transfer task scores were not statistically correlated with
content training time regardless of the training treatment.
Self-Efficacy Evaluation
Self efficacy has proven to be an important factor in the area of academic achievement in
traditional learning settings (Hodges 2008) and research suggest that people with high efficacy
typically manifest higher confidence levels (Lanigan 2008). Self efficacy was assessed after
training and after completing the scenarios. The following hypothesis was tested in order to
assess if the TC3 Game-Based Simulation training system significantly enhances trainee self-
efficacy:
H6: Self-Efficacy scores for the TC3 Game-Based Simulation training group will be
significantly higher than self-efficacy scores for other TC3 training treatment groups.
Data Collected to Analyze Hypothesis Six: Self Efficacy
After completing the training and post test, Medic trainees were asked if they felt
confident that they would be able to perform back on the job the tasks associated with the
training objectives in the area of Hemorrhage Control, Airway Management and Breathing.
After completing the scenarios, Medic trainees were asked if they felt that the training enabled
them to complete the scenarios and apply the principles associated to the training objectives in
the area of Hemorrhage Control, Airway Management and Breathing. They provided feedback
using a Likert Scale from 1 to 5 (Strongly Disagree=1, Disagree=2, Neutral=3, Agree=4 and
Strongly Agree=5). See Appendices H and J respectively. The average of the responses was
calculated for analysis purposes. To test H6, a one-way ANOVA for completely randomized
designs was performed to determine if self-efficacy scores significantly differ for the TC3 Game-
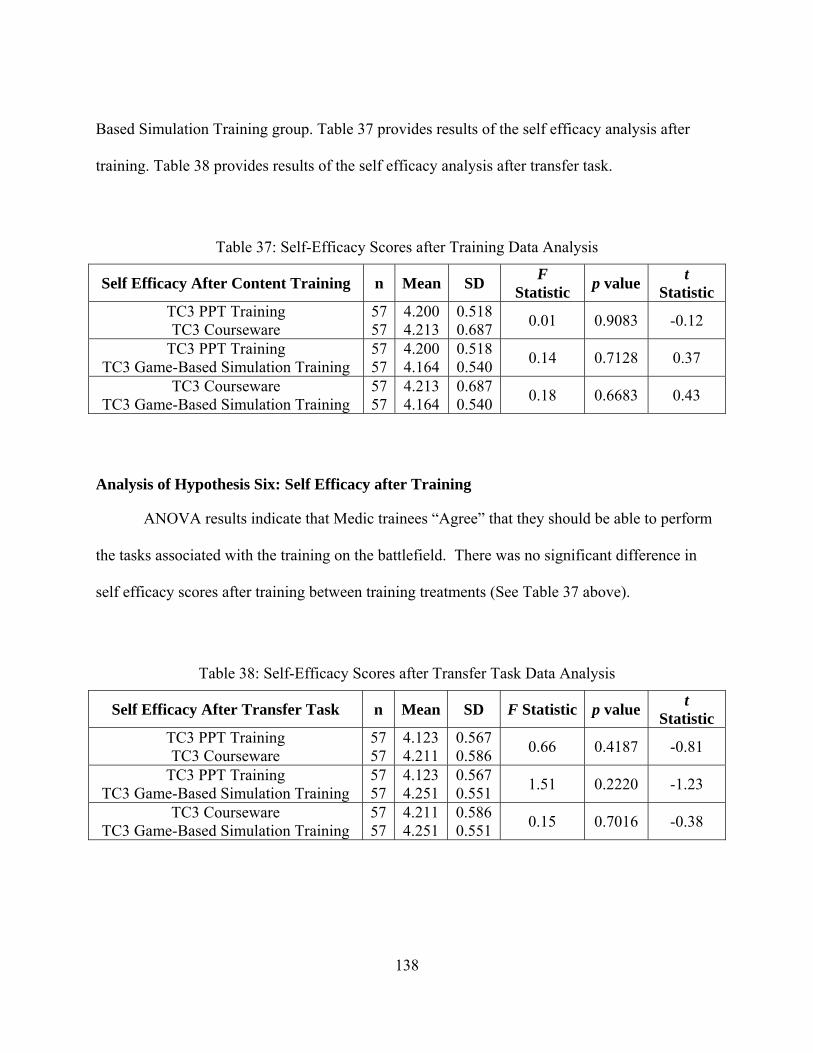
138
Based Simulation Training group. Table 37 provides results of the self efficacy analysis after
training. Table 38 provides results of the self efficacy analysis after transfer task.
Table 37: Self-Efficacy Scores after Training Data Analysis
Self Efficacy After Content Training n Mean SD F
Statistic p value
t Statistic
TC3 PPT Training TC3 Courseware
57 57
4.200 4.213
0.518 0.687
0.01 0.9083 -0.12
TC3 PPT Training TC3 Game-Based Simulation Training
57 57
4.200 4.164
0.518 0.540
0.14 0.7128 0.37
TC3 Courseware TC3 Game-Based Simulation Training
57 57
4.213 4.164
0.687 0.540
0.18 0.6683 0.43
Analysis of Hypothesis Six: Self Efficacy after Training
ANOVA results indicate that Medic trainees “Agree” that they should be able to perform
the tasks associated with the training on the battlefield. There was no significant difference in
self efficacy scores after training between training treatments (See Table 37 above).
Table 38: Self-Efficacy Scores after Transfer Task Data Analysis
Self Efficacy After Transfer Task n Mean SD F Statistic p value t
Statistic TC3 PPT Training TC3 Courseware
57 57
4.123 4.211
0.567 0.586
0.66 0.4187 -0.81
TC3 PPT Training TC3 Game-Based Simulation Training
57 57
4.123 4.251
0.567 0.551
1.51 0.2220 -1.23
TC3 Courseware TC3 Game-Based Simulation Training
57 57
4.211 4.251
0.586 0.551
0.15 0.7016 -0.38
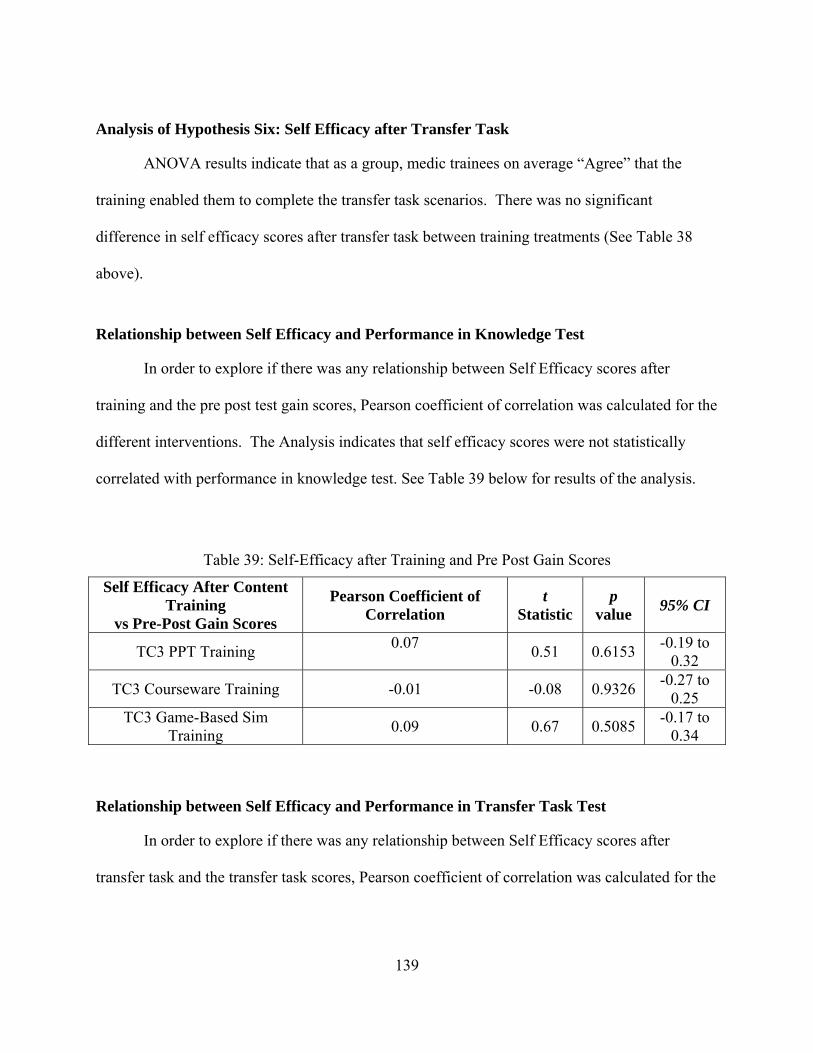
139
Analysis of Hypothesis Six: Self Efficacy after Transfer Task
ANOVA results indicate that as a group, medic trainees on average “Agree” that the
training enabled them to complete the transfer task scenarios. There was no significant
difference in self efficacy scores after transfer task between training treatments (See Table 38
above).
Relationship between Self Efficacy and Performance in Knowledge Test
In order to explore if there was any relationship between Self Efficacy scores after
training and the pre post test gain scores, Pearson coefficient of correlation was calculated for the
different interventions. The Analysis indicates that self efficacy scores were not statistically
correlated with performance in knowledge test. See Table 39 below for results of the analysis.
Table 39: Self-Efficacy after Training and Pre Post Gain Scores
Self Efficacy After Content Training
vs Pre-Post Gain Scores
Pearson Coefficient of Correlation
t Statistic
p value
95% CI
TC3 PPT Training 0.07
0.51 0.6153
-0.19 to 0.32
TC3 Courseware Training -0.01 -0.08 0.9326 -0.27 to
0.25 TC3 Game-Based Sim
Training 0.09 0.67 0.5085
-0.17 to 0.34
Relationship between Self Efficacy and Performance in Transfer Task Test
In order to explore if there was any relationship between Self Efficacy scores after
transfer task and the transfer task scores, Pearson coefficient of correlation was calculated for the
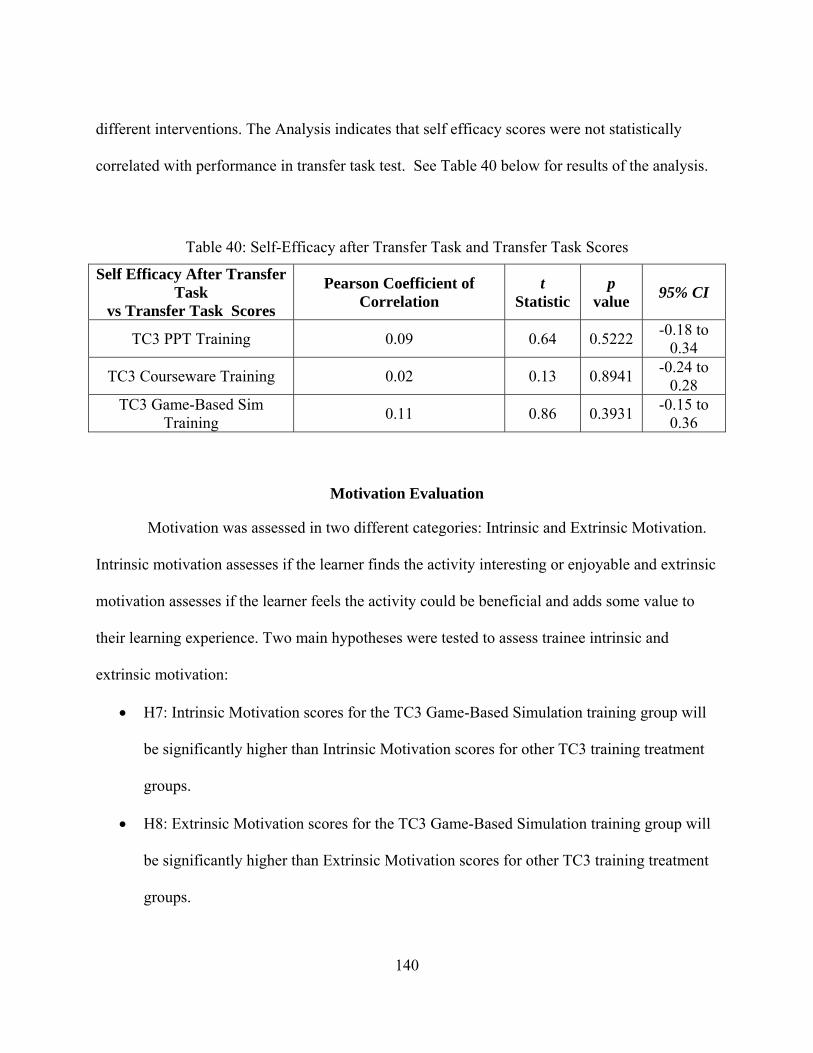
140
different interventions. The Analysis indicates that self efficacy scores were not statistically
correlated with performance in transfer task test. See Table 40 below for results of the analysis.
Table 40: Self-Efficacy after Transfer Task and Transfer Task Scores
Self Efficacy After Transfer Task
vs Transfer Task Scores
Pearson Coefficient of Correlation
t Statistic
p value
95% CI
TC3 PPT Training 0.09 0.64 0.5222 -0.18 to
0.34
TC3 Courseware Training 0.02 0.13 0.8941 -0.24 to
0.28 TC3 Game-Based Sim
Training 0.11 0.86 0.3931
-0.15 to 0.36
Motivation Evaluation
Motivation was assessed in two different categories: Intrinsic and Extrinsic Motivation.
Intrinsic motivation assesses if the learner finds the activity interesting or enjoyable and extrinsic
motivation assesses if the learner feels the activity could be beneficial and adds some value to
their learning experience. Two main hypotheses were tested to assess trainee intrinsic and
extrinsic motivation:
H7: Intrinsic Motivation scores for the TC3 Game-Based Simulation training group will
be significantly higher than Intrinsic Motivation scores for other TC3 training treatment
groups.
H8: Extrinsic Motivation scores for the TC3 Game-Based Simulation training group will
be significantly higher than Extrinsic Motivation scores for other TC3 training treatment
groups.
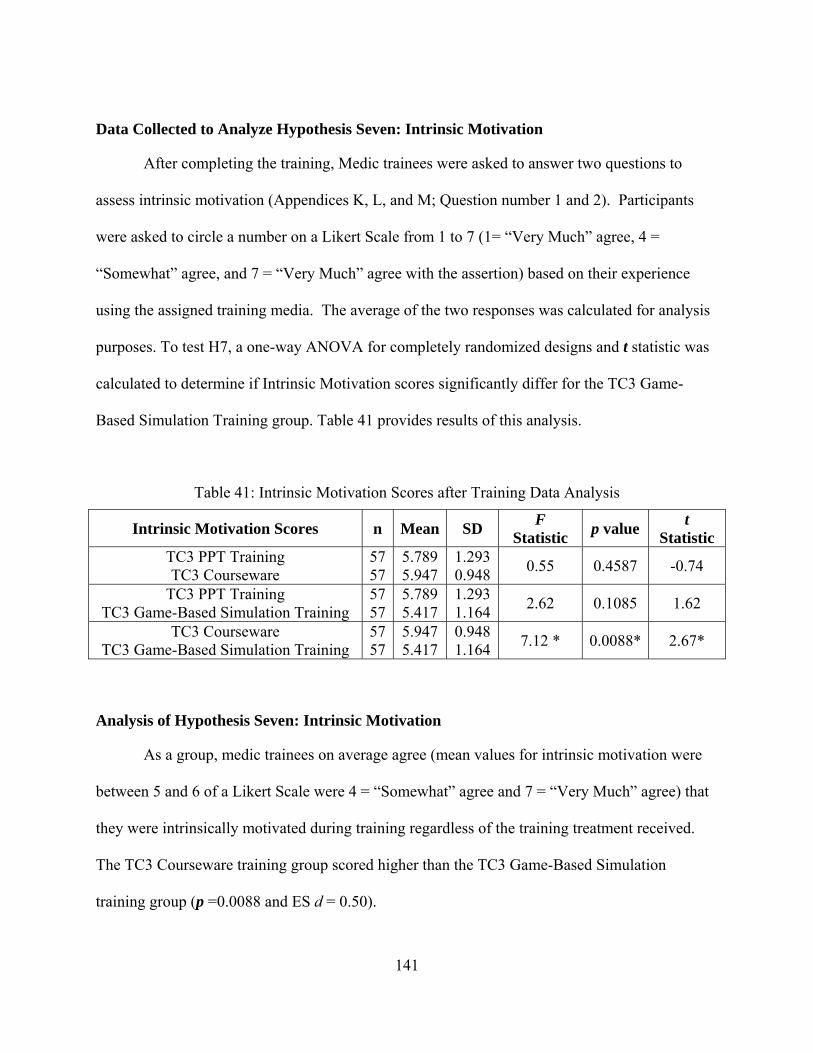
141
Data Collected to Analyze Hypothesis Seven: Intrinsic Motivation
After completing the training, Medic trainees were asked to answer two questions to
assess intrinsic motivation (Appendices K, L, and M; Question number 1 and 2). Participants
were asked to circle a number on a Likert Scale from 1 to 7 (1= “Very Much” agree, 4 =
“Somewhat” agree, and 7 = “Very Much” agree with the assertion) based on their experience
using the assigned training media. The average of the two responses was calculated for analysis
purposes. To test H7, a one-way ANOVA for completely randomized designs and t statistic was
calculated to determine if Intrinsic Motivation scores significantly differ for the TC3 Game-
Based Simulation Training group. Table 41 provides results of this analysis.
Table 41: Intrinsic Motivation Scores after Training Data Analysis
Intrinsic Motivation Scores n Mean SD F
Statistic p value
t Statistic
TC3 PPT Training TC3 Courseware
57 57
5.789 5.947
1.293 0.948
0.55 0.4587 -0.74
TC3 PPT Training TC3 Game-Based Simulation Training
57 57
5.789 5.417
1.293 1.164
2.62 0.1085 1.62
TC3 Courseware TC3 Game-Based Simulation Training
57 57
5.947 5.417
0.948 1.164
7.12 * 0.0088* 2.67*
Analysis of Hypothesis Seven: Intrinsic Motivation
As a group, medic trainees on average agree (mean values for intrinsic motivation were
between 5 and 6 of a Likert Scale were 4 = “Somewhat” agree and 7 = “Very Much” agree) that
they were intrinsically motivated during training regardless of the training treatment received.
The TC3 Courseware training group scored higher than the TC3 Game-Based Simulation
training group (p =0.0088 and ES d = 0.50).
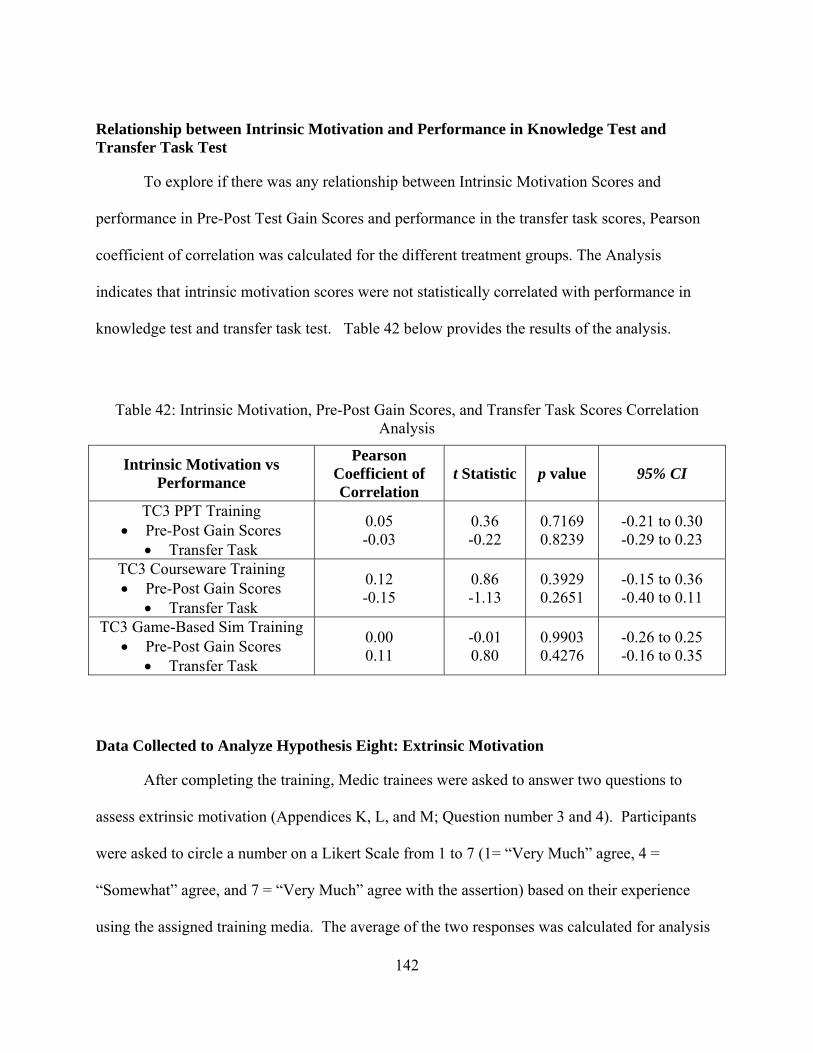
142
Relationship between Intrinsic Motivation and Performance in Knowledge Test and Transfer Task Test
To explore if there was any relationship between Intrinsic Motivation Scores and
performance in Pre-Post Test Gain Scores and performance in the transfer task scores, Pearson
coefficient of correlation was calculated for the different treatment groups. The Analysis
indicates that intrinsic motivation scores were not statistically correlated with performance in
knowledge test and transfer task test. Table 42 below provides the results of the analysis.
Table 42: Intrinsic Motivation, Pre-Post Gain Scores, and Transfer Task Scores Correlation Analysis
Intrinsic Motivation vs Performance
Pearson Coefficient of Correlation
t Statistic p value 95% CI
TC3 PPT Training Pre-Post Gain Scores
Transfer Task
0.05 -0.03
0.36 -0.22
0.7169 0.8239
-0.21 to 0.30 -0.29 to 0.23
TC3 Courseware Training Pre-Post Gain Scores
Transfer Task
0.12 -0.15
0.86 -1.13
0.3929 0.2651
-0.15 to 0.36 -0.40 to 0.11
TC3 Game-Based Sim Training Pre-Post Gain Scores
Transfer Task
0.00 0.11
-0.01 0.80
0.9903 0.4276
-0.26 to 0.25 -0.16 to 0.35
Data Collected to Analyze Hypothesis Eight: Extrinsic Motivation
After completing the training, Medic trainees were asked to answer two questions to
assess extrinsic motivation (Appendices K, L, and M; Question number 3 and 4). Participants
were asked to circle a number on a Likert Scale from 1 to 7 (1= “Very Much” agree, 4 =
“Somewhat” agree, and 7 = “Very Much” agree with the assertion) based on their experience
using the assigned training media. The average of the two responses was calculated for analysis
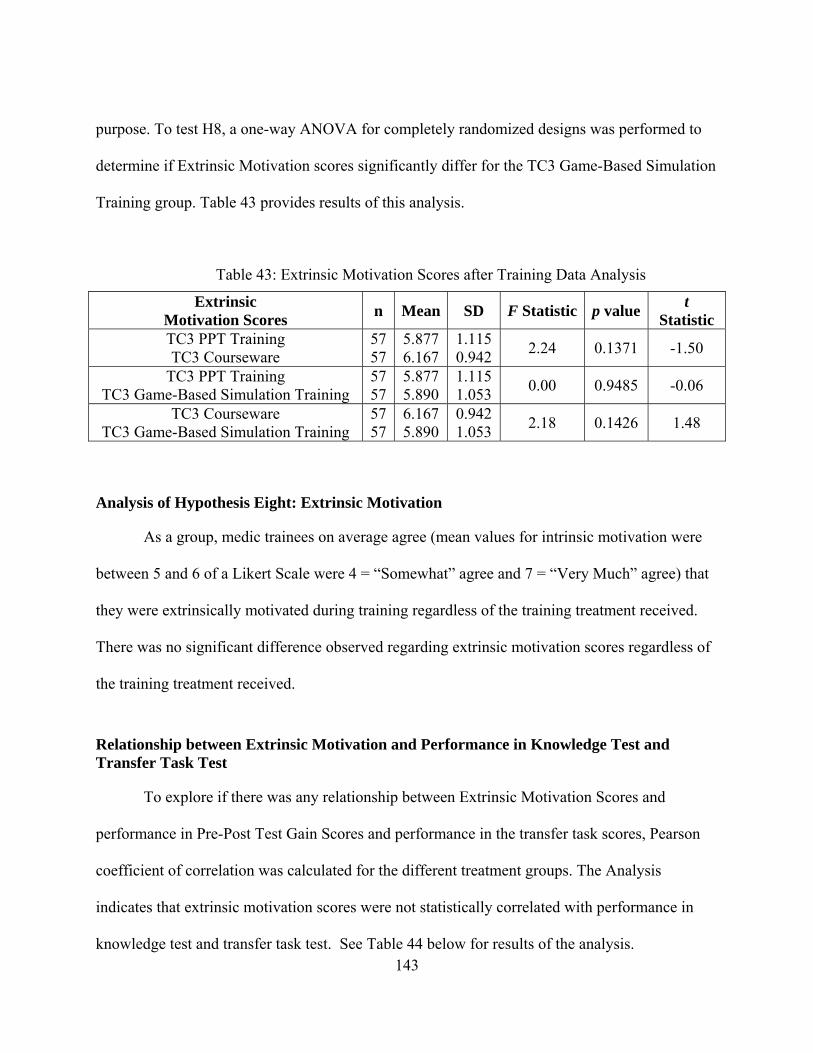
143
purpose. To test H8, a one-way ANOVA for completely randomized designs was performed to
determine if Extrinsic Motivation scores significantly differ for the TC3 Game-Based Simulation
Training group. Table 43 provides results of this analysis.
Table 43: Extrinsic Motivation Scores after Training Data Analysis
Extrinsic Motivation Scores
n Mean SD F Statistic p value t
Statistic TC3 PPT Training TC3 Courseware
57 57
5.877 6.167
1.115 0.942
2.24 0.1371 -1.50
TC3 PPT Training TC3 Game-Based Simulation Training
57 57
5.877 5.890
1.115 1.053
0.00 0.9485 -0.06
TC3 Courseware TC3 Game-Based Simulation Training
57 57
6.167 5.890
0.942 1.053
2.18 0.1426 1.48
Analysis of Hypothesis Eight: Extrinsic Motivation
As a group, medic trainees on average agree (mean values for intrinsic motivation were
between 5 and 6 of a Likert Scale were 4 = “Somewhat” agree and 7 = “Very Much” agree) that
they were extrinsically motivated during training regardless of the training treatment received.
There was no significant difference observed regarding extrinsic motivation scores regardless of
the training treatment received.
Relationship between Extrinsic Motivation and Performance in Knowledge Test and Transfer Task Test
To explore if there was any relationship between Extrinsic Motivation Scores and
performance in Pre-Post Test Gain Scores and performance in the transfer task scores, Pearson
coefficient of correlation was calculated for the different treatment groups. The Analysis
indicates that extrinsic motivation scores were not statistically correlated with performance in
knowledge test and transfer task test. See Table 44 below for results of the analysis.
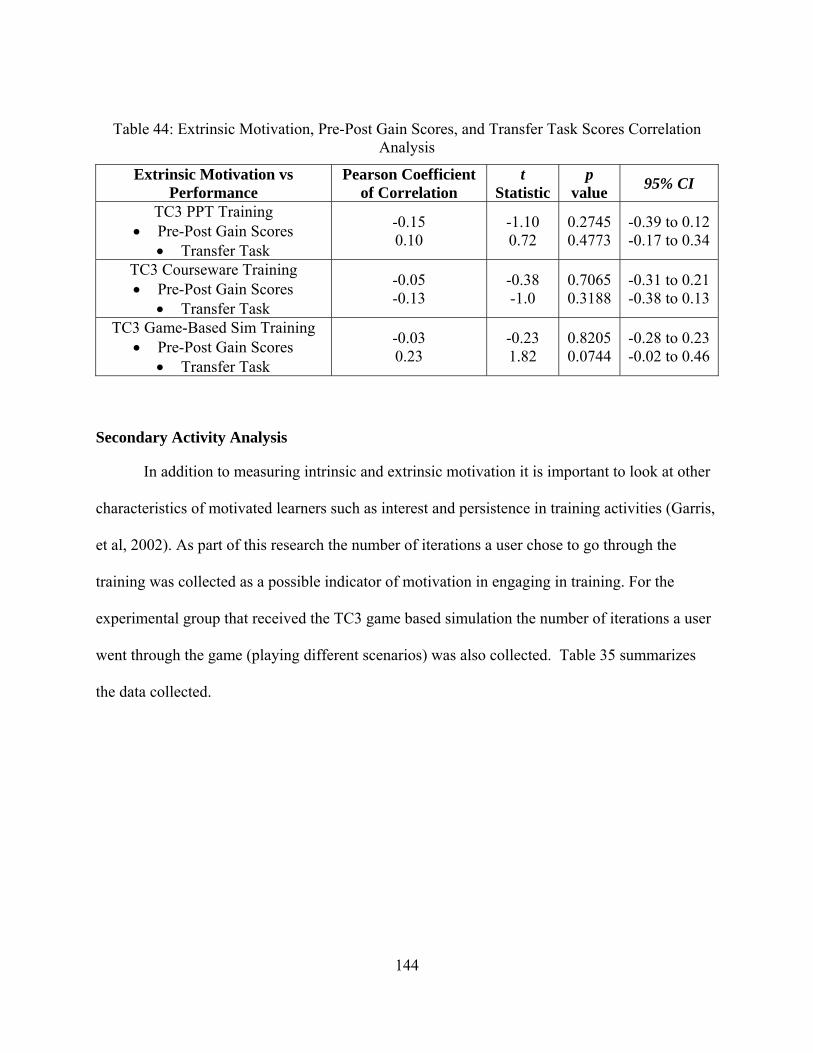
144
Table 44: Extrinsic Motivation, Pre-Post Gain Scores, and Transfer Task Scores Correlation Analysis
Extrinsic Motivation vs Performance
Pearson Coefficient of Correlation
t Statistic
p value
95% CI
TC3 PPT Training Pre-Post Gain Scores
Transfer Task
-0.15 0.10
-1.10 0.72
0.2745 0.4773
-0.39 to 0.12 -0.17 to 0.34
TC3 Courseware Training Pre-Post Gain Scores
Transfer Task
-0.05 -0.13
-0.38 -1.0
0.7065 0.3188
-0.31 to 0.21 -0.38 to 0.13
TC3 Game-Based Sim Training Pre-Post Gain Scores
Transfer Task
-0.03 0.23
-0.23 1.82
0.8205 0.0744
-0.28 to 0.23 -0.02 to 0.46
Secondary Activity Analysis
In addition to measuring intrinsic and extrinsic motivation it is important to look at other
characteristics of motivated learners such as interest and persistence in training activities (Garris,
et al, 2002). As part of this research the number of iterations a user chose to go through the
training was collected as a possible indicator of motivation in engaging in training. For the
experimental group that received the TC3 game based simulation the number of iterations a user
went through the game (playing different scenarios) was also collected. Table 35 summarizes
the data collected.
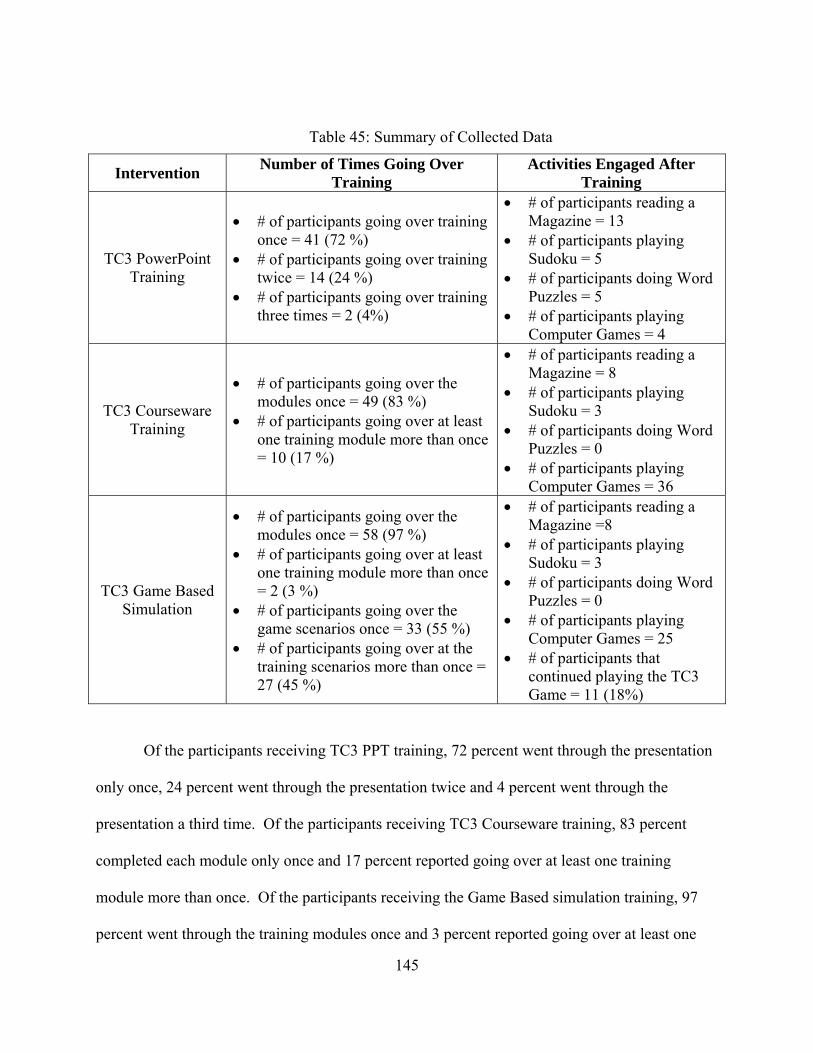
145
Table 45: Summary of Collected Data
Intervention Number of Times Going Over
Training Activities Engaged After
Training
TC3 PowerPoint Training
# of participants going over training once = 41 (72 %)
# of participants going over training twice = 14 (24 %)
# of participants going over training three times = 2 (4%)
# of participants reading a Magazine = 13
# of participants playing Sudoku = 5
# of participants doing Word Puzzles = 5
# of participants playing Computer Games = 4
TC3 Courseware Training
# of participants going over the modules once = 49 (83 %)
# of participants going over at least one training module more than once = 10 (17 %)
# of participants reading a Magazine = 8
# of participants playing Sudoku = 3
# of participants doing Word Puzzles = 0
# of participants playing Computer Games = 36
TC3 Game Based Simulation
# of participants going over the modules once = 58 (97 %)
# of participants going over at least one training module more than once = 2 (3 %)
# of participants going over the game scenarios once = 33 (55 %)
# of participants going over at the training scenarios more than once = 27 (45 %)
# of participants reading a Magazine =8
# of participants playing Sudoku = 3
# of participants doing Word Puzzles = 0
# of participants playing Computer Games = 25
# of participants that continued playing the TC3 Game = 11 (18%)
Of the participants receiving TC3 PPT training, 72 percent went through the presentation
only once, 24 percent went through the presentation twice and 4 percent went through the
presentation a third time. Of the participants receiving TC3 Courseware training, 83 percent
completed each module only once and 17 percent reported going over at least one training
module more than once. Of the participants receiving the Game Based simulation training, 97
percent went through the training modules once and 3 percent reported going over at least one
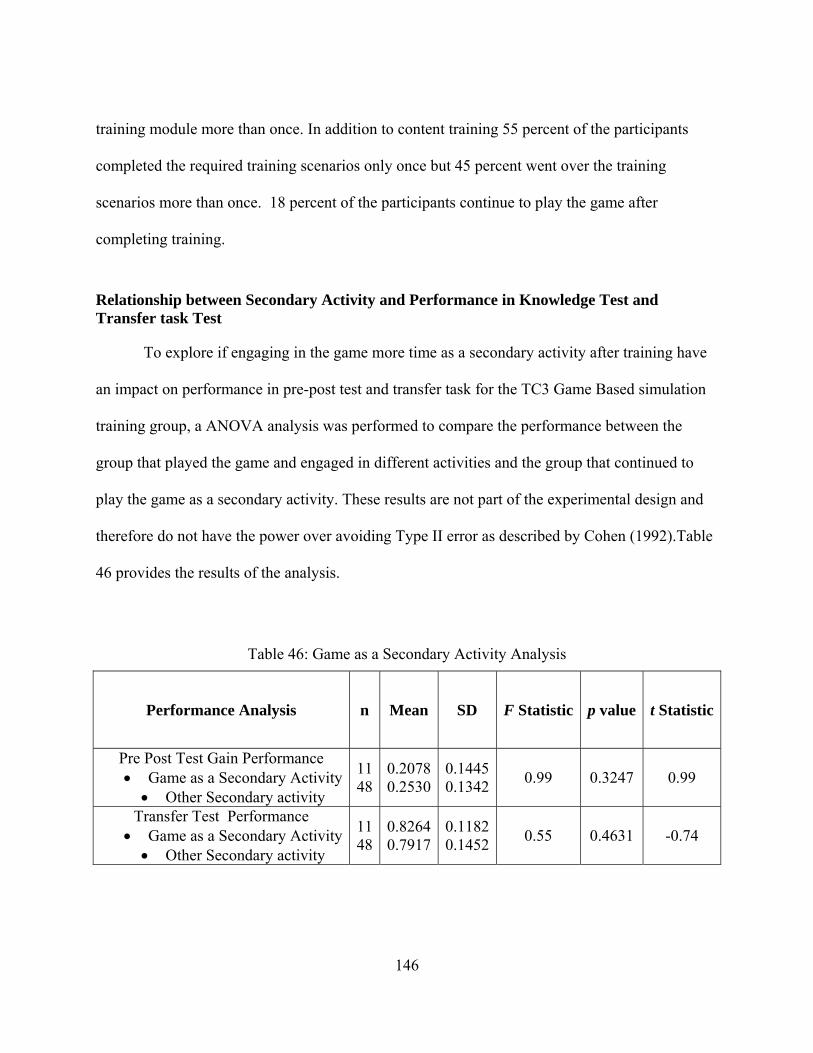
146
training module more than once. In addition to content training 55 percent of the participants
completed the required training scenarios only once but 45 percent went over the training
scenarios more than once. 18 percent of the participants continue to play the game after
completing training.
Relationship between Secondary Activity and Performance in Knowledge Test and Transfer task Test
To explore if engaging in the game more time as a secondary activity after training have
an impact on performance in pre-post test and transfer task for the TC3 Game Based simulation
training group, a ANOVA analysis was performed to compare the performance between the
group that played the game and engaged in different activities and the group that continued to
play the game as a secondary activity. These results are not part of the experimental design and
therefore do not have the power over avoiding Type II error as described by Cohen (1992).Table
46 provides the results of the analysis.
Table 46: Game as a Secondary Activity Analysis
Performance Analysis n Mean SD F Statistic p value t Statistic
Pre Post Test Gain Performance Game as a Secondary Activity Other Secondary activity
1148
0.20780.2530
0.14450.1342
0.99 0.3247 0.99
Transfer Test Performance Game as a Secondary Activity Other Secondary activity
1148
0.82640.7917
0.11820.1452
0.55 0.4631 -0.74
147
Results from the ANOVA analysis indicate that there was no significant difference
observed regarding performance in gain scores and transfer task test scores between the group in
the TC3 Game-Based Simulation that continue to engage in the game as a secondary task and the
group who chose other activities after training. It is also of value to note that 3 % in transfer task
score was observed for the group that engaged in the game as a secondary activity.
148
CHAPTER FIVE: SUMMARY OF FINDINGS AND CONCLUSIONS, RESEARCH LIMITATIONS, LESSONS LEARNED AND FUTURE RESEARCH
Research Relevance
The linear battlefield limits the number of trained medical personnel attached to
maneuver elements. There is a need to fill the gap with some type of medical capability at the
individual Soldier level in order to improve the survivability of the Soldier in combat. As sited
by retired Lieutenant Colonel Donald L. Parsons (Parsons, 2006), “improving care at the point of
wounding is the best medicine. The process has to start long before Soldiers ever see the
battlefield and the first step is training and then more training.”
There is a growing advocacy for the use of instructional games as a tool to provide
cognitive skills. The Army is currently pursuing the use of instructional games in an effort to
improve effectiveness in training. There are some advantages to this concept when compared to
live, virtual and constructive simulations. If developed to be run on a PC, games provide a low
cost alternative to training. They can be distributed easily, therefore there is potential to
minimize time and logistics. If the Soldier has access to a PC, he or she could play the game any
time, anywhere.
The Department of Combat Medic Training (DCMT) is constantly challenged with
increasing number of trainees and limited resources. They are constantly seeking new venues
that will enhance the current tools and methods used for initial skills and sustainment training of
Army Combat Medics (68Ws) who are faced with responding to today’s battlefield casualty
situations. New technologies for training readiness are needed to provide medics with greater
opportunities to develop and test their decision making and technical medical skills. The Army is
149
considering the use of the TC3 Sim game as a tool to improve the training of individual Soldiers
as well as improve the readiness of combat medics (Fowler, Smith & Litteral, 2005).
The intent of this research was to measure training effectiveness of the TC3 Game- Based
Simulation as an instructional game to teach the concepts of tactical combat casualty care using
the Kirkpatrick model (1959). The first three levels were evaluated: Reaction, Knowledge
Acquisition, and Skill Transfer. Once the Soldiers leave medic training and are assigned to their
new duty stations, due to scattering of these medics to various units around the world, it is
extremely difficult to evaluate the impact of organization performance by the TC3 training
program. The effects of three levels of training treatments were compared in trainee
performance: Multimedia, Interaction, and Experiential Learning. Experiments were conducted
at DCMT to evaluate the training effectiveness in supporting the 68W10 Healthcare Specialist
Course program of instruction (POI). The goal of this research was to address an important
question: Can instructional games as experiential tools encourage learning? i.e., is this game an
effective tool to train Soldiers the aspects of TC3?
Summary of Findings and Conclusions
The particular gap in the literature that this research focuses on is the potential use of
computer instructional games for learning by young adults. The focus of this research was the
assessment of three different training treatments for combat medic trainees. One of those
treatments involved the use of a simulation game as a supplement to more traditional training.
An experiment was designed such that statistical differences in effectiveness between treatments
could be discerned at α = 0.05 and β = 0.20. Statistically significant findings were the following:
150
Level I Reaction
In terms of overall reaction to training, no difference was observed regardless of the
training received (H1). As a group medic trainees on average rated the training as “Very Good”
regardless of the training treatment. As a group, medic trainees on average “Agree” that the
training objectives were met during training, that the training (materials and technology) should
be incorporated in the program of instruction, and that the technology was easy to use regardless
of the training treatment. When looking at descriptive characteristics as hypothesized by Bae
(2002) and Ferdig (2007), no significant difference in overall reaction to training was observed
regardless of training treatment or gender. Regarding the need of an instructor during training,
medic trainee responses were statistically significant for the group with TC3 PPT training.
Level II Knowledge Acquisition
Post test scores improved over pre-test scores for all treatment groups (H2). Additionally,
significant statistical differences were found in knowledge gain scores between the TC3 PPT
treatment group and both the TC3 Courseware and TC3 Game-Based Simulation training
treatment groups (H3). Medic trainees’ responses were statistically correlated for the TC3
Courseware training group with higher gain scores and lower scores of reaction towards needing
an instructor during training. This is of significance since the courseware training system was
developed as a distance learning tool to support medic sustainment training. In average a 9%
increased in knowledge test performance was observed between the groups receiving the TC3
PPT training (current training intervention at DCMT) and the TC3 Game-Based Simulation. In
average an 11% increased in knowledge test performance was observed between the TC3 PPT
and the TC3 Courseware training groups. In terms of content training area, no significant

151
difference in performance in the area of hemorrhage control was observed between treatment
groups. Statistical significant difference in performance in the area of breathing was found
between the group with TC3 PPT training and both the TC3 Courseware and TC3 Game-Based
Simulation training treatment groups. The TC3 Courseware treatment group experienced a 23 %
decrease in percentage of missed questions from what was observed in the TC3 PPT treatment
group. The TC3 Game-Based Simulation treatment group experienced a 20 % decrease in
percentage of missed questions from what was observed in the TC3 PPT treatment group.
Statistical significant difference in performance in the area of airway management was found
between the group with TC3 Courseware training and both the TC3 PPT and TC3 Game-Based
Simulation training treatment groups. The TC3 Courseware treatment group experienced a 16 %
decrease in percentage of missed questions from what was observed in the TC3 PPT treatment
group. The TC3 Courseware treatment group experienced an 8 % decrease in percentage of
missed questions from what was observed in the TC3 Game-Based Simulation treatment group.
Statistically significant difference in content training time was observed between the TC3
Courseware and the TC3 Game-Based Simulation training treatment groups (H4). The TC3
Game-Based Simulation training group spent less time going over the courseware training
modules than the TC3 Courseware training group. With less content training time, the TC3
Game-Based Simulation group was able to perform at the same level as the TC3 Courseware
group. One reason that could explain the difference in training time between the groups could be
the desire that some of the participants demonstrated in engaging with the TC3 Game-Based
Simulation system. No linear correlation between content training time and performance in pre-
post gain scores was observed regardless of the training intervention received.
152
Level III Skill Acquisition
The TC3 Courseware and TC3 Game-Based Simulation training groups scored
statistically higher in the transfer task test than the TC3 PowerPoint training group (H5). Higher
performance in transfer task test scores were observed for the TC3 Game-Based Simulation
group with higher scores of reaction towards having met the training objectives during training.
In average a 9% increased in transfer scenario performance was observed between the TC3 PPT
and the TC3 Game-Base simulation training groups. In terms of content training area, no
significant difference in performance in the area of breathing was observed between treatment
groups. Statistical significant difference in performance in the area of hemorrhage control was
found between the group with TC3 PPT training and both the TC3 Courseware and TC3 Game-
Based Simulation training treatment groups. The TC3 Courseware treatment group experienced a
7 % decrease in percentage of missed questions from what was observed in the TC3 PPT
treatment group. The TC3 Game-Based Simulation treatment group experienced an 11 %
decrease in percentage of missed questions from what was observed in the TC3 PPT treatment
group. Statistical significant difference in performance in the area of airway management was
found between the group with TC3 Game-Based Simulation and both the TC3 PPT and TC3
Courseware training treatment groups. The TC3 Game-Based Simulation treatment group
experienced a 24 % decrease in percentage of missed questions from what was observed in the
TC3 PPT treatment group. The TC3Game-Based Simulation treatment group experienced a 20 %
decrease in percentage of missed questions from what was observed in the TC3 Courseware
treatment group. Even though the overall performance of the transfer task did not indicate
statistical difference between the TC3 Game-Based Simulation and the TC3 Courseware, when
looking at the performance per TC3 area, a statistical significant difference was observed
153
between the TC3 Game-Based Simulation and TC3 Courseware treatment groups in the area of
airway management. No linear correlation was observed between content training time and
performance in transfer task scores regardless of the training treatment received.
Self-Efficacy
As a group, medic trainees on average “Agree” that they should be able to perform the
tasks associated with the training: in the first case on the battlefield and in the second case
enabling them to complete the scenarios. No significant difference in self-efficacy was found
between treatment groups (H6). No linear correlation was observed between Self-Efficacy after
training and after transfer task scores and performance in gain scores and transfer task test scores
regardless of the training treatment received.
Motivation
As a group, medic trainees on average agree that they were intrinsically and extrinsically
motivated regardless of the training treatment received. The TC3 Courseware training group
scored intrinsic motivation higher than the TC3 Game-Based Simulation training group (H7).
There was no statistically significant difference observed regarding extrinsic motivation scores
between the TC3 Game-Based Simulation Training group and the TC3 PPT training or TC3
Courseware training groups (H8). No linear correlation was observed between intrinsic and
extrinsic motivation and performance in Pre-Post Gain Scores and Transfer Task Scores.
In addition to the designed experiment, correlations of Bae’s (2002) descriptive
characteristics (age, experience, and education level) and Ferdig’s (2007) gender were tracked
along with the test of hypotheses. These correlations and results are not part of the experimental
design and therefore do not have the power over avoiding Type II error as described by Cohen

154
(1992). The statistically significant correlations are listed below with due caution to the astute
reader in the hope of potentially contributing insights to possible future research into the
correlations and results observed. The following are statistically significant findings:
Higher overall reaction scores were observed for participants with lower levels of
education in the TC3 PPT training group.
Higher reaction scores towards having met that training objectives were observed for
participants with lower levels of education in the TC3 Courseware training group.
Higher reaction scores towards having met that training objectives were observed
amongst younger participants in the TC3 Game-Based Simulation group.
Higher reaction scores towards finding the technology easy to use were observed
amongst younger participants and participants with lower levels of education in the TC3
Game-Based Simulation group.
Higher reaction scores towards needing an instructor during training were observed
amongst older participants in the TC3 Game-Based Simulation group.
No difference was observed between females and males regarding overall reaction to
training and performance in knowledge and transfer task.
Experimental Limitations
Experimental Limitations arise primarily from scope. Limitations result in terms of
resources, subjects, experimental methodology and games considered. The experimental
limitations encountered are believed to not been significant enough to dismiss any of the
findings. Each topic is discussed in turn below.
155
Resources
Evaluating beyond the Kirkpatrick’s third level was difficult to accomplish. Once the
Soldiers leave the school at DCMT and are assigned to their new duty stations, it is extremely
difficult to evaluate the impact of organization performance by the TC3 program. Level three
evaluations was accomplished using paper and pencil scenarios due to the fact that in order to
evaluate hands on task in a lane environment would have required instructor participation and
resources and time constraints limited their participation. In addition, participant’s performance
at the conclusion of the 68W course is sensitive information that DCMT can not release.
The experiment was conducted with three experimental groups: TC3 PPT Training, TC3
Courseware, and TC3 Game Based Simulation. It would have been ideal to consider a fourth
experimental group: PPT and TC3 Game Based Simulation were the content training would have
been provided by the PPT presentation. That would have completely isolated the performance
due to the game portion of the training. Again limitations in access to students and resources
prevented the inclusion of a fourth experimental group.
DCMT has several learning resource centers with at least 60 computers per center. Due
to the fact that the courseware and game could not be placed in the network, only 20 gaming
computers were available to support both the courseware group and the game group. This
limited the amount of participants per session and prevented conducting a fourth experimental
group.
Subjects
In order to conduct the experiment with at least 156 participants, the experiment was
conducted at the Department of Combat Medic Training School. Access to the student
156
population was constraint. First, the window of opportunity was very limited. Students could be
accessed only one day during their training. The day participants could participate was the same
day they tested for EMT B certification. Fatigue was a major factor observed from the students.
This might have impacted their motivation and performance. Especially in the Game
intervention which was more intense that the other two interventions.
Most of the student population at the school is young recruits with no combat experience
and medical experience. This factor was a constraint in the analysis of data specifically to
identify if experience and age could impact performance, self efficacy and motivation in a game
environment.
Experimental Methodology
To gather feedback from participants, they were asked to complete surveys. Missing
values of sections not completed by participants was an issue. Data was missing not only on
surveys but also on transfer scenarios and demographic instrument. The major problem observed
was with instruments that had continuation pages in the back. It would have been beneficial to
provide electronic input via computer software surveys to capture the data.
Participants were asked to record time of training and training activities. During the
experiment constant reminder for time stamping was required. This issue could have been
avoided if a built in tool in the game and courseware be available to capture time on task. The
same applied for the PPT group.
Even though a pilot test was performed and the surveys were streamlined to only have the
necessary data for analysis, the experiment was long and students were asked to fill out too many
surveys. This could have impacted their answers. In addition, during the pilot test it was noticed
157
that even though specific instructions were given to students regarding the modules to do training
on, some of the participants chose the wrong modules. This issue was fixed by blocking the
links and allowing only the links associated with the experiment to work.
The participants in the game experimental group were provided with game interface
training. The amount of time for training was constraint by the experimental window available
from the school to avoid conflicting with the regular program of instruction. It would have been
of benefit to provide extra game interface training. In addition, participants in the game
experimental group were provided with after action review on the training scenarios via paper.
This was due to the fact that after action capability in the game was not completely developed. It
would have been beneficial to run the experimental group with a more robust AAR capability
that would provide immediate feedback and remediation without the intervention of an
instructor.
Games
Only one game was evaluated during this research study. There are other games that
have been developed to support 68 W training, but their developmental stage was not at the same
level as the TC3 Game-Based Simulation. In addition, the limitations explained above precluded
the evaluation of multiple games.
Lessons Learned
Several lessons learned were drawn from the experiment and could be addressed in
follow on research and experimentation. None of the limitations addressed are believed to impact
the findings of this research.
158
In terms of experimental methodology and logistics it would have been of benefit to
capture most of the survey data via computer software. This would not only address the issue of
missing data but would also ease the input of the data for analysis. Many hours were dedicated
to data input. Also, time stamping of computer-based activities should be captured via the
software to prevent having to constantly remind participants to collect the data.
Even though most of the data gathered for reaction was done through questionnaires,
some of the areas in the questionnaire need improvement. Additional feedback would have been
of benefit in the area of reaction to overall training. If would have been of help to ask the
participants which features they liked from the training. This would have given insight towards
the factors that might motivate learners in a game environment.
Being able to perform a pilot test to validate test instruments and protocols was
instrumental in the success of the follow on experimentation. Early Coordination of the
experiment needs to be done at all levels to include recruiting personnel. This was of importance
to ensure volunteer participation and to better manage subject’s expectations.
Recommended Future Research
Advocacy of gaming tools to support training has been a trend observed in recent years.
This research focused on instructional game, i.e., games that have been developed to support
specific learning objectives. Reaction to training in a game environment was explored, as well
as, acquisition of knowledge and transfer of skills. Also the role of self-efficacy and motivation
in a game environment was considered as possible factors to improve performance.
When looking closely at the descriptive characteristics observed in the sample
population, most of the participants belonged to Generation Y. Even though most of them
159
reported having experience with video games, the majority of them do not engage in playing at a
regular basis. The majority of the people that reported not having experience with video games
had higher levels of education (Associate Degrees, Bachelors, and Post Bachelors Education). Of
the people that reported time spent during a typical week, the majority reported playing less than
5 hours a week. Most of the population rated themselves at the Intermediate level in terms of
First Person game. In terms of gender, the majority of females rated at the beginner level were
the majority of males consider themselves at the intermediate level. The design of this research
experiment does not provide sufficient power to make conclusions on these findings. For future
research, sets of experiments designed with gender, education level, and generation identification
may clarify if these population characteristics are determinate on outcome.
Simple correlation analysis was performed to explore the relationship between
descriptive characteristics, as hypothesized by Bae (2002) and Ferdig (2007), overall reaction,
and performance in the training environment. For future research, it would be of benefit to
explore non linear relationships between variables as well as multiple regression analysis. In
addition, no difference was observed between females and males regarding overall reaction to
training
Due to limitations on resources, the game-based simulation training was incorporated
with courseware content training. It would have been ideal to consider a fourth experimental
group: PPT and TC3 Game Based Simulation were the content training would have been
provided by the PPT presentation. Future research should consider completely isolating the
performance due to the game portion of the training.
160
Due to constraints in time and resources at DCMT, level III evaluation was accomplished
using paper and pencil scenarios. Future research should consider evaluating performance at lane
training and field exercises, where hands on skills evaluation can be performed.
One area that was not addressed in this research is to look at how it would be more
effective to incorporate the game component in the program of instruction. For future research,
it would be of benefit to explore different ways of incorporating the game in order to see if
differences in performance are observed. The game could be incorporated as an extra curricular
activity in addition to traditional instruction. This particular scenario would augment trainees’
time of skill practice. Another possibility could be introducing the tool into the traditional
classroom environment but being facilitated by an instructor in order to provide feedback on
students’ performance in an AAR (After Action Review) fashion.
As part of this research effort it was found that the game-based simulation group spent
less time in content training compared to the courseware group. With less content training the
game-based simulation group was able to perform at the same level in knowledge test and
transfer task. Future research should consider looking at whether or not trainees would use the
game as a tool to improve on transfer skills if time is available after training. Also, it would be
of benefit to explore the amount of time trainees would consider engaging in gaming activities
after receiving training.
Finally, it would be of benefit for future research to conduct longitudinal research, i.e.
collect repeated observations of trainees over long periods of time, to explore the impact of
game-based simulation training would have in performance on task related activities and
retention of TC3 knowledge and skills.

161
APPENDIX A: CONSENT FORM

162

163

164

165
APPENDIX B: DEMOGRAPHIC SURVEY

166

167

168
APPENDIX C: PRE-POST TEST VERSION A

169

170

171

172
APPENDIX D: TIMING AND ACTIVITIES FORM – POWERPOINT TRAINING TIME DATA

173

174
APPENDIX E: TIMING AND ACTIVITIES FORM – COURSEWARE TRAINING TIME DATA

175

176
APPENDIX F: TIMING AND ACTIVITIES FORM – COURSEWARE AND GAME TRAINING TIME DATA

177

178
APPENDIX G: PRE-POST TEST VERSION B

179

180

181

182
APPENDIX H: REACTION SURVEY – POST-TRAINING
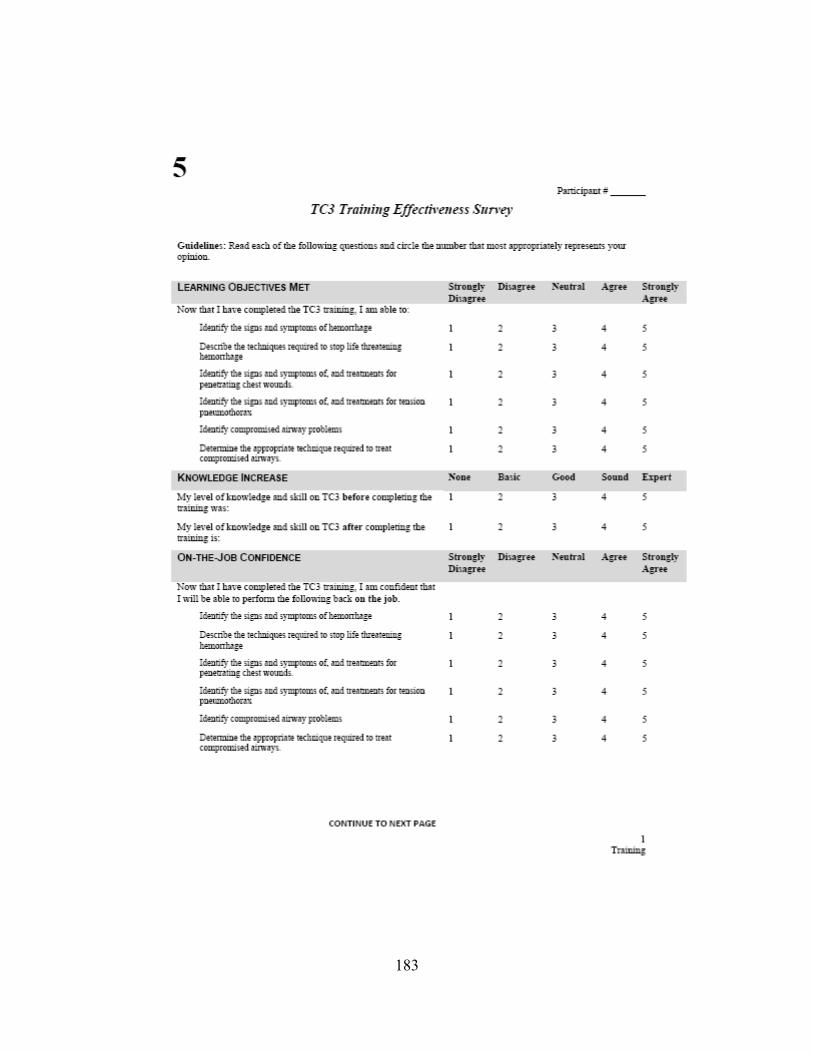
183

184

185
APPENDIX I: TRANSFER SCENARIO

186

187
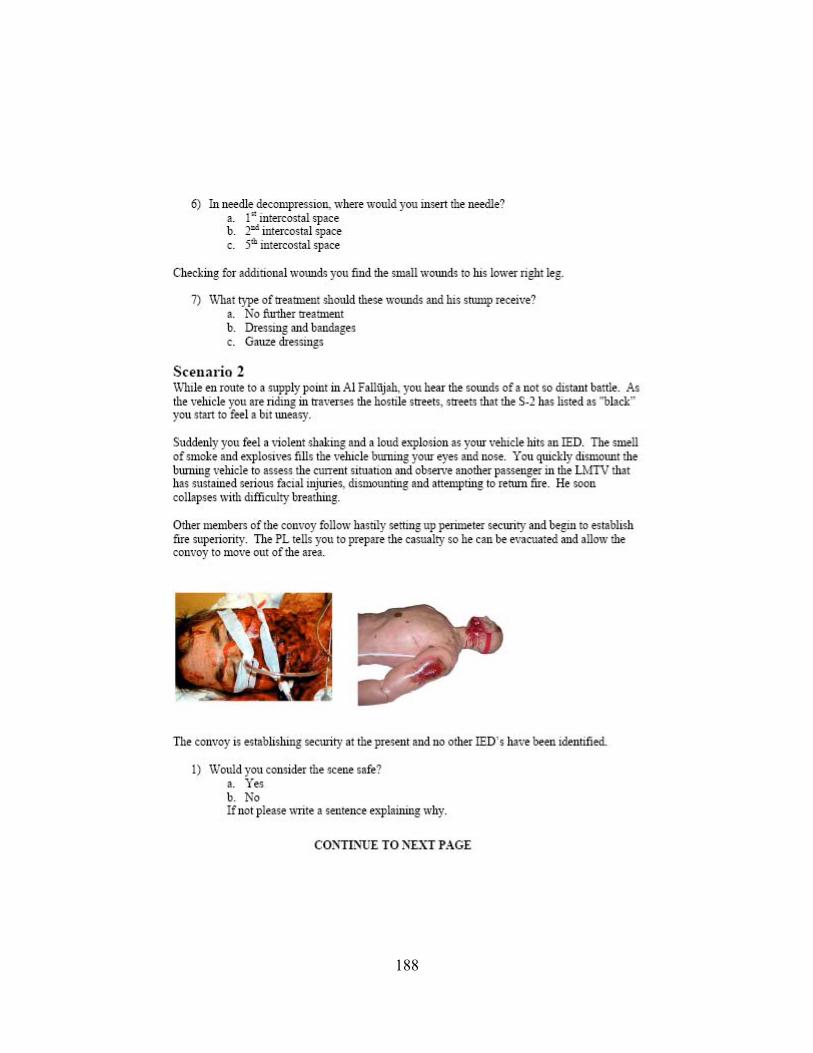
188

189

190
APPENDIX J: REACTION SURVEY – POST-TRANSFER
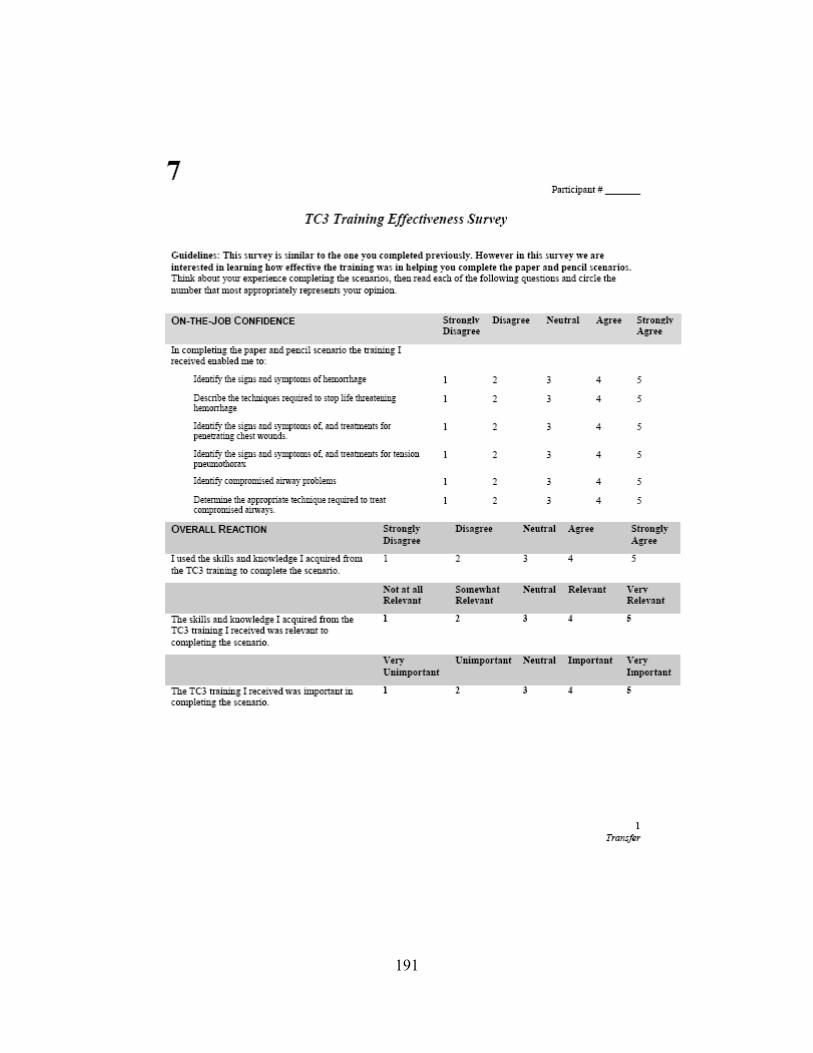
191

192
APPENDIX K: MOTIVATION SURVEY – POWERPOINT

193
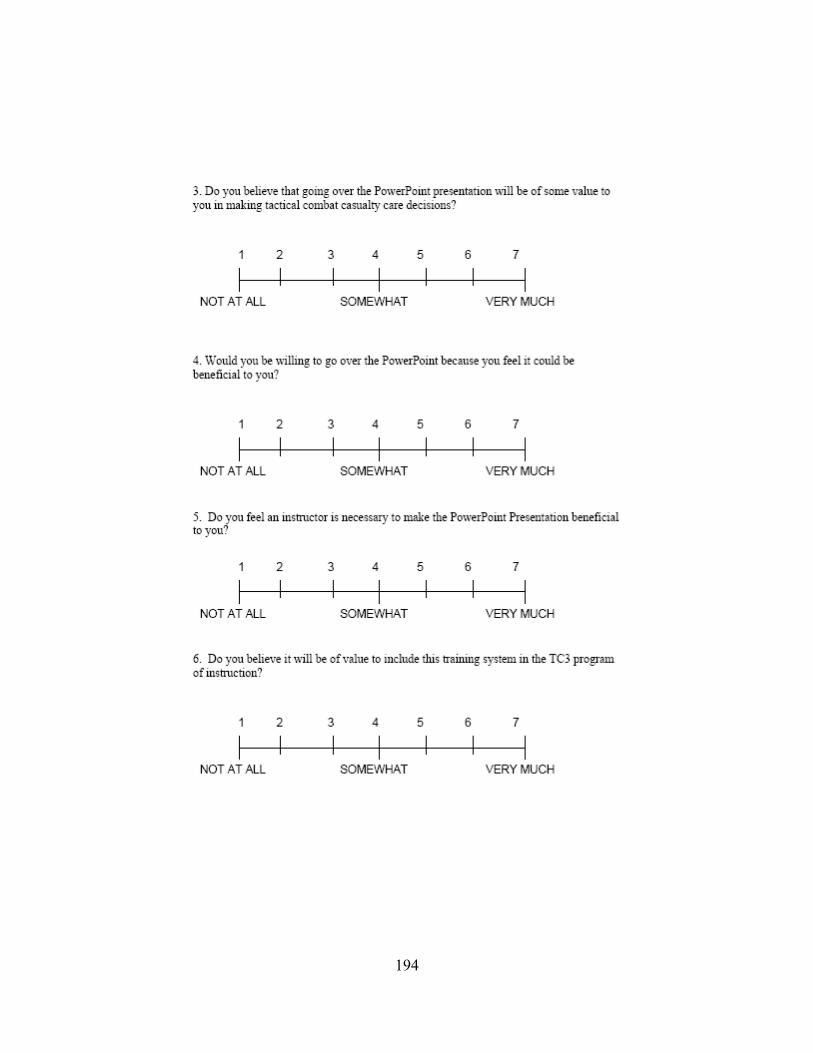
194

195
APPENDIX L: MOTIVATION SURVEY – COURSEWARE

196
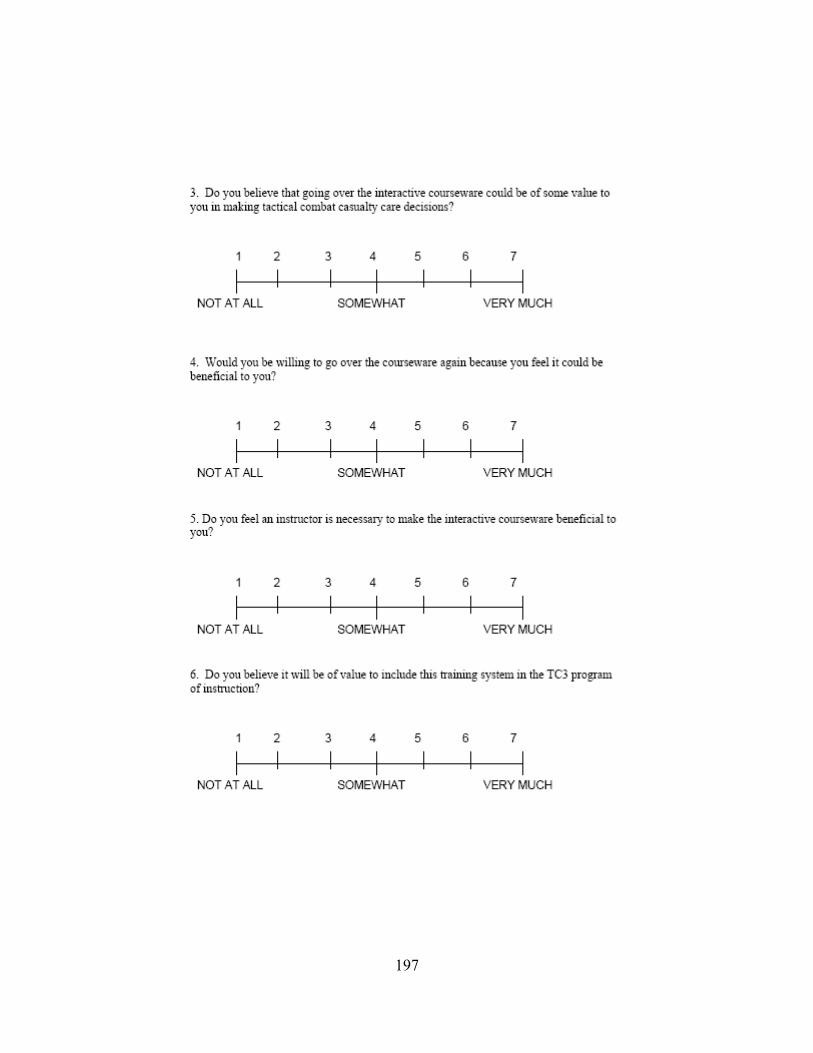
197

198
APPENDIX M: MOTIVATION SURVEY – GAME

199
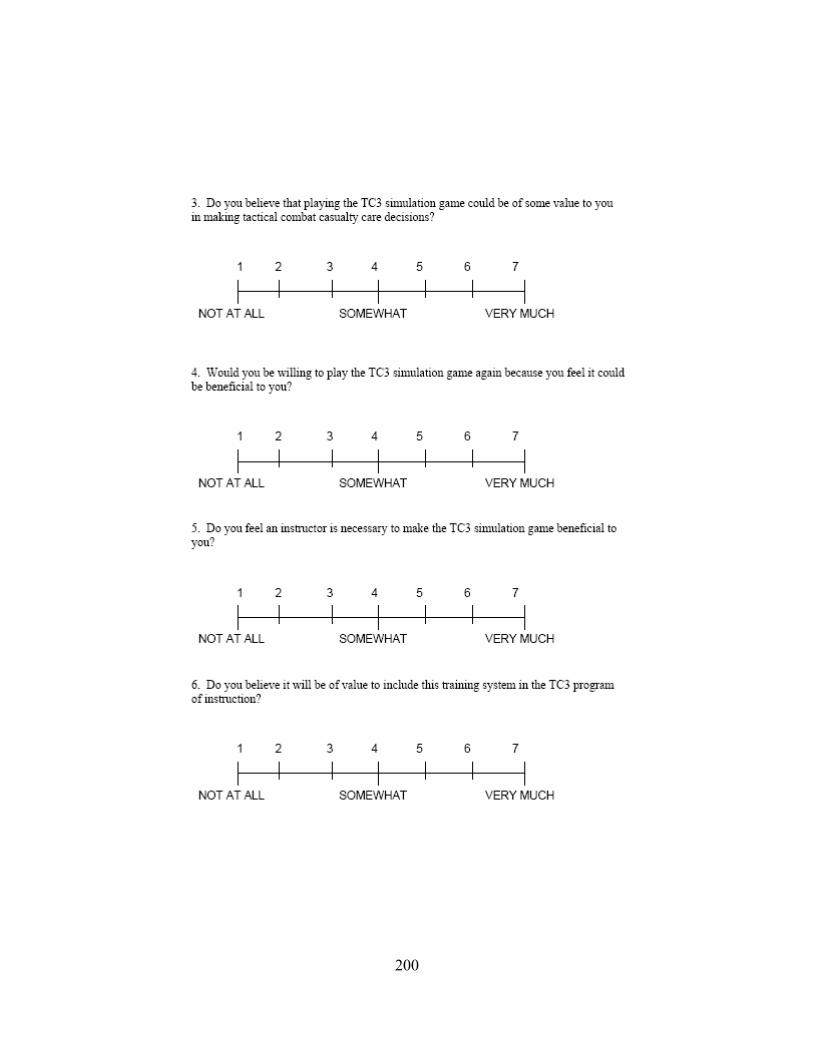
200

201
APPENDIX N: UCF IRB APPROVAL

202
203
LIST OF REFERENCES
Abell,M. (2000). Soldiers as Distance Learners: What Army Trainers need to Know,
Proceedings of the Interservice/Industry Training, Simulation, and Education
Conference (I/ITSEC) 2000, Orlando, FL.
Amr, K. (2007). Constructing Knowledge through Games: Essential factors for an
effective educational game. In Proceedings of World Conference on
Educational Multimedia, Hypermedia and Telecommunications 2007 (pp.
1601-1609). Chesapeake, VA: AACE.
Arthur, W., Jr., Bennett, W., Jr., Edens, P. M., & Bell, S. T. (2003). Effectiveness of
Training in Organizations: A Meta-Analysis of Design and Evaluation
Features. Journal of Applied Psychology Vol 88, No. 2, 234–245.
Bae, E. (2002). The effects of trainee characteristic on training effectiveness in
improving organizational performance. Performance Improvement Quarterly,
Volume 15 Number 2, pp. 47-60.
Batchelder, J. S. and Rachal, J. R. (2000). Effects of a Computer-Assited Program in
a Prison Setting: An Experimental Study. JCE Vol. 51, No. 4, December
2000.
Baxter, H.C., Ross, K.G., Phillips, J., Shafer, J., & Fowlkes, J. (2004). Leveraging
Commercial Video Game technology to Improve Military Decision Skills.
Proceedings of the Interservice/Industry Training, Simulation and Education
Conference (I/ITSEC) 2004, Orlando, FL.
204
Becker, H. A. (1980). The emergence of simulation and gaming. Simulation &
Games, Vol. 11 No. 1, pgs 11-25.
Belanich, J., Orvis, K. A., Moore, J. C., Horn, D. B., and Solberg, J. L. (2007).
Fact or Fiction – Soldiers are Gamers: Potential Effects on Training.
Proceedings of the Interservice/Industry Training, Simulation, and Education
Conference (I/ITSEC) 2007, Orlando FL.
Birnbaum, R. (1982). Games and simulations in higher education. Simulation &
Games, Vol. 13 No. 1, pgs 3-11.
Björk, S., & Holopainen, J. (2003, Nov). Describing Games: An Interaction-Centric
Structural Framework. Retrived on July 22, 2007 from
http://citeseer.ist.psu.edu/688088.html
Bredemeier, M.E. and Greenblat, C.S. (1981). The educational effectiveness of
simulation games. Simulation & Games, Vol. 12 No. 3, pgs 307-332.
Brown, K. G., Rietz,T. A., and Sugrue, B. (2005). The effects of Videoconferencing,
class size, and learner characteristic on training outcomes. Performance
Improvement Quarterly, Volume 18 Number 1, pp. 59-82.
Butler, R. J., Markulis, P. M., and Strang, D. R. (1988). Where are we? An analysis of
the methods and focus of the research on simulation gaming. Simulation &
Games, Vol. 19 No. 1, pgs 3-26.
Carsten, A., and Beck, J. (2005). Get Ready for the Gamer Generation. Techtrends,
Volume 49, Number 3 Pgs 22-25.
205
Casey, M.S. and Doverspike, D. (2005) Training Needs Analysis and Evaluation for
New Technologies Through the Use of Problem-based Inquiry. Performance
Improvement Quarterly, Volume 18 Number 1, pp. 110-124.
Center for Army Lessons Learned (CALL). (2006) Handbook 06-18 Tactical Combat
Casualty Care Handbook. Retrieved on May 30, 2006 from
https://call2.army.mil/products/handbooks/asp/06-18/fwd.asp
Clark, R.E. (1983). Reconsidering research on learning from media. Review of
Educational Research, 53(4), 445-459.
Cohen, J. (1992). A Power Primer. Psychological Bulletin, 112, pp. 155-159.
Costikan, G. (2002). I Have No Words & I Must Design: Toward a Critical
Vocabulary for Games. Proceedings of the Computer Games and Digital
Cultures Conference, ed. Frans Mäyrä. Tampere, Finland: Tampere
University Press. Retrieved on July 28, 2007 from
http://digra.org/dl/db/05164.51146 .
Csikszentmihalyi, M. (1990). Flow: The Psychology of Optimal Experience. New
York: Harper & Row, Publishers.
Cunningham, J. B. (1984). Assumptions underlying the use of different types of
simulations. Simulation & Games, Vol. 15 No. 2, pgs 213-234.
de Freitas, S. and Jarvis, S. (2006). A Framework for Developing Serious Games to
meet Learner Needs. Proceedings of the Interservice/Industry Training,
Simulation, and Education Conference (I/ITSEC) 2006, Orlando, FL.
206
de Freitas, S. and Oliver, M. (2006). How can exploratory learning with games and
simulations within the curriculum be most effectively evaluated? Computers
& Education, Vol. 46 249-264.
de Freitas, S. (2004). Learning through Play. London: Learning and Skills Research
Center.
Deci, E. & Ryan, R. (2005). Self Determination Theory: An Approach to Human
Motivation and Personality (2005). Intrinsic Motivation Inventory SDS
Questionnaires. Retrieved March 6, 2008, from
http://www.psych.rochester.edu/SDT/measures/intrins.html
Dempsey, J.V., Lucassen, B.A., Haynes, L.L., and Casey, M.S. (1996). Instructional
Applications of Computer Games. Paper presented at the 1996 American
Educational Research Association, 8-12 April 1996, New York. ERIC
Document Reproduction Service No. ED 394 500.
Department of Defense (1995, October) Reference: (g) DoD 5000.59-P, "Modeling
and Simulation Master Plan.” Washington, DC: United States Department of
Defense, Defense Modeling and Simulation Office.
Department of Defense (2004, June 9) Department of Defense Training
Transformation Implementation Plan. Washington, DC: The pentagon, Office
of the Under Secretary for Personnel and Readiness.
Dimitrov, D. & Rumrill, P. (2003) Pretest-posttest designs and measurement of
change. Work, 20, pp. 159-165.
207
Dorn, D.S. (1989). Simulation Games: One More Tool on the Pedagogical Shelf.
Teaching Sociology, Vol.17, (January, 1989), pp. 1-18.
Egenfeldt-Nielsen, S. (2007). Third generation educational use of computer games.
Journal of Educational Multimedia and Hypermedia. 16 (3), pp. 263-281.
Chesapeake, VA: AACE.
Entertainment Software Association. (2007). Essential facts about the computer and
video game industry. Retrieved from
http://www.theesa.com/facts/gamer_data.php on July 2007.
Ferdig, R. (2007). PREFACE: Learning and teaching with electronic games. Journal
of Educational Multimedia and Hypermedia. 16 (3), pp. 217-223. Chesapeake,
VA: AACE.
Fowler, F., Smith, B. & Litteral, D.J. CSM (2005) A TC3 Game-based Simulation for
Combat Medic Training. Proceedings of the Interservice/Industry Training,
Simulation and Education Conference(I/ITSEC) 2005, Orlando, FL.
Garris,R., Ahlers, R., and Driskell, J. E. (2002) .Games, Motivation, and Learning:
A Research and Practice Model. Simulation & Gaming, Vol. 33 No. 4, pp.
441-467.
Global Security. (2006) Improvised Explosive Devices Information. Retrieved on
July 5, 2006 from www.globalsecurity.org/military/intro/ied.html.
208
Green, M. & Sulbaran, T. (2006). Motivation Assessment Instrument for Virtual
Reality Scheduling Simulator. In T. Reeves & S. Yamashita (Eds.),
Proceedings of World Conference on E-Learning in Corporate, Government,
Healthcare, and Higher Education 2006 (pp. 45-50). Chesapeake, VA: AACE.
Greenblat, C.S. (1973). Teaching with Simulation Game: A Review of Claims and
Evidence. Teaching Sociology, Vol.1, No.1. (Oct., 1973), pp. 62-83.
Hardre, P.L. and Chen C. (2005) A case study analysis of the role of Instructional
Design in the development of Teaching Expertise. Performance Improvement
Quarterly, Volume 18 Number 1, pp. 39.
Hays, R.T, and Singer, M.J. (1989). Simulation Fidelity in Training System Design:
Bridging the Gap between Reality and Training. New York: Springer-Verlag.
Hays, R.T. (2005). The Effectiveness of Instructional Games: A literature Review and
Discussion. Technical Report 2005-004 Naval Air Warfare Center Training
Systems Division, Orlando, FL.
Hays, R.T. (2007). Instructional Gaming Handbook: How to select and Use
Instructional Games. Technical Report Naval Air Warfare Center Training
Systems Division, Orlando, FL.
Hodges, C. B. (2008). Self-Efficacy in the Context of Online Learning Environments:
A Review of the literature and direction for Research. Performance
Improvement Quarterly, Volume 20, Number 3-4, pp 7-25.
Iraq Coalition Casualty Count ICCC. (2006) IED Fatalities by Month Information.
Retrieved on July 5, 2006 from http://icasualties.org/oif/IED.aspx.
209
Kaufman, R. and Keller, J.(1994) Levels of evaluation: Beyond Kirkpatrick. Human
Resources quarterly, Volume 5 Number 4, pp. 371-380.
Kirkley, S. E., Tomblin, S., Kirkley, J. (2005). Instructional Design Authoring
Support of the Development of Serious Games and Mixed Reality Training.
Proceedings of the Interservice/Industry Training, Simulation, and Education
Conference (I/ITSEC) 2005, Orlando, FL.
Kirkpatrick, D. L. (1959). Techniques for evaluating training programs. Journal of
the American Society of Training and Development, 13, 3-9.
Klein, J.D. (2002). Empirical research on performance improvement. Performance
Improvement Quarterly, Volume 15 Number 1, pp. 99-110.
Kozma, R. (1994). Will media influence learning: Reframing the debate. Educational
Technology Research and Development, 42(2), 7-19.
Lanigan, M. L. (2008). Are Self-Efficacy Instruments Comparable to Knowledge and
Skills Tests in Training Evaluation Settings?. Performance Improvement
Quarterly, Volume 20, Number 3-4 PP 97-112.
Leemkuil, H., de Jong, T., and Ootes, S. (2000). Review of Educational Use of
Games and Simulations. Knowledge management Interactive Training System
Consortium. Universiteit Twente Project number IST-1999-13078, The
Netherlands.Retrieved on July 15, 2007 from
http://kits.edte.utwente.nl/documents/D1.pdf
210
Litteral, G. R. (2005). A Tale of Two Opposing Methodologies: Adult Student
Performance and Preference Factors in a Traditional Versus Game-Based
Approach to Learning. A Paper presented to the Department of Instructional
Design and Technology Emporia State University in partial fulfillment of the
requirements for the Degree of Master of Science. May 13, 2005.
Liu,X. and Schwen, T.m. (2006). Sociocultural Factors Affecting the success of an
online MBA course. Performance Improvement Quarterly, Volume 19
Number 2, pp. 69-92.
Mendenhall, W. and Sincich, T. (1995). Statistics for Engineering and the Sciences,
Fourth Edition. Prentice-Hall, Inc. Upper Saddle River, New Jersey, 07458.
ISBN 0-02-380581-1.
Mishra, P. & Foster, A. (2007). The Claims of Games: A Comprehensive Review and
Directions for Future Research. In C. Crawford et al. (Eds.), Proceedings of
Society for Information Technology and Teacher Education International
Conference 2007 (pp. 2227-2232). Chesapeake, VA: AACE.
Mitchell, A., and Savill-Smith, C. (2004). The use of Computer and Video Games for
Learning. Published by the Learning and Skills Development Agency.
Retrieved on June 7, 2007 from http://www.lsda.org.uk/files/pdf/1529.pdf .
Mosby, Inc. (2003) Revised Fifth Edition – Pre Hospital Trauma Life Support – Basic
and Advance Prehospital Trauma Life Support. Mosby, Inc. 2003.
Nielsen, J. (1993). Usability Engineering. Boston: Academic Press.
211
Parsons, D. L. Retired LTC (2006). Pre-Hospital Care in the U.S. Army. Military
Medical technology online edition. Retrieved on July 3, 2006 from
http://www.military-medical-technology.com/.
Parsons, D. L. Retired LTC (2006). TC3 Training Materials of the 91W10 Healthcare
Specialist Course. US Army Medical Department Center & School, the
Department of Combat Medic Training (DCMT), Fort Sam Houston, TX.
Peterson, T. O. and Arnn, R.B. (2005) Self-Efficacy: The foundation of Human
Performance. Performance Improvement Quarterly, Volume 18 Number 2,
pp. 5-18.
Prensky Mark (2001). Digital Game-Based Learning. McGraw-Hill, 2001. Chapter 1
(1-19) & Chapter 2 (1-22).
Randel, J. M., Morris, B.A., Wetzel, C. D., & Whitehill, B. V. (1992). The
Effectiveness of Games for Educational Purposes: A Review of Recent
Research. Simulation & Gaming, Vol. 23, No. 3, 261-276.
Rice, J. (2007). Assessing Higher Order Thinking in Video Games. Journal of
Technology and Teacher Education. 15 (1), pp. 87-100. Chesapeake, VA:
AACE.
Rice, J. (2007). New media resistance: Barriers to implementation of computer video
games in the classroom. Journal of Educational Multimedia and Hypermedia.
16 (3), pp. 249-261. Chesapeake, VA: AACE.
Rideout, V., Roberts, D.F., and Foehr, U.G. (2005). Generation M: Media in the
lives of 8-18 year-olds, Kaiser Family Foundation, March 2005.
212
Sacks, P. (1998) Generation X goes to college: An eye-opening account of teaching
in postmodern America. Chicago: Open Court Publishing Company.
Santo, S. (2006). Relationships between learning styles and online learning.
Performance Improvement Quarterly, Volume 19 Number 3, pp.73-88.
Sotomayor, T., Peters, R., Riddle, D., and Parsons, D. (2007). Designing and
Evaluating the Transfer of Learning through a Game-Based Simulation for
Combat Medics. Proceedings of the Interservice/Industry Training,
Simulation, and Education Conference (I/ITSEC) 2007, Orlando, FL.
Spelman, M. D. (2002).GLOBECORP: Simulation Versus Tradition. Simulation &
Gaming, Vol. 33 No. 3, pgs 376-394.
Squire, K. (2005). Game-Based Learning: State of the Field. E-Learning Consortium,
February 18, 2005.
Tomlinson, B., and Masuhara, H. (2000). Using simulations on materials
development courses. Simulation & Gaming, Vol. 31 .No. 2, Pgs 152-168
US Army Medical Department Center and School Portal (AMMEDD). (2006) 91W
and Department of Combat Medic Training Information. Retrieved in June 15,
2006 from http://www.cs.amedd.army.mil/details.aspx?dt=49
Walsh, W. J., Fullbright, T. W., Gearhardt, R. S., Kastigar, G., and Barber, R. (2006).
Evaluation of On-line First Responder Training: Not Always Right, But
Always Learning. Proceedings of the Interservice/Industry Training,
Simulation, and Education Conference (I/ITSEC) 2006, Orlando, FL.
213
Westbrook, J. & Braithwaite, J. (2001). The Health Care Game: An Evaluation of a
Heuristic, Web-Based Simulation. Journal of Interactive Learning Research.
12 (1), pp. 89-104. Norfolk, VA: AACE.
Whitley, T. R. & Faria, A. J. (1989) A study of the relationship between student final
exam performance and simulation game participation. Simulation & Games,
Vol. 20 No. 1, pgs 44-64.
Wiebenga, S. R. (2005). Guidelines for selecting, using, and evaluating games in
corporate training. Performance Improvement Quarterly, Volume 18 Number
4, pp. 19-36.
Wikipedia (2006). Modeling and Simulation Definition. In Wikipedia, the free
encyclopedia. Retrieved in June 15, 2006 from http://en.wikipedia.org/wiki/
Wikipedia. (2007). Game Definition. In Wikipedia, the free encyclopedia. Retrieved
on July 15, 2007 from http://en.wikipedia.org/wiki/Games.