Embed Size (px)
Citation preview
Evaluating the Quality of Open SourceSoftware
Diomidis Spinellis1 Georgios Gousios1 Vassilios Karakoidas1
Panagiotis Louridas1
Department of Management Science and TechnologyAthens University of Economics and Business
Athens, Greece
Paul J. Adams1
Research and DevelopmentSirius Corporation Ltd.
Weybridge, United Kingdom
Ioannis Samoladas1 Ioannis Stamelos1
Department of InformaticsAristotle University of Thessaloniki
Thessaloniki, Greece
Abstract
Traditionally, research on quality attributes was either kept under wraps within the organization thatperformed it, or carried out by outsiders using narrow, black-box techniques. The emergence of open sourcesoftware has changed this picture allowing us to evaluate both software products and the processes thatyield them. Thus, the software source code and the associated data stored in the version control system,the bug tracking databases, the mailing lists, and the wikis allow us to evaluate quality in a transparentway. Even better, the large number of (often competing) open source projects makes it possible to contrastthe quality of comparable systems serving the same domain. Furthermore, by combining historical sourcecode snapshots with significant events, such as bug discoveries and fixes, we can further dig into the causesand effects of problems. Here we present motivating examples, tools, and techniques that can be used toevaluate the quality of open source (and by extension also proprietary) software.
Keywords: open source, product quality attributes, process quality attributes, sqo-oss
1 This work was funded by the European Community’s Sixth Framework Programme under the contractIST-2005-033331 “Software Quality Observatory for Open Source Software (sqo-oss)”
Electronic Notes in Theoretical Computer Science 233 (2009) 5–28
1571-0661/$ – see front matter © 2009 Elsevier B.V. All rights reserved.
www.elsevier.com/locate/entcs
doi:10.1016/j.entcs.2009.02.058
1 Introduction
Traditionally, research on software quality attributes was either kept under wrapswithin the organization that performed it [4, pp. vii–viii], or it was carried out byoutsiders using narrow, black-box techniques [19,6]. The emergence of open sourcesoftware has changed this picture [31] by allowing us to examine both the softwareproducts [27] and the processes that yield them [13]. Thus, assets, such as thesoftware source code, the associated data stored in the version control system, theissue-tracking databases, the mailing lists, and the wikis, allow us to evaluate qualityin a transparent way [10]. More importantly, because open source software hasconsiderable economic impact [8], and is increasingly used in mission-critical real-world applications (see for instance [5, p. 313] and [17, p. 81]), many organizationswould like to have at hand object measures regarding the quality of the developmentprocess and the corresponding product.
This paper presents a technical and research overview of sqo-oss, a cooperativeresearch effort aiming to establish a software quality observatory for open sourcesoftware. After an overview in the next Section, Section 3 presents the system’sstructure, and Section 4 examples of research on software quality that we hope tobring under the sqo-oss umbrella.
2 Overview
The motivation behind this study came about three years ago when one of itsauthors (Spinellis) found on his hands an idle server with ample storage and internetbandwidth. Having recently read studies concerning the use of the maintainabilityindex on open source quality [32,24], he decided to apply it on snapshots of theFreebsd system over 10 years of its evolution.
The maintainability index (MI) is a widely used measurement of maintainabil-ity. Typical values for MI range from 200 to −100. Higher MI values imply bettermaintainability. The formula and its constituent coefficients are derived from nu-merous empirical studies, and the formula’s results have been tested against actualprogrammer perceptions. For example, one study [3] relates how Hewlett-Packard(hp) engineers compared two similar systems. The system they subjectively consid-ered as being difficult to maintain and modify had an MI of 89, the other, whichhad received praise for its quality in an internal hp evaluation had an MI of 123.Normally, we should calibrate the formula’s coefficients for our specific organiza-tion and project, but even with its given values, the formula typically yields usableresults.
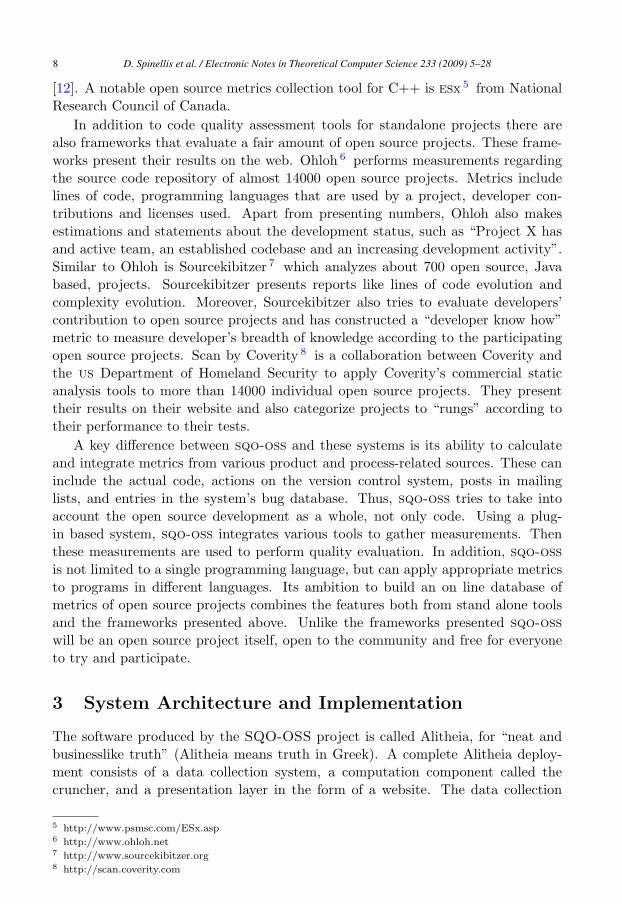
To experiment with the formula, Spinellis put together a script to calculate thevalue over a directory tree, and then applied it on snapshots of the Freebsd systemover 10 years of its evolution (see Figure 1). That demonstrated the value of ex-ploring quality attributes using process-related data, and initiated a research grantapplication, for sqo-oss: a software quality observatory for open source software.
The sqo-oss project is a two year 200 person-month European research effort.
D. Spinellis et al. / Electronic Notes in Theoretical Computer Science 233 (2009) 5–286
50
52
54
56
58
94 95 96 97 98 00 01 02 03 04 050
1
2
3
Mai
ntai
nabi
lity
inde
x
Line
s of
cod
e (m
illio
ns)
Year
Kernel MILOC
60
62
64
66
68
70
94 95 96 97 98 00 01 02 03 04 052
3
4
5
Mai
ntai
nabi
lity
inde
x
Line
s of
cod
e (m
illio
ns)
Year
User Programs MILOC
Fig. 1. Program growth and maintainability index over time in the Freebsd kernel and user programs.
The consortium consists of two academic partners: the Athens University of Eco-nomics and Business and the Aristotle University of Thessanoniki, and three indus-trial partners: kdab, with employees in Sweden, France, Denmark, and Germany,which executes Open Source and proprietary development contracts in the Qt/kde
environment; ProSyst, a leading provider of embedded Java and osgi compliantsoftware, and Sirius Corporation, an Open Source consultancy. Also participatingis kde e.V., an open source organization behind the namesake powerful free soft-ware graphical desktop environment for Linux and Unix workstations. The project’sgoals are to
• create a metric plugin-based architecture and a corresponding processing engine,• establish new product and process software metrics that take advantage of the
sqo-oss infrastructure,• provide an interface through the web, web services, and an Eclipse plugin that
developers can use to improve the quality of their application,• publish concrete values of product and process metrics for popular oss software,• setup a league of open source software applications based on user-specified criteria.
Each one of the above goals is not a unique or an innovative tool idea. Thereare several open source tools that try to evaluate code quality of a single softwareproject by examining several aspects of it. pmd 1 is a Java scanner that tries tofind possible bugs from exception handling statements and code problems, such asdead or duplicate code. Findbugs 2 performs static analysis to reveal bugs in Javabased programs. Checkstyle 3 is a coding style checker for Java programs. Sonar 4 ,unlike the above, is a plug in metrics tool, for Java. It integrates, as plug-ins, aset of code measurement tools (like the ones presented) in a single application andpresents overall results. The presentation follows the iso/iec 9126 Quality Model
1 http://pmd.sourceforge.net2 http://findbugs.sourceforge.net3 http://checkstyle.sourceforge.net/4 http://sonar.codehaus.org/
D. Spinellis et al. / Electronic Notes in Theoretical Computer Science 233 (2009) 5–28 7
[12]. A notable open source metrics collection tool for C++ is esx 5 from NationalResearch Council of Canada.
In addition to code quality assessment tools for standalone projects there arealso frameworks that evaluate a fair amount of open source projects. These frame-works present their results on the web. Ohloh 6 performs measurements regardingthe source code repository of almost 14000 open source projects. Metrics includelines of code, programming languages that are used by a project, developer con-tributions and licenses used. Apart from presenting numbers, Ohloh also makesestimations and statements about the development status, such as “Project X hasand active team, an established codebase and an increasing development activity”.Similar to Ohloh is Sourcekibitzer 7 which analyzes about 700 open source, Javabased, projects. Sourcekibitzer presents reports like lines of code evolution andcomplexity evolution. Moreover, Sourcekibitzer also tries to evaluate developers’contribution to open source projects and has constructed a “developer know how”metric to measure developer’s breadth of knowledge according to the participatingopen source projects. Scan by Coverity 8 is a collaboration between Coverity andthe us Department of Homeland Security to apply Coverity’s commercial staticanalysis tools to more than 14000 individual open source projects. They presenttheir results on their website and also categorize projects to “rungs” according totheir performance to their tests.
A key difference between sqo-oss and these systems is its ability to calculateand integrate metrics from various product and process-related sources. These caninclude the actual code, actions on the version control system, posts in mailinglists, and entries in the system’s bug database. Thus, sqo-oss tries to take intoaccount the open source development as a whole, not only code. Using a plug-in based system, sqo-oss integrates various tools to gather measurements. Thenthese measurements are used to perform quality evaluation. In addition, sqo-oss
is not limited to a single programming language, but can apply appropriate metricsto programs in different languages. Its ambition to build an on line database ofmetrics of open source projects combines the features both from stand alone toolsand the frameworks presented above. Unlike the frameworks presented sqo-oss
will be an open source project itself, open to the community and free for everyoneto try and participate.
3 System Architecture and Implementation
The software produced by the SQO-OSS project is called Alitheia, for “neat andbusinesslike truth” (Alitheia means truth in Greek). A complete Alitheia deploy-ment consists of a data collection system, a computation component called thecruncher, and a presentation layer in the form of a website. The data collection
5 http://www.psmsc.com/ESx.asp6 http://www.ohloh.net7 http://www.sourcekibitzer.org8 http://scan.coverity.com
D. Spinellis et al. / Electronic Notes in Theoretical Computer Science 233 (2009) 5–288
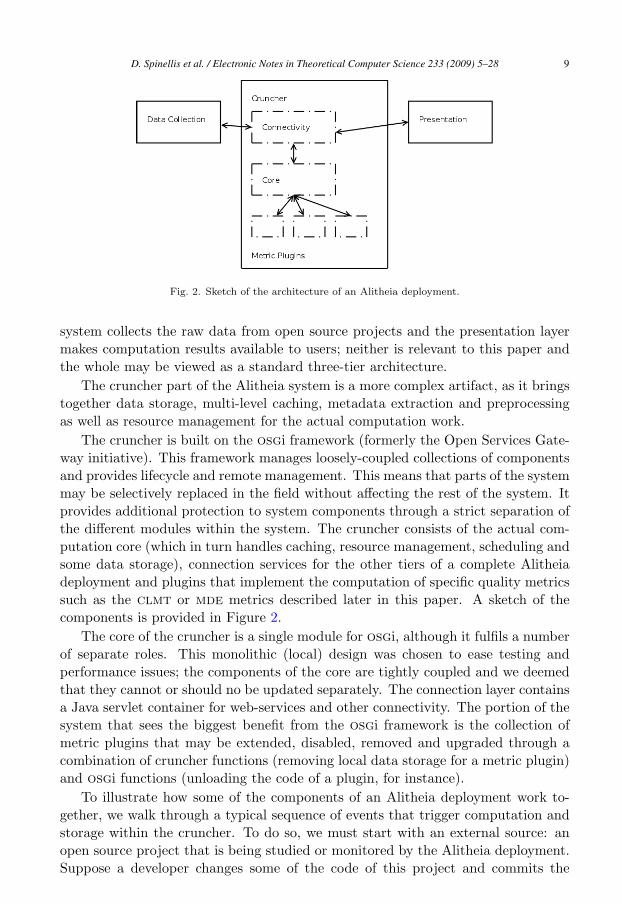
Fig. 2. Sketch of the architecture of an Alitheia deployment.
system collects the raw data from open source projects and the presentation layermakes computation results available to users; neither is relevant to this paper andthe whole may be viewed as a standard three-tier architecture.
The cruncher part of the Alitheia system is a more complex artifact, as it bringstogether data storage, multi-level caching, metadata extraction and preprocessingas well as resource management for the actual computation work.
The cruncher is built on the osgi framework (formerly the Open Services Gate-way initiative). This framework manages loosely-coupled collections of componentsand provides lifecycle and remote management. This means that parts of the systemmay be selectively replaced in the field without affecting the rest of the system. Itprovides additional protection to system components through a strict separation ofthe different modules within the system. The cruncher consists of the actual com-putation core (which in turn handles caching, resource management, scheduling andsome data storage), connection services for the other tiers of a complete Alitheiadeployment and plugins that implement the computation of specific quality metricssuch as the clmt or mde metrics described later in this paper. A sketch of thecomponents is provided in Figure 2.
The core of the cruncher is a single module for osgi, although it fulfils a numberof separate roles. This monolithic (local) design was chosen to ease testing andperformance issues; the components of the core are tightly coupled and we deemedthat they cannot or should no be updated separately. The connection layer containsa Java servlet container for web-services and other connectivity. The portion of thesystem that sees the biggest benefit from the osgi framework is the collection ofmetric plugins that may be extended, disabled, removed and upgraded through acombination of cruncher functions (removing local data storage for a metric plugin)and osgi functions (unloading the code of a plugin, for instance).
To illustrate how some of the components of an Alitheia deployment work to-gether, we walk through a typical sequence of events that trigger computation andstorage within the cruncher. To do so, we must start with an external source: anopen source project that is being studied or monitored by the Alitheia deployment.Suppose a developer changes some of the code of this project and commits the
D. Spinellis et al. / Electronic Notes in Theoretical Computer Science 233 (2009) 5–28 9
change. Then the following events occur within the Alitheia deployment:
(i) Some time later, the data collection component updates its copy of the opensource project and notices that the source code has changed.
(ii) The data collection component updates the raw data from the data source andconnects to the cruncher to inform it of the change in the raw data.
(iii) The cruncher retrieves the raw data from the data collection component, anal-yses it and stores the extracted and preprocessed metadata locally.
(iv) The cruncher determines which metric plugins should act on the new data.Each of these plugins is asked to calculate a result for the change(s) in the rawdata.
(v) The scheduler part of the cruncher handles resource and cpu allocation to thecomputation jobs that ensue.
(vi) Each metric plugin does its calculation and stores its results.
Once the core has activated metric plugins for calculations, the roles of masterand servant are reversed: the metric plugins begin querying the core for services.The core provides two levels of data access, each with their own caching scheme,through a Thin and a Fat Data Services Layer. Metrics may use either layer butthe Fat Layer is recommended, as it provides more processed and cached data thanthe Thin Layer.
The Thin Data Layer (tds, so called because using it for data retrieval is atiresome process) provides raw project data to clients (e.g., metrics plugins). Theraw data consists of project source code, both as individual file contents and sourcecheckouts, project source history, mail messages in rfc822 format and bug data.The tds manages access to the data and does resource management so that raw datarequests do not overwhelm the cruncher (for instance by simultaneously requestinga complete checkout of the source code of kde for all 830,000 revisions of thatproject).
The Fat Data System (fds) deals with the processed metadata about individualitems that would otherwise be retrieved through the tds; for mail messages we mayconsider sender, recipients, subject, etc. bits of metadata that can be individuallyqueried. The fds also performs aggregation and allows higher-level search: “whichmail messages were sent last tuesday?” or “what replies are there to this message”.The fds uses the database storage for the cruncher to store the metadata. Weassume that metadata is both smaller and used more briefly than raw project data.Another feature of the fds is the production of “timeline” views of a project, inwhich it merges the events from the source, mail and bug data into a single unifiednotion of “project change event.” This is valuable for metrics that operate on morethan one datatype or that attempt to measure an aspect of a project’s process, notjust the product.
From the point of view of a metric plugin — once that metric is activated todo a specific measurement — the architecture of the Alitheia core is turned on itshead: the fds is the primary service to use, with the database of metadata directly
D. Spinellis et al. / Electronic Notes in Theoretical Computer Science 233 (2009) 5–2810
runMetrics(ProjectFile[])
Updater LoC MetricMetric
ActivatorFDSDB
OSGi
Scheduler Updater LoC MetricMetric
ActivatorFDSDB
OSGi
Scheduler
enqueue(MetricJob(ProjectFile))
(a) The updater notifies the metric activator (b) The metric activator enqueues a calculation job
Updater LoC MetricMetric
ActivatorFDSDB
OSGi
Scheduler
run(ProjectFile)
Updater LoC MetricMetric
ActivatorFDSDB
OSGi
Scheduler
getFile(ProjectFile)
(c) The job is executed (d) The metric retrieves the file contents from the fds
Updater LoC MetricMetric
ActivatorFDSDB
OSGi
Scheduler
addRecord(ProjectFile)
(f) The result is stored
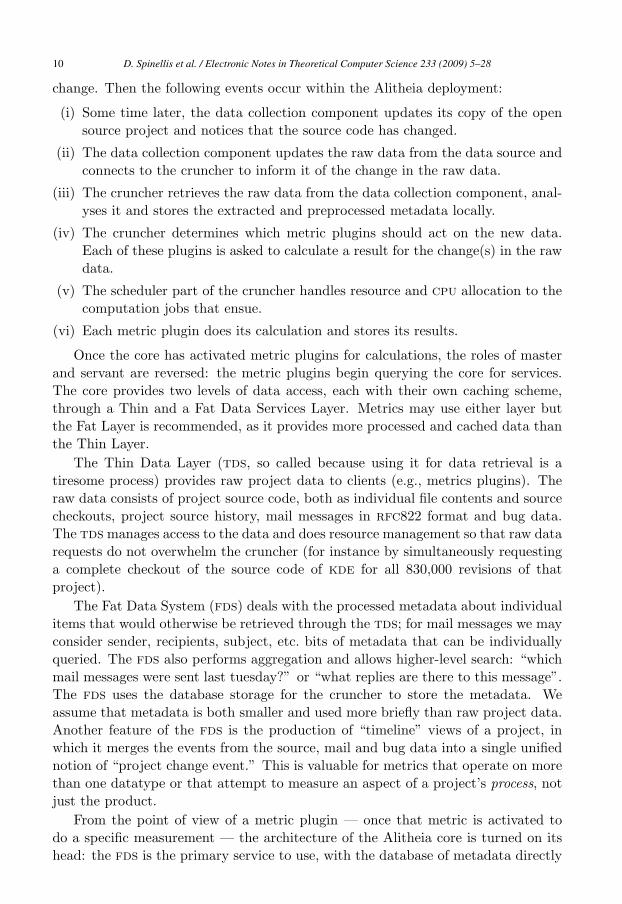
Fig. 3. Metric activation and processing
available if the fds api is insufficient, and the tds is to be used for low-level datashuffling; the metric’s primary concern is in obtaining the data and storing its result.Overall, a metric may view the rest of an Alitheia deployment as an elaborate multi-level cache mechanism, where remote data from an open source project under studyby the metric is mirrored by the data collection subsystem (reducing latency forraw data access), then copied to the cruncher for immediate study through thetds (reducing data access time further, but still requiring processing to obtain thecommon metadata, if that is needed) and stored in pre-digested form (reducing thetime to obtain common metadata further) in the fds.
Turning the view on its head again and examining the interface that a metricprovides to the cruncher, we see that this interface has three areas of functionality:lifecycle management, measurement (both performing measurements and obtain-ing the results afterwards for the communications and presentation layers), metricconfiguration and metadata.
Lifecycle management is invoked by the osgi framework when loading and un-loading a metric plugin, and is required to keep the databases clean. It follows astandard pattern of install, update and remove. Metric configuration and metadatais a straightforward keys-and-values kind of interface.
Metric plugins implement one or more metrics that are interested in one ormore kinds of change in the open source projects under study. We use Java’sreflection mechanism to dispatch requests; as a consequence the metric plugin api
has a method run(Object) which takes an object describing the change and this isdispatched to the relevant measurement methods in each metric.
Figure 3 presents the steps required to calculate a simple line counting metric foran array of files. The updater component is notified externally that an update to themirrored project assets has occurred; it then proceeds to incrementally process theasset metadata while recording the exact resources that have changed. It then passes
D. Spinellis et al. / Electronic Notes in Theoretical Computer Science 233 (2009) 5–28 11
OSGi
LoC Metric DBWeb
ServicePluginadmin
Client
getResult(Metric,File)
LoC Metric DBWeb
ServicePluginadmin
OSGi
getMetricRef(Metric)
(a) The client requests the result of metric on a file (b) The web service acquires a metric interface
LoC Metric DBWeb
ServicePluginadmin
OSGi
getResult(File)
LoC Metric DBWeb
ServicePluginadmin
OSGi
findResultObject(File)
(c) The web service asks the metric (d) The metric retrieves the result
OSGi
LoC Metric DBWeb
ServicePluginadmin
Client
Result
(e) The result is returned
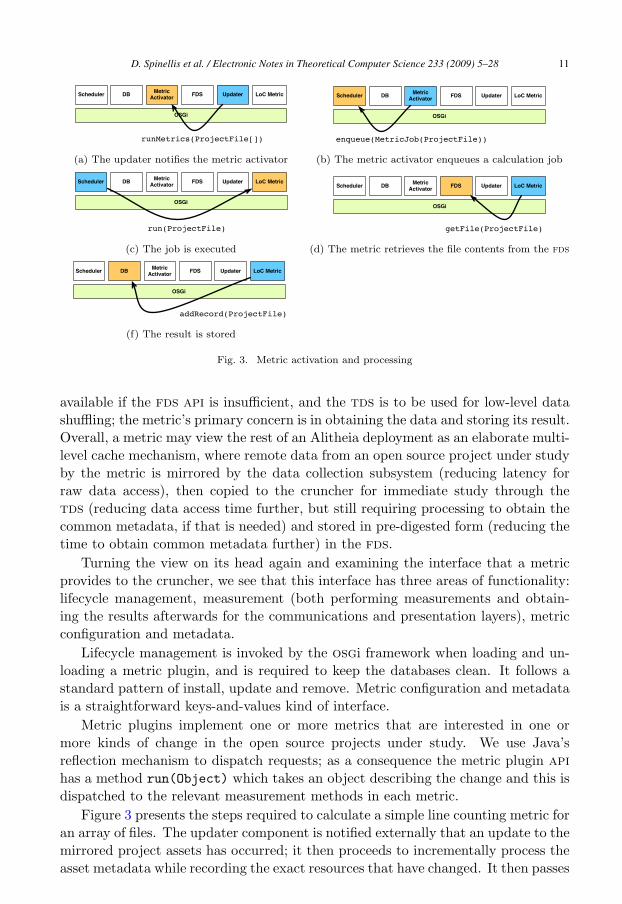
Fig. 4. Results retrieval
the corresponding information to the metric activator (a). The metric activatorcreates a job for each changed asset and calls the scheduler to enqueue the jobs(b). When a thread becomes available, the scheduler runs the job. The job itselfessentially calls the metric’s run method with the appropriate argument (c), in ourcase an object encapsulating a file. With this reference available, the metric canquery the fds component to retrieve the file’s contents from the original data source,in that case directly from the project’s repository. Finally, the lines of the file arecounted and the result is stored in the database (e).
The simplest result retrieval scenario is presented in Figure 4. The client asks theweb service component for the measurement calculated by a metric on a specific file(a). As each metric can store results in arbitrary ways in the system’s database, itis not possible to search for metric results using a generic data retrieval mechanism;instead each plug-in provides its own results retrieval function. Therefore, the webservice must call the plug-in administrator to obtain a reference to the plug-ininterface that implements the specific metric (b) and then query the plug-in itselffor the result of the metric on the specific file (c). The plug-in code searches thedatabase (d) for the result and returns it to the web service, which encapsulates itin a soap message and returns it to the client(e).
Measurement retrieval incurs a complication. Some measurements may not bedone yet — for instance, when a large project is added it may take some time for allmeasurement to be completed or we may ignore measurements of “old” data untilsuch time as someone expresses interest in them. We can distinguish situationsin which response time is important; if the user interface in the presentation layermakes a request (through the communication layer and the core) for a specificmeasurement, it is important to give a quick response: the measurement value if weknow it or otherwise an “I don’t know yet” value (and then start calculating the
D. Spinellis et al. / Electronic Notes in Theoretical Computer Science 233 (2009) 5–2812
180˚
240˚
300˚
0˚
60˚
120˚
180˚
-90˚
-60˚
-30˚
0˚
30˚
60˚
90˚
101
101
102
103
104
105
LOC
0
50
100
150
200
250
300
0 4 8 12 16 20
Ave
rage
LO
C p
er d
ay
Time (UTC)
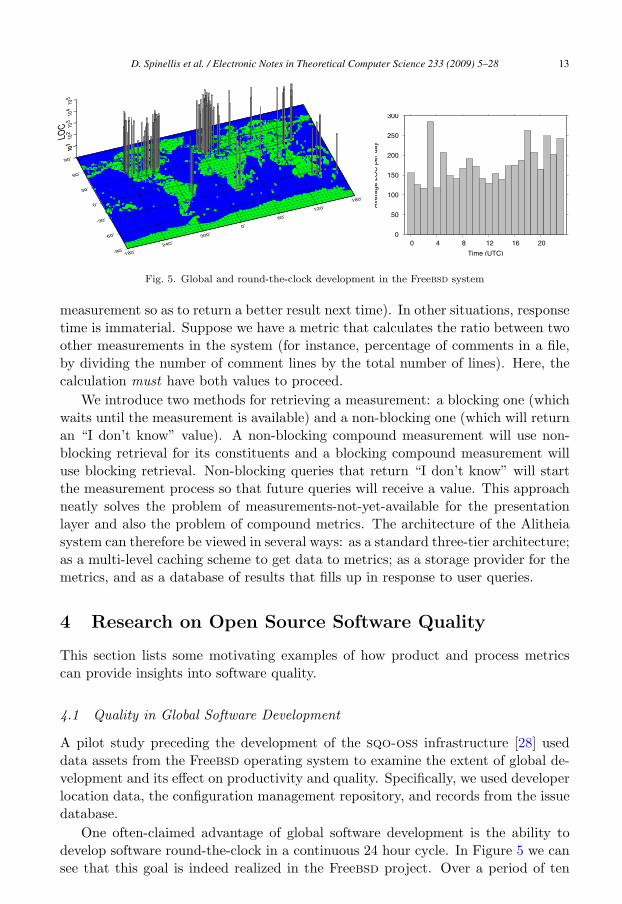
Fig. 5. Global and round-the-clock development in the Freebsd system
measurement so as to return a better result next time). In other situations, responsetime is immaterial. Suppose we have a metric that calculates the ratio between twoother measurements in the system (for instance, percentage of comments in a file,by dividing the number of comment lines by the total number of lines). Here, thecalculation must have both values to proceed.
We introduce two methods for retrieving a measurement: a blocking one (whichwaits until the measurement is available) and a non-blocking one (which will returnan “I don’t know” value). A non-blocking compound measurement will use non-blocking retrieval for its constituents and a blocking compound measurement willuse blocking retrieval. Non-blocking queries that return “I don’t know” will startthe measurement process so that future queries will receive a value. This approachneatly solves the problem of measurements-not-yet-available for the presentationlayer and also the problem of compound metrics. The architecture of the Alitheiasystem can therefore be viewed in several ways: as a standard three-tier architecture;as a multi-level caching scheme to get data to metrics; as a storage provider for themetrics, and as a database of results that fills up in response to user queries.
4 Research on Open Source Software Quality
This section lists some motivating examples of how product and process metricscan provide insights into software quality.
4.1 Quality in Global Software Development
A pilot study preceding the development of the sqo-oss infrastructure [28] useddata assets from the Freebsd operating system to examine the extent of global de-velopment and its effect on productivity and quality. Specifically, we used developerlocation data, the configuration management repository, and records from the issuedatabase.
One often-claimed advantage of global software development is the ability todevelop software round-the-clock in a continuous 24 hour cycle. In Figure 5 we cansee that this goal is indeed realized in the Freebsd project. Over a period of ten
D. Spinellis et al. / Electronic Notes in Theoretical Computer Science 233 (2009) 5–28 13
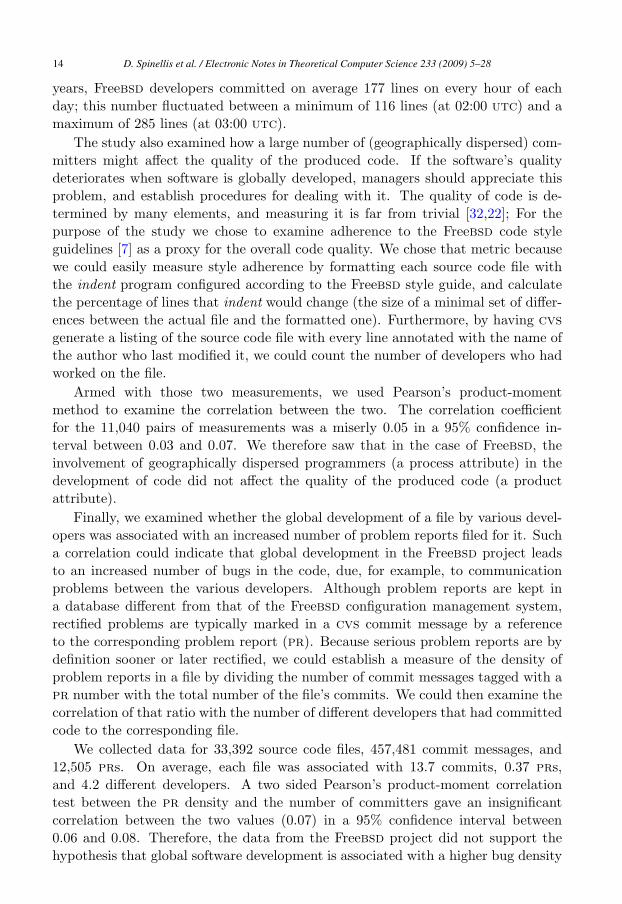
years, Freebsd developers committed on average 177 lines on every hour of eachday; this number fluctuated between a minimum of 116 lines (at 02:00 utc) and amaximum of 285 lines (at 03:00 utc).
The study also examined how a large number of (geographically dispersed) com-mitters might affect the quality of the produced code. If the software’s qualitydeteriorates when software is globally developed, managers should appreciate thisproblem, and establish procedures for dealing with it. The quality of code is de-termined by many elements, and measuring it is far from trivial [32,22]; For thepurpose of the study we chose to examine adherence to the Freebsd code styleguidelines [7] as a proxy for the overall code quality. We chose that metric becausewe could easily measure style adherence by formatting each source code file withthe indent program configured according to the Freebsd style guide, and calculatethe percentage of lines that indent would change (the size of a minimal set of differ-ences between the actual file and the formatted one). Furthermore, by having cvs
generate a listing of the source code file with every line annotated with the name ofthe author who last modified it, we could count the number of developers who hadworked on the file.
Armed with those two measurements, we used Pearson’s product-momentmethod to examine the correlation between the two. The correlation coefficientfor the 11,040 pairs of measurements was a miserly 0.05 in a 95% confidence in-terval between 0.03 and 0.07. We therefore saw that in the case of Freebsd, theinvolvement of geographically dispersed programmers (a process attribute) in thedevelopment of code did not affect the quality of the produced code (a productattribute).
Finally, we examined whether the global development of a file by various devel-opers was associated with an increased number of problem reports filed for it. Sucha correlation could indicate that global development in the Freebsd project leadsto an increased number of bugs in the code, due, for example, to communicationproblems between the various developers. Although problem reports are kept ina database different from that of the Freebsd configuration management system,rectified problems are typically marked in a cvs commit message by a referenceto the corresponding problem report (pr). Because serious problem reports are bydefinition sooner or later rectified, we could establish a measure of the density ofproblem reports in a file by dividing the number of commit messages tagged with apr number with the total number of the file’s commits. We could then examine thecorrelation of that ratio with the number of different developers that had committedcode to the corresponding file.
We collected data for 33,392 source code files, 457,481 commit messages, and12,505 prs. On average, each file was associated with 13.7 commits, 0.37 prs,and 4.2 different developers. A two sided Pearson’s product-moment correlationtest between the pr density and the number of committers gave an insignificantcorrelation between the two values (0.07) in a 95% confidence interval between0.06 and 0.08. Therefore, the data from the Freebsd project did not support thehypothesis that global software development is associated with a higher bug density
D. Spinellis et al. / Electronic Notes in Theoretical Computer Science 233 (2009) 5–2814
in the code produced.
4.2 Mean Developer Engagement
The principles behind the agile development methods and common practice withinthe Open Source community are vastly different. In recent years there has been arise of interest in these, in order to detect and inform on areas of compatible sharedpractices. In [1] we argue that it is possible to quantify the level of agility displayedby Open Source projects. An indicator of agility, the Mean Developer Engagement(mde) metric is introduced and tested through the analysis of public project data.Projects sampled from two repositories (kde and SourceForge) are studied and anull hypothesis is formulated: projects from the two samples display a similar levelof mde.
As developers are a limited resource within the Free Software community it isimportant that Free Software projects engage their developer resource in order tomaintain their interest. To this end the mde metric for measuring engagement isdefined as “the ability, on average, over the lifetime of a Free Software project, forthat project to make use of its developer resources.” Mathematically this can bedescribed as:
de =
∑ni=1
(dev(active)
dev(total)
)i
n(1)
Where:
• dev(active) is the number of (distinct) developers active in time period i.• dev(total) is the total number of developers involved with the project in the
periods 0 . . . i.• n is the number of time periods over which the project has been evaluated. For
this research these were periods of a week.
The initial failing of this approach is that dev(total) is hard to define. As afirst attempt this was simply taken to be the number of accounts within the projectSubversion repository. This, however, is a naıve approach, because account detailsremain within a Subversion repository even after the developer has left the project.To make this measurement more accurate we introduced a developer “grace period”.This is a period of developer inactivity where we still consider the developer partof dev(total). The longer a developer has been involved with a project, the longerwe allow their grace period to grow.
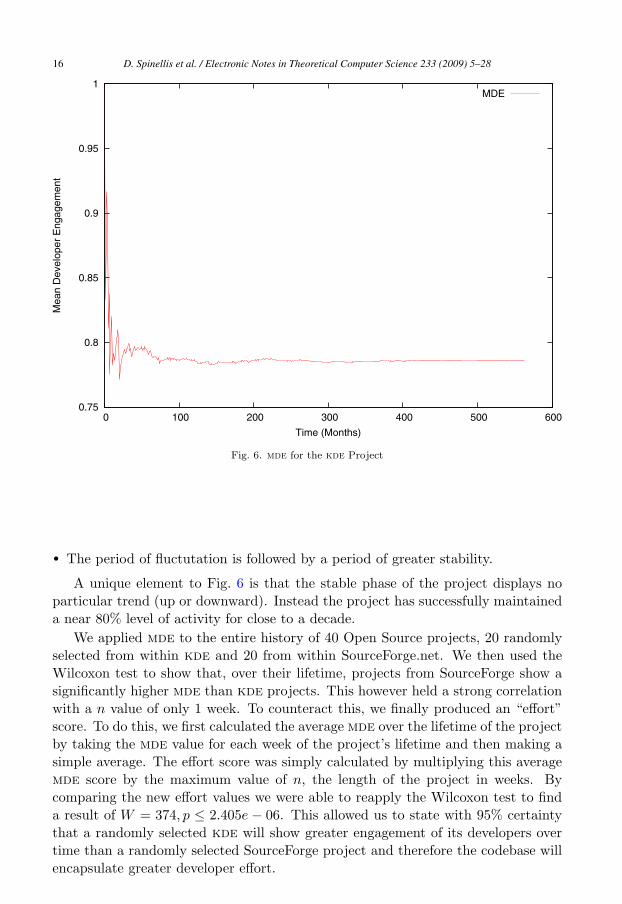
An example plot of mde for the history of the kde projects is provided in Fig. 6.This plot clearly shows some features common to all Open Software projects:
• mde, mathematically, must start at 1. That is, at least one developer was activewithin the first week of the project and, at the time, was the only developer inthe project. Put simply, the projet is founded.
• The mde at the begining of the project shows a fluctuation. This is caused bychanges in dev(active) whilst both dev(total) and n are low.
D. Spinellis et al. / Electronic Notes in Theoretical Computer Science 233 (2009) 5–28 15
0.75
0.8
0.85
0.9
0.95
1
0 100 200 300 400 500 600
Mea
n D
evel
oper
Eng
agem
ent
Time (Months)
MDE
Fig. 6. mde for the kde Project
• The period of fluctutation is followed by a period of greater stability.
A unique element to Fig. 6 is that the stable phase of the project displays noparticular trend (up or downward). Instead the project has successfully maintaineda near 80% level of activity for close to a decade.
We applied mde to the entire history of 40 Open Source projects, 20 randomlyselected from within kde and 20 from within SourceForge.net. We then used theWilcoxon test to show that, over their lifetime, projects from SourceForge show asignificantly higher mde than kde projects. This however held a strong correlationwith a n value of only 1 week. To counteract this, we finally produced an “effort”score. To do this, we first calculated the average mde over the lifetime of the projectby taking the mde value for each week of the project’s lifetime and then making asimple average. The effort score was simply calculated by multiplying this averagemde score by the maximum value of n, the length of the project in weeks. Bycomparing the new effort values we were able to reapply the Wilcoxon test to finda result of W = 374, p ≤ 2.405e − 06. This allowed us to state with 95% certaintythat a randomly selected kde will show greater engagement of its developers overtime than a randomly selected SourceForge project and therefore the codebase willencapsulate greater developer effort.
D. Spinellis et al. / Electronic Notes in Theoretical Computer Science 233 (2009) 5–2816
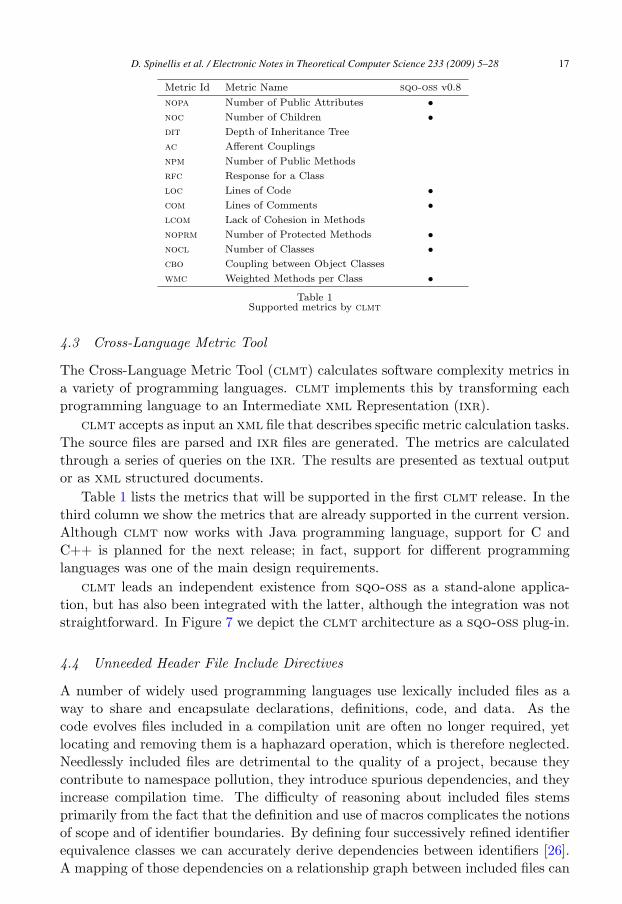
Metric Id Metric Name sqo-oss v0.8
nopa Number of Public Attributes •noc Number of Children •dit Depth of Inheritance Tree
ac Afferent Couplings
npm Number of Public Methods
rfc Response for a Class
loc Lines of Code •com Lines of Comments •lcom Lack of Cohesion in Methods
noprm Number of Protected Methods •nocl Number of Classes •cbo Coupling between Object Classes
wmc Weighted Methods per Class •Table 1
Supported metrics by clmt
4.3 Cross-Language Metric Tool
The Cross-Language Metric Tool (clmt) calculates software complexity metrics ina variety of programming languages. clmt implements this by transforming eachprogramming language to an Intermediate xml Representation (ixr).
clmt accepts as input an xml file that describes specific metric calculation tasks.The source files are parsed and ixr files are generated. The metrics are calculatedthrough a series of queries on the ixr. The results are presented as textual outputor as xml structured documents.
Table 1 lists the metrics that will be supported in the first clmt release. In thethird column we show the metrics that are already supported in the current version.Although clmt now works with Java programming language, support for C andC++ is planned for the next release; in fact, support for different programminglanguages was one of the main design requirements.
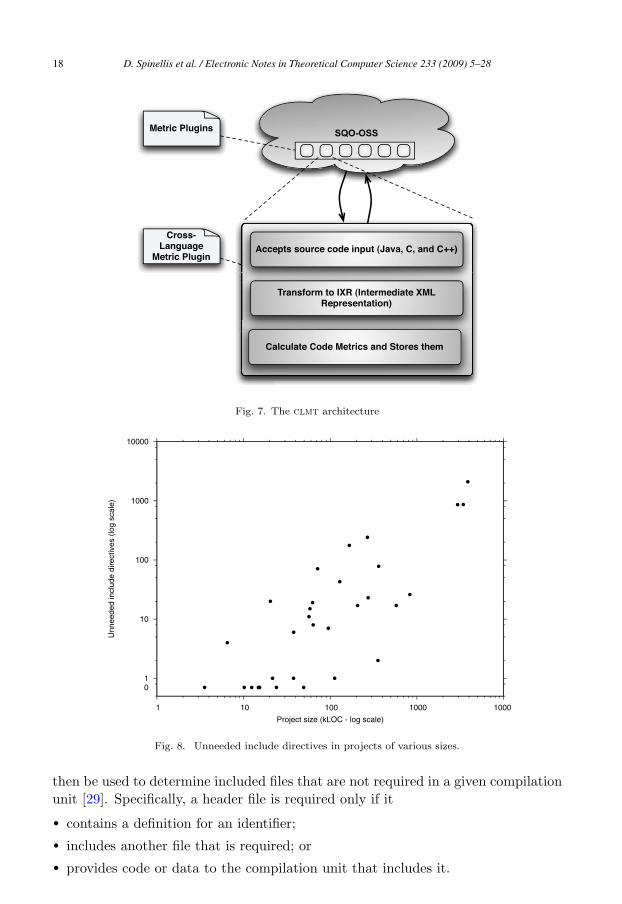
clmt leads an independent existence from sqo-oss as a stand-alone applica-tion, but has also been integrated with the latter, although the integration was notstraightforward. In Figure 7 we depict the clmt architecture as a sqo-oss plug-in.
4.4 Unneeded Header File Include Directives
A number of widely used programming languages use lexically included files as away to share and encapsulate declarations, definitions, code, and data. As thecode evolves files included in a compilation unit are often no longer required, yetlocating and removing them is a haphazard operation, which is therefore neglected.Needlessly included files are detrimental to the quality of a project, because theycontribute to namespace pollution, they introduce spurious dependencies, and theyincrease compilation time. The difficulty of reasoning about included files stemsprimarily from the fact that the definition and use of macros complicates the notionsof scope and of identifier boundaries. By defining four successively refined identifierequivalence classes we can accurately derive dependencies between identifiers [26].A mapping of those dependencies on a relationship graph between included files can
D. Spinellis et al. / Electronic Notes in Theoretical Computer Science 233 (2009) 5–28 17
SQO-OSSMetric Plugins
Cross-Language
Metric PluginAccepts source code input (Java, C, and C++)
Transform to IXR (Intermediate XMLRepresentation)
Calculate Code Metrics and Stores them
Fig. 7. The clmt architecture
1
10
100
1000
10000
1 10 100 1000 1000
Unn
eede
d in
clud
e di
rect
ives
(lo
g sc
ale)
Project size (kLOC - log scale)
0
Fig. 8. Unneeded include directives in projects of various sizes.
then be used to determine included files that are not required in a given compilationunit [29]. Specifically, a header file is required only if it
• contains a definition for an identifier;• includes another file that is required; or• provides code or data to the compilation unit that includes it.
D. Spinellis et al. / Electronic Notes in Theoretical Computer Science 233 (2009) 5–2818
We tested our approach on 32 medium and large–sized open-source projects.These were: the Apache httpd 1.3.27, Lucent’s awk as of Mar 14th, 2003, bash 3.1,cvs 1.11.22, Emacs 22.1, the kernel of Freebsd head branch as of September 9th,2006 lint configuration processed for the i386, amd64, and sparc64 architectures,gdb 6.7, Ghostscript 7.05, gnuplot 4.2.2, at&t GraphViz 2.16, the default configura-tion of the Linux kernel 2.6.18.8-0.5 processed for the x86-64 (amd64) architecture,the kernel of OpenSolaris as of August 8th, 2007 configured for the Sun4v Sun4uand sparc architectures, the Microsoft Windows Research Kernel 1.2 processed forthe i386 and amd64 architectures, Perl 5.8.8, Postgresql 8.2.5, Xen 3.1.0, and theversions of the programs bind, ed, lex, mail, make, ntpd, nvi, pax, pppd, routed,sendmail, tcpdump, tcsh, window, xlint, and zsh distributed with Freebsd 6.2. TheFreebsd programs were processed under Freebsd 6.2 running on an i386 processorarchitecture, while the rest, where not specified, were configured under opensuse
Linux 10.2 running on an amd64 processor architecture. For expediency, we se-lected the projects by looking for representative, widely-used, large-scale systemsthat were written in C and could be compiled standalone. The processed sourcecode size was 14.2 million lines of code.
A summary of the results appears in Figure 8. As we can see, unneeded headerfiles are rarely a problem for projects smaller than 20 kloc, but become a significantone as the project’s size increases. (The chart’s abscissa also includes a notionalvalue of zero where projects without include directive problems are indicated.)
4.5 A Metric for Developer Contributions
In software engineering, contribution assessment entails the measurement of thecontribution of a person in terms of lines of code or function points towards the de-velopment of a software project. In the recent years however, the shift to more agiledevelopment practices and the proliferation of software and project managementtools has reduced the estimation capacity of classic software estimation models. Asoftware developer today is not only required to write code, but also to communicatewith colleagues effectively and to use a variety of tools that produce and modifycode with minimal input from his side.
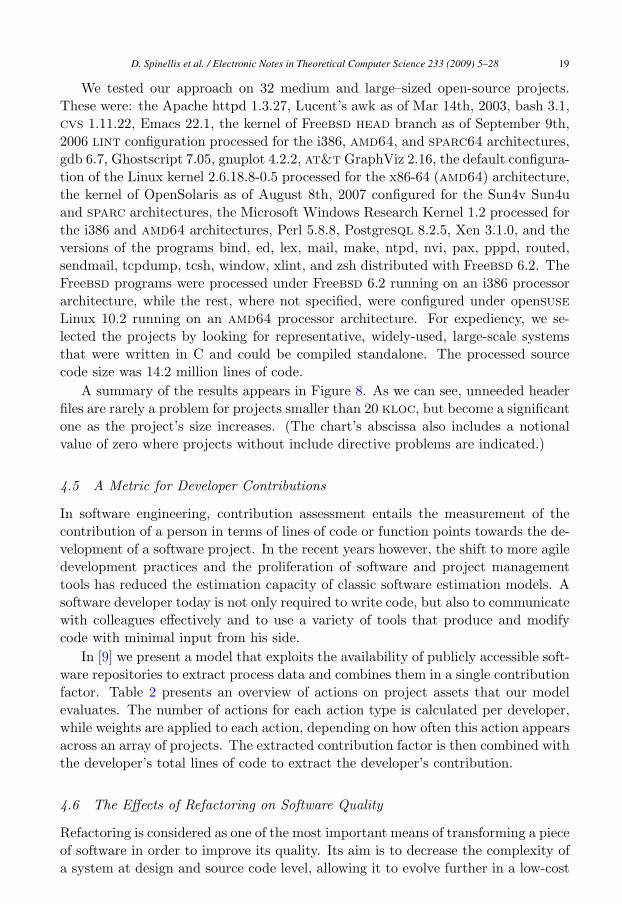
In [9] we present a model that exploits the availability of publicly accessible soft-ware repositories to extract process data and combines them in a single contributionfactor. Table 2 presents an overview of actions on project assets that our modelevaluates. The number of actions for each action type is calculated per developer,while weights are applied to each action, depending on how often this action appearsacross an array of projects. The extracted contribution factor is then combined withthe developer’s total lines of code to extract the developer’s contribution.
4.6 The Effects of Refactoring on Software Quality
Refactoring is considered as one of the most important means of transforming a pieceof software in order to improve its quality. Its aim is to decrease the complexity ofa system at design and source code level, allowing it to evolve further in a low-cost
D. Spinellis et al. / Electronic Notes in Theoretical Computer Science 233 (2009) 5–28 19
Asset Action Type
Code andDocumentationRepository
Add lines of code of good/bad quality P/N
Commit new source file or directory P
Commit code that generates/closes a bug N/P
Add/Change code documentation P
Commit fixes to code style P
Commit more than X files in a single commit N
Commit documentation files P
Commit translation files P
Commit binary files N
Commit with empty commit comment N
Commit comment that awards a pointy hat P
Commit comment that includes a bug report num P
Mailing lists -Forums
First reply to thread P
Start a new thread P
Participate in a flamewar N
Close a lingering thread P
Bug Database Close a bug P
Report a confirmed/invalid bug P/N
Close a bug that is then reopened N
Comment on a bug report P
Wiki Start a new wiki page P
Update a wiki page P
Link a wiki page from documentation/mail file P
irc Frequent participation to irc P
Prompt replies to directed questions P
Table 2Project resources and actions that can be performed on them. The Type column denotes whether an
action has positive (P) or negative (N) impact.
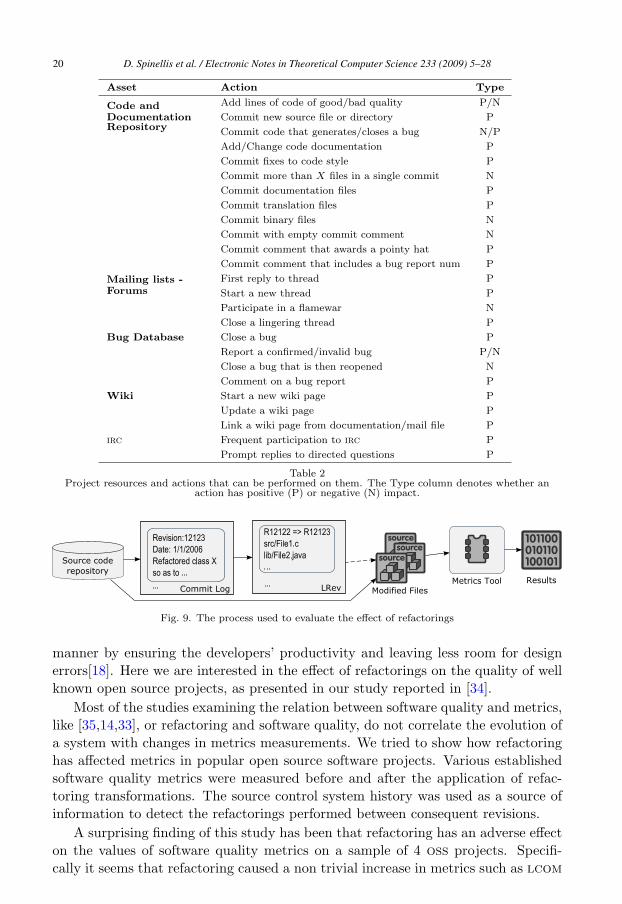
Fig. 9. The process used to evaluate the effect of refactorings
manner by ensuring the developers’ productivity and leaving less room for designerrors[18]. Here we are interested in the effect of refactorings on the quality of wellknown open source projects, as presented in our study reported in [34].
Most of the studies examining the relation between software quality and metrics,like [35,14,33], or refactoring and software quality, do not correlate the evolution ofa system with changes in metrics measurements. We tried to show how refactoringhas affected metrics in popular open source software projects. Various establishedsoftware quality metrics were measured before and after the application of refac-toring transformations. The source control system history was used as a source ofinformation to detect the refactorings performed between consequent revisions.
A surprising finding of this study has been that refactoring has an adverse effecton the values of software quality metrics on a sample of 4 oss projects. Specifi-cally it seems that refactoring caused a non trivial increase in metrics such as lcom
D. Spinellis et al. / Electronic Notes in Theoretical Computer Science 233 (2009) 5–2820
Dataset size k r2
in/out in/out
j2se sdk 13,055 2.09/3.12 .99/.86
Eclipse 22,001 2.02/3.15 .99/.87
OpenOffice 3,019 1.93/2.87 .99/.94
bea WebLogic 80,095 2.01/3.52 .99/.86
cpan packages 27,895 1.93/3.70 .98/.95
Linux libraries 4,047 1.68/2.56 .92/.62
Freebsd libraries 2,682 1.68/2.56 .91/.58
MS-Windows binaries 1,355 1.66/3.14 .98/.76
Freebsd ports, libraries deps 5,104 1.75/2.97 .94/.76
Freebsd ports, build deps 8,494 1.82/3.50 .99/.98
Freebsd ports, runtime deps 7,816 1.96/3.18 .99/.99
TEX 1,364 2.00/2.84 .91/.85
meta-font 1,189 1.94/2.85 .96/.85
Ruby 603 2.62/3.14 .97/.95
The errors of TEX 1,229 3.36 .94
Linux system calls (242) 3,908 1.40 .89
Linux C libraries functions (135) 3,908 1.37 .84
Freebsd system calls (295) 3,103 1.59 .81
Freebsd C libraries functions (135) 3,103 1.22 .80
Table 3Software Power Laws.
(Lack of Cohesion in Methods, expresses the similarity of methods), Ca (AfferentCoupling, the number of other packages depending upon a class) and rfc (Re-sponse for a Class, the sum of the number of methods of the class itself and allother methods it calls), indicating that it caused classes to become less coherentas more responsibilities are assigned to them. The same principles seem to applyin procedural systems as well, in which case the effect is captured as an increasein complexity metrics. Since it is a common conjecture that the metrics used canactually indicate a system’s quality, these results suggest that either the refactoringprocess does not always improve the quality of a system in a measurable way orthat developers still have not managed to use refactoring effectively as a means toimprove software quality. In other words, these results may indicate that eitherrefactoring was not used in a way that improves the quality of the studied projectsor that software quality metrics are not the best method to measure the qualityimprovements introduced by refactoring.
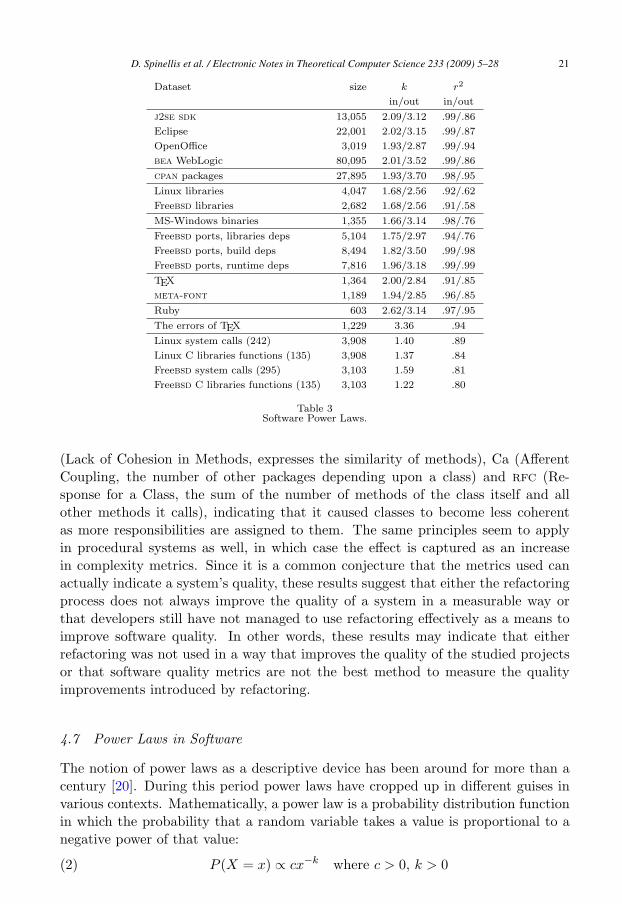
4.7 Power Laws in Software
The notion of power laws as a descriptive device has been around for more than acentury [20]. During this period power laws have cropped up in different guises invarious contexts. Mathematically, a power law is a probability distribution functionin which the probability that a random variable takes a value is proportional to anegative power of that value:
P (X = x) ∝ cx−k where c > 0, k > 0(2)
D. Spinellis et al. / Electronic Notes in Theoretical Computer Science 233 (2009) 5–28 21
The availability of large open-source software systems allowed us to study the ex-istence of scale-free networks of their modules [16]. We chose modules of varying sizeand functionality, ranging from simple Java classes to systems using self-containedlibraries written in C, Perl, and Ruby. For our purposes, the links connecting themodules are given by their dependencies. For two modules A and B we add a di-rected link from B to A when B depends on A. This produces a directed graph.We explore the structure of both the incoming links and the outgoing links.
Note that measuring fan-in and fan-out is not new, and has been used as ameasure for procedural complexity [11]. Here we are not interested in measuringcomplexity, but in seeing whether incoming and outgoing links in different levels ofabstraction show similar patterns. Such patterns could then be related to variousquality metrics.
A summary of our findings is shown in Table 3. In each row we list the numberof nodes, the exponent for the incoming links and outgoing links, where applicable,and the corresponding correlation coefficient. The long, fat tails observed in ourdata impact on several aspects of software engineering, such as quality, design, reuse,and optimization. Based on our results, we propose taking into account the powerlaws present in software to focus development efforts and save resources in qualityassurance tasks.
Even though, as software developers, we may not be able to locate troublespotsin a system, we have a measure of the impact of our efforts. Selecting modules atrandom, we may expect that around a percent of the dependencies will not leadto bugs propagated from bugs in the selected modules. If, however, we focus onthe top (in terms of dependent modules) a percent of the modules in a system, wemay avoid the propagation of errors to up to aθ other dependent modules, whereθ = 1 − 1
k−1 (for details see [16])—a significant improvement.For instance, the success and failure of beta-testing can be illuminated if we con-
sider the scale-free distribution of bugs; beta-testers will discover quickly the smallnumber of defects that make up a large proportion of those that can be found; atthe same time, there will always be other effects, with a much lower probability tobe found during testing, that will continue to torment unlucky users during produc-tion. However, despite the best of efforts, a system may still fail. Recovery-OrientedComputing accepts this as a fact of life and demands that systems appropriate forrapid recovery should be identified at various levels of abstraction [2]. This suggeststhat hub modules could be suitable candidates.
4.8 A Quality Model for Open Source Software
In the context of the sqo-oss project we defined a model for software qualityevaluation, based on software models [15] that define and measure software quality.This particular model aims at capturing the particularities arising from the specialnature of open source software development process. Moreover, it focuses both onsource code and the community around a project.
The model is presented in [23]. The model construction process followed agqm [25] approach. The outcome was a hierarchical tree view of the quality at-
D. Spinellis et al. / Electronic Notes in Theoretical Computer Science 233 (2009) 5–2822
SQO-OSS Quality Characteristics
Product (Code) Quality
Community Quality
Maintainability
Reliability
Security
Mailing list quality
Documentation quality
Developer base quality
Analyzability
Changeability
Stability
Testability
Maturity
Effectiveness
Fig. 10. The sqo-oss quality model
0
20
40
60
80
100
FreeBSD Linux Solaris Windows 0
10
20
30
40
50
60
70
0
0.5
1
1.5
2
2.5
3
FreeBSD Linux Solaris Windows
10,917
3,412
1,328
2,270
30 44 718
62
Fig. 11. Common coupling at file and global scope (left); comment density in C and header files (right).
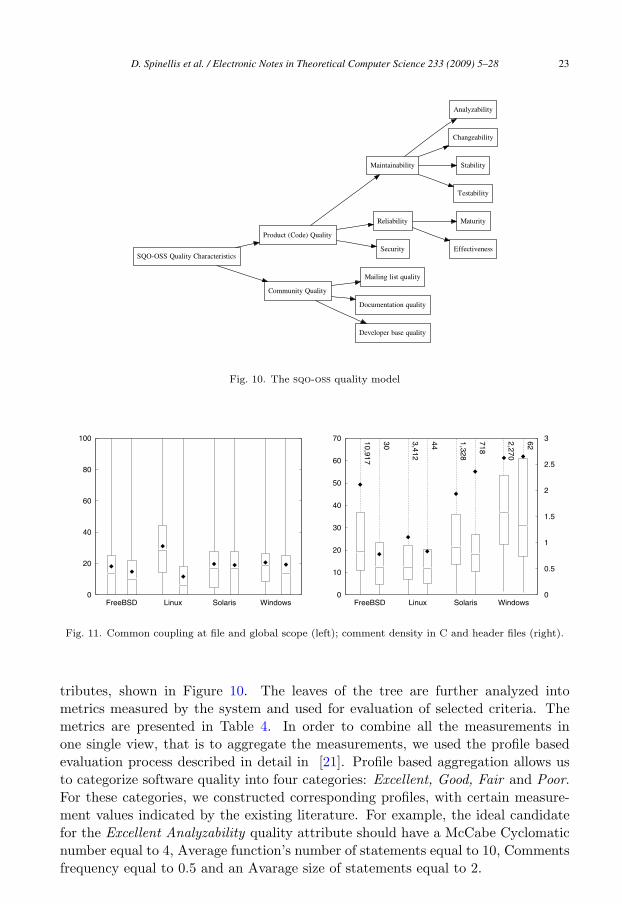
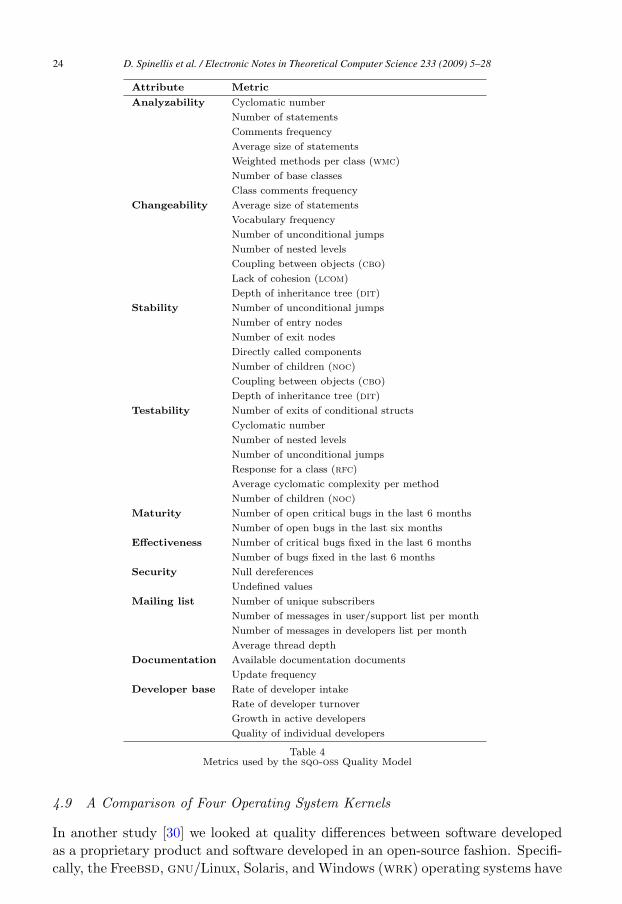
tributes, shown in Figure 10. The leaves of the tree are further analyzed intometrics measured by the system and used for evaluation of selected criteria. Themetrics are presented in Table 4. In order to combine all the measurements inone single view, that is to aggregate the measurements, we used the profile basedevaluation process described in detail in [21]. Profile based aggregation allows usto categorize software quality into four categories: Excellent, Good, Fair and Poor.For these categories, we constructed corresponding profiles, with certain measure-ment values indicated by the existing literature. For example, the ideal candidatefor the Excellent Analyzability quality attribute should have a McCabe Cyclomaticnumber equal to 4, Average function’s number of statements equal to 10, Commentsfrequency equal to 0.5 and an Avarage size of statements equal to 2.
D. Spinellis et al. / Electronic Notes in Theoretical Computer Science 233 (2009) 5–28 23
Attribute Metric
Analyzability Cyclomatic number
Number of statements
Comments frequency
Average size of statements
Weighted methods per class (wmc)
Number of base classes
Class comments frequency
Changeability Average size of statements
Vocabulary frequency
Number of unconditional jumps
Number of nested levels
Coupling between objects (cbo)
Lack of cohesion (lcom)
Depth of inheritance tree (dit)
Stability Number of unconditional jumps
Number of entry nodes
Number of exit nodes
Directly called components
Number of children (noc)
Coupling between objects (cbo)
Depth of inheritance tree (dit)
Testability Number of exits of conditional structs
Cyclomatic number
Number of nested levels
Number of unconditional jumps
Response for a class (rfc)
Average cyclomatic complexity per method
Number of children (noc)
Maturity Number of open critical bugs in the last 6 months
Number of open bugs in the last six months
Effectiveness Number of critical bugs fixed in the last 6 months
Number of bugs fixed in the last 6 months
Security Null dereferences
Undefined values
Mailing list Number of unique subscribers
Number of messages in user/support list per month
Number of messages in developers list per month
Average thread depth
Documentation Available documentation documents
Update frequency
Developer base Rate of developer intake
Rate of developer turnover
Growth in active developers
Quality of individual developers
Table 4Metrics used by the sqo-oss Quality Model
4.9 A Comparison of Four Operating System Kernels
In another study [30] we looked at quality differences between software developedas a proprietary product and software developed in an open-source fashion. Specifi-cally, the Freebsd, gnu/Linux, Solaris, and Windows (wrk) operating systems have
D. Spinellis et al. / Electronic Notes in Theoretical Computer Science 233 (2009) 5–2824
Metric Freebsd Linux Solaris wrk
A. Overview
Version 2006-09-18 2.6.18.8-0.5 2007-08-28 1.2
Lines (thousands) 2,599 4,150 3,000 829
Comments (thousands) 232 377 299 190
Statements (thousands) 948 1,772 1,042 192
Source files 4,479 8,372 3,851 653
Linked modules 1,224 1,563 561 3
C functions 38,371 86,245 39,966 4,820
Macro definitions 727,410 703,940 136,953 31,908
B. File Organization
Files per directory ↘ 6.8 20.4 8.9 15.9
Header files per C source file ≈ 1 1.05 1.96 1.09 1.92
Average structure complexity in files ↘ 2.2 1014 1.3 1013 5.4 1012 2.6 1013
C. Code Structure
% global functions ↘ 36.7 21.2 45.9 99.8
% strictly structured functions ↗ 27.1 68.4 65.8 72.1
% labeled statements ↘ 0.64 0.93 0.44 0.28
Average # function parameters ↘ 2.08 1.97 2.20 2.13
Average depth of maximum nesting ↘ 0.86 0.88 1.06 1.16
Tokens per statement ↘ 9.14 9.07 9.19 8.44
% tokens in replicated code ↘ 4.68 4.60 3.00 3.81
Average function structure complexity ↘ 7.1 104 1.3 108 3.0 106 6.6 105
D. Code Style
% style conforming lines ↗ 77.27 77.96 84.32 33.30
% style conforming typedef identifiers ↗ 57.1 59.2 86.9 100.0
% style conforming aggregate tags ↗ 0.0 0.0 20.7 98.2
Characters per line ↘ 30.8 29.4 27.2 28.6
% numeric constants in operands ↘ 10.6 13.3 7.7 7.7
% unsafe function-like macros ↘ 3.99 4.44 9.79 4.04
% misspelled comment words ↘ 33.0 31.5 46.4 10.1
% unique misspelled comment words ↘ 6.33 6.16 5.76 3.23
E. Preprocessing
% preprocessor directives in header files ↘ 22.4 21.9 21.6 10.8
% non-#include directives in C files ↘ 2.2 1.9 1.2 1.7
% preprocessor directives in functions ↘ 1.56 0.85 0.75 1.07
% preprocessor conditionals in functions ↘ 0.68 0.38 0.34 0.48
% function-like macros in functions ↘ 26 20 25 64
% macros in unique identifiers ↘ 66 50 24 25
% macros in identifiers ↘ 32.5 26.7 22.0 27.1
F. Data Organization
% global scope variable declarations ↘ 0.36 0.19 1.02 1.86
% global scope variable operands ↘ 3.3 0.5 1.3 2.3
% identifiers with wrongly global scope ↘ 0.28 0.17 1.51 3.53
% variable declarations with file scope ↘ 2.4 4.0 4.5 6.4
% variable operands with file scope ↘ 10.0 6.1 12.7 16.7
Variables per typedef or aggregate ↘ 15.13 25.90 15.49 7.70
Data elements per aggregate or enum ↘ 8.5 10.0 8.6 7.3
Metric interpretation: ↘ means lower is better; ↗ means higher is better.
Table 5Key scalar metrics for four operating system kernels
D. Spinellis et al. / Electronic Notes in Theoretical Computer Science 233 (2009) 5–28 25
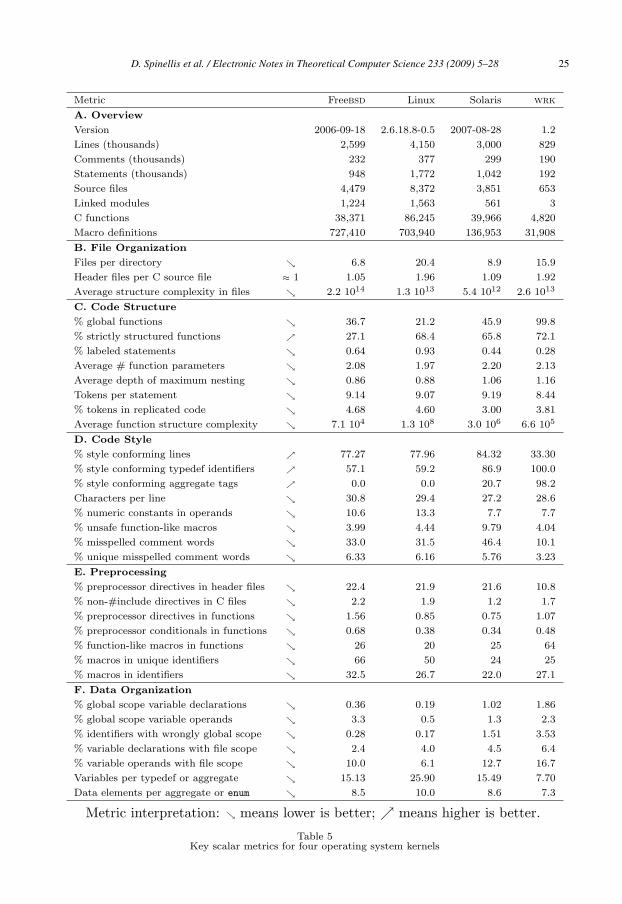
kernels that provide comparable facilities, but their code bases share almost no com-mon parts, while their development processes vary dramatically. We analyzed thesource code of the four systems by collecting metrics in the areas of file organization,code structure, code style, the use of the C preprocessor, and data organization (seeTable 5 and Figure 11). The aggregate results indicated that across various areasand many different metrics, four systems developed using wildly different processesscored comparably. This allowed us to posit that the structure and internal qualityattributes of a working, non-trivial software artifact will represent first and foremostthe engineering requirements of its construction, with the influence of process beingmarginal, if any.
5 Conclusions
By combining both product and process metrics we are able to answer novel issuesin software development, with particular emphasis on quality aspects. In sqo-oss
we take that view in earnest, and we have designed and implemented a platformthat allows both kinds of data to be captured and analysed in an efficient way.
It is important to note that sqo-oss is not (another) metrics evaluation system.It is a platform on which metrics can be developed, plugged it, and run, on projectsof any size. Our plans include extending and maintaining sqo-oss so as to functionas a digital repository for Open Source software research.
As shown in Section 4, we have already tackled a number of interesting researchquestions based on quantitative measurements of quality attributes of Open Sourceprojects. The availability of an open platform for supporting this sort of inquiry willenable us to pursue further research questions; we also hope that other researcherswill wish to take advantage of our infrastructure by working on new metrics andevaluating them with large scale measurements on sqo-oss.
References
[1] Adams, P. J., A. Capiluppi and A. de Groot, Detecting agility of open source projects through developerengagement, in: OSS2008: Proceedings of the Fourth International Conference on Open Source Systems,2008.
[2] Candea, G., A. B. Brown, A. Fox and D. Patterson, Recovery-oriented computing: Building multitierdependability, IEEE Computer 37 (2004), pp. 60–67.
[3] Coleman, D., D. Ash, B. Lowther and P. W. Oman, Using metrics to evaluate software systemmaintainability, Computer 27 (1994), pp. 44–49.
[4] Cusumano, M. A. and R. W. Selby, “Microsoft Secrets,” The Free Press, New York, 1995.
[5] Debenest, P., E. F. Fukushima, Y. Tojo and S. Hirose, A new approach to humanitarian demining. part1: Mobile platform for operation on unstructured terrain, Autonomous Robots 18 (2005), pp. 303–321.
[6] Forrester, J. E. and B. P. Miller, An empirical study of the robustness of Windows NT applicationsusing random testing, in: WSS’00: Proceedings of the 4th conference on USENIX Windows SystemsSymposium (2000), pp. 59–68.
[7] The FreeBSD Project, “Style—Kernel Source File Style Guide,” (1995), freeBSD Kernel Developer’sManual: style(9). Available online http://www.freebsd.org/docs.html (January 2006).
D. Spinellis et al. / Electronic Notes in Theoretical Computer Science 233 (2009) 5–2826
[8] Ghosh, R. A., Study on the: Economic impact of open source software on innovation and thecompetitiveness of the information and communication technologies (ICT) sector in the EU,Available online http://ec.europa.eu/enterprise/ict/policy/doc/2006-11-20-flossimpact.pdf.(2006), prepared by MERIT for the European Commission under the contract ENTR/04/112.
[9] Gousios, G., E. Kalliamvakou and D. Spinellis, Measuring developer contribution from softwarerepository data, in: A. E. Hassan, M. Lanza and M. W. Godfrey, editors, MSR ’08: Mining SoftwareRepositories (2008), pp. 129–132.
[10] Hassan, A. E., R. C. Holt and A. Mockus, Report on MSR 2004: International workshop on miningsoftware repositories, SIGSOFT Software Engineering Notes 30 (2005), p. 4.
[11] Henry, S. and D. Kafura, Software structure metrics based on information flow, IEEE Transactions onSoftware Engineering 7 (1981), pp. 510–518.
[12] International Organization for Standardization, Software Engineering—Product Quality—Part 1:Quality Model (2001), iSO/IEC 9126-1:2001.
[13] Jørgensen, N., Putting it all in the trunk: Incremental software development in the FreeBSD opensource project, Information Systems Journal 11 (2001), pp. 321–336.
[14] Kan, S. H., Metrics and models in software quality engineering (2nd edition) (2002).URL http://www.amazon.co.uk/exec/obidos/ASIN/0201729156/citeulike-21
[15] Kanellopoulos, Y., I. Heitlager, C. Tjortjis and J. Visser, Interpretation of source code clusters in termsof the ISO/IEC-9126 maintainability characteristics, in: K. Kontogiannis, C. Tjorjis and A. Winter,editors, 12th European Conference on Software Maintenance and Reengineering (2008), pp. 63–72.
[16] Louridas, P., D. Spinellis and V. Vlachos, Power laws in software, ACM Transactions on SoftwareEngineering and Methodology (2008), to appear.
[17] Matthies, L., M. Maimone, A. Johnson, Y. Cheng, R. Willson, C. Villalpando, S. Goldberg, A. Huertas,A. Stein and A. Angelova, Computer vision on Mars, International Journal of Computer Vision 75(2007), pp. 67–92.
[18] Mens, T. and T. Tourwe, A Survey of Software Refactoring, IEEE Transactions on Software Engineering30 (2004), pp. 126–139.
[19] Miller, B. P., L. Fredriksen and B. So, An empirical study of the reliability of UNIX utilities,Communications of the ACM 33 (1990), pp. 32–44.
[20] Mitzenmacher, M., A brief history of generative models for power law and lognormal distributions,Internet Mathematics 1 (2004), pp. 226–251.
[21] Morisio, M., I. Stamelos and A. Tsoukias, Software product and process assessment through profile-based evaluation, International Journal of Software Engineering and Knowledge Engineering 13 (2003),pp. 495–512.
[22] Payne, C., On the security of open source software, Information Systems Journal 12 (2002), pp. 61–78.
[23] Samoladas, I., G. Gousios, D. Spinellis and I. Stamelos, The sqo-oss quality model: measurement basedopen source software evaluation, in: OSS ’08: Proceedings of the International Conference on OpenSource Systems 2008 (2008), to appear.
[24] Samoladas, I., I. Stamelos, L. Angelis and A. Oikonomou, Open source software development shouldstrive for even greater code maintainability, Communications of the ACM 47 (2004), pp. 83–87.
[25] Solingen, R. V., The goal/question/metric approach, Encyclopedia of Software Engineering 2 (2002),pp. 578–583.
[26] Spinellis, D., Global analysis and transformations in preprocessed languages, IEEE Transactions onSoftware Engineering 29 (2003), pp. 1019–1030.
[27] Spinellis, D., “Code Quality: The Open Source Perspective,” Addison-Wesley, Boston, MA, 2006.
[28] Spinellis, D., Global software development in the FreeBSD project, in: P. Kruchten, Y. Hsieh,E. MacGregor, D. Moitra and W. Strigel, editors, International Workshop on Global SoftwareDevelopment for the Practitioner (2006), pp. 73–79.
[29] Spinellis, D., Optimizing header file include directives, Journal of Software Maintenance and Evolution:Research and Practice (2008), .To appear.
D. Spinellis et al. / Electronic Notes in Theoretical Computer Science 233 (2009) 5–28 27

[30] Spinellis, D., A tale of four kernels, in: W. Schafer, M. B. Dwyer and V. Gruhn, editors, ICSE ’08:Proceedings of the 30th International Conference on Software Engineering (2008), pp. 381–390.
[31] Spinellis, D. and C. Szyperski, How is open source affecting software development?, IEEE Software 21(2004), pp. 28–33.
[32] Stamelos, I., L. Angelis, A. Oikonomou and G. L. Bleris, Code quality analysis in open source softwaredevelopment, Information Systems Journal 12 (2002), pp. 43–60.
[33] Stamelos, I., L. Angelis, A. Oikonomou and G. L. Bleris, Code quality analysis in open source softwaredevelopment., Information Systems Journal 12 (2002), pp. 43–60.
[34] Stroggylos, K. and D. Spinellis, Refactoring: Does it improve software quality?, in: B. Boehm,S. Chulani, J. Verner and B. Wong, editors, 5th International Workshop on Software Quality (2007),pp. 1–6.
[35] Subramanyam, R. and M. S. Krishnan, Empirical analysis of ck metrics for object-oriented designcomplexity: Implications for software defects, IEEE Transactions on Software Engineering 29 (2003),pp. 297–310.
D. Spinellis et al. / Electronic Notes in Theoretical Computer Science 233 (2009) 5–2828