Embed Size (px)
Citation preview

EVALUATING THE QUALITY OF STEADY-STATE MULTIVARIATE EXPERIMENTAL DATA IN VARIOUS ORC EXPERIMENTAL
SETUPS
S. Quoilin, O. Dumont, R. Dickes, V. Lemort
Thermodynamics Laboratory, University of Liège
September 15th 2017
ORC 2017 Conference

2
High quality data is required for the development, the calibration and the validation of models
Different types of models: Deterministic models Semi-empirical models Empirical models
Experimental data is subject to many measurements errors, test bench malfunctions, operator misuse or misinterpretation, etc.
Special focus on multidimensional inputs Goal of this work: provide an open-source tool to assess the
quality of experimental data and its « explainability » Several key questions to be answered
Introduction Quality of experimental data

3
Question 1: “Most likely” shape of the function explaining the
data?

4
Question 2: Repeatability and detection of outliers

5
Additional questions:
• Best explanatory variables?
– Goal: explain the data with the smallest possible set of input variables
• Data accuracy / noise level?
– Goal: determine experimentally what it the data accuracy => what would be the best accuracy a model could reach with this data
– Necessity to de-noise the data

Data analysis: Use of Gaussian Process regressions /
Kriging interpolation
6
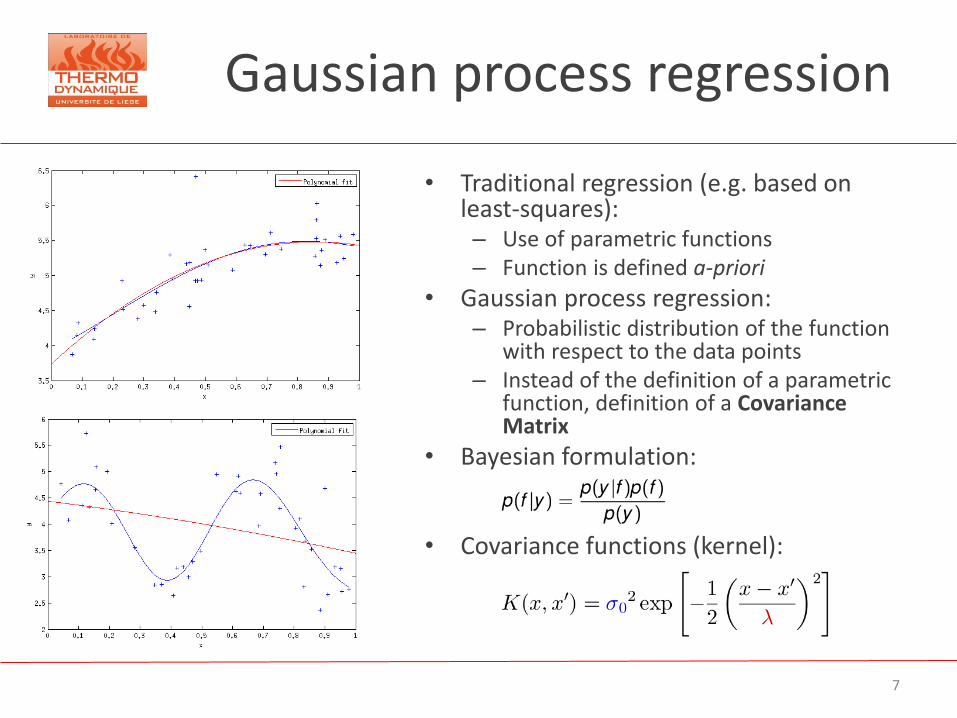
Gaussian process regression
• Traditional regression (e.g. based on least-squares): – Use of parametric functions – Function is defined a-priori
• Gaussian process regression: – Probabilistic distribution of the function
with respect to the data points – Instead of the definition of a parametric
function, definition of a Covariance Matrix
• Bayesian formulation: • Covariance functions (kernel):
7

Gaussian process
8 Source: John P. Cunningham, Gaussian Processes for Machine Learning, MLSS 2012
1. Definition of a GP prior
2. Use Baysian inference to update the probability distribution
𝑦 200 = −6

Gaussian process: Regression
9

Gaussian process: Effect of outliers
10

Gaussian process: Effect of noise
11

Selection of the length scales Preventing overfitting
12 Source: John P. Cunningham, Gaussian Processes for Machine Learning, MLSS 2012
Unidimensional Gaussian Process regression: Use of a SE kernel:
l=50: just right l=15: Overfitting l=150: Underfitting

Selection of the length scales Preventing overfitting
13
Multidimensional Gaussian Process regression: Use of an SE ARD Kernel:
The hyperparameters ld must be optimized to avoir under/over fitting

Selection of the length scales Preventing overfitting
14
Three-step process: 1. Optimize the parameters (l1,l2,l3,…) to
maximize the marginal likelihood
2. Computation of the mean average error in Cross-Validation / Training
3. Visual verification:
Cross-validation, good fit:
Mean relative error: MRE with all points: 2.7% MRE in cross-validation: 7.6%

Selection of the length scales Preventing overfitting
15
Three-step process: 1. Optimize the parameters (l1,l2,l3,…) to
maximize the marginal likelihood
2. Computation of the mean absolute error in Cross-Validation / Training
3. Visual verification:
Cross-validation, overfit:
Mean relative error: MRE with all points: 1.1% MRE in cross-validation: 18.5%

Examples of experimental test rig
16

Experimental setups Open-drive scroll compressor
17
• Converted into an expander
• Built in volumetric ratio : 3.94
• Absence of lubrication
• Not tight

18
Experimental setups Open-drive scroll compressor

19
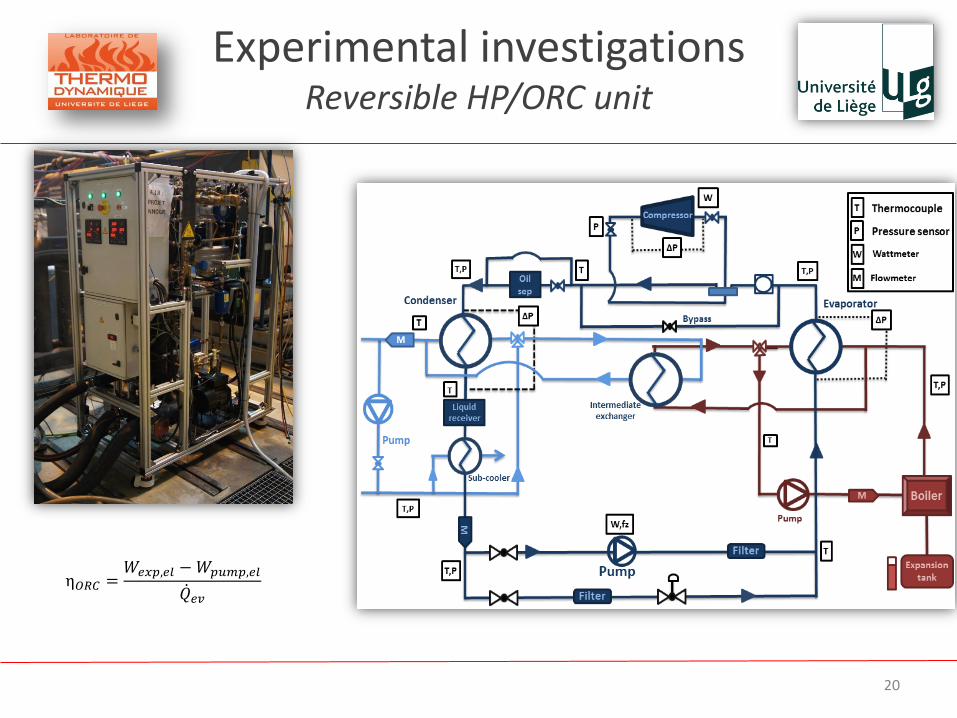
Experimental setups Reversible HP/ORC unit
Heat Pump ORC Reversible HP/ORC
Working fluid
Working fluid
20
η𝑂𝑅𝐶 =𝑊𝑒𝑥𝑝,𝑒𝑙 −𝑊𝑝𝑢𝑚𝑝,𝑒𝑙
𝑄 𝑒𝑣
Experimental investigations Reversible HP/ORC unit

21
Sun2Power unit: • 2kWe recuperative ORC
• R245fa as working fluid
• Scroll expander + diaphragm pump
• Two BPHEXs (EV + REC)
• One fin coil air-cooled condenser
Reference database: • Experimental measurements
• Complete range of conditions (40 pts)
Experimental investigations Sun2Power unit

Outlier detection Example with the HP/ORC test rig
22

Feature selection Example with the Sun2power test rig
23
Lengthscales:
Relevant input variable

Summary
24
Predicted variable: Power output 2 outliers MAPE, GP: 1,92% MAPE, physical model: 2.45 %
Predicted variable: Power output No outlier MAPE, GP: 4.56% MAPE, physical model: 8.12 %
Predicted variable: Power output 2 outliers MAPE, GP: 0.99% MAPE, physical model: 1.94 %

Conclusions
Starting from three ORC-related datasets, the proposed framework allowed us to: Perform non-linear, non-parametric regression Detect doubtful data points (outliers) Select the relevant input variables for the process to model (feature
selection)
Plot the effect of each relevant input variable by keeping the others constant (response surface)
Evaluate the noise level in the data (i.e. the maximum model accuracy) Compare the “quality” of various datasets The GPExp tool: Open-source Easy to download and run in Matlab Graphical user interface (GUI) External contributions and improvements are welcome
25

EVALUATING THE QUALITY OF STEADY-STATE MULTIVARIATE EXPERIMENTAL DATA IN VARIOUS ORC EXPERIMENTAL
SETUPS
S. Quoilin, O. Dumont, R. Dickes, V. Lemort
Thermodynamics Laboratory, University of Liège
September 15th 2017
ORC 2017 Conference