Embed Size (px)
Citation preview
CORRESPONDENCE Defne Öcal Kaplan [email protected]
© 2016 Öcal Kaplan. Open Access terms of the Creative Commons Attribution 4.0 International License (http://creativecommons.org/licenses/by/4.0/) apply. The license permits unrestricted use, distribution, and reproduction in any medium, on the condition that users give exact credit to the original author(s) and the source, provide a link to the Creative Commons license, and indicate if they made any changes.
Introduction
The complicated anatomy of the hand consists of 27 bones (8 carpal, 5
metacarpal, 14 phalges), 27 joints, 34 muscles, more than a hundred ligaments
and tendons, innumerable blood vessels, nerves and soft tissues. One hand is more
preferred than the other in skills carried out with one hand. In the developmental
process of the individual; the genetic structure, external factors encountered,
occupation, purpose-oriented trainings in different sports branches which are
done with hand play a significant role in the configuration and differentiation of
the hand. The skill of handgrip is one of the basic functions of the upper extremity.
INTERNATIONAL JOURNAL OF ENVIRONMENTAL & SCIENCE EDUCATION
2016, VOL. 11, NO.10, 3297-3309
Evaluating The Relation Between Dominant and Non-Dominant Hand Perimeters and Handgrip Strength of
Basketball, Volleyball, Badminton and Handball Athletes
Defne Öcal Kaplana
aKastamonu University, Kastamonu, TURKEY
ABSTRACT In this study, it’s aimed to evaluate the relation between dominant and non-dominant hand
perimeters and handgrip strength of basketball, volleyball, badminton and handball
athletes. Totally 101 active athletes (49 females, 52 male), of the average age in female
20±1.42 years, in male 21±1.99 years, joined to this study. Height, body weight, BMI (Body
Mass Index) and handgrip strength of all the athletes were measured according to
international standards. Hand perimeters were measured at a certain standard with digital
camera and was calculated with the software developed. The data was analyzed by SPSS
22 programme and Student t test, Pearson Correlation test and One Way Anova was applied.
A significance level of p <0.05 was adopted in the analysis. Results of the analysis showed
that dominant and non-dominant handgrips of athletes in all disciplines and gender are
significantly different and hand and finger perimeters developing different depending on
the way they use the ball or racket grip.
The resulting data is important to contribute structuring strength developer training
programs for using the dominant hand in different sports athletes and orientating the
athletes during aptitude selection in the future.
KEYWORDS ARTICLE HISTORY Badminton, basketball, handball, hand span,
handgrip strength, volleyball Received 21 April 2016
Revised 05 July 2016 Accepted 07 July 2016
OPEN ACCESS

3298 D. ÖCAL KAPLAN
The appearance of the normal grasping patterns depends on the anatomic
coherence of the hand and its capability of achieving the normal functions of the
supportive neural structures (Gürcan, 2008).
Hand size relates to grip strength: the longer the bones, the longer the
muscles and hence the greater the number of contractile units that can be
incorporated. Lengthening muscle by adding sarcomeres in series is associated
with only increasing the speed of a muscle contraction and not its force (Lieber,
2002). Dimensional characteristics of the hand in many sports branches,
especially in branches such as basketball and handball that include grasping
something and moves of throw, anthropometric dimensions of the hand and
correspondingly the handgrip strength affect success (Visnapuu, 2007). It has
been shown that the maximum handgrip strength can differ to a great extent even
if it is compared within people with the same age range and same sex. Different
bodily measurement values such as genetic characteristics, body weight and
height and different bodily uses peculiar to a certain society can play a significant
role. In addition, it is required to have data related to the differences of hand
measurement in order for making the dimension of hand-held tools (such as ball,
racket, glove) more ergonomic and being more productive biomechanically (Lin,
2015; Yu, 2013; Mirmohammadi, 2015).
There are many studies in literature showing that the maximum handgrip
strength can be affected by numerous anthropometric measurement values such
as gender, age, height, body weight, body mass index (BMI), dominant hand, hand
length and width and that those can be used to estimate the handgrip strength of
an individual (Plogmaker, 2013). Hand measurements are crucial in revealing
their differences among branches as well as estimating the rates of tall stature
and other extremities (Paulis, 2015; Jee, 2015; Ahmed, 2013; Uhrová, 2015; Ishak,
2012). Today, it has been tried to improve more useful, cheaper and different
methods with lower error rate which can be alternative to standard
anthropometric measurements and they have been proved to be able to be used
statistically instead of manual measurements (Maunier, 2000; Jiang, 2012;
Rogers, 2008). Measurements carried out by taking photos are less time-
consuming and enable participants to be more enthusiastic as there is no
measurement tool contacting the body. In addition, the archivability of the data
helps them to be reinterpreted in the future (Habibi, 2013).
By looking at this information, it is aimed in this study to reveal the
relationship between palm reaches of dominant and non-dominant hands and
handgrip strengths of elite athletes in basketball, volleyball, handball and
badminton, and to make an inter-branch comparison. The findings of the study
will help creating ideas on determining criteria during the process of choosing
skills, specifying the influences of goal-oriented trainings and producing tools in
proportion to the hand sizes of the users in sports branches such as basketball,
volleyball, handball and badminton in which handgrip strength is crucial.
Materials and Methods
Totally, 101 active athletes from the branches of 21 basketball players (9
female, 12 male), 34 volleyball players (14 female, 20 male), 19 badminton players
(9 female, 10 male) and 27 handball players (17 female, 10 male) participated in
this study. To determine anthropometric measurements of subjects, in accordance
with international standards, the height with anthropometer, body weight with
INTERNATIONAL JOURNAL OF ENVIRONMENTAL & SCIENCE EDUCATION 3299
100 gr sensitive electronic weigher (Lohman, 1998; Weiner, 1988). Body mass
index (BMI) was calculated as the body mass per (height)2 in kg/m2 as the general
anthropometric variables. Then three groups of hand anthropometric variables
were measured: 5 finger spans and 5 perimeters of the hand.
Handgrip strength measurements; right-hand grip strength and left-hand
grip strength values were measured using hand grip dynamometer according to
international standards with the dynamometer. The right and left hand were
measured separately twice and best value kg. was detected.
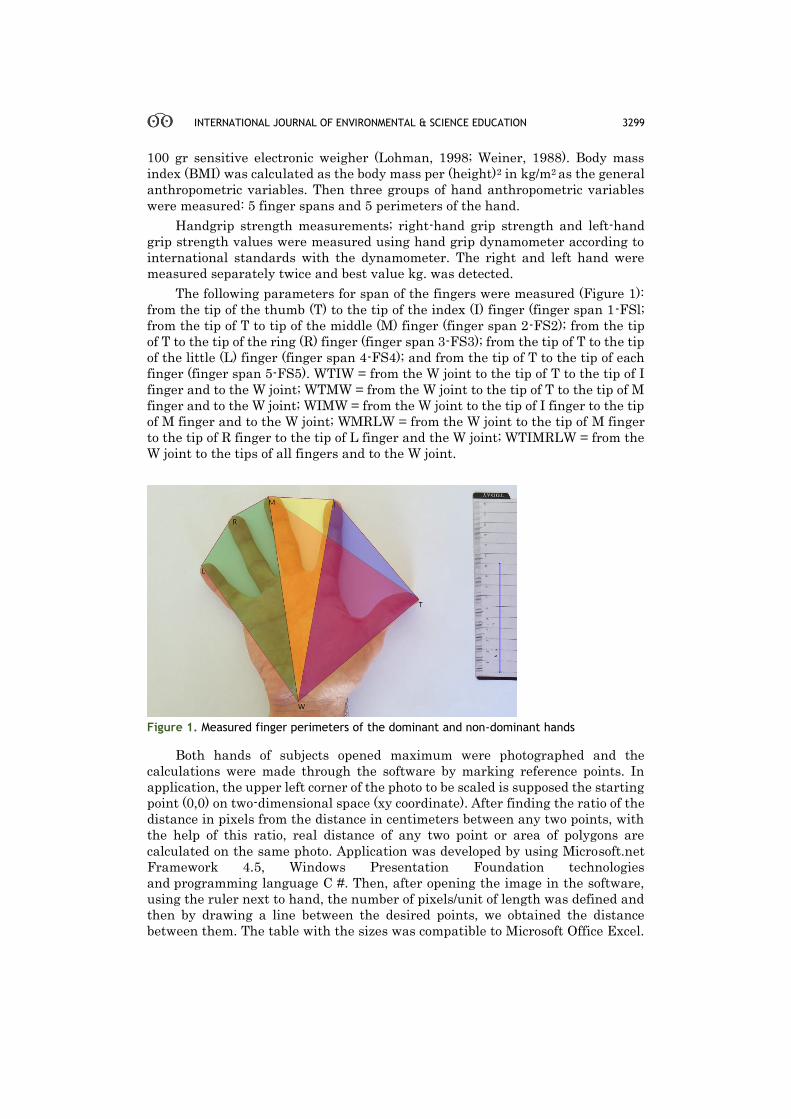
The following parameters for span of the fingers were measured (Figure 1):
from the tip of the thumb (T) to the tip of the index (I) finger (finger span 1-FSl;
from the tip of T to tip of the middle (M) finger (finger span 2-FS2); from the tip
of T to the tip of the ring (R) finger (finger span 3-FS3); from the tip of T to the tip
of the little (L) finger (finger span 4-FS4); and from the tip of T to the tip of each
finger (finger span 5-FS5). WTIW = from the W joint to the tip of T to the tip of I
finger and to the W joint; WTMW = from the W joint to the tip of T to the tip of M
finger and to the W joint; WIMW = from the W joint to the tip of I finger to the tip
of M finger and to the W joint; WMRLW = from the W joint to the tip of M finger
to the tip of R finger to the tip of L finger and the W joint; WTIMRLW = from the
W joint to the tips of all fingers and to the W joint.
Figure 1. Measured finger perimeters of the dominant and non-dominant hands
Both hands of subjects opened maximum were photographed and the
calculations were made through the software by marking reference points. In
application, the upper left corner of the photo to be scaled is supposed the starting
point (0,0) on two-dimensional space (xy coordinate). After finding the ratio of the
distance in pixels from the distance in centimeters between any two points, with
the help of this ratio, real distance of any two point or area of polygons are
calculated on the same photo. Application was developed by using Microsoft.net
Framework 4.5, Windows Presentation Foundation technologies
and programming language C #. Then, after opening the image in the software,
using the ruler next to hand, the number of pixels/unit of length was defined and
then by drawing a line between the desired points, we obtained the distance
between them. The table with the sizes was compatible to Microsoft Office Excel.

3300 D. ÖCAL KAPLAN
In this way, the error while entering the numbers into analyses software like
Excel or SPSS was resolved and a lot of time saved.
The basic principle of the application can be explained as follows; measuring
the distance in the plane, we use Euclidean Distance Formula for. According to
the Euclidean distance formula, the distance between two points in the plane with
coordinates (x,y) and (a,b) is given by dist ((x, y), (a, b)) = √(x - a)² + (y - b)²
The data was analyzed by SPSS 22 programme and Student t test, Pearson
Correlation test and One Way Anova was applied. A significance level of p <0.05
was adopted in the analysis.
Results
101 (49 females, 52 male) athletes’ general anthropometric parameters and
handgrip strengths have been measured among which the average age in female
is 20±1.42 years and in men 21±1.99 years in basketball, volleyball, badminton
and handball. Descriptive statistics in terms of age, body height, body weight,
Body Mass Index, dominant and non-dominant handgrip strength of the athletes
who have been measured are shown in Table 1.
As a result of the Paired Sample t Test which have been carried out to
determine whether there is a significant difference between dominant and non-
dominant handgrip strength of the athletes in branch and gender subtitles, it has
been observed that in all the branches the dominant hand is significantly different
than the non-dominant hand both in male and female athletes. The results of the
Paired Sample t Test are shown in Table 2.
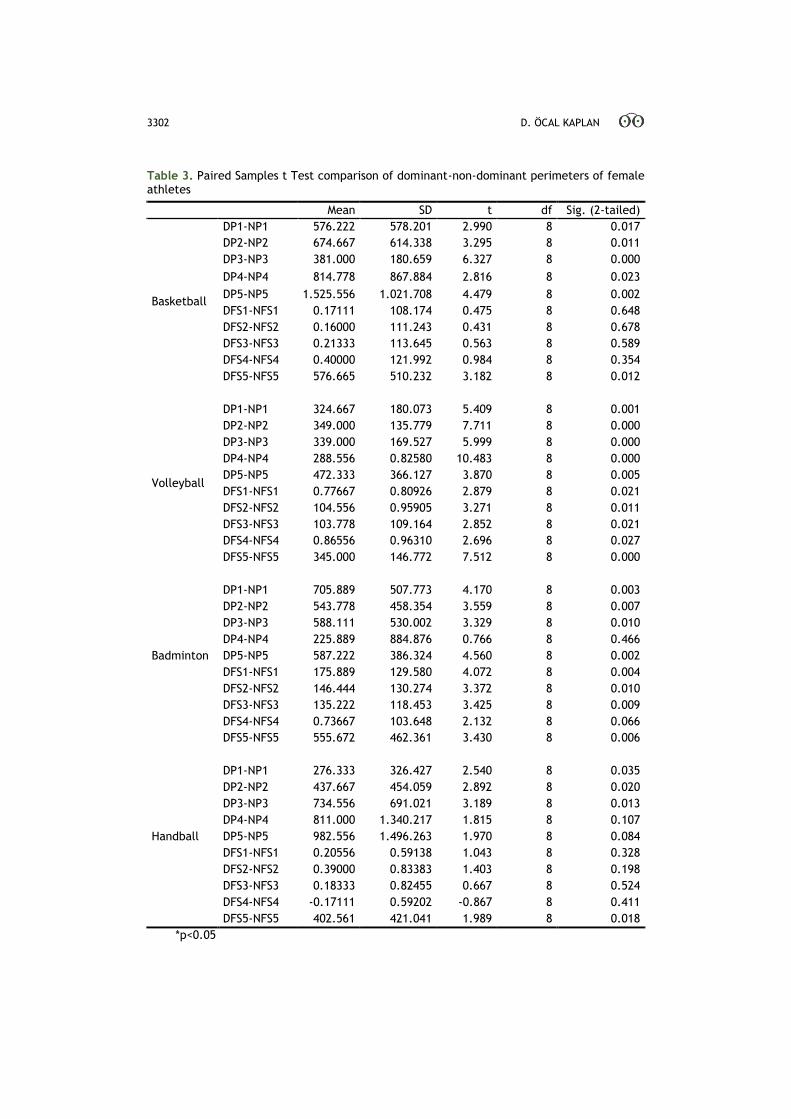
The data obtained as a result of female’s dominant and non-dominant hand
size comparison in all the branches are shown in Table 3. According to the Paired
Samples t Test, dominant hand P1, P2, P3, P4, P5 and FS5 values of female
basketball players show a significant difference in proportion to their non-
dominant hand (p<0.05). When FS1, FS2, FS3, FS4 dominant hand values in the
same group have been compared with the non-dominant hand values, it has been
observed that there is not a significant difference between them (p<0.05). Female
volleyball players’ dominant hand P1, P2, P3, P4, P5 and FS1, FS2, FS3, FS4, FS5
values show a significant difference in proportion to their non-dominant hand
values (p<0.05). Female badminton players’ dominant hand P1, P2, P3, P5 and
FS1, FS2, FS3, FS5 values show a significant difference in proportion to their non-
dominant hand values (p<0.05). When dominant hand P4 and FS4 values are
compared with the non-dominant hand values in the same group, it has been
observed that there is not a significant difference between them (p<0.05). Female
handball players’ dominant hand P1, P2, P3 and FS5 values show a significant
difference in proportion to the non-dominant hand values (p<0.05). When
dominant hand P4, P5 and FS1, FS2, FS3, FS4 values are compared with the non-
dominant hand values in the same group, it has been observed that there is not a
significant difference between them (p<0.05).
The data obtained as a result of the comparison of all the male athletes’
dominant and non-dominant hand sizes in all branches are shown in Table 4.
According to the Paired Samples t Test results, male basketball players’ dominant
hand P1, P2 and FS5 values show a significant difference in proportion to the non-
dominant hand values (p<0.05). When dominant hand P3, P4, P5 and FS1, FS2,
FS3, FS4 values are compared with the non-dominant hand values in the same
group, it has been observed that there is not a significant difference between them

INTERNATIONAL JOURNAL OF ENVIRONMENTAL & SCIENCE EDUCATION 3301
(p<0.05). However, among male volleyball, badminton and handball players,
dominant hand P1, P2, P3, P4, P5 and FS1, FS2, FS3, FS4, FS5 values show a
significant difference in proportion to the non-dominant hand values (p<0.05).
3302 D. ÖCAL KAPLAN
Table 3. Paired Samples t Test comparison of dominant-non-dominant perimeters of female athletes
Mean SD t df Sig. (2-tailed)
Basketball
DP1-NP1 576.222 578.201 2.990 8 0.017
DP2-NP2 674.667 614.338 3.295 8 0.011
DP3-NP3 381.000 180.659 6.327 8 0.000
DP4-NP4 814.778 867.884 2.816 8 0.023
DP5-NP5 1.525.556 1.021.708 4.479 8 0.002
DFS1-NFS1 0.17111 108.174 0.475 8 0.648
DFS2-NFS2 0.16000 111.243 0.431 8 0.678
DFS3-NFS3 0.21333 113.645 0.563 8 0.589
DFS4-NFS4 0.40000 121.992 0.984 8 0.354
DFS5-NFS5 576.665 510.232 3.182 8 0.012
Volleyball
DP1-NP1 324.667 180.073 5.409 8 0.001
DP2-NP2 349.000 135.779 7.711 8 0.000
DP3-NP3 339.000 169.527 5.999 8 0.000
DP4-NP4 288.556 0.82580 10.483 8 0.000
DP5-NP5 472.333 366.127 3.870 8 0.005
DFS1-NFS1 0.77667 0.80926 2.879 8 0.021
DFS2-NFS2 104.556 0.95905 3.271 8 0.011
DFS3-NFS3 103.778 109.164 2.852 8 0.021
DFS4-NFS4 0.86556 0.96310 2.696 8 0.027
DFS5-NFS5 345.000 146.772 7.512 8 0.000
Badminton
DP1-NP1 705.889 507.773 4.170 8 0.003
DP2-NP2 543.778 458.354 3.559 8 0.007
DP3-NP3 588.111 530.002 3.329 8 0.010
DP4-NP4 225.889 884.876 0.766 8 0.466
DP5-NP5 587.222 386.324 4.560 8 0.002
DFS1-NFS1 175.889 129.580 4.072 8 0.004
DFS2-NFS2 146.444 130.274 3.372 8 0.010
DFS3-NFS3 135.222 118.453 3.425 8 0.009
DFS4-NFS4 0.73667 103.648 2.132 8 0.066
DFS5-NFS5 555.672 462.361 3.430 8 0.006
Handball
DP1-NP1 276.333 326.427 2.540 8 0.035
DP2-NP2 437.667 454.059 2.892 8 0.020
DP3-NP3 734.556 691.021 3.189 8 0.013
DP4-NP4 811.000 1.340.217 1.815 8 0.107
DP5-NP5 982.556 1.496.263 1.970 8 0.084
DFS1-NFS1 0.20556 0.59138 1.043 8 0.328
DFS2-NFS2 0.39000 0.83383 1.403 8 0.198
DFS3-NFS3 0.18333 0.82455 0.667 8 0.524
DFS4-NFS4 -0.17111 0.59202 -0.867 8 0.411
DFS5-NFS5 402.561 421.041 1.989 8 0.018
*p<0.05

INTERNATIONAL JOURNAL OF ENVIRONMENTAL & SCIENCE EDUCATION 3303
Table 4. Paired Samples t Test comparison of dominant-non-dominant perimeters of male athletes
Mean SD t df Sig. (2-tailed)
Basketball
DP1-NP1 801.167 538.688 5.152 11 0.000
DP2-NP2 668.750 382.328 6.059 11 0.000
DP3-NP3 290.083 1.019.940 0.985 11 0.346
DP4-NP4 325.250 1.357.918 0.830 11 0.424
DP5-NP5 281.750 1.545.410 0.632 11 0.541
DFS1-NFS1 -0.06667 159.367 -0.145 11 0.887
DFS2-NFS2 0.05917 135.007 0.152 11 0.882
DFS3-NFS3 0.08917 0.76108 0.406 11 0.693
DFS4-NFS4 -0.10333 0.84617 -0.423 11 0.680
DFS5-NFS5 589.648 322.200 5.041 11 0.001
Volleyball
DP1-NP1 512.500 567.061 4.042 19 0.001
DP2-NP2 498.150 442.755 5.032 19 0.000
DP3-NP3 581.300 587.038 4.428 19 0.000
DP4-NP4 555.000 656.247 3.782 19 0.001
DP5-NP5 769.650 656.879 5.240 19 0.000
DFS1-NFS1 0.79400 0.82942 4.281 19 0.000
DFS2-NFS2 0.54250 0.81007 2.995 19 0.007
DFS3-NFS3 0.77650 0.83283 4.170 19 0.001
DFS4-NFS4 0.95600 0.89113 4.798 19 0.000
DFS5-NFS5 562.160 498.768 4.678 19 0.000
Badminton
DP1-NP1 800.600 660.626 3.832 9 0.004
DP2-NP2 691.900 387.716 5.643 9 0.000
DP3-NP3 563.300 580.600 3.068 9 0.013
DP4-NP4 572.800 534.740 3.387 9 0.008
DP5-NP5 1.108.300 525.272 6.672 9 0.000
DFS1-NFS1 110.300 100.537 3.469 9 0.007
DFS2-NFS2 0.93300 0.83569 3.530 9 0.006
DFS3-NFS3 0.92400 0.87377 3.344 9 0.009
DFS4-NFS4 114.800 0.43840 8.281 9 0.000
DFS5-NFS5 722.500 562.640 4.751 9 0.002
Handball
DP1-NP1 913.100 603.051 4.788 9 0.001
DP2-NP2 858.000 639.885 4.240 9 0.002
DP3-NP3 897.500 822.180 3.452 9 0.007
DP4-NP4 1.015.600 915.818 3.507 9 0.007
DP5-NP5 1.714.800 1.151.506 4.709 9 0.001
DFS1-NFS1 123.300 0.79035 4.933 9 0.001
DFS2-NFS2 158.100 0.63990 7.813 9 0.000
DFS3-NFS3 142.800 112.240 4.023 9 0.003
DFS4-NFS4 0.83000 0.66269 3.961 9 0.003
DFS5-NFS5 864.200 620.382 4.564 9 0.001
*p<0.05
3304 D. ÖCAL KAPLAN
Discussion
It’s very important to develop new alternative measurements besides
classical anthropometric measurements to shorten the time of researches in
sports science. This study serves this aim as using low error rate digital
measurement technics. Similarly, in their study aiming at the comparison of the
measurements carried out with the use of calliper and 2D screening i.e. via
photography, Habibi et al. (2013) have evaluated 204 workers’ hand
measurements. They have found that 19.68±2.08 cm hand length measured on
photography was 19.56±2.23 cm when measured with calliper and there is no
significant difference between the measurements, the measurements carried out
on photography can be used instead of manual methods.
Big hand, long fingers have direct relationship with shots on target.
Visnapuu et al. (2008) evaluated the relationship between the test results of young
male basketball and handball players’ anthropometric hand measurements and
their shots, and they confirmed that height and P3 or P1 are dependent in
basketball players. In their study which they analysed the influences of young
male basketball and handball players’ basic body and hand anthropometric
characteristics upon different shot tests, Visnapuu et al. (2008) have determined
that height in handball, and LFL in basketball players are the most important
characteristics, basketball players’ height and P3 and P1 are dependent and hand
anthropometric parameters have affected the results of shot test more. In their
study, Semproli et al. (2007) stated that FS2 are the most important hand span
parameter, the importance of FS1 and FS3 in older age groups is increasing, the
most important finger length is IFB, the variance of RFL values in older age
groups increased to 45%. They also found that among the sizes used while
explaining the variability of handgrip strength, the most important one among
young people is P’, P3 and P4 with their influence upon the variance is around 30-
40% in older age groups. In their study in which they analysed the influence of
male athletes and sedanters’ hand measurements, hand shape and some
anthropometric characteristics upon the handgrip strength, Fallahi et al. (2011)
confirmed that there is a significant and a positive correlation between the
handgrip strength and hand sizes. It has been measured that athletes’ height was
1,82 cm, body weight was 85,25 kg, BMI was 24,42, dominant handgrip strength
was 48,15 kg and non-dominant handgrip strength was 45,64 kg. It has been
calculated that P1 was 48.28 cm2, P2 was 53.79 cm2, P3 was 45.84 cm2, P4 was
47.57 cm2, P5 was 61.76 cm2 and they show a parallelism with the data of the
study.
In their study in order to determine the hand indexes of female and male,
Ibeachu et al. (2011) have found that right hand length of males was 19.09±0.07
cm, left hand length was 19.02±0.08 cm, right hand length of female was
17.62±0.07 cm and left hand was 17.69±0.3 cm. They have revealed that male’s
hand sizes are statistically and significantly bigger in proportion to female’s hand
sizes. Barut et al. (2008) have found a significant difference for right and left hand
width, right hand length/height, left hand length/height values between handball
and volleyball players. In addition, they have found a statistically significant
difference in female athletes in terms of right-left hand width, right and left
handgrip strength and right-left hand 3rd finger length. In the same study, it has
been determined that hand anthropometric measurements among the branches
are statistically different and the reason of that is the applications of different
INTERNATIONAL JOURNAL OF ENVIRONMENTAL & SCIENCE EDUCATION 3305
sports branches. Visnapuu et al. (2007) have expressed that specific hand
anthropometric measurements of handball and basketball players between 10 and
17 years are more influential upon the handgrip strength in proportion to the
general anthropometric measurements. Besides, they have emphasized that
finger lengths are significantly related to the maximal handgrip strength of hand
spans, and that they have to be measured in branches such as basketball and
handball. The results of these studies supports the hypothesis and results of
recent study.
Ruiz et al. (2006) have determined that there is a relationship between
optimal handgrip span and hand span of male and female between 13 and 18, and
they developed a mathematical equation. Similarly, in their study touching upon
the relationship between hand span and optimal handgrip span, Espana et al.
(2008) stated that male’s hand span was 17.8±1.5 cm and female’s hand span was
17.2±1.4 cm, and that male had higher levels of handgrip strength and handgrip
span in proportion to female. Clerke et al. (2005) analysed the influence of hand
shape upon maximal handgrip strength of 116 male and 112 female participants,
they found that male are stronger than female, their dominant hands are stronger
than their non-dominant hands, there is no difference originating from the shape
of the hand. Tajika et al. (2015) took 133 baseball players’ handgrip strength and
hand anthropometric measures, and found that dominant hand is stronger than
the non-dominant hand and there is a significant relationship between dominant
hand handgrip strength, length, body mass and BMI. Similarly, Miyakate et al.
(2012) have observed that especially in male there is a positive correlation
between handgrip strength, length and lean body mass. In their study analysing
the influence of some anthropometric parameters in young female and male upon
the handgrip strength and endurance, Smrithi et al. (2012) have confirmed that
male’s handgrip strength and endurance are significantly higher than female’s.
They have found that there is a negative correlation between handgrip strength
and body weight in overweight male, and there is a significant and positive
correlation between handgrip strength, endurance, body weight and BMI in thin
male.
In their study which they aimed at determining the difference between
dominant and non-dominant handgrip strength of male and female whose ages
are between 18 and 25, Koley and Singh (2010) have found that right dominant
and non-dominant handgrip strength averages of male are in turn 41.31±6.00 kg
(n:103) and 38.14±6.20 kg; left dominant and non-dominant handgrip strength
averages are 41.12±6.88 kg (n:48) and 37.76±7.34 kg. These values in female are;
right dominant and non-dominant handgrip strength averages are 23.82±3.71 kg
(n:129) and 21.03±3.49 kg; left dominant and non-dominant handgrip strength
averages are 23.48±3.29 kg (n:23) and 21.46±3.37 kg. In both genders, there has
been found a significant difference in favour of the dominant hand.
In the study, there is a significant difference between dominant and non-
dominant handgrip strength of the athletes in branch and gender subtitles, it has
been observed that in all the branches the dominant hand is significantly different
than the non-dominant hand both in male and female athletes. Kaplan et al.
(2014) determined that elite female fencers’ handgrip strength average is 34,35
kg, non-dominant handgrip strength average is 29,11 kg and there is a significant
difference between the hand that holds the fence and the other hand. Tillar et al.
(2004) have stated that there is a positive correlation in handball players between

3306 D. ÖCAL KAPLAN
isometric handgrip strength and the speed of throwing the ball in both genders.
Ferreira et al. (2011) have evaluated the difference between the dominant and
non-dominant handgrip strength in terms of age and gender, and determined that
dominant handgrip strength of male between 17 and 19 is 46,66 kg, non-dominant
handgrip strength is 45,69 kg; dominant handgrip strength of girls in the same
age group is 29,19 kg, non-dominant handgrip strength is 27,19 kg. They revealed
that handgrip strength increases with age and male have higher values. In their
study focusing on whether the influence of body typologies upon physical
performance is different according to the gender or not, Fuster et al. (1998) have
found that male’s right handgrip strength is 50.21±7.1 kg, left handgrip strength
is 46.90±7.8 kg, female’s right handgrip strength is 30.06±4.1 kg, left handgrip
strength is 27.82±4.7 kg. Results related to the strength variables appeared to be
significantly high in favour of male. In their study comparing the dominant hand
anthropometric measures of elite volleyball players and sedentary group, Öcal et
al. (2010) have found that athletes’ hand measurements are significantly
different, and the reason of that is based on their trainings of their branches. As
a result of their study on 393 university students, Kulaksız et al. (2002) have
found that right hand has higher values in terms of hand span and hand shape
index, and environmental factors such as hand activity, hormones and brain
asymmetry can play an effective role upon hand anthropometric measurements.
In their study focusing on revealing the relationship between handgrip strength,
gender, body weight and height, Ploegmaker et al. (2013) have found that male
show more significant momentum about handgrip strength and there is a strong
relationship especially between handgrip strength, height and body weight. In
their study aiming at determining the variables related to handgrip strength
based on gender and age, Nevill et al. (2000) have confirmed that there is a linear
relationship between the level of physical activity and handgrip strength.
The data of the study can be applied to aptitude selection of sports branches.
In their study on their estimation of the influence of anthropometric
characteristics upon handgrip strength of 115 male and 114 female between 20
and 25, Chandrasekaran et al. (2010) have revealed that age, height and body
weight are important determinants of handgrip strength. In their study on 295
healthy children between 6 and 13, de Souze et al. (2014) have revealed the
relationship between the handgrip strength and age, gender, body composition.
They have found that handgrip strength of both hands increases with age,
dominant hand is stronger than the non-dominant hand, and handgrip strength
shows a correlation with lean mass and height. In their study carried out on 1417
healthy children between 5 and 18 years for determining norms related to
handgrip strength, Newman et al. (1984) have confirmed that male have higher
levels of handgrip strength than female, and handgrip strength shows a
correlation with height and body weight. In a similar study carried out by Aktaş
et al. (2013), it has been determined that there is a positive and significant
relationship between the handgrip strength of volleyball players and their arm
and forearm. Nicolay et al. (2005) compared the dominant and non-dominant
handgrip strength and endurance between genders, and they have determined
that male are stronger than female and dominant hand is stronger than the non-
dominant hand. In their study revealing the comparison between male’s right and
left handgrip strength and biometric endurance, and their relationship with age
and other physical activities, Chatterjee et al. (1991) have confirmed that
handgrip strength and body weight have a positive correlation with height and
INTERNATIONAL JOURNAL OF ENVIRONMENTAL & SCIENCE EDUCATION 3307
body surface area. In their study focusing on the influence of the handgrip
strength upon handgrip span and type, Fransson et al. (1991) have found that the
difference in terms of the handgrip strength of male and female is 35% lower in
accordance with female’s hand sizes. Semproli et al. (2007) have stated that basic
and specific hand anthropometry has a higher influence on handgrip strength in
male in proportion to female in the increasing ages.
The data obtained as a result of the comparison of all the male-female
athletes’ dominant and non-dominant hand sizes and handgrip strengths in all
branches show significant differences. In all branches in dominant hands P1, P2
and FS5 values are significantly different and at female basketball and handball
players DFS5 value is higher than the other branches. This can be related to grip
of the ball. All the findings of this study serves determining criteria during the
process of choosing skills, specifying the influences of goal-oriented trainings and
producing tools in proportion to the hand sizes of the users in sports branches
such as basketball, volleyball, handball and badminton and shows new ways for
the future studies.
Acknowledgement
I would like to thank Ercan Kaplan who is a software engineer and prepared
the software that enabled the calculation of hand measurements on photography.
Disclosure statement
No potential conflict of interest was reported by the authors.
Notes on contributors
Defne Öcal Kaplan holds a PhD in physical education and now is an associate
professor at Kastamonu University, Kastamonu, Turkey.
References
Ahmed A.A. (2013). Estimation of stature from the upper limb measurements of Sudanese adults. Forensic Sci Int. 10, 228(1-3), 178.e1-7.
Aktas, Y., Gokhan, İ. & Aysan, H.A. (2013). Comparison of some physical and anthropometric
parameters and examination of relationship between them in volleyball players in different
leagues. International Educational e-Journal, Volume-II, Issue-IV.
Barut, Ç., Demirel, P. & Kıran, S. (2008) Evaluation of hand anthropometric measurements and grip
strength in basketball, volleyball and handball players. Anatomy 2, 55-59.
Barut, Ç., Demirel, P. & Kıran, S. (2008). Evaluation of hand anthropometric measurements grip
strength in basketball, volleyball and handball players. Anatomy 2, 55-59.
Chandrasekaran, B., Ghosh, A., Prasad, C., Krishnan, K. & Chandrasharma, B. (2010) Age and
anthropometric traits predict handgrip strength in healthy normals. J Hand Microsurg. 2(2), 58-
61.
Chatterjee, S. & Chowdhuri, B.J. (1991). Comparison of grip strength and isomeric endurance
between the right and left hands of men and their relationship with age and other physical
parameters. J Hum Ergol (Tokyo). 20(1), 41-50.
Clerke, A.M., Clerke, J.P. & Adams, R.D. (2005). Effects of hand shape on maximal isometric grip
strength and its reliability in teenagers. J Hand Ther. Jan-Mar, 18(1), 19-29.
de Souza, M.A., de Jesus Alves de Baptista, C.R., Baranauskas Benedicto, M.M., Pizzato, T.M.
& Mattiello-Sverzut, A.C. (2014) Normative data for hand grip strength in
healthy children measured with a bulb dynamometer: A cross-sectional study. Physiotherapy. 100(4), 313-318.

3308 D. ÖCAL KAPLAN
España-Romero, V., Artero E.G., Santaliestra-Pasias A.M., Gutierrez, A., Castillo, M.J. & Ruiz, J.R.
(2008). Hand span influences optimal grip span in boys and girls aged 6 to 12 years. J Hand Surg Am. 33(3), 378-384.
Fallahi, A.A. & Jadidian, A.A. (2011) The effect of hand dimensions, hand shape and some
anthropometric characteristics on handgrip strength in male grip athletes and non-athletes. J Hum Kinet, 29, 151–159.
Ferreira,A.C., Shımano,A.C., Mazzer, N.,Barbieri, C.H., etc. (2011) Grip and pinch strength in healthy
children and adolescents. Acta Ortop Bras. 19(2), 92-97.
Fransson C & Winkel J. (1991) Hand strength: The influence of grip span and grip type.
Ergonomics. 34(7), 881-892.
Fuster, V., Jerez, A. & Ortega, A. (1998) Anthropometry and strength relationship: male-female
differences. Anthropol Anz. 56(1), 49-56.
Habibi, E., Soury, S. & Zadeh, A. H. (2013) Precise evaluation of anthropometric 2D software
processing of hand in comparison with direct method. J Med Signals Sens. 3(4), 256–261.
Ibeachu, P.C. Abu, E.C. & Didia, B.C. (2011). Anthropometric sexual dimorphism of hand length,
breadth and hand indices of university of port-harcourt students. Asian Journal of Medical Sciences. 3(8), 146-150.
Ishak, N.I., Hemy, N. & Franklin, D. (2012) Estimation of stature from hand and
handprint dimensions in a western Australian population. Forensic Sci Int. 10, 216(1-3), 199.e1-
7.
Jee, S.C. & Yun, M.H. (2015). Estimation of stature from diversified hand anthropometric dimensions
from Korean population. J Forensic Leg Med. 35, 9-14.
Jiang, L., Jian Yao, J., Li, B., Fang, F., Zhang, O. & Meng, M.O.H. (2012) Automatic body feature
extraction from front and side images. A Journal of Software Engineering and Applications, 5,
94-100.
Kaplan, D.Ö., Baydil, B. & Duvan A. (2014). Determination of somatotype features and differences
between the dominant-nondominant hand grip strengths of elite female fencers. 13. International Sport Sciences Congress. P: 254-255. 7-9 November 2014, Konya, Turkey.
Koley, S. & Singh A. P. (2010). Effect of hand dominance in grip strength in collegiate population of
Amritsar, Punjab, India. Anthropologist, 12(1), 13-16.
Kulaksiz G. & Gözil R. (2002). The effect of hand preference on hand anthropometric measurements
in healthy individuals. Ann Anat. May, 184(3), 257-265.
Lieber. R L. (2002). Skeletal muscle structure, function and plasticity (2nd ed.). Baltimore: Lippincott,
Williams & Wilkins
Lin, C.H., Lin, P. T. & Chao,Y. (2015). Hand surface area variation analyzed by 3D laser scan
measurement. Proceedings of the Second European Academic Research Conference on Global Business, Economics, Finance and Banking. Zurich-Switzerland, 3-5 July 2015.
Lohman, T.G., Roche, A.F. & Martorell, R.M. (1998) Anthropometric standardization referance manual. Champaign. Human Kinetics Books.
Meunier, P. & Yin, S. (2000) Performance of a 2D image-based anthropometric measurement and
clothing sizing system. Appl Ergon. 31(5), 445-451.
Mirmohammadi, S.J., Mehrparvar, A.H., Mostaghaci, M., Davari, M.H., Bahaloo, M. & Mashtizadeh,
S. (2015) Anthropometric hand dimensions in a population of Iranian male workers in 2012. Int
J Occup Saf Ergon. 14, 1-17.
Miyatake, N., Miyachi, M., Tabata,I., Sakano, N., Hirao, T. & Numata, T. (2012) Relationship between
muscle strength and anthropometric, body composition parameters in Japanese adolescents.
Health. Vol.4, No.1, 1-5
Nevill, A.M. & Holder, R.L. (2000) Modelling handgrip strength in
the presence of confounding variables: Results from the allied Dunbar national fitness survey.
Ergonomics. 43(10), 1547-1558
Newman, D.G., Pearn, J., Barnes, A., Young, C.M., Kehoe, M. & Newman, J. (1984) Norms
for hand grip strength. Arch Dis Child. 59(5), 453-459.
Nicolay, C.W. & Walker, A.L. (2005) Grip strength and endurance: influences of anthropometric
variation, hand dominance, and gender. International Journal of Industrial Ergonomics. 35(7),
605–618.

INTERNATIONAL JOURNAL OF ENVIRONMENTAL & SCIENCE EDUCATION 3309
Öcal, D. Baydil, B. & Melekoğlu T. (2010) Comparison of anthropometric measurements of dominant
hands between adult elite volleyball players and sedentaries. Ovidius University Annals, Series Physical Education and Sport- Scıence, Movement and Health, 10(2), 546-548.
Paulis, M.G. (2015) Estimation of stature from handprint dimensions in Egyptian population. J Forensic Leg Med. 34, 55-61.
Ploegmakers, J.J., Hepping, A.M., Geertzen, J.H., Bulstra, S.K. & Stevens, M. (2013) Grip strength is
strongly associated with height, weight and gender in childhood: a cross sectional study of 2241
children and adolescents providing reference values. J Physiother. 59(4), 255-261.
Rogers, M.S., Barr, A.B., Kasemsontitum, B. & Rempel, D.M. (2008). A three-dimensional
anthropometric solid model of the hand based on landmark measurements. Ergonomics. 51(4),
511-526.
Ruiz, J.R., España-Romero, V., Ortega, F.B., Sjöström, M., Castillo, M.J. & Gutierrez, A. (2006).
Hand span influences optimal grip span in male and female teenagers. J Hand Surg Am. 31(8),
1367-1372.
Semproli S., Brasili P., Toselli S., Ventrella A.R., Jürimäe J. & Jürimäe T. (2007). The influence of
anthropometric characteristics to the handgrip and pinch strength in 6-10-year old children.
Anthropol Anz. 65(3), 293-302.
Skirven, T.M. & Osterman. L.A. (2011). Rehabilitation of the hand and upper extremity. (6.Ed.)
Elsevier Mosby, Philadelphia
Smrithi Shetty C, Shibin Girish Parakandy & Nagaraja S. (2012). Influence of various anthropometric
parameters on handgrip strength and endurance in young males and females. Int J Biol Med Res. 3(3), 2153-2157.
Tajika, T., Kobayashi, T., Yamamoto, A., et. al. (2015). Relationship between grip, pinch strengths and
anthropometric variables, types of pitch throwing among Japanese high school baseball pitchers.
Asian J Sports Med. 6(1), e25330
Tormo, J. M. C., Turpin, J. A. P., Cuevas, Á. G. L., et. (2013). Handgrip strength and hand dimensions
in high-level inter-university judoists. Archives of Budo. (1)9, 21-28.
Uhrová, P., Beňuš, R., Masnicová, S., Obertová, Z., Kramárová, D., Kyselicová, K., Dörnhöferová,
M., Bodoriková, S. & Neščáková, E. (2015). Estimation of stature using hand and foot
dimensions in Slovak adults. Leg Med (Tokyo). 17(2), 92-97.
van den Tillaar, R. & Ettema, G. (2004). Effect of body size and gender in overarm throwing
performance. Eur J Appl Physiol. 91(4), 413-418.
Visnapuu, M. & Jürimäe, T. (2007). Handgrip strength and hand dimensions in young handball and
basketball players. J Strength Cond Res. 21(3), 923-929.
Visnapuu, M. & Jürimäe, T. (2008). The influence of basic body and hand anthropometry on the
results of different throwing tests in young handball and basketball players. Anthropol Anz. 66(2), 225-236.
Weiner, J.S., Lourie, J.A. (Ed). (1988). Pratical human biology. Academic Press. London
Yu, A., Yick, K.L., Ng, S.P. & Yip, J. (2013). 2D and 3D anatomical analyses of hand dimensions for
custom-made gloves. Appl Ergon. 44(3), 381-392.