Embed Size (px)
Citation preview
1
Evaluating the response of 13C in Haloxylon ammodendron, a1
dominant C4 species in Asian desert ecosystem, to water and nitrogen2
addition as well as the availability of its 13C as the indicator of water3
use-efficiency4
Zixun Chen1,2, Xuejun Liu2,3, Xiaoqing Cui2,3, Yaowen Han2, Guoan Wang1,2*, Jiazhu Li4*5
6
1. Key Lab of Plant–Soil Interaction, College of Resources and Environmental Sciences, China7
Agricultural University, Beijing, 100193, China.8
2. Beijing Key Laboratory of Farmland Soil Pollution Prevention and Remediation, Department of9
Environmental Sciences and Engineering, College of Resources and Environmental Sciences,10
China Agricultural University, Beijing, 100193, China.11
3. Xinjiang Institute of Ecology and Geography, Chinese Academy of Sciences, Urumqi, 83011,12
China13
4. Institute of Desertification Studies, Chinese Academy of Forestry, Beijing, 100192, China.14
15
16
*Corresponding author:17
Guoan Wang, [email protected]
Jiazhu Li, [email protected]
20
21
22
2
Abstract23
Variations in precipitation and atmospheric N deposition affect water and N24
availability in desert, and thus may have significant effects on desert ecosystems.25
Haloxylon ammodendron is a dominant plant in Asian desert, and addressing its26
physiological acclimatization to the changes in precipitation and N deposition can27
provide an insight into how desert plants adapt extreme environment by physiological28
adjustment. Carbon isotope ratio (δ13C) in plants has been suggested as a sensitive29
long-term indicator of physiological acclimatization. Therefore, this study evaluated30
the effect of precipitation change and increasing atmospheric N deposition on δ13C of31
H. ammodendron. Furthermore, Haloxylon ammodendron is a C4 plant, whether its32
δ13C can indicate water use-efficiency (WUE) has not been addressed. In the present33
study, we designed a field experiment with a completely randomized factorial34
combination of N and water, and measured δ13C and gas exchange of H.35
ammodendron, then we calculated the degree of bundle-sheath leakiness (φ) and36
WUE of the assimilating branches of H. ammodendron. δ13C and φ remained stable37
under N and water supply, while N addition, water addition and their interaction38
affected gas exchange and WUE in H. ammodendron. In addition, δ13C had no39
correlation with WUE. These results were associated with the irrelevance between40
δ13C and the ratio of intercellular to ambient CO2 concentration (ci/ca), which might41
be caused by a special value (0.37) of the degree of bundle-sheath leakiness (φ) or a42
lower activity of carbonic anhydrase (CA) of H. ammodendron. In conclusion, δ13C of43
H. ammodendron is not sensitive to global change in precipitation and atmospheric N44
3
deposition, and cannot be used for indicating its WUE.45
46
1 Introduction47
Recently, global precipitation pattern has changed significantly (Frank et al., 2015;48
Knapp et al., 2015), and atmospheric N deposition has continued to rise (Galloway et49
al., 2004; Liu et al., 2013; Song et al., 2017). Previous researchers have suggested that50
arid ecosystems are most sensitive to climate change (Reynolds et al., 2007; Huang et51
al., 2016), while global change in precipitation and atmospheric N deposition has an52
important impact on water and N availability in desert (Huang et al., 2018). Thus,53
these changes may have significant effects on desert ecosystems. Haloxylon54
ammodendron is a dominant species in desert regions, especially in Asia. Studying the55
physiological responses of H. ammodendron to global change can provide an insight56
into how desert plants adapt extreme environment by physiological adjustment.57
Carbon isotope ratio (δ13C) in plants depends on the ratio of intercellular to ambient58
CO2 concentration (ci/ca), which reflects the balance between inward CO2 diffusion59
rate, regulated by stomatal conductance (gs), and CO2 assimilating rate (A) (Farquhar60
and Richards, 1984), and has been suggested as a sensitive long-term indicator of61
physiological acclimatization (Battipaglia et al., 2013; Cernusak et al., 2013; Tranan62
and Schubertt, 2016; Wang and Feng, 2012). Therefore, investigating the variations in63
δ13C of H. ammodendron under water and nitrogen addition can enhance64
understanding of physiological responses of desert plants to future changes in65
precipitation and atmospheric N deposition.66
4
A large quantity of works has been devoted to the relationships between C3 plant67
δ13C and water availability or precipitation (e.g., Diefendorf et al., 2010; Kohn, 2010;68
Liu et al., 2005; Ma et al., 2012; Serret et al., 2018; Stewart et al., 1995; Wang et al.,69
2005, 2008) and nitrogen availability (e.g. Cernusak et al., 2007; Li et al., 2016;70
Sparks and Ehleringer, 1997; Yao et al., 2011; Zhang et al., 2015). However, a71
relatively small amount of research has focused on the responses of C4 plant δ13C to72
water availability or precipitation (Ellsworth et al., 2017; Liu et al., 2005; Rao et al.,73
2017; Wang et al., 2006) and nitrogen availability (Ma et al., 2016; Schmidt et al.,74
1993). For C4 plants, δ13C is controlled by both the ci/ca ratio and the degree of75
bundle-sheath leakiness (φ), the proportion of CO2 produced within bundle sheath76
cells from C4 acids that leaks back to mesophyll cells (Ellsworth and Cousins, 2016;77
Ellsworth et al., 2017; Farquhar, 1983). Thus, the responses of C4 plant δ13C to water78
and N availability are also affected by φ. Genetic factors control φ values, which79
causes the interspecific differences in δ13C, even the responses of plant δ13C to water80
and N availability (Gresset et al., 2014). On the other hand, enzymatic activity of81
carbonic anhydrase (CA) may influence δ13C in C4 plants (Cousins et al., 2006). CA is82
an enzyme that catalyzes the hydration of CO2 in mesophyll cells to form bicarbonate83
(HCO3-). Previous studies showed that CA activity in most C4 plants is usually low,84
just sufficient to support photosynthesis (Cousins et al., 2006; Gillon and Yakir, 2000,85
2001; Hatch and Burnell, 1990). H. ammodendron is a typical C4 plant. How its δ13C86
responds to water and N availability has never been addressed.87
Foliar δ13C in C3 plants has been considered as a useful indicator of intrinsic water88
5
use-efficiency (WUE) (Farquhar, 1983). However, although some studies have89
suggested that δ13C of C4 plants could also indicate its WUE (Henderson et al., 1992;90
Wang et al., 2005; Cernusak et al., 2013; Ellsworth and Cousins, 2016), this statement91
is still controversial. The relationship between δ13C and WUE is based on the links92
between ci/ca ratio and δ13C and between ci/ca ratio and WUE (Ehleringer and Cerling,93
1995). For C3 plants, δ13C always decreases with an increase in ci/ca ratio; but for C494
plants, the correlation between δ13C and ci/ca ratio depends on φ value (Cernusak et al.,95
2013) and CA activity (Cousins et al., 2006). As mentioned above, φ value is under96
genetic control, and the CA activity changes across species (Cousins et al., 2006;97
Gillon and Yakir, 2000, 2001; Hatch and Burnell, 1990), thus, the correlation between98
δ13C and ci/ca ratio, as well as the relationship between WUE and δ13C, shows99
interspecific difference. Whether δ13C of H. ammodendron indicates WUE has never100
been evaluated.101
In this study, we designed an experiment with multiple water and nitrogen supply in102
the southern Gurbantunggut Desert in Xinjiang Uygur Autonomous Region, China.103
We measured the δ13C, gas exchange and WUE of the assimilating branches of H.104
ammodendron. We had two objectives. One objective was to evaluate the response of105
the dominant plant of Asian desert to future changes in precipitation and atmospheric106
N deposition by revealing the effects of water and N supply on δ13C of H.107
ammodendron. The other was to explore the availability of δ13C as the indicator of108
water use-efficiency in H. ammodendron.109
110
6
2 Materials and methods111
2.1 Definitions and Basic Equations112
Stable carbon isotopic ratio (δ13C) of natural materials is expressed as:113
δ13C(‰)= (13C/12C)sample(13C/12C)standard
-1 ×1000 (1)114
where (13C/12C)sample and (13C/12C)standard are the 13C/12C ratio of the sample and of Pee115
Dee Belemnite standard (PDB), respectively. the standard is the carbon dioxide116
obtained from the Peedee belemnite (PDB) limestone (Craig, 1957). Farquhar (1983)117
proposed the pattern of carbon isotopic discrimination (Δ) in C4 plant:118
Δ= δ13Cair-δ13Cplant
1+δ13Cplant/1000≈ δ13Cair - δ13Cplant= a + b4+ φ b – s - a ci
ca(2)119
where δ13Cplant and δ13Cair are the δ13C values of plants and CO2 in the ambient air,120
respectively. The parameter a (= 4.4‰, Craig, 1954) is the carbon isotopic121
fractionation in the diffusion of CO2 into internal leaves; b4 (= -5.9‰, O’Leary, 1984)122
is the combined carbon isotopic fractionations occurring in the processes of gaseous123
CO2 dissolution, hydration/dehydration reactions of CO2 and HCO3- in mesophyll124
cells, and HCO3-carboxylation by PEP (phosphoenolpyruvate) carboxylase; s (= 1.8‰,125
O’Leary, 1984) is the carbon isotopic fractionation during diffusion of CO2 out of the126
bundle-sheath cells, and b (= 27‰, Farquhar and Richards, 1984) is the carbon127
isotopic fractionation of CO2 carboxylation by RuBP (ribulose-1,5-bisphosphate)128
carboxylase. The variable φ is the proportion of CO2 producing within bundle sheath129
cells from C4 acids that leaks back to mesophyll cells, and ci/ca is the ratio of130
intercellular to ambient CO2 concentration. Eq. (2) can be transformed into the131
following format:132
7
δ13Cplant = - b4 + φ b - s - a cica+ δ13Cair - a (3)133
According to Eq. (3), if the coefficient [b4 + φ (b - s) – a] is greater than 0, δ13C134
decreases with increasing ci/ca; if this coefficient is lower than 0, δ13C increases with135
increasing ci/ca.136
Water use-efficiency (WUE) is defined as the amount of assimilated carbon dioxide137
by plants under the consumption of per unit water. There are two characteristics of138
WUE, instantaneous WUE (ins-WUE) and intrinsic WUE (int-WUE), respectively.139
ins-WUE can be calculated by:140
ins-WUE = A/E = (ca–ci)/1.6v = ca(1-ci/ca)/1.6v (34)141
where A is photosynthetic rate, E is transpiration rate and v is calculated142
by:143
v = (ei-ea)/p (45)144
where ei and ea are the water vapor pressure inside and outside the leaves, p is the145
atmospheric pressure.146
The definition of int-WUE is:147
int-WUE = A/gs = (ca–ci)/1.6 = ca(1-ci/ca)/1.6 (56)148
where gs is stomatal conductance.149
2.2 Study site and species150
This experiment was conducted at the Fukang Station of Desert Ecology, Chinese151
Academy of Sciences, on the southern edge of the Gurbantunggut Desert (44°26′ N,152
87°54′ E) in northwestern China. The altitude of the study site is 436.8 m above153
average sea level (a.s.l.). It is a typical continental arid, temperate climate, with a hot154
8
summer and cold winter in the area. The mean annual temperature is 7.1ºC and the155
mean annual precipitation is 215.6 mm, with a potential evaporation of about 2000156
mm. The mean annual temperature and the annual rainfall amount in the sampling157
year are 10.23ºC and 122.7 mm (Cui, 2018). The soil type is grey desert soils158
(Chinese classification) with aeolian sands on the surface (0-100 cm). The159
percentages of clay (< 0.005 mm), silt (0.005-0.063 mm), fine sand (0.063-0.25 mm)160
and medium sand (0.25-0.5 mm) range from 1.63-1.76%, 13.79-14.15%,161
55.91-56.21% and 20.65-23.23%, respectively (Chen et al., 2007). The soil is highly162
alkaline (pH = 9.55 ± 0.14) with low fertility. The vegetation is dominated by163
Haloxylon ammodendron and Haloxylon persicum with about 30% coverage. Herbs164
include ephemerals, annuals and small perennials, with a cover of ca. 40% (Fan et al.,165
2013). Although the coverage of the two Haloxylon species is a little lower than that166
of herbs, the biomass of the former is much larger than that of the latter, because167
Haloxylon plants are shrubs with an average height of 1.5 m whereas the latter are168
very low herbaceous plants. Biological soil crusts are distributed widely on the soil169
between the herbs and Haloxylon, with almost 40% coverage (Zhang et al., 2007).170
The present study focused on Haloxylon ammodendron because it is the dominant171
species in Asian desert. Haloxylon ammodendron is a species of Chenopodiaceae,172
which is a xerophytic and halophytic woody plant (Cui et al., 2017). The leaves of H.173
ammodendron have been completely degraded due to the extreme drought, and the174
assimilation branches, which are the glossy green branches (Fig. S1), perform the175
same functions as the leaves. Due to its drought tolerance, H. ammodendron is widely176
9
distributed in desert areas.177
2.3 Experimental design178
A field experiment with a completely randomized factorial combination of water and179
nitrogen has been conducted from 2014 to 2017. We designed two water addition180
levels (0, 60mm·yr−1; W0, W1) based on the prediction that precipitation will increase181
by 30% in northern China in the next 30 years (Liu et al., 2010), and three levels of N182
addition (0, 30, 60 kg N·ha−1·yr−1; N0, N1 and N2), because N deposition has reached183
35.4 kg N·ha−1·yr−1 in the nearby city, Urumqi (Cui et al., 2017) and will double by184
2050 relative to the early 1990s (Galloway et al., 2008). Therefore, there were six185
treatments (W0N0, W0N1, W0N2, W1N0, W1N1, W1N2) in this experiment. Four186
replicates of each treatment were set, making a total of 24 plots with a size of 10 m187
10 m. A small sub-plot with a size of 1.5 m×1.5 m was set in each plot. A188
well-grown H. ammodendron was enclosed in the center of the sub-plot. The average189
height and coverage of an individual H. ammodendron were 1.5 m and 1.9 m2,190
respectively, and did not vary significantly across the plots. The type of nitrogen used191
in the present study is NH4NO3. To simulate natural water and N inputs, the192
treatments were applied in equal amounts, twelve times, once a week in April, July193
and September, as 5 mm·m-2 of water and 2.5 or 5 kg N·ha−1 each week (Cui et al.,194
2017). Usually, water addition was with a sprinkler kettle, irrigating over the canopy195
of H. ammodendron.196
2.4 Measurements of gas exchange and WUE197
The leaves of H. ammodendron have been completely degraded due to the extreme198
10
drought, and As mentioned above, the main assimilating organ of H. ammodendron is199
the assimilation branches perform the same functions as the leaves. Thus, we200
conducted gas exchange measurements on the assimilation branches of the H.201
ammodendron grown in the sub-plots by LI-6400 portable photosynthesis system. The202
measurements were conducted on 27-29, June 2016, which is the main growing203
season of H. ammodendron. It may be the most appropriate to take measurements204
during this period, and the results of the measurements are therefore more205
representative. Previous studies have also usually conducted this measurement during206
the growing season (Nyongesah and Wang, 2013; Cui, 2018; Gong et al., 2019). The207
ins-WUE and the int-WUE were calculated based on these measured gas exchange208
traits by the Eq. (34), and int-WUE by Eq. (56). At each plot, the top assimilating209
branches of a mature individual was selected randomly for the measurement of gas210
exchange, which includes photosynthetic rate (A), stomatal conductance (gs),211
transpiration rate (E), the ambient CO2 concentration (ca) and the intercellular CO2212
concentration (ci). About Before the measurement of gas exchange, it takes about 5s213
to stabilize was needed for stability after the assimilating branches was inserted in214
the cuvette and then the assimilating branches were measured. We repeated 10 times215
on the same assimilating branches for each measurement. Our measurements were216
carried out under the conditions of We measured gas exchange with a standard 450217
mmol·mol-1 CO2 concentration at a flow rate of 500 mmol·s-1 above saturation in218
photo flux density of 1600 mmol·m-2·s-1. The temperature of the measuring219
assimilating branches varied from 29.5 °C to 30.5 °C during the entire period of gas220
11
exchange measurements.221
2.5 Samples collection222
Sample collection was conducted in 20, July, during the addition of water and223
nitrogen. Considering that there is a considerable difference in δ13C between buds,224
young and matured leaves, so we collected the mature assimilating branches of H.225
ammodendron for the δ13C measurements. All H. ammodendron individuals grown in226
plots (10 m 10 m) were sampled. Eight pieces of the mature assimilating branches227
(15-20 cm long) were collected from each individual; two pieces of assimilating228
branches were collected at each of the four cardinal directions from the positions of229
full irradiance. All assimilating branches from the same plot were combined into one230
sample. After the samples were collected, they were immediately divided into two231
parts randomly and taken back to the laboratory at Fukang Station. The first part was232
used to determine the chlorophyll content. The second part was immediately233
inactivated in a 105 °C oven in the laboratory at Fukang Station, and then brought234
back to Beijing in a ziplock bag. The time interval between sample collection and235
inactivation is very short. After inactivation, the carbon exchange of the assimilating236
branches stop, so the isotope composition of the samples will not change anymore.237
All plant samples of the second part were air-dried immediatelyin the field and then in238
the laboratory in Beijing. Then the samples were ground into a fine powder using a239
steel ball mixer mill MM200 (Retsch GmbH, Haan, Germany) for the measurements240
of δ13C, and N contents and chlorophyll contents.241
2.6 Measurements of plant δ13C, plant N and chlorophyll contents242
12
The δ13C and N measurements were performed on a DeltaPlus XP mass spectrometer243
(Thermo Scientific, Bremen, Germany) coupled with an automated elemental244
analyzer (Flash EA1112, CE Instruments, Wigan, UK) in a continuous flow mode, at245
the Stable Isotope Laboratory of the College of Resources and Environmental246
Sciences, China Agricultural University. The carbon isotopic ratios were reported in247
the delta notation relative to the V-PDB standard. For this measurement, we obtained248
standard deviations low than 0.15‰ for δ13C among replicate measurements of the249
same sample. And standard deviations for the N measurements were 0.1%.250
The chlorophyll contents of all samples were also determined immediately when251
the sample were taken back in the laboratory at Fukang Station. The samples were252
first extracted by 95% ethyl alcohol (0.5 g sample to 25 mL ethyl alcohol), and then253
the absorbancy was measured under the wave length of 665 and 649 mm by the254
spectrophotometer. The content of chlorophyll a, b was calculated by the follow255
equations:256
Chlorophyll a (mg/L) = 13.95×OD665-6.88×OD649 (67)257
Chlorophyll b (mg/L) = 24.96×OD649-7.32×OD665 (78)258
where OD665 and OD649 are the absorbancy under the wave length of 665 and259
649mm, respectively.260
2.6 7 Calculation of the degree of bundle-sheath leakiness261
The degree of bundle-sheath leakiness (φ) was calculated by the transformation of Eq.262
(2):263
φ = (δ13Cair - δ13Cplant� (1+δ13Cplant/1000� - aci ca
+ a - b4 b - s (89)264
13
In this equation, parameters a, b4, b and s are constant, while δ13Cplant and ci/ca are265
the measured values of our samples. We did not measure the δ13Cair at our study site,266
so we had to use an approximation of the δ13Cair to do this calculation. The267
approximated value we used is -9.77‰, which has been measured at Donglingshan268
Mountain, Beijing, north China in September 2019. The two sites should have similar269
δ13Cair because the two sites are located in countryside with less human activities and270
have a similar distance from the nearest city. The straight line distances between271
Donglingshan Mountain and the city center of Beijing, and between our study site and272
Urumqi city are about 90 km. In addition, since the δ13Cair has large diurnal and273
seasonal variations, we used the published range of δ13Cair from May to July in274
Shangdianzi, China (Data comes from Global Monitoring Laboratory, Earth System275
Research Laboratories, https://www.esrl.noaa.gov/gmd) to calculate the minimum and276
maximum δ13Cair of the time period, which is the main growing season for H.277
ammodendron. Finally, the δ13Cair used in the calculation ranged from -10.52‰ to278
-9.01‰ with an average of -9.77‰.279
2.87 Statistical analysis280
Statistical analyses were conducted using SPSS software (SPSS for Windows, Version281
20.0, Chicago, IL, United States). One-way analysis of variance (ANOVA) and282
two-way analysis of variance (ANOVA) were used to compare the difference of δ13C283
and other physiological traits between each treatment. Pearson analysis was used to284
determine the correlation among δ13C, WUE and ci/ca in H. ammodendron.285
286
14
3 Results287
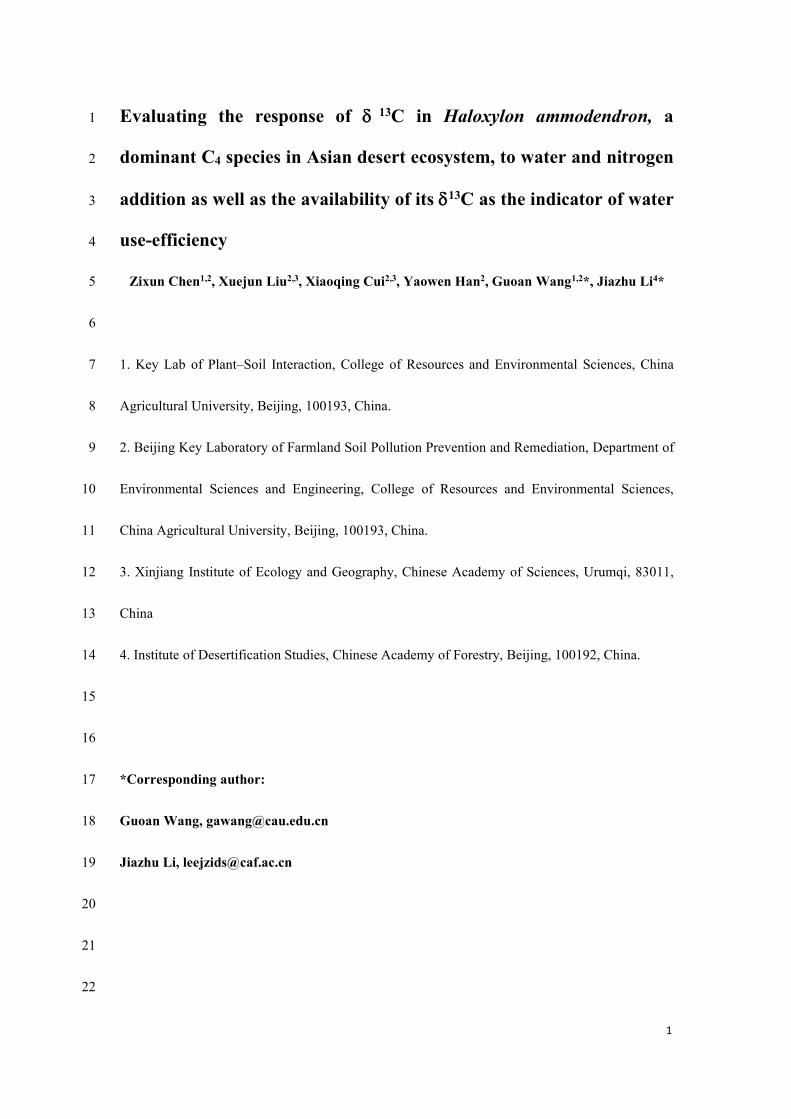
3.1 Plant δ13C under water and nitrogen addition288
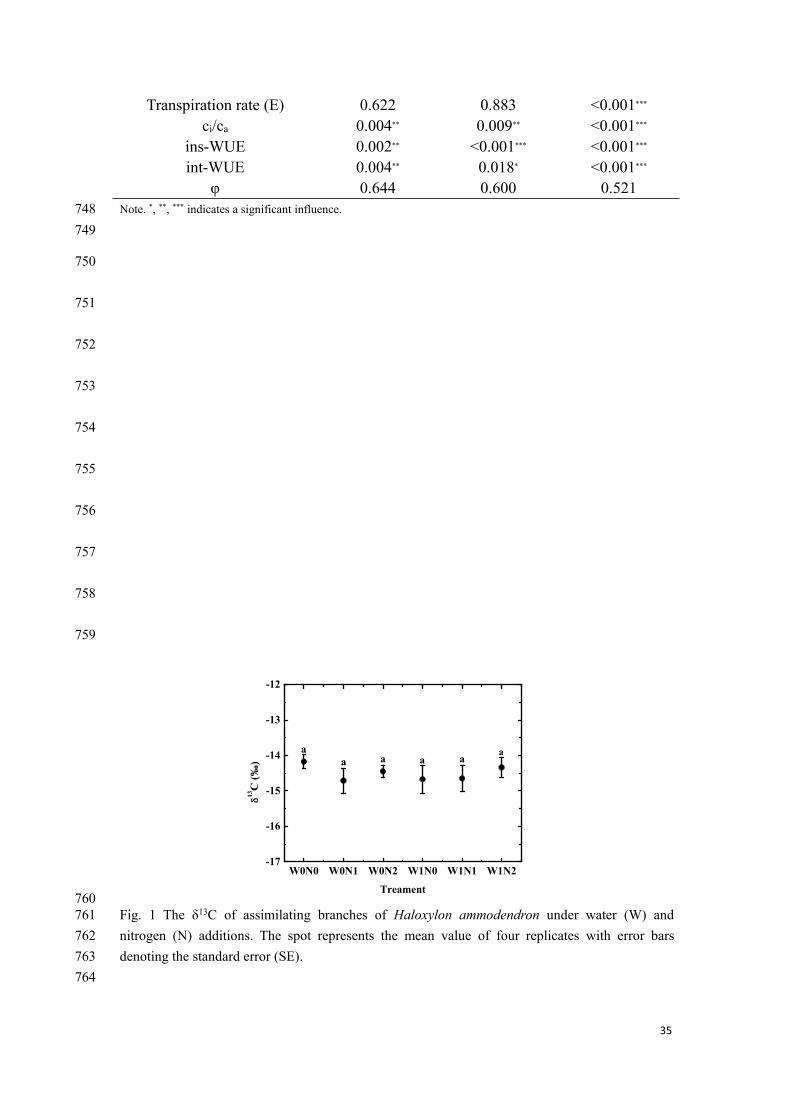
The δ13C of the assimilating branches of H. ammodendron in the six treatments289
W0N0, W0N1, W0N2, W1N0, W1N1, W1N2 was -14.18 ± 0.19 ‰, -14.71 ± 0.35 ‰,290
-14.45 ± 0.18 ‰, -14.67 ± 0.40 ‰, -14.65 ± 0.38 ‰, -14.34 ± 0.29 ‰, respectively.291
One-way ANOVA analyses showed no significant variation in δ13C across treatments292
(p = 0.79, Fig. 1). Two-way ANOVA analyses suggested that δ13C was not affected by293
water addition (p = 0.68), N addition (p = 0.61) and their interaction (p = 0.56, Table294
1).295
Fig.1296
Table 1297
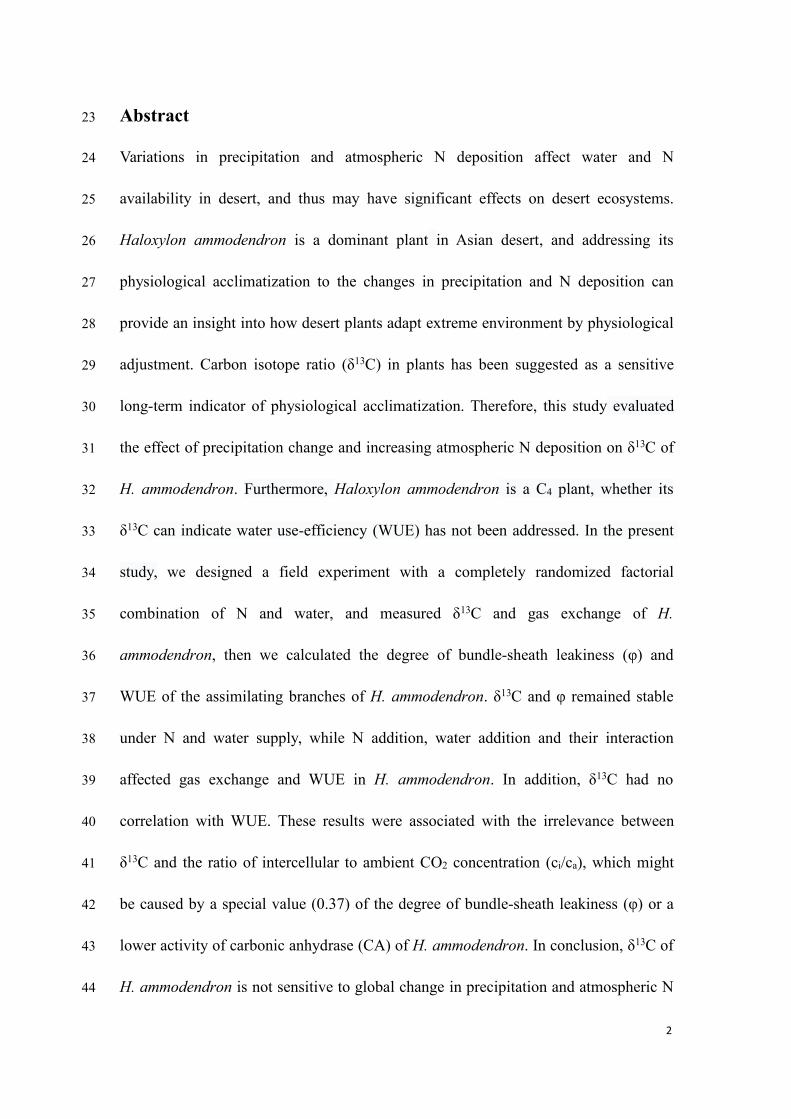
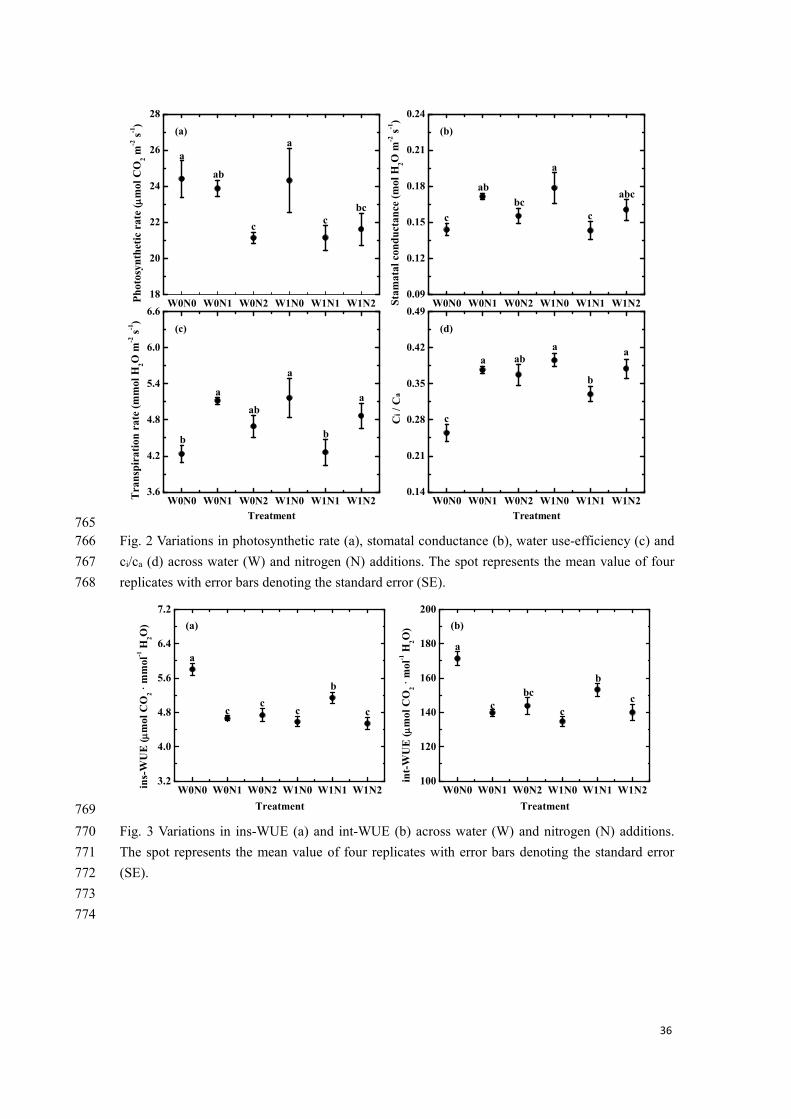
3.2 Gas exchange and WUE under water and nitrogen addition298
Photosynthetic rate (A), stomatal conductance (gs), transpiration rate (E) and ci/ca299
ranged from 12.11 μmol CO2 m-2 s-1 to 39.35 μmol CO2 m-2 s-1, from 0.09 mol H2O300
m-2 s-1 to 0.31 mol H2O m-2 s-1, from 2.87 mmol H2O m-2 s-1 to 8.49 mmol H2O m-2 s-1301
and 0.11 to 0.57, respectively. One-way ANOVA analyses showed significant changes302
in leaf gas exchange across the six treatments (p = 0.01for A, p < 0.01 for gs, p <=303
0.01 for E and ci/ca, Fig. 2). Two-way ANOVA analyses suggested that water addition304
had exerted effect on ci/ca (p < 0.01), that N additions influenced A (p < 0.01) and ci/ca305
(p = 0.009), and that the interaction between water and N supply played a role in gs (p306
< 0.001), E (p < 0.001) and ci/ca (p < 0.001, Table 1).307
Fig. 2308
15
Instantaneous WUE (ins-WUE) and intrinsic WUE (int-WUE) ranged from 3.09309
μmol CO2 / mmol H2O to 8.49μmol CO2 / mmol H2O and from 93.64μmol CO2 / mol310
H2O to 208.47μmol CO2 / mmol H2O, respectively. One-way ANOVA analyses311
showed significant changes in these two indexes across these treatments (both p <312
0.001, Fig. 3). Two-way ANOVA analyses suggested that water addition, N addition313
and their interaction all have significant effect on these two indexes (all p < 0.05,314
Table 1).315
Fig. 3316
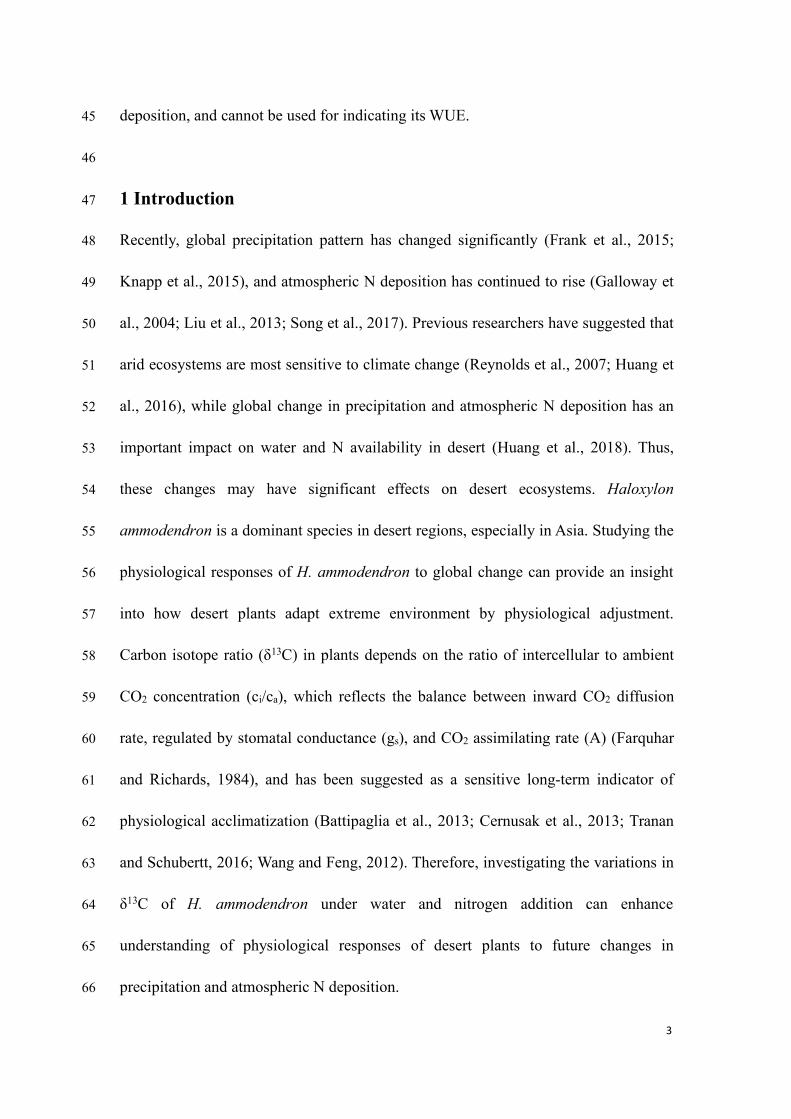
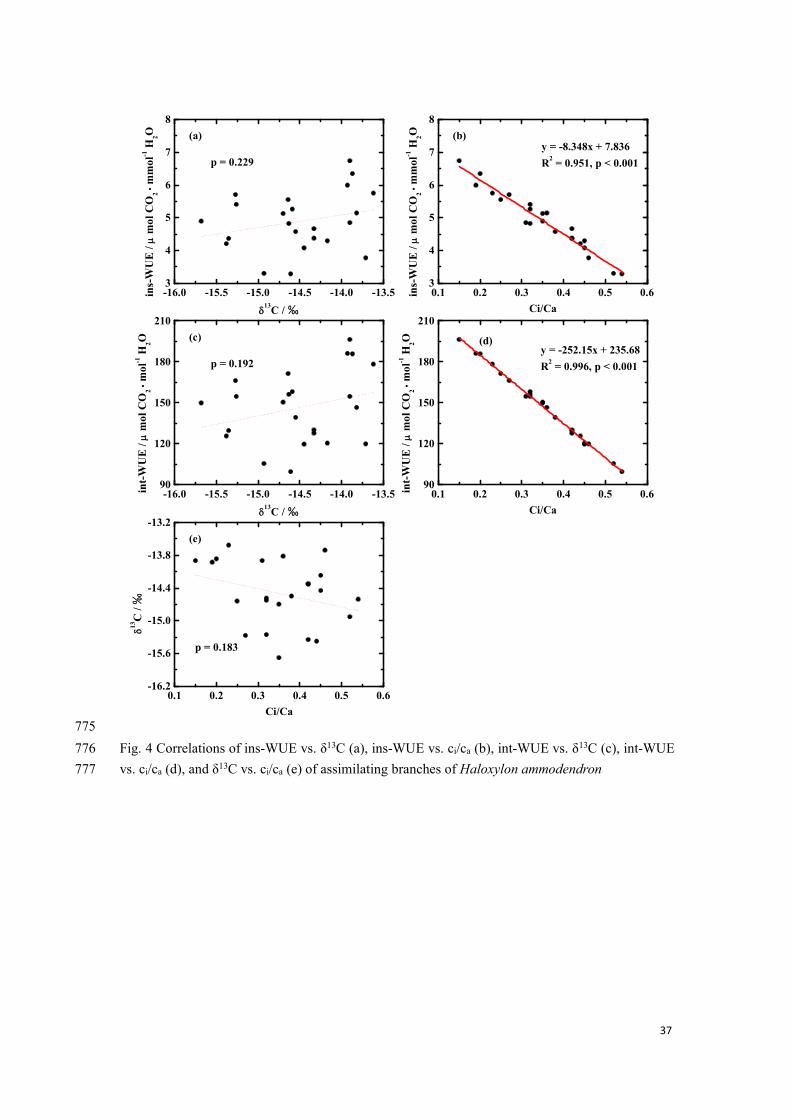
3.3 Correlations among δ13C, WUE and ci/ca ratio317
In order to test whether δ13C in H. ammodendron can indicate WUE, the relationships318
among δ13C, ins-WUE, int-WUE and ci/ca ratio were revealed in this study. Our319
results showed no correlation between δ13C and ins-WUE (p = 0.23, Fig. 4a), between320
δ13C and int-WUE (p = 0.23, Fig. 4c), and between δ13C and ci/ca ratio (p = 0.18, Fig.321
4e). However, there was a negative correlation between ins-WUE and ci/ca ratio (p <322
0.001, Fig. 4b), and between int-WUE and ci/ca ratio (p < 0.001, Fig. 4d).323
Fig. 4324
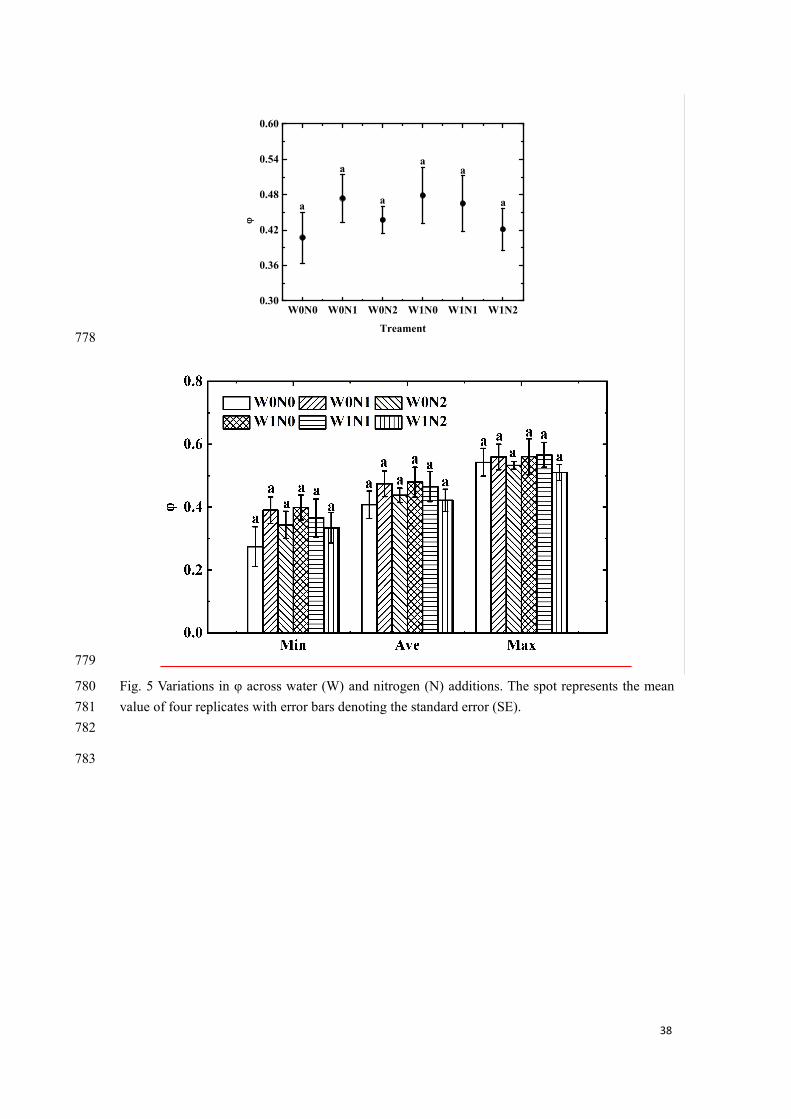
3.4 The degree of bundle-sheath leakiness under water and nitrogen addition325
The calculated φ value calculated from the minimum δ13Cair ranged from 0.16 to326
0.50 with a mean value of 0.35; the φ value calculated from the maximum δ13Cair327
ranged from 0.44 to 0.70 with a mean value of 0.55, and the φ value calculated from328
the average δ13Cair ranged from 0.32 to 0.59 with a mean value of 0.45. One-way329
ANOVA analyses showed no significant variation in φ calculated from the minimum,330
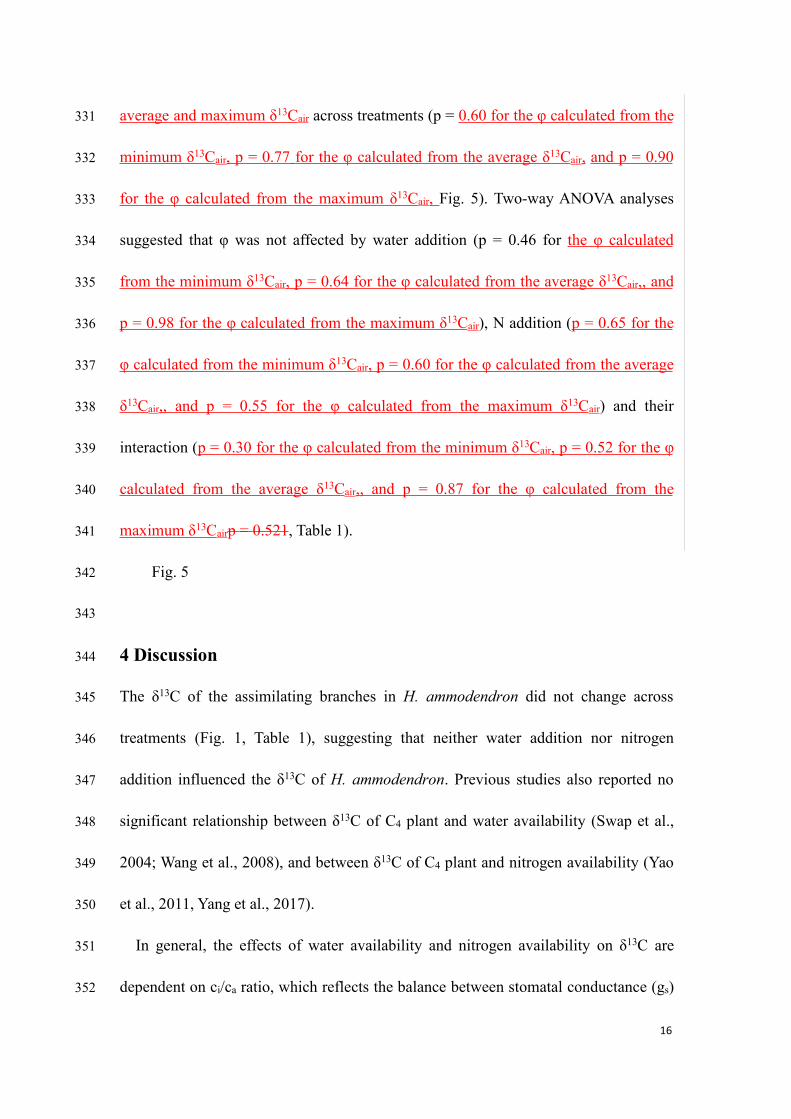
16
average and maximum δ13Cair across treatments (p = 0.60 for the φ calculated from the331
minimum δ13Cair, p = 0.77 for the φ calculated from the average δ13Cair, and p = 0.90332
for the φ calculated from the maximum δ13Cair, Fig. 5). Two-way ANOVA analyses333
suggested that φ was not affected by water addition (p = 0.46 for the φ calculated334
from the minimum δ13Cair, p = 0.64 for the φ calculated from the average δ13Cair,, and335
p = 0.98 for the φ calculated from the maximum δ13Cair), N addition (p = 0.65 for the336
φ calculated from the minimum δ13Cair, p = 0.60 for the φ calculated from the average337
δ13Cair,, and p = 0.55 for the φ calculated from the maximum δ13Cair) and their338
interaction (p = 0.30 for the φ calculated from the minimum δ13Cair, p = 0.52 for the φ339
calculated from the average δ13Cair,, and p = 0.87 for the φ calculated from the340
maximum δ13Cairp = 0.521, Table 1).341
Fig. 5342
343
4 Discussion344
The δ13C of the assimilating branches in H. ammodendron did not change across345
treatments (Fig. 1, Table 1), suggesting that neither water addition nor nitrogen346
addition influenced the δ13C of H. ammodendron. Previous studies also reported no347
significant relationship between δ13C of C4 plant and water availability (Swap et al.,348
2004; Wang et al., 2008), and between δ13C of C4 plant and nitrogen availability (Yao349
et al., 2011, Yang et al., 2017).350
In general, the effects of water availability and nitrogen availability on δ13C are351
dependent on ci/ca ratio, which reflects the balance between stomatal conductance (gs)352
17
and photosynthetic rate (A) (Farquhar and Richards, 1984). Stomatal conductance (gs)353
usually increases Wwith more increasing water availability under water addition,354
plants tend to open stomata to absorb more CO2, leading to an increase in gs. Although355
two-way ANOVA analyses suggested that water addition had no effect on both A and356
gs (Table 1); one-way ANOVA analyses showed that gs was higher in W1N0 than that357
in W0N0 (Fig. 2b), indicating that water addition had a positive effect on gs under358
ambient N condition. Increasing gs under water supply will lead to the rise of359
intercellular CO2 because of the decrease of diffusional resistance to CO2. As the360
results, ci/ca ratio was observed to increase with increasing moisture (Fig. 2d, Table 1).361
However, δ13C remained stable under water addition (Fig. 1, Table 1). Thus, ci/ca ratio362
could not explain the observed response of δ13C to water supply.363
For most plants in natural ecosystems, nitrogen is the key factor limiting plant364
growth (Hall et al., 2011). Thus, nitrogen addition usually causes plants to absorb365
more N. However, extreme drought could prevent plants from absorbing N even366
under high N supply. In the present experiment, N supply was found to have an effect367
on N contents in H. ammodendron. Relative to the control treatment (W0N0), N368
contents increased with N supply under low N addition, but kept unchanged under369
high addition (Table S1, S2). Nitrogen is the main constituent of Rubisco (ribulose‐370
1,5 ‐ bisphosphate carboxylase oxygenase) and chlorophyll in plants. Thus,371
chlorophyll a was found to have the similar pattern as N contents under water and N372
supply. Chlorophyll a was higher in W0N1 than W0N0, and there was no difference in373
chlorophyll a between W0N0 and W0N2 (Table S1). Increasing chlorophyll contents374
18
in W0N1 should lead to the increase in photosynthetic rate (A). However, different375
from our prediction, one-way ANOVA analyses suggested that A in W0N1 did not376
differ from that in W0N0, and that A in W0N2 was lower than that in W0N0 (Fig., 2a).377
Two-way ANOVA analyses showed that N addition had an influence on A (Table 1).378
Both the analyses suggested that N supply played a negative role in A, . These results379
might be associated with the extremely high light intensity at the study site. Due to the380
high light intensity, photosynthetic rate might not be correlated with chlorophyll381
contents (Gabrielsen, 1948). The negative effect of N supply on A led to the decrease382
in and thus the consumption of intercellular CO2. Consequently, ci/ca ratio increased383
with N supply (Fig. 2d, Table 1). Therefore, the variations in ci/ca ratio with N384
addition could not account for the unchanged pattern in δ13C under N supply (Fig. 1).385
The co-application of water and nitrogen had a negative effect on A but no effect on386
gs (W0N0 vs. W1N1, W1N2, Fig. 2a, b). The responses of A and gs to the387
co-application of water and nitrogen resulted in an increase in ci/ca ratio (Fig., 2d).388
Since δ13C remained unchanged under the co-application of water and nitrogen (Fig.389
1), ci/ca ratio could not also explain the observed δ13C response to the co-application390
of water and nitrogen.391
In summary, the unchanged δ13C across treatments was not dependent on the ci/ca392
ratio in H. ammodendron (Fig. 4e). The observed δ13C stability across treatments393
might be associated with the φ value and carbonic anhydrase (CA) in H.394
ammodendron. For C4 plants, the relationship between carbon isotope discrimination395
( δ13Cair - δ13Cplant, see Eq. (2)) and ci/ca ratio is controlled by φ values (Ellsworth396
19
and Cousins, 2016; Ellsworth et al., 2017; Farquhar, 1983; Wang et al., 2008). Some397
studies suggested that φ value was stable for a given species under a wide range of398
environmental conditions (Henderson et al., 1992; Wang et al., 2008; Cernusak et al.,399
2013). However, other studies had different conclusions that φ value was influenced400
by irradiation (Bellasio and Griffiths, 2014; Kromdijk et al., 2010; Pengelly et al.,401
2010; Ubierna et al., 2013), temperature (von Caemmerer et al., 2014), water stress402
(Fravolini et al., 2002; Gong et al., 2017; Williams et al., 2001; Yang et al., 2017) and403
nitrogen supply (Fravolini et al., 2002; Meinzer and Zhu, 1998; Yang et al., 2017). In404
current study, the φ value of H. ammodendron remained unchanged across six405
treatments (Fig. 5), and two-way ANOVA analyses suggested that water supply and N406
supply had no effect on φ (Table 1). Therefore, the φ value of H. ammodendron was407
insensitive to water and N addition in this study. Even if the φ value remains stable,408
the relationship between and ci/ca ratio is also associated with the magnitude of the409
φ value. Cernusak et al. (2013) predicted that when φ value is greater than 0.37, the410
correlation between and ci/ca ratio is positive; conversely, when φ value is less than411
0.37, the correlation is negative. In particular, when φ value is equal to 0.37, there will412
be no correlation between them, because the coefficient ([b4 + φ (b - s) – a] in Eq. (2))413
of ci/ca ratio equals to 0 (Cernusak et al., 2013). The φ value calculated from the414
average δ13Cair ranged from 0.32 to 0.59 with a mean value of 0.45 in present study.415
Thus, the correlation between and ci/ca in H. ammodendron should be positive416
based on the prediction by Cernusak et al. (2013). always changes in the opposite417
direction to δ13Cplant changes according to Eq. (2), thus, a negative relationship418
20
between δ13Cplant and ci/ca is expected. In fact, this study observed no correlation419
between δ13C and ci/cain H. ammodendron (Fig. 4e); this indicates that φ was not the420
driver of the observed δ13C pattern in H. ammodendron. However, the measured δ13C421
represents the fixed carbon isotope composition throughout the assimilation branch422
formation period, which usually spans at least several weeks. And the measured ci/ca423
is an instant indicator. As a result, there were some uncertainties in the calculation of424
φ value using Eq. (2) based on the measured δ13C and ci/ca. The measured δ13C425
represents the fixed carbon isotope composition throughout the assimilation branch426
formation period, which usually spans at least several weeks. And the measured ci/ca427
is a instant indicator.In addition, the mean φ value calculated from the minimum and428
maximum δ13Cair were 0.35 and 0.55, respectively Therefore, suggesting that the φ429
value of H. ammodendron might be close to 0.37, which leaded to the observed430
insensitive response of δ13C to water and N addition.431
The enzymatic activity of CA may be another mechanism behind the unchanged432
δ13C across treatments. Cousins et al. (2006) suggested that enzymatic activity of CA433
affects carbon isotope discrimination in most C4 plants because CA can result in the434
parameter b4 changes (see Eq. (2)). But in traditional view, the parameter b4 was a435
constant. However, it is only true when the ratio of PEP carboxylation rate to the CO2436
hydration rate (Vp/Vh) is equal to zero, which is caused by a high CA activity. If437
Vp/Vh is not zero, b4 will change and be controlled by Vp/Vh (Cousins et al., 2006).438
Previous studies reported that CA activity was low in most C4 plants (Cousins et al.,439
2006; Gillon and Yakir, 2000, 2001; Hatch and Burnell, 1990). Thus, CA activity in H.440
21
ammodendron might also be low, leading to the change in b4 with Vp/Vh, and thus441
δ13C. Cousins et al. (2006) added Vp/Vh into the discrimination pattern of C4 plants442
and predicted that at a given φ value, when the Vp/Vh is 0 or 1, the correlation443
between and ci/ca ratio is negative or positive, respectively. Since CA activity is low444
in most C4 plants, and the Vp/Vh always ranges from 0 to 1, we speculate that no445
correlation between and ci/ca ratio may also occur when the Vp/Vh is a certain value446
between 0 and 1. The irrelevance of and ci/ca ratio also means that δ13Cplant is not447
related to ci/ca ratio due to the negative correlation between and δ13C plant according448
to Eq. (2). Thus, the uncorrelated pattern between δ13C and ci/ca ratio in H.449
ammodendron might be related to this specific Vp/Vh value due to low CA activity.450
In addition, the unchanged δ13C across treatments may also be controlled by the451
water sources of H. ammodendron. Previous study has found that the root of H.452
ammodendron can be inserted into the soil layer deeper than 3 m (Sheng et al., 2004),453
which made it easy to uptake groundwater. Therefore, H. ammodendron may be less454
sensitive to water addition. However, a study conducted in the same region has found455
that the shallow soil water (0-40 cm) and groundwater are two important water456
sources for H. ammodendron (Dai et al., 2014), and another study has reported that457
water addition resulted in an increase of soil water contents in shallow soil layer (Cui,458
2018). Moreover, gas exchange changed across treatments in the present study (Fig.459
2). Thus, the utilization of groundwater by H. ammodendron may be one of the460
reasons why its δ13C was not sensitive to water and N addition, but it should not be461
the main reason.462
22
Whether foliar δ13C of C4 plants can indicate their WUE is still controversial.463
Henderson et al. (1992) found that δ13C of 10 C4 species has negative correlation with464
their WUE. Although this result was just opposite to a positive relationship between465
δ13C and WUE for C3 plants (Farquhar, 1983; Duquesnay et al., 1998; Feng, 1998), it466
is a proof that δ13C of C4 plants can indicate their WUE. In the work of Henderson et467
al. (1992), they found that the φ values in 10 C4 species was around 0.21 over a range468
of irradiance and leaf temperature. According to the suggestion by Cernusak et al.469
(2013) that is negatively related to ci/ca ratio when φ value is less than 0.37, thus,470
the δ13C of 10 C4 species has a positive correlation with ci/ca ratio. In general, under471
fixed ambient CO2 concentration, WUE is always negatively correlated with ci/ca ratio472
(see Eq. (43) and Eq. (56)). This is why a negative relationship between δ13C and473
WUE was observed for the 10 C4 species. The present study showed that ins-WUE474
and int-WUE both had no correlation with δ13C in H. ammodendron (Fig. 4a, 4c),475
which was different from the results published by Henderson et al. (1992). In general,476
ci/ca ratio is the link between WUE and δ13C. As mentioned above, if the φ value477
equals to 0.37 and/or the activity of CA is very low, δ13C would not correlate to ci/ca478
ratio, and thus leads to the uncorrelation between δ13C and WUE. In addition, the479
different time scales of δ13C, ins-WUE and int-WUE may also result in this480
uncorrelation. As mentioned above, the measured δ13C represents the long-term fixed481
carbon isotope composition (at least several weeks). And the value of ins-WUE and482
int-WUE were calculated from the gas exchange of a short-term measurement, which483
lasted only a few minutes. Therefore, this difference in time scale may also drive the484
23
uncorrelation between δ13C and WUE. Although the defects in measurements could485
introduce some uncertainty in the observed relationship between δ13C and WUE,486
δ13C remained stable under water and nitrogen addition (Fig. 1, Table 1), while the487
measured ins-WUE and int-WUE was higher in the control treatment (W0N0) than488
other treatments (Fig. 3), suggesting and water and N supply had a significant effect489
on WUE (Table 1). These results indirectly confirmed that δ13C of H. ammodendron490
could not indicate its WUE.491
The present study has found that δ13C of H. ammodendron could not be used as a492
indicator of its WUE. Although this conclusion cannot be analogous to all C4 plants,493
the present study has important implications for the understanding of physiological494
responses of desert plants to future changes in precipitation and atmospheric N495
deposition. H. ammodendron is a dominant species in Asia desert, which has a great496
effect on the stabilization of sand dunes, the survival and development of understory497
plants and the structure and function of desert ecosystems (Sheng et al., 2005; Su et498
al., 2007; Cui et al., 2017). Thus, H. ammodendron is widely distributed in desert499
areas, and the prediction of its drought adaptation is crucial in desert ecosystem.500
501
5 Conclusion502
Global changes including precipitation and atmospheric N deposition have been503
proved to have an important influence on ecosystems, especially for the arid504
ecosystems. The present study showed that water and N addition had little effect on505
the δ13C values and the degree of bundle-sheath leakiness (φ) of H. ammodendron, but506
24
played an important role in the change of its gas exchange and water use efficiency507
(WUE). In addition, different pattern of instantaneous WUE (ins-WUE), intrinsic508
WUE (int-WUE) and δ13C across treatment and no correlation between instantaneous509
WUE (ins-WUE) and δ13C, and between intrinsic WUE (int-WUE) and δ13C has been510
found in this study, suggesting that δ13C of H. ammodendron could not indicate its511
WUE. This result was caused by the lack of the correlation between δ13C and the ratio512
of intercellular to ambient CO2 concentration (ci/ca), which might be associated with513
the degree of bundle-sheath leakiness (φ) or the low activity of carbonic anhydrase514
(CA). Thus, the current experiment implies that the availability of δ13C as the515
indicator of WUE could be not universal for C4 species.516
517
Conflict of interest518
None declared.519
520
Funding521
This research was supported by the Chinese National Basic Research Program (No.522
2014CB954202 and a grant from the National Natural Science Foundation of China523
(No. 41772171).524
525
Authors' Contributions526
G Wang and J Li designed the experiment and modified the manuscripts. Z Chen527
designed and executed the experiment and wrote the manuscripts. X Liu designed the528
25
experiment. X Cui executed the experiment. Y Han executed the experiment.529
530
Acknowledgements531
This research was supported by the Chinese National Basic Research Program (No.532
2014CB954202 and a grant from the National Natural Science Foundation of China533
(No. 41772171). We would like to thank the supports from the Fukang Observation534
Station of Desert Ecology, Xinjiang Institute of Ecology and Geography, Chinese535
Academy of Sciences, and to thank Ma Yan for analyzing stable carbon isotope ratios536
in the Isotope Lab at the College of Resources and Environment, China Agricultural537
University.538
539
Data availability540
The datasets analyzed in this manuscript are not publicly available. Requests to access541
the datasets should be directed to [email protected]
543
References544
Battipaglia, G., Saurer, M., Cherubini, P., Calfapietra, C., McCarthy, H. R., Norby, R. J., and545
Cotrufo, M. F.: Elevated CO2 increases tree-level intrinsic water use efficiency: insights from546
carbon and oxygen isotope analyses in tree rings across three forest FACE sites. New Phytol.,547
197, 544-554, 2013.548
Bellasio, C., and Griffiths, H.: Acclimation to low light by C4 maize: implications for bundle549
sheath leakiness. Plant Cell Environ., 37, 1046-1058, 2014.550
26
Cernusak, L. A., Ubierna, N., Winter, K., Holtum, J. A. M., Marshall, J.. D., and Farquhar, G. D.:551
Environmental and physiological determinants of carbon isotope discrimination in terrestrial552
plants. New Phytol., 200, 950-965, doi: 10.1111/nph.12423, 2013.553
Cernusak, L. A., Winter, K., Aranda, J., Turner, B. L., and Marshall, J. D.: Transpiration efficiency554
of a tropical pioneer tree (Ficus insipida) in relation to soil fertility. J. Exp. Bot., 58(13),555
3549-3566, 2007.556
Chen, Y., Wang, Q., Li, W., and Ruan, X.: Microbiotic crusts and their interrelations with557
environmental factors in the Gurbantonggut desert, western China. Environ. Geol., 52, 691-700,558
2007.559
Cousins, A. B., Badger, M. R., and von Caemmerer, S.: Carbonic anhydrase and its influence on560
carbon isotope discrimination during C4 photosynthesis. Insights from antisense RNA in561
Flaveria bidentis. Plant Physiol., 141, 232-242, 2006.562
Craig, H.: Carbon-13 in plants and relationships between carbon-13 and carbon-14 variations in563
nature. J. Geol., 62, 115-149, 1954.564
Craig, H.: Isotopic standards for carbon and oxygen and correction factors for mass spectrometric565
analysis of carbon dioxide. Geochim. Cosmochim. Acta, 12, 133-149, 1957.566
Cui, X. Q., Yue, P., Gong, Y., Li, K. H., Tan, D. Y., Goulding, K., and Liu, X. J.: Impacts of water567
and nitrogen addition on nitrogen recovery in, Haloxylon ammodendron, dominated desert568
ecosystems. Sci. Total Environ., 601-602, 1280-1288, 2017.569
Cui, X. Q.: Effects of enhanced precipitation, temperature and nitrogen addition on nitrogen fate570
and plant stoichiometry in temperate desert ecosystem in Xinjiang. Ph.D thesis, China571
Agricultural University, 2018.572
27
Dai, Y., Zheng, X., Tang, L., and Li, Y.: Dynamics of water usage in Haloxylon ammodendron in573
the southern edge of the Gurbantunggut Desert. Chinese J. Plant Ecol., 38, 1214-1225, 2014.574
Diefendorf, A. F., Mueller, K. E., and Wing, S. L.: Global patterns in leaf 13C discrimination and575
implications for studies of past and future climate. Proc. Natl. Acad. Sci. U.S.A., 107,576
5738-5743. doi: 10.1073/pnas.0910513107, 2010.577
Duquesnay, A., Breda, N., Stievenard, M., and Dupouey, J.: Changes of tree-ring δ13C and578
water-use efficiency of beech (Fagus sylvatica L.) in northeastern France during the past579
century. Plant Cell Environ., 21, 565-572, 1998.580
Ehleringer, J. R., and Cerling, T. E.: Atmospheric CO2 and the ratio of intercellular to ambient CO2581
concentrations in plants. Tree Physiol., 15, 105-111, 1995.582
Ellsworth, P. Z., Ellsworth, P. V., and Cousins, A. B.: Relationship of leaf oxygen and carbon583
isotopic composition with transpiration efficiency in the C4 grasses Setaria viridis and Setaria584
italica. J. Exp. Bot., 68(13), 3513-3528, 2017.585
Ellsworth, P. Z., and Cousins, A. B.: Carbon isotopes and water use efficiency in C4 plants. Curr.586
Opin. Plant. Biol., 31, 155-161, 2016.587
Fan, L. L., Li, Y., Tang, L. S., and Ma, J.: Combined effects of snow depth and nitrogen addition588
on ephemeral growth at the southern edge of the Gurbantunggut Desert, China. J. Arid. Land, 5,589
500-510, 2013.590
Farquhar, G. D.: On the nature of carbon isotope discrimination in C4 species. Aust. J. Plant591
Physiol., 10(2), 205-226, 1983.592
Farquhar, G. D., and Richards, P. A.: Isotopic composition of plant carbon correlates with593
water-use efficiency of wheat gemotypes. Aust. J. Plant Physiol., 11, 539-552, 1984.594
28
Feng, X.: Long-term ci/ca response of trees in western North America to atmospheric CO2595
concentration derived from carbon isotope chronologies. Oecologia, 117, 19-25, 1998.596
Frank, D., Reichstein, M., Bahn, M., Thonicke, K., Frank, D., Mahecha, M. D., Smith, P., der597
Velde, M. V., Vicca, S., Babst, F., Beer, C., Buchmann, N, Canadell, J. C., Ciais, P., Cramar, W.,598
SIbrom, A., Miglietta, F., Poulter, B., Rammig, A., Seneviratne, S. I., Walz, A., Wattenbach, M.,599
Zavala, M. A., and Zscheischler, J.: Effects of climate extremes on the terrestrial carbon cycle:600
Concepts, processes and potential future impacts. Global Chang. Biol., 21(8), 2861-2880, 2015.601
Fravolini, A., Williams, D. G., and Thompson, T. L.: Carbon isotope discrimination and bundle602
sheath leakiness in three C4 subtypes grown under variable nitrogen, water and atmospheric603
CO2 supply. J. Exp. Bot., 53(378), 2261-2269, 2002.604
Gabrielsen, E. K.: Effects of different chlorophyll concentrations on photosynthesis in foliage605
leaves. Physiol. Plant. 1, 5-37, 1948.606
Galloway, J. N., Dentener, F. J., Capone, D. G., Boyer, E. W., Howarth, R. W., Seitzinger, S. P.,607
Asner, G. P., Cleveland, C. C., Green, P. A., Holland, E. A., Karl, D. M., Michaels, A. F., Porter,608
J. H., Townsend, A. R., and Vörösmarty, C.J.: Nitrogen cycles: past, present, and future.609
Biogeochem. 70, 153-226, 2004.610
Galloway, J. N., Townsend, A. R., Erisman, J. W., Bekunda, M., Cai, Z., Freney, J. R., Martinelli,611
L. A., Seitzinger, S. P., and Sutton, M. A.: Transformation of the nitrogen cycle: recent trends,612
questions, and potential solutions. Science, 320, 889-892, 2008.613
Gillon, J. S., and Yakir, D.: Naturally low carbonic anhydrase activity in C4 and C3 plants limits614
discrimination against (COO)-O-18 during photosynthesis. Plant Cell Environ., 23, 903-915,615
2000.616
29
Gillon, J. S., and Yakir, D.: Influence of carbonic anhydrase activity in terrestrial vegetation on the617
O-18 content of atmospheric CO2. Science, 291, 2584-2587, 2001.618
Gong, X. W, Lü, G. H., He, X. M., Sarkar, B., and Yang X. D.: High air humidity causes619
atmospheric water absorption via assimilating branches in the deep-rooted tree Haloxylon620
ammodendron in an arid desert region of Northwest China. Front. Plant Sci., 10, 573, 2019.621
Gong, X. Y., Schäufele, R., and Schnyder, H.: Bundle-sheath leakiness and intrinsic water use622
efficiency of a perennial C4 grass are increased at high vapour pressure deficit during growth. J.623
Exp. Bot., 68(2), 321-333, 2017.624
Gresset, S., Westermeier, P., Rademacher, S., Ouzunova, M., Presterl, T., Westhoff, P., and Schön,625
C.: Stable carbon isotope discrimination is under genetic control in the C4 species maize with626
several genomic regions influencing trait expression. Plant Physiol., 164(1), 131-143, 2014.627
Hall, S. J., Sponseller, R. A., Grimm, N. B., Huber, D., Kaye, J. P., Clark, C., and Collins, S. L.:628
Ecosystem response to nutrient enrichment across an urban airshed in the Sonoran Desert. Ecol.629
Appl., 21, 640-660, 2011.630
Hatch, M. D., and Burnell, J. N.: Carbonic anhydrase activity in leaves and its role in the first step631
of C4 photosynthesis. Plant Physiol., 93, 825-828, 1990.632
Henderson, S. A., von Caemmerer, S., and Farquhar, G. D.: Short-termmeasurements of carbon633
isotope discrimination in several C4 species. Aust. J. Plant Physiol., 19, 263-285, 1992.634
Huang, J. P., Yu, H. P., Guan, X. D., Wang, G. Y., and Guo, R. X.: Accelerated dryland expansion635
under climate change. J. Nature Climat. Chang., 6(2), 2016.636
Huang, J. Y., Wang, P., Niu, Y. B., Yu, H. L., Ma, F., Xiao, G. J., and Xu, X.: Changes in C:N:P637
stoichiometry modify N and P conservation strategies of a desert steppe species Glycyrrhiza638
30
uralensis. Sci. Rep., 8(1), 12668, 2018.639
Knapp, A. K., Hoover, D. L., Wilcox, K. R., Avolio, M. L., Koerner, S. E., La Pierre, K. J., Loik,640
M. E., Luo Y. Q., Sala, O. E., and Smith, M. D.: Characterizing differences in precipitation641
regimes of extreme wet and dry years: Implications for climate change experiments. Glob.642
Chang. Biol.y 21(7), 2624-2633, 2015.643
Kohn, M. J.: Carbon isotope compositions of terrestrial C3 plants as indicators of (paleo) ecology644
and (paleo) climate. Proc. Natl. Acad. Sci. U.S.A., 107, 19691-19695. doi:645
10.1073/pnas.1004933107, 2010.646
Kromdijk, J., Griffiths, H., and Schepers, H. E.:. Can the progressive increase of C4 bundle sheath647
leakiness at low PFD be explained by incomplete suppression of photorespiration? Plant Cell648
Environ., 33, 1935-1948, 2010.649
Li, J. Z., Wang, G. A., Zhang, R.N., and Li, L.: A negative relationship between foliar carbon650
isotope composition and mass-based nitrogen concentration on the eastern slope of mount651
gongga, China. PLoS ONE, 11(11), e0166958, 2016.652
Liu, W. G., Feng, X. H., Ning, Y. F., Zhang, Q. L., Cao, Y. N., and An, Z. S.: δ13C variation of C3653
and C4 plants across an asian monsoon rainfall gradient in arid northwestern China. Glob.654
Chang. Biol., 11(7), 1094-1100, 2005.655
Liu, X., Zhang, Y., Han, W., Tang, A., Shen, J., Cui, Z., Vitousek, P., Erisman, J. W., Goulding, K.,656
Christie, P., Fangmeier, A., and Zhang, F.: Enhanced nitrogen deposition over China. Nature657
494, 459-462, 2013.658
Liu, Y. X., Li, X., Zhang, Q., Guo, Y. F., Gao, G., and Wang, J. P.: Simulation of regional659
temperature and precipitation in the past 50 years and the next 30 years over China. Quat. Int.,660
31
212, 57-63, 2010.661
Ma, J. Y., Sun, W., Liu, X. N., and Chen, F. H.: Variation in the stable carbon and nitrogen isotope662
composition of plants and soil along a precipitation gradient in northern China. PLoS ONE,663
7(12), e51894, 2012.664
Ma, J. Y., Sun, W., Koteyeva, N. K., Voznesenskaya, E., Stutz, S. S., Gandin, A., Smith-Moritz, A.665
M., Heazlewood, J. L., and Cousins, A. B.: Influence of light and nitrogen on the photosynthetic666
efficiency in the c4 plant Miscanthus×Giganteus. Photo. Res., 131(1), 1-11, 2016.667
Meinzer, F. C., and Zhu, J.: Nitrogen stress reduces the efficiency of the C4 CO2 concentrating668
system, and therefore quantum yield, in Saccharum (sugarcane) species. J. Exp. Bot., 49(324),669
1227-1234, 1998.670
Nyongesah, M. J, and Wang, Q.: Variation of photosynthesis and pigment concentration relative to671
irradiance and nitrogen content for two coexisting desert shrubs. Ecol. Engin., 58, 238-248,672
2013.673
O’ Leary, M. H.: Measurement of the isotopic fractionation associated with diffusion of carbon674
dioxide in aqueous solution. J. Phys. Chem., 88, 823-825, 1984.675
Pengelly, J. J. L., Sirault, X. R. R., Tazoe, Y., Evans, J. R., Furbank, R. T., and von Caemmerer, S.:676
Growth of the C4 dicot Flaveria bidentis: photosynthetic acclimation to low light through shifts677
in leaf anatomy and biochemistry. J. Exp. Bot., 61, 4109-4122, 2010.678
Rao, Z. G., Guo, W. K., Cao, J. T., Shi, F. X., Jiang, H., and Li, C. Z.: Relationship between the679
stable carbon isotopic composition of modern plants and surface soils and climate: A global680
review. Earth Sci. Rev., 165, 110-119, 2017.681
Reynolds, J. F., Smith, D. M. S., Lambin, E. F., Turnerll, B. L., Mortimore, M., Batterbury, S. P. J.,682
32
Downing, T. E., Dowlatabadi, H., Fernández, R. J., Herrick, J. E., Huber-Sannwald, E., Jiang,683
H., Leemans, R., Lynam, T., Maestre, F. T., Ayarza, M., and Walker, B.: Global desertification:684
building a science for dryland development. Science, 316(5826), 847-851, 2007.685
Saranga, Y., Flash, I., Paterson, A. H., and Yakir, D.: Carbon isotope ratio in cotton varies with686
growth stage and plant organ. Plant Sci. (Shannon), 142(1), 0-56, 1999.687
Schmidt, G., Gebauer, G., Widmann, K., and Ziegler, H.: Influence of nitrogen supply and688
temperature on stable carbon isotope ratios in plants of different photosynthetic pathways (C3,689
C4, CAM). Isotopenp. Isot. Environ. Heal. Stud., 29(1-2), 9-13, 1993.690
Serret, M. D., Yousfi, S., Vicente, R., Piñero, M. C., Otálora-Alcón G., del Amor, F. M., and Araus,691
J. L.: Interactive effects of CO2 concentration and water regime on stable isotope signatures,692
nitrogen assimilation and growth in sweet pepper. Front. Plant Sci., 8, 2180, 2018.693
Sheng, J., Qiao, Y., Liu, H., Zhai, Z., and Guo, Y.: A Study on the Root System of Haloxylon694
Aammodendron ( C. A. Mey. ) Bunge. Acta Agrestia Sinica, 12, 91-94, 2004.695
Song, L., Kuang, F., Skiba, U., Zhu, B., Liu, X., Levy, P., Dore, A., and Fowler, D.: Bulk696
deposition of organic and inorganic nitrogen in southwest China from 2008 to 2013. Environ.697
Pollut. 227, 157-166, 2017.698
Sparks, J. P., and Ehleringer, J. R.: Leaf carbon isotope discrimination and nitrogen content for699
riparian trees along elevational transects. Oecologia, 109, 362-367. doi:700
10.1007/s004420050094, 1997701
Stewart, G. R., Turnbull, M. H., Schmidt, S., and Erskine, P. F.: 13C Natural abundance in plant702
communities along a rainfall gradient: a biological integrator of water availability. Aust. J. Plant703
Physiol., 22, 51-55. doi: 10.1071/ PP9950051, 1995.704
33
Swap, R. J., Aranibar, J. N., Dowty, P. R., Gilhooly III, W. P., and Macko, S. A.: Natural705
abundance of 13C and 15N in C3 and C4 vegetation of southern africa: patterns and implications.706
Glob. Change Biol., 10(3), 350-358, 2004.707
Tranan, M. W., and Schubertt, B. A.: Temperature-induced water stress in high-latitude forests in708
response to natural and anthropogenic warming. Glob. Change Biol., 22, 782-791, doi:709
10.1111/gcb.13121, 2016.710
Ubierna, N., Sun, W., Kramer, D. M., and Cousins, A. B.: The efficiency of C4 photosynthesis711
under low light conditions in Zea mays, Miscanthus x giganteus and Flaveria bidentis. Plant712
Cell Environ., 36, 365-381, 2013.713
von Caemmerer, S., Ghannoum, O., Pengelly, J. J. L., and Cousins, A. B.: Carbon isotope714
discrimination as a tool to explore C4 photosynthesis. J. Exp. Bot., 65, 3459-3470, 2014.715
Wang, G. A., Feng, X., Han, J., Zhou, L., Tan, W., and Su, F.: Paleovegetation reconstruction using716
δ13C of soil organic matter. Biogeosci., 5, 1325-1337. doi: 10.5194/bg-5-1325-2008, 2008.717
Wang, G. A., and Feng, X. H.: Response of plants’ water use efficiency to increasing atmospheric718
CO2 concentration. Environ. Sci. Technol., 46, 8610-8620, 2012.719
Wang, G. A., Han, J. M., Zhou, L. P., Xiong, X. G., and Wu, Z. H.: Carbon isotope ratios of plants720
and occurrences of C4 species under different soil moisture regimes in arid region of Northwest721
China. Physiol. Plant., 25, 74-81, 2005.722
Wang, G. A., Han, J. M., Zhou, L. P., Xiong, X. G., Tan, M., Wu, Z. H., and Peng, J.: Carbon723
isotope ratios of C4 plants in loess areas of North China. Sci. China Ser. D., 49(1), 97-102,724
2006.725
Williams, D. G., Gempko, V., Fravolini, A., Leavitt, S. W., Wall, G. W., Kimball, B. A., Pinter Jr, P.726
34
J., LaMorte, R., and Ottman, M.: Carbon isotope discrimination by Sorghum bicolor under CO2727
enrichment and drought. New Phytol., 150, 285-293, 2001.728
Yang, H., Yu, Q., Sheng, W. P., Li, S. G., and Tian, J.: Determination of leaf carbon isotope729
discrimination in C4 plants under variable N and water supply. Sci. Rep., 7, 351, 2017.730
Yao, F. Y., Wang, G. A., Liu, X. J., and Song, L.: Assessment of effects of the rising atmospheric731
nitrogen deposition on nitrogen uptake and long-term water-use efficiency of plants using732
nitrogen and carbon stable isotopes. Rapid Commun. Mass Spectrom., 25, 1827-1836, 2011.733
Zhang, J., Gu, L., Bao, F., Cao, Y., Hao, Y., He, J., Li, J., Li, Y., Ren, Y., Wang, F., Wu, R., Yao, B.,734
Zhao, Y., Lin, G., Wu, B., Lu, Q., and Meng, P.: Nitrogen control of 13C enrichment in735
heterotrophic organs relative to leaves in a landscape-building desert plant species. Biogeosci.,736
12(1), 15-27, 2015.737
Zhang, Y. M., Chen, J., Wang, L., Wang, X. Q., and Gu, Z. H.: The spatial distribution patterns of738
biological soil crusts in the Gurbantunggut Desert, Northern Xinjiang, China. J. Arid Environ.,739
68, 599-610, 2007.740
741
742
743
744
745
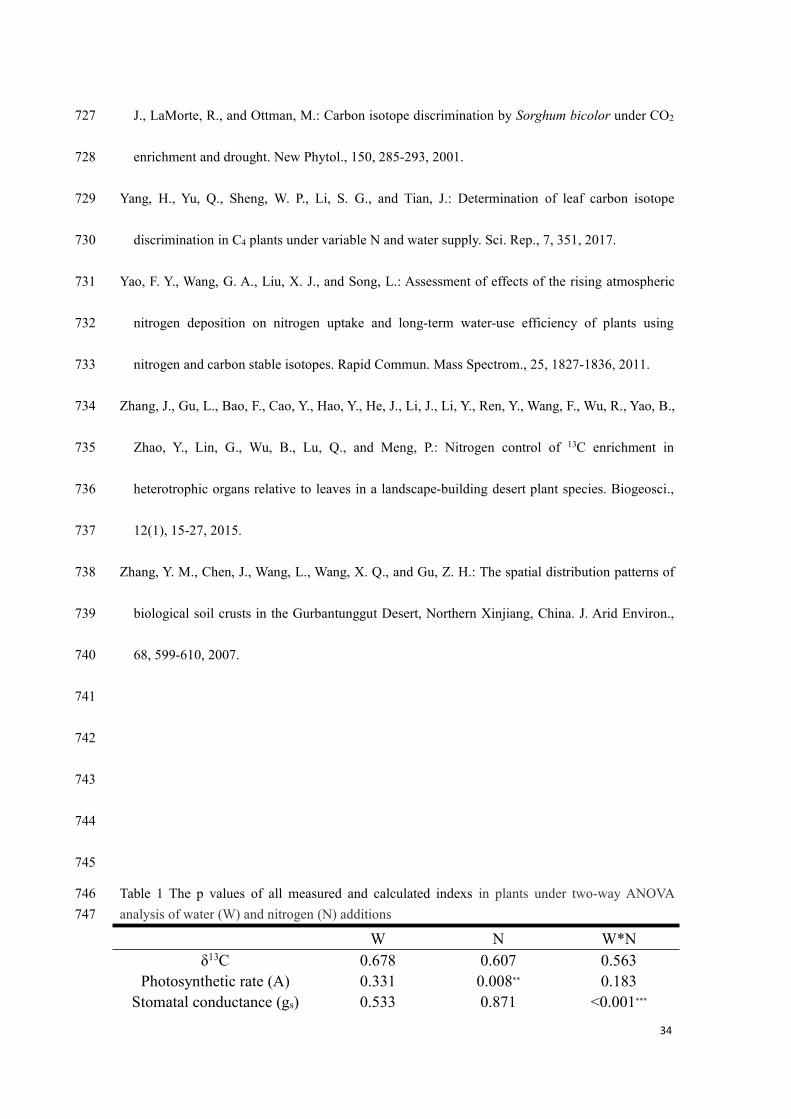
Table 1 The p values of all measured and calculated indexs in plants under two-way ANOVA746analysis of water (W) and nitrogen (N) additions747
W N W*Nδ13C 0.678 0.607 0.563
Photosynthetic rate (A) 0.331 0.008** 0.183Stomatal conductance (gs) 0.533 0.871 <0.001***
35
Transpiration rate (E) 0.622 0.883 <0.001***
ci/ca 0.004** 0.009** <0.001***
ins-WUE 0.002** <0.001*** <0.001***
int-WUE 0.004** 0.018* <0.001***
φ 0.644 0.600 0.521Note. *, **, *** indicates a significant influence.748
749
750
751
752
753
754
755
756
757
758
759
W0N0 W0N1 W0N2 W1N0 W1N1 W1N2-17
-16
-15
-14
-13
-12
aaaaa
13C
(‰)
Treament
a
760Fig. 1 The δ13C of assimilating branches of Haloxylon ammodendron under water (W) and761nitrogen (N) additions. The spot represents the mean value of four replicates with error bars762denoting the standard error (SE).763
764
36
W0N0 W0N1 W0N2 W1N0 W1N1 W1N218
20
22
24
26
28
W0N0 W0N1 W0N2 W1N0 W1N1 W1N20.09
0.12
0.15
0.18
0.21
0.24
W0N0 W0N1 W0N2 W1N0 W1N1 W1N23.6
4.2
4.8
5.4
6.0
6.6
W0N0 W0N1 W0N2 W1N0 W1N1 W1N20.14
0.21
0.28
0.35
0.42
0.49
bcc
a
c
ab
Phot
osyn
thet
ic r
ate
(m
ol C
O2 m
-2 s-1
)
a
(a) (b)
abc
c
a
bcab
c
Stam
atal
con
duct
ance
(mol
H2O
m-2 s-1
)ab
b
a a
b
a
(c)
Tra
nspi
ratio
n ra
te (m
mol
H2O
m-2 s-1
)
Treatment
(d)
a
b
aaba
c
Ci /
Ca
Treatment765Fig. 2 Variations in photosynthetic rate (a), stomatal conductance (b), water use-efficiency (c) and766ci/ca (d) across water (W) and nitrogen (N) additions. The spot represents the mean value of four767replicates with error bars denoting the standard error (SE).768
W0N0 W0N1 W0N2 W1N0 W1N1 W1N23.2
4.0
4.8
5.6
6.4
7.2
W0N0 W0N1 W0N2 W1N0 W1N1 W1N2100
120
140
160
180
200(a)
c
b
cc
c
a
ins-
WU
E (
mol
CO
2 · m
mol
-1 H
2O)
Treatment
(b)
bbc c
cc
a
int-
WU
E (
mol
CO
2 · m
ol-1 H
2O)
Treatment769Fig. 3 Variations in ins-WUE (a) and int-WUE (b) across water (W) and nitrogen (N) additions.770The spot represents the mean value of four replicates with error bars denoting the standard error771(SE).772
773774
37
-16.0 -15.5 -15.0 -14.5 -14.0 -13.53
4
5
6
7
8
0.1 0.2 0.3 0.4 0.5 0.63
4
5
6
7
8
-16.0 -15.5 -15.0 -14.5 -14.0 -13.590
120
150
180
210
0.1 0.2 0.3 0.4 0.5 0.690
120
150
180
210
0.1 0.2 0.3 0.4 0.5 0.6-16.2
-15.6
-15.0
-14.4
-13.8
-13.2
ins-
WU
E /
mol
CO
2 • m
mol
-1 H
2O
13C / ‰
(a)
p = 0.229
(b)
ins-
WU
E /
mol
CO
2 • m
mol
-1 H
2O
Ci/Ca
y = -8.348x + 7.836R2 = 0.951, p < 0.001
p = 0.192
(c)
int-W
UE
/
mol
CO
2 • m
ol-1
H2O
13C / ‰
(d)y = -252.15x + 235.68R2 = 0.996, p < 0.001
int-W
UE
/
mol
CO
2 • m
ol-1
H2O
Ci/Ca
p = 0.183
(e)
13C
/ ‰
Ci/Ca775
Fig. 4 Correlations of ins-WUE vs. δ13C (a), ins-WUE vs. ci/ca (b), int-WUE vs. δ13C (c), int-WUE776vs. ci/ca (d), and δ13C vs. ci/ca (e) of assimilating branches of Haloxylon ammodendron777
38
W0N0 W0N1 W0N2 W1N0 W1N1 W1N20.30
0.36
0.42
0.48
0.54
0.60
a
aa
a
a
Treament
a
778
779
Fig. 5 Variations in φ across water (W) and nitrogen (N) additions. The spot represents the mean780value of four replicates with error bars denoting the standard error (SE).781
782
783