Embed Size (px)
Citation preview

Environmental Engineering and Management Journal January 2014, Vol.13, No. 1, 61-72
http://omicron.ch.tuiasi.ro/EEMJ/
“Gheorghe Asachi” Technical University of Iasi, Romania
EVALUATING TRENDS OF WATER QUALITY INDEX
OF SELECTED KELANG RIVER TRIBUTARIES
Zubaidah Ismail1, Rahizah Sulaiman1, Ramlee Karim2
1Civil Engineering Department, University of Malaya, 50603 Kuala Lumpur, Malaysia 2Petmel Resources Pte Ltd, 53 Persiaran Zaaba, TTDI, 60000 Kuala Lumpur, Malaysia
Abstract Concerns for the river environment in Malaysia were highlighted. There had been occurrences of inadequate supply of water in certain cities and unexpected floods over the last few years. This paper discusses the results and efforts to clean the Gombak River which passes through several industrial areas and the City of Kuala Lumpur and the Penchala River which has an extra burden of passing through a highly densely populated Kuala Lumpur satellite city. Both rivers were considered polluted with the Penchala River being in a worse situation than the Gombak River. Special attention was given to the trends in the levels of Water Quality Index (WQI) over a period of nine years from 1997 to 2005. Results of efforts which included public participation, engineering and river works and strict statutory regulations by the government authorities had shown only slight success in improving the river water quality. The Gombak River started with a WQI of 64 units shows improvement of 0.07 WQI units / month while the Penchala River started with WQI of 27 units shows improvement of 0.017 units / month with BOD and Ammoniacal Nitrogen as critical factors. Further efforts from stakeholders could be harnessed and public awareness be enhanced to strive for a healthier Gombak and Penchala rivers. Key words: Gombak River, interim water quality standard, Penchala River, river clean-up, water quality index Received: February, 2011; Revised final: April, 2012; Accepted: April, 2012
Author to whom all correspondence should be addressed: e-mail: [email protected], Phone: 60379675284; Fax: 60379675318
1. Introduction The river systems in Malaysia constitute from
more than 100 river systems in Peninsular Malaysia and more than 50 river systems in Sabah and Sarawak are a vital part of the Malaysian water resources system (http://www.riverbasin.org/index.cfm?&menuid=81&parentid=51).
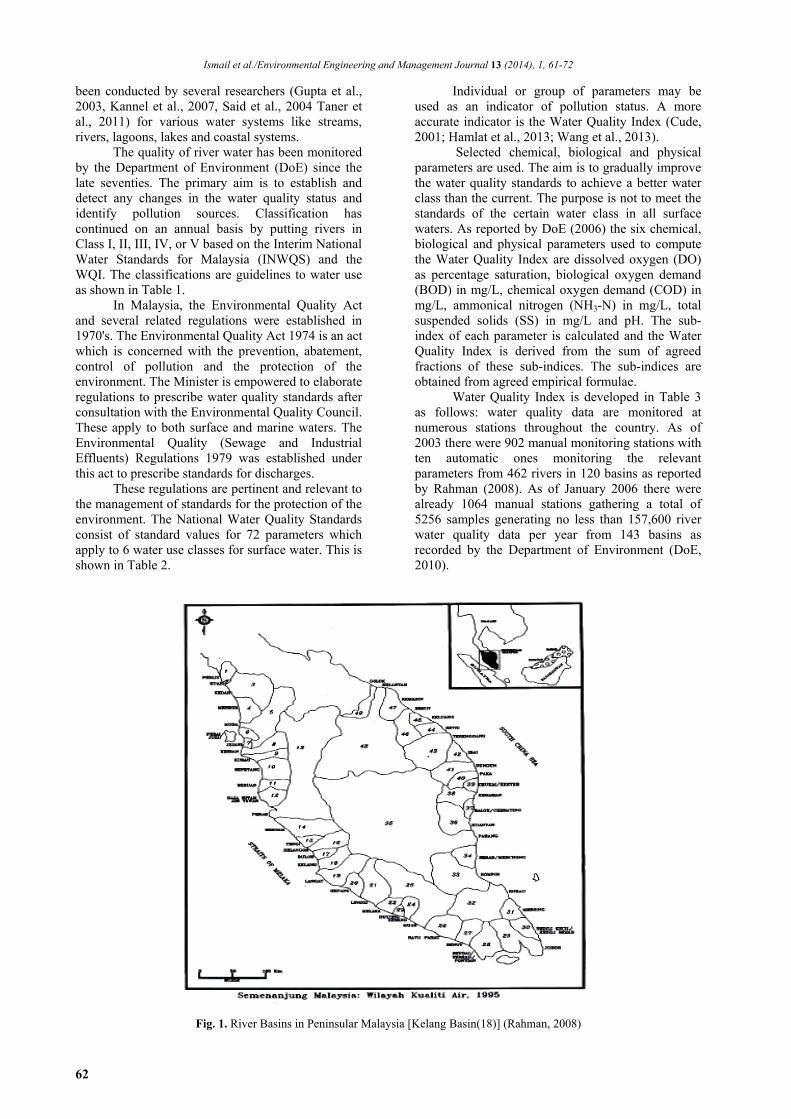
The river basins in Peninsular (Semenanjung) Malaysia (Fig. 1) include Kelang River (No. 18) as the main river in the Kelang basin. It flows through Kuala Lumpur, the capital city of Malaysia. It is 120 km long and drains the Kelang Valley basin which has an area of about 1288 sq. km. into the Straits of Melaka. The Gombak River and the Penchala River are two important tributaries of the 11 Kelang River tributaries.
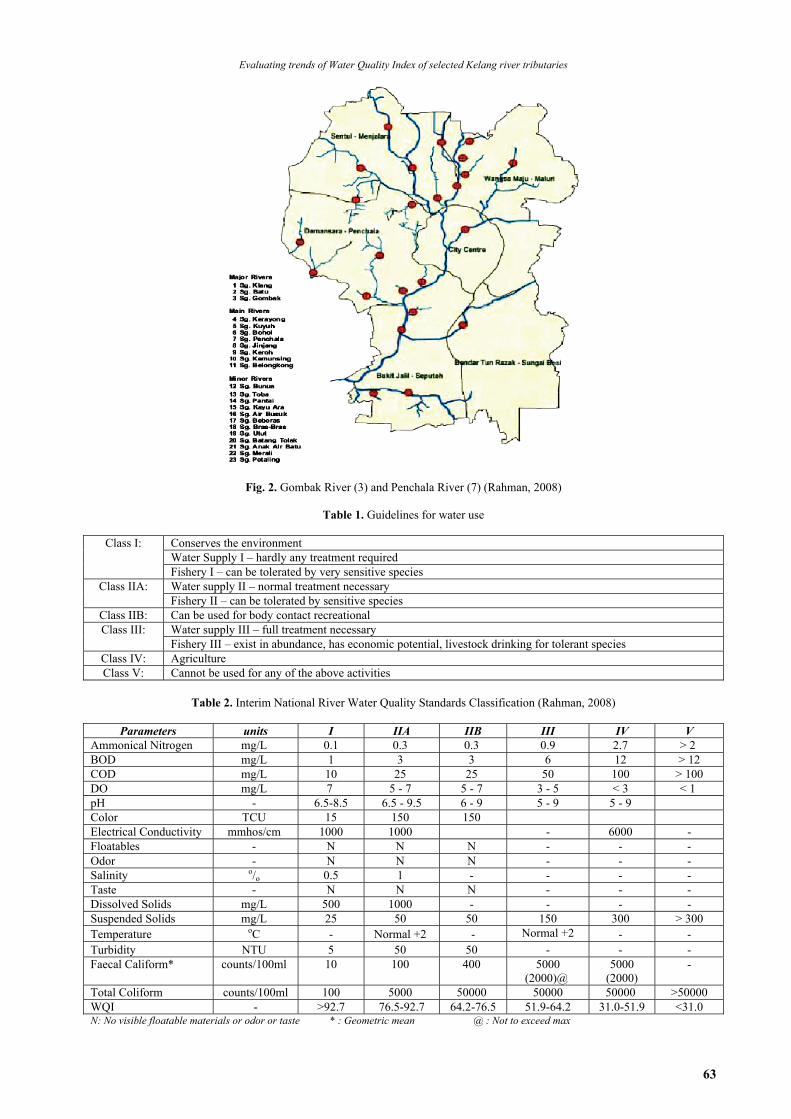
Fig. 2 shows the Gombak River (No. 3) and the Penchala River (No. 7). Several parts of the rivers have become concrete drains due to fast development. This has resulted in frequent flash floods in and around Kuala Lumpur recently. The Gombak River and the Penchala River can be considered short but they are highly polluted. The Gombak River meets the Kelang River right in the centre of Kuala Lumpur after having gone through forest land, residential areas and some light industrial areas. The Penchala River meets the Kelang River further downstream after having gone through mainly residential and industrial areas.
One of the methods to assess the health of any river is to monitor the Water Quality Index (WQI). Data on water quality are used to determine the status by examining to see whether it is clean, slightly polluted or polluted. Water quality index studies have
Ismail et al./Environmental Engineering and Management Journal 13 (2014), 1, 61-72
62
been conducted by several researchers (Gupta et al., 2003, Kannel et al., 2007, Said et al., 2004 Taner et al., 2011) for various water systems like streams, rivers, lagoons, lakes and coastal systems.
The quality of river water has been monitored by the Department of Environment (DoE) since the late seventies. The primary aim is to establish and detect any changes in the water quality status and identify pollution sources. Classification has continued on an annual basis by putting rivers in Class I, II, III, IV, or V based on the Interim National Water Standards for Malaysia (INWQS) and the WQI. The classifications are guidelines to water use as shown in Table 1.
In Malaysia, the Environmental Quality Act and several related regulations were established in 1970's. The Environmental Quality Act 1974 is an act which is concerned with the prevention, abatement, control of pollution and the protection of the environment. The Minister is empowered to elaborate regulations to prescribe water quality standards after consultation with the Environmental Quality Council. These apply to both surface and marine waters. The Environmental Quality (Sewage and Industrial Effluents) Regulations 1979 was established under this act to prescribe standards for discharges.
These regulations are pertinent and relevant to the management of standards for the protection of the environment. The National Water Quality Standards consist of standard values for 72 parameters which apply to 6 water use classes for surface water. This is shown in Table 2.
Individual or group of parameters may be used as an indicator of pollution status. A more accurate indicator is the Water Quality Index (Cude, 2001; Hamlat et al., 2013; Wang et al., 2013).
Selected chemical, biological and physical parameters are used. The aim is to gradually improve the water quality standards to achieve a better water class than the current. The purpose is not to meet the standards of the certain water class in all surface waters. As reported by DoE (2006) the six chemical, biological and physical parameters used to compute the Water Quality Index are dissolved oxygen (DO) as percentage saturation, biological oxygen demand (BOD) in mg/L, chemical oxygen demand (COD) in mg/L, ammonical nitrogen (NH3-N) in mg/L, total suspended solids (SS) in mg/L and pH. The sub-index of each parameter is calculated and the Water Quality Index is derived from the sum of agreed fractions of these sub-indices. The sub-indices are obtained from agreed empirical formulae.
Water Quality Index is developed in Table 3 as follows: water quality data are monitored at numerous stations throughout the country. As of 2003 there were 902 manual monitoring stations with ten automatic ones monitoring the relevant parameters from 462 rivers in 120 basins as reported by Rahman (2008). As of January 2006 there were already 1064 manual stations gathering a total of 5256 samples generating no less than 157,600 river water quality data per year from 143 basins as recorded by the Department of Environment (DoE, 2010).
Fig. 1. River Basins in Peninsular Malaysia [Kelang Basin(18)] (Rahman, 2008)
Evaluating trends of Water Quality Index of selected Kelang river tributaries
63
Fig. 2. Gombak River (3) and Penchala River (7) (Rahman, 2008)
Table 1. Guidelines for water use
Conserves the environment Water Supply I – hardly any treatment required
Class I:
Fishery I – can be tolerated by very sensitive species Water supply II – normal treatment necessary Class IIA: Fishery II – can be tolerated by sensitive species
Class IIB: Can be used for body contact recreational Water supply III – full treatment necessary Class III: Fishery III – exist in abundance, has economic potential, livestock drinking for tolerant species
Class IV: Agriculture Class V: Cannot be used for any of the above activities
Table 2. Interim National River Water Quality Standards Classification (Rahman, 2008)
Parameters units I IIA IIB III IV V
Ammonical Nitrogen mg/L 0.1 0.3 0.3 0.9 2.7 > 2 BOD mg/L 1 3 3 6 12 > 12 COD mg/L 10 25 25 50 100 > 100 DO mg/L 7 5 - 7 5 - 7 3 - 5 < 3 < 1 pH - 6.5-8.5 6.5 - 9.5 6 - 9 5 - 9 5 - 9 Color TCU 15 150 150 Electrical Conductivity mmhos/cm 1000 1000 - 6000 - Floatables - N N N - - - Odor - N N N - - - Salinity o/o 0.5 1 - - - - Taste - N N N - - - Dissolved Solids mg/L 500 1000 - - - - Suspended Solids mg/L 25 50 50 150 300 > 300 Temperature oC - Normal +2 - Normal +2 - - Turbidity NTU 5 50 50 - - - Faecal Caliform* counts/100ml 10 100 400 5000
(2000)@ 5000
(2000) -
Total Coliform counts/100ml 100 5000 50000 50000 50000 >50000 WQI - >92.7 76.5-92.7 64.2-76.5 51.9-64.2 31.0-51.9 <31.0 N: No visible floatable materials or odor or taste * : Geometric mean @ : Not to exceed max

Ismail et al./Environmental Engineering and Management Journal 13 (2014), 1, 61-72
64
Table 3. Derivation of WQI (Rahman, 2008)
WQI = 0.22xSIDO+ 0.19xSIBOD+ 0.16xSICOD+ 0.15xSIAN+ 0.16xSISS+ 0.12xSIpH,
where, SIDO = Sub-Index DO (in % saturation);
SIBOD = Sub-Index BOD; SICOD = Sub-Index COD;
SIAN = Sub-Index NH3N; SISS = Sub-Index SS;
SIpH = Sub-Index pH Best fit equations for the estimation of the sub-index values are:
Sub-index for DO (in % saturation):
SIDO = 0 for x<= 8
= 100 for x >= 92
= -0.395 + 0.030x2 - 0.00020x3 for 8 < x < 92 Sub-index for BOD:
SIBOD = 100.4 - 4.23x for x <=5
= 108* exp (-0.055x) - 0.1x for x > 5 Sub-index for COD:
SICOD = -1.33x + 99.1 for x <=20
= 103*exp (-0.0157x) - 0.04x for x >= 20 Sub-index for AN:
SIAN = 100.5 - 105x for x <= 0.3
= 94*exp (-0.573x) - 5 * | x - 2 | for 0.3 < x < 4
= 0 for x >= 4 Sub-index for SS:
SISS = 97.5*exp (-0.00676x) + 0.05x for x<= 100
= 71*exp (-0.0061x) - 0.015x for 100 < x < 1000
= 0 for x >=1000 Sub-index for pH:
SIpH = 17.2 - 17.2x + 5.02x2 for x < 5.5
= -242 + 95.5x - 6.67x2 for 5.5 <= x < 7
= -181 + 82.4x -6.05x2 for 7 <= x 8.75
= 536 - 77.0x + 2.76x2 for x >= 8.75 With an allocation of about RM 5 million ten
years ago it had reached about RM 25 million per year currently. The river water quality has been reported by WWW-Malaysia (2003) and the river water quality has also been benchmarked against similar water-ways around the region by Zainuddin (2010). The safety and security of river water is of paramount importance since it is by far the cheapest form of water supply source. In 1997, the river was classified as Class III based on the water quality parameters measured by DoE. Measurements made from 1999 to 2005 showed that despite efforts to improve the river water quality, very little improvement is shown. Polluting materials in rivers could not be maintained below the natural self-purification ability of the rivers. In the last few years there has been inadequate supply of water in the big cities, unexpected floods threatening human lives and properties.
The existing rivers cannot provide enough water for the approximately 5 million consumers in
the Kelang Valley. The growth in population, public and industrial sector activities and rural-urban migration over the last three decades has resulted in heavy demand for water. It is currently necessary to supplement water supplies from the Klau River dam in the state of Pahang to channel water several hundred kilometers to Selangor, Kuala Lumpur and Putrajaya. Environmental management becomes more complex as pointed out by Shafii (2010).
The cause of pollution of the rivers has been primarily attributed to indiscriminate dumping of rubbish, and effluents from industries like construction, iron and steel, saw-milling, battery production, petroleum refining and other operations, clearing of forest land for development, landfills, and overflows from broken manholes and septic tanks (Ismail et al., 2012a, 2012b; Ismail and Karim, 2012; Ismail et al., 2013a, 2013c, 2014a). Inefficient drainage systems also contribute to the problem. Physical, biological and other means have to be employed to treat the polluted water (Aziz and,

Evaluating trends of Water Quality Index of selected Kelang river tributaries
65
Kamaruddin, 2010; Ismail and Salim, 2012; Ismail and Bedderi, 2009; Ismail et al., 2014b; Shirazi et al., 2011b) to render it suitable for agricultural and domestic purposes (Shirazi et al., 2011a). Both surface and groundwater were affected (Baharuddin et al. 2013; Ismail et al., 2013b). Allocation of RM 50 billion equivalent to USD 17 billion has been made to clean-up the Kelang River. The initial stage of the project costing about RM 2 billion will start early in 2011 as reported by Tan (2010). 2. River care strategy
There are several factors from different
methods and approaches which determine the success or otherwise of a river management system in the maintenance of the river water quality. 2.1. Human approach
Holmes (1999) observed that lack of finance
and inadequate policy can restrict the progress of a river restoration project. Government can ensure that restoration projects are credible by requiring recipients of federal funds to adhere to the accepted standards. Requirements must be established for monitoring outcomes and tracking agency performance through an information management system as developed by Antohe and Stanciu (2009) and Belaton et al. (2004).
There is also a need to promote the use of proven methods, and to provide basic data needed for planning and implementation. Standards and guidelines need to incorporate basic standards through revision of manuals and design criteria. Reformed programs must be met before grants or contracts are awarded as suggested by Palmer and Allan (2006).
The different roles and functions of agencies and authorities can upset each other’s planned schemes. The Department of Environment may have the powers to control pollution of water resources but the approval of development projects may still be under the prerogative of another authority. In the case of water supply, coordination and integrated management approach must be practiced and the catchment areas must be under the jurisdiction of the State Governments to ensure effective control of the water quality as suggested by Pillay and Talha (2003).
Citizens participate more effectively in collective efforts when they are involved in policy design and decisions. This has been observed by Folz and Hazlett (1991) and by Folz (1999) in the case of a product recycling project. Continuous motivation and incentives to participate in the programs have been proven to be important management processes (Barjoveanu et al., 2004). These have been demonstrated in reycling and reuse projects (Maghrebi et al., 2010; Teodosiu et al., 2003) and studies on the water quality of the Jajhood River (Galatchi et al., 2006).
Past communities depended heavily on rivers for drinking, cultivation and transport. The value and importance of rivers have been lost, residents are denied usage of the river, and stretches of rivers are inaccessible to the people. Rivers can be more reachable to the people if proper walkways and parking lots are provided as suggested by Mohkeri and Parish (2003). Traditional culture to safeguard against threat of rivers which people have forgotten can be regained. More stringent amendments are needed for the Environmental Quality (Sewage and Industrial Effluents) Regulations ((1979) for water courses discharging water into catchment areas. A coordinated tracking system for restoration projects must be implemented. Effective communication is also required between experts like engineers, hydrologists and geologists. Goog communication must also exist between the experts and the public like resident associations and non-governmental organizations (Ismail and Sulaiman, 2009).
Lack of a sense of urgency and commitment among stakeholders in solving problems seem to be one of the main hurdles in carrying out community projects. Relationship and trust have to be developed and nutured. This human process can take a long time. One cannot expect results on an immediate basis. The interest and rapport within the group of stakeholders need to be maintained all the time. . There must be efforts to find the the required driving force and the appropriate moves to forge a good partnership and understanding between the community and the authority. In order to get better public involvement, professional expertise, needs to be tapped, and early successful results can be exploited by the media to the maximum advantage (Falk, 1992).
The mass media can assume an effective and important role in giving reports and disseminating information on clean-up activities locally and around the world. Diseases related to water pollution can be highlighted, and their causes and prevention can be discussed. Activities and views of NGOs can also be published. There are many NGOs which are already working towards the betterment of river environments. However, many members of the public are not aware of what they are exactly doing. Local daily newspapers can publish opinions from professional on the general state of the environment on a regular basis. The media can focus not only on what the authority can do but also on what the community can contribute from their daily activities to protect and preserve the river environment. 2.2. Systems approach
Most of the time, urban rivers cannot cope with the total load from the factory as well as other factories in the same industrial area. This is true for the Gombak River and the Penchala River which are described by Mohamed (1993) as streams.
The management of the rivers for drinking water supply becomes a problem. A master plan containing

Ismail et al./Environmental Engineering and Management Journal 13 (2014), 1, 61-72
66
project policy and planning, list of projects and other matters is needed to ensure a comprehensive administrative system. This can avoid investment risk through minimal coordination. An effective national communication system which can track and monitor basic information on prioritized activities that are being organized.
2.3. Regulatory approach
Compliance to laws and regulations is a common instrument used to combat environmental pollution. Teodosiu et al. (2009) suggest the adoption of the EU principle of polluter pays to be enforced in order to get operators complying with the regulatory requirements. However, experience have shown that significant failures have resulted when standards have been set too lenient or if they are set too stringent that they cannot be afforded for economic reasons as observed by Novotny and Somlyody (1995) in the case of water quality management. When new regulations or amendments are introduced adequate time should be given for operators to achieve compliance, and demonstrate continual progress.
The Environmental Quality Act (EQA, 1974) stipulates that any project development having a budget bigger than a certain amount is required to conduct an EIA study. Some developers purposely stay within the size limits to avoid having to conduct this study. It is proposed that provisions for sanctions on issues that do not fully meet the required condition can be negotiated as suggested by Schnelle and Brown (2002). New investors can thus be encouraged to continue while tightening the standards can be scheduled over a period of time. Certain projects no matter the size require EIA to be conducted and this must be religiously implemented to ensure the well-being of the Gombak River, the Penchala River and other similar rivers.
2.4. Technical approach
Silt and waste materials entering the river
system will settle and accumulate at the bottom of the river bed. Bacteria and pathogenic materials and other life forms flourish and later die and decay. Accumulated sediment can be removed from the river by dredging. Aeration and oxygen circulation can also reduce disease causing bacteria by exposing pathogenic bacteria to sunlight as noted by Laing and Rausch (1993).
Control of activities in the upper and middle reaches of the river becomes important after the deepening and desilting has been done. Another remediation method is by using living plants, or plants combined with dead or organic materials to maximize erosion control and to form permanent turf reinforcement. Cover for fish breeding can be achieved and rehabilitation efforts can be enhanced by introducing boulders, old tires and logs.
2.5. Adopted approaches
Community-based groups like Residents Associations have been formed to discuss and carry out cleaning up activities for the Gombak River and the Penchala River. A non-Governmental organization, Global Environment Centre (GEC), has also been volunteering to run programs for school children to instill a love for the rivers and educate them to care for the river’s well-being. Under the GEC, a River Care Fund (RCF) has started to build the capacity of these community groups to disseminate information through the building of community skills on river monitoring and reporting and creating local action groups.
There have been several river restoration projects undertaken and several approaches that have been taken to improve the pollution situation of the two rivers. The public has been encouraged to be continually motivated and incentives to participate in community programs has been forthcoming (Ismail and Sulaiman, 2009). Many NGOs are working towards the betterment of the river environment. Local daily newspapers publish opinions from professional on the general state of the environment. The public has been directly involved in the policy and decision-making regarding their community. The authorities have been monitoring, communicating and coordinating on the restoration projects.
Aeration facilities have been installed at the middle region of Gombak River which is at the industrial area of the river. River deepening and desilting to remove accumulated sediment has also been done. Plants and overhanging riparian vegetation have been planted. More organic instead of inorganic fertilizers has been applied to golf courses. Some oil and grease traps at food outlets have also been installed. The main objectives of the proposal to clean-up the Gombak River and the Penchala River are to upgrade water quality classification, beautify the river, prevent potential threats to health, create a sense of ownership among the river community, and to review environmental regulations in preventing excessive discharges with overwhelming industrial effluent loading.
2.6. Clean-up proposal
The effectiveness of the EIA implementation needs to be examined to ensure the well-being of the Gombak River and the Penchala River and other similar rivers. In the clean-up proposal for the Kelang River, similar allocations must be made also for its tributaries like the Gombak River, the Penchala River and other similarly distressed tributaries of this main river. Environmental reporting can be made mandatory for industries.
An effective tracking and monitoring has to be systematically organized. Ensure prevention approach is simple as suggested by Muller and Hahn (1995) and strive for an effective and sound sewage treatment projects and work with authorities as well

Evaluating trends of Water Quality Index of selected Kelang river tributaries
67
as local or state municipalities to identify financing schemes that are consistent with the existing institutional structure and flow of capital into these projects.
3. Material and methods
Reports from DoE on the WQI on dates and from the various monitoring stations taken over regular time intervals collected from 1997 to 2005 at three sampling stations referred to as 1K17, 1K18 and 1K24 along the Gombak River and one along the Penchala River referred to as 1K14 are analyzed. The location of the study area is given in Fig. 2. For the nine-year period the total count, the maximum, the minimum, the mean and standard deviation values of the parameters making up the WQI namely dissolved oxygen, biological oxygen demand, chemical oxygen demand, total suspended solids, pH, ammoniacal nitrogen and the WQI for each river are recorded and calculated.
The values over the years of the study period from 1997 to 2005 are then plotted with months as the time unit and 1st January 1997 is taken as zero hour. The graphs for these parameters and the WQI for the Gombak River and the Penchala River are given in Fig. 3 to Fig. 9. Since the parameters are moving steadily to stable levels, it is reasonable to assume exponential or logarithmic relationships over the study period. Logarithmic trends over the years are obtained for the parameters and the WQI. 4. Results
The summary of the data for Gombak River is given in Table 4a indicating also the Classification based on each individual parameter. The summary of the corresponding data for Penchala River together with the Classification based on similar individual parameters is given in Table 4(b). Various models namely, the logarithm model, the power law model,
the polynomial model and the linear model were tried to fit the data for the observation of any trends. For all the parameters, it was found that the logarithm model fitted the data best. Fig. 3a shows the graph of the dissolved oxygen in percentage saturation with standard deviation of 22.0% for the Gombak River over the study period. The trend equation is given with the plot for each parameter where, ‘g’ denotes Gombak River ‘p’ denotes Penchala River and ‘T’ is time in months. Fig. 3b shows the corresponding graph for Penchala River with standard deviation of 15.62%.
The biological oxygen demand in mg/L for the Gombak River is shown in Fig. 4a, with standard deviation of 6.34 mg/L. over the study period. Fig. 4b shows the corresponding graph for Penchala River with standard deviation of 18.51 mg/L.
The chemical oxygen demand for the Gombak River is shown in Fig. 5a, with standard deviation of 16.95 mg/L over the study period. Fig. 5b shows the corresponding graph for Penchala River with standard deviation of 34.84 mg/L. Fig. 6a shows the graph of the total suspended solids in mg/L for the Gombak River with standard deviation of 240.72 mg/L. over the study period. Fig. 6b shows the corresponding graph for Penchala River with standard deviation of 95.69 mg/L.
The varation of pH for the Gombak River is illustrated in Fig. 7a, with a standard deviation of 4.18 over the study period. Fig. 7b shows the corresponding graph for Penchala River with standard deviation of 1.67. Fig. 8 (a) shows the graph of ammoniacal nitrogen in mg/L for the Gombak River with standard deviation of 2.69 mg/L over the study period. Fig. 8b shows the corresponding graph for Penchala River with standard deviation of 2.77 mg/L. Water Quality Index is shown in Fig 9a for the Gombak River with standard deviation of 15.75 units over the study period, while for Penchala River it is shown in Fig. 9b, with standard deviation of 152.59 units.
Table 4. Summary of data for Gombak River (a) and Penchala River (b)
a)
Factor DO %Sat BOD mg/L COD mg/L SS
mg/L pH unit
AN mg/L
WQI unit
Count 263 264 263 263 263 263 263 Maximum 109 45 105 2370 7.89 14.7 95 Minimum 4 1 4 1 5.71 1.01 28 Mean 69 7.15 32.8 145.5 7.07 2.45 68.1 Std Dev 22.0 6.34 16.95 240.72 4.18 2.69 15.75 Class II II IIB II/III I III III
b) Count 159 159 159 159 159 159 159 Maximum 81 81 191 659 10.88 21.28 70 Minimum 0 2 6 6 2.11 0.01 7 Mean 16 28 82.8 95.2 6.25 4.92 34.1 Std Dev 15.62 18.51 34.84 95.69 1.67 2.77 12.59 Class IV V III IIB IIB V IV

Ismail et al./Environmental Engineering and Management Journal 13 (2014), 1, 61-72
68
a. b.
Fig. 3. a) Dissolved Oxygen (% Saturation) for Gombak River; b) Dissolved Oxygen (% Saturation) for Penchala River
a. b.
Fig. 4. a) Biological oxygen demand for Gombak River; b) Biological oxygen demand for Penchala River
a. b.
Fig. 5. a) Chemical oxygen demand for Gombak River; b) Chemical oxygen demand for Penchala River
a. b.

Evaluating trends of Water Quality Index of selected Kelang river tributaries
69
Fig. 6. a) Total suspended solids for Gombak River; b) Total suspended solids for Penchala River
a. b.
Fig. 7. a) pH for Gombak River; b) pH for Penchala River
a. b.
Fig. 8. a) Ammoniacal nitrogen for Gombak River; b) Ammoniacal nitrogen for Penchala River
a. b.
Fig. 9. a) Water Quality Index for Gombak River; b) Water Quality Index for Penchala River
5. Discussion A quick glance at the classifications based on
individual parameters of the two rivers it can be observed that the Penchala River is in a worse polluted condition than the Gombak River (Table 4a and 4b). It can also be observed that the critical parameters are biological oxygen demand and
ammoniacal nitrogen. This can be attributed to the fact that the Penchala River passes through a generally denser populated area than the Gombak River. From Fig. 3 it can be observed that the Penchala River shows a slightly faster rate of dissolved oxygen improvement compared to Gombak River, but the absolute values keep it firmly in Class IV. The less favorable initial values for Penchala

Ismail et al./Environmental Engineering and Management Journal 13 (2014), 1, 61-72
70
River make the rate of improvement more apparent. Together with the WQI, dissolved oxygen has been successfully used to assess river water quality (Kannel et al., 2007).
Fig. 4 reveals that the Penchala River shows about four times faster rate of biological oxygen demand improvement compared to Gombak River but the absolute values still keep it in Class V.
From Figs. 5a and 5b it is seen that the Penchala River has a slight improving trend for the chemical oxygen demand improvement compared to Gombak River, which shows a slight deteriorating trend but the absolute values for Penchala River place it in Class III while Gombak River is in Class IIB. Again this apparent good performance is due to the less favorable initial conditions for the Penchala River. Figs. 6a and 6b show that the Gombak River has a faster rate of total solids improvement compared to Penchala River but based on the absolute values of this parameter Gombak River is placed in Class IIB while Pencala River is classified in Class II. Again this is due to the different initial conditions.
Fig. 7 demonstrates that the values of pH for Gombak River remained fairly constant with little variation. Values for the Penchala River are quite unpredictable, especially over the first half of the study period, with an overall average which is slightly acidic. Based on this parameter Gombak River is in the Class I, while Penchala River is in Class IIB. From Figs. 8a and 8b it can be observed that the Penchala River shows a slight improving trend for the ammoniacal nitrogen compared to Gombak River which shows a slight deteriorating trend but the absolute values for Penchala River place it in Class V while Gombak River is placed in Class III. The denser population around the Penchala River contributes to these higher values.
Both the Gombak River and the Penchala River show improvements in the Water Quality Index over the study period from 1997 to 2005 (Figs. 9a and 9b). The Penchala River shows a rate of WQI improvement of about one-and-a-half times faster compared to the Gombak River but based on the absolute values of the WQI the Gombak River is placed in Class III while the Penchala River is classified in Class IV. The critical parameters to keep a close watch for are ammoniacal nitrogen and biological oxygen demand.
It is shown that the efforts at cleaning-up the Gombak River or the Penchala River up till now can be considered as a soft approach. The efforts at de-silting the river beds, for instance, have been sporadic and desultory. There have not been any concerted efforts to systematically clean-up the rivers. Over the study period of nine years there has been no indication of long-lasting satisfactory results from this soft approach.
A harder direct clean-up approach has to be applied with the necessary allocation in tandem with the main Kelang River clean-up project which must
also include other tributaries which are in a similar environmental distress.
6. Conclusions
The river water quality has shown little
improvement. The WQI for the Gombak River was 56 units at the beginning and improved at a rate of 0.130 WQI units / month. Corresponding values for the Penchala River was 25 units and 0.116 units / month with BOD and ammoniacal nitrogen as critical factors. The water quality improved during the period 1999 to 2005 but deteriorated in 2004.
Awareness and attitude change is a priority to be instilled in the authorities and the community. The entire improvement process can take decades, but gradual progress is better than no progress at all.
Acknowledgement The authors express their gratitude to the staff of the Department of Environment for their discussion and general assistance, and to the Civil Engineering Department, University of Malaya for providing the research facilities
References Antohe V., Stanciu C., (2009), Modeling and simulation of
quality indicators of surface water, Environmental Engineering and Management Journal, 8, 1421-1427.
Aziz R.A., Kamaruddin M.H., (2010), Water quality study of Melaka River using WQI remote sensing and GIS, Map Asia 2010 & ISG, Online at: http://www.mapasia.org/2010/proceeding/pdf/125.pdf.
Baharuddin M.F.T., Ismail Z., Othman S.Z., Taib S., Hashim R., (2013), Use of time-lapse resistivity tomography to determine freshwater lens morphology, Measurement, 46, 964-975.
Barjoveanu G., Teodosiu C., Jørgensen M.S., (2004), Sustainable development assessment: application to the Prut river basin, Environmental Engineering and Management Journal, 3, 827-844.
Belaton B., Talib A.Z.H., Ismail A.I.M., (2004), Development of a River Water Quality Management Information System, Proc. Reg. Conf. Ecological and Environmental Modeling, Penang, Malaysia, On line at: http://eprints.usm.my/431/1/Development_Of_A_River_Water_Quality_Management_Information_System.pdf.
Cude G.C., (2001), Oregon water quality index a tool for evaluating water quality management effectiveness, Journal of the American Water Resources Association, 37, 125–137.
DoE, (2006), Environmental Report: River water quality monitoring program, Department of Environment, Ministry of Natural Resources and Environment, Government of Malaysia.
DoE, (2010), Benchmarking River Water Quality Monitoring, Department of Environment, Ministry of Natural Resources and Environment, Government of Malaysia, On line at: http://irep.iium.edu.my/2954/1/Feature-BenchmarkingRiverWater3pp.pdf
EQA (1974), Environmental Quality Act Government of Malaysia, Environmental Quality (Sewage and Industrial Effluents), Government of Malaysia

Evaluating trends of Water Quality Index of selected Kelang river tributaries
71
Falk N., (1992), Voluntary Work and the Environment: Local Environmental Development Initiatives in Europe, European Foundation for the Improvement of Living and Working Conditions, European Commission, On line at: http://www.bookdepository.co.uk/Voluntary-Work-Environment-European-Foundation-for-Improvement-Living-%26-Working-Conditions/9789282636503
Folz D.H., (1999), Recycling policy and performance: trends in participation, diversion, and costs, Public Works Management Policy, 4, 131-142.
Folz D.H., Hazlett J.M., (1991), Public participation and recycling performance: explaining program success, Public Administration Review, 51, 526-533.
Galatchi L-D., Dobrinas S., Chirila E., (2006), Threats on the seaside lakes water and their acute and long-term consequences, Environmental Engineering and Management Journal, 4, 169–176.
Gupta A.K., Gupta S.K., Patil R.S., (2003), A comparison of water quality indices for coastal water, Journal of. Environmenyal Science and Health, A 38, 2711–2725.
Hamlat A., El-Bari Tidjani A., Yebdri D., Errih M., Guidoum A., (2013), Water quality analysis of reservoirs within Western Algeria catchment areas using water quality index CCME WQI, Journal of Water Supply: Research and Technology, doi:10.2166/aqua.2013.226.
Holmes N.T.H., (1999), The river restoration project and its demonstration sites. In de Waal L.C., Wade P.M., Large A., (Eds.), Rehabilitation of Rivers: Principles and Implementation, John Wiley & Sons, 133-148.
Ismail Z., Abdullah S.Z., Primasari B., Shirazi S.M., Karim R., (2014a), Issues and public awareness of landfills in Malaysia with a focus on post-closure development, Environmental Engineering and Management Journal, On line at: http://omicron.ch.tuiasi.ro/EEMJ/pdfs/accepted/353_64_Ismail_11.pdf.
Ismail Z., Othman S.Z., Law K.H., Sulaiman A.H., Hashim R., (2014b), Comparative performance of water hyacinth and water lettuce in preventing build-up of nutrients in municipal wastewater, CLEAN – soil, air and water, doi: 10.1002/clen.201200254.
Ismail Z., Abdullah S.Z., Othman S.Z., Shirazi S.M., Karim R. (2013a), Assessment of the relative adequacy of landfills as a means of solid waste disposal in Malaysia, CLEAN – soil, air, water, 41, 1122-1128.
Ismail Z., Salim K., Othman S.Z., Ramli A.H., Shirazi S.M., Karim R., Khoo S.Y., (2013b), Determining and comparing the levels of heavy metal concentrations in two selected urban river water, Measurement, 46, 4135-4144.
Ismail Z., Tai J.C., Kong K.K., Law K.H., Shirazi S.M., Karim R., (2013c), Using data envelopment analysis in comparing the environmental performance and technical efficiency of selected companies in their global petroleum operations, Measurement, 46, 3401-3413.
Ismail Z., Bedderi A.M., (2009), Potential of water hyacinth as heavy metal removal agent from refinery effluents, Journal of Water, Air and Soil Pollution, 199, 57-65.
Ismail Z., Karim R., (2012), Some aspects of spills in the sea transportation of petroleum materials, Safety Science, 51, 202-208
Ismail Z., Doostdar S., Harun Z., (2012a), Factors influencing the implementation of a safety
management system for construction sites, Safety Science, 50, 418-423.
Ismail Z., Ramli A.H., Somarin S.D., (2012b), Lessons
learnt from accidents in downstream petroleum product processing and handling, Oil Gas European Magazine, 38, 157-162.
Ismail Z., Salim K., (2012), Determination of critical factors in implementing river clean-up projects: a Malaysian case study, CLEAN- Soil, Air and Water, 41, 16-23.
Ismail Z., Sulaiman R., (2009), Managing river water quality index: A Malaysian case study, Asian Journal of Water, Environment and Pollution, 6, 79-86.
Kannel P.R., Lee,S., Lee Y.S., Kanel S.R., Khan S.P., (2007), Application of water quality indices and dissolved oxygen as indicators for river water classification and urban impact assessment, Environmental Monitoring and Assessment, 132, 93–110.
Laing R.L., Rausch C.J., (1993), Aeration and pollutant abatement in the Helpe Mineure River, Fourmies, France, Lake and Reservoir Management, 9, 98-102.
Maghrebi M., Tajrishy M., Jamshidi M., (2010), Assessment of Jajrood River watershed microbial pollution: sources and fates, Environmental Engineering and Management Journal, 9, 385-391.
Mohamed M., (1993), Problems in management of rivers for drinking water supply, Proc. Int. Symp. on Management of Rivers for the future, 4B, 1-4.
Mohkeri S., Parish F., (2003), Needs and strategies for river restoration, Proc. 13th Conf. Water and Drainage, Kuala Lumpur.
Muller N., Hahn H.H., (1995), Factors affecting water quality of large rivers – Past experiences and future outlook. Remediation and management of degraded river basins with emphasis on Central and Eastern Europe. Proc. NATO Adv. Res. Workshop, Heidelberg, Germany, Springer Verlag.
Novotny V., Somlyody L., (1995), Water Quality Management: Western Experiences and Challenges for Central and Eastern European Countries. Remediation and Management of Degraded River Basins with Emphasis on Central and Eastern Europe. Proc. NATO Adv. Res. Workshop, Heidelberg, Germany, Springer Verlag.
Palmer M.A., Allan J.D., (2006), Restoring rivers, Issues in Science and Technology, 22, 40-48.
Pillay M.S., Talha M.Z.M., (2003), Drinking water quality issues, Proc. 13th Conf. Water and Drainage, Kuala Lumpur.
Rahman Z.A., (2008), Status of river basin water quality, DoE, On line at: http://www.iges.or.jp/jp/ltp/pdf/wwf3/fr2.pdf.
Said A., Stevens D.K., Sehlke G., (2004), An innovative index for evaluating water quality in streams, Environmental Management, 34, 406–414.
Schnelle K.B., Brown C.A., (2002), Air Pollution Control Technology Handbook, CRC Press, Boca Raton, Florida.
Shafii F., (2010), Status of Sustainable Building in South East Asia, Institute Sultan Iskandar of Urban Habitat, Report SB08, Melbourne.
Shirazi S.M., Ismail Z., Akib S., Sholichin M., Islam M.M.A., (2011a), Climatic parameters and Net Irrigation Requirement of Crops. International Journal of Physical Sciences, 6, 15-26.
Shirazi S.M., Kuwano J., Kazama H., Wiwat S., Ismail Z., (2011b), Response to Swelling and Permeability of

Ismail et al./Environmental Engineering and Management Journal 13 (2014), 1, 61-72
72
Bentonite using Saline Solution for Nuclear Waste Disposal, Disaster Advances, 4, 41-47.
Tan C., (2010), Kelang River to clean-up soon, The Star online, On line at: http://thestar.com.my/news/story.asp?file=/2010/3/14/nation/5861915&sec=nation.
Taner M.U., Ustun B., Erdincler A., (2011), A simple tool for the assessment of water quality in polluted lagoon systems: A case study for Kucukcekmece Lagoon, Turkey, Ecological Indicators, 11, 749–756.
Teodosiu C., Barjoveanu G., Teleman D., (2003), Sustainable water resources management: river basin management and the EC Water Framework Directive, Environmental Engineering and Management Journal, 2, 377-394.
Teodosiu C., Cojocariu C., Musteret C.P., Dascalescu I.G., Caraene I., (2009), Assessment of human and natural
impacts over water quality in the Prut river basin, Romania, Environmental Engineering and Management Journal, 8, 1439-1450.
Wang W.K., Yang Z.Y., Kong J.L., Cheng D.H., Duan L., Wang Z.F., (2013), Ecological impacts induced by groundwater and their thresholds in the arid areas in Northwest China, Environmental Engineering and Management Journal, 12, 1497-1507.
WWF-Malaysia, (2003), Our water sources, On line at: http://www.wwf.org.my/media_and_information/learning_sharing/freshwater_main/.
Zainuddin Z., (2010), Benchmarking river water quality in Malaysia, Jurutera, February, On line at: http://zakizainudin.blogspot.com/2010/10/benchmarking-river-water-quality-in.html.


![Easy preparation of ultrathin reduced graphene …repository.um.edu.my/97457/1/2015 easy.pdfCERAMICS INTERNATIONAL Available online at Ceramics International ] (]]]]) ]]]–]]] Easy](https://img.pdfslide.net/doc/110x75/5ad8c29f7f8b9af9068debcc/easy-preparation-of-ultrathin-reduced-graphene-easypdfceramics-international.jpg)