Embed Size (px)
Citation preview
______________________________________________________________ DOI: https://doi.org/10.33258/birci.v4i3.2386 5876
Evaluation Analysis of OCR and GFR Relay Protection
Coordination on Feeder YB-02 PT PLN ULP Natal
with ETAP Simulation
Zuraidah Tharo1, Siti Anisah2, Fariz Aditya Putra3, Melly Andriana4
1,2,3,4Faculty Program Study Electrical Engineering, Faculty of Science and Technology, Universitas
Pembangunan Panca Budi, Indonesia
[email protected], [email protected], [email protected],
I. Introduction
Electrical energy is one of the most vital needs in the modern era like now. In this case,
PT. PLN (Persero) as the company authorized to supply electrical energy needs to provide
guaranteed electrical energy. The provision of electrical energy is carried out by an electric
power system which includes a generation system, transmission system, and distribution
system. To ensure continuity of electrical energy service, a high level of reliability is required
for each element of the electric power system.
The distribution system is the part of the electric power system that is closest to the
customer, so a disturbance in the distribution system will have a direct impact on the
customer. Disturbances in the electric power system can cause equipment to become
damaged so that it interferes with service to consumers or customers. payment methods used
namely the retrospective payment method and the prospective payment method (Herianti,
2020). Saputra (2018) statet that implications for the need to develop financing standards that
include standardization of education cost components covering operational costs, investment
costs and personal costs. Therefore, it is necessary to make efforts to secure the electric
power system so that the reliability in the supply of electricity goes well. For this reason, it is
necessary to design a security system in the distribution system.
In 2020 the Panyabungan Substation operates to supply PLN ULP Natal which
previously received supplies from the Panyabungan Substation. With the change in supply,
PLN ULP Natal made changes to the network configuration in order to maintain the
reliability of the distribution system in distributing electrical power to the community.
One of the most important things to pay attention to is the change in the configuration
of the feeder network, namely the coordination between security equipment in the
Abstract
With the increasing number of customers of PT. PLN (Persero) ULP Natal, disruption to the distribution system will result in more widespread blackouts. To avoid this, the protection system in the distribution channel (especially in the YB-02 feeder) needs to be evaluated to ensure proper coordination. The protection systems are outgoing PMT, Recloser L-01 and Recloser L-02. The method used in this study is a method of observation, literature study, interviews and guidance. From this study, it was found that the coordination conditions between PMT Outgoing, Recloser L-01 and Recloser L-02 were correct and their capabilities could be improved by calculating the OCR and GFR relay settings. The coordination between PMT Outgoing.
Keywords
distribution protection;
coordination and protection
settings; OCR; GFR; recloser;
PMT
Budapest International Research and Critics Institute-Journal (BIRCI-Journal)
Volume 4, No 3, August 2021, Page: 5876-5893 e-ISSN: 2615-3076(Online), p-ISSN: 2615-1715(Print)
www.bircu-journal.com/index.php/birci email: [email protected]
5877
distribution security system. Coordination between safety equipment in a distribution security
system is very important to determine the reliability of a feeder to secure distribution system
equipment and/or localize faults. To determine a setting or coordination of safety equipment
against interference, it is necessary to know the amount of short-circuit current in the
distribution network. With the increasing number of customers every year, it will certainly
affect the number of customers who experience blackouts due to disturbances. Therefore, an
action is needed to maintain the security settings and coordination in order to maintain its
reliability.
II. Research Methods
This research will be conducted at PT PLN (Persero) ULP CHRISTMAS UP3
Padangsidimpuan North Sumatra Region. This research was conducted in May 2020 until the
end of July 2020.
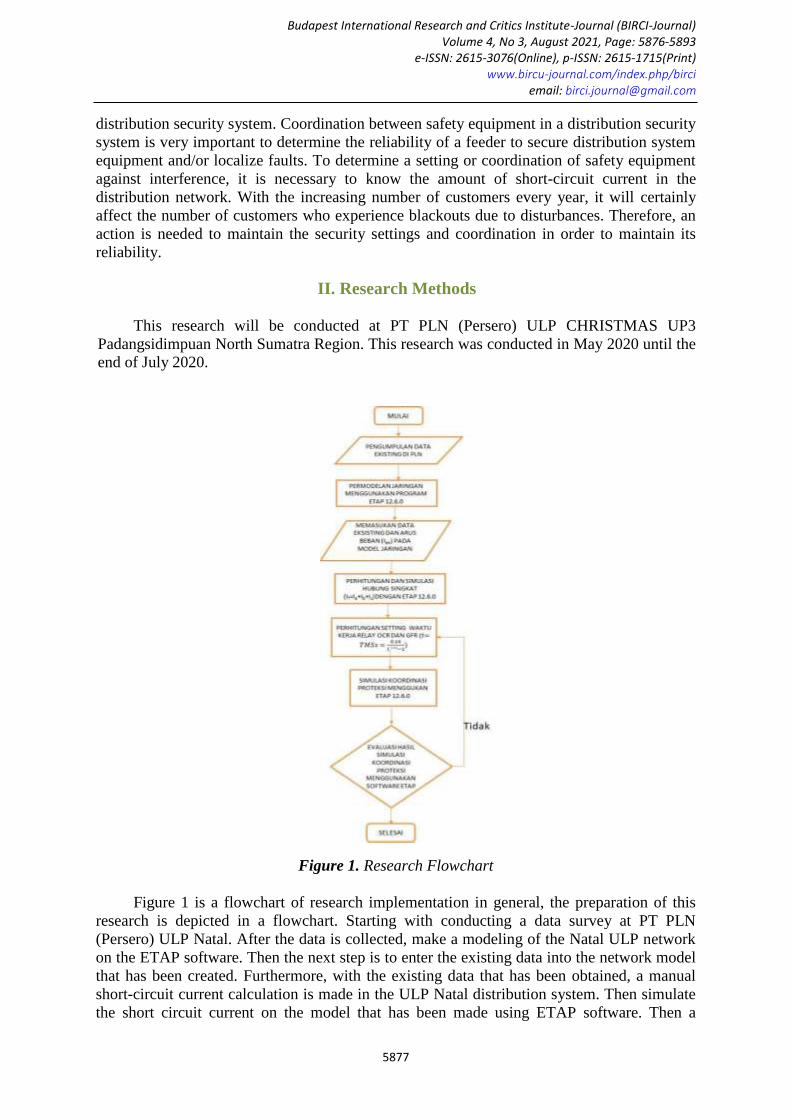
Figure 1. Research Flowchart
Figure 1 is a flowchart of research implementation in general, the preparation of this
research is depicted in a flowchart. Starting with conducting a data survey at PT PLN
(Persero) ULP Natal. After the data is collected, make a modeling of the Natal ULP network
on the ETAP software. Then the next step is to enter the existing data into the network model
that has been created. Furthermore, with the existing data that has been obtained, a manual
short-circuit current calculation is made in the ULP Natal distribution system. Then simulate
the short circuit current on the model that has been made using ETAP software. Then a
5878
comparison of the results of manual calculations with the ETAP simulation is carried out.
After the short circuit current has been simulated, the OCR and GFR relay protection settings
are made manually then the results of these calculations are input into the ETAP network
modeling that has been made. Furthermore, a simulation of the coordination of OCR and
GFR relay protection is carried out in securing short-circuit disturbances that occur in the
ULP Natal distribution system network. Evaluation of the simulation results of the OCR and
GFR relay coordination on the existing results of the resetting that has been made.
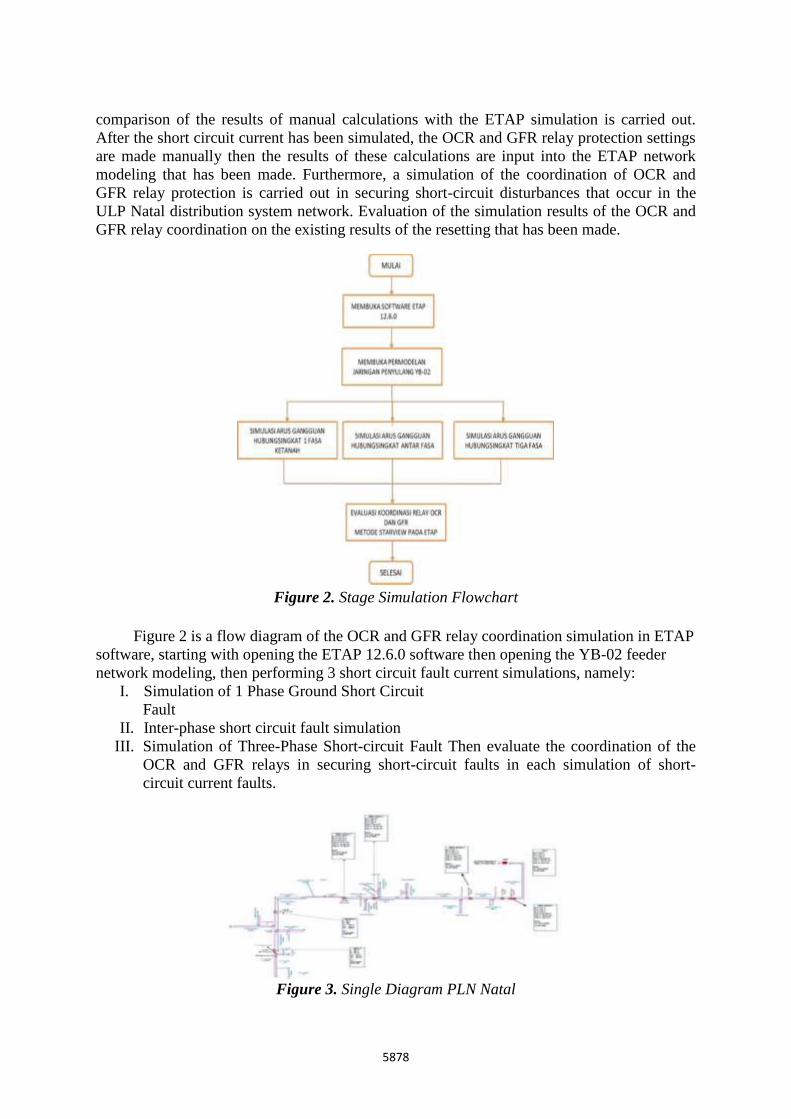
Figure 2. Stage Simulation Flowchart
Figure 2 is a flow diagram of the OCR and GFR relay coordination simulation in ETAP
software, starting with opening the ETAP 12.6.0 software then opening the YB-02 feeder
network modeling, then performing 3 short circuit fault current simulations, namely:
I. Simulation of 1 Phase Ground Short Circuit
Fault
II. Inter-phase short circuit fault simulation
III. Simulation of Three-Phase Short-circuit Fault Then evaluate the coordination of the
OCR and GFR relays in securing short-circuit faults in each simulation of short-
circuit current faults.
Figure 3. Single Diagram PLN Natal
5879
From the Single Line Diagram ULP Natal data above, it can be seen that the
distribution network equipment used is a power transformer at a 60 MVA substation, a 16-
250 kVA distribution transformer, a circuit breaker, a recloser, a load breaker switch, a
disconnecting switch, conductor wire and its type and length.
III. Discussion
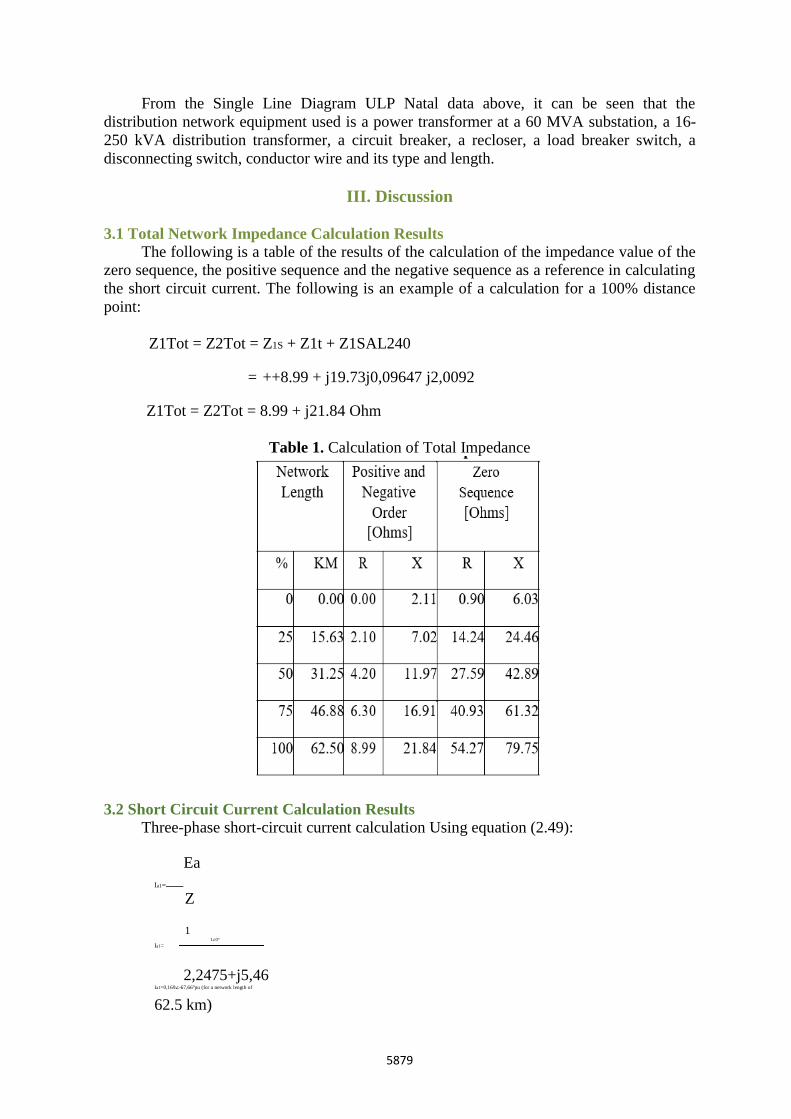
3.1 Total Network Impedance Calculation Results
The following is a table of the results of the calculation of the impedance value of the
zero sequence, the positive sequence and the negative sequence as a reference in calculating
the short circuit current. The following is an example of a calculation for a 100% distance
point:
Z1Tot = Z2Tot = Z1S + Z1t + Z1SAL240
= ++8.99 + j19.73j0,09647 j2,0092
Z1Tot = Z2Tot = 8.99 + j21.84 Ohm
Table 1. Calculation of Total Impedance
3.2 Short Circuit Current Calculation Results
Three-phase short-circuit current calculation Using equation (2.49):
Ea
Ia1=
Z
1 1∠0°
Ia1=
2,2475+j5,46 Ia1=0,169∠-67,66°pu (for a network length of 62.5 km)
5880
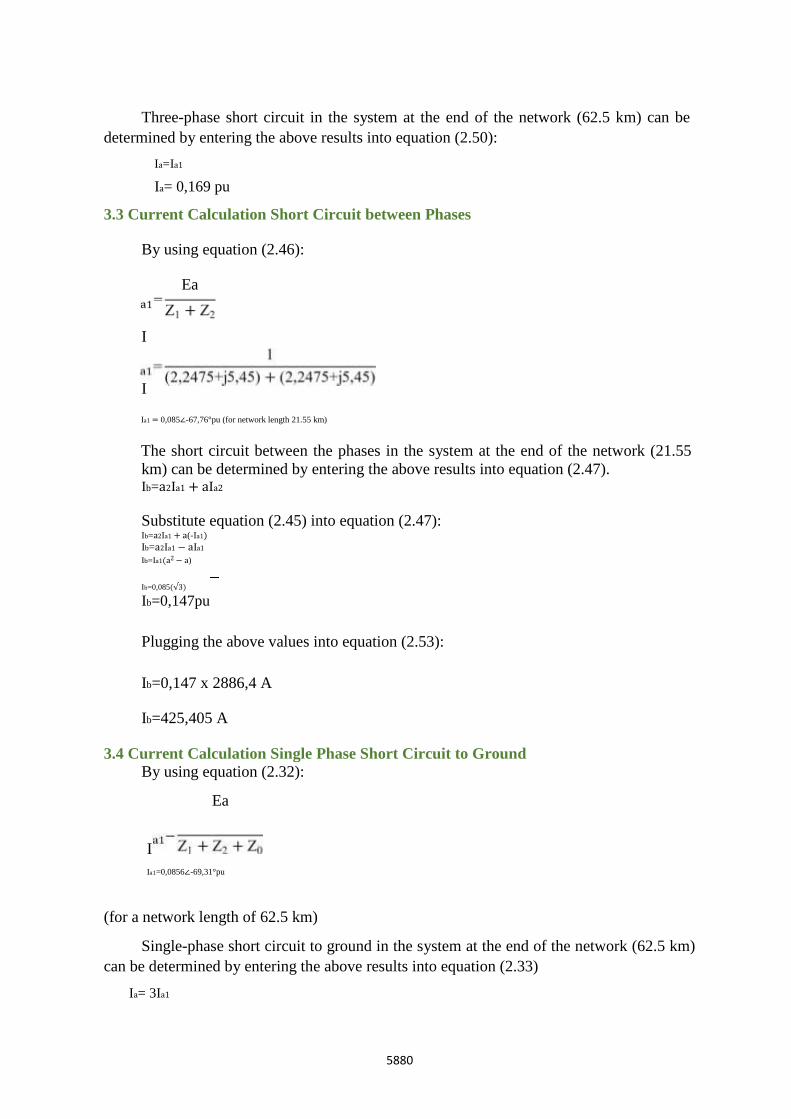
Three-phase short circuit in the system at the end of the network (62.5 km) can be
determined by entering the above results into equation (2.50):
Ia=Ia1
Ia= 0,169 pu
3.3 Current Calculation Short Circuit between Phases
By using equation (2.46):
Ea
I
I Ia1 = 0,085∠-67,76°pu (for network length 21.55 km)
The short circuit between the phases in the system at the end of the network (21.55
km) can be determined by entering the above results into equation (2.47). Ib=a2Ia1 + aIa2
Substitute equation (2.45) into equation (2.47): Ib=a2Ia1 + a(-Ia1)
Ib=a2Ia1 − aIa1
Ib=Ia1(a2 − a)
Ib=0,085(√3)
Ib=0,147pu
Plugging the above values into equation (2.53):
Ib=0,147 x 2886,4 A
Ib=425,405 A
3.4 Current Calculation Single Phase Short Circuit to Ground
By using equation (2.32):
Ea
I
Ia1=0,0856∠-69,31°pu
(for a network length of 62.5 km)
Single-phase short circuit to ground in the system at the end of the network (62.5 km)
can be determined by entering the above results into equation (2.33)
Ia= 3Ia1
5881
Ia= 3(0,0856)
Ia= 0,147 pu
Plugging the above values into equation (2.53):
Ib=0,147 x 2886,4 A
Ib=425,405 A
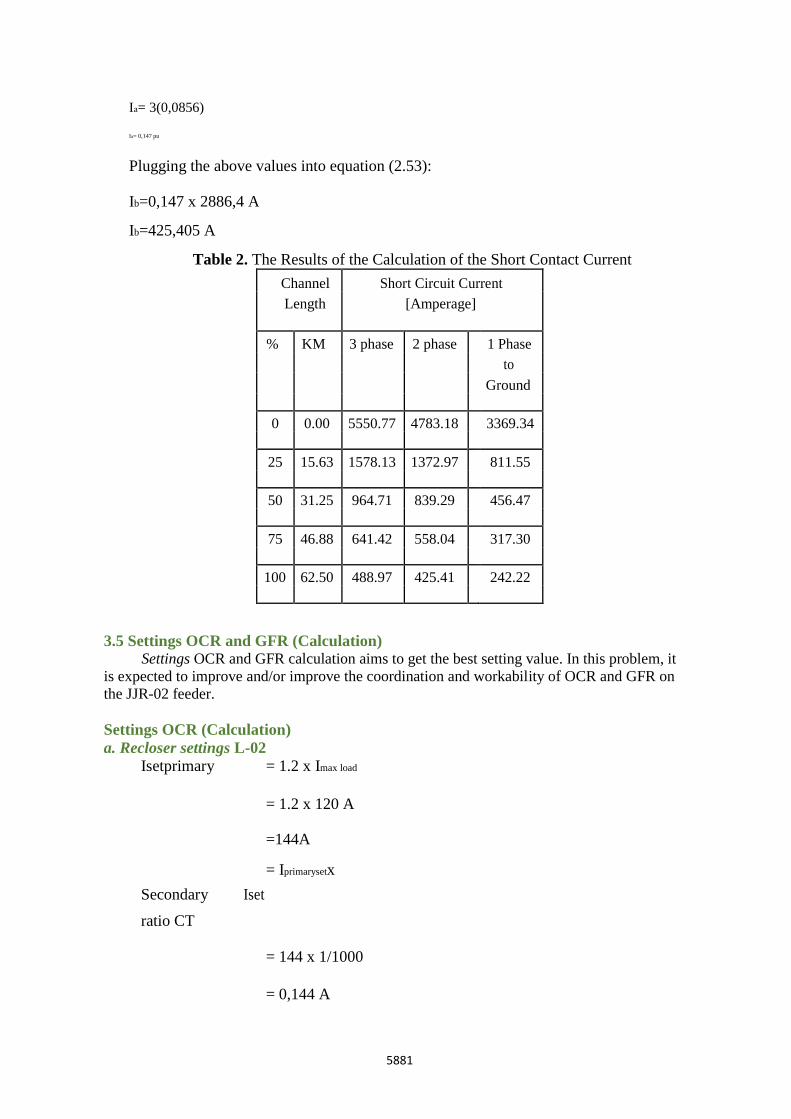
Table 2. The Results of the Calculation of the Short Contact Current
Channel Short Circuit Current
Length [Amperage]
% KM 3 phase 2 phase 1 Phase
to
Ground
0 0.00 5550.77 4783.18 3369.34
25 15.63 1578.13 1372.97 811.55
50 31.25 964.71 839.29 456.47
75 46.88 641.42 558.04 317.30
100 62.50 488.97 425.41 242.22
3.5 Settings OCR and GFR (Calculation) Settings OCR and GFR calculation aims to get the best setting value. In this problem, it
is expected to improve and/or improve the coordination and workability of OCR and GFR on
the JJR-02 feeder.
Settings OCR (Calculation)
a. Recloser settings L-02
Isetprimary = 1.2 x Imax load
= 1.2 x 120 A
=144A
Secondary Iset
= Iprimarysetx
ratio CT
= 144 x 1/1000
= 0,144 A
5882
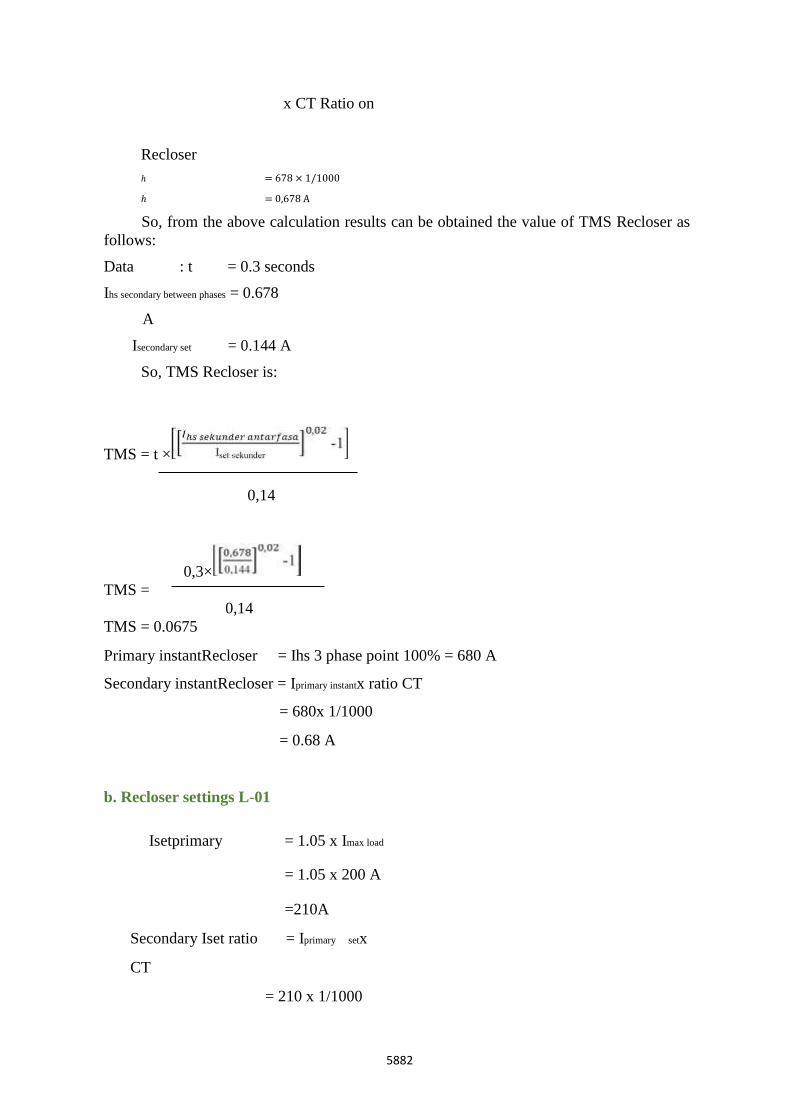
x CT Ratio on
Recloser
ℎ = 678 × 1/1000
ℎ = 0,678 A
So, from the above calculation results can be obtained the value of TMS Recloser as
follows:
Data : t = 0.3 seconds
Ihs secondary between phases = 0.678
A
Isecondary set = 0.144 A
So, TMS Recloser is:
TMS = t ×
0,14
0,3×
TMS =
0,14
TMS = 0.0675
Primary instantRecloser = Ihs 3 phase point 100% = 680 A
Secondary instantRecloser = Iprimary instantx ratio CT
= 680x 1/1000
= 0.68 A
b. Recloser settings L-01
Isetprimary = 1.05 x Imax load
= 1.05 x 200 A
=210A
Secondary Iset ratio = Iprimary setx
CT
= 210 x 1/1000
5883
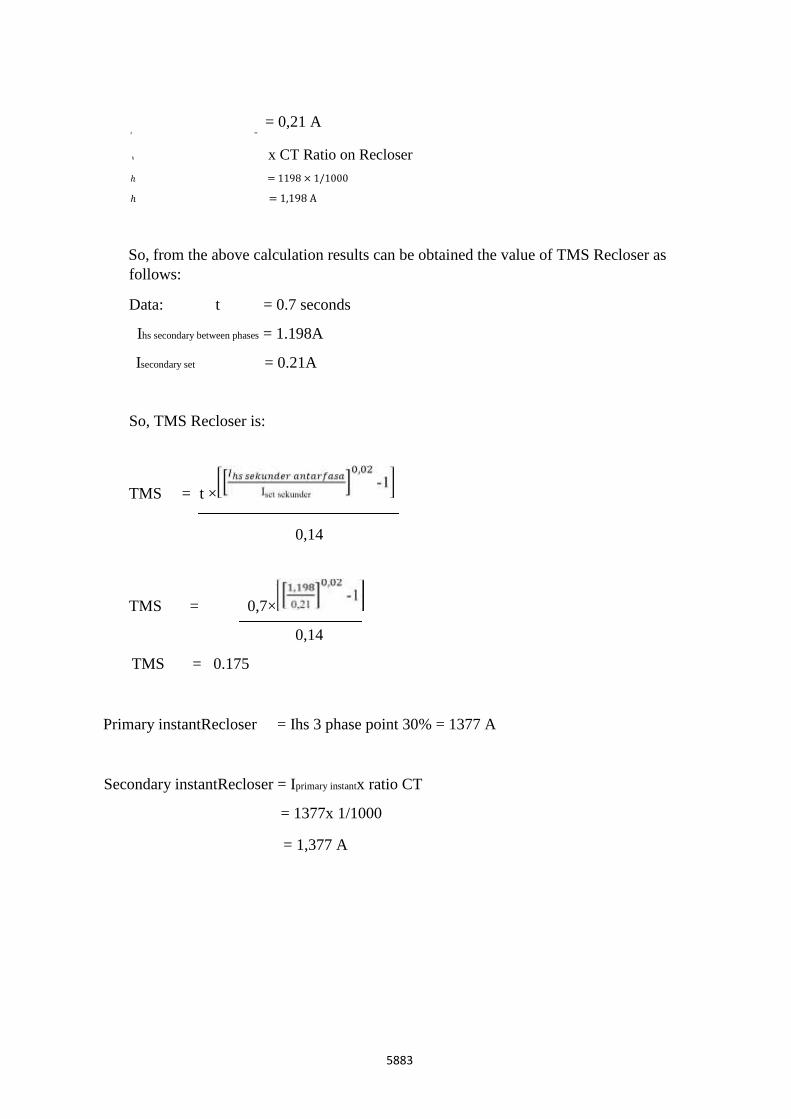
= 0,21 A ℎ =
ℎ x CT Ratio on Recloser
ℎ = 1198 × 1/1000
ℎ = 1,198 A
So, from the above calculation results can be obtained the value of TMS Recloser as
follows:
Data: t = 0.7 seconds
Ihs secondary between phases = 1.198A
Isecondary set = 0.21A
So, TMS Recloser is:
TMS = t ×
0,14
TMS = 0,7×
0,14
TMS = 0.175
Primary instantRecloser = Ihs 3 phase point 30% = 1377 A
Secondary instantRecloser = Iprimary instantx ratio CT
= 1377x 1/1000
= 1,377 A
5884
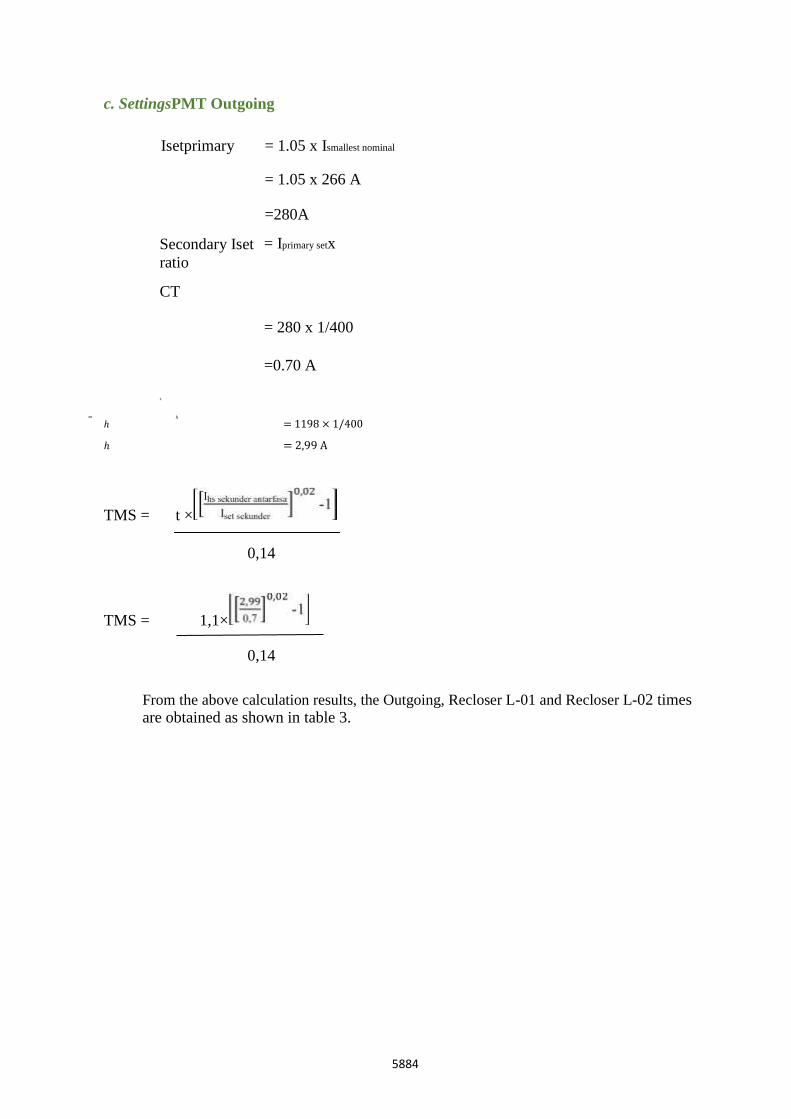
c. SettingsPMT Outgoing
Isetprimary = 1.05 x Ismallest nominal
= 1.05 x 266 A
=280A
Secondary Iset
ratio
= Iprimary setx
CT
= 280 x 1/400
=0.70 A
ℎ
= ℎ
ℎ = 1198 × 1/400
ℎ = 2,99 A
TMS = t ×
0,14
TMS = 1,1×
0,14
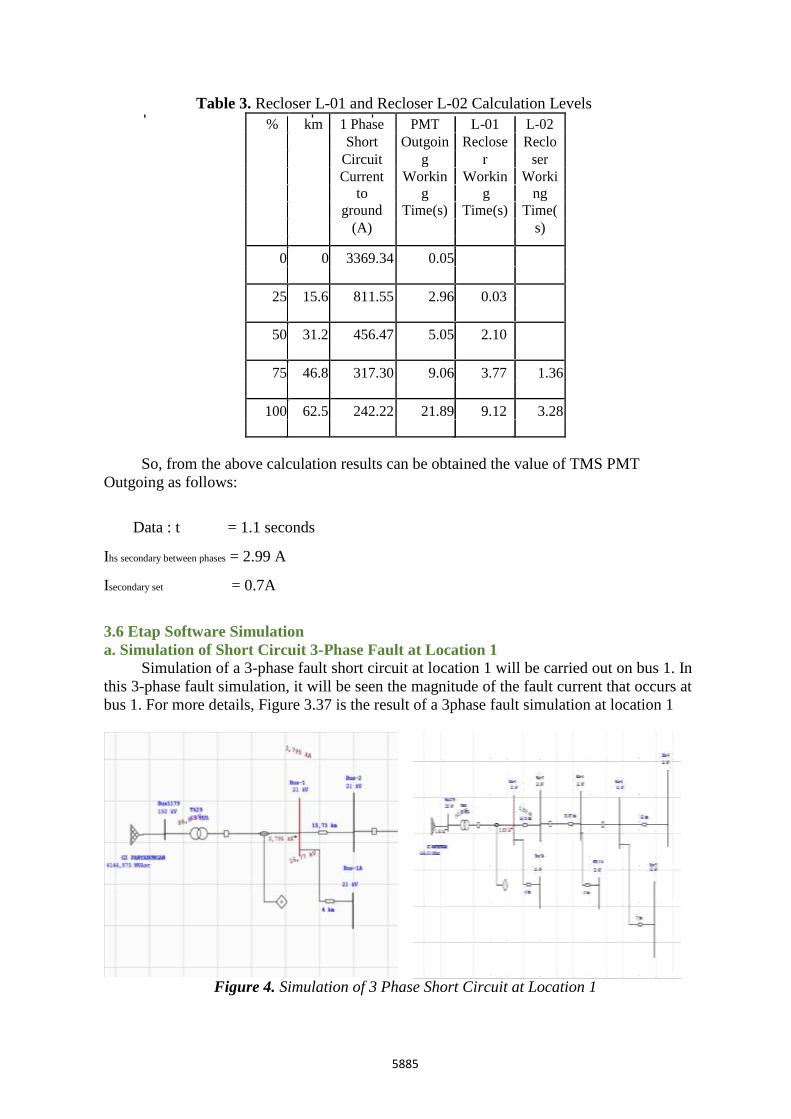
From the above calculation results, the Outgoing, Recloser L-01 and Recloser L-02 times are obtained as shown in table 3.
5885
Table 3. Recloser L-01 and Recloser L-02 Calculation Levels
%
km 1 Phase PMT
L-01
L-02
Short Outgoin Reclose Reclo
Circuit g r ser
Current Workin Workin Worki
to g g ng
ground Time(s) Time(s) Time(
(A) s)
0 0 3369.34 0.05
25 15.6 811.55 2.96 0.03
50 31.2 456.47 5.05 2.10
75 46.8 317.30 9.06 3.77 1.36
100 62.5 242.22 21.89 9.12 3.28
So, from the above calculation results can be obtained the value of TMS PMT
Outgoing as follows:
Data : t = 1.1 seconds
Ihs secondary between phases = 2.99 A
Isecondary set = 0.7A
3.6 Etap Software Simulation
a. Simulation of Short Circuit 3-Phase Fault at Location 1
Simulation of a 3-phase fault short circuit at location 1 will be carried out on bus 1. In
this 3-phase fault simulation, it will be seen the magnitude of the fault current that occurs at
bus 1. For more details, Figure 3.37 is the result of a 3phase fault simulation at location 1
Figure 4. Simulation of 3 Phase Short Circuit at Location 1
5886
From the picture above, the results show that when a short circuit occurs on bus 1, the
short circuit current that occurs is 5.929 Ka on bus 1. For more details, Figure 3.39 is the
result of simulation of inter-phase faults at location 1.
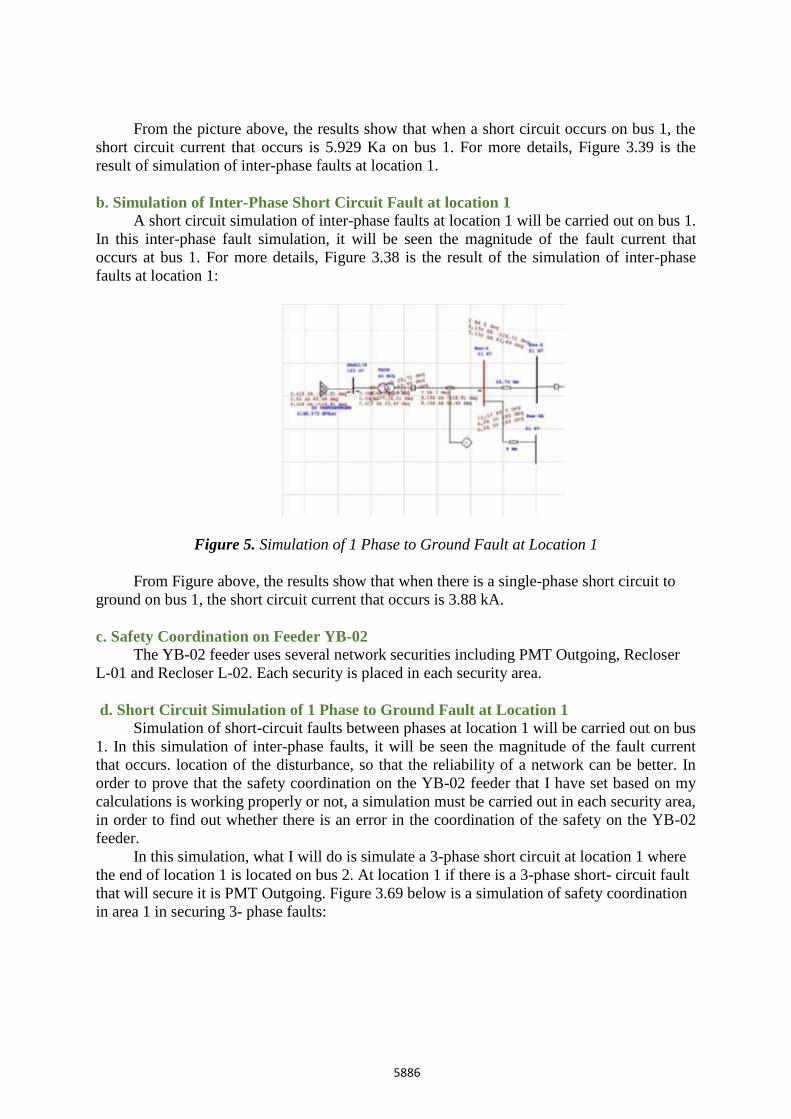
b. Simulation of Inter-Phase Short Circuit Fault at location 1
A short circuit simulation of inter-phase faults at location 1 will be carried out on bus 1.
In this inter-phase fault simulation, it will be seen the magnitude of the fault current that
occurs at bus 1. For more details, Figure 3.38 is the result of the simulation of inter-phase
faults at location 1:
Figure 5. Simulation of 1 Phase to Ground Fault at Location 1
From Figure above, the results show that when there is a single-phase short circuit to
ground on bus 1, the short circuit current that occurs is 3.88 kA.
c. Safety Coordination on Feeder YB-02
The YB-02 feeder uses several network securities including PMT Outgoing, Recloser
L-01 and Recloser L-02. Each security is placed in each security area.
d. Short Circuit Simulation of 1 Phase to Ground Fault at Location 1
Simulation of short-circuit faults between phases at location 1 will be carried out on bus
1. In this simulation of inter-phase faults, it will be seen the magnitude of the fault current
that occurs. location of the disturbance, so that the reliability of a network can be better. In
order to prove that the safety coordination on the YB-02 feeder that I have set based on my
calculations is working properly or not, a simulation must be carried out in each security area,
in order to find out whether there is an error in the coordination of the safety on the YB-02
feeder.
In this simulation, what I will do is simulate a 3-phase short circuit at location 1 where
the end of location 1 is located on bus 2. At location 1 if there is a 3-phase short- circuit fault
that will secure it is PMT Outgoing. Figure 3.69 below is a simulation of safety coordination
in area 1 in securing 3- phase faults:
5887
Figure 6. Simulation of 1 Phase to Ground Fault at Location 1
e. Simulation of Coordination of Protection
Equipment in Securing 3-Phase Interference
In this sub-chapter I will simulate interphase faults at 3 locations, namely location 1, location
2, and location 3.
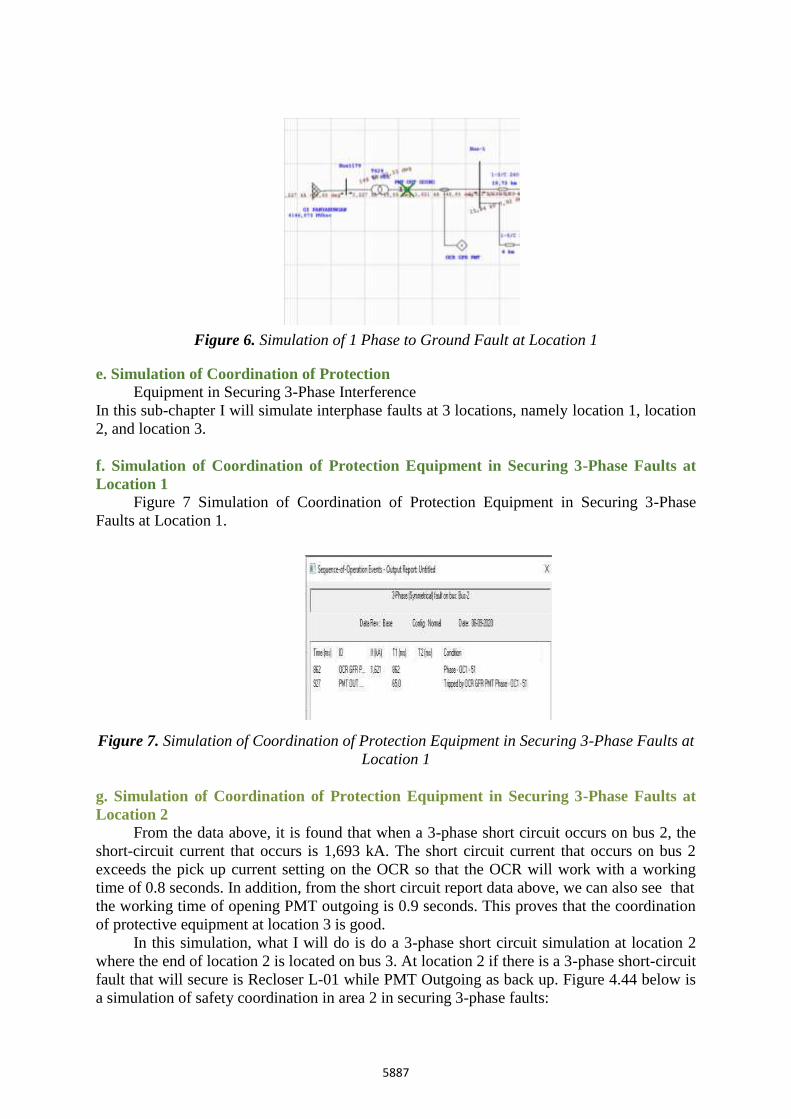
f. Simulation of Coordination of Protection Equipment in Securing 3-Phase Faults at
Location 1
Figure 7 Simulation of Coordination of Protection Equipment in Securing 3-Phase
Faults at Location 1.
Figure 7. Simulation of Coordination of Protection Equipment in Securing 3-Phase Faults at
Location 1
g. Simulation of Coordination of Protection Equipment in Securing 3-Phase Faults at
Location 2
From the data above, it is found that when a 3-phase short circuit occurs on bus 2, the
short-circuit current that occurs is 1,693 kA. The short circuit current that occurs on bus 2
exceeds the pick up current setting on the OCR so that the OCR will work with a working
time of 0.8 seconds. In addition, from the short circuit report data above, we can also see that
the working time of opening PMT outgoing is 0.9 seconds. This proves that the coordination
of protective equipment at location 3 is good.
In this simulation, what I will do is do a 3-phase short circuit simulation at location 2
where the end of location 2 is located on bus 3. At location 2 if there is a 3-phase short-circuit
fault that will secure is Recloser L-01 while PMT Outgoing as back up. Figure 4.44 below is
a simulation of safety coordination in area 2 in securing 3-phase faults:
5888
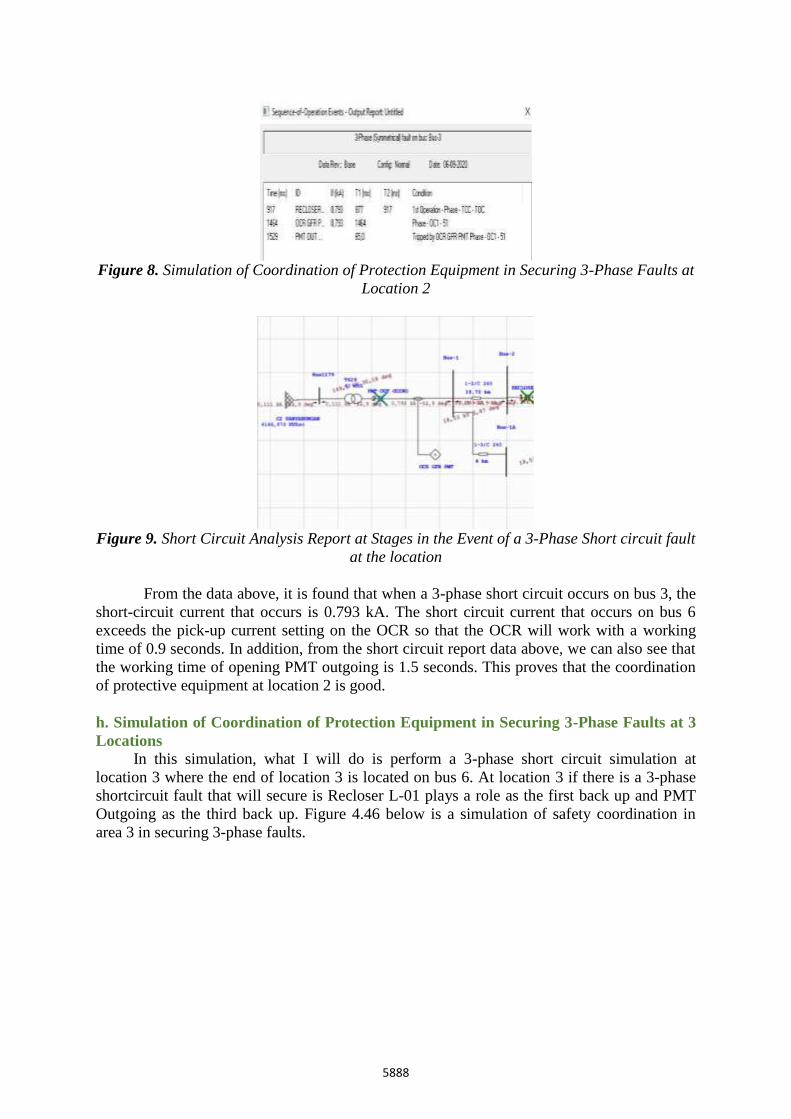
Figure 8. Simulation of Coordination of Protection Equipment in Securing 3-Phase Faults at
Location 2
Figure 9. Short Circuit Analysis Report at Stages in the Event of a 3-Phase Short circuit fault
at the location
From the data above, it is found that when a 3-phase short circuit occurs on bus 3, the
short-circuit current that occurs is 0.793 kA. The short circuit current that occurs on bus 6
exceeds the pick-up current setting on the OCR so that the OCR will work with a working
time of 0.9 seconds. In addition, from the short circuit report data above, we can also see that
the working time of opening PMT outgoing is 1.5 seconds. This proves that the coordination
of protective equipment at location 2 is good.
h. Simulation of Coordination of Protection Equipment in Securing 3-Phase Faults at 3
Locations
In this simulation, what I will do is perform a 3-phase short circuit simulation at
location 3 where the end of location 3 is located on bus 6. At location 3 if there is a 3-phase
shortcircuit fault that will secure is Recloser L-01 plays a role as the first back up and PMT
Outgoing as the third back up. Figure 4.46 below is a simulation of safety coordination in
area 3 in securing 3-phase faults.
5889
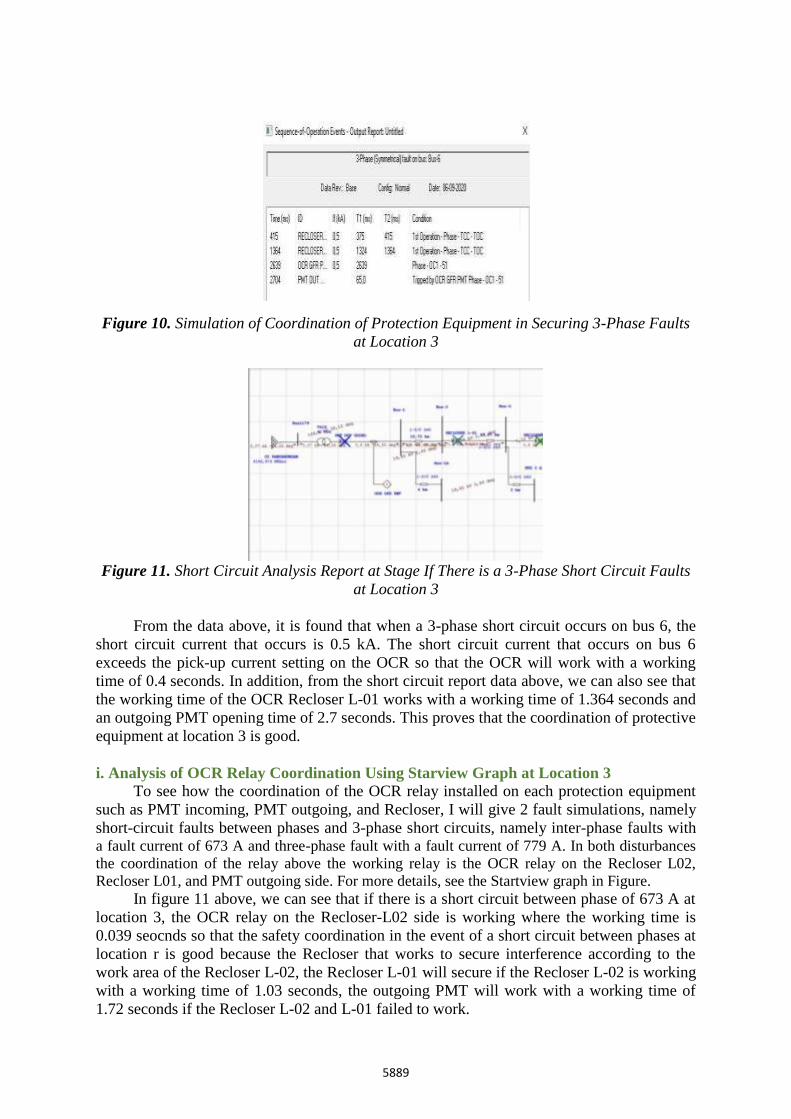
Figure 10. Simulation of Coordination of Protection Equipment in Securing 3-Phase Faults
at Location 3
Figure 11. Short Circuit Analysis Report at Stage If There is a 3-Phase Short Circuit Faults
at Location 3
From the data above, it is found that when a 3-phase short circuit occurs on bus 6, the
short circuit current that occurs is 0.5 kA. The short circuit current that occurs on bus 6
exceeds the pick-up current setting on the OCR so that the OCR will work with a working
time of 0.4 seconds. In addition, from the short circuit report data above, we can also see that
the working time of the OCR Recloser L-01 works with a working time of 1.364 seconds and
an outgoing PMT opening time of 2.7 seconds. This proves that the coordination of protective
equipment at location 3 is good.
i. Analysis of OCR Relay Coordination Using Starview Graph at Location 3
To see how the coordination of the OCR relay installed on each protection equipment
such as PMT incoming, PMT outgoing, and Recloser, I will give 2 fault simulations, namely
short-circuit faults between phases and 3-phase short circuits, namely inter-phase faults with a fault current of 673 A and three-phase fault with a fault current of 779 A. In both disturbances
the coordination of the relay above the working relay is the OCR relay on the Recloser L02,
Recloser L01, and PMT outgoing side. For more details, see the Startview graph in Figure. In figure 11 above, we can see that if there is a short circuit between phase of 673 A at
location 3, the OCR relay on the Recloser-L02 side is working where the working time is
0.039 seocnds so that the safety coordination in the event of a short circuit between phases at
location r is good because the Recloser that works to secure interference according to the
work area of the Recloser L-02, the Recloser L-01 will secure if the Recloser L-02 is working
with a working time of 1.03 seconds, the outgoing PMT will work with a working time of
1.72 seconds if the Recloser L-02 and L-01 failed to work.
5890
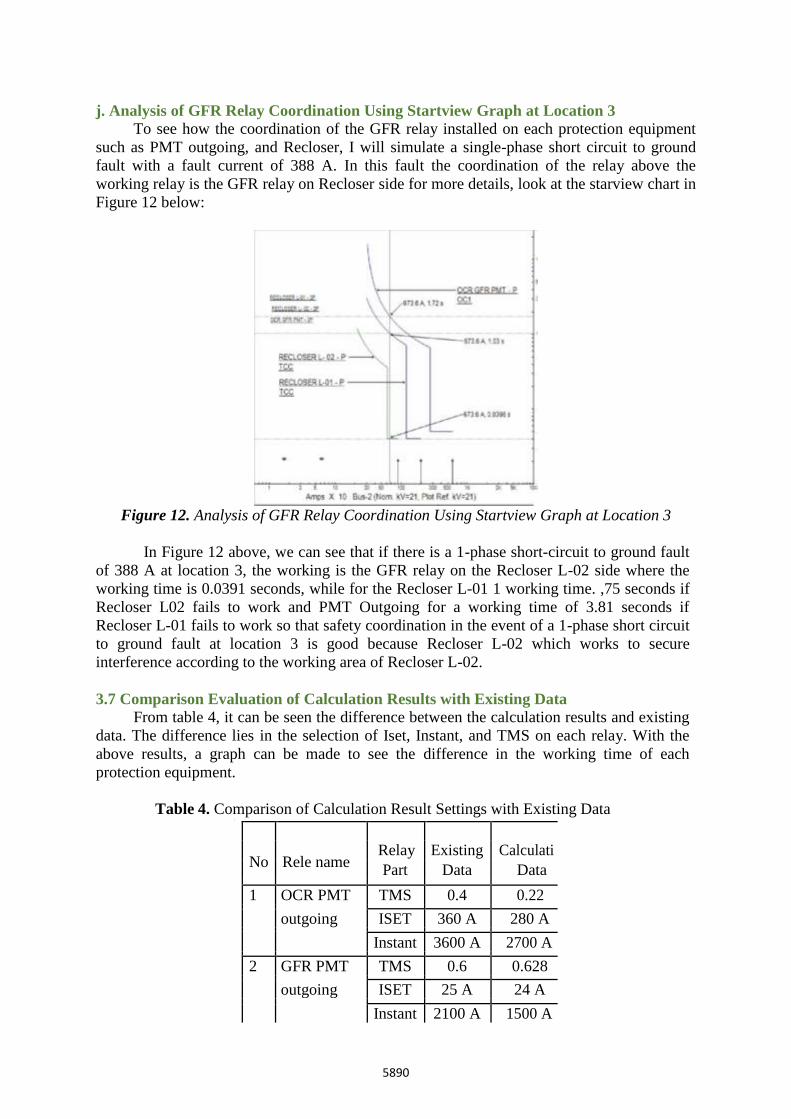
j. Analysis of GFR Relay Coordination Using Startview Graph at Location 3
To see how the coordination of the GFR relay installed on each protection equipment
such as PMT outgoing, and Recloser, I will simulate a single-phase short circuit to ground
fault with a fault current of 388 A. In this fault the coordination of the relay above the
working relay is the GFR relay on Recloser side for more details, look at the starview chart in
Figure 12 below:
Figure 12. Analysis of GFR Relay Coordination Using Startview Graph at Location 3
In Figure 12 above, we can see that if there is a 1-phase short-circuit to ground fault
of 388 A at location 3, the working is the GFR relay on the Recloser L-02 side where the
working time is 0.0391 seconds, while for the Recloser L-01 1 working time. ,75 seconds if
Recloser L02 fails to work and PMT Outgoing for a working time of 3.81 seconds if
Recloser L-01 fails to work so that safety coordination in the event of a 1-phase short circuit
to ground fault at location 3 is good because Recloser L-02 which works to secure
interference according to the working area of Recloser L-02.
3.7 Comparison Evaluation of Calculation Results with Existing Data
From table 4, it can be seen the difference between the calculation results and existing
data. The difference lies in the selection of Iset, Instant, and TMS on each relay. With the
above results, a graph can be made to see the difference in the working time of each
protection equipment.
Table 4. Comparison of Calculation Result Settings with Existing Data \
No Rele name
Relay Existing Calculati Part Data Data
1 OCR PMT TMS 0.4 0.22
outgoing
ISET 360 A 280 A
Instant 3600 A 2700 A
2 GFR PMT TMS 0.6 0.628
outgoing
ISET 25 A 24 A
Instant 2100 A 1500 A
5891
3 OCR TMS 0.2 0.175
RecloserL01
ISET 180 A 210 A
Instant 1200 A 1000 A
4 GFR TMS 0.25 0.345
RecloserL01
ISET 20 A 24 A
Instant 700 A 600 A
No Rele name
Relay Existing Calculation
Part Data Data
5 OCR TMS 0.09 0.0675
Recloser
ISET 120 A 144 A
L-02
Instant 680 A 600 A
6 GFR TMS 0.09 0.107
Recloser
ISET 20 A 24 A
L-02
Instant 350 A 300 A
3.8 Comparative Evaluation of Coordination Results of Calculation OCR Settings with.
Existing Data
Regarding the comparison of the coordination of the calculated OCR protection settings
with Existing data, it can be seen that there is a difference in the PMT Outgoing (Existing)
Curve with PMT Outgoing (Calculation Results) where the calculation results look more
sensitive than the existing curve because the GAP working time between Recloser L-01 with
PMT Outgoing is not too far away, so backing up if Recloser L-01 fails to work can be done
quickly. Then the second difference lies in Iset both on Recloser L-01 and Recloser L-02.
The results of the Iset calculation that I use are the latest peak load data retrieval data, while
the existing data is the peak load data 6 months ago. From the two curves above, it can be
concluded that both the existing data and the data from the calculation of the OCR settings
are good because each protection equipment coordinates well in securing interference.
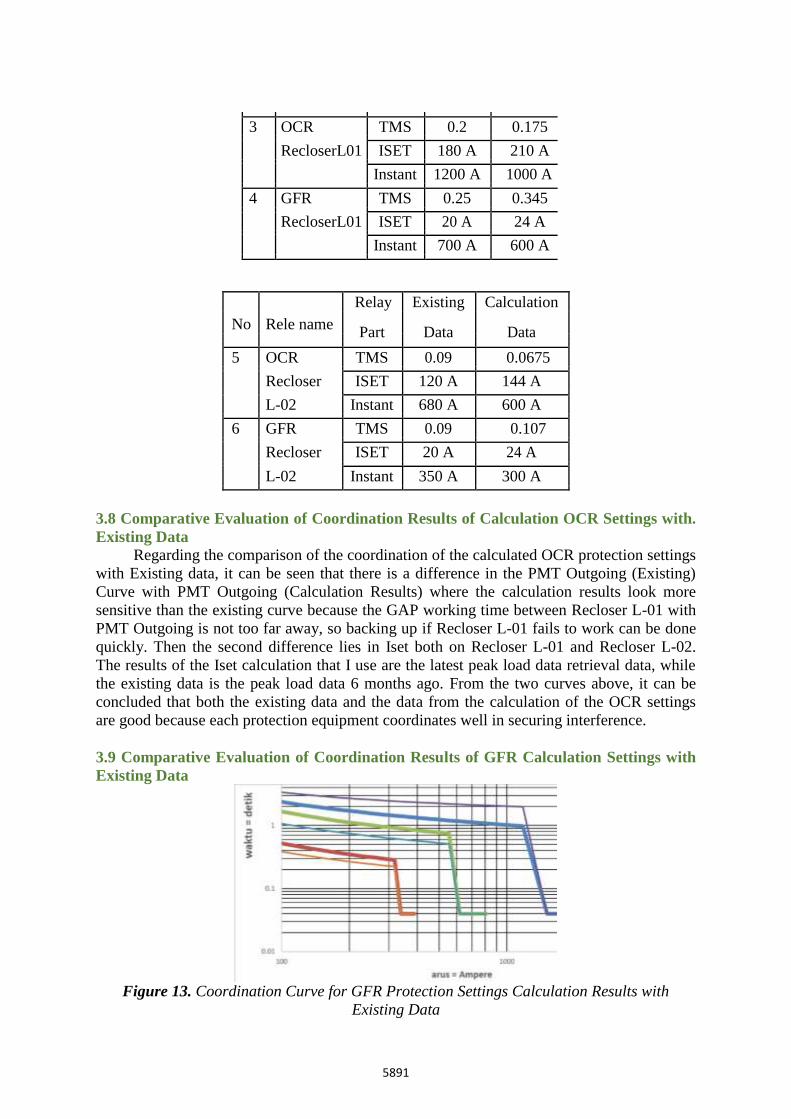
3.9 Comparative Evaluation of Coordination Results of GFR Calculation Settings with
Existing Data
Figure 13. Coordination Curve for GFR Protection Settings Calculation Results with
Existing Data
5892
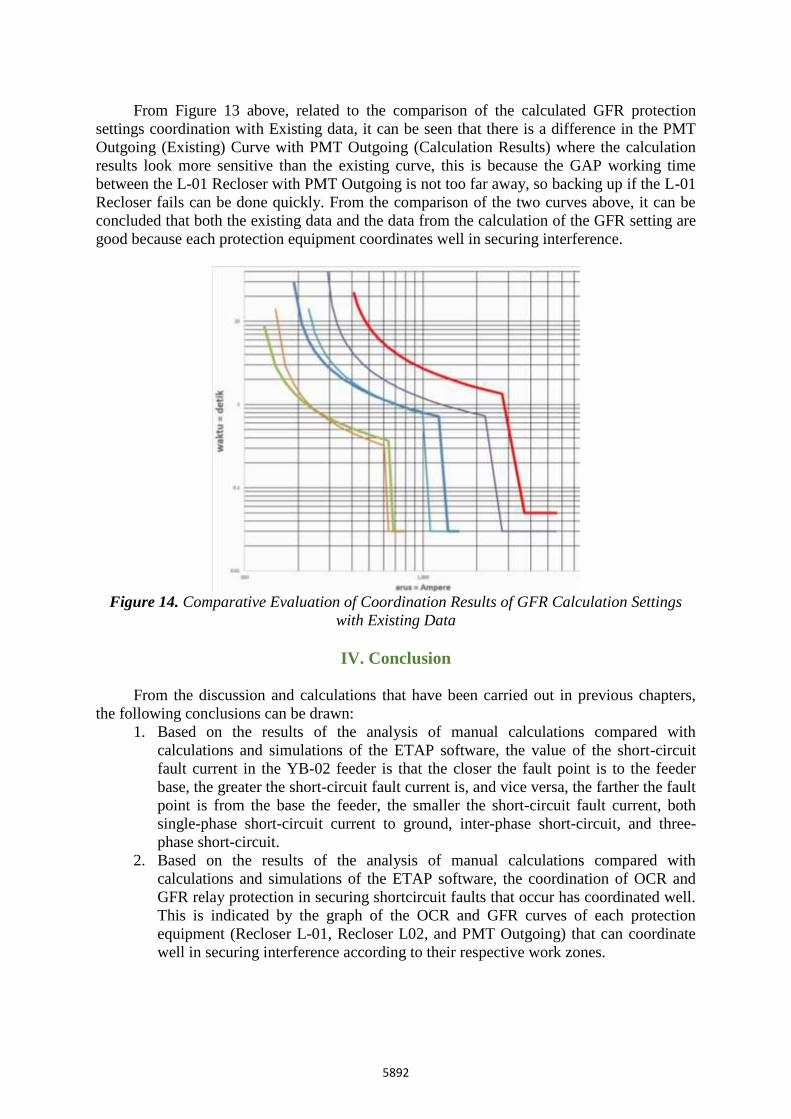
From Figure 13 above, related to the comparison of the calculated GFR protection
settings coordination with Existing data, it can be seen that there is a difference in the PMT
Outgoing (Existing) Curve with PMT Outgoing (Calculation Results) where the calculation
results look more sensitive than the existing curve, this is because the GAP working time
between the L-01 Recloser with PMT Outgoing is not too far away, so backing up if the L-01
Recloser fails can be done quickly. From the comparison of the two curves above, it can be
concluded that both the existing data and the data from the calculation of the GFR setting are
good because each protection equipment coordinates well in securing interference.
Figure 14. Comparative Evaluation of Coordination Results of GFR Calculation Settings
with Existing Data
IV. Conclusion
From the discussion and calculations that have been carried out in previous chapters,
the following conclusions can be drawn:
1. Based on the results of the analysis of manual calculations compared with
calculations and simulations of the ETAP software, the value of the short-circuit
fault current in the YB-02 feeder is that the closer the fault point is to the feeder
base, the greater the short-circuit fault current is, and vice versa, the farther the fault
point is from the base the feeder, the smaller the short-circuit fault current, both
single-phase short-circuit current to ground, inter-phase short-circuit, and three-
phase short-circuit.
2. Based on the results of the analysis of manual calculations compared with
calculations and simulations of the ETAP software, the coordination of OCR and
GFR relay protection in securing shortcircuit faults that occur has coordinated well.
This is indicated by the graph of the OCR and GFR curves of each protection
equipment (Recloser L-01, Recloser L02, and PMT Outgoing) that can coordinate
well in securing interference according to their respective work zones.
5893
References
Baand National Standardization. 2000. General Requirements for Electrical Installation 2000
(PUIL 2000). Jakarta: PUIL Foundation.
Lightat, Purwo Prasetyo. 2014. Calculation of Losses and Voltage Drops Due to Changes in
Radial Network Configuration WL1.05 and WLI. Using Etap 7.0.0 Software.
Diponegoro. University Electrical Engineering.
Gonen, T. 1986. Electric Power Distribution System Engineering. McGraw Hill: New York.
Handoyo, A. 2005. Analysis of Engineering Loss Calculation at PLN (Persero). UPJ Central
Semarang.
Herianti, et.al. (2020). The Effectiveness Implementation of Package Payment System (INA-
CBGs) at Inpatient Installation of RSUD Zainoel Abidin Banda Aceh. Budapest
International Research and Critics Institute-Journal (BIRCI-Journal) Vol 3 (2): 1775-
1781.
Saputra, A. (2018). Allocation of Education Budget in Indonesia. Budapest International
Research and Critics Institute-Journal (BIRCI-Journal) Vol I (2): 142-148.
Sari, Hedy Febriana Puspita. 2016. Analysis of Technical Loss Value of Medium Voltage
Network at Feeder 5 Matur PT PLN Rayon Koto. Electrical Engineering Padang.
Institute of Technology SPLN 1. 1995. Voltage–Standard Voltage. Jakarta: PT PLN
(Persero).
SPLN 56-2. 1994. Medium Voltage Electrical Connection (SUTM). Jakarta: PT PLN
(Persero).
SPLN 64. 1985. Guidance for Choice and Use of Fulfillers in Systems Medium Voltage
Distribution.Jacard: PT PLN (Persero).
SPLN 72. 1987. Design Specifications for Medium Voltage Networks (JTM) and Jlow-
voltage network (JTR). Jacard: PT PLN (Persero).
Suhadi, et al. 2008. Electrical Power Distribution Engineering. Jakarta: Department
Penational education.
Suswanto, Daman. 2009. Electric Power Distribution System. field.
Tanjung, A. 2015. Analysis of 20 kV Distribution System to Improve Distribution System
Performance Using Electrical Transient Analysis Program. Electrical Engineering at
Lancang Kuning University.


![MULTI FUNCTION GROUND FAULT RELAY … FUNCTION GROUND FAULT RELAY [GFR]-5C, 10C 6. Identification of indications : When leakages occur in plural number of circuits on sometime, ground](https://img.pdfslide.net/doc/110x75/5ccea8d488c993b5058d8100/multi-function-ground-fault-relay-function-ground-fault-relay-gfr-5c-10c-6-identification.jpg)


![MULTI FUNCTION GROUND FAULT RELAY [GFR]-5C, 10C](https://img.pdfslide.net/doc/110x75/616a522a11a7b741a3513879/multi-function-ground-fault-relay-gfr-5c-10c.jpg)