Embed Size (px)
Citation preview

University of Mississippi University of Mississippi
eGrove eGrove
Honors Theses Honors College (Sally McDonnell Barksdale Honors College)
Spring 5-1-2021
Evaluation and Sizing of Solar Powered Reverse Osmosis Water Evaluation and Sizing of Solar Powered Reverse Osmosis Water
Desalination System Desalination System
Sandip Subedi
Follow this and additional works at: https://egrove.olemiss.edu/hon_thesis
Part of the Energy Systems Commons
Recommended Citation Recommended Citation Subedi, Sandip, "Evaluation and Sizing of Solar Powered Reverse Osmosis Water Desalination System" (2021). Honors Theses. 1823. https://egrove.olemiss.edu/hon_thesis/1823
This Undergraduate Thesis is brought to you for free and open access by the Honors College (Sally McDonnell Barksdale Honors College) at eGrove. It has been accepted for inclusion in Honors Theses by an authorized administrator of eGrove. For more information, please contact [email protected].

EVALUATION AND SIZING OF SOLAR POWERED REVERSE OSMOSIS WATER
DESALINATION SYSTEM
By
Sandip Subedi
A thesis submitted to the faculty of The University of Mississippi in partial fulfillment of
the requirements of the Sally McDonnell Barksdale Honors College.
Oxford
May 2021
Approved by
---------------------------------------
Advisor: Dr. Tejas Pandya
---------------------------------------
Reader: Dr. Farhad Farzbod
---------------------------------------
Reader: Dr. Wen Wu

ii
© 2021
Sandip Subedi
All RIGHTS RESERVED

iii
ACKNOWLEDGEMENTS
I would like to thank Dr. Tejas Pandya for his continuous guidance, support, and
encouragement throughout the process of this work. I would also like to thank Dr. Wen
Wu and Dr. Farhad Farzbod for suggestions along the way, and also taking the time to be
on the committee. I am also thankful to all the researchers, scientists, engineers,
organizations, and committees whose references were vital in writing this report. Finally,
I would like to express my sincerest gratitude to my family for always supporting and
motivating me.

iv
ABSTRACT
SANDIP SUBEDI: EVALUATION AND SIZING OF SOLAR POWERED REVERSE OSMOSIS
WATER DESALINATION SYSTEM (Under the direction of Dr. Tejas Pandya)
About 71 % of the surface of Earth is water, out of which around 2.5 % is freshwater. The
majority of the surface of Earth is occupied by seawater which also contains dissolved
salt. The salt concentration in seawater makes it toxic to humans because the human
body is unable to get rid of the salt that comes from seawater. The demand for fresh
water is increasing due to the rise in global population. In this context, desalinated
seawater is considered as a viable resource to meet the growing demand for fresh water.
Desalination process is highly energy intensive due to the high salinity of the sea water.
Reverse Osmosis (RO) Desalination process has emerged as the leading and the cost-
effective membrane based desalination process that is currently dominating the
desalination market. Though several researches are being conducted in cost reduction of
desalination process, the use of renewable energy in sea water desalination is not being
widely studied. This paper presents the design of an RO desalination plant that can
produce 12 m3 of water in a day, and is powered by Photovoltaic system. The paper also
presents the water production cost analysis from an RO plant powered by a PV system,
and an RO plant powered by purchased electricity. Furthermore, the fossil fuel that can
be saved over the lifetime operation of the designed RO plant with a PV system is also
evaluated.

v
Table of Contents
LIST OF FIGURES ........................................................................................................ VI
LIST OF TABLES ......................................................................................................... VII
LIST OF ABBREVIATIONS .......................................................................................... VIII
1 INTRODUCTION ................................................................................................... 1
1.1 Seawater Desalination ........................................................................................................... 1
1.2 Reverse Osmosis .................................................................................................................... 3
1.3 Reverse Osmosis Desalination System .................................................................................... 4
1.4 Solar Energy .......................................................................................................................... 8
1.5 Photovoltaic System .............................................................................................................. 9
2 METHODOLOGY ................................................................................................ 12
2.1 Reverse Osmosis Plant Design .............................................................................................. 12
2.2 Photovoltaic System Design ................................................................................................. 14
3 RESULTS ............................................................................................................ 15
3.1 Reverse Osmosis Plant ......................................................................................................... 15
3.2 Photovoltaic System ............................................................................................................ 18
4 ANALYSIS .......................................................................................................... 19
4.1 Economic Analysis ............................................................................................................... 19
4.2 Fossil Fuel Savings ................................................................................................................ 21
5 CONCLUSION .................................................................................................... 22
6 REFERENCES ...................................................................................................... 23
vi
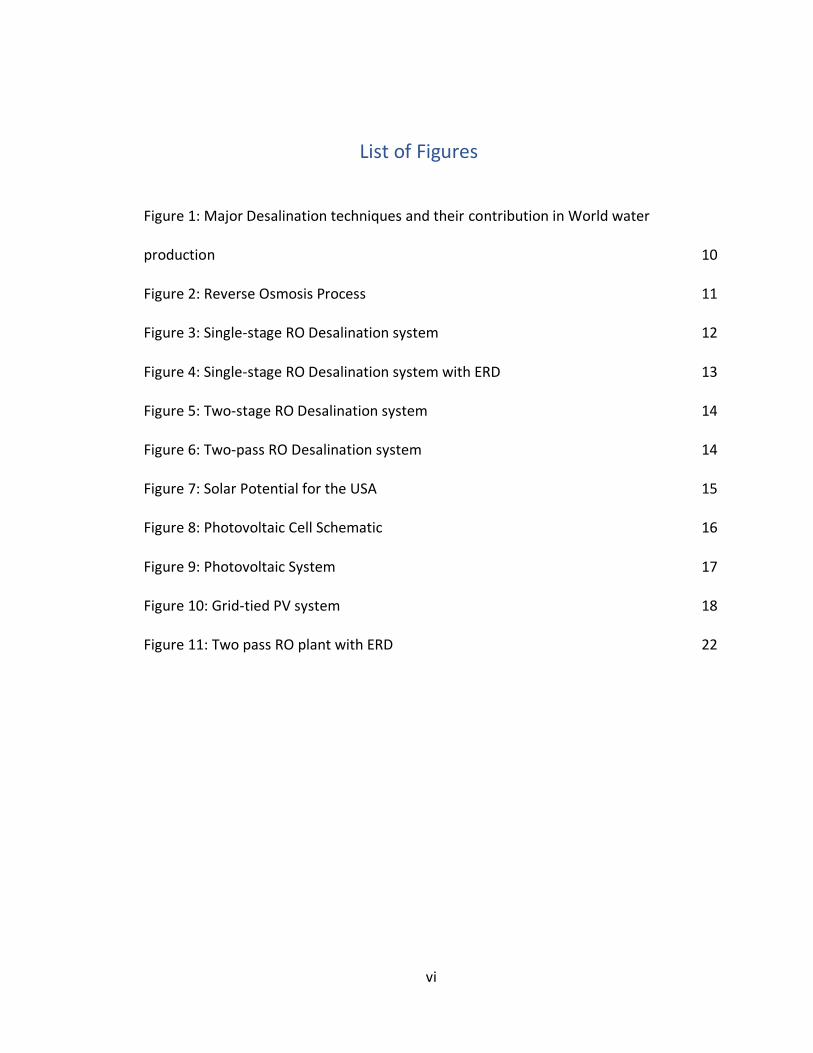
List of Figures
Figure 1: Major Desalination techniques and their contribution in World water
production 10
Figure 2: Reverse Osmosis Process 11
Figure 3: Single-stage RO Desalination system 12
Figure 4: Single-stage RO Desalination system with ERD 13
Figure 5: Two-stage RO Desalination system 14
Figure 6: Two-pass RO Desalination system 14
Figure 7: Solar Potential for the USA 15
Figure 8: Photovoltaic Cell Schematic 16
Figure 9: Photovoltaic System 17
Figure 10: Grid-tied PV system 18
Figure 11: Two pass RO plant with ERD 22
vii
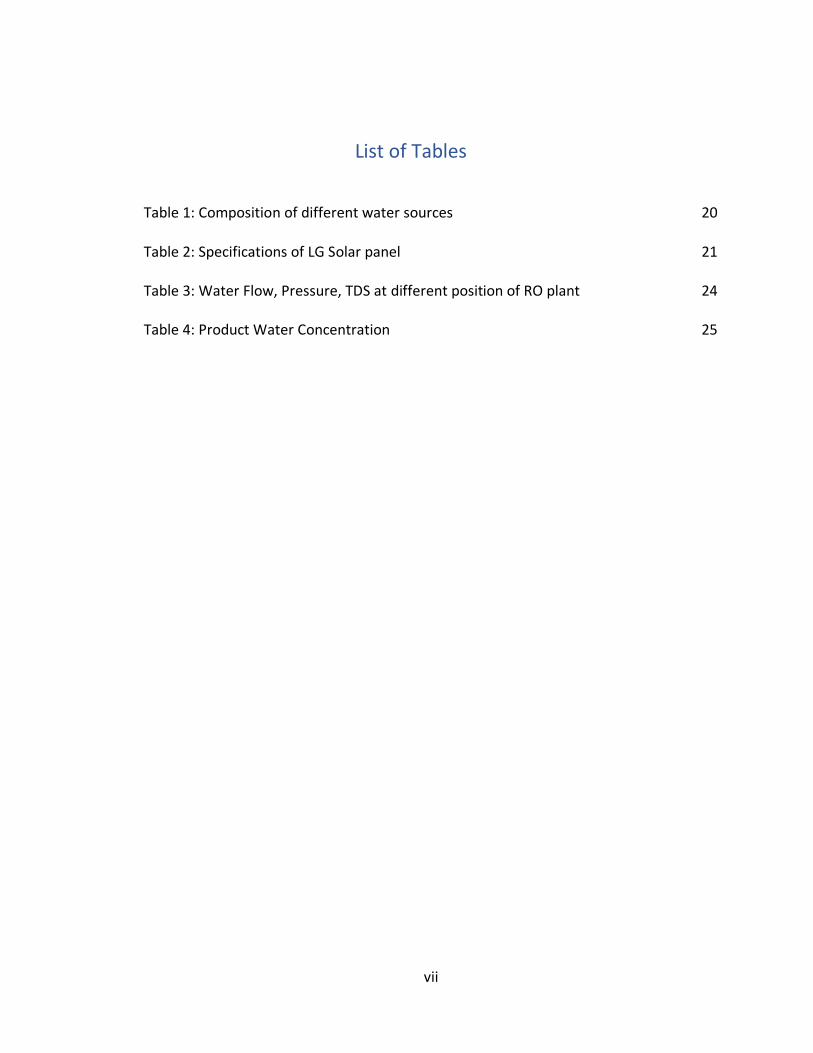
List of Tables
Table 1: Composition of different water sources 20
Table 2: Specifications of LG Solar panel 21
Table 3: Water Flow, Pressure, TDS at different position of RO plant 24
Table 4: Product Water Concentration 25

viii
List of Abbreviations TDS Total Dissolved Solids
RO Reverse Osmosis
ERD Energy Recovery Device
USA United States of America
PV Photovoltaic
DC Direct Current
AC Alternate Current
IMS Integrated Membrane System

1
1 Introduction
1.1 Seawater Desalination The quantity of freshwater available on earth’s surface is only 2.5 % of total water
quantity, and only 0.008 % represents the accessible surface freshwater [1] . Water
shortages have affected many communities, and humans have long searched for a
solution to inadequate fresh water supplies. Desalination is one of the promising solutions
to overcome the shortage of fresh water. Desalination refers to the process of removing
the salts and minerals (contaminants) from either seawater or brackish water in order to
attain clean water suitable for human consumption and industrial and domestic usage [2].
Saline water can be classified depending on the Total Dissolved Solids (TDS) for brackish
water TDS is up to 10,000 ppm, and for seawater TDS is up to 45,000 ppm [3]. The
permissible limit of salinity in freshwater is in the range of 500 ppm to 1000 ppm [4]. Most
of the desalination systems require thermal and/or electrical input. Desalination is an
extensive energy process which requires about 10000 tons of fossil fuel per year to
produce 1000 m3 of water per day [5]. It is essential to replace the depleted fossil fuel by
renewable energy resources in order to decrease the carbon footprint and greenhouse
gases emission. Figure 1 shows the major desalination process and their contribution in
world water production. The RO Desalination is the leading desalination process in the
world. About 62 % of world water production comes from an RO desalination process [1].

2
This paper presents an overview of an RO desalination process, and a small-scale RO
desalination plant that runs on solar PV cells.
Figure 1: Major Desalination techniques and their contribution in World water production [1]

3
1.2 Reverse Osmosis Osmosis is a naturally occurring process where a semi-permeable barrier allows passage
of some molecules but not others. The direction of flow in the osmosis process is from
less concentrated solution such as freshwater to a more concentrated solution such as
seawater until the equilibrium is reached. Reverse Osmosis, as the name suggests, is the
opposite of the osmosis process. In the process of RO, by applying pressure impure water
forces to pass through a thin semi‐permeable membrane made of a thin film of cellulose
acetone affixed to a perforated plate or tube which catches the dissolved solids and
allows the water molecule to pass through it [6]. The hydrostatic pressure greater than
osmotic pressure of dissolved solid is applied on the concentrated side of the membrane.
Schematic view of the RO process is shown in Figure 2.
Figure 2: Reverse Osmosis Process [6]

4
1.3 Reverse Osmosis Desalination System RO desalination system works on the principle of RO process. It uses a high pressure pump
to increase the pressure on the seawater side and force the water across the
semipermeable membrane, leaving dissolved salts behind in the reject stream. The most
basic RO desalination system includes the pre-treatment module, high-pressure pumps,
the RO membrane module, and the post-treatment module, arranged as shown in Figure
3 [7]. In the pre-treatment module, the incoming feed water is pre-treated to remove
suspended solids, reduce potential fouling, and increase the lifespan of an RO membrane.
Post-treatment is required depending on the application of product water. It generally
involves remineralization and demineralization of the product water based on the
required purity. The high-pressure pump increases the pressure of the pre-treated water
and forces it to the membrane module. The membrane module blocks the dissolved salt
and allows the passage of water into the post-treatment module. The highly saline water
blocked by the membrane is rejected from the membrane module. The high-pressure
pump requires high energy to operate and is supplied in the form of electricity.

5
Figure 3: Single-stage RO Desalination system [7]
The energy can be extracted from rejected water and fed into the high-pressure pump
which reduces the energy required to operate the pump. The advancement of membrane
technology and energy recovery devices (ERDs) over the last 50 years has brought down
the energy intensity of an RO desalination systems [7]. Single-stage RO desalination
system with ERD is shown in Figure 4.
Figure 4: Single-stage RO Desalination system with ERD [7]

6
The performance of the RO desalination system can be improved by modifying the
configuration of the membrane module. The RO membrane module may contain one or
several modules with many membrane elements arranged in series or parallel in a
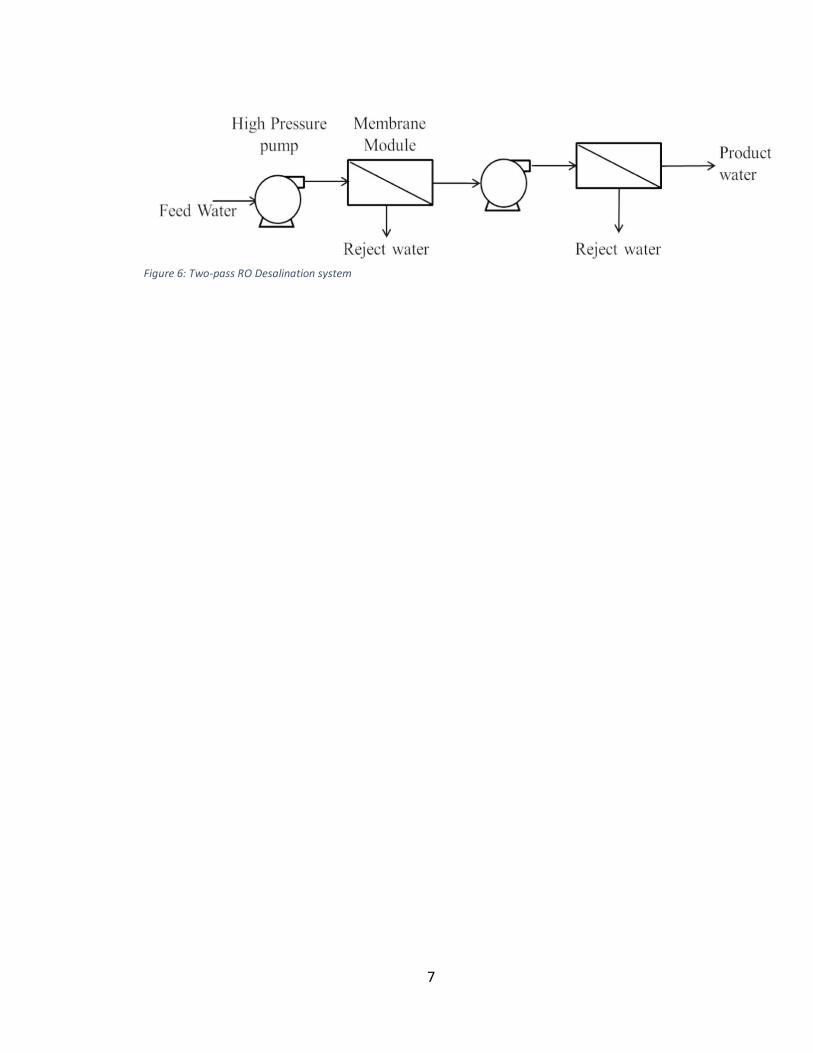
module. Figure 5 and Figure 6 represent two-stage and two-pass RO desalination systems
respectively. In a two-stage system, reject water from one membrane module is
pressurized through another membrane module, and the product water from both
membrane modules is collected together. In a two-pass system, the product water from
one membrane module is passed through another membrane module, and the final
product water is collected. The ultimate objectives of these different configurations of RO
desalination systems are to achieve a satisfied quality of water and long-term robustness
of the plant with increasing energy efficiency, water recovery, and membrane lifetime [8].
Figure 5: Two-stage RO Desalination system [7]
7
Figure 6: Two-pass RO Desalination system
8
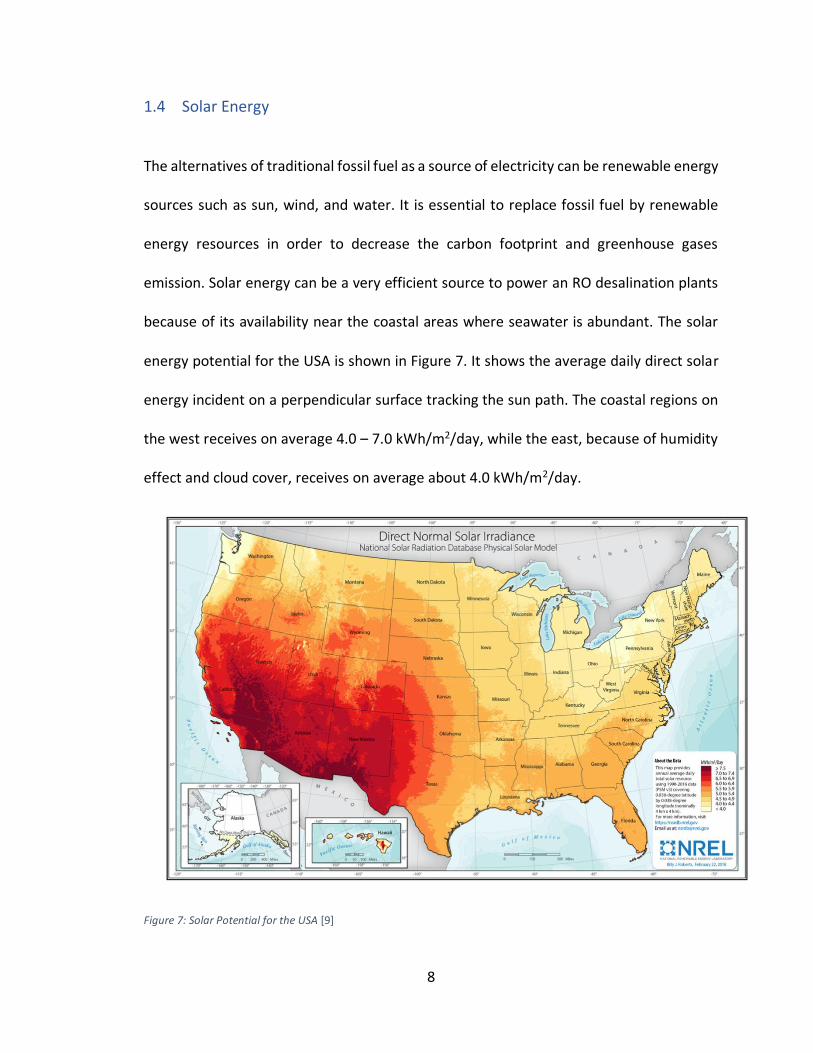
1.4 Solar Energy
The alternatives of traditional fossil fuel as a source of electricity can be renewable energy
sources such as sun, wind, and water. It is essential to replace fossil fuel by renewable
energy resources in order to decrease the carbon footprint and greenhouse gases
emission. Solar energy can be a very efficient source to power an RO desalination plants
because of its availability near the coastal areas where seawater is abundant. The solar
energy potential for the USA is shown in Figure 7. It shows the average daily direct solar
energy incident on a perpendicular surface tracking the sun path. The coastal regions on
the west receives on average 4.0 – 7.0 kWh/m2/day, while the east, because of humidity
effect and cloud cover, receives on average about 4.0 kWh/m2/day.
Figure 7: Solar Potential for the USA [9]

9
1.5 Photovoltaic System The Photovoltaic System converts radiation from the sun into the usable electricity. This
conversion process is called the photovoltaic effect. When semiconductor materials are
exposed to light, the photons of the light ray excite the electrons in the semiconductor
material creating a significant number of free electrons. The flow of these electrons create
electricity. This is how Photovoltaic effect produces electricity. Photovoltaic cell is the
basic unit of the system where photovoltaic effect is utilized to produce electricity from
light. Figure 8 shows a schematic of a photovoltaic cell.
Figure 8: Photovoltaic Cell Schematic [21]
Silicon is the most widely used semiconductor material for constructing a photovoltaic
cell. The silicon atom has four valence electrons. In a solid crystal, each silicon atom shares
each of its four valence electrons with another nearest silicon atom hence creating the
covalent bond between them. Pure silicon is called an intrinsic semiconductor, but if a
small amount of impurities, usually called the dopant, is combined with the pure silicon,

10
an extrinsic semiconductor result. An n-type of semiconductor results if the dopant has
more electrons in the valence band than the base material. An n-type semiconductor
seems to have an excess of electrons even though the semiconductor is electrically
neutral. A p-type semiconductor appears to have a deficit of electrons, or an excess of
“holes'', although it is electrically neutral. The reason for doping a pure semiconductor
such as silicon is that a junction formed with n-type and p-type semiconductor material
enhances the flow of electricity and holes. The most fundamental components of the
photovoltaic panel are individual photovoltaic cells, which are assembled together to
form modules. That in combination with one another yields a whole photovoltaic system.
Figure 9 shows the photovoltaic system. This whole system generates electricity from
solar irradiance.
Figure 9: Photovoltaic System [11]
PV systems are generally of two different types, Off-Grid System and Grid-tied System.
The Off-Grid System doesn’t have an energy back-up system, whereas a Grid-tied system

11
has connection with the grid. In the Grid-tied system, the PV system converts solar energy
to DC electricity, which is further converted to AC electricity through an inverter and is
tied to the grid system [12]. This paper presents the design of a grid-tied PV system.
During the day the excess electricity is fed to the grid and the energy can be drawn back
at night from the grid. Figure 11 shows the Grid-tied PV system.
Figure 10: Grid-tied PV system [12]

12
2 Methodology
2.1 Reverse Osmosis Plant Design The impurities present in water vary in sizes. Pre-treatment is done initially to remove
large solute particles. Reverse Osmosis removes solute size ranging from 0.1 nanometer
to 1 nanometer which are ions present in water [13]. Table 1 shows the concentration in
different water sources.
Table 1: Composition of different water sources [13]

13
This paper presents the desalination of seawater. Hence, seawater composition from
Table 1 is taken to design an RO desalination plant. The concentration of Calcium,
Magnesium, Sodium, Bicarbonate, Sulphate, Chloride, Nitrate, Fluoride, and Boron are
400 mg/l, 1252 mg/l, 10561 mg/l, 140 mg/l, 2650 mg/l, 18980 mg/l, 1.5 mg/l, 1.4 mg/l,
and 4 mg/l respectively. These properties are used to design an RO desalination plant
using Integrated Membrane System (IMS) Design Software. IMS Design gives the user
complete control over input concentration of feed water and membrane selection based
on the required product water. The software also evaluates the energy consumption
based on the pressure supplied by the pressure pump.

14
2.2 Photovoltaic System Design The energy consumption obtained from the designed RO plant is used to design a PV
system. The PV system is designed in such a way that it supplies enough energy to operate
an RO plant. The RO plant is designed to operate in Biloxi, Mississippi. Solar irradiation is
taken into consideration to design a PV system. The average direct normal solar
irradiation of Biloxi, Mississippi is 5.0 kWh/m2/day [9]. This value is used to determine
annual solar energy available in the location, which is converted to electricity using a PV
system. Individual PV panels are available in the market supplied by companies like
Panasonic, Tesla, LG etc. Based on the energy required to power an RO plant, the required
number of PV panels are connected together which forms a PV system. This paper uses
specifications provided by LG Solar Panel to create a PV System. Table 2 shows
specifications of LG solar panel.
Table 2: Specifications of LG Solar panel [15]

15
3 Results
3.1 Reverse Osmosis Plant IMS Design software was used to design an RO plant. The concentration of impurities/ions
in seawater were used from Table 1. Different parameters were twisted such as number
of stages, number passes, number of membranes, ERD, and pressure pump to obtain
energy efficient and quality product water. Figure 10 shows the RO desalination plant
obtained from IMS design. The seawater is supplied from 1 which mixes with the
concentrate from the second membrane module. Some part of it goes to a pressure
exchanger which mixes with the high pressure concentrate from the first membrane
module, and some of it goes to a high pressure pump. The high pressure pump pressurizes
the seawater which eventually mixes with the high pressure concentrate coming from the
pressure exchanger, and passes through the first membrane module. The product water
from the first membrane module is further passed through another high pressure pump
and membrane module to obtain final product water. The water flow, pressure, and TDS
at each numbered hexagon is shown in Table 3. The product water is obtained at the rate
of 0.5 m3/h.

16
Figure 11: Two pass RO plant with ERD [Obtained from IMS Design Software]
Table 3: Water Flow, Pressure, TDS at different position of RO plant [Obtained from IMS Design Software]
The obtained product water concentration is shown in Table 4. The concentration of
Calcium, Magnesium, Sodium, Bicarbonate, Sulphate, Chloride, Nitrate, Fluoride, and

17
Boron are 0.001 mg/l, 0.004 mg/l, 4.174 mg/l, 0.085 mg/l, 0.022 mg/l, 6.326 mg/l, 0.019
mg/l, 0.024 mg/l, and 2.202 mg/l respectively. Based on the required quality of the
product water, it can be further mineralized or demineralized.
Table 4: Product Water Concentration [Obtained from IMS Design Software]
The energy is used in the RO plant to operate pressure pumps. Based on the pressure
required in the pumps, the energy is evaluated from the IMS Design software. The energy
to generate 1 m3 of desalinated water was found to be 3.85 kWh.

18
3.2 Photovoltaic System The energy to operate an RO plant is 3.85 kWh per m3 of product water. The product
water flow rate out of an RO plant is 0.5 m3/h. The specification of LG solar panel, average
direct solar irradiation of the location, inverter losses, and systems losses can be used to
evaluate the number of solar panels required to power the RO plant.
● Water generated in a day = 0.5 m3/h * 24 h = 12 m3
● Energy required = 3.85 kWh/m3 * 12 m3 = 46.2 kWh/day
● Average direct solar irradiation = 5.0 kWh/m2/day [14]
● Area of panel = 1.7272 m2 [15]
● Efficiency = 20.3 % [15]
● Energy produced by a panel = 5.0 kWh/m2/day * 1.7272 m2 * 0.203= 1.75 kWh/day
● Inverter losses = 4 % [11]
● System losses = 14 % [11]
● After accounting for these losses, Energy produced by a panel = 0.96* 0.86 *
1.75kWh/day
= 1.44 kWh/day
● Number of Panels = (46.2 kWh/day)/(1.44 kWh/day) = 33
The RO plant has the capacity of producing 12 m3 product water in a day which can be
operated by a PV system with 33 LG solar panels.

19
4 Analysis
4.1 Economic Analysis The use of an RO plant and PV system together reduces the cost of desalinated water.
The other option to power an RO plant would be to purchase energy from the grid. This
paper presents the water production cost differences in these two approaches, and
overall cost saved using one of these approaches.
The water production cost from an RO plant powered by PV system is $0.67/m3, whereas
the water production cost of RO plant powered by purchased electricity is $0.94/m3. Over
the lifespan of the RO plant, the amount that can be saved using an RO plant powered by
PV system is $23,588. The estimated lifetime of an RO plant is 20 years, whereas the
estimated lifetime of a PV system is 25 years. The energy generated from the PV system
for the remaining 5 years can be sold to Mississippi Power at a rate determined by the
Mississippi Public Service Commission [20].
• Capital Cost of an RO plant = $24,120
• Operation and Maintenance Cost of an RO plant= $1000/year (Estimated)
• Projected lifetime of an RO plant = 20 years
• Total cost of an RO plant (lifetime) = $24120 + $ 1000 * 20 = $ 44120
• Cost of 1 LG solar panel = $ 352
• Cost of a PV system (33 solar panels) = $ 352 * 33 = $11,616

20
• Operation and Maintenance Cost of PV system = $13.09/kW/year
• Power from 1 LG solar panel = 350 W = 0.35 kW
• Total power from 33 LG solar panel = 0.35 kW * 33 = 11.55 kW
• Total Operation and Maintenance Cost (Over lifetime of RO plant) = 13.09 * 11.55
* 20 = $ 3,024
• Total Cost of PV system = $ 11,616 + $ 3,024 = $ 14,640
• Cost of electricity in Mississippi = $ 0.1102/kWh
• Total Cost of electricity to power an RO plant = $ 0.1102 * 47.52 * 365 * 20 =
$38,228
• Total cost of RO and PV system = $ 44,120 + $ 14,640 = $ 58,760
• Total cost of RO system powered by electricity from grid = $44,120 + $38,228 =
$82,348
• Total water produced (lifetime) = 12 * 365 * 20 = 87,600 m3
• Cost of water production (RO powered by PV) = $ 58,760/87,600 m3 = $0.67/m3
• Cost of water production (RO powered by Conventional) = $ 82,348/87,600 m3 =
$0.94/m3

21
4.2 Fossil Fuel Savings
The use of solar energy as a source of electricity in an RO plant consequently saves fossil
fuel. It is essential to save fossil fuel by renewable energy resources in order to decrease
the carbon footprint and greenhouse gases emission.
● 8.3 kWh of energy is produced by 1 kg of coal. The efficiency of electricity
production from coal is 39 %.
● 1 kg of coal produces 0.39 * 8.3 = 3.237 kWh of electrical energy
● Total conventional energy substituted = 427, 680 kWh
● Mass of coal required = 427,680 kWh/3.327 kWh = 128,548 kg
● CO2 emission from 1 kg of Coal = 1.91 kg
● Total Carbon dioxide Emission = 1.91× 128,548 = 245,526 kg= 245.5 Metric ton
● Carbon dioxide Emission per annum = 245.5/25 ≅ 10 Metric ton
The RO plant powered by a PV system prevents 10 Metric ton of CO2 emission per annum.

22
5 Conclusion
The increasing demand of fresh water and limited availability of its sources have increased
the need of desalinated seawater in recent years. Among several desalination techniques,
RO desalination has emerged as a leading and cost-effective desalination process. The
desalination process is also an energy intensive process which requires a lot of energy to
operate. Solar energy can be used to power RO desalination plants. For this theoretical
study, the PV system was used to convert solar energy to electricity and supply it to the
RO plant. The water desalination cost from an RO plant powered by a PV system was
estimated to be around $0.67/m3, whereas the water desalination cost of an RO plant
powered by purchased electricity was estimated to be around $0.94/m3. The RO plant
otherwise operated by conventional fossil fuel energy sources could have serious
environmental impact. The solar powered RO desalination plant presented in this report
can produce 12 m3 of desalinated water every day. The desalinated plant is estimated to
save around 10 metric tons of CO2 per annum which aids to decrease greenhouse gases
emission. A detailed study and a scaled down prototype of a solar powered RO plant can
provide much needed insight into the technical and economic feasibility, and its impact
on the environment.

23
6 References [1] Alkaisi, A., Mossad, R. and Sharifian-Barforoush, A., 2017. A Review of the Water Desalination Systems Integrated with Renewable Energy. Energy Procedia, 110, pp.268-274. [2] Shenvi, S., Isloor, A. and Ismail, A., 2015. A review on RO membrane technology: Developments and challenges. Desalination, 368, pp.10-26. [3] G. Micale, A. Cipollina and L. Rizzuti, "Seawater Desalination for Freshwater Production", Green Energy and Technology, pp. 1-15, 2009. Available: 10.1007/978-3-642-01150-4_1 [Accessed 23 March 2021]. [4] Rao, Mamatha, 2004. Water quality in sustainable water management. Current Science, 87(7), pp. 942-947. [5] Methnani, M., 2007. Influence of fuel costs on seawater desalination options. Desalination, 205(1-3), pp.332-339. [6] Manchanda, H. and Kumar, M., 2017. Study of water desalination techniques and a review on active solar distillation methods. Environmental Progress & Sustainable Energy, 37(1), pp.444-464. [7] Que, V., Tuan, D., Huy, N. and Phu, V., 2021. Design and performance of small-scale reverse osmosis desalination for brackish water powered by photovoltaic units: a review. IOP Conference Series: Earth and Environmental Science, 652(1), p.012024. [8] Poovanaesvaran, P., Alghoul, M., Sopian, K., Amin, N., Fadhel, M. and Yahya, M., 2011. Design aspects of small-scale photovoltaic brackish water reverse osmosis (PV-BWRO) system. Desalination and Water Treatment, 27(1-3), pp.210-223. [9] Nrel.gov. 2021. National Renewable Energy Laboratory (NREL) Home Page. [online] Available at: <https://www.nrel.gov> [Accessed 23 March 2021]. [10] S. Subedi and S. Subedi, "Powering Memphis International Airport with PV Cells", Oxford, 2020. [11] Hodge, B., n.d. Alternative energy systems and applications. [12] Zipp, K., 2021. What are some common types of solar PV and storage installations?. [online] Solar Power World. Available at:

24
<https://www.solarpowerworldonline.com/2015/10/what-are-some-common-types-of-solar-pv-and-storage-installations/> [Accessed 23 March 2021]. [13] Singh, R., n.d. Membrane technology and engineering for water purification. [14] Globalsolaratlas.info. 2021. Global Solar Atlas. [online] Available at: <https://globalsolaratlas.info/download/usa> [Accessed 23 March 2021]. [15] Solaris-shop.com. 2021. [online] Available at: <https://www.solaris-shop.com/content/LG350Q1C-A5%20Specs.pdf> [Accessed 23 March 2021]. [16] Wittholz, M., O'Neill, B., Colby, C. and Lewis, D., 2008. Estimating the cost of desalination plants using a cost database. Desalination, 229(1-3), pp.10-20. [17] Advisian.com. 2021. The Cost of Desalination - Advisian. [online] Available at: <https://www.advisian.com/en/global-perspectives/the-cost-of-desalination> [Accessed 23 March 2021]. [18] Energybot.com. 2021. Electricity Rates By State - EnergyBot. [online] Available at: <https://www.energybot.com/electricity-rates-by-state.html> [Accessed 23 March 2021]. [19] Nrel.gov, 2021. [Online]. Available: https://www.nrel.gov/docs/fy17osti/68023.pdf. [Accessed: 23- Mar- 2021]. [20] W. Save, R. Energy and S. Energy, "Net Metering & Your Bill", Mississippipower.com, 2021. [Online]. Available: https://www.mississippipower.com/residential/ways-to-save/renewable-energy/solar-energy/net-metering---your-bill.html. [Accessed: 23- Mar- 2021]. [21] PV Panels, 2021. [Online]. Available: http://www.apricus.com/solar-pv-systems-pv-panels-19.html#.YH_JzS2cZQI. [Accessed: 21 April 2021]