Embed Size (px)
Citation preview

Evaluation method for maximum of network robustness
index, with single link failure mechanism
Kaveh Rezvani Dehaghanni1a, Ali Naderan2b, Kamran Rahimov3
1- Transportation Engineering Department, Science and Research branch, Islamic Azad University, Tehran, Iran
2- Transportation Engineering Department, Science and Research branch, Islamic Azad University, Tehran, Iran
3- Transportation Engineering Department, payam noor university, Tehran, Iran
e-mail(a): [email protected]
e-mail(b): [email protected],ir
telephone: +98 921 588 7563
Abstract A wide range of relatively short-term disruptive events such as partial flooding, blizzard,
storm, mist, some human mistakes and accidents occur on transportation networks on a daily
basis. These events have profound impacts on traffic flow. This paper aims to present a
methodological approach that estimates the consequences of these events on the network
performance. By using three factors including travel time, DDHV and link length, a formula
was established to calculate travel cost. Afterwards, by employing travel assignment models
(all-or-nothing assignment) and moor algorithm, Rank table importance index of links was
created; Thereby, the most important link of the network was identified and we called that
"critical link". By calculating the travel cost, before and after the removal of important link of
network, the maximum of network robustness index was calculated. This paper takes Tehran
district 4 four transportation network as the subject for case study. The results showed that
the north side of Hengam Ave is the most important part of the network study. By removing
this link from the network, the maximum network ro-bustness index was calculated.
Keywords: network robustness index(NRI); urban highways network; all-or-nothing
assignment; single link failure mechanism; shortest-path tree
1. Introduction
With the rapid development of urbanization, highway network is increasingly
becoming the important skeleton between and within the urban agglomerations, and it plays
an important role in economic and social development of a country or region. There is a
growing awareness that highway networks, are becoming more and more vulnerable to
unforeseen disturbances like incidents and that measures need to be taken in order to make
highway networks more robust, against which disturbances should the network be made
robust? Which factors determine the robustness of a highway network? What is the
relationship between robustness and travel times? Which indicators can be used to quantify
robustness? How can these indicators be computed? This paper addresses these questions by
Scientific Cooperations Journal of Civil Engineering and Architecture, Vol. 3, Issue. 1, December-2017
22

developing a consistent framework for robustness in which a definition, terms related to
robustness, indicators and an evaluation method are included.
Urban transportation infrastructures are complex systems of various connected
components like bridges, highways, tunnels, retaining walls, buildings and etc. Due to their
spatial extent, they are exposed to some human mistakes like accidents, or variable natural
hazards such as earthquakes, flooding, blizzard. Experience from past disastrous events
showed that transportation infrastructures are quite vulnerable due to the lack of redundancy,
the lengthy repair time, the rerouting difficulties or the cascading failures and
interdependencies. These damages greatly could cause of diminishing traffic flow, and
consequently travel time will be increased, businesses will be disrupted, fuel and energy will
be wasted, the environment will be polluted, disruptive in terms of safety of life, and other
socioeconomic problems will emerge.
Erik Jenelius (2010) by using the concept of redundancy, has provided a method to
determine the importance of links in times of network disruptions. Snelder et al. (2012) by
describing the concept of robustness, presented an evaluation method for network
vulnerability against short term variations in the supply. By definition; robustness measures
the ability of a system to continue in operation and, thus, maintain some levels of
functionality, even when exposed to disruption. Like reliability, it is a measure of strength
rather than loss and can be seen as a complement to vulnerability
This paper aims to propose an evaluation and conclusion analysis method for
calculating the amount of urban transportation network users' detriment, after fail of each of
the links method, by using network robustness index(NRI), This method could provide
support to the strategies of improving and optimizing the highway network's resistant ability
against horary natural disasters and human mistakes.
2. Methodology Materials
According to the definitions presented in the previous section; to determine the
network robustness, needs to perform analysis of vulnerabilities in the network. In accordance
with the definition provided Berdica (2002); Vulnerability, means the potential consequences
of a disaster event on system performance. Hence, by using the graph theory, the transport
network is considered as a set of nodes and connected links. Afterwards; the network
robustness is determined; when part or parts of the network (for various reasons such as
Scientific Cooperations Journal of Civil Engineering and Architecture, Vol. 3, Issue. 1, December-2017
23

human mistakes and accidents, weakness of transport system, natural disasters, explosion,
Targeted attacks and etc) are not able to operate. In this paper, a single link failure mechanism
is used for scanning the network. This mechanism is appropriate for failures like accidents,
storms and heavy rainfall at low intensity.
The purpose of this analysis is to specify that "Which part of the network if removed,
therby the network performance in response to travel demand will be more flawed". For this
measure, different criteria have used so far. In this paper we have used importance index and
travel costs before/after the failure in order to calculate the NRI.
The travel cost is calculated according to the following formula:
(1)
Cij : The travel cost from node i to j
Tij : Travel time from node i to j (h)
DDHVij : Directional Design Hour Volume from node i to j (veh/h)
Lij : ij link length (KM)
This cost should be calculated under normal circumstances (before Crisis) for all links
of the network by using all-or-nothing assignment model. To do this; by utilizing moor
algorithm and the minimum length sum in a tree path, shortest-path for the networks' nodes
can be drawn. In the other words; the shortest-path tree must be drawn for all of the networks'
nodes and afterwards travel cost for all nodes is calculated by using the corresponding the
shortest-path tree.
(2)
Travel cost from node i (under normal circumstances)
After calculating the assignment cost for all nodes, by summing the travel cost of all
networks' nodes; the total travel cost (under normal circumstances) will be calculated.
Scientific Cooperations Journal of Civil Engineering and Architecture, Vol. 3, Issue. 1, December-2017
24

(3)
: Total Travel cost (under normal circumstances)
After calculating the total travel cost under normal circumstances, by eliminating a
link of network (links' traffic flow, spreading it to surrounding links); a new shortest-path tree
will be drawn and therefore, the travel cost for each node / total travel cost will be re-
calculated with respect to equation 2 and 3. We call them Ci(f) and Ctotal
(f) Respectively.
Finally, to calculate the NRI and having a correct understanding of effect of a link failure on
the NIR, the difference between the total travel cost must be calculated before and after the
failure. The NRI is an index that indicates the network weakness in the case of an unforeseen
incident and in response to travel demand
(4) -
: Total Travel cost (in disaster time)
It is still an open question that by eliminating which link, the NRI will be maximized?
To answer this question, links' importance index should be considered in the way that link that
contains the most amount of importance index, will be the most effective link of the network.
By removing this link, the maximum travel cost will be imposed on the network. Therefore
the maximum amount of NRI is corresponding to the removing of this link the we called this
link "critical link".
In this paper; importance index Measurement is calculated by the number of access
created to other nodes by each link. For this reason, to finding the importance index, the
shortest-path sum in the trees should be studied under normal circumstances.
Scientific Cooperations Journal of Civil Engineering and Architecture, Vol. 3, Issue. 1, December-2017
25

Fig. 1. Process modeling to determine the NRI
3. Case study: the 4th district of Tehran
In this paper, highways network of the 4th district of Tehran is studied as a case. This
highway network is shown in Fig. 2.
Fig. 2. Tehran district 4 highways network
In accordance with the hierarchy of modeling presented in the previous section, at the
first Step: shown the network based on graph theory.(Fig.3)
Scientific Cooperations Journal of Civil Engineering and Architecture, Vol. 3, Issue. 1, December-2017
26

Fig. 3. Transport networks' Graph
By using the data that obtained by field studies , Aerial Photos and traffic Maps;
(about The volume of traffic , travel time and link length), According to Formula 1, calculate
the travel cost for each link.(see table 1).
Table 1. Travel cost under normal circumstances
Link name DDHV
(Veh/h)
Travel time
(hour)
Link length
(Km)
Travel cost
(
AB 6250 0.03 1.5 125
BC 6600 0.04 2.7 98
CD 6250 0.012 0.7 104
EF 6270 0.036 1.8 125
FG 6380 0.048 2.6 118
GH 6350 0.042 1.8 148
IJ 3225 0.13 2.6 161
JK 4800 0.01 0.5 96
KL 4525 0.048 1.9 114
AE 6525 0.038 2.7 92
EI 5950 0.083 2.5 198
BF 4835 0.043 2.6 80
FJ 3775 0.08 3.2 94
Scientific Cooperations Journal of Civil Engineering and Architecture, Vol. 3, Issue. 1, December-2017
27

CG 4165 0.113 3.0 157
GK 3865 0.12 2.4 193
DH 4545 0.163 5.7 130
HL 4595 0.042 1.7 114
In the figure below; all of the the links' travel cost shown on the network graph.(Fig.4)
Fig. 4. The travel cost of each link under normal circumstances
After calculating the travel cost of each link; by using all-or-nothing assign method
and moor algorithm, the shortest-path tree to was drawn for all nodes (Figure 5).
Fig. 5. The shortest-path tree of all nodes under normal circumstances
Scientific Cooperations Journal of Civil Engineering and Architecture, Vol. 3, Issue. 1, December-2017
28

After assigning of the nodes, Due to the existing routes of shortest-path trees and use
of(Equation 2); the cost of traveling from one node to other nodes is calculated. The following
table shows the cost of travel from node A (see table 2).
Table 2. Assignment of node A and its cost
S
ource(i) Destination(j)
Route:
Traveled link(s) Cost of travel summation
A
B AB 125 125
C AB-BC 125+98 223
D AB-BC-CD 125+98+104 327
E AE 92 92
F AE-AF 92+125 217
G AE-EF-FG 92+125+118 335
H AB-BC-CD-DH 125+98+104+130 457
I AE-EI 92+198 290
J AE-EF-FJ 92+125+94 311
K AE-EF-FJ-JK 92+125+94+96 407
L AE-EF-FJ-JK-KL 92+125+94+96+114 521
= CAB+CAC+CAD+CAE+CAF+CAG+CAH+CAI+CAJ+CAK+CAL
5+223+327+92++217+335+457+290+311+407+521 = 3305
Similarly, this cost is calculated for other network nodes. Subsequently, in accordance
with (Equation 4) the sum of these costs, the total travel of Network will be calculated that is
visible in the table blow(see table 2).
Table 3. The travel cost from a node to another nodes under normal circumstances
sum
3305 2516 2737 3366 2975 2125 2533 3162 3842 2465 2822 3349 35197
Scientific Cooperations Journal of Civil Engineering and Architecture, Vol. 3, Issue. 1, December-2017
29

Now we can by removing a link of Network, calculating the NRI. But to maximize the
NRI, we need to determine the importance index for each link and finding the critical link.
For this purpose; by using the shortest-path-tree and access routes to the nodes, we
compiled the following table. The numbers that inserted in front of each link, Represents the
number of accesses that provided in each assignment to other nodes. For example, on
assignment of node A, AB link provides access to other 9 nodes , or on assignment of node
E, IJ link does not provide access to any node (see table 4). According to the description
provided, it is obviously, the larger the sum of the numbers in front of each link, the link has a
greater role in the assignment of network. Therefore, the largest number of table is the number
that is corresponding to critical link.
Table 4. Ranking of the link importance
A B C D E F G H I J K L SUM
AB 9 1 1 1 0 1 1 1 0 1 1 1 18
BC 3 3 6 6 2 2 0 2 2 2 0 0 28
CD 2 2 3 9 1 1 1 3 1 1 0 1 25
EF 0 2 1 1 9 1 1 1 0 1 1 1 19
FG 1 1 0 0 2 2 6 2 1 1 0 0 16
GH 0 0 0 0 1 1 2 3 0 0 0 1 8
IJ 0 0 1 1 0 1 1 1 9 1 1 1 17
JK 2 2 0 0 2 2 0 2 3 3 6 6 28
KL 1 1 0 0 1 1 0 3 2 2 3 7 21
EA 2 0 0 0 1 0 0 0 1 0 0 0 4
EI 1 1 0 0 1 0 0 0 2 0 0 0 5
FB 5 7 4 4 3 4 2 0 3 4 2 2 40
FJ 3 3 2 2 3 4 2 0 5 7 4 4 39
CG 0 0 2 2 0 0 2 0 0 0 1 0 7
GK 0 0 1 1 0 0 1 0 0 0 2 0 5
HD 1 1 2 2 0 0 0 4 0 0 1 2 13
HL 0 0 1 1 0 0 1 4 1 1 2 4 15
Scientific Cooperations Journal of Civil Engineering and Architecture, Vol. 3, Issue. 1, December-2017
30

According to the above table, FB link is critical link of the network. Assuming failure
in the critical link, by removing this link of network; calculated the travel cost again.
According to, absence of FB link, and spreading its traffic on nearby links; drawing a new
network graph for disaster time(Fig. 6).
Fig. 6. Travel cost in disaster time
Due to occurrence the changes in links' travel cost and absence of FB link, nodes
assignment will be changed (Except node H, because there wasn't the FB link in the shortest-
path tree of node H). (Fig. 7)
Fig. 7. The shortest-path tree of all nodes in disaster time
Scientific Cooperations Journal of Civil Engineering and Architecture, Vol. 3, Issue. 1, December-2017
31
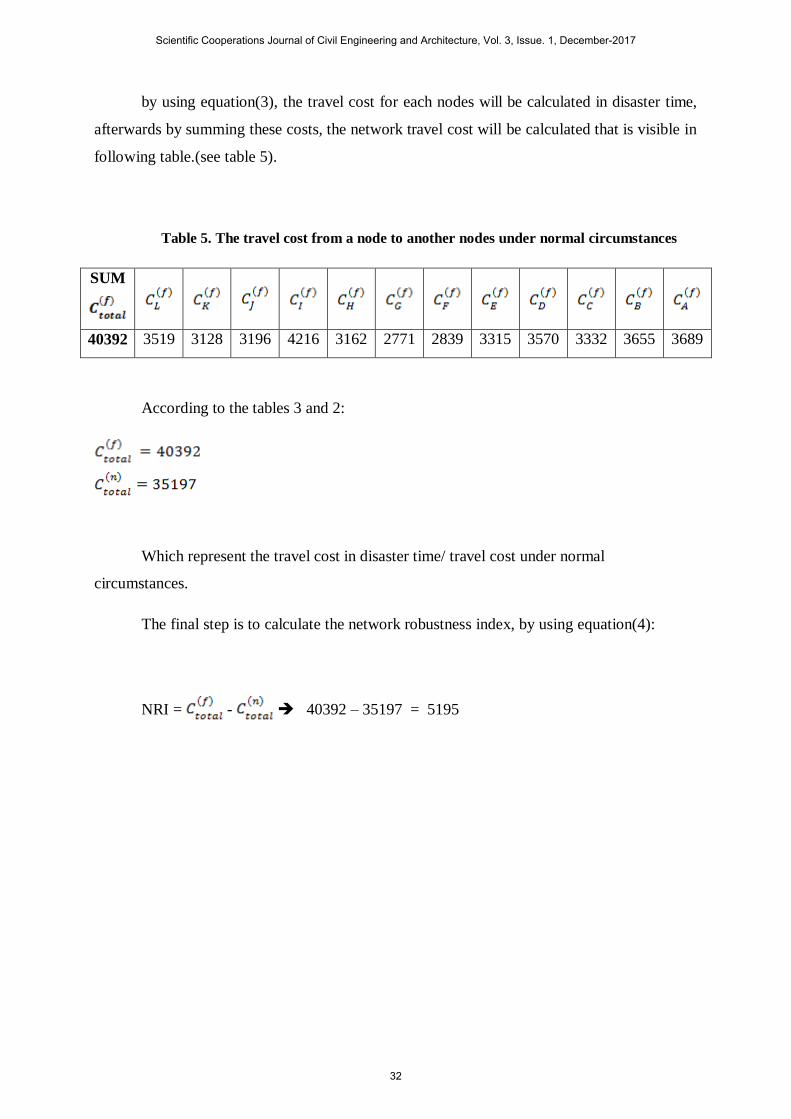
by using equation(3), the travel cost for each nodes will be calculated in disaster time,
afterwards by summing these costs, the network travel cost will be calculated that is visible in
following table.(see table 5).
Table 5. The travel cost from a node to another nodes under normal circumstances
SUM
3689 3655 3332 3570 3315 2839 2771 3162 4216 3196 3128 3519 40392
According to the tables 3 and 2:
Which represent the travel cost in disaster time/ travel cost under normal
circumstances.
The final step is to calculate the network robustness index, by using equation(4):
NRI = - 40392 – 35197 = 5195
Scientific Cooperations Journal of Civil Engineering and Architecture, Vol. 3, Issue. 1, December-2017
32

Reference
D.M.Scott, D.C.Novak, L.Altman-Hull, F.Gue, (2006) "Network robustness index: A new
method for identifying critical links and evaluating the performance of transportation
networks.," Journal of Transport Geography, pp. 215-227.
D'Este, G.M. and M.A.P. Taylor, (2003), "Network vulnerability: an approach to reliability
analysis at the level of national strategic transport network.," The network reliability of
transport, pp. 23-44.
E.Jenelius, "Redundancy importance: Links as rerouting alternatives during road network
disruptions.," Procedia Engineering, pp. 129-137, 2010.
Ham, H., T. J. Kim and D. Boyce, (2005), "Assessment of economic impacts from unexpected
events with an interregional commodity flow and multimodal transportation network
model.," Transportation Research Part A, pp. 849-860.
J.Sullivan, D.C.Novak, L.Aultman-hall, D.M.Scott, (2010) "Identifying critical road segments
and measuring system-wide robustness in transportation networks with isolating links: A
link-based capacity-reduction approach.," Transportation Research Part A: Policy and
Practice, pp. 323-336.
K. Berdica, (2002), "An introduction to road vulnerability: what has been done, is done and
what should be done.," Transport Policy, pp. 117-127.
M. Snelder , H.J. van Zuylen and L.H. Immers, (2012) " A framework for robustness analysis
of road networks for short term variations in supply., "Transportation Research Part A, pp.
828-842.
Tatano, H. and S. Tsuchiya, (2008), "A framework for economic loss estimation due to
seismic transportation network disruption: a spatial computable general equilibrium
approach.," Natural Hazards, p. 253–265.
Scientific Cooperations Journal of Civil Engineering and Architecture, Vol. 3, Issue. 1, December-2017
33