Embed Size (px)
Citation preview

RESEARCH ARTICLE
Evaluation method on seismic risk of
substation in strong earthquake area
Jiawei Cui1¤a, Ailan CheID1¤a*, Sheng Li2¤b, Yongfeng Cheng2¤b
1 Department of Civil Engineering, Shanghai Jiao Tong University, Shanghai, China, 2 Department of
Electric Engineering, China Electric Power Research Institute, Xicheng District, Beijing, China
¤a Current address: Ocean and Civil Engineering, Shanghai Jiao Tong University, Shanghai, China
¤b Current address: China Electric Power Research Institute, Xicheng District, Beijing, China
Abstract
Frequent earthquakes in strong earthquake areas pose a great threat to the safety operation
of electric power facilities. There exists a pressing research need to develop an assessment
method for the seismic risk of substations, i.e., the hubs of power system networks. In this
study, based on Incremental Dynamic Analysis (IDA), Probabilistic Seismic Demand Model
(PSDM) and reliability theory, a vulnerability model for a substation is obtained, based on
considering the relationships between Peak Ground Acceleration (PGA) and four seismic
damage states (complete, extensive, moderate, and slight.) via a probabilistic approach.
After an earthquake, the scope of influence and PGA distribution are evaluated using infor-
mation recorded by the seismic observation stations, based on using interpolation or an
empirical formula for the PGA attenuation. Therefore, the seismic risk can be evaluated by
combining ground motion evaluation and the pre-built vulnerability model. The Wuqia- Kash-
gar area of Xinjiang was selected as the study area; it is an Earthquake-prone area, and one
of the starting points for new energy transmission projects in China. Under a hypothetical
earthquake (MS 7.9), the seismic risk of the substations was evaluated. The results show
that: this method is able to give the probabilities of the four damage states of the substations,
four substations close to the epicenter only have a probability of slight damage (45%-88%)
and other substations are safer.
1. Introduction
A power system, is one of the main lifeline projects for a nation, society, and economy, and
damage to a power system can cause unpredictable losses [1]. The safety of a substation is par-
ticularly important, as it acts as a hub of the power system [2,3]. The most destructive factor
threatening a substation is undoubtedly an earthquake. For example, the 1976 Tangshan earth-
quake caused severe damage to the corresponding power system, making the city’s lifeline
projects unable to function normally, including those for the water supply, communications,
combustion gas, medical aid, heat supply, firefighting, and material supply [4]. The 1989 Loma
earthquake caused damage to three major substations at Moss Landing, Metcalf, and San
Mateo in the San Francisco Bay area, respectively, resulting in power outages for 1.4 million
PLOS ONE
PLOS ONE | https://doi.org/10.1371/journal.pone.0258792 December 2, 2021 1 / 22
a1111111111
a1111111111
a1111111111
a1111111111
a1111111111
OPEN ACCESS
Citation: Cui J, Che A, Li S, Cheng Y (2021)
Evaluation method on seismic risk of substation in
strong earthquake area. PLoS ONE 16(12):
e0258792. https://doi.org/10.1371/journal.
pone.0258792
Editor: Ahad Javanmardi, Fuzhou University,
CHINA
Received: May 30, 2021
Accepted: October 6, 2021
Published: December 2, 2021
Peer Review History: PLOS recognizes the
benefits of transparency in the peer review
process; therefore, we enable the publication of
all of the content of peer review and author
responses alongside final, published articles. The
editorial history of this article is available here:
https://doi.org/10.1371/journal.pone.0258792
Copyright: © 2021 Cui et al. This is an open access
article distributed under the terms of the Creative
Commons Attribution License, which permits
unrestricted use, distribution, and reproduction in
any medium, provided the original author and
source are credited.
Data Availability Statement: Our data set has
been committed to a public repository and the
relevant DOIs is https://datadryad.org/stash/
dataset/doi:10.5061/dryad.8gtht76q6.

customers [5]. In the 2008 Wenchuan earthquake in China, there were more than 40 cases of
leakage, seven cases of displacement, and 58 cases of casing damage in the transformers of 110
kV (and above) substations in the Sichuan Power Grid (Fig 1) [6]. Many studies have shown
that major earthquakes may cause severe damage to substations; this will not only lead to the
interruption of the main services of the power system, but will also affect earthquake relief
work. Recently, ultra-high voltage transmission and transformation systems with bulk power
grids, large generation units, high voltages and high automation have been gradually applied
in power systems [7]. However, as the voltage level of a substation continues to increase, its
vulnerability will also increase, and the consequences and losses caused by damage to it will
become increasingly serious [8,9]. Therefore, it is very important to evaluate the seismic risk of
substations after an earthquake; this can not only help reasonably allocate maintenance per-
sonnel and paths, but can also ensure the rapid restoration of power and smooth progress in
disaster relief work.
In view of this, scholars have conducted many seismic studies on substations, mainly from
two perspectives: seismic performance, and the vulnerability of the electrical equipment. Anal-
yses of the seismic performances of substations have generally been performed based on
numerical simulations [10–12] and physical modeling [13,14]. However, these studies have
focused on the seismic design, isolation, and damping measures for power facilities before an
earthquake. It is difficult to accurately and comprehensively assess the damage state of a sub-
station after an earthquake. In contrast, the vulnerability analysis method uses probability to
evaluate the seismic risk of a substation [15]. The vulnerability analysis method for power facil-
ities is different from that for general civil construction and industrial equipment. Although
there may be no major structural damage, the function may be seriously affected. A database
addressing the seismic performances of substation equipment in California, jointly funded by
Pacific Gas and Electric and Pacific Earthquake Engineering Center, contains relatively com-
plete seismic damage data. The method employed constructs a relationship curve between the
equipment damage rate and ground motion parameters through statistical analysis of histori-
cal earthquake damage data, i.e., a vulnerability model. Based on the damage to facilities of the
Sichuan power grid in the Wenchuan earthquake, Hailei et al. and Mingpan used statistical
regression methods to fit the vulnerability curves of various substation equipment, based on
statistics from historical records of substation earthquake disasters [16,17]. Anagnos et al.
drew a failure probability curve for substation equipment based on detailed data from the Cali-
fornia substation earthquake disaster [18]. Although a seismic damage statistical analysis
method is generally more accurate, it is difficult to obtain sufficient statistical data, and histori-
cal data are time-effective.
Another method of building the vulnerability model uses shaking-table testing and numeri-
cal simulations. The former is used to evaluate the dynamic characteristics of a structure, and
the latter is used to obtain large amounts of data samples. Paolacci et al. conducted a vulnera-
bility analysis for a high-voltage isolating switch [19]. Zareei et al. built a vulnerability model
for a 420 kV circuit breaker with multivariate vulnerability [20]. Bender J et al. studied the vul-
nerability of a high-voltage bushing of a main transformer [21]. A vulnerability model can con-
struct a relationship between seismic intensity and the seismic damage states of power
facilities; moreover, the research on single power facilities is relatively mature. Therefore, it is
possible to quickly evaluate the damage states of power facilities after an earthquake by com-
bining the ground motion evaluations and vulnerability model. However, the design of a sub-
station is redundant, and thus the destruction of a single device does not necessarily lead to the
failure of the substation. The relative importance of each power equipment in a substation sys-
tem is also different. Nevertheless, it is very important to study how to evaluate the seismic vul-
nerability of substations from an overall perspective.
PLOS ONE Evaluation method on seismic risk of substation in strong earthquake area
PLOS ONE | https://doi.org/10.1371/journal.pone.0258792 December 2, 2021 2 / 22
Funding: This work was part of the Program on
‘Visualization of post-disaster information based on
big data mining technology’ and ‘Study on on-line
seismic monitoring and rapid damage evaluation
method for substation (converter station).’ funded
under the Ministry of Science and Technology of
the People’s Republic of China, (grant number
2018YFC1504504 and 2018YFC0809404) awarded
to AC. The project provides funding for research
into how to quickly and effectively assess damage
and visualize disaster information after an
earthquake.
Competing interests: The authors have declared
that no competing interests exist.

This study presented herein is aimed at proposing a method for evaluating the seismic risk
of a substation after an earthquake. The power facilities in the substation are divided into nine
categories, and are assigned importance weights. A vulnerability model for substations with
different voltage levels is constructed based on using an IDA, PSDM, and reliability theory in
advance of an earthquake. When an earthquake occurs, the ground motion information, such
as the epicenter, intensity, PGA, and distance to the epicenter can be quickly obtained through
widely distributed seismic observation stations and a PGA attenuation law. Within the scope
of seismic influence, the ground motion information of the substations is combined with the
pre-built vulnerability model to complete seismic risk evaluations for substations with differ-
ent voltage levels. A flowchart of this process is shown in Fig 2.
2. Evaluation of ground motion based on seismic observation
stations
After an earthquake occurs, it is necessary to quickly obtain the PGA at the locations of the
substations for a seismic risk assessment. However, not every substation has complete ground
motion recording equipment, and even if so, the equipment are likely to be damaged during
an earthquake. Widely distributed seismic observation stations can record ground motion
information in real time. At present, most countries and regions worldwide have built com-
plete networks of seismic observation stations. The United States Federal Emergency Manage-
ment Agency has developed a disaster assessment system network including Shakemap,
Hazards US, and ‘Prompt Assessment of Global Earthquakes for Respons’ systems, which can
provide intensity information within 3–5 min after an earthquake. Japan has the "K-NET" and
"KIKI-NET" seismic observation networks for quickly providing disaster investigations, quick
intensity map reports, and other information. In Europe, multi-source observation methods
such as those based on optics, light detection and ranging, and specific absorption rates are
used to monitor earthquake disasters and analyze dynamic disaster conditions. By 2021, China
will have 15,391 seismic observation stations, thereby ensuring that the spacing between sta-
tions in key surveillance areas is within 25 km. Therefore, the information recorded by seismic
Fig 1. Destruction of power facilities in the Wenchuan earthquake.
https://doi.org/10.1371/journal.pone.0258792.g001
PLOS ONE Evaluation method on seismic risk of substation in strong earthquake area
PLOS ONE | https://doi.org/10.1371/journal.pone.0258792 December 2, 2021 3 / 22

observation stations can effectively provide ground motion inputs for seismic risk assessments
of substations over a wide area.
However, there are many substations with different voltage levels over a large area and these
substations do not necessarily coincide with seismic observation stations network. In order to
obtain the PGA of the substation location after the earthquake, the distribution law of PGA can
only be obtained by fitting the PGA data of the seismic network. In general, the attenuation
model of PGA is difficult to consider the effect of site conditions. It is a complex process to clarify
the influence of site conditions of hundreds of substations in a region on PGA in detail. In gen-
eral, as with seismic observation stations, the foundation of the substation is reinforced and can
be thought of as free ground shaking. The effect of ignoring the amplifying effects of soft soils can
be considered small. Therefore, ignoring site conditions can ensure the efficiency of seismic risk
assessment of substations, and will not affect the accuracy of probability-based assessment.
In view of the attenuation law of the PGA in the process of ground motion propagation,
‘Evaluation of Earthquake Safety of Engineering Site’ (GB17741-2005) provides recommended
attenuation models, along with a unified expression as follows:
lgðPGAÞ ¼ C1 þ C2M þ C3M2 þ ðC4 þ C5MÞlg½Rþ C6expðC7MÞ� ð1Þ
In the above, M is the earthquake magnitude, and can be statistically regressed through the
surface wave magnitude (MS). R is a distance parameter. Ci(i = 1,2,. . .,7) are the regression
parameters. C6exp(C7M) is the near-field saturation factor, and is usually determined in
advance according to the focal depth, and C3M2 is a large earthquake saturation factor.C2M is
used to explain how high-frequency components often increase the acceleration in strong
earthquake recording waves. In this study, the magnitude correlation factor and distance
parameter correlation factor in the model were first decoupled, and then a distributed statisti-
cal regression was conducted to obtain the other parameters.
Fig 2. Flowchart of seismic damage assessment of substation.
https://doi.org/10.1371/journal.pone.0258792.g002
PLOS ONE Evaluation method on seismic risk of substation in strong earthquake area
PLOS ONE | https://doi.org/10.1371/journal.pone.0258792 December 2, 2021 4 / 22

Eq (1) contains seven regression parameters. The results from a direct statistical regression
still cannot meet the accuracy requirements for the free surface motion evaluation. Thus, it is
necessary to propose further hypotheses and simplify the model. A commonly used method is
to decouple the magnitude correlation factor and distance parameter correlation factor in the
model, and then to perform statistical regression step-by-step to obtain other parameters. For
a specific earthquake, the magnitude-related factors have little influence on the attenuation
model. Therefore, the correlation factor for the distance parameter can be first calculated
based on statistical regression, and the attenuation formula can be simplified as follows:
lgðPGAÞ ¼ C8 þ C9lgðRþ C10Þ ð2Þ
Here, C10 = C6exp(C7M). After fitting C8, C9, and C10 based on historical earthquake infor-
mation, other parameters can be obtained by further linear regression.
3. Vulnerability model for substations with different voltage levels
Earthquake disasters have evident regional characteristics, and there are often many different
voltage substations within the scope of seismic influence. To evaluate the seismic risk, it is nec-
essary to construct a vulnerability model. According to this paper [22], the vulnerability of a
substation is determined based on the vulnerability of its power facilities. Therefore, assuming
that each power facility is independent of the others, a vulnerability model for a substation can
be obtained by combining these vulnerabilities. This section takes a 750 kV main transformer
as an example to illustrate the construction process of the vulnerability model. The building
process was as follows.
The power facilities in the substation were divided into nine categories, and corresponding
importance weights were determined.
① A finite element model was built for each single power facility, and the natural frequency,
natural period, key vulnerable parts, and limit state of each single power facility were
analyzed.
② Ground motion records were selected for the numerical calculations, and an amplitude
modulation was performed on them.
③ The vulnerability model for a single power facility was built based on IDA, the PSDM, and
reliability theory.
④ The vulnerability model of the substation was built by assigning importance values to the
power facilities of various categories.
3.1 Vulnerability model of single power facility: Case on 750 kV main
transformer
3.1.1 Structural properties and seismic damage characteristics of 750 kV main-
transformer.
(1) Nature characteristic:
The geometric dimensions and material parameters of a 750 kV main transformer can be
obtained based on the "General design of power transmission and transformation project of
State Grid." [23]. Then, the basic form of the finite element model is determined by extracting
its geometric and material properties (Fig 3). The transformer comprises a main body, hoist
seat, flange, low-voltage bushing, medium-voltage bushing, high-voltage bushing, and coun-
terweight on busing top. The material and geometric parameters are listed in Table 1. Through
PLOS ONE Evaluation method on seismic risk of substation in strong earthquake area
PLOS ONE | https://doi.org/10.1371/journal.pone.0258792 December 2, 2021 5 / 22

Fig 3. Finite element model of 750 kV main transformer and key vulnerability parameters (① the top displacement of
the high-voltage bushing Ug; ② the maximum bending stress at the root of the high-voltage bushing Sg; ③ the top
displacement of the medium-voltage bushing Uz; ④ the maximum bending stress at the root of the medium-voltage
bushing Sz).
https://doi.org/10.1371/journal.pone.0258792.g003
Table 1. Parameters of 750 kV main transformer.
Number Parameter Value
1 The length of main body (m) 6
2 The width of main body (m) 2.5
3 The height of main body (m) 3
4 The weight of main body (kg) 300000
5 The elastic modulus of high-voltage bushing (GPa) 100
6 Poisson ratio of high-voltage bushing 0.38
7 The length of high-voltage bushing (m) 8
8 The outside diameter of high-voltage bushing (m) 0.5
9 The wall thickness of high-voltage bushing (m) 0.05
10 The weight of high-voltage bushing (kg) 5000
11 Equivalent stiffness coefficient of flange section 0.5
12 The ratio of medium-voltage bushing (for high-voltage) 0.4
13 The ratio of low-voltage bushing (for medium-voltage) 0.4
https://doi.org/10.1371/journal.pone.0258792.t001
PLOS ONE Evaluation method on seismic risk of substation in strong earthquake area
PLOS ONE | https://doi.org/10.1371/journal.pone.0258792 December 2, 2021 6 / 22

numerical simulation, the characteristic frequency is determined as 1.42, and the characteristic
period is 0.7091 s.
(2) Key vulnerable parameters
Because the main body is heavy and has a fixed device at the bottom, a 750 kV main trans-
former rarely overturns and slips. However, a 750 kV main transformer contains composite
insulator bushing. Owing to its mass concentration, large slenderness ratio, and brittle mate-
rial, it can easily crack or break in the event of an earthquake [19]. Therefore, the bending
stress at the root of the bushing and displacement of the top of the bushing are the limiting
parameters. Four key vulnerable parameters are identified (Fig 3).
(3) Limit states:
In the vulnerability model for the power facilities, the limit states or seismic capacities of
the key parameters refer to the quantitative description of four damage states: complete, exten-
sive, moderate, and slight [24]. Table 2 defines the four seismic damage states corresponding
to the 750 kV main transformer [25]. Based on the structural properties and material proper-
ties of the composite insulator bushing, it is considered that the bushing will undergo complete
damage if the displacement of the casing exceeds 1/12 of the structural height and the maxi-
mum bending stress exceeds 40 MPa approximately. According to the literature [26], multiples
of 0.7, 0.4, and 0.2 of the complete damage parameter values are selected for the extensive,
moderate, and slight damage limit states, respectively (Table 3).
3.1.2 Selection and treatment of ground motion. To perform the IDA, a large number of
ground motion time history records need to be selected. The selected ground motion records
should have various applicability, and should not be restricted by the site. In addition, the dis-
creteness of the ground motion records within a wide period range should also be considered,
i.e., to ensure occasional uncertainty. Baker recommended a Pacific Earthquake Engineering
Research (PEER) strong earthquake database ground motion record series [27]. Based on
‘Code for seismic design of power facilities (GB 50260)’, and ‘Code for seismic design of build-
ings (GB50011)’, the selection principle for the seismic waves for the IDA of 750 kV main
transformer is shown in Table 4.
Then, 20 pieces of ground motion time history are identified from the PEER strong motion
database according to the above conditions (Table 5).
3.1.3 Incremental dynamic analysis (IDA) of 750 kV main transformer.
(1) IDA method:
Table 2. Four limit states of 750 kV main transformer.
Limit state Define
Complete damage Impaired major functions. It may take a long time (e.g., 60 days) to repair
Extensive damage Partial function interruption. It can be repaired over a period of time (e.g., 15 days)
Moderate damage Some functions can be restored after a short interruption
Slight damage Function play without interruption
https://doi.org/10.1371/journal.pone.0258792.t002
Table 3. Parameter values of limit states of 750 kV main transformer.
Key vulnerability parameters Parameter values of limit states
Complete Extensive Moderate Slight
Ug (mm) 600 420 240 120
Sg (MPa) 40 28 16 8
Uz (mm) 200 140 80 40
Sz (MPa) 40 28 16 8
https://doi.org/10.1371/journal.pone.0258792.t003
PLOS ONE Evaluation method on seismic risk of substation in strong earthquake area
PLOS ONE | https://doi.org/10.1371/journal.pone.0258792 December 2, 2021 7 / 22

The IDA is a method for performing multiple dynamic time history analyses of a structural
system. According to the calculation results, the dynamic response of the structural system can
be obtained, and the results can be applied to a performance-based evaluation of the structure
[28]. First, each selected ground motion record is multiplied by a series of scale factors for
amplitude modulation, as shown in Eq (3). Subsequently, the multiple ground motion records
after amplitude modulation are used for a dynamic analysis of the structure. Finally, the IDA
curve is plotted to evaluate the performance of the structure.
al ¼ l � a ð3Þ
In the above, a is the recorded acceleration value before amplitude modulation, and is
shorthand for a(ti); λ is the adjustment coefficient; and aλ is the recorded acceleration value
after amplitude modulation.
According to the literature [29], when the earthquake intensity index is at the PGA, the
amplitude levels shown in Table 6 can be used to perform the ground motion intensity ampli-
tude modulation.
(2) Results of the IDA:
The characteristic period of 750 kV main transformer is 0.7019. Thus, the amplitude adjust-
ment for the 20 ground motion data are 0.1 g, 0.2 g, 0.3 g, 0.4 g, 0.5 g, 0.6 g, 0.7 g, 0.8 g, 0.9 g,
1.0 g, 1.1 g, 1.2 g, 1.3 g, 1.4 g, and 1.5 g. In this way, a total of 20 × 15 = 300 ground motion rec-
ords is obtained.
Table 4. Selection principle of ground motion records.
Parameter Natural vibration period of 750 kV main transformer (s) Venue category Earthquake grouping Earthquake influence coefficient
Attribute value 0.7091 3 3 0.08
https://doi.org/10.1371/journal.pone.0258792.t004
Table 5. Pieces of information related to ground motion records.
Number Time and Station Name Joyner-Boore distance (km) MS PGA (g/10−2)
1 1941 Ferndale City Hall 91 6.6 4.53
2 1942 El Centro Array 57 6.5 2.86
3 1951 El Centro Array 25 5.6 5.90
4 1952 LA—Hollywood Stor FF 115 7.36 5.33
5 1952 Pasadena—CIT Athenaeum 123 7.36 4.48
6 1952 San Luis Obispo 73 6 3.71
7 1953 El Centro Array 15 5.5 4.39
8 1955 El Centro Array 14 5.4 5.17
9 1956 El Centro Array 121 6.8 5.14
10 1960 Ferndale City Hall 57 5.7 5.97
11 1966 Cholame—Shandon Array 18 6.19 4.72
12 1960 San Onofre—So Cal Edison 129 6.63 4.15
13 1968 Via Tejon PV 55 6.61 2.91
14 1971 LB—Terminal Island 58 6.61 3.11
15 1971 Port Hueneme 68 6.61 2.38
16 1971 Puddingstone Dam (Abutment) 52 6.61 4.55
17 1971 San Juan Capistrano 108 6.61 3.99
18 1971 UCSB—Fluid Mech Lab 124 6.61 1.80
19 1971 Wheeler Ridge—Ground 68 6.61 3.23
20 1971Wrightwood—6074 Park Dr 61 6.61 4.55
https://doi.org/10.1371/journal.pone.0258792.t005
PLOS ONE Evaluation method on seismic risk of substation in strong earthquake area
PLOS ONE | https://doi.org/10.1371/journal.pone.0258792 December 2, 2021 8 / 22

Based on the dynamic time-history analysis method, a finite element analysis of 750 kV
main transformer is conducted based on 300 ground motion records. Then, the dynamic
response values of the four key vulnerable parameters of 750 kV main transformer can be plot-
ted in Cartesian and logarithmic coordinate systems (Fig 4). These figures indicate that the
seismic response values of four key vulnerability parameters (Ug, Sg, Uz, Sz.) under 20 sets of
seismic waves, where the red line is the median of the seismic response values of 20 seismic
waves under different PGA (0.1 g, 0.2 g, . . ., 1.5 g.). The bushing comprises a brittle material,
and shows no evident deformation. Therefore, the shaded part in the figure indicates that the
bushing has been completely destroyed.
3.1.4 Vulnerability model of 750 kV main transformer based on probabilistic seismic
demand model (PSDM).
(1) Vulnerability model of each key vulnerable parameter based on PSDM:
The vulnerability model is built using the PSDM. The main purpose of the PSDM is to
establish a probabilistic relationship between the intensity of ground motion and the seismic
demand of a certain type of structure. Under the assumption that the seismic demand D of the
structure and peak ground motion IM obey a lognormal distribution, the failure probability of
the structure is expressed as follows [30]:
P½D � C=IM� ¼ Fln IMð Þ � ln�C � lna
bffiffiffiffiffiffiffiffiffiffiffiffiffiffib2D=IMþb
2C
p
b
0
B@
1
CA ð4Þ
Here, �D is the median value of the seismic response of structure; �C is the median value of
the structural seismic capacity, i.e., ultimate failure value of structure under earthquake action;
βC is the standard deviation of the structural seismic capacity, in general, take 0.2; βD/IM is the
log standard deviation of the structural seismic demand, and its median is ln�D; its standard
deviation is σ. a and b are unknown parameters that must be obtained through regression anal-
ysis. The value of βD/IM, a, and b can be estimated as follows:
lnð�DÞ ¼ blnðIMÞ þ lnðaÞ ð5Þ
bD=IM≅;
ffiffiffiffiffiffiffiffiffiffiffiffiffiffiffiffiffiffiffiffiffiffiffiffiffiffiffiffiffiffiffiffiffiffiffiffiffiffiffiffiffiffiffiffiffiffiffiffiXðlnðdiÞ � lnðaIMb
i ÞÞ2
N � 2
s
ð6Þ
In the above, di is the peak earthquake demand, and IMi is the peak ground motion. N is
the number of samples.
The seismic response results of each key vulnerability parameter from 3.1.3 was input into
Eq (6) to calculate the βD/IM value, as shown in Table 7.
Then, according to the calculation results of the above sections and the limit states of each
key vulnerable parameter, their vulnerability model can be obtained through Eq (4), as shown
in Fig 5. These figures illustrate that the probability of four seismic states of key vulnerability
parameters under different PGA. It can be seen that the seismic vulnerability of high-voltage
Table 6. Criterion for earthquake amplitude modulation.
Characteristic period of structure T(s) Amplitude of PGA
T� 0.5 s {0.1 g, 0.2 g, 0.3 g, . . ., 3.0 g}
0.5 s < T� 2 s {0.1 g,0.2 g,0.3 g, . . ., 1.5 g}
2 s < T {0.1 g, 0.2 g, 0.3 g, 0.4 g, 0.5 g}
https://doi.org/10.1371/journal.pone.0258792.t006
PLOS ONE Evaluation method on seismic risk of substation in strong earthquake area
PLOS ONE | https://doi.org/10.1371/journal.pone.0258792 December 2, 2021 9 / 22

PLOS ONE Evaluation method on seismic risk of substation in strong earthquake area
PLOS ONE | https://doi.org/10.1371/journal.pone.0258792 December 2, 2021 10 / 22

busing is higher than that of medium-voltage busing. High-voltage busing has a larger size
than the medium, resulting in lower stiffness. As a result, high-voltage busing is more vulnera-
ble to earthquakes. This shows the correctness of the analysis results from the side.
(2) Vulnerability model of 750 kV main transformer
After obtaining the vulnerability model for each key vulnerable parameter of the main
transformer, it is necessary to determine the joint probability distribution of the different key
vulnerable parameters reaching the limit state to construct the vulnerability model for the 750
kV main transformer. The seismic damage states between key vulnerable parameters are inde-
pendent of each other, and their contributions to the overall functional loss of the system are
the same. Therefore, the key vulnerable parameters are connected in series. Based on a simpli-
fied method of reliability theory, the reliability (probability of failure) of the series system is
defined as follows [31]:
max½PðEiÞ� � Pfs �Xn
i¼1
PðEiÞ; 1
" #
ð7Þ
Here, P(Ei) is the failure probability of a single critical factor, and Pfs is the failure probabil-
ity of the system. The lower boundary in Eq (7) represents the failure probability of the system
when the failure events of the key vulnerable parameters are completely correlated, and the
upper boundary represents the failure probability of the system when the failure events of each
component are mutually exclusive. Furthermore, when the failure events of the key vulnerable
parameters are statistically independent, the upper boundary can be rewritten as follows:
Pfs ¼ 1 �Yn
i¼1
½1 � PðEiÞ� ð8Þ
The probability curves of the three failure states for each key vulnerable parameter are
substituted into Eqs (7) and (8). Then, the upper and lower boundaries of the four seismic
damage state probabilities can be obtained for 750 kV main transformer; these comprise its
vulnerability model (Fig 6). It can be seen that probabilistic seismic vulnerability analysis
obtains the damage probability of the electrical equipment under different earthquake intensi-
ties, and quantitatively describes the seismic performance of the equipment. For example,
when the intensity of the PGA reaches 1.0 g, the probabilities of the four damage states for the
750 kV main transformer are 100%, 97%–100%,15%–28%, and 0%, respectively.
3.2 Vulnerability model of substations with different voltage levels
3.2.1 Classification of power facilities. Because the relative importance and contribu-
tions of the different power facilities to the seismic damage of the substation are different and
Fig 4. Incremental dynamic analysis (IDA) of key vulnerable parameters. (a) IDA of Ug. (b) IDA of Sg. (c) IDA of
Uz. (d) IDA of Sz.
https://doi.org/10.1371/journal.pone.0258792.g004
Table 7. Logarithmic standard deviation of each key vulnerable parameter.
Vulnerable parameters Regression equation Coefficient of determination R2 logarithmic standard deviation βD/IM Correlation coefficient ρUg ln(Ug) = 1.0000ln(PGA)+1.1434 0.47 1.09 0.68
Sg ln(Sg) = 1.0006ln(PGA)+3.1125 0.53 1.02 0.73
Uz ln(Uz) = 1.0075ln(PGA)+2.2827 0.40 0.55 0.63
Sz ln(Sz) = 1.0000ln(PGA)+2.9382 0.47 0.58 0.69
https://doi.org/10.1371/journal.pone.0258792.t007
PLOS ONE Evaluation method on seismic risk of substation in strong earthquake area
PLOS ONE | https://doi.org/10.1371/journal.pone.0258792 December 2, 2021 11 / 22

do not simply represent a series relationship, the vulnerability model for the entire substation
cannot be calculated using Eqs (7) and (8). There are great differences in the layout of electrical
equipment and structures in different substations, but they are relatively uniform in type.
Fig 5. Vulnerability models of four key vulnerable parameters. (a) Vulnerability of Ug. (b) Vulnerability of Sg. (c)
Vulnerability of Uz. (d) Vulnerability of Sz.
https://doi.org/10.1371/journal.pone.0258792.g005
Fig 6. Vulnerability model of 750 kV main transformer. (a) Upper boundary. (b) Lower boundary.
https://doi.org/10.1371/journal.pone.0258792.g006
PLOS ONE Evaluation method on seismic risk of substation in strong earthquake area
PLOS ONE | https://doi.org/10.1371/journal.pone.0258792 December 2, 2021 12 / 22

According to this characteristic, in the study of the vulnerability of power facilities, typical
types of power facilities can be selected to carry out example analysis, and on this basis, a uni-
versal applicability of substation seismic vulnerability analysis method can be formed.
This study adopts an importance weight assignment method to construct vulnerability
models for substations with different voltage levels. The power facilities are classified based
on their structural characteristics, seismic damage characteristics, and functions, as shown in
Fig 7. Subsequently, the importance weight of each district power facility is obtained through
referring to this criterion (Table 8) [25].
The vulnerability model for the substation can be obtained using Eq (9).
Xn
i
maxðPiðEjÞÞ � Fi � Pfw �Xn
i
1 �Ys
j
PiðEjÞ
" #
� Fi ð9Þ
In the above, Pfw is the vulnerability of a substation, Pi(Ej) is the vulnerability of a key part
of a power facility, and Fi is the importance weight of a zone-type power facility.
Fig 7. Classification of power facilities in substation.
https://doi.org/10.1371/journal.pone.0258792.g007
Table 8. Earthquake safety risk assessment of substations-weights (F) of assessment items.
Number Items weight
1 Main control communication building 0.18
2 Main transformer 0.19
3 Shunt reactor 0.15
4 High-voltage side power distribution device (HVS) 0.10
5 Medium-voltage side power distribution device (MVS) 0.09
6 Low-voltage power distribution equipment and reactive power compensation (LVPD) 0.08
7 Small room and indoor power distribution device 0.08
8 Important ancillary facilities (such as fire protection) 0.07
9 Power distribution frame and lightning rod 0.05
https://doi.org/10.1371/journal.pone.0258792.t008
PLOS ONE Evaluation method on seismic risk of substation in strong earthquake area
PLOS ONE | https://doi.org/10.1371/journal.pone.0258792 December 2, 2021 13 / 22

3.2.2 Vulnerability model of substation with different voltage levels. The vulnerability
model for a substation can be constructed by assigning importance weights, as presented in
Table 8, to the vulnerability curve of each district power facility. Based on the data provided by
the ‘General design of power transmission and transformation project of State Grid’ [23], and
Eq (9), vulnerability models are constructed for 100 kV, 220 kV, and 750 kV substations (Figs
8–10). It can be seen that these seismic vulnerability models can be used to construct the rela-
tionship between different ground motion intensities and seismic damage states of substations
in a probabilistic way. Then, the seismic risk of substations within the affected area can be
assessed after the earthquake.
4. Case study
4.1 Study area
The Wuqia-Kashgar area of Xinjiang was selected as the study area. It is located at 73.5˚ to
77.5˚ east longitude and 38.5˚ to 40.5˚ north latitude. This area is an earthquake-prone area,
with complete historical seismic records. It has a widely distributed network of seismic obser-
vations and a complete record of historical earthquake information, facilitating the evaluation
Fig 8. Vulnerability model of 750 kV substations. (a) Upper boundary. (b) Lower boundary.
https://doi.org/10.1371/journal.pone.0258792.g008
Fig 9. Vulnerability model of 220 kV substations. (a) Upper boundary. (b) Lower boundary.
https://doi.org/10.1371/journal.pone.0258792.g009
PLOS ONE Evaluation method on seismic risk of substation in strong earthquake area
PLOS ONE | https://doi.org/10.1371/journal.pone.0258792 December 2, 2021 14 / 22

of the ground motion characteristics. Fig 11(A) shows the earthquake catalog in the last 20
years, and Fig 11(B) shows the distribution of seismic observations in this area. Earthquakes of
magnitude 2.9–6.8 have occurred 120 times.
Among them, the largest earthquake was the 2008 Wuqia MS 6.8 earthquake. The macro
epicenter was located at 39˚39’ N, 73˚52’ E. Table 9 records the PGAs of each seismic observa-
tion station in Wuqia-Kashgar. Through Eqs (1) and (2), the PGA attenuation law of this
earthquake was obtained as follows:
lgðPGAÞ ¼ 3:1376 � 0:6499�M þ 0:1144�M2 � 1:522lg½Rþ 0:3736� expð0:5738�MÞ� ð10Þ
Subsequently, according to the actual situation after the earthquake, the results from Eq
(10) were modified to obtain the intensity distribution diagram (Fig 12).
Notably, this area is one of the starting points for new energy (solar and wind power) trans-
mission projects in China. It has a complete transmission system, and many substations that
are threatened by earthquakes (Fig 13). Therefore, it was representative to choose this area for
a research example.
Fig 10. Vulnerability model of 110 kV substations. (a) Upper boundary. (b) Lower boundary.
https://doi.org/10.1371/journal.pone.0258792.g010
Fig 11. Historical seismic information and seismic observation stations of the Wuqia-Kashgar area. (a) Earthquake catalogue. (b) Seismic
observation station.
https://doi.org/10.1371/journal.pone.0258792.g011
PLOS ONE Evaluation method on seismic risk of substation in strong earthquake area
PLOS ONE | https://doi.org/10.1371/journal.pone.0258792 December 2, 2021 15 / 22

Table 9. Complete ground motion records of each station.
Number Station name Epicentral distance (km) Horizontal PGA (g) Vertical PGA (g) The biggest PGA (g)
1 Akto 201.2 0.0071 0.0027 0.0076
2 Braksu 186.5 0.0114 0.0035 0.0119
3 Bayan kuruti 165.4 0.0111 0.0050 0.0122
4 Baishkran 209.9 0.0078 0.0035 0.0085
5 Gedalyan 254.5 0.0109 0.0046 0.0118
6 Gulluk 284.3 0.0070 0.0029 0.0076
7 Harajun 272.4 0.0109 0.0039 0.0116
8 Hongqi Farm 237.3 0.0147 0.0053 0.0156
9 Jiashi 263.4 0.0074 0.0018 0.0076
10 Jigan 45.7 0.1273 0.0535 0.1381
11 Finance 197.7 0.0101 0.0036 0.0107
12 Palltokoy 124.4 0.0060 0.0061 0.0086
13 42 regiments 295.8 0.0048 0.0015 0.0050
14 Upper Artush 184.8 0.0047 0.0034 0.0058
15 Sparse 197.7 0.0065 0.0039 0.0076
16 Shule 205.1 0.0115 0.0056 0.0128
17 Toyun 155.4 0.0115 0.0056 0.0128
18 Topa 165.5 0.0111 0.0046 0.0120
19 Upal 309.2 0.0053 0.0014 0.0055
20 Uhsharu 163.8 0.0087 0.0062 0.0107
21 Uca 96.3 0.0178 0.0111 0.0210
22 Seaker 136.1 0.0069 0.0047 0.0083
23 Yuepu Lake 317.5 0.0048 0.0020 0.0052
24 Sheep farm 269.4 0.0057 0.0019 0.0060
https://doi.org/10.1371/journal.pone.0258792.t009
Fig 12. Intensity distribution of the 2008 Wuqia MS 6.8 earthquake.
https://doi.org/10.1371/journal.pone.0258792.g012
PLOS ONE Evaluation method on seismic risk of substation in strong earthquake area
PLOS ONE | https://doi.org/10.1371/journal.pone.0258792 December 2, 2021 16 / 22

4.2 Evaluation of ground motion characteristics
Because there was no actual earthquake for supporting the study, this study assumed that
when an earthquake at the upper magnitude limit of this area occurs, the seismic damage states
of the substations are evaluated within the seismic influence scope. The evaluation process was
as follows.
① The upper limit of the magnitude was calculated through the G-R model, assuming that its
epicenter location, seismic influence scope, and PGA distribution law were the same as
those of the 2008 Wuqia M 6.8 earthquake.
② The numbers, geographic locations, and voltage levels of substations within this area were
determined, and their PGA values were calculated.
③ The seismic damage states of the substations were evaluated by inputting their PGAs into
the pre-built vulnerability models.
4.2.1 The upper limit of regional magnitude. The magnitudes and frequencies of earth-
quakes, whether global or regional earthquakes, generally satisfy Gutenberg-Rick’s law, as
shown in Eq (11) [32]. But the model does not take into account the upper limit of magnitude,
as shown in Eq (12) [33]. In 1971, Utsu T proposed a modified G-R model that can take into
account the upper limit of magnitude. Therefore, the modified G-R model was used to calcu-
late the upper limit of the magnitude of the Wuqia-Kashgar earthquake.
lgnðMÞ ¼ a � bM ð11Þ
lgnðMÞ ¼ a � bM þ lgðMc � MÞ ð12Þ
In the above, n(M) is the number of earthquakes in the magnitude M−ΔM to M+ΔM range.
The cumulative frequency is that NðMÞ ¼R1M nðM0ÞdM0. The value of a describes the level of
seismic activity in the selected area, and the value of b is related to the regional medium
Fig 13. Distribution of substations in Wuqia-Kashgar area.
https://doi.org/10.1371/journal.pone.0258792.g013
PLOS ONE Evaluation method on seismic risk of substation in strong earthquake area
PLOS ONE | https://doi.org/10.1371/journal.pone.0258792 December 2, 2021 17 / 22

characteristics, stress state, and inhomogeneity, and can reflect the source b characteristics of
the earthquake. Mc is the upper limit of regional magnitude.
For parameters a and b, this study used the maximum likelihood method given by [33] to
estimate their values. In the probability density function f(X) of this model, X = M−Mz (Mz is
the lower limit of the magnitude of the analysis data) is taken as the probability variable, and is
given in Eq (13):
f ðXÞ ¼ B2ðC � BÞexpð� BXÞ=P ð13Þ
In the above; B ¼ blnð10Þ; C ¼ Mc � Mz; P ¼ expð� BCÞ þ BC � 1: ð14Þ
Then, the probability density function is expressed by two numbers, B and C. If the number
of earthquakes contained in a set of data is set as N, the logarithmic likelihood can be calcu-
lated by Eq (15).
lnðLÞ ¼ N 2lnB � lnP � BXN
i¼1
Xi=N
!
þXN
i¼1
lnðC � XiÞ ð15Þ
In Eq (14), the conditions for maximizing the logarithmic likelihood are that:
@
@BlnL ¼ 0;
@
@ClnL ¼ 0 ð16Þ
Thus, B and C can be obtained from Eqs (15), and (16). After that, b and Mc can be further
solved by Eq (14).
The historical seismic information from the last 20 years, as shown in Fig 11(A), was taken
as the data sample. The magnitude-cumulative frequency relationship was plotted as a curve,
as shown in Fig 14. It can be seen that the cumulative frequency did not change within the
magnitude range of 1.0–2.9. Therefore, it could not be included in the calculation range of the
model. Between the magnitudes of 2.9, and 6.8, the linear relationship was good and the cumu-
lative frequency distribution decreased with the increase in MS, indicating that the data was
complete and could be used for the model calculations.
According to the earthquake catalog data, the maximum likelihood method was used to fit
Eqs (11)–(16) to obtain Mc = 7.9. So, the upper limit of regional magnitude (MS) of the Wuqia-
Kashgar earthquake is 7.9.
4.2.2 The distribution of PGA. It was assumed that the epicenter of the upper limit of the
magnitude and the PGA distribution law were the same as those of the 2008 Wuqia MS 6.8
earthquake. Then, using Eq (10), the seismic influence scope and PGA distribution of this
earthquake were obtained, as shown in Fig 15.
4.3 Evaluation of seismic damage state of substation
As shown in Fig 15, substations within the scope of the earthquake can be obtained through
the State Grid Corporation of China, including the number, voltage level, distribution, and
geographic location. There are 18 substations in the Wuqia-Kashgar area of Xinjiang, includ-
ing three 750 kV substations, eleven 220 kV substations, and four 110 kV substations.
The PGA of each substation was substituted into the corresponding vulnerability model to
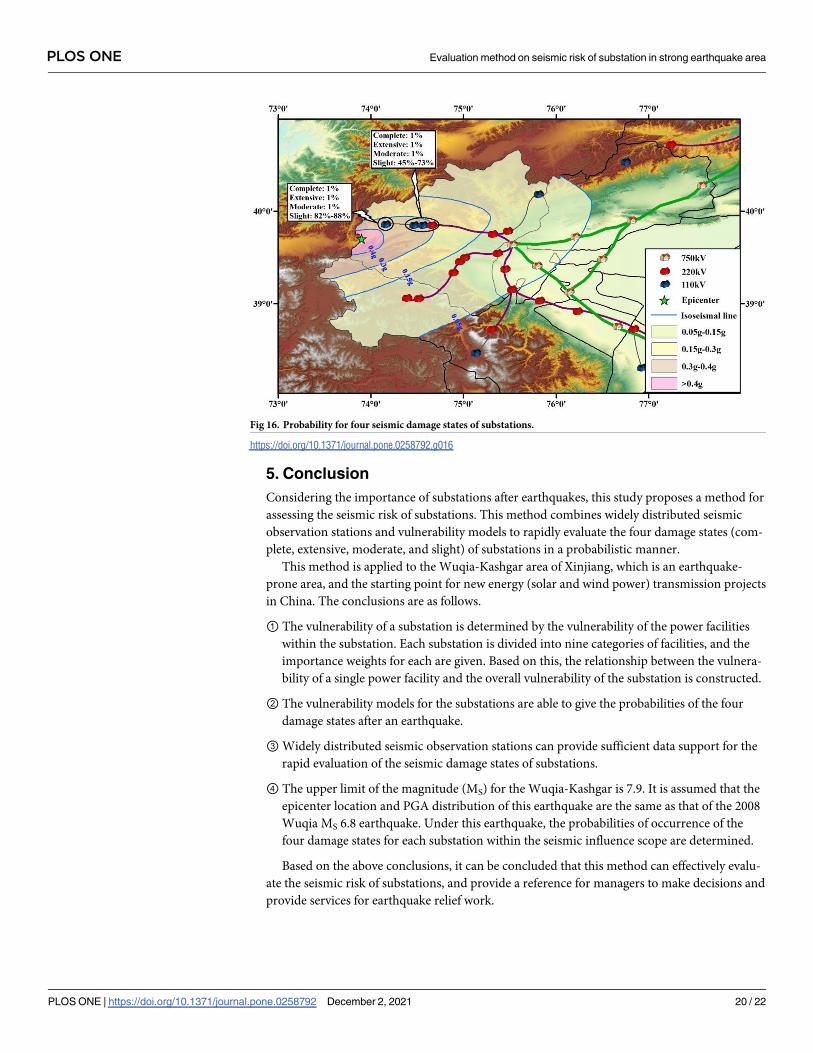
obtain the seismic damage state, as shown in Fig 16. From the results, it can be seen that four
substations close to the epicenter are threatened, and that the other substations are safer.
Among them, owing to the distance from the epicenter, the 750 kV substations are barely
affected, which is more important. For the 110 kV substation, which is close to the epicenter,
PLOS ONE Evaluation method on seismic risk of substation in strong earthquake area
PLOS ONE | https://doi.org/10.1371/journal.pone.0258792 December 2, 2021 18 / 22

the probabilities of the four damage states are 1%, 1%, 1%, and 82%-88%, respectively. The
other three substations’ (two 110 kV and one 220 kV) probabilities for the four damage states
are 1%, 1%, 1%, and 45%-73%, respectively. The likelihood of major damage to these substa-
tions is unlikely, but slight damage is very likely, so repairs can be carried out subsequent to
other priority repairs.
Fig 14. Magnitude-cumulative frequency curve.
https://doi.org/10.1371/journal.pone.0258792.g014
Fig 15. Peak ground acceleration (PGA) distribution of the Wuqia-Kashgar area (assumed earthquake).
https://doi.org/10.1371/journal.pone.0258792.g015
PLOS ONE Evaluation method on seismic risk of substation in strong earthquake area
PLOS ONE | https://doi.org/10.1371/journal.pone.0258792 December 2, 2021 19 / 22
5. Conclusion
Considering the importance of substations after earthquakes, this study proposes a method for
assessing the seismic risk of substations. This method combines widely distributed seismic
observation stations and vulnerability models to rapidly evaluate the four damage states (com-
plete, extensive, moderate, and slight) of substations in a probabilistic manner.
This method is applied to the Wuqia-Kashgar area of Xinjiang, which is an earthquake-
prone area, and the starting point for new energy (solar and wind power) transmission projects
in China. The conclusions are as follows.
① The vulnerability of a substation is determined by the vulnerability of the power facilities
within the substation. Each substation is divided into nine categories of facilities, and the
importance weights for each are given. Based on this, the relationship between the vulnera-
bility of a single power facility and the overall vulnerability of the substation is constructed.
② The vulnerability models for the substations are able to give the probabilities of the four
damage states after an earthquake.
③ Widely distributed seismic observation stations can provide sufficient data support for the
rapid evaluation of the seismic damage states of substations.
④ The upper limit of the magnitude (MS) for the Wuqia-Kashgar is 7.9. It is assumed that the
epicenter location and PGA distribution of this earthquake are the same as that of the 2008
Wuqia MS 6.8 earthquake. Under this earthquake, the probabilities of occurrence of the
four damage states for each substation within the seismic influence scope are determined.
Based on the above conclusions, it can be concluded that this method can effectively evalu-
ate the seismic risk of substations, and provide a reference for managers to make decisions and
provide services for earthquake relief work.
Fig 16. Probability for four seismic damage states of substations.
https://doi.org/10.1371/journal.pone.0258792.g016
PLOS ONE Evaluation method on seismic risk of substation in strong earthquake area
PLOS ONE | https://doi.org/10.1371/journal.pone.0258792 December 2, 2021 20 / 22

Acknowledgments
The authors are grateful to all study participants.
Author Contributions
Data curation: Sheng Li.
Formal analysis: Jiawei Cui.
Investigation: Jiawei Cui.
Methodology: Jiawei Cui, Ailan Che.
Resources: Yongfeng Cheng.
Writing – original draft: Jiawei Cui.
Writing – review & editing: Jiawei Cui.
References1. Miryousefi Aval SM, Ahadi A, Hayati H. Adequacy assessment of power systems incorporating building
cooling, heating and power plants. Energy and Buildings, 2015; 105: 236–246. https://doi.org/10.1016/j.
enbuild.2015.05.059.
2. Johnson B, Chalishazar V, Cotilla-Sanchez E, Brekken TKA. A Monte Carlo methodology for earth-
quake impact analysis on the electrical grid. Electric Power Systems Research, 2020; 184: 106332.
https://doi.org/10.1016/j.epsr.2020.106332.
3. Arias Velasquez RM, Mejıa Lara JV. Improvement in the design of power oil-filled reactors to avoid
faults of seismic origin. Engineering Failure Analysis, 2019; 97: 416–433. https://doi.org/10.1016/j.
engfailanal.2019.01.025.
4. He J, Zhang L, Yao Z, Che H, Gong S, Wang M, et al. Source apportionment of particulate matter
based on numerical simulation during a severe pollution period in Tangshan, North China. Environmen-
tal Pollution, 2020; 266: 115133. https://doi.org/10.1016/j.envpol.2020.115133 PMID: 32693305
5. Hwang HHM, Huo J. Seismic vulnerability analysis of electric substation equipment and structures.
Probabilistic engineering mechanics, 1998; 13(2): 107–116. https://doi.org/10.1016/S0266-8920(97)
00018-0.
6. He C, Xie Q, Yang Z, Xue S. Seismic evaluation and analysis of 1100-kVUHV porcelain transformer
bushings. Soil Dynamics and Earthquake Engineering, 2019; 123: 498–512. https://doi.org/10.1016/j.
jcsr.2019.06.019.
7. Liang H, Xie Q, Bu X, Cao Y. Shaking table test on 1000 kV UHV transmission tower-line coupling sys-
tem. Structures, 2020; 27: 650–663. https://doi.org/10.1016/j.istruc.2020.06.017.
8. Baghmisheh AG, Estekanchi HE. Effects of rigid bus conductors on seismic vulnerability of electrical
substation equipment. Soil Dynamics and Earthquake Engineering, 2019; 125: 105733. https://doi.org/
10.1016/j.soildyn.2019.105733.
9. Cheng YF, Zhu ZB. Research state and development of seismic performance of substation electrical
equipment. Building Structure, 2019; 49(S2):356–361. https://doi.org/10.19701/j.jzjg.2019.S2.065.
10. Li S, Tsang H, Cheng Y, Lu Z. Seismic testing and modeling of cylindrical electrical equipment with
GFRP composite insulators. Composite Structures, 2018; 194: 454–467. https://doi.org/10.1016/j.
compstruct.2018.02.036.
11. Politopoulos I, Feau C. Some aspects of floor spectra of 1DOF nonlinear primary structures. Earth-
quake Engineering & Structural Dynamics, 2007; 36(8): 975–993. https://doi.org/10.1002/eqe.664
12. Jiang W, Li B, Xie WC. Generate floor response spectra: part 1. direct spectra-to-spectra method.
Nuclear Engineering and Design, 2015; 293(11): 525–546. https://doi.org/10.1016/j.nucengdes.2015.
05.034.
13. Sun Q, Yuan G, Huang Y, Shu Q, Li Q. Structural behavior of supported tubular bus structure in substa-
tions under seismic loading. Engineering Structures, 2018; 174: 861–872. https://doi.org/10.1016/j.
engstruct.2018.07.077.
14. Anshel J, Schiff, Leon Kempner, Jr. IEEE 693 Seismic qualification of composite for substation high-
voltage equipment // 13th World Conference on Earthquake Engineering, Vancouver, B C, Canada:
August 1–6, 2004;2306.
PLOS ONE Evaluation method on seismic risk of substation in strong earthquake area
PLOS ONE | https://doi.org/10.1371/journal.pone.0258792 December 2, 2021 21 / 22

15. Zareei SA, Hosseini M, Ghafory-Ashtiany M. Evaluation of power substation equipment seismic vulner-
ability by multivariate fragility analysis: A case study on a 420kV circuit breaker. Soil Dynamics and
Earthquake Engineering, 2017; 92: 79–94. https://doi.org/10.1016/j.soildyn.2016.09.026.
16. Hailei H, Jianbo G, Qiang X. Vulnerability analysis of power equipment caused by earthquake disaster.
Power System Technology,2011, 35(4):25–28. https://doi.org/10.13335/j.1000-3673.pst.2011.04.002
(In Chinese).
17. Mingpan X. Research on the vulnerability of high voltage electrical equipment based on different ground
motion parameters. Harbin: Institute of Engineering Mechanics, China Earthquake Administration,
2016. (In Chinese).
18. Liu H, Tatano H, Pflug G, Hochrainer-Stigler S. Post-disaster recovery in industrial sectors: A Markov
process analysis of multiple lifeline disruptions. Reliability Engineering & System Safety, 2021; 206:
107299. https://doi.org/10.1016/j.ress.2020.107299.
19. Paolacci F, Giannini R, Alessandri S, De Felice G. Seismic vulnerability assessment of a high voltage
disconnect switch. Soil Dynamics and Earthquake Engineering, 2014; 67: 198–207. https://doi.org/10.
1016/j.soildyn.2014.09.014.
20. Zareei SA, Hosseini M, Ghafory-Ashtiany M. Seismic failure probability of a 400kV power transformer
using analytical vulnerability curves. Engineering Failure Analysis, 2016; 70: 273–289. https://doi.org/
10.1016/j.engfailanal.2016.09.007.
21. Bender J, Farid A. Seismic vulnerability of power transformer bushings: Complex structural dynamics
and seismic amplification. Engineering Structures, 2018; 162: 1–10. https://doi.org/10.1016/j.engstruct.
2018.01.052.
22. Pires JA, Ang AHS, Villaverde R. Seismic reliability of electrical power transmission systems. Nuclear
Engineering and Design, 1996, 160 (3): 427–439. https://doi.org/10.1016/0029-5493(95)01119-6.
23. State Grid Corporation of China. General design of power transmission and transformation project of
State Grid. Beijing, China: China Electric Power Press. 2017.
24. FEMA. HAZUS-MH Multi-hazard loss estimation methodology, Earthquake Model-Technical Manual.
Washington D.C.: Federal Emergency Management Agency, Department of Homeland Security, 2003.
25. State Grid Corporation of China. Guidelines for seismic safety risk assessment of electrical substations
(converter stations). Beijing, China: China Electric Power Press. 2021.
26. Li S, Lu Z, Zhu Z, Liu Z, Cheng Y, Lu Xi. Dynamic properties and seismic vulnerability of substation com-
posite insulators. Engineering Mechanics, 2016; 33(04): 91–97. https://doi.org/10.6052/j.issn.1000-
4750.2014.08.0712 (In Chinese).
27. Baker J W, Lin T, Shahi S K, Jayaram N. New ground motion selection procedures and selected
motions for the PEER transportation research program. Pacific Earthquake Engineering Research Cen-
ter, 2011. US750639 A.
28. Vamvatsikos D, Cornell CA. Incremental dynamic analysis. Earthquake Engineering and Structural
Dynamics, 2002, 31(3): 491–514. https://doi.org/10.1007/978-3-642-36197-5_136-1.
29. Porter, K, Farokhnia K, Vamvatsikos D, Cho I. Analytical derivation of seismic vulnerability function for
high rise buildings. Report produced in the context of the Global vulnerability consortium, 2013.
30. Zhong J, Zhang J, Zhi X, Fan F. Probabilistic seismic demand and capacity models and fragility curves
for reticulated structures under far-field ground motions. Thin-Walled Structures, 137: 2019;436–447.
https://doi.org/10.1016/j.tws.2019.01.032.
31. Haldar A, Mahadevan S. Probability, reliability, and statistical methods in engineering design. New
York, NY: John Wiley & Sons, 2000;143―273. https://doi.org/10.1002/bate.200002930
32. zalohar J. Chapter 14-Gutenberg-Richter’s Law//zalohar J. Developments in Structural Geology and
Tectonics. Elsevier: 2018;173–178. https://doi.org/10.1016/B978-0-12-814580-7.00011–3
33. Mabuti hiroshi yasushi. otake masakazu. sato haruo. Distribution of global maximum magnitude Mc
based on modified G-R magnitude-frequency distribution model. World Earthquake Translations, 2004;
(01):1–13.
PLOS ONE Evaluation method on seismic risk of substation in strong earthquake area
PLOS ONE | https://doi.org/10.1371/journal.pone.0258792 December 2, 2021 22 / 22


![IEEE 693 Seismic Qualification of Composites for Substation ...IEEE Standard 693-1997, "IEEE Recommended Practice for Seismic Design of Substations" [1], is a major improvement in](https://img.pdfslide.net/doc/110x75/61028a6809446d71ff27f1a5/ieee-693-seismic-qualification-of-composites-for-substation-ieee-standard-693-1997.jpg)