Embed Size (px)
Citation preview
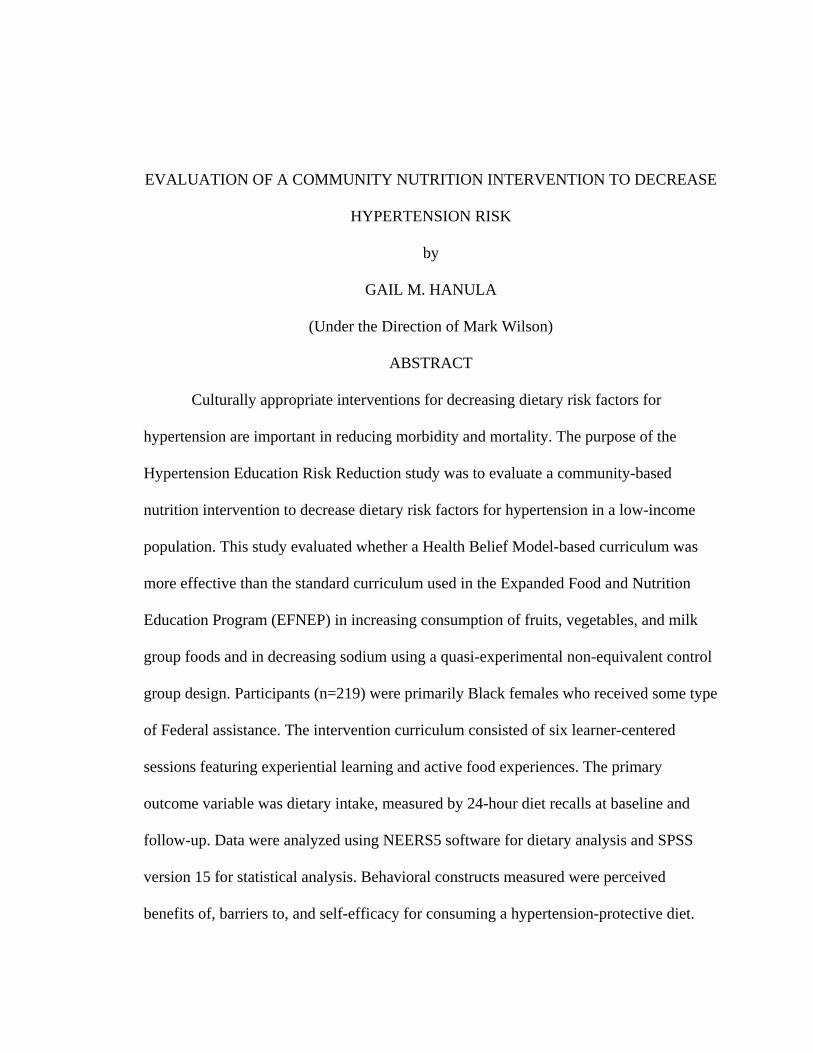
EVALUATION OF A COMMUNITY NUTRITION INTERVENTION TO DECREASE
HYPERTENSION RISK
by
GAIL M. HANULA
(Under the Direction of Mark Wilson)
ABSTRACT
Culturally appropriate interventions for decreasing dietary risk factors for
hypertension are important in reducing morbidity and mortality. The purpose of the
Hypertension Education Risk Reduction study was to evaluate a community-based
nutrition intervention to decrease dietary risk factors for hypertension in a low-income
population. This study evaluated whether a Health Belief Model-based curriculum was
more effective than the standard curriculum used in the Expanded Food and Nutrition
Education Program (EFNEP) in increasing consumption of fruits, vegetables, and milk
group foods and in decreasing sodium using a quasi-experimental non-equivalent control
group design. Participants (n=219) were primarily Black females who received some type
of Federal assistance. The intervention curriculum consisted of six learner-centered
sessions featuring experiential learning and active food experiences. The primary
outcome variable was dietary intake, measured by 24-hour diet recalls at baseline and
follow-up. Data were analyzed using NEERS5 software for dietary analysis and SPSS
version 15 for statistical analysis. Behavioral constructs measured were perceived
benefits of, barriers to, and self-efficacy for consuming a hypertension-protective diet.
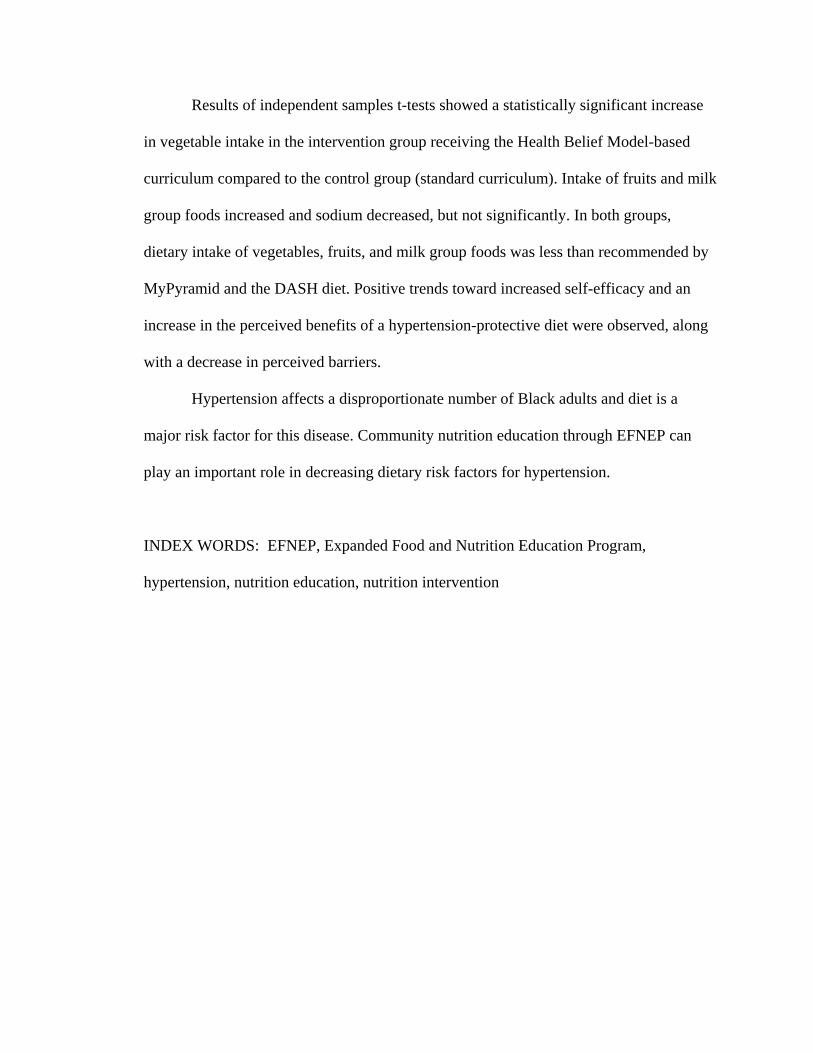
Results of independent samples t-tests showed a statistically significant increase
in vegetable intake in the intervention group receiving the Health Belief Model-based
curriculum compared to the control group (standard curriculum). Intake of fruits and milk
group foods increased and sodium decreased, but not significantly. In both groups,
dietary intake of vegetables, fruits, and milk group foods was less than recommended by
MyPyramid and the DASH diet. Positive trends toward increased self-efficacy and an
increase in the perceived benefits of a hypertension-protective diet were observed, along
with a decrease in perceived barriers.
Hypertension affects a disproportionate number of Black adults and diet is a
major risk factor for this disease. Community nutrition education through EFNEP can
play an important role in decreasing dietary risk factors for hypertension.
INDEX WORDS: EFNEP, Expanded Food and Nutrition Education Program, hypertension, nutrition education, nutrition intervention
EVALUATION OF A COMMUNITY NUTRITION INTERVENTION TO DECREASE
HYPERTENSION RISK
by
GAIL M. HANULA
B.S.H.E., UNIVERSITY OF GEORGIA, 1982
M.H.E., UNIVERSITY OF GEORGIA, 1983
Ed.S., UNIVERSITY OF GEORGIA, 1984
A Dissertation Submitted to the Graduate Faculty of The University of Georgia in Partial
Fulfillment of the Requirements for the Degree
DOCTOR OF PHILOSOPHY
ATHENS, GEORGIA
2009

© 2009
Gail M. Hanula
All Rights Reserved
EVALUATION OF A COMMUNITY NUTRITION INTERVENTION TO DECREASE
HYPERTENSION RISK
by
GAIL M. HANULA
Major Professor: Mark Wilson
Committee: Pamela Orpinas Rebecca Mullis
James Bason Electronic Version Approved: Maureen Grasso Dean of the Graduate School The University of Georgia May 2009
DEDICATION
This dissertation is dedicated to the staff of the Expanded Food and Nutrition
Education Program (EFNEP) at The University of Georgia. You are the heart of EFNEP
and your dedication is a tremendous inspiration.
I would also like to dedicate this to my family: to my husband, Jim, for his
encouragement and support; to my daughter, Kristin, for her patience and understanding;
and to my mother, Jean Mooney, for instilling in me a love of learning.
iv
ACKNOWLEDGEMENTS
I would like to thank the staff of The University of Georgia Expanded Food and
Nutrition Education Program (EFNEP) for their assistance with this project. Special
thanks go to the following individuals, who truly went above and beyond: Marilyn Huff-
Waller, Joann Banks, Phyllis Cain, Rhea Bentley, and Tiffany Williams.
Thanks to the members of my committee, Dr. Mark Wilson (Chair), Dr. Pamela
Orpinas, Dr. Rebecca Mullis, and Dr. Jim Bason. I have learned a great deal from all of
you and am very grateful for your support.
I would also like to acknowledge several very special women who provided
encouragement and inspiration at critical times in my academic career. The late Dr.
Aleene Cross encouraged me to pursue graduate studies. Dr. Carolyn Berdanier
introduced me to the science of nutrition and was instrumental to my enrollment in the
Master’s degree program. Dr. Ann Peisher encouraged me to pursue my doctorate and
was an excellent role model. Dr. Ann Glauser, Dr. Susan Baker, Joann Banks, Dr. Helen
Chipman, JoAnn McCloud-Harrison, Dr. Mary McFerren, Dr. Rebecca Mullis, Dr.
Pamela Orpinas, Amanda Scott, and Wells Willis provided wisdom, encouragement, and
guidance, without which this dissertation would likely have remained a dream. I am
grateful to all of you and will do my best to follow your example.
v

TABLE OF CONTENTS
Page
ACKNOWLEDGEMENTS ............................................................................................... v
LIST OF TABLES .......................................................................................................... viii
LIST OF FIGURES ......................................................................................................... ix
CHAPTER
1 INTRODUCTION ....................................................................................... 1
Significance of the Study ............................................................................ 2
Purpose of the Study and Research Questions ............................................ 2
2 REVIEW OF THE LITERATURE ............................................................. 5
Epidemiology of Hypertension ................................................................... 5
Health Disparities and Hypertension ........................................................... 6
Diet and Hypertension ................................................................................. 7
Dietary Intake Studies .................................................................................10
Behavioral Constructs .................................................................................13
Behavioral Interventions .............................................................................23
Summary .....................................................................................................31
3 METHODS ..................................................................................................32
Purpose of the Study and Research Questions ............................................32
Study Design ...............................................................................................35
Participants ..................................................................................................37
vi
Measures ......................................................................................................40
Data Management and Analysis ..................................................................42
Development of the Intervention .................................................................43
4 RESULTS ....................................................................................................58
Dietary Intake ..............................................................................................59
Behavioral Constructs .................................................................................61
Participant Evaluations ............................................................................... 66
Process Evaluation ......................................................................................69
Summary .....................................................................................................70
5 DISCUSSION, IMPLICATIONS, AND RECOMMENDATIONS ...........72
Findings of the Study ..................................................................................72
Limitations...................................................................................................76
Further Research..........................................................................................79
Summary .....................................................................................................81
REFERENCES ..................................................................................................................83
APPENDICES
A INFORMATIONAL LETTER (PARTICIPANTS) ....................................98
B CLIENT’S 24-HOUR DIET RECALL .......................................................99
C HERR SURVEY .......................................................................................100
D HERR SURVEY INSTRUCTOR’S GUIDE ............................................105
E PROCESS EVALUATION .......................................................................113
vii

LIST OF TABLES
Page
Table 3.1 Demographic Data of Participants .....................................................................39
Table 3.2 Demographic Data of Participants Completing the HERR Survey ...................39
Table 3.3 Learning Objectives for the HERR Curriculum ................................................47
Table 3.4 Sequence and Scope of the HERR Curriculum ................................................ 53
Table 3.5 Comparison of EFNEP Control (Standard) and Intervention Curricula ............57
Table 4.1 Dietary Intake at Baseline and Follow-up .........................................................60
Table 4.2 Behavioral Construct Scores at Baseline and Follow-up ...................................62
Table 4.3 Improvement in Self-Efficacy for Hypertension-Protective Behaviors ............65
viii
ix
LIST OF FIGURES
Page
Figure 3.1 Theoretical Model of the Hypertension Education Risk Reduction Study ......33

CHAPTER 1
INTRODUCTION
The need to develop culturally appropriate interventions for decreasing dietary
risk factors for hypertension is important to reduce morbidity and mortality (Whelton,
Beevers, & Sonkodi, 2004). It is crucial that interventions address the needs of minority
populations who bear a disproportionate burden of chronic disease. Georgia’s Expanded
Food and Nutrition Education Program (EFNEP) reaches the underserved with nutrition
education. EFNEP is funded by the United States Department of Agriculture (USDA) to
educate families on the importance of nutrition to health and ways to plan, purchase and
prepare healthy meals on a limited budget. This community nutrition education program,
which has been funded for 40 years, reaches clientele at risk for hypertension and could
play an important role in decreasing morbidity and mortality from cardiovascular disease.
EFNEP participants in Georgia represent a population at increased risk for
hypertension. In 2006, 78% of EFNEP participants received some type of Federal
assistance and 65% were Black adults. Program participants were primarily women with
children in their care (Hanula, 2006). Mothers play an important role as the nutrition
gatekeepers in the home. According to Wansink (2006, p. 165), the person who prepares
and buys the family food controls about 72% of the food eaten by the family. In 2006,
there were 3,726 adult participants in Georgia’s EFNEP with a total of 8,687 children.
Nutrition education through EFNEP has the potential to improve the health of entire
families.
1
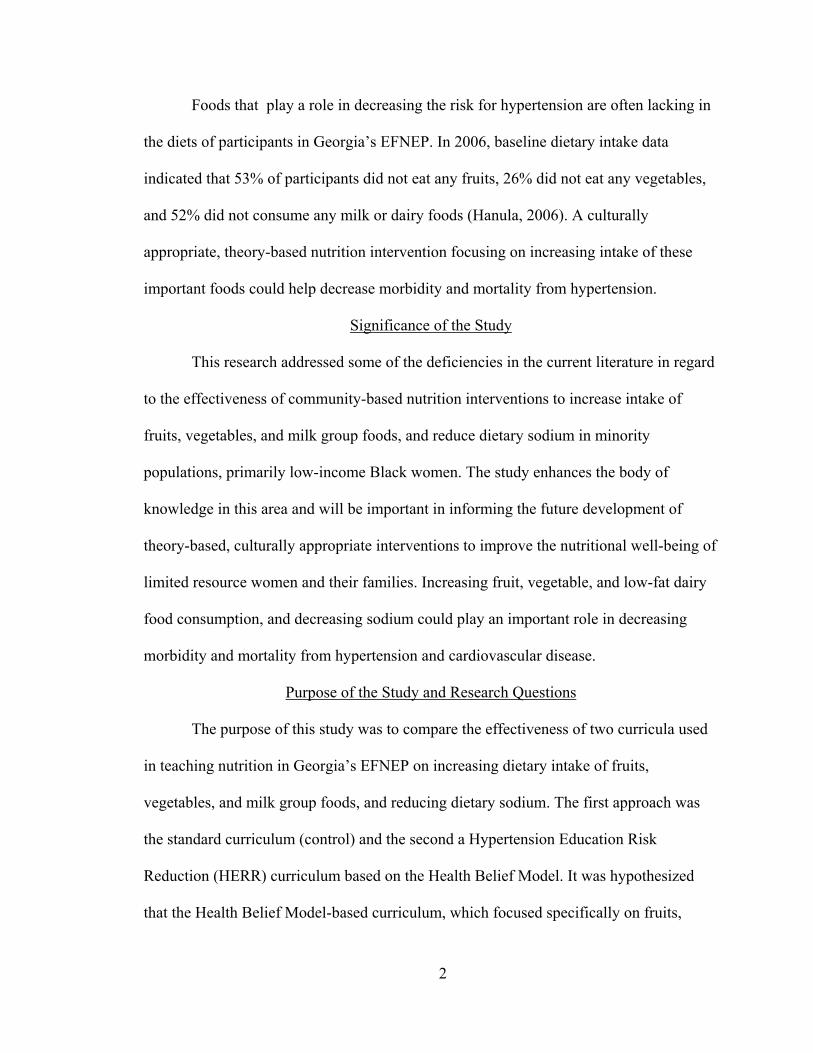
Foods that play a role in decreasing the risk for hypertension are often lacking in
the diets of participants in Georgia’s EFNEP. In 2006, baseline dietary intake data
indicated that 53% of participants did not eat any fruits, 26% did not eat any vegetables,
and 52% did not consume any milk or dairy foods (Hanula, 2006). A culturally
appropriate, theory-based nutrition intervention focusing on increasing intake of these
important foods could help decrease morbidity and mortality from hypertension.
Significance of the Study
This research addressed some of the deficiencies in the current literature in regard
to the effectiveness of community-based nutrition interventions to increase intake of
fruits, vegetables, and milk group foods, and reduce dietary sodium in minority
populations, primarily low-income Black women. The study enhances the body of
knowledge in this area and will be important in informing the future development of
theory-based, culturally appropriate interventions to improve the nutritional well-being of
limited resource women and their families. Increasing fruit, vegetable, and low-fat dairy
food consumption, and decreasing sodium could play an important role in decreasing
morbidity and mortality from hypertension and cardiovascular disease.
Purpose of the Study and Research Questions
The purpose of this study was to compare the effectiveness of two curricula used
in teaching nutrition in Georgia’s EFNEP on increasing dietary intake of fruits,
vegetables, and milk group foods, and reducing dietary sodium. The first approach was
the standard curriculum (control) and the second a Hypertension Education Risk
Reduction (HERR) curriculum based on the Health Belief Model. It was hypothesized
that the Health Belief Model-based curriculum, which focused specifically on fruits,
2
vegetables, and milk group foods to prevent hypertension, would be more effective in
increasing consumption of these foods than the standard curriculum. The standard
nutrition education curriculum used in the University of Georgia’s EFNEP is a general
nutrition curriculum with lessons on all five food groups. The standard curriculum has
been effective in the past in increasing consumption of foods that are protective against
hypertension, but intake levels of these foods following completion of EFNEP in 2006
were still far below recommended levels (Hanula, 2006). This study sought to examine
empirical data concerning the effects of a Health Belief Model-based curriculum versus a
non-Health Belief Model-based curriculum on nutrition behaviors to investigate the best
theoretical foundation for a nutrition education intervention to increase consumption of a
hypertension-protective diet. The questions that guided this study are as follows:
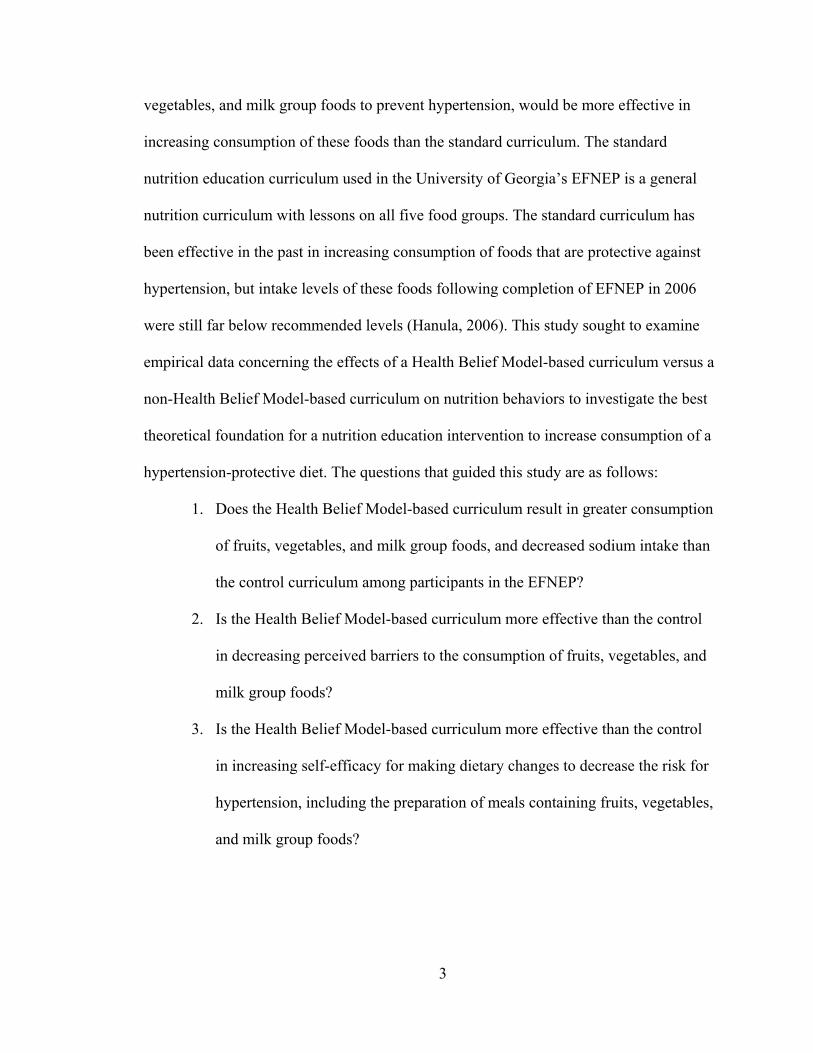
1. Does the Health Belief Model-based curriculum result in greater consumption
of fruits, vegetables, and milk group foods, and decreased sodium intake than
the control curriculum among participants in the EFNEP?
2. Is the Health Belief Model-based curriculum more effective than the control
in decreasing perceived barriers to the consumption of fruits, vegetables, and
milk group foods?
3. Is the Health Belief Model-based curriculum more effective than the control
in increasing self-efficacy for making dietary changes to decrease the risk for
hypertension, including the preparation of meals containing fruits, vegetables,
and milk group foods?
3
4. Is the Health Belief Model-based curriculum more effective than the control
curriculum in increasing self-efficacy for the interpretation of nutrition labels
to determine the salt content of foods?
The answers to these questions will inform future nutrition interventions to decrease
dietary risk factors for hypertension.
Culturally appropriate community nutrition interventions can play an important
role in reducing morbidity and mortality from hypertension, especially in underserved
populations who bear a disproportionate burden of chronic disease. Nutrition education
through EFNEP can play an important role in the effort to reduce health disparities
among the economically disadvantaged, and this project will add to the body of literature
in this area.
4
CHAPTER 2
REVIEW OF THE LITERATURE
The purpose of this literature review is to examine the research that informed a
nutrition intervention to decrease morbidity and mortality from hypertension. The chapter
is divided into seven sections: 1) epidemiology of hypertension, 2) health disparities and
hypertension, 3) diet and hypertension, 4) dietary intake studies, 5) behavioral constructs,
6) behavioral interventions, and 7) summary.
Epidemiology of Hypertension
Cardiovascular disease is the leading cause of death in the United States,
accounting for 39% of all deaths in 2001, 32% of which occurred in individuals under 75
years of age (Dietary Guidelines Advisory Committee, 2005; United States Department
of Health and Human Services & United States Department of Agriculture, 2005).
Modifying the controllable risk factors that impact the development or progression of
cardiovascular disease could play a significant role in decreasing morbidity and mortality.
Elevated blood pressure is one of these modifiable risk factors (Dietary Guidelines
Advisory Committee).
Over half of the adults in the United States are affected either by hypertension,
defined as systolic blood pressure ≥ 140 mmHg and diastolic blood pressure ≥ 90 mmHg,
or pre-hypertension, defined as systolic blood pressure of 129-139 mmHg and diastolic
blood pressure of 80-89 mmHg (Chobanian et al., 2003). Over one-fourth of the
population in the United States has hypertension. The prevalence increased from 25% in
5
1988-1991 to 29% in 1999-2000 according to data from the National Health and
Nutrition Examination Survey (Hajjar & Kotchen, 2003). It was highest in Black adults
(34%), women (30%) and adults 60 years of age and older (65%). Pre-hypertension is
also common. Hsia et al. (2007) found pre-hypertension present in 40% of White
postmenopausal women and 32% of Black post-menopausal women. In addition,
approximately 90% of non-hypertensive adults will develop hypertension during their
lifetimes (Vasan et al., 2002). It is estimated that as little as a 3 mmHg reduction in
systolic blood pressure could lead to an 8% reduction in stroke mortality and a 5%
reduction in mortality from cardiovascular disease (Stamler, et al., 1989). Clearly,
community-based efforts to reduce blood pressure and prevent hypertension should be
considered a public health priority.
Health Disparities and Hypertension
The 2005 Dietary Guidelines Advisory Group report states that, “Health
disparities are substantial among racial and ethnic minorities and among the
economically disadvantaged” (Dietary Guidelines Advisory Committee, 2005, p. 3).
Black persons tend to have a greater incidence of blood pressure-related diseases, such as
stroke and kidney failure, than non-Black persons, and an overall higher prevalence of
elevated blood pressure (Fiscella & Holt, 2008; USDHHS & USDA, 2005; Wang &
Wang, 2004). Poor blood pressure control is a common problem that contributes to
significant morbidity and mortality among Black adults. In a study by Bosworth et al.
(2006), Black persons were more likely than White persons to be non-adherent to their
medications and in poor blood pressure control. Brown and Segal (1996) studied the
health perceptions of Black persons with hypertension and reported they were more
6

present-oriented than White persons regarding daily experiences with hypertension
management. Those with present-orientations perceived themselves to be less susceptible
to the consequences of hypertension, believed less in the benefits of prescribed
medication, and believed more in the benefits of home remedies. It is possible, therefore,
that members of this population might be receptive to methods of decreasing blood
pressure through diet.
Health disparities also exist among the economically disadvantaged (Brown &
Segal, 1996; Kotchen et al., 1998). Adults over the age of 25 with less than 12 years of
education have a higher death rate from chronic diseases than adults with higher levels of
education (National Center for Health Statistics, 2009, p. 223). Members of minority
population groups who are poor and have less than a high school education are likely to
have limited literacy skills, which may impair communication between patients and
health care providers (Kotchen et al.; Ruud et al.). Interventions to reduce morbidity and
mortality from hypertension should address the needs of underserved populations who
bear a disproportionate burden of chronic disease.
Diet and Hypertension
Diet plays an important role in the prevention or postponement of cardiovascular
disease. Elevated blood pressure is one of the risk factors for cardiovascular disease that
is modifiable by diet (Cook et al., 2007). The roles of sodium and potassium in the
regulation of blood pressure have been well-documented (Whelton, 1994). Population-
based studies indicate that fruits, vegetables, and dairy products have beneficial effects on
blood pressure (Appel et al., 1997; Svetkey et al., 2005).
7
Electrolytes
Electrolytes play an important role in regulating blood pressure. The relationship
of sodium to blood pressure regulation has been well-documented (Whelton, 1994). On
average, the higher the dietary sodium intake, the higher the person’s blood pressure. For
this reason, the Dietary Guidelines for Americans recommends limiting sodium intake to
less than 2,300 mg per day, the Upper Limit (UL) established by the Institute of Medicine
(Dietary Guidelines Advisory Committee, 2005). Usual intake of sodium by many
Americans exceeds this Upper Limit, in some cases by two to three times, primarily due
to the high sodium content of many processed foods (USDHHS & USDA, 2005). Racial
differences exist in regard to the effects of sodium on blood pressure. Black persons tend
to be more sensitive to sodium and experience a greater increase in blood pressure in
response to increased intakes of sodium than non-Black persons (Alderman, 1994). For
this reason, the Dietary Guidelines recommendation for Black persons is to aim to
consume no more than 1,500 mg of sodium each day (USDHHS & USDA).
Potassium is another electrolyte that plays a role in the regulation of blood
pressure. It has the opposite effect of sodium, in that increased intake of potassium helps
lower blood pressure. Potassium also has the beneficial effect of blunting the blood
pressure-raising effects of sodium. When potassium is present in sufficient quantities in a
high-sodium diet, the increase in blood pressure is diminished (Morgan, Myers, & Teow,
1984; Morris, Sebastian, Forman, Tanaka, & Schmidlin, 1999; USDHHS & USDA,
2005; Whelton, 2004). Black individuals tend to be more sensitive than White individuals
to potassium’s blood pressure-lowering effects. Therefore, including potassium-rich
8

foods in the diet is especially beneficial to this population (USDHHS & USDA; Douglas,
Ferdinand, Bakris, & Sowers, 2002).
Fruits and Vegetables
Diets high in fruits and vegetables are associated with a reduced risk of stroke and
other chronic diseases (USDHHS & USDA, 2005). Observational studies show that
increased intakes of fruits and vegetables lower blood pressure and decrease the risk of
stroke (Appel et al., 1997; Bazzano et al., 2002; Gillman et al., 1995; Johnsen et al.,
2003; Joshipura et al., 1999; Rissanen et al., 2003; Sauvaget, Nagano, Allen, & Kodama,
2003; Steffen, et al., 2003; Svetkey et al., 2005; USDHHS & USDA). In addition to
observational studies, two clinical trials found significant reductions in blood pressure
with increased fruit and vegetable intake (Appel et al., 1997; John et al., 2002). Mean
blood pressure reductions were 2.7/1.9 mmHg and 4.0/1.5 mmHg, respectively. The
mechanism(s) for the reduction in blood pressure with increased consumption of fruits
and vegetables has not been clearly established. However, since most fruits and
vegetables are good sources of potassium, at least part of the beneficial effect of fruits
and vegetables on blood pressure is likely due to the resulting increase in potassium
consumption (USDHHS & USDA; Whelton et al., 2004).
Dairy Foods
The addition of low-fat dairy products to the diet resulted in decreased blood
pressure in several studies (Appel et al., 1997; Sacks et al., 2001; Svetkey et al., 1999). In
the Dietary Approaches to Stop Hypertension (DASH) study, the addition of three cups
of milk to a diet high in fruits and vegetables (8-10 servings) resulted in twice the
reduction in blood pressure of a diet high in fruits and vegetables alone (Appel et al.).
9
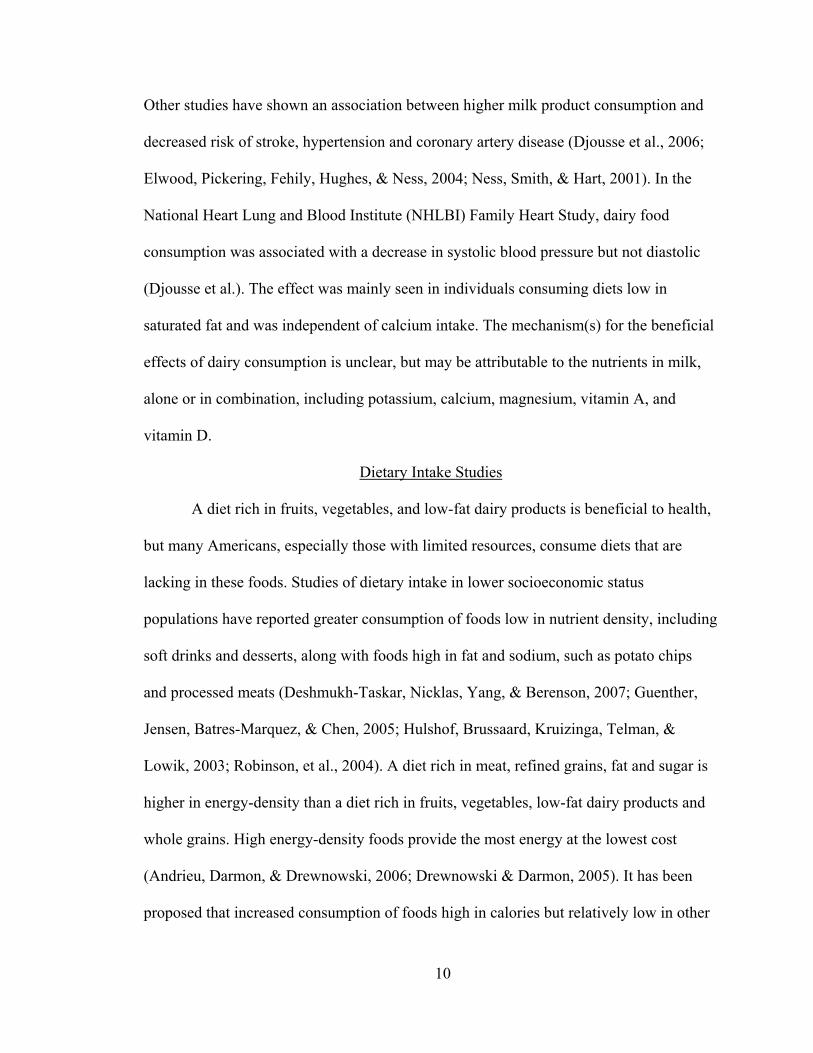
Other studies have shown an association between higher milk product consumption and
decreased risk of stroke, hypertension and coronary artery disease (Djousse et al., 2006;
Elwood, Pickering, Fehily, Hughes, & Ness, 2004; Ness, Smith, & Hart, 2001). In the
National Heart Lung and Blood Institute (NHLBI) Family Heart Study, dairy food
consumption was associated with a decrease in systolic blood pressure but not diastolic
(Djousse et al.). The effect was mainly seen in individuals consuming diets low in
saturated fat and was independent of calcium intake. The mechanism(s) for the beneficial
effects of dairy consumption is unclear, but may be attributable to the nutrients in milk,
alone or in combination, including potassium, calcium, magnesium, vitamin A, and
vitamin D.
Dietary Intake Studies
A diet rich in fruits, vegetables, and low-fat dairy products is beneficial to health,
but many Americans, especially those with limited resources, consume diets that are
lacking in these foods. Studies of dietary intake in lower socioeconomic status
populations have reported greater consumption of foods low in nutrient density, including
soft drinks and desserts, along with foods high in fat and sodium, such as potato chips
and processed meats (Deshmukh-Taskar, Nicklas, Yang, & Berenson, 2007; Guenther,
Jensen, Batres-Marquez, & Chen, 2005; Hulshof, Brussaard, Kruizinga, Telman, &
Lowik, 2003; Robinson, et al., 2004). A diet rich in meat, refined grains, fat and sugar is
higher in energy-density than a diet rich in fruits, vegetables, low-fat dairy products and
whole grains. High energy-density foods provide the most energy at the lowest cost
(Andrieu, Darmon, & Drewnowski, 2006; Drewnowski & Darmon, 2005). It has been
proposed that increased consumption of foods high in calories but relatively low in other
10
nutrients is a likely contributor to the health disparities experienced by the poor
(Drewnowski & Darmon; Ledikwe et al., 2006; Newby, Weismayer, Akesson, Tucker, &
Wolk, 2006).
Consumption of Fruits and Vegetables
Americans’ consumption of fruits and vegetables is far less than optimal (Centers
for Disease Control and Prevention, 2007; LaForge, Greene, & Prochaska, 1994;
Patterson, Block, Rosenberger, Pee, & Kahle, 1990; Subar et al., 1995). Data from the
2005 Behavioral Risk Factor Surveillance System (BRFSS) indicate that only 33% of
adults consumed fruit two or more times per day and 27% consumed vegetables three or
more times per day (Centers for Disease Control and Prevention). Adults with limited
resources have been reported to consume fewer fruits and vegetables than those of higher
socioeconomic status (Havas et al., 1998). A National Cancer Institute study found that
median daily fruit and vegetable consumption was 3.1 servings for the lowest income
group in comparison to 3.7 for the highest income group (Subar et al.). When fruits and
vegetables are provided through federal assistance programs, such as the Special
Supplemental Nutrition Program for Women, Infants, and Children (WIC), mean daily
consumption of fruits and vegetables is higher. Havas et al. found that WIC participants
consumed 4.1 servings per day of fruits and vegetables, including juice. National EFNEP
data reveal that clients enrolled in the program in 2004 consumed an average of 3.6
servings of fruits and vegetables a day (USDA, 2006). The Dietary Guidelines and
MyPyramid recommendations call for the equivalent of 9 servings a day for the reference
2,000 calorie diet (4.5 cups of fruits and vegetables), an increase of 80% over the 1992
recommendation of 5 servings a day, which was approximately 2.5 cups of fruits and
11
vegetables (USDA, 2005). There is clearly a need for nutrition education regarding the
importance of fruits and vegetables and for research on barriers to the consumption of
these important foods.
Calcium Consumption
Data on calcium consumption indicates that the majority of American adults do
not consume the Daily Recommended Intake (DRI) for calcium. The problem is
especially severe in Black persons. In a study on barriers to calcium intake in Black
women, Zablah, Reed, Hegsted, and Keenan (1999) reported that 80% of clients
interviewed consumed less than 75% of the Recommended Dietary Allowance (RDA) for
calcium of 1,000 mg/day. The mean calcium intake was 485 mg. In a study of dairy
intake in Black adults and children in the United States, Fulgoni et al. (2007) reported
that none of the participants in the study met the DRI for calcium, nor did any of the
participants meet the milk group recommendation of the 2005 Dietary Guidelines for
Americans of 3 cups of milk or milk products per day (USDHHS & USDA, 2005). Black
males consumed one serving of dairy products and Black females 0.8 servings of dairy
products per day. Similarly dismal statistics for intake of dairy products are seen in
Georgia’s EFNEP population. In 2006, 51% of clients consumed less than half of the
recommended amount of calcium. The mean number of servings of milk group foods was
0.9 cups compared to the recommendation of three cups, with 52% of the participants
reporting no milk group food consumption (Hanula, 2006).
Sodium Intake
Usual intake of sodium by many Americans exceeds the Upper Limit for sodium
established by the Institute of Medicine, in some cases by two to three times (Dietary
12

Guidelines Advisory Committee, 2005). The high sodium content of many processed
foods is the primary reason for this (USDHHS & USDA, 2005). Many people lack
awareness of the importance of lowering dietary sodium. In a study by Neily et al.
(2002), 86% of patients were unaware of dietary sodium recommendations. In addition,
42% could not interpret the sodium content on the Nutrition Facts label on food
containers to categorize foods as high or low sodium in a sorting exercise. After an
educational intervention, 92% of the participants were able to determine the sodium
content of foods by reading the Nutrition Facts label. Education can play an important
role in helping clients choose foods lower in sodium.
Behavioral Constructs
The Health Belief Model is a conceptual framework for understanding why
individuals engage, or do not engage, in health-related actions (Janz & Becker, 1984;
Strecher, DeVellis, Becker, & Rosenstock, 1986). Constructs of this model include
perceived severity, susceptibility, benefits, barriers, cues to action, and self-efficacy. In
regard to severity, hypertension and renal disease ranked as the 13th leading cause of
death in 2004 (Minino, Heron, Murphy, & Kochanek, 2007). Hypertension affects a large
percentage of the population of the United States. It has been estimated that it will affect
90% of adults in this country during their lifetimes (Vasan et al., 2002). The prevalence
of hypertension increased from 25% in 1988-1991 to 29% in 1999-2000 according to
data from the National Health and Nutrition Examination Survey (Hajjar & Kotchen,
2003). Based on these statistics, it is likely that many adults perceive that they are
susceptible to hypertension. In addition, the majority of EFNEP participants are Black
females, and Black adults tend to have a higher incidence of blood pressure-related
13
diseases, such as stroke and kidney failure, than White adults and an overall higher
prevalence of elevated blood pressure (USDHHS & USDA, 2005). Awareness of
hypertension was reported by 81% of respondents to the Maywood Cardiovascular
Survey, the majority of which were Black adults (Freeman, Rotimi, & Cooper, 1996).
The high prevalence of hypertension and reported awareness of this disease among Black
adults is likely to result in a fairly high degree of perceived susceptibility.
Barriers to Consuming a Diet Protective of Hypertension
In spite of the seriousness and prevalence of hypertension, barriers exist to
practicing health behaviors that can reduce morbidity from this disease. In regard to diet,
each day individuals make over 200 food-related decisions (Wansink, 2006, p. 1). While
it could be argued that determinants exist for each individual food consumed, most
studies have been conducted on general determinants of food choice. The leading
determinants are taste, cost, and convenience. Nutrition was not one of the top three
reasons why consumers stated that they chose their foods, according to a study by Glanz,
Basil, Maibach, Goldberg, and Snyder (1998). This has implications for nutrition
interventions since standard practice is to promote foods for their nutritional value. To
maximize the effectiveness of a nutrition intervention, consideration should be given to
both psychological and environmental factors influencing food choices, including taste,
cost and convenience, as these can be barriers to the consumption of foods that help
protect against hypertension.
Taste
Taste is the most important determinant of food choice (Glanz et al., 1998). This
makes intuitive sense, as most people elect to eat foods they enjoy if they have the
14
opportunity to choose. When people are asked why they are eating a certain food, they
almost automatically reply, “because I like it,” or “because it tastes good.” According to
Wansink (2006, p. 94), however, the reasons why we eat certain foods are actually much
more complex than taste alone. In one study, stale popcorn was provided free of charge to
patrons of a movie theater. It was consumed in large quantities by the majority of people
to whom it was served. Although the popcorn was not fresh, hot or crunchy, the majority
of participants stated that they ate the popcorn because it tasted good (Wansink & Kim,
2005). In another study by Wansink, the taste of menu items with descriptive names, such
as “Succulent Italian Seafood Filet,” was rated much higher than items with less
descriptive names, such as “Seafood Filet,” even though the two items were exactly the
same food served in the same restaurant (Wansink, 2006, p. 126). It appears that many
factors influence the perceived taste and acceptability of food. This has implications in
regard to modifying the eating environment to favor the consumption of foods that may
decrease the risk of hypertension, since taste is sometimes perceived as a barrier to
consumption (Campbell et al., 1998; Reicks, Randall, & Haynes, 1994). Recipes
developed for promotion in nutrition interventions should be given names that sound
appealing to increase the likelihood of acceptability. In addition, exploring reasons why
people choose to eat or not to eat certain foods could be an important strategy for
enabling participants to overcome barriers to the consumption of hypertension-protective
foods.
Cost
The cost of food is an important determinant of food choice. Cost is the second
most important reason why people choose to eat certain foods (Glanz et al., 1998). “All-
15
you-can-eat” buffet restaurants and “dollar menus” at fast food restaurants are popular
and appeal to consumers interested in getting the most food for their money. In the
United States, far less of our disposable income is spent on food than in many countries.
There is some concern that dietary recommendations, such as those to eat more fresh
fruits and vegetables, may be too expensive for people with limited financial resources
(Campbell et al., 1998; Eikenberry & Smith, 2004; Lutz & Blalock, 1993; Reicks et al.,
1994; Treiman et al., 1996). In a recent study, the average cost of fruits and vegetables
was 21 cents per serving (Cassady, Jetter, & Culp, 2007). Prices varied greatly among
stores, even within low income areas. In addition, expenditures for food require a larger
percentage of income when income is relatively low. A USDA survey found that the
percentage of after-tax income spent on food was 34% for households with incomes
between $5,000 and $9,999, but only 9% for households with incomes of $70,000 or
more (Clausen, 2008). Although federal food assistance programs are available for
people living at or near the poverty level, low-income families may still experience some
degree of food insecurity, defined as not having assured access at all times to enough
food for an active, healthy life (Nord, Andrews, & Carlson, 2006). According to USDA,
12.6 million households were food insecure in 2005 (Nord, Andrews, & Carlson). In
Georgia, 18% of EFNEP participants reported running out of food before the end of the
month Most of the Time or Almost Always (Hanula, 2006). Fewer than 20% of EFNEP
clients enrolled during 2006 reported that they never ran out of food before the end of the
month (Hanula). Food insecurity creates an additional barrier to eating a healthful diet.
Interventions designed to increase the consumption of a more healthful, but also more
costly diet, need to be sensitive and culturally appropriate when targeted to groups at risk
16
for food insecurity (Newby et al., 2006). Creating awareness of food assistance programs
in the community, along with education on food budgeting and methods of preparing
low-cost, nutritious foods, could help lessen the effect of cost as a barrier to the
consumption of a healthful diet.
Barriers to fruit and vegetable intake
The majority of research on determinants of the intake of specific foods has been
in regard to fruits and vegetables. Barriers reported by limited resource participants
include too much time and effort required to prepare fruits and vegetables, preference for
other foods, not liking the taste, families eating fruits and vegetables too quickly, lack of
availability, inadequate space for storing canned and frozen fruits and vegetables,
difficulty transporting canned foods from the grocery store, and cost (Campbell et al.,
1998; Lutz & Blalock, 1993; Reicks et al., 1994; Treiman et al., 1996). Focus group data
reveal that many women, especially those in their late teens and twenties, do not cook
extensively and prefer to spend a minimal amount of time in food preparation (Neumark-
Sztainer, Story, Perry, & Casey, 1999). If nutrition education interventions are to be
effective with young adults, it appears that recipes for meals and snacks that include
fruits, vegetables and low-fat dairy products must be quick and easy, both to prepare and
to clean up.
Fruit and vegetable purchases vary with income level. Blisard, Stewart and
Jolliffe (2004) reported that in any given week, approximately 19% of low-income
households purchased no fruits or vegetables and that low-income households spent
significantly less per person per week on fruits and vegetables compared to higher
income households. They also found that small increases in income translated into
17

additional fruit and vegetable expenditures by higher income households but not by low-
income households. This may reflect a lower priority placed on these foods by lower-
income households. Promoting a diet high in fruits and vegetables as helpful in lowering
blood pressure may increase the perceived benefit of these foods.
Environmental barriers
Environmental factors influence the foods we choose and consume, and the
amount of food we eat. Lack of available fresh fruits and vegetables has been reported as
a barrier to fruit and vegetable consumption, especially in the inner cities where grocery
stores are less plentiful (Campbell et al., 1998). While influencing environmental factors,
such as the availability of certain foods in grocery stores, has not been a focus of EFNEP
in Georgia, the home environment is one that could be influenced. In the home, more of a
particular food may be consumed if it is easy to see and obtain. Wansink (2006, pp. 78-
79) studied candy consumption and found that the largest amount of candy was
consumed when it was placed in a clear dish where it could be easily seen and accessed.
In the home, consumption of hypertension-protective foods might be increased if these
foods were visible and accessible in ready-to-consume form. Examples of this would be
baby carrots or grapes in snack-size bags, clearly visible on an eye-level shelf in the
refrigerator for easy “grab and go” snacks.
Beliefs regarding the food/health relationship
Beliefs among the lay public regarding the relationship of food to health may
differ substantially from evidence-based information reported in the scientific literature.
Street intercept interviews and focus groups conducted in a metropolitan census tract in
Texas comprised primarily of Black adults revealed that 35% related high blood pressure
18
to eating pork or other foods that thickened the blood (Wilson et al., 2002). Hypertension
was causally linked to pork consumption in 8 of the 12 focus groups. High blood pressure
was thought to be treatable with vitamins, garlic and other herbs in 11 of the 12 groups,
and vinegar was mentioned as a remedy for high blood pressure. Participants listed
dietary salt as a cause of high blood pressure in 8 of the 12 groups; however, some
participants believed that consumption of Epsom salts would cure hypertension.
Efforts to prevent or control hypertension through nutrition education should take
into consideration that lay beliefs may diverge sharply from current medical approaches
to hypertension. Although research evidence linking garlic and vinegar to blood pressure
regulation is lacking, there is no harm in consuming these foods, as long as they do not
substitute for blood pressure-lowering medications. It is possible that using garlic and
vinegar as ingredients in recipes promoted in an intervention to decrease dietary risk
factors for hypertension could enhance the credibility of the educator among participants
and increase acceptance of the recipes.
Self-Efficacy
Self-efficacy is an important construct of the Health Belief Model and a strong
relationship exists between self-efficacy and a number of health-related behaviors,
including diet (Brug, Glanz, & Kok, 1997; Schwarzer & Fuchs, 1995). Schwarzer and
Fuchs reported that a strong sense of personal efficacy was related to better health and
that behavior change was facilitated by a personal sense of control. If people believe they
can take action to solve a problem, they become more inclined to do so and feel more
committed to this decision. The belief that one understands and can effectively apply a
19
strategy leads to a greater sense of control over the outcome, which promotes self-
efficacy and motivation to apply the strategy (Pintrich & Schunk, 1996).
Brug et al. (1997) reported that self-efficacy expectations toward increasing fruit
consumption were significantly lower among people who indicated that they had no
desire to consume more fruit. Participants who increased their fruit consumption reported
significantly higher self-efficacy expectations for this behavior. Self-efficacy for fruit and
vegetable consumption can lead to greater increases in servings of fruits and vegetables
than either changes in knowledge or attitudes (Havas et al., 1998). However, the
perceived unattainability of a goal may have a negative effect on self-efficacy, according
to Roncolato and Huon (1998). This raises concerns regarding the desirability of
promoting the consumption of 9 servings of fruits and vegetables a day, which is over
twice what the average EFNEP client consumed in 2006 (Hanula, 2006). In 2006, EFNEP
clients consumed an average of 1.1 servings of fruit per day and 3 servings of vegetables.
Of even greater concern is that 53% of EFNEP clients reported consuming no fruit and
26% consumed no vegetables. The “Fruits and Veggies: More Matters!” slogan may be a
more culturally appropriate message to promote in a short-term intervention with low-
income participants, with the goal of increasing overall consumption of fruits and
vegetables, but not necessarily to the optimal levels recommended for each subgroup
(green vegetables, legumes, etc.) according to MyPyramid.gov (USDA, 2005).
Benefits of Consuming Fruit, Vegetables and Dairy Products
The health benefits of consuming fruits, vegetables and low-fat dairy products
have been well established for many years, however, evidence that these foods are
beneficial to blood pressure regulation is fairly recent. The Dietary Approaches to Stop
20

Hypertension (DASH) clinical trial provided strong evidence that diet can have a major
effect on blood pressure (Appel et al., 1997; Moore et al., 2001; Svetkey et al., 1999).
The DASH trial, sponsored by the National Heart, Lung and Blood Institute (NHLBI),
was a large (n=459) controlled feeding study that tested the impact of three dietary
patterns on blood pressure over an eight week period. The control diet was a fairly typical
American diet, low in fruits, vegetables and dairy products, and with a fat content similar
to the average of 37%. The first intervention diet was similar to the control diet in fat
content, but higher in fruits and vegetables. The second intervention diet was a
“combination diet,” higher than the control in fruits, vegetables and low-fat dairy
products and lower than the control in saturated fat, total fat (27%), and cholesterol.
Sodium and calories were held constant across all three diets in order to test the effects of
the diets without interference from the known effects of decreased sodium and weight on
blood pressure. The target for sodium was 3,000 mg/day, which is higher than the 2,300
mg recommended in the Dietary Guidelines for Americans, but less than the majority of
Americans typically consume (USDHHS & USDA, 2005). The “combination diet,” high
in fruits, vegetables, and low-fat dairy products, and low in fat, reduced blood pressure
more than the control diet. In non-hypertensive patients, systolic blood pressure was
reduced by 3.5 mmHg more and diastolic blood pressure by 2.1 mmHg more in the
treatment group than in the control group. The effect was even more pronounced in
patients with high blood pressure at baseline (n=133), where the reduction in systolic
blood pressure was 11.4 mmHg and diastolic 5.5 mmHg more in the treatment group than
in the control group. The authors also reported that the DASH combination diet was more
effective in minorities, particularly Black persons (Svetkey et al.).
21
The Dietary Approaches to Stop Hypertension 2 Study (DASH 2) was designed to
study the main and interactive effects of three levels of sodium intake and two dietary
patterns on blood pressure in 400 participants, 50% of whom were Black adults. All
participants had either above-optimal blood pressure or Stage I hypertension (Svetkey et
al., 2005). The dietary patterns were the DASH control diet, average in fat (37%) and low
in fruits, vegetables, and dairy products, and the DASH combination diet, high in fruits,
vegetables, and low-fat dairy products and low in total fat (27%), saturated fat, and
cholesterol. Whereas in DASH 1, sodium levels were kept constant at 3,000 mg per day,
DASH 2 used three different sodium levels. The highest level was similar to DASH 1 and
reflected current consumption levels in the United States. The intermediate sodium level
reflected the Upper Limit of current recommendations for sodium and the lowest level
was the optimal sodium level for lowering blood pressure.
Clinical feeding trials provide compelling evidence of the beneficial role diet can
play in decreasing hypertension risk. However, in free-living populations, dietary
behavior change can be extremely difficult and complex. The results of the DASH studies
are impressive and highlight the benefits of a diet rich in fruits, vegetables, and low-fat
dairy products, and moderate in sodium in lowering blood pressure. However, the DASH
studies were clinical trials where all food was provided to the participants, who were
asked not to eat anything other than the food provided during this time. Highlighting the
benefits of a hypertension-protective diet may help individuals make positive dietary
changes. However, health behavior research indicates that knowledge of the benefits of a
protective behavior alone may not be sufficient to motivate individuals to change.
22
Behavioral Interventions
Multi-component Lifestyle Interventions
A number of behavioral studies have explored the effect of multi-component
lifestyle interventions on decreasing hypertension. These studies support the important
role of multiple-component lifestyle interventions, although Appel et al. (2003) state that
it has been well-documented that the combined effect of an intervention that implements
two or more blood-pressure reducing components is less than the sum of blood pressure
reductions from interventions that implement each component alone. This is believed to
be due to the effort and complexity of making multiple lifestyle changes.
The Primary Prevention of Hypertension (PPH) study tested the impact of
reduced sodium, alcohol and caloric intake, along with increased physical activity, on
hypertension incidence in a largely White male population (n=201). This 5-year trial
significantly reduced the risk of hypertension. The effect on blood pressure was related
primarily to the degree of weight loss, the average of which was 2.7 kg. Sodium intake
was reduced by 25% and alcohol intake decreased by 30%. The majority of intervention
participants reported increased physical activity (Stamler et al., 1989).
The Hypertension Control Program (HCP), tested a similar diet without the
emphasis on physical activity, also in a largely White male population, primarily with
hypertensive individuals (n=189) who were taken off their medications to control blood
pressure and either followed the diet low in sodium, alcohol, and calories (intervention)
or their typical diet (control). After four years, 39% of those in the intervention group
remained normotensive without drug therapy compared to 5% who did not take
medication to control blood pressure or follow the intervention diet (Stamler et al., 1987).
23
The Trials of Hypertension Prevention Phase II (TOHP-2) trial tested the effects
of weight loss, reduced sodium intake, or a combination of both on the incidence of
hypertension in 2,383 overweight adults (66% male, 82% non-Black adults) over a 48-
month period. The incidence of hypertension at 6 months, which was the height of
intervention adherence, was lowest in the combined weight loss/reduced sodium group
(3%), followed by the weight loss group (4%) and the reduced sodium group (5%). It was
highest in the usual care group (7%). The incidence of hypertension was significantly less
than the control in each lifestyle group at 48 months, but there was no significant
difference among the intervention groups (Cook et al., 2007).
The PREMIER study was a multi-session, behavioral intervention to treat
elevated blood pressure in free living individuals (n=810). The goal was to develop a
lifestyle intervention that could be easily transferred into general health care settings. The
intervention was designed to be culturally relevant for Black persons and other minorities
and it was Social Cognitive Theory and behavioral self-management-based (Funk et al.,
2006). Participants were recruited at four clinical centers: Johns Hopkins (Maryland),
Duke (North Carolina), Kaiser Permanente (Oregon), and Pennington (Louisiana).
Demographics indicated that the average age of participants was 50 years of age, 62%
were female, and 34% were Black adults. The participants were randomly assigned to
one of three groups. The first consisted of advice only, the second was a comprehensive
behavior change program (established), and the third was a comprehensive behavior
change component plus the DASH diet (established plus DASH). The control group
participated in a 30-minute session with a health practitioner, generally a Registered
Dietitian. The behavioral interventions consisted of a total of 18 face-to-face contacts
24
during the 6-month intervention, 4 of which were individual sessions and 14 group
sessions. Both behavioral interventions significantly reduced weight and intakes of
sodium and fat compared to the advice only (control) group. At the end of the 6 months
the established plus DASH intervention group significantly increased intakes of fruits,
vegetables, and dairy products as measured by 24-hour diet recalls. Total servings of
fruits and vegetables increased from baseline to follow-up as follows: 4.4 to 4.9 in the
control group, 4.6 to 5.1 in the established group and 4.8 to 7.8 in the established plus
DASH group. Servings of dairy products changed from baseline to follow-up as follows:
1.6 to 1.7 in the control group, 1.7 to 1.5 in the established group and 1.8 to 2.3 in the
established plus DASH group (Appel et al., 2003). The established intervention caused
statistically significant reductions in blood pressure in those under and over 50 years of
age and the established plus DASH intervention lowered blood pressure in both those
under and over 50 years of age, but significantly more so in the older age group.
Follow-up of participants in the PREMIER study continued for an additional 12
months. Reductions in blood pressure in the intervention groups were not significantly
different from the controls at the follow-up 18 months after the original baseline (Elmer
et al., 2006). However, the established plus DASH group significantly increased servings
of fruits, vegetables, and dairy products, although not to the levels consumed in the
original DASH feeding studies (9-12 servings of fruits and vegetables). Servings at
baseline, 6 months and 18 months post were as follows: Fruits: control group, 1.8, 1.9,
1.8; established group 1.7, 2.2, 2.0; established plus DASH group, 1.8, 4.0, 3.5;
Vegetables: control group 2.6, 2.9, 2.8; established group 2.8, 2.9, 2.7; established plus
DASH group 2.9, 3.9, 4.0; Dairy products: control group 1.6, 1.7, 1.6; established group,
25

1.7, 1.5, 1.5; established plus DASH group 1.8, 2.3, 2.1. Sodium intake decreased in each
group, but the average intake in each of the groups still exceeded the target goal of less
than 2300 mg per day (Lin et al., 2007).
These studies highlight the fact that multiple behavior changes can be achieved at
essentially the same time. However, it should be noted that in each of these studies, the
participants were motivated and the populations were slightly skewed towards persons
with higher education and incomes. It may not be possible to generalize the results of
these studies to the EFNEP population, which is predominantly of the Black race, female,
and poor. In addition, many of the participants in EFNEP do not self-select enrollment in
EFNEP classes, rather, they participate in the program when it is offered through other
agencies where they obtain services, such as the Department of Family and Children’s
Services and women’s resource centers.
Community-Based Nutrition Education Interventions
The DASH - Dinner with Your Nutritionist intervention was community-based in
a university-neighborhood health care center (Rankins, Sampson, Brown, & Jenkins-
Salley, 2005). Participants were low-income African-American adults with hypertension.
This eight-week, Social Cognitive Theory-based intervention featured nutrition
presentations and DASH-diet dinners to which participants could bring a guest for social
support. Out of 280 eligible participants at the health care center with a hypertension
diagnosis, 92 provided informed consent. Of these individuals, 82 chose to enroll in the
study. The mean age of participants was 55 years of age. The primary outcome variable
was blood pressure, which decreased significantly from pretest to posttest (-8.4 mmHg
systolic, p <.05 and -4.3 mmHg diastolic, p<.05) in participants who attended at least six
26
of the eight sessions. Serum folate was used as a biomarker for following the DASH diet.
Participants who attended at least six sessions (n=32) had significantly higher serum
folate levels at posttest than at pretest. This study was unique in that it offered the
opportunity for education and social support along with free dinners for the participants
and their guests. The authors report that they were encouraged by the fact that 79% of the
participants came to at least one meeting and 54% attended more than half of the
sessions, since the health care center staff estimated that less than 15% of the patients
they refer for nutritional counseling follow up on the referral. However, the fact that less
than half of these individuals, who had been diagnosed with hypertension and chose to
participate in the study, took advantage of the opportunity to participate in at least six of
the eight sessions highlights the difficulty in reaching low-income African-American
adults with nutrition education.
The Sisters in Health intervention was a community-based nutrition education
program taught by paraprofessionals in New York State, with the goal of increasing fruit
and vegetable consumption among low-income women (Devine, Farrell, & Hartman,
2005). The intervention consisted of six group sessions, each 90 minutes in length. The
curriculum emphasized active food experiences in a positive social setting. The control
group received classes on parenting or budgeting and a pamphlet on nutrition. Of the 269
participants, the majority were female. The outcome measure was increased fruit and
vegetable consumption, measured by the six-question screener used on the Behavioral
Risk Factor Surveillance Survey. At follow-up, the intervention group was 0.44 times
more likely than the control group to eat fruits and vegetables five times a day. The
intervention group consumed fruits and vegetables significantly more times per day than
27
the control group, 1.6 times versus 0.8 times per day. Participants also completed a seven
item scale measuring attitudes toward fruit and vegetable consumption. There were no
significant differences between the groups at baseline, but the intervention group had a
greater mean increase in attitude scale scores than the control at follow-up (p=.04). This
study provides evidence that community nutrition education programs featuring group
support and active food experiences can be effective in increasing fruit and vegetable
consumption.
Community-based, federally funded nutrition education programs are available in
each state and U.S. territory through the EFNEP, a partnership between USDA, land
grant universities, and local county governments. The goal of the EFNEP is to increase
the capacity for healthful food choices among low-income families with children. EFNEP
classes are taught by paraprofessionals who have been trained in nutrition, food safety,
and food resource management. Program guidelines specify that to the extent possible,
the paraprofessional aides should be recruited and hired from the target population based
on research supporting the effectiveness of lay nutrition and health educators (USDA,
2006).
EFNEP nutrition curricula are based on MyPyramid.gov and the Dietary
Guidelines for Americans (USDHHS & USDA, 2005). The standard curriculum used in
Georgia is a modification of Eating Right is Basic III, developed by Michigan State
University. The modifications reflect current USDA nutrition recommendations and the
dietary guidance system that was revised in 2005. Core lesson topics include each of the
major food groups, food safety, and food shopping skills. A minimum of six lessons is
required in Georgia for clients to receive a certificate of completion. Typically the core
28

lessons are taught, with the addition of classes on special interest topics such as breakfast,
maternal and infant nutrition, and child nutrition, where appropriate and when time
permits. The federal partner requires evaluation of the program. The measure for dietary
intake is 24-hour diet recalls completed at baseline and follow-up. In 2006, 89% of
EFNEP graduates in Georgia made a positive change in their diets at follow-up.
Improvement was seen in number of servings from each of the food groups, although
intake still fell short of recommended levels (Hanula, 2006).
The EFNEP has been in existence since 1969. The program began as a home-
based intervention, reaching limited resource clients by recruiting door-to-door in low-
income housing areas and through other agencies reaching similar clientele. The majority
of clients now participate in EFNEP through group programs at community agencies,
including adult literacy programs, women’s resource centers, county health departments,
parent resource centers at local schools, and substance abuse recovery programs.
Research at Cornell University sheds light on understanding the experiences and
motivations of EFNEP participants (Devine, Brunson, Jastran, & Bisogni, 2006).
Participants’ motives for enrolling in the program include, “want to be healthy,” “for
job/program,” and “care for kids” One mother initially expressed little interest in learning
about foods and nutrition, but continued in the program because she liked and trusted the
paraprofessional educator, and she began to develop an interest in changing her family’s
food habits. The authors suggested that readiness for change varies with individual clients
and that tailoring programs for participants at various stages may be useful. This poses a
challenge when working with groups of individuals. However, it is clear from this
29
research that efforts must be made to engage participants in the learning process and to
insure that sessions are enjoyable and relevant to participants’ daily lives.
Cox, Gonzales-Vigilar, Novascone, & Silva-Barbeau (1996) conducted a Health
Belief Model-based intervention with EFNEP clientele in Virginia designed to decrease
diet-related cancer and cardiovascular disease risks. The intervention consisted of 18
lessons delivered over a 6-month period, 9 of which were from the traditional EFNEP
curriculum and 9 experimental chronic-disease prevention lessons. The chronic disease
prevention lessons emphasized reducing dietary intake of fat and salt and increasing
intake of low-fat milk products, vegetables, fruits, whole grains, fiber, calcium,
potassium, and antioxidants. Discussions were held with clients on perceived
susceptibility to cancer and heart disease, perceived severity, perceived benefits, and
perceived barriers to making dietary changes, including ways to overcome these barriers.
The experimental group significantly increased their fruit and vegetable intake over
controls. Fruit intake increased significantly in the intervention group from 1.5 to 2.6
servings compared to 1.4 servings both pre and post in the control group (p=.002).
Vegetable servings increased from 0.9 to 1.6 servings in the intervention group compared
to 0.6 to 0.8 servings in the control group (p=.038). The intervention group did not
significantly decrease their sodium intakes or improve their milk consumption. Sodium
intake decreased from 2,723 mg to 2,464 mg in the intervention group, and increased in
the control group from 2,406 mg to 2,474 mg (p=.750). Milk intake increased in both
groups, from 0.6 to 1.0 servings in the intervention group and from 0.3 to 0.8 servings in
the control group (p=.587). This study supports the use of a Health Belief Model-based
curriculum to decrease risk factors for cardiovascular disease in a low-income population.
30
Summary
In conclusion, the literature supports the effectiveness of nutrition interventions to
decrease morbidity and mortality from hypertension. The Health Belief Model is an
appropriate framework for such an intervention. Due to the prevalence of hypertension in
low-income, Black adults, an intervention focused on reducing the risk of hypertension
could play an important role in enabling participants to change dietary behaviors.
31
CHAPTER 3
METHODS
This chapter details the methodology of this study and is composed of six
sections. Section 1 presents the purpose of the study and research questions. Section 2
explains the study design. Section 3 describes the participants and how the sample was
obtained. Section 4 discusses the measures used in the study. Section 5 describes the data
management and analysis. The final section, Section 6, describes the development of the
intervention.
Purpose of the Study and Research Questions
The purpose of this study was to evaluate a community-based nutrition education
intervention designed to decrease dietary risk factors for hypertension in a low-income
population. The study evaluated whether a Health Belief Model-based nutrition education
curriculum was more effective than the standard curriculum used in The University of
Georgia’s EFNEP in increasing consumption of potassium-rich foods and in reducing
dietary sodium to levels recommended in the 2005 Dietary Guidelines for Americans
(USDHHS & USDA, 2005). The theoretical framework for this intervention was the
Health Belief Model (Janz & Becker, 1984). Constructs of the model incorporated were
benefits, barriers, and self-efficacy. The theoretical model of the intervention is depicted
in Figure 3.1. According to the model, the health behavior of consuming a hypertension-
protective diet will increase when barriers to consuming this diet decrease, the perceived
benefits of the diet increase, and self-efficacy for performing the behaviors increases. The
32
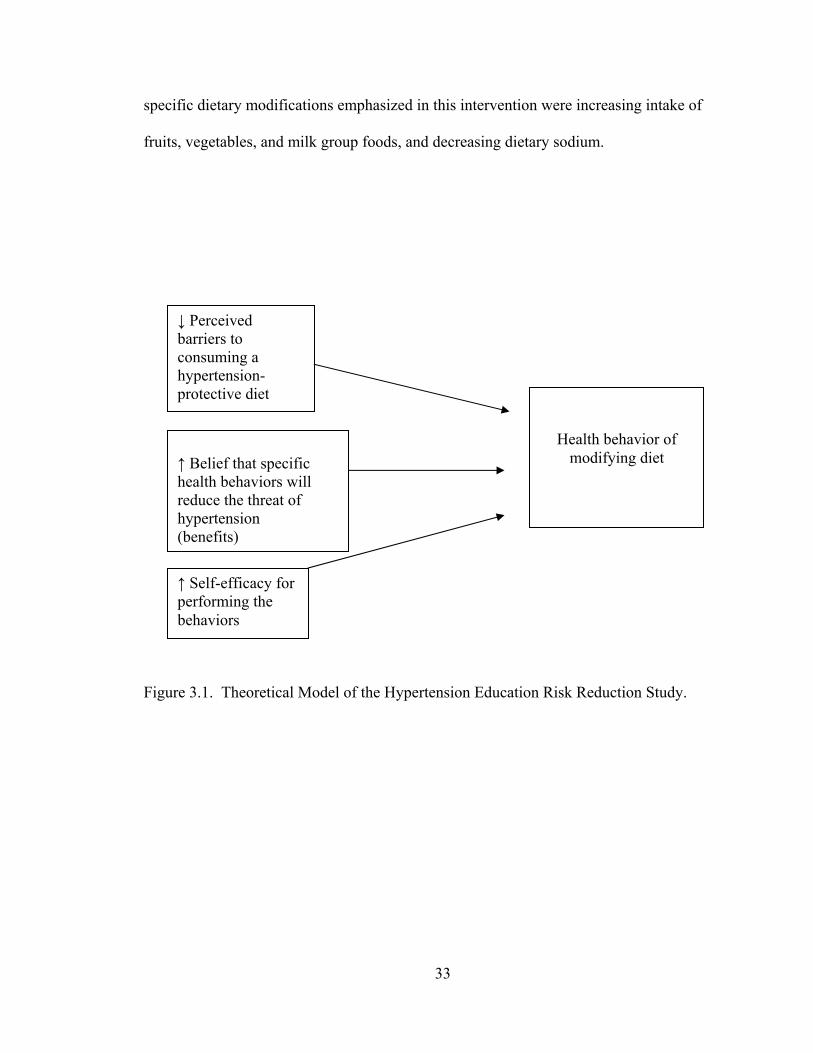
specific dietary modifications emphasized in this intervention were increasing intake of
fruits, vegetables, and milk group foods, and decreasing dietary sodium.
↓ Perceived barriers to consuming a hypertension-protective diet d
↑ Belief that specific health behaviors will reduce the threat of hypertension (benefits)
Health behavior of modifying diet
↑ Self-efficacy for performing the behaviors
Figure 3.1. Theoretical Model of the Hypertension Education Risk Reduction Study.
33

The specific research questions that guided this study and the hypotheses are as
follows:
1. Does the Health Belief Model-based curriculum result in greater consumption of
fruits, vegetables, and milk group foods and in decreased sodium intake than the
control curriculum among participants in the EFNEP?
Hypothesis 1: The nutrition education curriculum that incorporates constructs of
the Health Belief Model will be more effective than the control curriculum in
increasing intake of fruits, vegetables, and milk group foods, and decreasing
intake of sodium.
2. Will the Health Belief Model-based curriculum be more effective than the control
in decreasing perceived barriers to the consumption of fruits, vegetables, and milk
group foods?
Hypothesis 2: The Health Belief Model-based curriculum will be more effective
than the control curriculum in decreasing perceived barriers to the consumption of
fruits, vegetables, and milk group foods.
3. Is the Health Belief Model-based curriculum more effective than the control
curriculum in increasing self-efficacy for making dietary changes to decrease the
risk for hypertension, including the preparation of meals containing fruits,
vegetables, and milk group foods?
Hypothesis 3: The Health Belief Model-based curriculum will be more effective
than the control curriculum for increasing self-efficacy for preparing healthy
meals.
34
4. Is the Health Belief Model-based curriculum more effective than the control
curriculum in increasing self-efficacy for the interpretation of nutrition labels to
determine the salt content of foods?
Hypothesis 4: The Health Belief Model-based curriculum will be more effective
than the control curriculum in increasing self-efficacy for the interpretation of
nutrition labels to determine the salt content of foods.
Study Design
This study, referred to as the Hypertension Education Risk Reduction (HERR)
study, used a quasi-experimental non-equivalent control group design (Campbell &
Stanley, 1963, p. 47). This design is widely used in educational research involving
experimental and control groups, both of which are given pretests and posttests, where it
cannot be assumed that the control and experimental groups have pre-experimental
sampling equivalence. The groups in this study constituted naturally assembled
collectives of individuals who were participants in community nutrition education
programs designed for clients with limited financial resources. The control group
received the standard curriculum used in The University of Georgia’s EFNEP (X0). The
intervention group received the Health Belief Model-based curriculum (X1), referred to as
the Hypertension Education Risk Reduction (HERR) curriculum, described in detail in
the last section of this chapter. The design of the study was follows:
Intervention (X1) Group: HERR Curriculum O X1 O
Control Group (X0): Standard Curriculum O X0 O
The non-equivalent control group design controls for the main effects of history,
maturation, testing and instrumentation (Campbell & Stanley, 1963, p. 48). According to
35
Campbell and Stanley, the addition of a control group reduces the equivocality of
interpretation over what is obtained in the one-group pretest-posttest design. A
disadvantage of the non-equivalent control group design is regression, which presents a
potential problem with internal validity (Campbell & Stanley, p. 49). However, the
control group was not selected based on its extreme scores on the pretest and groups were
not matched. This control is also more effective if the groups are similar in their scores
on the pretest and in their recruitment. The recruitment process did not vary.
Power calculations were conducted prior to the study to determine the sample size
needed to detect an intervention effect
(www.dssresearch.com/toolkit/spcalc/power_a1.asp, accessed 11/21/2006). A sample
size of 74 was calculated to provide 95% power using an effect size of 0.4 and alpha of
.05. The effect size was based on the expected increase in servings of milk group foods
seen in a previous study (Cox et al., 1995). The increase in milk group foods was
expected to be lower than the increase in servings from the fruit and vegetable groups
based on previous data (Hanula, 2006). The goal was to have approximately 100
individuals in each of the control and intervention groups for the study to have enough
power to detect an intervention effect and to allow for a 25% attrition rate.
The study was conducted in Georgia from February 2008 to September 2008.
Eight EFNEP sites were assessed for eligibility. Criteria for inclusion were classes taught
primarily in English, location in an urban area, and approval of Cooperative Extension
administration. Four sites were excluded because they did not meet the criteria. Of the
remaining four sites, two were non-randomly assigned to the intervention and two were
assigned to the control group. Intervention sites were Atlanta (Fulton County) and
36
Columbus (Muscogee County) and control sites were Augusta (Richmond County) and
Macon (Bibb County). All had Cooperative Extension staff willing to participate in the
study by teaching either the intervention or control curriculum and administering the
evaluation.
The University of Georgia Institutional Review Board approved this project on
January 31, 2008 as an amendment to Project Number 2007-10317-2, On-going Family
and Consumer Sciences Extension Evaluation of Education Programs. The amendment
met the criteria for exempt (administrative) review procedures so written consent from
participants was not required. A letter outlining the purpose of the study was attached to
each survey and informational letters were provided to program staff. A copy of the letter
to participants is found in Appendix A.
Participants
Participants in this study were individuals enrolled in EFNEP, a federally-funded
program with the goal of providing food and nutrition education for limited resource
families with children. A total of 219 participants completed 24-hour diet recalls at
baseline and immediately following the intervention. Table 3.1 shows demographic data
for these participants. The majority of participants in the intervention and control groups
were Black females who received some type of federal assistance. Significantly more
males than females participated in the intervention group (p=.002). The age range of
participants in each group was almost identical; however, the mean age of participants in
the intervention group was 41 years of age, 9 years older than the control group (p<.001).
Control group participants were significantly more likely to receive some type of federal
assistance than intervention group participants (p<.001).
37
Of the total participants, 153 individuals completed the Hypertension Education
Risk Reduction (HERR) surveys at both baseline and follow-up. Table 3.2 presents
demographic data of these 153 participants. As in the total sample, the majority of
participants in both groups were Black females who received some type of federal
assistance. Control group participants in the subsample were significantly more likely to
receive some type of federal assistance than intervention group participants (p=.037). The
mean age of participants in the intervention group subsample was also significantly
higher than the control group subsample (p<.001). Gender differences between groups
were not statistically significant.
38
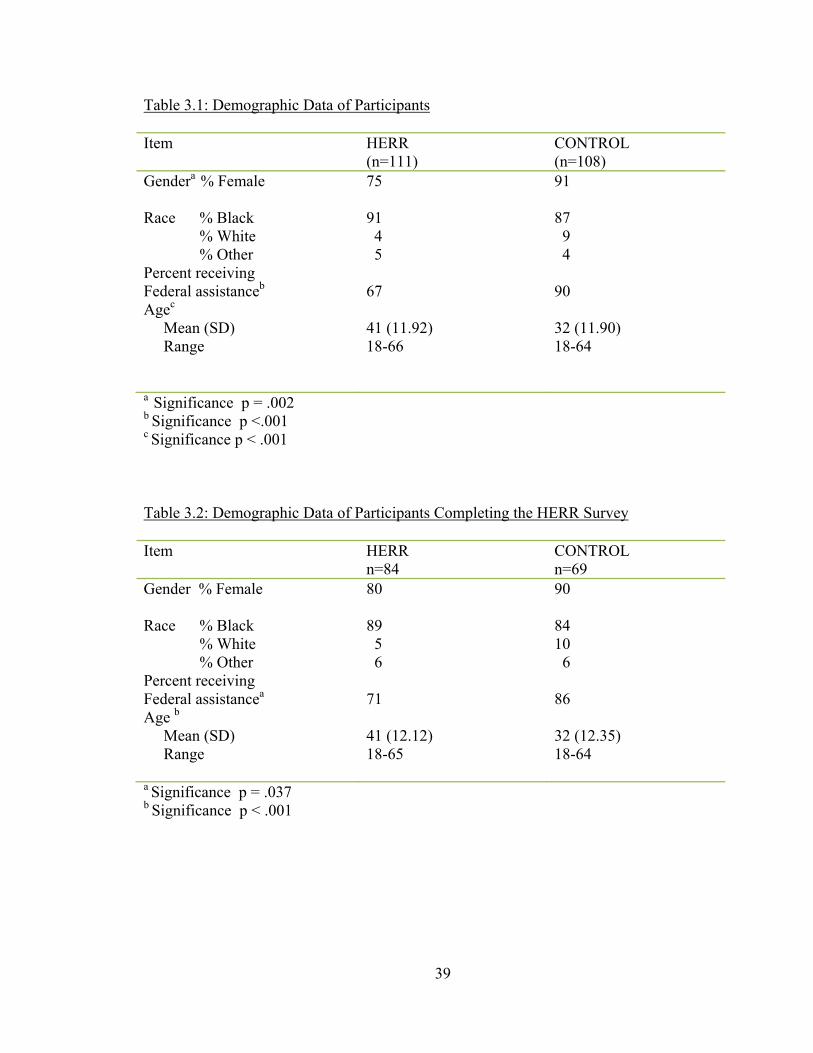
Table 3.1: Demographic Data of Participants
Item HERR (n=111)
CONTROL (n=108)
Gendera % Female 75
91
Race % Black % White % Other
91 4 5
87 9 4
Percent receiving Federal assistanceb
Agec Mean (SD) Range
67 41 (11.92) 18-66
90 32 (11.90) 18-64
a Significance p = .002 b Significance p <.001 c Significance p < .001
Table 3.2: Demographic Data of Participants Completing the HERR Survey Item HERR
n=84 CONTROL n=69
Gender % Female 80
90
Race % Black % White % Other
89 5 6
84 10 6
Percent receiving Federal assistancea
Age b
Mean (SD) Range
71 41 (12.12) 18-65
86 32 (12.35) 18-64
a Significance p = .037 b Significance p < .001
39
Measures
Baseline data were collected by paraprofessionals at intervention and control sites
beginning in February 2008. Post-testing was conducted immediately following the last
lesson. This study used the following measures: 1) 24-hour diet recall (Appendix B), 2)
Hypertension Education Risk Reduction (HERR) survey (Appendix C). All measures
were self-reported. Procedures for administering the instrument were supplied to the
paraprofessional educators who conducted the evaluation (Appendix D). Protocol
included reading information on the forms aloud to participants.
The 24-hour diet recall is a measure of dietary intake. Respondents record all
foods and beverages consumed during the past 24 hours or on the previous day. The 24-
hour diet recall is the most widely used dietary method in population studies, as its
principal use is to describe the average dietary intake of a group (Hankin & Wilkens,
1994). It is an efficient method for quantifying dietary intake and comparing groups of
people. The 24-hour diet recall method has been tested for validity and group mean
nutrient estimates from 24-hour recalls have been found to be similar to observed intakes.
The Hypertension Education Risk Reduction (HERR) survey was developed for
this study in order to assess constructs of the Health Belief Model, including benefits of,
barriers to, and self-efficacy for consuming a hypertension-protective diet. According to
the conceptual framework of the intervention, an increase in the perceived benefits of the
dietary modifications, a decrease in perceived barriers, and an increase in self-efficacy for
these behaviors would increase the likelihood of the health behaviors being adopted.
Barriers to fruit and vegetable consumption identified in two studies with limited
resource clients were addressed (Havas et al., 1998; Reicks et al., 1994). Similar
40
questions were developed for milk group foods (yogurt and low-fat cheese) and low-salt
foods. A total of 18 questions assessed perceived barriers. An additional nine questions
addressed the health benefits of fruits, vegetables, and milk group foods, along with the
benefits of consuming a diet low in salt. Seven questions assessed self-efficacy for
consuming a hypertension-protective diet. The response choices for these questions were
based on a study reported by Townsend and Kaiser (2005) on the development of a tool
to assess psychosocial indicators of fruit and vegetable intake for use in federal nutrition
education programs. The authors reported that participants preferred a choice of three
responses over four. The response choices used on the California survey were used on
this scale. For assessing the behavioral constructs of benefits and self-efficacy, the
response choices were Agree (2), Agree or Disagree (1), Disagree (0). The response
choices for assessing barriers were Agree (0), Agree or Disagree (1), Disagree (2).
Scores for the constructs of barriers, benefits, and self-efficacy were added and then
divided by the total number of questions assessing the respective constructs.
Six questions from the California Fruit and Vegetable Inventory were included on
the HERR survey. Three of these questions addressed dietary intake in a food frequency
format. The response choices, with the scores in parentheses, were almost always (3),
often (2), sometimes (1), never (0). Food purchasing and preparation responsibilities were
assessed with two questions. Response choices were I am (2), shared decision (1), and
someone else (0). Perception of diet quality was measured with one question with the
response choices of excellent (5), very good (4), good (3), fair (2), poor (1).
The HERR survey was pilot tested with program staff in Athens, Atlanta, and
Augusta. Questions were reviewed for cultural relevance, word usage, clarity, visual
41
appeal, and face validity by program staff in Athens. Two University of Georgia
Cooperative Extension faculty members reviewed the instrument for content validity. The
final survey consisted of 47 questions on two double-sided pages, printed in color to
enhance its appeal and usability. Red was used for alternating questions to visually
separate rows of response choice bubbles. The final version of the HERR survey was
tested for reading level using Microsoft Office 2007. The Flesch-Kincaid Grade Level
was 3.5 and the Flesch Reading Ease score was 84% for the survey alone. The addition of
the cover letter to participants raised the Flesch-Kincaid Grade Level to 5.3 and lowered
the Flesch Reading Ease score to 73%.
Reliability testing was conducted for the subtests from baseline administration of
the survey (n=153 respondents). Internal consistency was defined as Cronbach’s alpha.
The reliability coefficient for each subtest was as follows: barriers .76 (n=18 items),
benefits .67 (n=9 items), self-efficacy .57 (n=7 items), seriousness of hypertension .71
(n=2 items), food frequency .77 (n=7 items), and food preparation and buying .81 (n=2
items). Item-total statistics were examined for the construct of self-efficacy to determine
if reliability could be improved with deletion of any of the items, but it could not.
Data Management and Analysis
Enrollment data, exit data, and 24-hour diet recall information were entered into
the NEERS5 software, version CRS5.1, by program staff. Original copies of the data
were retained in the County Extension offices in secure areas. Data were transmitted
electronically to the EFNEP Data Management Specialist in Athens, who stored the data
on a password-protected computer in a locked office. The Data Management Specialist
reviewed the county data for completeness and the principal investigator reviewed dietary
42
intake data for reasonableness. Unusually high total amounts of food group servings or
nutrients were investigated by reviewing individual diet recalls for data entry errors.
Original copies of the standard EFNEP evaluation forms will be stored for six
years and then shredded, as per University of Georgia records and retention procedures.
The HERR surveys were sent to the principal investigator for data entry. Original data is
being stored in a secure location and will be retained by the principal investigator for five
years and then shredded, as per University of Georgia Graduate School policy.
Baseline differences between intervention and control groups were evaluated by
independent samples t-tests for the continuous variables of age, dietary intake of fruits,
vegetables, milk group foods, and sodium. Baseline differences between intervention and
control groups were also evaluated for categorical variables, including race, gender, and
receipt of Federal assistance. Individual samples t-tests were used to compare changes in
the outcome variables between intervention and control counties. For all hypotheses, the
unit of analysis was at the individual level. All statistical analyses were performed using
SPSS (version 15.0, 2006, SPSS, Inc., Chicago, IL). Statistical significance was defined
as p < .05.
Development of the Intervention
To develop an effective health promotion program to improve eating behaviors, it
is important to use a structured process based on theory and informed by research and
practice (Bartholomew, Parcel, Kok, & Gottlieb, 2001). The process of intervention
mapping was used in the development of this intervention. Intervention mapping uses a
social ecological approach in which health is viewed as a function of individuals and their
environments – family, social networks, organizations, communities and societies. An
43
important component of intervention mapping is the involvement in the planning process
of all stakeholders, including the target audience. Bartholomew et al. emphasize that
effective health promotion programs cannot be planned in a vacuum by “experts.”
Ongoing interaction between program planners, educators, and participants is necessary
to create the most effective program possible. Therefore, stakeholder input was obtained
from EFNEP staff in Athens, Atlanta, and Augusta for development of the intervention
and evaluation. The planning team included one paraprofessional in Atlanta who taught
the intervention curriculum, County Extension Agents in Athens, Atlanta, and Columbus,
a retired County Extension Agent, and the principal investigator.
Needs Assessment
Intervention mapping depends on a thoroughly conducted needs assessment to guide
the process. A literature review was conducted as part of the needs assessment for this
intervention and is found in Chapter 2. The PRECEDE-PROCEED model was used as
the framework for conducting the needs assessment (Green & Kreuter, 1991). This model
provides structure for applying theory to identify the most appropriate intervention
strategies. It is based on the premises that an educational diagnosis should come before
an intervention plan and that the most powerful interventions are those that are based on
the most potent determinants of the behavior that are amenable to change (Bartholomew
et al., 2001). Potency refers to the strength of the association of a predictive factor to the
outcome behavior, often reported as the percent variance in behavior the factor predicts.
Unfortunately, in the area of dietary behavior, there is no unified theoretical model
describing the relation among determinants of eating habits and behavior. Many of the
identified determinants are not amenable to change through a nutrition intervention,
44

including level of education and socioeconomic status (Lytle et al., 2003; Neumark-
Sztainer et al., 1999). However, the determinants most frequently identified in the
literature are closely aligned with three constructs of the Health Belief Model: benefits,
barriers, and self-efficacy. This model was, therefore, used as the framework for the
intervention.
The constructs of benefits, barriers and self-efficacy are somewhat responsive to
change, although dietary behaviors are extremely complex. A review of the literature
revealed that interventions focusing on specific problem eating behaviors were more
effective than those focusing on general behaviors, such as improving eating habits
(Luepker et al., 1994; Nicklas, Johnson, Myers, Farris, & Cunningham, 1998). Specific,
measurable objectives of the intervention included increasing consumption of fruits,
vegetables, and milk group foods, and decreasing dietary sodium with the goal of
decreasing dietary risk factors for hypertension. A description of each of the steps and
tasks in the intervention mapping process follows.
Step 1, Task 1: Identification of Target Population
The target population was predetermined as low-income adults participating in the
EFNEP. It was predicted that the sociodemographic characteristics of the population
would be similar to participants in Georgia’s EFNEP in previous years. In 2006, 97% of
the clients were female, 65% were Black adults, and 78% received some form of Federal
assistance (Hanula, 2006).
45
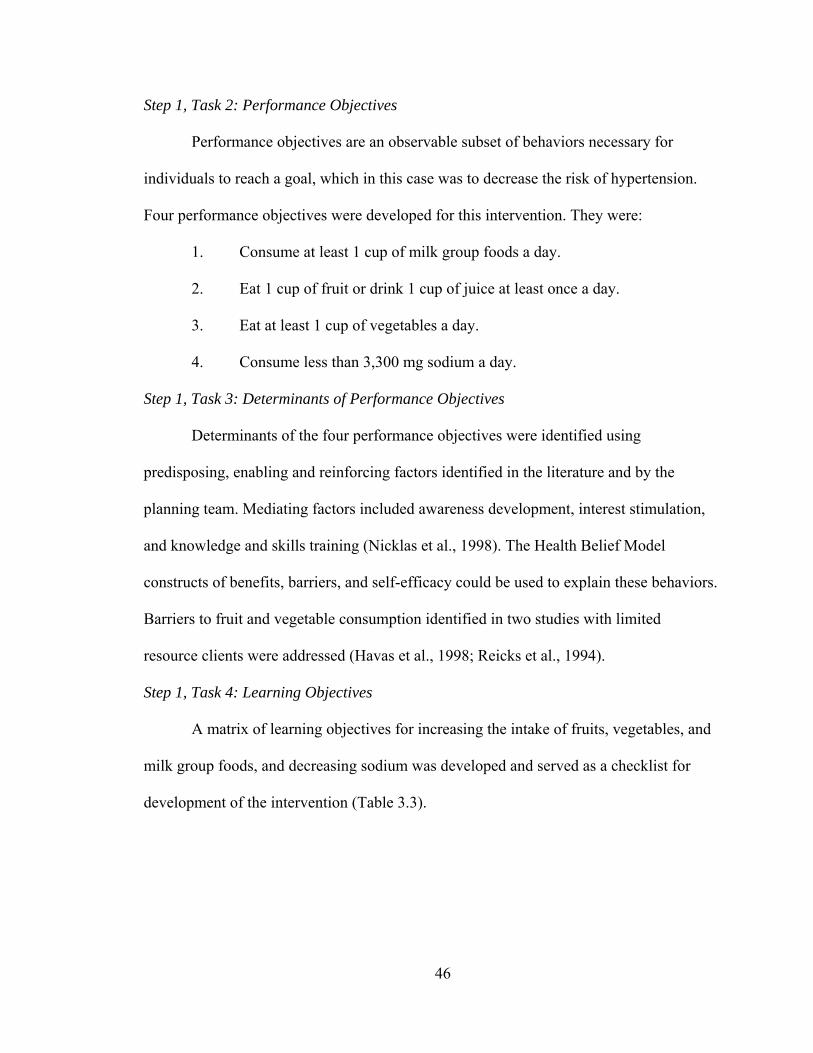
Step 1, Task 2: Performance Objectives
Performance objectives are an observable subset of behaviors necessary for
individuals to reach a goal, which in this case was to decrease the risk of hypertension.
Four performance objectives were developed for this intervention. They were:
1. Consume at least 1 cup of milk group foods a day.
2. Eat 1 cup of fruit or drink 1 cup of juice at least once a day.
3. Eat at least 1 cup of vegetables a day.
4. Consume less than 3,300 mg sodium a day.
Step 1, Task 3: Determinants of Performance Objectives
Determinants of the four performance objectives were identified using
predisposing, enabling and reinforcing factors identified in the literature and by the
planning team. Mediating factors included awareness development, interest stimulation,
and knowledge and skills training (Nicklas et al., 1998). The Health Belief Model
constructs of benefits, barriers, and self-efficacy could be used to explain these behaviors.
Barriers to fruit and vegetable consumption identified in two studies with limited
resource clients were addressed (Havas et al., 1998; Reicks et al., 1994).
Step 1, Task 4: Learning Objectives
A matrix of learning objectives for increasing the intake of fruits, vegetables, and
milk group foods, and decreasing sodium was developed and served as a checklist for
development of the intervention (Table 3.3).
46

Table 3.3: Learning Objectives for the HERR Curriculum _____________________________________________________________________
Performance Objective 1: Consume at least 1 cup of milk group foods a day.
Determinant Learning Objective
Self-Efficacy 1. Express confidence that one can make and enjoy a recipe using yogurt. 2. Express confidence that one can make and enjoy a recipe using low-fat cheese. 3. Express confidence that one can prepare a balanced meal to include milk group foods.
Benefits 1. Discuss the benefits of milk group foods to health, including blood pressure. 2. Analyze the fat and calcium content of various milk group foods by using the Nutrition Facts label.
Barriers 1. Plan to purchase milk group foods by making a grocery list.
2. Identify milk group foods that are appropriate for the lactose intolerant, including yogurt and reduced-lactose milk. 3. Compare the cost and nutrient value of milk to soft drinks. 4. Judge the taste of milk group foods that are shelf-stable. 5. Evaluate the taste of recipes that include low-fat milk group foods.
Performance Objective 2: Eat 1 cup of fruit or drink 1 cup of juice at least once a day. Determinant Learning Objective Self-Efficacy 1. Express confidence that one can make and enjoy a low-fat fruit
dessert. 2. Express confidence that one can prepare a balanced meal to include fruit.
Benefits 1. Discuss the benefits of fruit to health, including blood pressure. 2. Recognize that all forms of fruit are beneficial: canned, frozen, dried, and fresh.
Barriers 1. Compare the cost of generic versus name brands of canned fruit.
2. Distinguish between the price per pound and the price per item of fruit. 3. Plan a meal or snack that includes fruit. 4..Create a grocery list that includes fruit. 5. Evaluate the taste of recipes that include fruit. 6. Compare the cost of fruit to candy.
47
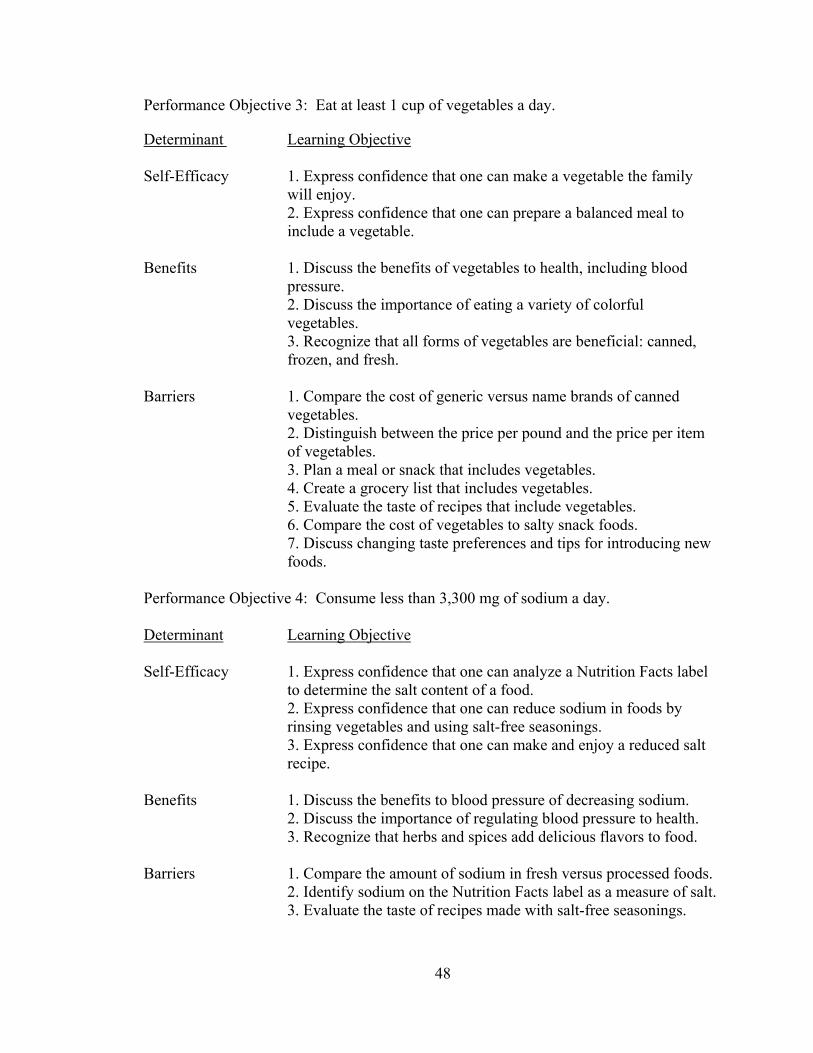
Performance Objective 3: Eat at least 1 cup of vegetables a day.
Determinant Learning Objective Self-Efficacy 1. Express confidence that one can make a vegetable the family
will enjoy. 2. Express confidence that one can prepare a balanced meal to include a vegetable.
Benefits 1. Discuss the benefits of vegetables to health, including blood
pressure. 2. Discuss the importance of eating a variety of colorful vegetables. 3. Recognize that all forms of vegetables are beneficial: canned, frozen, and fresh.
Barriers 1. Compare the cost of generic versus name brands of canned
vegetables. 2. Distinguish between the price per pound and the price per item of vegetables. 3. Plan a meal or snack that includes vegetables. 4. Create a grocery list that includes vegetables. 5. Evaluate the taste of recipes that include vegetables. 6. Compare the cost of vegetables to salty snack foods. 7. Discuss changing taste preferences and tips for introducing new foods.
Performance Objective 4: Consume less than 3,300 mg of sodium a day.
Determinant Learning Objective
Self-Efficacy 1. Express confidence that one can analyze a Nutrition Facts label
to determine the salt content of a food. 2. Express confidence that one can reduce sodium in foods by rinsing vegetables and using salt-free seasonings. 3. Express confidence that one can make and enjoy a reduced salt recipe.
Benefits 1. Discuss the benefits to blood pressure of decreasing sodium. 2. Discuss the importance of regulating blood pressure to health. 3. Recognize that herbs and spices add delicious flavors to food.
Barriers 1. Compare the amount of sodium in fresh versus processed foods.
2. Identify sodium on the Nutrition Facts label as a measure of salt. 3. Evaluate the taste of recipes made with salt-free seasonings.
48

Steps 2 and 3: Methods and Strategies
Methods are techniques for influencing changes in the determinants of behavior
defined in Step 1. The goal was to match methods to the determinants because it is the
methods that form the basis of intervention components to change the performance
objectives listed in Step 1 by answering the question, “How can we influence people to
meet the learning objectives?” Bartholomew et al. (2001) state that it is best to select
methods from several levels, including individual, interpersonal, community and societal,
to match the determinants. The methods in this intervention were limited to the individual
and interpersonal levels to comply with EFNEP guidelines. The planning team developed
the lessons within the framework of learner-centered education (Norris, 2003, pp.58-60).
A challenge in developing an intervention is to cover all of the objectives while
creatively translating methods to strategies. It was important to obtain input from those
who would be conducting the intervention to ensure that the methods and strategies
developed were culturally appropriate and practical. The methods selected for this
intervention were information transmission, reevaluation, identification of barriers and of
potential and immediate solutions, and modeling. The planning team reviewed the
methods and strategies with input from paraprofessional staff. The strategies selected
included learner-centered education with ample opportunity for dialog with participants,
experiential learning activities, and recipe demonstrations. Clear messages about the
benefits of consuming high potassium, low sodium foods were developed along with
information on barriers to consuming protective foods and strategies for overcoming
these barriers. Each session provided the opportunity for testimony from an individual
who implemented one of the target behaviors.
49

The construct of self-efficacy for consuming fruits, vegetables, and milk group
foods was addressed through culturally-appropriate recipes using many foods available
from food assistance programs. The majority of recipes were developed specifically for
this intervention because existing recipes meeting all of the established criteria were not
readily available. Miller, Burgess, and Mason (1999) suggested that recipes for limited
resource audiences have the following characteristics: easy-to-prepare and cook, quick,
require no special equipment, use low-cost ingredients, and be nutritious and tasty. These
criteria were included. Additional criteria were established to ensure that hypertension-
protective foods were highlighted, for ease and practicality of demonstration (including
time constraints), and to ensure food safety. Main dish recipes were required to contain a
vegetable and foods from at least two other food groups. Dessert and snack recipes were
required to include fruit and a low-fat food from the milk group. Recipe preparation had
to be completed in 15 minutes or less, and an electric skillet was the only allowable
equipment for heating foods. Reduced fat dairy foods were used in an effort to lower fat.
To lower sodium, herbs, salt-free seasonings, and small portions of foods high in sodium
were used. All recipe ingredients had to be readily available at a large grocery store chain
located near each intervention site.
Food safety was of particular concern for the recipe demonstrations since the
majority of classes are conducted in locations without cooking facilities. Cooperative
Extension Agents or Specialists trained all staff in food safety prior to the intervention.
Due to the potential hazard of cross-contamination, uncooked meats and unpasteurized
eggs were not used in recipe demonstrations. Foods from the meat group included
canned chicken and tuna, pasteurized eggs or egg substitute, pre-cooked ground turkey,
50

and fully-cooked ham. To decrease the risk of Listeriosis in pregnant women, cold fully-
cooked ham was heated until steaming hot as recommended by the Centers for Disease
Control and Prevention
(http://www.cdc.gov/nczved/dfbmd/disease_listing/listeriosis_gi.html#prevented,
accessed 11-08-08). Each lesson plan specified that copies of the recipes were to be
distributed to participants prior to sampling so they could check the ingredient list for
possible allergens. Another safety consideration was that all recipes were designed to be
made with lightly serrated plastic knives since some partner agencies do not allow the use
of sharp knives in their facilities.
The principal investigator developed all recipes following guidelines specified for
the development of recipes for audiences with limited resources (Miller et al., 1999; Reed
& Schuster, 2002). Colleagues conducted informal recipe sampling. Recipes that were
appealing in taste and texture were then tested by intervention staff in local County
Extension offices. Recipes rated excellent by the majority of testers were evaluated for
practicality, ease of demonstration, and food safety hazards. A minimum of three
individuals tested each recipe. Successful recipes were tested for clarity of instructions.
Nutrition analyses were conducted using nutritiondata.com (www.nutritiondata.com).
All recipes were consistent with the educational goals of the intervention
(Robinson, Wong, Rodgers, Bielamowicz, & Konzelmann, 2005). Teaching tips
consistent with the identified educational goals were developed for each recipe and
included in the curriculum. Recipes were distributed to participants at each session and
combined into a cookbook that was distributed at the conclusion of the six-lesson series.
51
Nutrition Facts labels and nutrition and food safety information were provided for the
recipes to enhance the teaching value.
An overview of the sequence and scope of the Hypertension Education Risk
Reduction curriculum, Food Talk, is found in Table 3.4. Single copies of the Food Talk
curriculum and the EFNEP Meals in Minutes recipe book are available from the author
upon request.
52
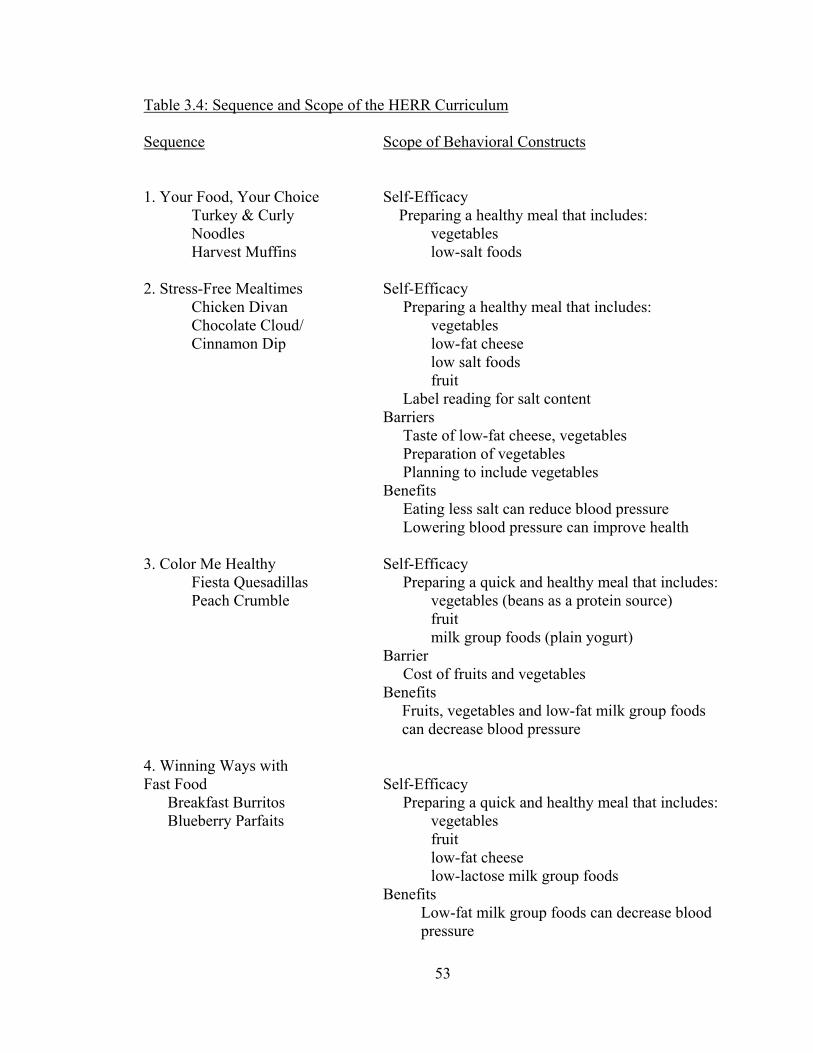
Table 3.4: Sequence and Scope of the HERR Curriculum Sequence Scope of Behavioral Constructs
1. Your Food, Your Choice Self-Efficacy
Turkey & Curly Preparing a healthy meal that includes: Noodles vegetables Harvest Muffins low-salt foods
2. Stress-Free Mealtimes Self-Efficacy
Chicken Divan Preparing a healthy meal that includes: Chocolate Cloud/ vegetables Cinnamon Dip low-fat cheese
low salt foods fruit
Label reading for salt content Barriers Taste of low-fat cheese, vegetables Preparation of vegetables Planning to include vegetables Benefits Eating less salt can reduce blood pressure Lowering blood pressure can improve health
3. Color Me Healthy Self-Efficacy Fiesta Quesadillas Preparing a quick and healthy meal that includes:
Peach Crumble vegetables (beans as a protein source) fruit milk group foods (plain yogurt) Barrier
Cost of fruits and vegetables Benefits
Fruits, vegetables and low-fat milk group foods can decrease blood pressure
4. Winning Ways with Fast Food Self-Efficacy
Breakfast Burritos Preparing a quick and healthy meal that includes: Blueberry Parfaits vegetables fruit
low-fat cheese low-lactose milk group foods
Benefits Low-fat milk group foods can decrease blood pressure
53

Barriers Taste of low-fat milk group foods Taste of lower salt foods Cost/value of milk and cheese
Cost of vegetables – fresh vs. frozen Planning to include milk group foods Preparation time for vegetables
5. Keep Yourself Well! Self-Efficacy
Famous Fried Rice Preparing a quick and healthy meal that includes: Creamy Pineapple low-salt foods Pudding vegetables fruit Benefits
Nutrition is important to good health Barriers
Cost of food is less if you keep it safe/decrease waste
Taste of lower-salt foods Taste of vegetables Taste of low-fat milk group foods Taste of fruit 6. Keep Your Health Out of Jeopardy Self-Efficacy
Festive Tuna Salad Preparing a quick and healthy meal that includes: Easy Cheesy vegetables Broccoli Soup fruit Amazing Banana low-fat milk group foods Pudding Barriers
Cost of milk – shelf-stable milk decreases waste Taste of non-fat dry milk Taste of vegetables
54
Step 4: Adoption and Implementation
The fourth step in intervention mapping is the adoption and implementation of the
intervention. To facilitate successful adoption and implementation, the intervention
curriculum was developed with significant input from the EFNEP staff. During the
development phase, the lessons were tested for feasibility and acceptability.
Training on implementation of the curriculum, including recipe demonstrations
and activities, was provided to staff at the intervention sites. Materials provided included
detailed lesson plans, outlines, recipes with teaching points, and educational materials for
participants. Paraprofessional staff members were trained in learner-centered education
and the expectation was that the sessions would be less formal than traditional lecture-
based classes. Those teaching the intervention were asked not to share any of the
intervention materials with staff members in other counties.
Step 5: Evaluation
The goal was for the intervention curriculum to be implemented as intended,
therefore the implementation plan guidelines were thorough and specific. Since lack of
fidelity can be a problem in community interventions, paraprofessionals who taught the
intervention were asked to complete a brief, confidential process evaluation following
each teaching session. The process evaluation was available as an on-line survey through
Survey Monkey (www.surveymonkey.com) (Appendix E). Questions included
components of the lesson taught, whether a recipe demonstration was conducted,
satisfaction with the curriculum, and perceived participant satisfaction with the session
and recipes. In addition to the process evaluations, regular informal communication with
55

staff in intervention counties was conducted to insure that all concerns regarding process
were addressed.
Comparison of Intervention Curriculum to Control (Standard)
Table 3.5 outlines the major differences between the intervention curriculum and
the standard curriculum used in The University of Georgia’s EFNEP. The primary
difference is that the intervention curriculum emphasized nutritional adequacy rather than
optimal nutrition. In 2006, 89% of EFNEP clients in Georgia made at least one positive
change in their diets following completion of the EFNEP series of classes (Hanula,
2006). However, only 5% of clients achieved optimal nutrition, defined as consuming the
recommended number of servings from each food group according to the 1992 Food
Guide Pyramid, and over 50% reported consuming no fruits or dairy products. The
increased amount of milk, fruits, and vegetables recommended in the 2005 MyPyramid
made it even less likely that EFNEP clients would achieve optimal nutrition following a
relatively low-dose intervention. The intervention curriculum was designed to focus on
the food groups most often lacking in the diets of EFNEP clients. It is these same food
groups that clinical studies have found beneficial in decreasing the risk of hypertension.
The intervention curriculum emphasized the importance of daily consumption of milk
and low-fat dairy products, fruits, and vegetables in regard to decreasing blood pressure.
According to the Health Belief Model, belief in a health threat will influence health
behavior. Due to the prevalence of hypertension among Black adults with limited
resources, the prediction was that participants would have a strong belief in the health
threat of hypertension and would be more likely to adopt dietary changes in an effort to
56

decrease this immediate health threat (intervention curriculum) than if the same dietary
changes were presented as important for improving general health (standard curriculum).
Table 3.5: Comparison of EFNEP Control (Standard) and Intervention Curricula
Control Intervention
Optimal nutrition Nutritional adequacy Food Guidance System: Food Guidance System: MyPyramid Dietary Approaches to Stop Hypertension (DASH diet) Sessions focus on all 5 food Sessions focus on 3 of the 5 food groups: milk, fruits, vegetables, groups: milk, fruits, vegetables grains, meat and beans Amount of food needed from each Importance of eating at least one food from food group every day emphasized each food group every day emphasized (number of servings and serving sizes) Benefits of each food group to Benefits of increasing milk, fruits, and overall health and prevention of vegetables to blood pressure emphasized chronic disease emphasized Recipe demonstrations Recipes specified for each suggested, but recipes not specified session consistent with the educational goals for each lesson of the intervention
57
CHAPTER 4
RESULTS
This chapter presents the results of the Hypertension Education Risk Reduction
(HERR) study, a community intervention to decrease dietary risk factors for hypertension
in a low-income population. There are five sections in this chapter. Section 1 responds to
the first research question on dietary intake, “Was the Health Belief Model-based
curriculum more effective than the standard curriculum used in The University of
Georgia’s EFNEP in increasing consumption of potassium-rich foods and reducing
dietary sodium to levels recommended in the 2005 Dietary Guidelines for Americans?”
Section 2 responds to the second, third and fourth research questions on behavioral
constructs, “Will the Health Belief Model-based curriculum be more effective than the
control in decreasing perceived barriers to the consumption of fruits, vegetables, and milk
group foods?, “Was the Health Belief Model-based curriculum more effective than the
control curriculum in increasing self-efficacy for making dietary changes to decrease the
risk for hypertension, including the preparation of meals containing fruits, vegetables,
and milk group foods?,” and “Was the Health Belief Model-based curriculum more
effective than the control curriculum in increasing self-efficacy for the interpretation of
nutrition labels to determine the salt content of foods?” Qualitative data from participant
evaluations is presented in Section 3. Section 4 discusses the process evaluation, and
Section 5 summarizes the chapter.
58
Dietary Intake
Baseline
Dietary intake data were obtained from 24-hour diet recalls self-reported by study
participants (n=219). Data were analyzed using the NEERS5 software, Version CRS5.1.
Independent samples t-tests were performed using SPSS Version 15. An alpha level of
.05 was used for all statistical tests. Table 4.1 shows dietary intake data. At baseline,
mean intakes of fruits, vegetables, milk group foods, and sodium were higher in the
control group than in the intervention (HERR) group, but only the difference in vegetable
intake between the two groups was statistically significant (p = .03). The mean baseline
intake of vegetables among control group participants was 1.52 cups compared to 1.07
cups consumed by the HERR group. Mean intake of fruit was 0.87 cups at baseline in the
control group and 0.55 cups in the HERR group. Milk intake at baseline was also higher
in the control group, 0.66 cups, compared to 0.57 cups in the HERR group. Sodium
intake also differed between the two groups, with the control group consuming a mean of
2,941.47 mg of sodium at baseline compared to the HERR group, which consumed a
mean of 2,709.70 mg.
59
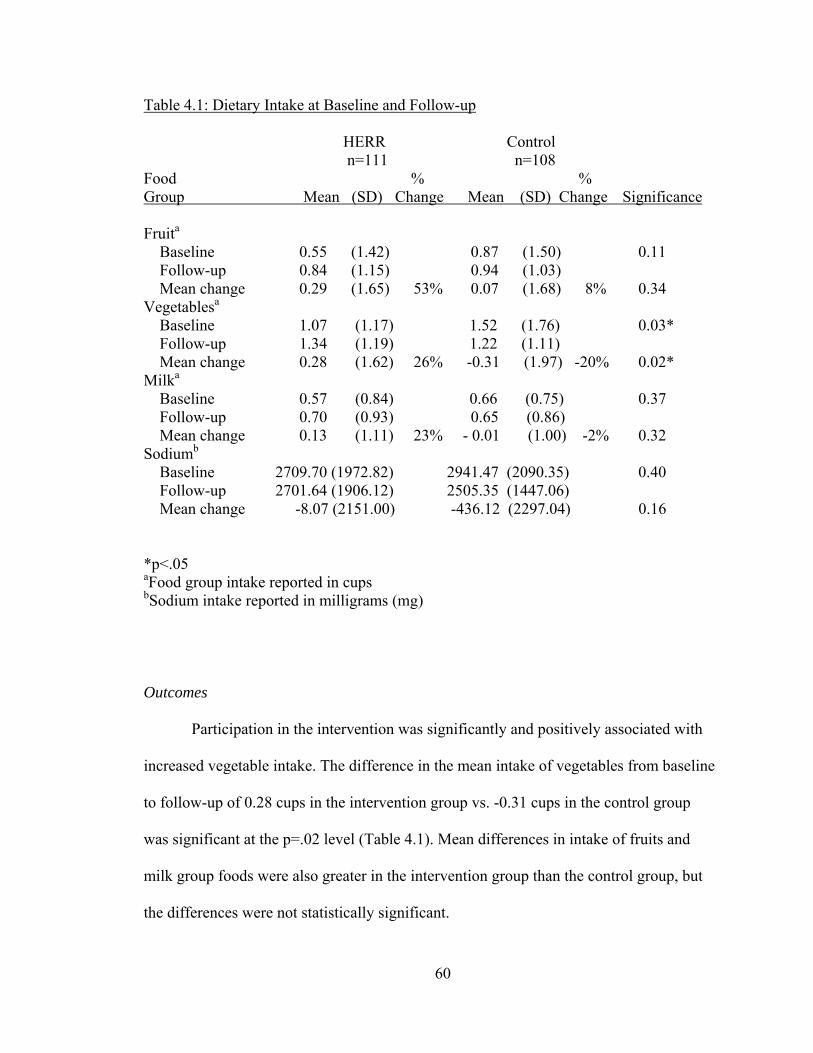
Table 4.1: Dietary Intake at Baseline and Follow-up
HERR Control n=111 n=108 Food % % Group Mean (SD) Change Mean (SD) Change Significance Fruita Baseline 0.55 (1.42) 0.87 (1.50) 0.11 Follow-up 0.84 (1.15) 0.94 (1.03) Mean change 0.29 (1.65) 53% 0.07 (1.68) 8% 0.34 Vegetablesa
Baseline 1.07 (1.17) 1.52 (1.76) 0.03* Follow-up 1.34 (1.19) 1.22 (1.11) Mean change 0.28 (1.62) 26% -0.31 (1.97) -20% 0.02* Milka
Baseline 0.57 (0.84) 0.66 (0.75) 0.37 Follow-up 0.70 (0.93) 0.65 (0.86) Mean change 0.13 (1.11) 23% - 0.01 (1.00) -2% 0.32 Sodiumb
Baseline 2709.70 (1972.82) 2941.47 (2090.35) 0.40 Follow-up 2701.64 (1906.12) 2505.35 (1447.06) Mean change -8.07 (2151.00) -436.12 (2297.04) 0.16
*p<.05 aFood group intake reported in cups bSodium intake reported in milligrams (mg)
Outcomes
Participation in the intervention was significantly and positively associated with
increased vegetable intake. The difference in the mean intake of vegetables from baseline
to follow-up of 0.28 cups in the intervention group vs. -0.31 cups in the control group
was significant at the p=.02 level (Table 4.1). Mean differences in intake of fruits and
milk group foods were also greater in the intervention group than the control group, but
the differences were not statistically significant.
60
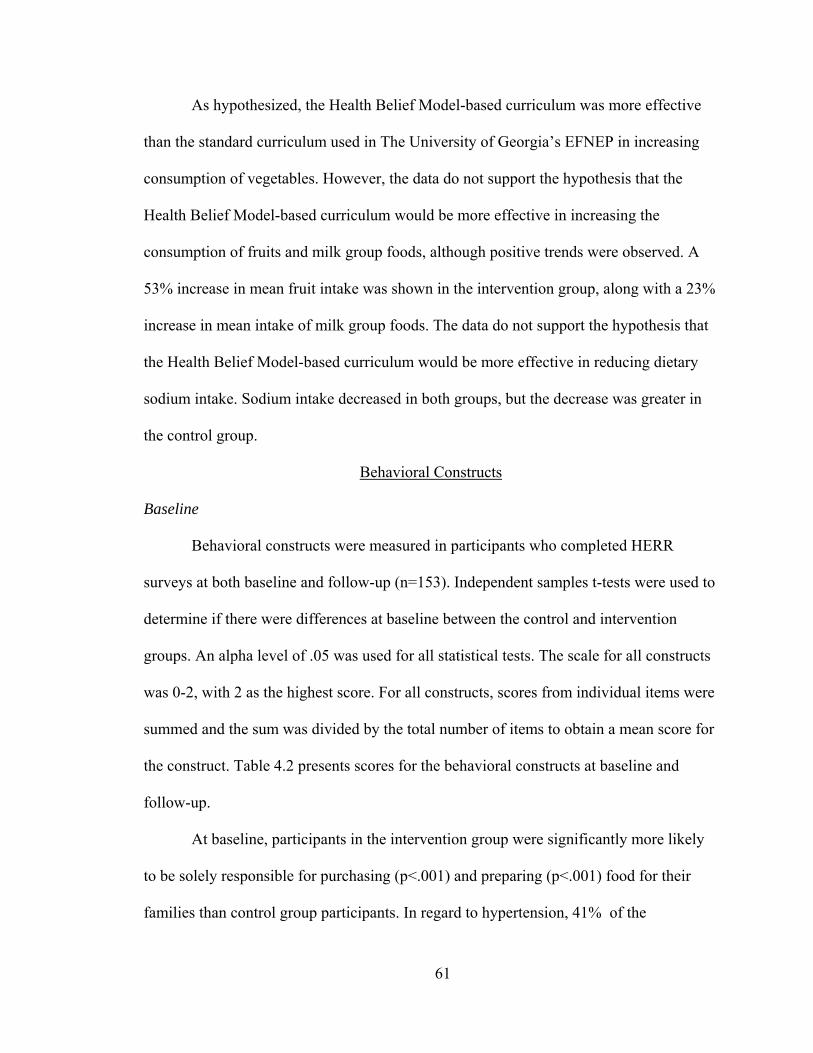
As hypothesized, the Health Belief Model-based curriculum was more effective
than the standard curriculum used in The University of Georgia’s EFNEP in increasing
consumption of vegetables. However, the data do not support the hypothesis that the
Health Belief Model-based curriculum would be more effective in increasing the
consumption of fruits and milk group foods, although positive trends were observed. A
53% increase in mean fruit intake was shown in the intervention group, along with a 23%
increase in mean intake of milk group foods. The data do not support the hypothesis that
the Health Belief Model-based curriculum would be more effective in reducing dietary
sodium intake. Sodium intake decreased in both groups, but the decrease was greater in
the control group.
Behavioral Constructs
Baseline
Behavioral constructs were measured in participants who completed HERR
surveys at both baseline and follow-up (n=153). Independent samples t-tests were used to
determine if there were differences at baseline between the control and intervention
groups. An alpha level of .05 was used for all statistical tests. The scale for all constructs
was 0-2, with 2 as the highest score. For all constructs, scores from individual items were
summed and the sum was divided by the total number of items to obtain a mean score for
the construct. Table 4.2 presents scores for the behavioral constructs at baseline and
follow-up.
At baseline, participants in the intervention group were significantly more likely
to be solely responsible for purchasing (p<.001) and preparing (p<.001) food for their
families than control group participants. In regard to hypertension, 41% of the
61
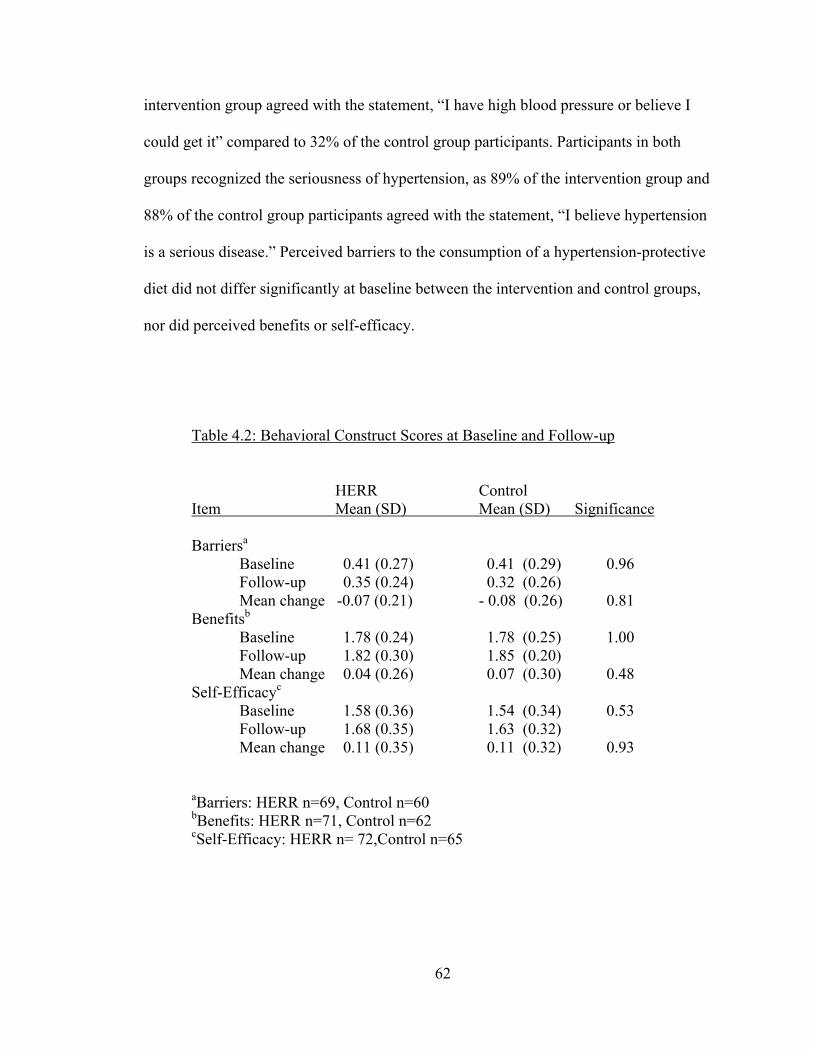
intervention group agreed with the statement, “I have high blood pressure or believe I
could get it” compared to 32% of the control group participants. Participants in both
groups recognized the seriousness of hypertension, as 89% of the intervention group and
88% of the control group participants agreed with the statement, “I believe hypertension
is a serious disease.” Perceived barriers to the consumption of a hypertension-protective
diet did not differ significantly at baseline between the intervention and control groups,
nor did perceived benefits or self-efficacy.
Table 4.2: Behavioral Construct Scores at Baseline and Follow-up
HERR Control Item Mean (SD) Mean (SD) Significance Barriersa
Baseline 0.41 (0.27) 0.41 (0.29) 0.96 Follow-up 0.35 (0.24) 0.32 (0.26) Mean change -0.07 (0.21) - 0.08 (0.26) 0.81 Benefitsb
Baseline 1.78 (0.24) 1.78 (0.25) 1.00 Follow-up 1.82 (0.30) 1.85 (0.20) Mean change 0.04 (0.26) 0.07 (0.30) 0.48 Self-Efficacyc
Baseline 1.58 (0.36) 1.54 (0.34) 0.53 Follow-up 1.68 (0.35) 1.63 (0.32) Mean change 0.11 (0.35) 0.11 (0.32) 0.93
aBarriers: HERR n=69, Control n=60 bBenefits: HERR n=71, Control n=62 cSelf-Efficacy: HERR n= 72,Control n=65
62
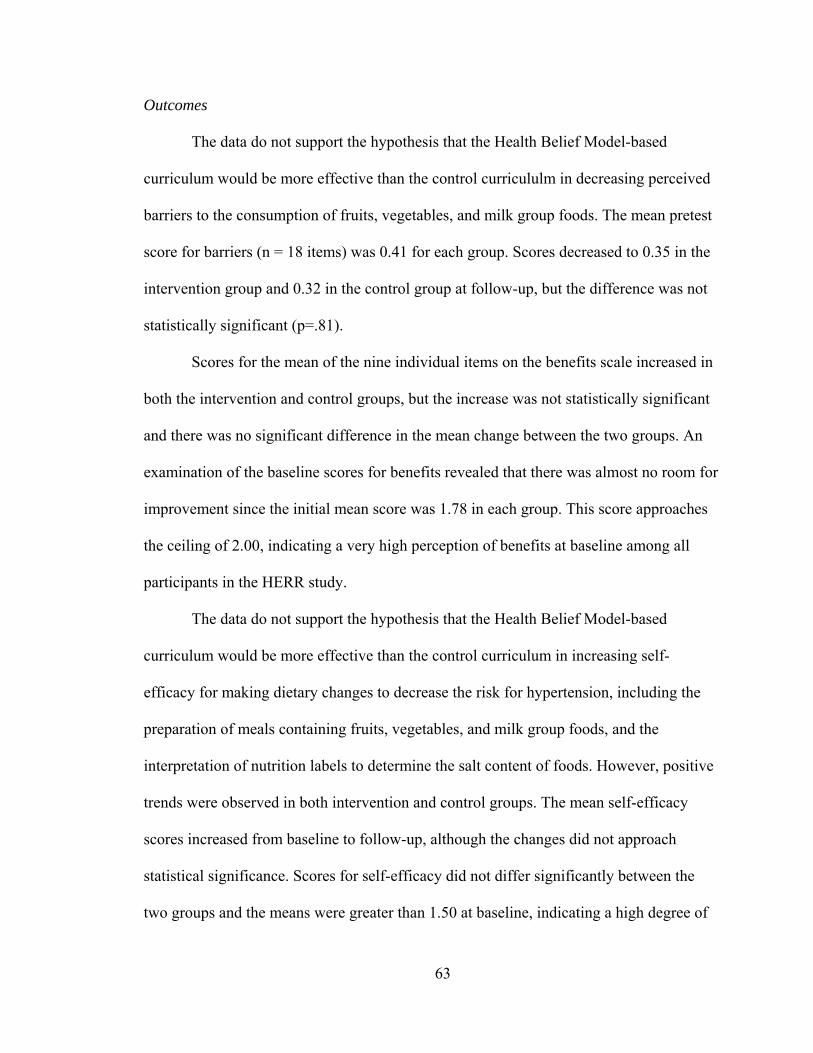
Outcomes
The data do not support the hypothesis that the Health Belief Model-based
curriculum would be more effective than the control curricululm in decreasing perceived
barriers to the consumption of fruits, vegetables, and milk group foods. The mean pretest
score for barriers (n = 18 items) was 0.41 for each group. Scores decreased to 0.35 in the
intervention group and 0.32 in the control group at follow-up, but the difference was not
statistically significant (p=.81).
Scores for the mean of the nine individual items on the benefits scale increased in
both the intervention and control groups, but the increase was not statistically significant
and there was no significant difference in the mean change between the two groups. An
examination of the baseline scores for benefits revealed that there was almost no room for
improvement since the initial mean score was 1.78 in each group. This score approaches
the ceiling of 2.00, indicating a very high perception of benefits at baseline among all
participants in the HERR study.
The data do not support the hypothesis that the Health Belief Model-based
curriculum would be more effective than the control curriculum in increasing self-
efficacy for making dietary changes to decrease the risk for hypertension, including the
preparation of meals containing fruits, vegetables, and milk group foods, and the
interpretation of nutrition labels to determine the salt content of foods. However, positive
trends were observed in both intervention and control groups. The mean self-efficacy
scores increased from baseline to follow-up, although the changes did not approach
statistical significance. Scores for self-efficacy did not differ significantly between the
two groups and the means were greater than 1.50 at baseline, indicating a high degree of
63

self-efficacy and little room for measurable change following the intervention. However,
examination of the individual items for self-efficacy revealed that in both intervention
and control groups, 50% or more of participants with low self-efficacy at baseline
increased their self-efficacy at follow-up for five of the seven behaviors. Table 4.3
presents improvements in self-efficacy for individual items
64
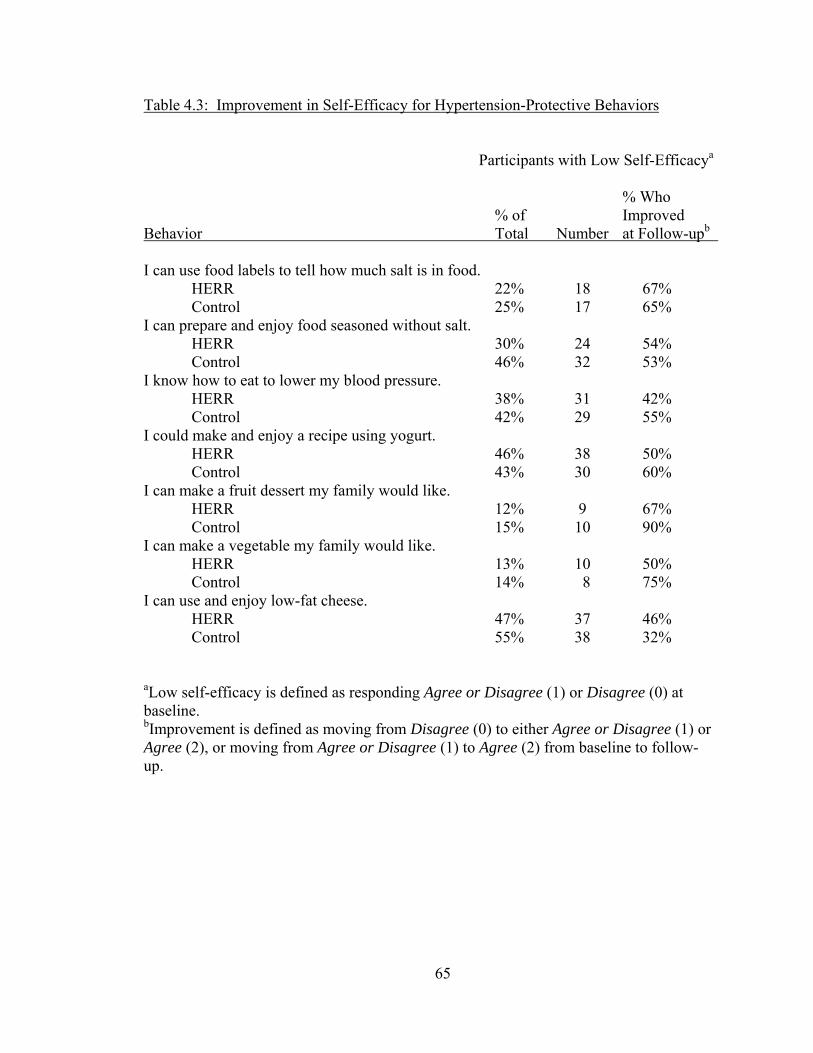
Table 4.3: Improvement in Self-Efficacy for Hypertension-Protective Behaviors
Participants with Low Self-Efficacya
% Who % of Improved Behavior Total Number at Follow-upb I can use food labels to tell how much salt is in food. HERR 22% 18 67% Control 25% 17 65% I can prepare and enjoy food seasoned without salt. HERR 30% 24 54% Control 46% 32 53% I know how to eat to lower my blood pressure. HERR 38% 31 42% Control 42% 29 55% I could make and enjoy a recipe using yogurt. HERR 46% 38 50% Control 43% 30 60% I can make a fruit dessert my family would like. HERR 12% 9 67% Control 15% 10 90% I can make a vegetable my family would like. HERR 13% 10 50% Control 14% 8 75% I can use and enjoy low-fat cheese. HERR 47% 37 46% Control 55% 38 32%
aLow self-efficacy is defined as responding Agree or Disagree (1) or Disagree (0) at baseline. bImprovement is defined as moving from Disagree (0) to either Agree or Disagree (1) or Agree (2), or moving from Agree or Disagree (1) to Agree (2) from baseline to follow-up.
65

Participant Evaluations
Participants in the HERR study had the opportunity to respond in writing to open-
ended questions during their last class session. These questions included, “What was the
most important thing you learned?” and “How did this program change your life?” The
responses revealed that many participants increased their self-efficacy for preparing
healthful meals and snacks and for eating a more healthful diet. The benefits of eating a
variety of foods, especially fruits and vegetables, were often noted. Participants stated
that what they learned in EFNEP would improve not only their own health, but the health
of their children. All of the comments are listed below.
Intervention Group
This program changed my life. I learned to eat more fruit and vegetables; take care of my body. Eating vegetables is the best healing food. I learned that you can eat less food and yogurt is good for you.
How to eat better and handle food.
How to eat healthy.
How to save and how to eat more healthy.
I learned that nutrition is very important and that you must plan properly.
I learned a healthy way for eating.
I learned how to eat right.
This program has made me more aware of what I eat.
This program help me be more aware of what I shouldn’t eat and should eat to be more healthy. I learned how to take better care of myself.
66
Control Group
I am more aware of what I eat and buy. I use less salt.
I learned how to cook. It was a great program. I learned about sodium, food labels. To cut salt.
To eat less junk food. I eat more Fruits. Food safety help me since I work at a restaurant. I eat better. And more vegetables.
I eat more vegetables. I will cook more when I get my children back. I look forward to this class every week. I learned how to feed my children better. I give them fruits and not so many sweets for snack. I really like this class. I have learned how to cook. I eat more vegetables and fruits.
To eat more fruit.
The spinach dip was fatabulas.
To eat more fruits and vegetables. I have learned a lot.
To eat a balance meal daily and to include all food groups. I make better choices. I eat more dairy. Thanks for class. I cook more.
How important nutrition is. It has made me see how quick and easy preparing my own meals can be. I really enjoyed this class. How to cook healthier and smarter.
How to cook. It taught me to budget my food money.
How to eat good but healthy and to manage money. Taught me to eat healthier.
How to eat healthy. Taught me how to budget my money in the food store.
How to shop on a budget. I bake more. I was glad this class was offered to me.
67

I do really like this class.
I don’t skip meals anymore. I love this class.
I eat better.
I learned a lot. How to thaw frozen food correctly. How to read labels. How to eat healthy and enjoy it. I learned how to eat better and to prepare food.
I learned how to eat right, and to feed my children right.
I learned how to read food labels, choose healthy snacks. I really enjoyed this class. I learned how to read labels, and eat more nutritious and healthier foods.
I learned so much in this class. I cook instead of eating out. I learned to save money. I learned to read labels and to better prepare foods.
I love the samples.
I really enjoyed the program, and its been beneficial. I learned to read food labels and to preplan meals. I really like this class. I learn to eat whole grains. It has been very enlightening on watching what I need to use when cooking my food. I try new things and different foods. Keep this class going. I am eating healthier and budgeting better.
Learn how to cook healthy. A healthy life. I would love bigger samples.
Learn how to cook without so much fat. It has made dieting and losing weight easier. My diabetes is under control now. Because of my eating habits.
This program helped me to look at food better. I learned something new every Tuesday.
68
To cook food more healthy. To eat better. I try to eat from each food group. I love my teachers. To cook more healthy. To use spices more. To eat more whole grains.
To eat from all food groups. I am eating more healthy now.
To feed my children good food daily. I cook more. My group was wonderful.
How to prepare meals in 30 minutes and how to eat healthy.
This class has given me wonderful eating habits and saved me a lot of money on groceries.
Process Evaluation
Fidelity to the intervention and perceived satisfaction of instructors and
participants with the intervention curriculum were evaluated through a brief, confidential
process evaluation. Intervention instructors were asked to complete the evaluation on
Survey Monkey (www.surveymonkey.com) following each teaching session. Feedback
on the recipes was very positive. Instructors rated all dessert recipes as liked or loved by
participants. The same was true for the main dish recipes, with the exception of Festive
Tuna Salad. One instructor reported the response to Festive Tuna Salad as hard to tell,
but the other four respondents rated this recipe as loved (n=3) or liked (n=1) by
participants. The majority of instructors said they would definitely use all of the recipes
again with the exception of Blueberry Parfaits, where the majority responded probably.
Feedback on the lesson plans was also very positive. The majority of responding
instructors reported that they enjoyed teaching the lessons and activities and perceived
that the participants were very engaged during the sessions. In response to the question,
“How much do you think your group liked the session?” 11 of 15 respondents replied a
lot and the remaining 4 responded loved it. There were 16 respondents to the question,
69
“How did most of the participants seem during the session? (check all that apply).”
Responses were very favorable: asked questions related to topic (8), lots of discussion
(7), very into it (4), into it (5), interested (5), asked off track questions (1), I couldn’t tell
how they seemed (0), didn’t participate (0), bored (0), not into it (0). All of the nine
respondents to the question about the activity in the lesson plan reported that it led to a
lot of discussion, seven said they really got into it and one said they liked it, but I changed
it a little. Twelve of 13 respondents reported that they loved teaching the lesson plan and
one reported that she liked it, but it needs a few changes. Of the 15 respondents to the
question, “How closely did you follow the lesson guide?” 13 said exactly and the other
two responded pretty closely and not sure. The not sure response was from the
respondent who reported that the group asked off-track questions during the first session.
Under “Comments and Suggestions for Improvement,” one respondent reported that she
enjoyed teaching the session, but was challenged in her time management due to teaching
a large group. Another stated,
These six sessions have provided an opportunity for participants to dialogue with each other and myself. I believe people learn well when they can be involved in the task at hand. Thanks for the opportunity to be a part of this pilot study.
Summary
The purpose of this chapter was to report the results of the study to examine
whether a Health Belief Model-based curriculum was more effective than the standard in
decreasing dietary risk factors for hypertension. The intervention was successful in
significantly increasing vegetable consumption over the control. Intake of fruits and milk
group foods also increased in the intervention group at follow-up, but the increases were
70
not statistically significant. Both groups decreased their sodium consumption. Positive
trends were seen in behavioral constructs, although none of the changes was statistically
significant. Scores at baseline were quite high for benefits and self-efficacy, and
perceived barriers were very low. The process evaluation indicated a high degree of
fidelity to the intervention curriculum and instructor and participant satisfaction with the
lessons and recipes. Qualitative data in the form of open-ended comments indicated that
participants in both groups felt they gained self-efficacy for planning and preparing
healthy meals as a result of participating in EFNEP.
71

CHAPTER 5
DISCUSSION, IMPLICATIONS, AND RECOMMENDATIONS
The primary focus of this study was to investigate whether a Health Belief Model-
based curriculum would result in greater consumption of a hypertension-protective diet
than the control curriculum among participants in the EFNEP. According to the
conceptual framework of the intervention, participants who received the Hypertension
Education Risk Reduction (HERR) curriculum would perceive fewer barriers, more
benefits, and greater self-efficacy for consuming a hypertension-protective diet, all of
which would lead to a greater likelihood of adopting the recommended dietary behaviors.
To answer these questions, 24-hour diet recalls and the Hypertension Education Risk
Reduction (HERR) survey were completed at baseline and following the intervention by
EFNEP participants in four counties. This chapter discusses the findings and limitations
of this study and presents suggestions for further research.
Findings of the Study
The primary research question in this study was whether the Health Belief Model-
based curriculum would be more effective than the standard curriculum in increasing
dietary intake of vegetables, fruits, and milk group foods. The data support the hypothesis
that the Health Belief Model-based curriculum would be more effective in increasing
vegetable intake. Positive changes in fruits and milk group foods were observed in the
intervention group, although not to the level of significance.
72
There are several possible explanations for the significant increase in vegetable
intake in the intervention group participants. Intervention group participants were
significantly less likely at baseline to report receiving some type of federal assistance,
which is an indicator of income. It is possible that intervention group participants had
higher incomes with which to purchase more vegetables. However, since many of the
intervention group participants were clients of a nonprofit agency that provided financial
assistance, it is unlikely that income was a factor. Intake of vegetables was actually
higher at baseline in the control group, so it is possible that the intervention group had
more room for improvement.
The intervention curriculum offers another possible explanation for the significant
increase in vegetable intake. Vegetables were emphasized in more recipes in the HERR
curriculum than any other food group. All main dish recipes demonstrated in the HERR
curriculum lessons contained at least ½ cup of vegetables per recipe serving.
Incorporating vegetables in a main dish may be key to insuring that they are included in a
meal. Efforts were made to use vegetables that required minimal preparation. Frozen and
canned vegetables were used in addition to fresh. Use of the less perishable forms of
vegetables may be appealing to individuals who do the bulk of their grocery shopping
monthly or who have limited access to grocery stores with high-quality fresh produce
(Hersey et al., 2001). Vegetables are also relatively low in cost compared to fruits. The
cost of the canned vegetables used in the intervention recipes was less than $1.00 for a
15-ounce can, but the cost of the canned fruit was slightly over $1.00 for a 15-ounce can.
The high cost of fruit may be one of the reasons why the intervention was not
effective in significantly increasing fruit consumption. Several studies have found that
73

cost is a barrier to fruit and vegetable consumption among limited resource individuals,
although this study did not provide evidence for this (Havas et al., 1998; Reicks et al.,
1994). In this study, 75% of participants reported that the cost of fruit was not a barrier.
However, the wording of the cost-related questions on the survey is a concern. The
questions were worded to reflect value, i.e., Fruit is worth the cost. Individuals with
limited resources may feel fruits are of value, but still not allocate funds to purchase these
foods. Although the average cost of fruits and vegetables was reported recently as only
21 cents per serving, prices vary greatly among stores and may be higher in small, inner-
city markets and convenience stores (Cassady et al., 2007). The study also began in
February, a time when locally grown, less expensive fruit is not in season. It should also
be noted that food prices were increasing dramatically at the time of this study.
According to USDA’s Economic Research Service, food prices rose 5.5% in 2008, the
highest annual increase since 1990
(http://www.ers.usda.gov/Briefing/CPIFoodAndExpenditures/
accessed April 15, 2009).
Milk group food consumption did not increase significantly in this study, although
a variety of dairy foods were used in the recipes. The intervention curriculum emphasized
yogurt and lactose-reduced milk, both of which are appropriate for individuals with
lactose intolerance, and shelf-stable non-fat dry milk, for those who cannot get to the
grocery store often. Recipes using plain yogurt were well-accepted by participants.
However, lack of availability of plain yogurt in small, inner city grocery stores might be a
concern. It was not a stock item carried at a small grocery store near the Cooperative
Extension office in one of the intervention counties, although the manager offered to
74
order it. Travelling several additional miles to a larger grocery store to purchase plain
yogurt may not be a viable option for EFNEP participants. The cost of milk group foods
might also be a concern. Lactose-reduced milk is significantly more expensive than
regular fluid milk, and reduced fat cheese is not always available in store brands.
Intervention group educators expressed concern that they could purchase regular cheese
at a lower price than the reduced-fat cheese specified in the recipes. Purchasing regular
cheese and using less is an option for decreasing fat, but in the intervention, the extra cost
of the reduced-fat cheese was deemed to be worthwhile because it was felt to be
important for participants to have the opportunity to taste the reduced-fat cheese.
Increasing milk group foods without significantly increasing fat intake remains a
challenge. Intake of milk group foods at follow-up was less than 33% of the
recommended amount in both intervention and control groups.
Sodium intake decreased in both the intervention and control groups, but not
significantly. The mean levels of sodium intake in both groups at follow-up exceeded the
Upper Limit for sodium of 2300 mg. The Upper Limit for sodium is even lower for Black
adults (1500 mg), so the high levels of sodium are of great concern. The intervention
introduced salt-free seasonings in several recipes. The fact that sodium is contained in
many processed foods makes it difficult for low-income individuals to decrease sodium
intake, especially if they have limited cooking and food storage facilities and have to rely
on convenience items and canned food.
The survey data do not support the hypothesis that the Health Belief Model-based
curriculum would be more effective than the control curriculum in increasing self-
efficacy for preparing healthy meals and in increasing self-efficacy for interpreting
75

nutrition labels to determine the salt content of foods. Self-efficacy scores were very high
at baseline and increased at follow-up in both groups, but the increases were not
statistically significant. An important trend was identified, however. Of the participants
who were not already confident in their ability to perform these skills, over 50% reported
increased self-efficacy at follow-up for each of the seven items. Qualitative data from exit
questionnaires completed by participants in both groups indicates that EFNEP in Georgia
is having a beneficial effect on the self-efficacy of participants for preparing quick and
healthy meals. Although this does not support the benefit of the Health Belief Model-
based curriculum over the control, it does provide evidence of the important role of
EFNEP nutrition education programs in increasing self-efficacy for preparing and
consuming a healthful diet. The skills required to prepare an inexpensive, healthful meal
might be more complicated than participants realize before they take the classes, and a
retrospective pretest might be a more informative measure for self-efficacy.
Limitations
This study has several limitations. The total number of participants in the study
exceeded the goal of 200, but still was rather low. It was approximately 10% of the total
EFNEP graduates in Georgia in 2008. Complete HERR survey data was only available
for 153 of the 219 participants. Lack of time was mentioned as a barrier to administering
the HERR survey by one of the educators in the control group. The survey was in
addition to the required EFNEP evaluation measures, and while the importance was
emphasized, the HERR survey was not required since the study was conducted as part of
the regular EFNEP.
76
Another limitation was the significant difference in the demographic make-up of
participants in the intervention group and control group. There were significantly more
males in the intervention group and the mean age was significantly higher. The control
group was also significantly more likely to report receiving some type of federal
assistance, which was used as an indicator of income. Because the majority of individuals
in the intervention group participated in EFNEP through programs at community
agencies serving the poor, it is possible that they were among the “working poor” who
are not eligible for federal programs, that they were newly poor, or that they simply
preferred not to divulge information on the programs they participated in. It would have
been helpful to have collected more specific information on income.
Another limitation was that the intervention had a relatively low dose. This may
help explain the reasons why dietary changes were not greater. Cox et al. (1996)
conducted a series of 18 lessons in their intervention, and reported a significant increase
in consumption of fruits and vegetables. Six lessons is the minimum required in EFNEP
in Georgia, so for sustainability, the intervention curriculum was limited to six lessons.
Consideration should be given to increasing the dose of the intervention in the future,
although tripling the dose, as in the Virginia EFNEP study, is probably not feasible due to
concerns about attrition and cost-effectiveness (Cox et al.).
An important component of EFNEP is the fact that the program is taught by
trained lay educators, paraprofessionals who are recruited primarily from the target
audience. While this is a strength of the program, and was the case in both intervention
and control groups, it may have introduced bias into the study by potentially influencing
the responses of participants on evaluation measures due to social desirability, thus
77

reducing the validity of the measures. Data were also self-reported and a biomarker of
fruit and vegetable intake, such as serum carotenoids, was not employed. Food choices
are very personal and participants may have been reluctant to list all foods and beverages
consumed. Literacy may also have been a problem.
Staff was provided with a protocol for conducting the evaluation in an attempt to
limit bias. However, the protocol may not have been followed at all times. There were a
number of cases where one entire page of the survey was not completed by the
participant. This would not have been expected to occur if the survey had been read to
participants as the protocol indicated.
Fidelity to the intervention curriculum was evaluated and the majority of
responses indicated that paraprofessional staff followed the lesson plans almost exactly.
However, lessons were not recorded and most were not observed. The standard
curriculum included information on reducing dietary sodium, but it was not a major
emphasis of the curriculum. It was somewhat surprising that 7% of the open-ended
comments on the participant evaluations from control counties were in regard to learning
about salt (3 of 45 comments). Informal exploration of this following the study revealed
that two of the paraprofessional educators in the control group had a great deal of
personal interest in the importance of decreasing salt intake, which may have led to a
greater emphasis on this topic in their classes.
In regard to the evaluation, another limitation was that the paraprofessional
educators who taught the curricula in the intervention and control counties also
administered the evaluations at baseline and follow-up. Although the role of the control
groups was explained, it is possible that some teaching to the test may have occurred,
78
perhaps even subconsciously, in an effort to cover material deemed important by the
researcher. Although it may be beneficial for another individual to conduct the evaluation
without the educator present, the dynamics of the EFNEP groups could be compromised
if this were to occur.
There was also concern regarding the scale of the HERR survey. Although
Townsend and Kaiser (2005) reported that limited resource clients preferred a survey
with no more than three response choices, a ceiling effect was observed in my study
when measuring the behavioral constructs of benefits and self-efficacy. It appears that a
3-point scale is insufficient for detecting measurable differences.
Further Research
This study was conducted as an evaluation of two curricula to examine whether
the Health Belief Model-based curriculum would be more effective than the standard
curriculum used in EFNEP at The University of Georgia in increasing the consumption of
hypertension-protective foods. Although the group receiving the standard intervention
was referred to as the control, the fact that both groups received nutrition education likely
influenced the lack of statistically significant differences between the two groups (with
the exception of the difference in mean intake of vegetables). Comparisons were made to
research conducted by Cox et al. (1996). However, in Cox’s study, the control group
received 13 lessons on money management that did not include specific information on
foods and nutrition. A recommendation for further research is to include a control group
receiving no nutrition education. This would require funding apart from EFNEP to hire
one or more educators to conduct lessons on a non-nutrition topic, such as financial
management or parenting. Also, because the dose of this intervention was fairly low (six
79

sessions), formative research could be conducted with educators who have taught the
intervention lessons and former participants to determine areas for revision and the need
for additional lesson topics, especially as they pertain to the Health Belief Model
constructs. The curriculum may benefit from an additional emphasis on increasing self-
efficacy for food shopping skills, such as making a grocery list, comparison shopping,
and meal planning. Hersey et al. (2001) found a significant relationship between
engaging in specific shopping practices and meal planning and nutrient availability in
Food Stamp-eligible households. A comparison of an extended curriculum, comprised of
eight to ten lessons, with the current six-lesson curriculum and a true control (no nutrition
education or a delayed intervention), would be informative.
Additional research is needed on the instrument used to measure behavioral
constructs. The 3-point Likert scale used on the HERR survey was not sensitive enough
to measure changes, as a ceiling effect was observed. Testing the instrument using the
more traditional 5-point Likert scale is recommended. A numeric scale could also be
tested as an alternative that would require less reading. The questions on the survey,
especially in regard to self-efficacy, need further study through qualitative research with
individuals or small groups. Reliability of the self-efficacy questions was low, and self-
efficacy scores were quite high at baseline and follow-up. A study comparing the use of a
retrospective pretest to a pretest-posttest measure of self-efficacy would fill a gap in the
literature on evaluation measures for nutrition interventions with limited resource clients.
The primary outcome of importance in this study was dietary intake. It was self-
reported and the outcome measure was the 24-hour diet recall. A validation measure,
using a biomarker of fruit and vegetable intake such as serum carotenoids, should be
80
considered in future research (Townsend & Kaiser, 2005). Additional studies should also
be conducted to determine if dietary changes are maintained at one, three, and six months
post-intervention. This will be challenging since EFNEP clients often move or change
telephone numbers and may be difficult to contact. However, incentive items could be
provided to participants who provide addresses or mobile telephone numbers at the last
class session, and to those who participate in additional follow-up interviews.
The overall goal of the study was to decrease hypertension risk. Efforts should be
made in future research to measure blood pressure at baseline and follow-up.
Hypertension was identified as a serious disease by 88% of the survey respondents,
which was similar to the Maywood Cardiovascular Study with a similar population,
where awareness of hypertension was reported by 81% of respondents (Freeman et al.,
1996). Although perceived as a serious disease, less than 41% of respondents agreed that
they were susceptible to hypertension. The fact that hypertension is a silent disease with
no symptoms makes it likely that some participants could have hypertension and not be
aware of it. Increasing awareness of one’s blood pressure could increase the perceived
benefits of making dietary changes to decrease the risk of hypertension. Rankins et al.
(2005) found that participants with hypertension who attended six of eight DASH diet
intervention sessions experienced significant reductions in blood pressure, which reduced
their risk of morbidity and mortality from hypertension.
Summary
This study provided evidence that a Health Belief Model-based curriculum was
more effective than the standard in decreasing dietary risk factors for hypertension. The
intervention was successful in significantly increasing vegetable consumption over the
81
control and intake of fruits and milk group foods also increased in the intervention group.
Positive trends were seen in behavioral constructs, although none of the changes was
statistically significant. Qualitative data in the form of open-ended comments indicated
that participants in both the intervention and control groups felt they gained self-efficacy
for planning and preparing healthy meals as a result of participating in EFNEP. However,
there are still many unanswered questions regarding determinants of eating behavior. In
this study, the majority of participants indicated that they enjoyed the taste of fruits and
felt they were worth the cost. At the same time, fruit consumption was less than 50% of
the recommendation of MyPyramid for a 2,000 calorie diet (USDA, 2005). Consumption
of milk group foods was even lower, at less than 25% of the MyPyramid
recommendation. Clearly, there is a need to explore why consumption of these important
foods is so low among Black adults with limited financial resources. Additional research
into the determinants of eating behavior in this population will play an important role in
helping to reduce health disparities and the burden of hypertension.
82

REFERENCES
Alderman, M. H. (1994). Non-pharmacological treatment of hypertension. Lancet,
344(8918), 307-311.
Andrieu, E., Darmon, N., & Drewnowski, A. (2006). Low-cost diets: More energy, fewer
nutrients. European Journal of Clinical Nutrition, 60(3), 434-436.
Appel, L. J., Champagne, C. M., Harsha, D. W., Cooper, L. S., Obarzanek, E., Elmer, P.
J., et al. (2003). Effects of comprehensive lifestyle modification on blood pressure
control: Main results of the PREMIER clinical trial. Journal of the American
Medical Association, 289(16), 2083-2093.
Appel, L. J., Moore, T. J., Obarzanek, E., Vollmer, W. M., Svetkey, L. P., Sacks, F. M.,
et al. (1997). A clinical trial of the effects of dietary patterns on blood pressure.
DASH collaborative research group. The New England Journal of Medicine,
336(16), 1117-1124.
Bartholomew, L. K., Parcel, G. S., Kok, G., & Gottlieb, N. H. (2001). Intervention
mapping: Designing theory and evidence-based health promotion programs.
Mountain View, California: Mayfield Publishing Company.
Bazzano, L. A., He, J., Ogden, L. G., Loria, C. M., Vupputuri, S., Myers, L., et al. (2002).
Fruit and vegetable intake and risk of cardiovascular disease in US adults: The first
National Health and Nutrition Examination Survey epidemiologic follow-up study.
The American Journal of Clinical Nutrition, 76(1), 93-99.
83
Blisard, N., Stewart, H., & Jolliffe, D. (2004). Low-income households' expenditures on
fruits and vegetables. AER833. United States Department of Agriculture, Economic
Research Service. Retrieved from
http://www.ers.usda.gov/Publications/AER833/May24,2004
Bosworth, H. B., Dudley, T., Olsen, M. K., Voils, C. I., Powers, B., Goldstein, M. K., et
al. (2006). Racial differences in blood pressure control: Potential explanatory
factors. The American Journal of Medicine, 119(1), 70.e9-70.15.
Brown, C. M., & Segal, R. (1996). Ethnic differences in temporal orientation and its
implications for hypertension management. Journal of Health and Social Behavior,
37(4), 350-361.
Brug, J., Glanz, K., & Kok, G. (1997). The relationship between self-efficacy, attitudes,
intake compared to others, consumption, and stages of change related to fruit and
vegetables. American Journal of Health Promotion: AJHP, 12(1), 25-30.
Campbell, D. T., & Stanley, J. C. (1963). Experimental and quasi-experimental designs
for research. Boston: Houghton Mufflin Company.
Campbell, M. K., Symons, M., Demark-Wahnefried, W., Polhamus, B., Bernhardt, J. M.,
McClelland, J. W., et al. (1998). Stages of change and psychosocial correlates of
fruit and vegetable consumption among rural African-American church members.
American Journal of Health Promotion, 12(3), 185-191.
Cassady, D., Jetter, K. M., & Culp, J. (2007). Is price a barrier to eating more fruits and
vegetables for low-income families? Journal of the American Dietetic Association,
107(11), 1909-1915.
84

Centers for Disease Control and Prevention. (2007). Prevalence of fruit and vegetable
consumption and physical activity by race/ethnicity--United States, 2005.
MMWR.Morbidity and Mortality Weekly Report, 56(13), 301-304.
Chobanian, A. V., Bakris, G. L., Black, H. R., Cushman, W. C., Green, L. A., Izzo, J. L.,
Jr., et al. (2003). Seventh report of the Joint National Committee on Prevention,
Detection, Evaluation, and Treatment of High Blood Pressure. Hypertension, 42(6),
1206-1252.
Clausen, A. (2008). Despite higher food prices, percent of US income spent on food
remains constant. United States Department of Agriculture, Economic Research
Service. Amber Waves, 6(4). Accessed January 25, 2009.
www.ers.usda.gov/AmberWaves/September08/Findings/PercentofIncome.htm
Cook, N. R., Cutler, J. A., Obarzanek, E., Buring, J. E., Rexrode, K. M., Kumanyika, S.
K., et al. (2007). Long term effects of dietary sodium reduction on cardiovascular
disease outcomes: Observational follow-up of the trials of hypertension prevention
(TOHP). British Medical Journal(Clinical Research Ed.), 334(7599), 885.
Cox, R. H., Gonzales-Vigilar, M. C. R. V., Novascone, M. A., & Silva-Barbeau, I.
(1996). Impact of a cancer intervention on diet-related cardiovascular disease risks
of White and African-American EFNEP clients. Journal of Nutrition Education,
28(4), 209-218.
Cox, R. H., Parker, G. G., Watson, A. C., Robinson, S. H., Simonson, C. J., Elledge, J.
C., et al. (1995). Dietary cancer risk of low-income women and change with
intervention. Journal of the American Dietetic Association, 95(9), 1031-1034.
85
Deshmukh-Taskar, P., Nicklas, T. A., Yang, S. J., & Berenson, G. S. (2007). Does food
group consumption vary by differences in socioeconomic, demographic, and
lifestyle factors in young adults? The Bogalusa Heart Study. Journal of the
American Dietetic Association, 107(2), 223-234.
Devine, C., Brunson, R., Jastran, M., & Bisogni, C. (2006). It just really clicked:
Participant-perceived outcomes of community nutrition education programs. Journal
of Nutrition Education and Behavior, 38(1), 42-49.
Devine, C. M., Farrell, T. J., & Hartman, R. (2005). Sisters in health: Experiential
program emphasizing social interaction increases fruit and vegetable intake among
low-income adults. Journal of Nutrition Education and Behavior, 37(5), 265-270.
Dietary Guidelines Advisory Committee. (2005). Report of the Dietary Guidelines
Advisory Committee on the Dietary Guidelines for Americans, 2005. Beltsville, MD:
Agricultural Research Service, United States Department of Agriculture.
Djousse, L., Pankow, J. S., Hunt, S. C., Heiss, G., Province, M. A., Kabagambe, E. K., et
al. (2006). Influence of saturated fat and linolenic acid on the association between
intake of dairy products and blood pressure. Hypertension, 48(2), 335-341.
Douglas, J. G., Ferdinand, K. C., Bakris, G. L., & Sowers, J. R. (2002). Barriers to blood
pressure control in African Americans. Overcoming obstacles is challenging, but
target goals can be attained. Postgraduate Medicine, 112(4), 51-2, 55, 59-62 passim.
Drewnowski, A., & Darmon, N. (2005). The economics of obesity: Dietary energy
density and energy cost. The American Journal of Clinical Nutrition, 82(1 Suppl),
265S-273S.
86
Eikenberry, N., & Smith, C. (2004). Healthful eating: Perceptions, motivations, barriers,
and promoters in low-income Minnesota communities. Journal of the American
Dietetic Association, 104(7), 1158-1161.
Elmer, P. J., Obarzanek, E., Vollmer, W. M., Simons-Morton, D., Stevens, V. J., Young,
D. R., et al. (2006). Effects of comprehensive lifestyle modification on diet, weight,
physical fitness, and blood pressure control: 18-month results of a randomized trial.
Annals of Internal Medicine, 144(7), 485-495.
Elwood, P. C., Pickering, J. E., Fehily, A. M., Hughes, J., & Ness, A. R. (2004). Milk
drinking, ischaemic heart disease and ischaemic stroke I. Evidence from the
Caerphilly cohort. European Journal of Clinical Nutrition, 58(5), 711-717.
Fiscella, K., & Holt, K. (2008). Racial disparity in hypertension control: Tallying the
death toll. Annals of Family Medicine, 6(6), 497-502.
Freeman, V., Rotimi, C., & Cooper, R. (1996). Hypertension prevalence, awareness,
treatment, and control among African Americans in the 1990s: Estimates from the
Maywood cardiovascular survey. American Journal of Preventive Medicine, 12(3),
177-185.
Fulgoni, V.,3rd, Nicholls, J., Reed, A., Buckley, R., Kafer, K., Huth, P., et al. (2007).
Dairy consumption and related nutrient intake in African-American adults and
children in the United States: Continuing survey of food intakes by individuals 1994-
1996, 1998, and the National Health and Nutrition Examination Survey 1999-2000.
Journal of the American Dietetic Association, 107(2), 256-264.
87
Funk, K. L., Elmer, P. J., Stevens, V. J., Harsha, D. W., Craddick, S. R., Lin, P. H., et al.
(2006). PREMIER--A trial of lifestyle interventions for blood pressure control:
Intervention design and rationale. Health Promotion Practice, 7(X), 1-10.
Gillman, M. W., Cupples, L. A., Gagnon, D., Posner, B. M., Ellison, R. C., Castelli, W.
P., et al. (1995). Protective effect of fruits and vegetables on development of stroke
in men. Journal of the American Medical Association, 273(14), 1113-1117.
Glanz, K., Basil, M., Maibach, E., Goldberg, J., & Snyder, D. (1998). Why Americans
eat what they do: Taste, nutrition, cost, convenience, and weight control concerns as
influences on food consumption. Journal of the American Dietetic Association,
98(10), 1118-1126.
Green, L. W., & Kreuter, M. W. (1991). Health promotion planning: An educational and
environmental approach. Mountain View: Mayfield Publishing Company.
Guenther, P. M., Jensen, H. H., Batres-Marquez, S. P., & Chen, C. F. (2005).
Sociodemographic, knowledge, and attitudinal factors related to meat consumption
in the United States. Journal of the American Dietetic Association, 105(8), 1266-
1274.
Hajjar, I., & Kotchen, T. A. (2003). Trends in prevalence, awareness, treatment, and
control of hypertension in the United States, 1988-2000. Journal of the American
Medical Association, 290(2), 199-206.
Hankin, J. H., & Wilkens, L. R. (1994). Development and validation of dietary
assessment methods for culturally diverse populations. American Journal of Clinical
Nutrition, 59 (suppl), 198S-200S.
88

Hanula, G. M. (2006). Report of the Expanded Food and Nutrition Education Program
(EFNEP) in Georgia. Athens, Georgia: University of Georgia Cooperative
Extension.
Havas, S., Treiman, K., Langenberg, P., Ballesteros, M., Anliker, J., Damron, D., et al.
(1998). Factors associated with fruit and vegetable consumption among women
participating in WIC. Journal of the American Dietetic Association, 98(10), 1141-
1148.
Hersey, J., Anliker, J., Miller, C., Mullis, R. M., Daugherty, S., Das, S., et al. (2001).
Food shopping practices are associated with dietary quality in low-income
households. Journal of Nutrition Education, 33(Supplement 1), S16-S26.
Hsia, J., Margolis, K. L., Eaton, C. B., Wenger, N. K., Allison, M., Wu, L., et al. (2007).
Prehypertension and cardiovascular disease risk in the women's health initiative.
Circulation, 115(7), 855-860.
Hulshof, K. F., Brussaard, J. H., Kruizinga, A. G., Telman, J., & Lowik, M. R. (2003).
Socio-economic status, dietary intake and 10 year trends: The Dutch National Food
Consumption survey. European Journal of Clinical Nutrition, 57(1), 128-137.
Janz, N. K., & Becker, M. H. (1984). The health belief model: A decade later. Health
Education Quarterly, 11(1), 1-47.
John, J. H., Ziebland, S., Yudkin, P., Roe, L. S., Neil, H. A., & Oxford Fruit and
Vegetable Study Group. (2002). Effects of fruit and vegetable consumption on
plasma antioxidant concentrations and blood pressure: A randomised controlled trial.
Lancet, 359(9322), 1969-1974.
89
Johnsen, S. P., Overvad, K., Stripp, C., Tjonneland, A., Husted, S. E., & Sorensen, H. T.
(2003). Intake of fruit and vegetables and the risk of ischemic stroke in a cohort of
Danish men and women. The American Journal of Clinical Nutrition, 78(1), 57-64.
Joshipura, K. J., Ascherio, A., Manson, J. E., Stampfer, M. J., Rimm, E. B., Speizer, F.
E., et al. (1999). Fruit and vegetable intake in relation to risk of ischemic stroke.
Journal of the American Medical Association, 282(13), 1233-1239.
Kotchen, J. M., Shakoor-Abdullah, B., Walker, W. E., Chelius, T. H., Hoffmann, R. G.,
& Kotchen, T. A. (1998). Hypertension control and access to medical care in the
inner city. American Journal of Public Health, 88(11), 1696-1699.
Laforge, R. G., Greene, G. W., & Prochaska, J. O. (1994). Psychosocial factors
influencing low fruit and vegetable consumption. Journal of Behavioral Medicine,
17(4), 361-374.
Ledikwe, J. H., Blanck, H. M., Khan, L. K., Serdula, M. K., Seymour, J. D., Tohill, B. C.,
et al. (2006). Low-energy-density diets are associated with high diet quality in adults
in the United States. Journal of the American Dietetic Association, 106(8), 1172-
1180.
Lin, P. H., Appel, L. J., Funk, K., Craddick, S., Chen, C., Elmer, P., et al. (2007). The
PREMIER intervention helps participants follow the Dietary Approaches to Stop
Hypertension dietary pattern and the current dietary reference intakes
recommendations. Journal of the American Dietetic Association, 107(9), 1541-1551.
Luepker, R. V., Murray, D. M., Jacobs, D. R. Jr., Mittelmark, M. B., Bracht, N., Carlaw,
R., et al. (1994). Community education for cardiovascular disease prevention: Risk
90
factor changes in the Minnesota Heart Health program. American Journal of Public
Health, 84(9), 1383-1393.
Lutz, S., & Blaylock, J. R. (1993). Household characteristics affect food choices. Food
Review, 16(2), 12-19.
Lytle, L. A., Varnell, S., Murray, D. M., Story, M., Perry, C., Birnbaum, A. S., et al.
(2003). Predicting adolescents' intake of fruits and vegetables. Journal of Nutrition
Education and Behavior, 35(4), 170-175.
Miller, I. E., Burgess, W. D., & Mason, A. C. (1999). Fast and flexible low cost recipes
for a family or fifty: A cookbook for emergency feeding programs and limited-
resource audiences. Journal of Nutrition Education, 31(1), 60B.
Minino, A. M., Heron, M. P., Murphy, S. L., Kochanek, K. D., & Centers for Disease
Control and Prevention National Center for Health Statistics National Vital Statistics
System. (2007). Deaths: Final data for 2004. National Vital Statistics Reports: From
the Centers for Disease Control and Prevention, National Center for Health
Statistics, National Vital Statistics System, 55(19), 1-119.
Moore, T. J., Conlin, P. R., Ard, J., & Svetkey, L. P. (2001). DASH (Dietary Approaches
to Stop Hypertension) diet is effective treatment for stage 1 isolated systolic
hypertension. Hypertension, 38(2), 155-158.
Morgan, T., Myers, J., & Teow, B. H. (1984). The role of sodium and potassium in the
control of blood pressure. Australian and New Zealand Journal of Medicine, 14(4),
458-462.
91
Morris, R. C. Jr., Sebastian, A., Forman, A., Tanaka, M., & Schmidlin, O. (1999).
Normotensive salt sensitivity: Effects of race and dietary potassium. Hypertension,
33(1), 18-23.
National Center for Health Statistics. (2009). Health, United States, 2008 with
Chartbook. Hyattsville, MD.
Neily, J. B., Toto, K. H., Gardner, E. B., Rame, J. E., Yancy, C. W., Sheffield, M. A., et
al. (2002). Potential contributing factors to noncompliance with dietary sodium
restriction in patients with heart failure. American Heart Journal, 143(1), 29-33.
Ness, A. R., Smith, G. D., & Hart, C. (2001). Milk, coronary heart disease and mortality.
Journal of Epidemiology and Community Health, 55(6), 379-382.
Neumark-Sztainer, D., Story, M., Perry, C., & Casey, M. A. (1999). Factors influencing
food choices of adolescents: Findings from focus-group discussions with
adolescents. Journal of the American Dietetic Association, 99(8), 929-937.
Newby, P. K., Weismayer, C., Akesson, A., Tucker, K. L., & Wolk, A. (2006).
Longitudinal changes in food patterns predict changes in weight and body mass
index and the effects are greatest in obese women. The Journal of Nutrition, 136(10),
2580-2587.
Nicklas, T. A., Johnson, C. C., Myers, L., Farris, R. P., & Cunningham, A. (1998).
Outcomes of a high school program to increase fruit and vegetable consumption:
Gimme 5--a fresh nutrition concept for students. The Journal of School Health,
68(6), 248-253.
92
Nord, M., Andrews, M., & Carlson, S. (2006). Household food security in the United
States, 2005. Washington, DC: United States Department of Agriculture, Economic
Research Service.
Norris, J. A. (2003). From telling to teaching: Dialog based learning: A dialogue
approach to adult learning. North Myrtle Beach: Learning by Dialogue.
Patterson, B. H., Block, G., Rosenberger, W. F., Pee, D., & Kahle, L. L. (1990). Fruit and
vegetables in the American diet: Data from the NHANES II survey. American
Journal of Public Health, 80(12), 1443-1449.
Pintrich, P. R., & Schunk, D. H. (1996). Motivation in education: Theory, research, and
applications. Englewood Cliffs, New Jersey: Prentice Hall.
Rankins, J., Sampson, W., Brown, B., & Jenkins-Salley, T. (2005). Dietary approaches to
stop hypertension (DASH) intervention reduces blood pressure among hypertensive
African American patients in a neighborhood health care center. Journal of Nutrition
Education and Behavior, 37(5), 259-264.
Reed, D. B., & Schuster, E. (2002). Recipe checklist: A tool to aid development of
recipes for audiences with limited resources. Journal of Extension, 40(6) Retrieved
from http://www.joe.org/joe/2002december/tt4.shtml
Reicks, M., Randall, J. L., & Haynes, B. J. (1994). Factors affecting consumption of
fruits and vegetables by low-income families. Journal of the American Dietetic
Association, 94(11), 1309-1311.
Rissanen, T. H., Voutilainen, S., Virtanen, J. K., Venho, B., Vanharanta, M., Mursu, J., et
al. (2003). Low intake of fruits, berries and vegetables is associated with excess
93
mortality in men: The Kuopio Ischaemic Heart Disease risk factor (KIHD) study.
Journal of Nutrition, 133(1), 199-204.
Robinson, S. F., Wong, W., Rodgers, A. S. W., Bielamowicz, M. K., & Konzlemann, K.
(2005). Selecting recipes to enhance educational programming--application of
formative research methods. Journal of Extension, 43(4) Retrieved from
http:www.joe.org/joe/2005august/tt3p.shtml
Robinson, S. M., Crozier, S. R., Borland, S. E., Hammond, J., Barker, D. J., & Inskip, H.
M. (2004). Impact of educational attainment on the quality of young women's diets.
European Journal of Clinical Nutrition, 58(8), 1174-1180.
Roncolato, W. G., & Huon, G. F. (1998). Subjective well-being and dieting. British
Journal of Health Psychology, 3, 375-386.
Ruud, J., Betts, N. M., & Dirkx, J. (1993). Developing written nutrition information for
adults with low literacy skills. Journal of Nutrition Education, 25, 11-16.
Sacks, F. M., Svetkey, L. P., Vollmer, W. M., Appel, L. J., Bray, G. A., Harsha, D., et al.
(2001). Effects on blood pressure of reduced dietary sodium and the dietary
approaches to stop hypertension (DASH) diet. DASH-sodium collaborative research
group. New England Journal of Medicine, 344(1), 3-10.
Sauvaget, C., Nagano, J., Allen, N., & Kodama, K. (2003). Vegetable and fruit intake and
stroke mortality in the Hiroshima/Nagasaki life span study. Stroke, 34(10), 2355-
2360.
Schwarzer, R., & Fuchs, R. (1995). Self-efficacy and health behaviours. In M. Conner, &
P. Norman (Eds.), Predicting health behaviour: Research and practice with social
cognition models. Buckingham: Open University Press.
94

Stamler, J., Prineas, R. J., Neaton, J. D., Grimm, R. H., McDonald, R. H., Schnaper, H.
W., et al. (1987). Background and design of the new U.S. trial on diet and drug
treatment of "mild" hypertension (TOMHS). The American Journal of Cardiology,
59(14), 51G-60G.
Stamler, R., Stamler, J., Gosch, F. C., Civinelli, J., Fishman, J., McKeever, P., et al.
(1989). Primary prevention of hypertension by nutritional-hygienic means. Final
report of a randomized, controlled trial. Journal of the American Medical
Association, 262(13), 1801-1807.
Steffen, L. M., Jacobs, D. R. Jr., Stevens, J., Shahar, E., Carithers, T., & Folsom, A. R.
(2003). Associations of whole-grain, refined-grain, and fruit and vegetable
consumption with risks of all-cause mortality and incident coronary artery disease
and ischemic stroke: The atherosclerosis risk in communities (ARIC) study. The
American Journal of Clinical Nutrition, 78(3), 383-390.
Strecher, V. J., DeVellis, B. M., Becker, M. H., & Rosenstock, I. M. (1986). The role of
self-efficacy in achieving health behavior change. Health Education Quarterly,
13(1), 73-92.
Subar, A. F., Heimendinger, J., Patterson, B. H., Krebs-Smith, S. M., Pivonka, E., &
Kessler, R. (1995). Fruit and vegetable intake in the United States: The baseline
survey of the five a day for better health program. American Journal of Health
Promotion, 9(5), 352-360.
Svetkey, L. P., Erlinger, T. P., Vollmer, W. M., Feldstein, A., Cooper, L. S., Appel, L. J.,
et al. (2005). Effect of lifestyle modifications on blood pressure by race, sex,
hypertension status, and age. Journal of Human Hypertension, 19(1), 21-31.
95
Svetkey, L. P., Sacks, F. M., Obarzanek, E., Vollmer, W. M., Appel, L. J., Lin, P. H., et
al. (1999). The DASH diet, sodium intake and blood pressure trial (DASH-sodium):
Rationale and design. DASH-sodium collaborative research group. Journal of the
American Dietetic Association, 99(8 Suppl), S96-104.
Townsend, M. S., & Kaiser, L. L. (2005). Development of a tool to assess psychosocial
indicators of fruit and vegetable intake for 2 federal programs. Journal of Nutrition
Education and Behavior, 37(4), 170-184.
Treiman, K., Freimuth, V., Damron, D., Lasswell, A., Anliker, J., Havas, S., et al. (1996).
Attitudes and behaviors related to fruits and vegetables among low-income women
in the WIC program. Journal of Nutrition Education, 28(3), 149-156.
United States Department of Agriculture. (2006). Expanded Food and Nutrition
Education Program (EFNEP). Retrieved 04/17, 2007, from
http://www.csrees.usda.gov/nea/food/efnep/efnep.html
United States Department of Agriculture. (2005). MyPyramid.gov. Retrieved September
14, 2007 from www.mypyramid.gov
United States Department of Health and Human Services, & United States Department of
Agriculture. (2005). Dietary Guidelines for Americans, 2005 (6th ed.). Washington,
D.C.: U.S. Dept. of Health and Human Services, U.S. Dept. of Agriculture.
Vasan, R. S., Beiser, A., Seshadri, S., Larson, M. G., Kannel, W. B., D'Agostino, R. B.,
et al. (2002). Residual lifetime risk for developing hypertension in middle-aged
women and men: The Framingham Heart Study. Journal of the American Medical
Association, 287(8), 1003-1010.
96
Wang, Y., & Wang, Q. J. (2004). The prevalence of prehypertension and hypertension
among US adults according to the new joint national committee guidelines: New
challenges of the old problem. Archives of Internal Medicine, 164(19), 2126-2134.
Wansink, B., & Kim, J. (2005). Bad popcorn in big buckets: Portion size can influence
intake as much as taste. Journal of Nutrition Education and Behavior, 37(5), 242-
245.
Wansink, B. (2006). Mindless eating: Why we eat more than we think. New York:
Bantam Books.
Whelton, P. K. (1994). Epidemiology of hypertension. Lancet, 344(8915), 101-106.
Whelton, P. K., Beevers, D. G., & Sonkodi, S. (2004). Strategies for improvement of
awareness, treatment and control of hypertension: Results of a panel discussion.
Journal of Human Hypertension, 18(8), 563-565.
Wilson, R. P., Freeman, A., Kazda, M. J., Andrews, T. C., Berry, L., Vaeth, P. A., et al.
(2002). Lay beliefs about high blood pressure in a low- to middle-income urban
African-American community: An opportunity for improving hypertension control.
The American Journal of Medicine, 112(1), 26-30.
Zablah, E. M., Reed, D. B., Hegsted, M., & Keenan, M. J. (1999). Barriers to calcium
intake in African-American women. Journal of Human Nutrition and Dietetics, 12,
123-132.
97
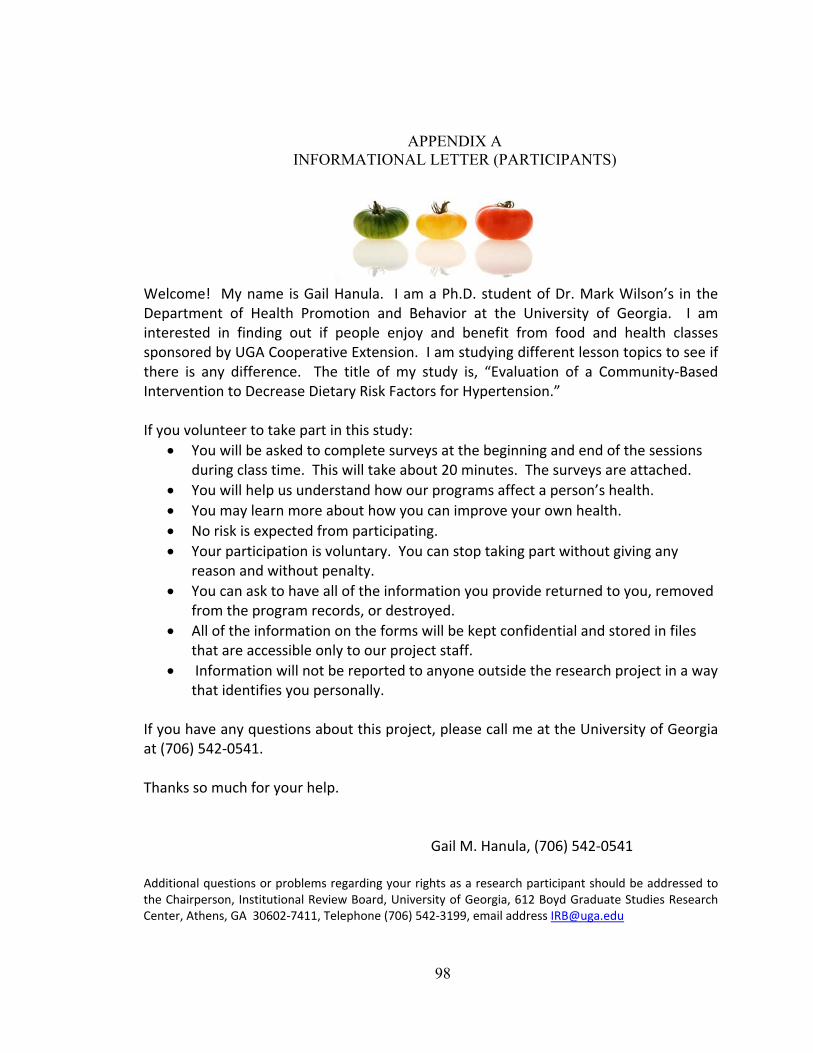
APPENDIX A INFORMATIONAL LETTER (PARTICIPANTS)
Welcome! My name is Gail Hanula. I am a Ph.D. student of Dr. Mark Wilson’s in the Department of Health Promotion and Behavior at the University of Georgia. I am interested in finding out if people enjoy and benefit from food and health classes sponsored by UGA Cooperative Extension. I am studying different lesson topics to see if there is any difference. The title of my study is, “Evaluation of a Community‐Based Intervention to Decrease Dietary Risk Factors for Hypertension.” If you volunteer to take part in this study:
• You will be asked to complete surveys at the beginning and end of the sessions during class time. This will take about 20 minutes. The surveys are attached.
• You will help us understand how our programs affect a person’s health. • You may learn more about how you can improve your own health. • No risk is expected from participating. • Your participation is voluntary. You can stop taking part without giving any
reason and without penalty. • You can ask to have all of the information you provide returned to you, removed
from the program records, or destroyed. • All of the information on the forms will be kept confidential and stored in files
that are accessible only to our project staff. • Information will not be reported to anyone outside the research project in a way
that identifies you personally. If you have any questions about this project, please call me at the University of Georgia at (706) 542‐0541. Thanks so much for your help.
Gail M. Hanula, (706) 542‐0541 Additional questions or problems regarding your rights as a research participant should be addressed to the Chairperson, Institutional Review Board, University of Georgia, 612 Boyd Graduate Studies Research Center, Athens, GA 30602‐7411, Telephone (706) 542‐3199, email address [email protected]
98
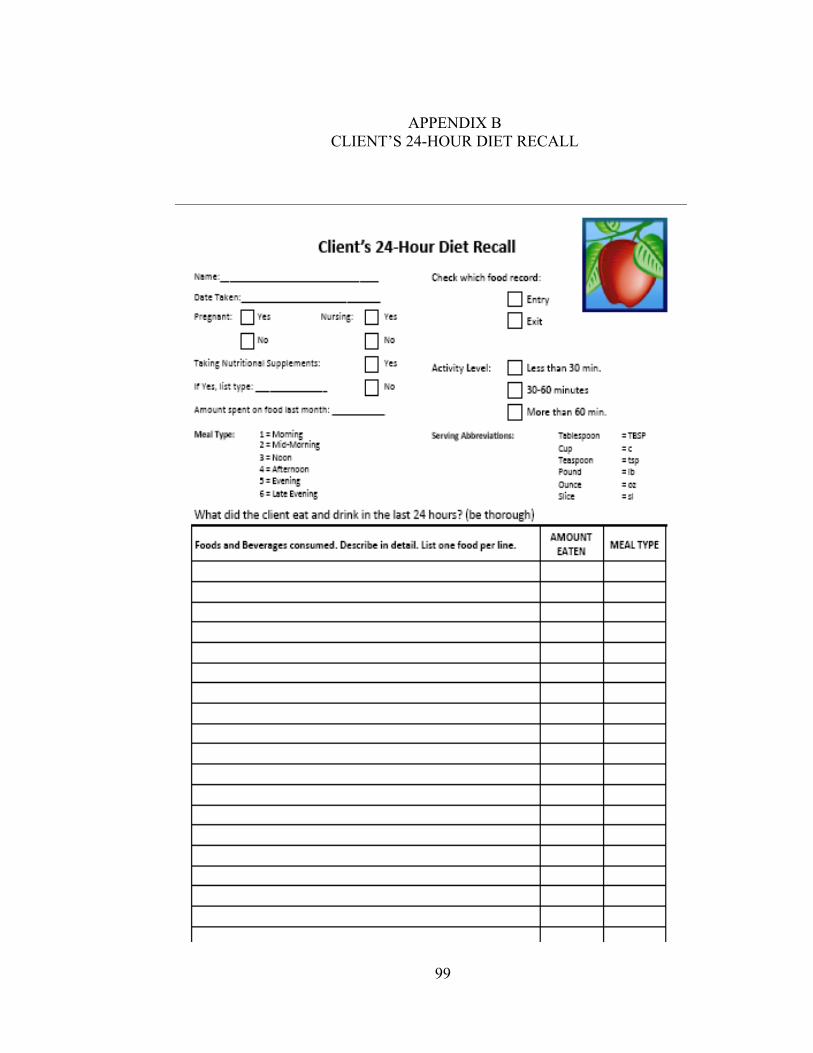
APPENDIX B
CLIENT’S 24-HOUR DIET RECALL
99
APPENDIX C HERR SURVEY
Welcome! My name is Gail Hanula. I am a Ph.D. student of Dr. Mark Wilson’s in the Department of Health Promotion and Behavior at the University of Georgia. I am interested in finding out if people enjoy and benefit from food and health classes sponsored by UGA Cooperative Extension. I am studying different lesson topics to see if there is any difference. The title of my study is, “Evaluation of a Community‐Based Intervention to Decrease Dietary Risk Factors for Hypertension.” If you volunteer to take part in this study:
• You will be asked to complete surveys at the beginning and end of the sessions during class time. This will take about 20 minutes. The surveys are attached.
• You will help us understand how our programs affect a person’s health. • You may learn more about how you can improve your own health. • No risk is expected from participating. • Your participation is voluntary. You can stop taking part without giving any reason and without
penalty. • You can ask to have all of the information you provide returned to you, removed from the program
records, or destroyed. • All of the information on the forms will be kept confidential and stored in files that are accessible only
to our project staff. • Information will not be reported to anyone outside the research project in a way that identifies you
personally. If you have any questions about this project, please call me at the University of Georgia at (706) 542‐0541. Thanks so much for your help.
Gail M. Hanula, (706) 542‐0541 Additional questions or problems regarding your rights as a research participant should be addressed to the Chairperson, Institutional Review Board, University of Georgia, 612 Boyd Graduate Studies Research Center, Athens, GA 30602‐7411, Telephone (706) 542‐3199, email address [email protected]
100
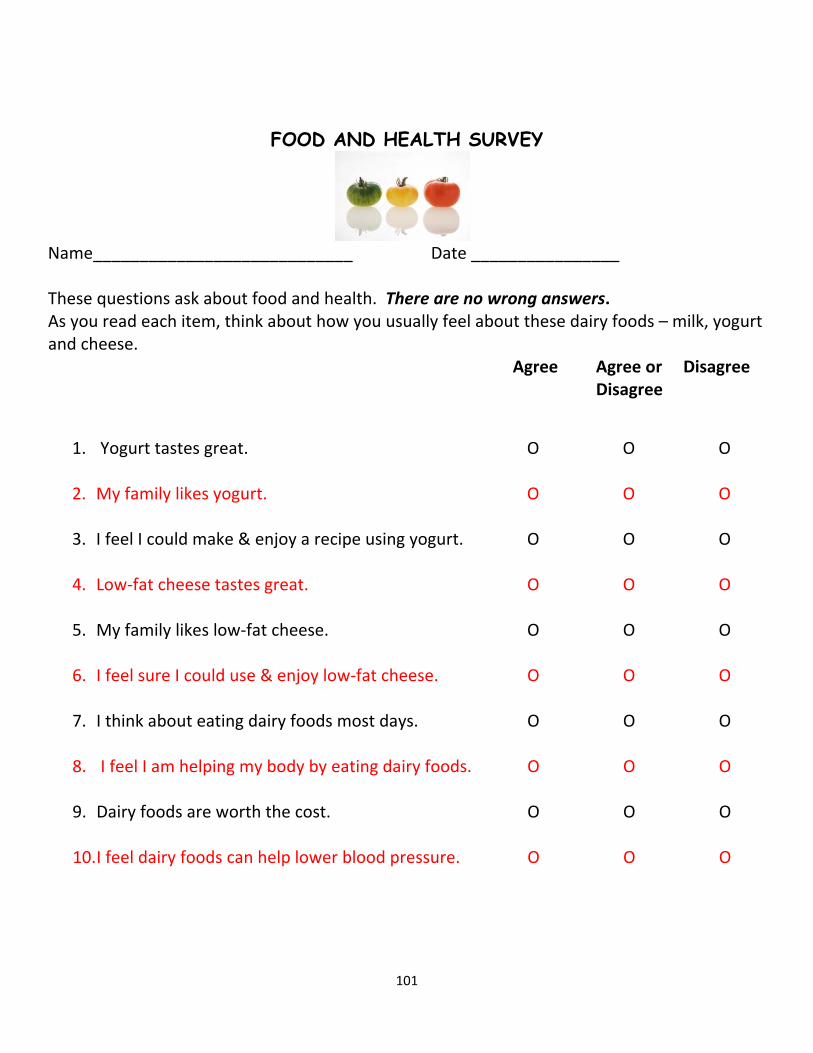
FOOD AND HEALTH SURVEY
Name____________________________ Date ________________ These questions ask about food and health. There are no wrong answers. As you read each item, think about how you usually feel about these dairy foods – milk, yogurt and cheese.
Agree Agree or Disagree Disagree
1. Yogurt tastes great. O O O
2. My family likes yogurt. O O O
3. I feel I could make & enjoy a recipe using yogurt. O O O
4. Low‐fat cheese tastes great. O O O
5. My family likes low‐fat cheese. O O O
6. I feel sure I could use & enjoy low‐fat cheese. O O O
7. I think about eating dairy foods most days. O O O
8. I feel I am helping my body by eating dairy foods. O O O
9. Dairy foods are worth the cost. O O O
10. I feel dairy foods can help lower blood pressure. O O O
101
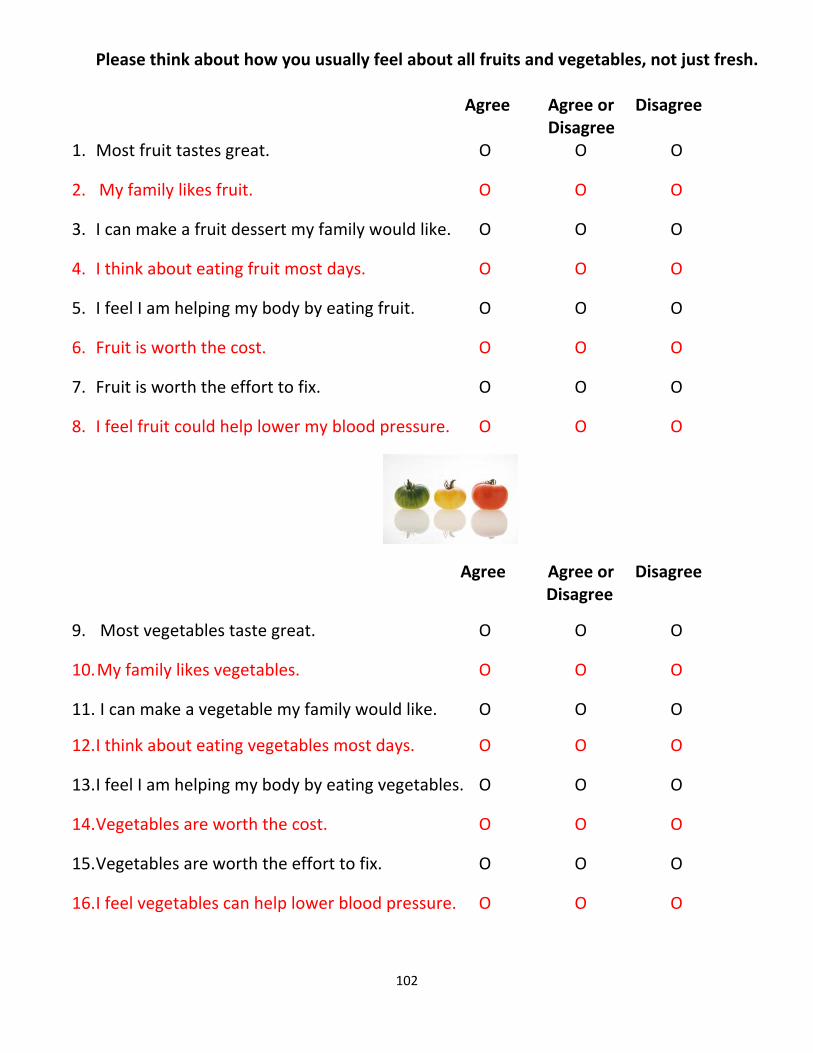
Please think about how you usually feel about all fruits and vegetables, not just fresh.
Agree Agree or Disagree Disagree
1. Most fruit tastes great. O O O
2. My family likes fruit. O O O
3. I can make a fruit dessert my family would like. O O O
4. I think about eating fruit most days. O O O
5. I feel I am helping my body by eating fruit. O O O
6. Fruit is worth the cost. O O O
7. Fruit is worth the effort to fix. O O O
8. I feel fruit could help lower my blood pressure. O O O
Agree Agree or Disagree Disagree
9. Most vegetables taste great. O O O
10. My family likes vegetables. O O O
11. I can make a vegetable my family would like. O O O
12. I think about eating vegetables most days. O O O
13. I feel I am helping my body by eating vegetables. O O O
14. Vegetables are worth the cost. O O O
15. Vegetables are worth the effort to fix. O O O
16. I feel vegetables can help lower blood pressure. O O O
102
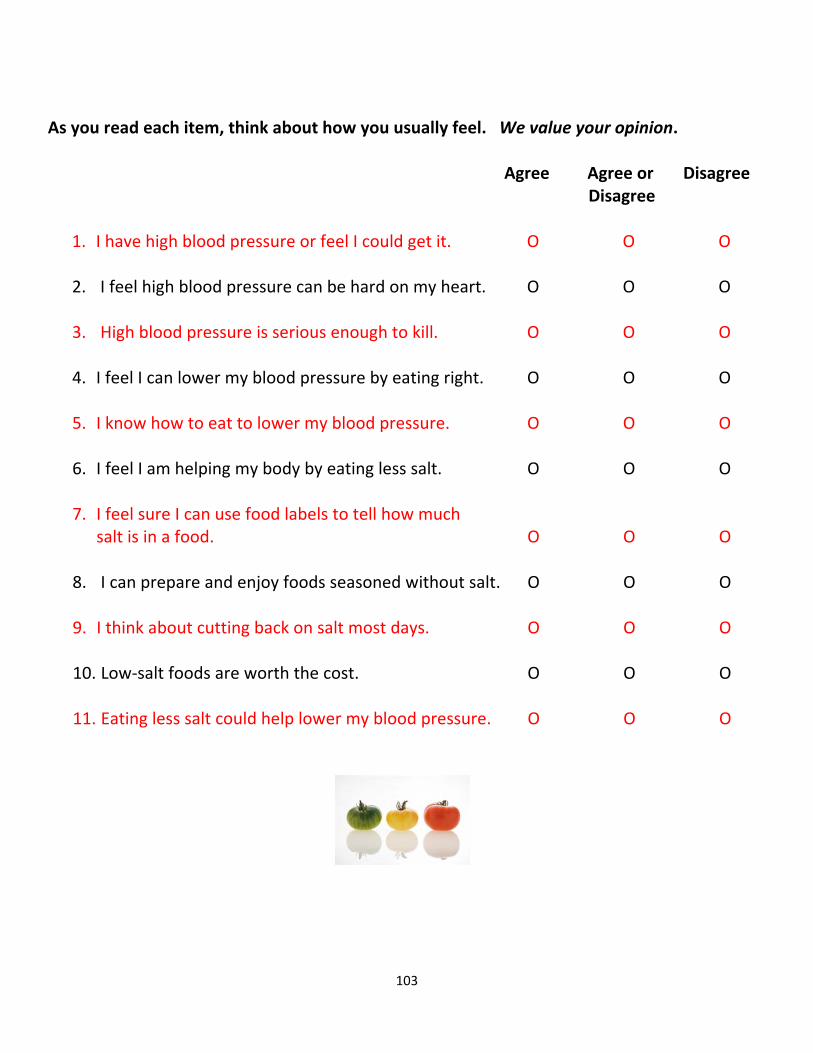
As you read each item, think about how you usually feel. We value your opinion.
Agree Agree or Disagree Disagree
1. I have high blood pressure or feel I could get it. O O O
2. I feel high blood pressure can be hard on my heart. O O O
3. High blood pressure is serious enough to kill. O O O
4. I feel I can lower my blood pressure by eating right. O O O
5. I know how to eat to lower my blood pressure. O O O
6. I feel I am helping my body by eating less salt. O O O
7. I feel sure I can use food labels to tell how much salt is in a food. O O O
8. I can prepare and enjoy foods seasoned without salt. O O O
9. I think about cutting back on salt most days. O O O
10. Low‐salt foods are worth the cost. O O O
11. Eating less salt could help lower my blood pressure. O O O
103

I am Shared Someone decision else
1. In your house, who is in charge of what foods to buy? O O O
2. In your house, who is in
charge of how to prepare the food? O O O
3. How would you describe your diet? Excellent Very good Good Fair Poor O O O O O
These questions ask about how often you eat certain foods – never, sometimes, often or almost always. There are no right or wrong answers. Almost Never Sometimes Often Always
4. Eat fruit O O O O 5. Eat more than one kind of fruit a day O O O O
6. Eat vegetables O O O O
7. Eat more than one kind
of vegetable a day O O O O
8. Eat yogurt O O O O
9. Drink 1% milk or use it in foods O O O O
10. Eat ham or sausage O O O O
104

APPENDIX D HERR SURVEY INSTRUCTOR’S GUIDE
FOOD AND HEALTH SURVEY
Instructor’s Guide
Please use this instruction guide when giving the Food and Health Survey to clients before the first lesson is taught and then again after the last lesson. Possible questions from clients with suggested responses follow many of the questions. Please contact me at [email protected] or (706) 340-6022 if you have any questions or concerns. Cover sheet
• This “information letter” is required for surveys by the University’s Board of Human Subjects.
• Note to instructors: The cover sheet is only needed for surveys given at the first lesson. There is no need for clients to complete a survey at the last session if they didn’t already complete a survey at the first lesson, but they may if they want to and you may give them an educational extender.
• Explanation: o We are evaluating our education programs and I’ve been asked to
distribute this survey so we can see what people are interested in learning about food and health.
o The only extra thing we are asking is that you fill out a Food and Health Survey today, during our session, and again at the last session.
o I will read the questions out loud and all you have to do is fill in the circle that describes how you feel. It will take about 5-10 minutes.
o We have a small token of our appreciation for you at the last session to thank you for participating.
o If you have any questions about this project, please call Gail Hanula and her telephone number is listed on the first page, which you may tear off and keep.
105
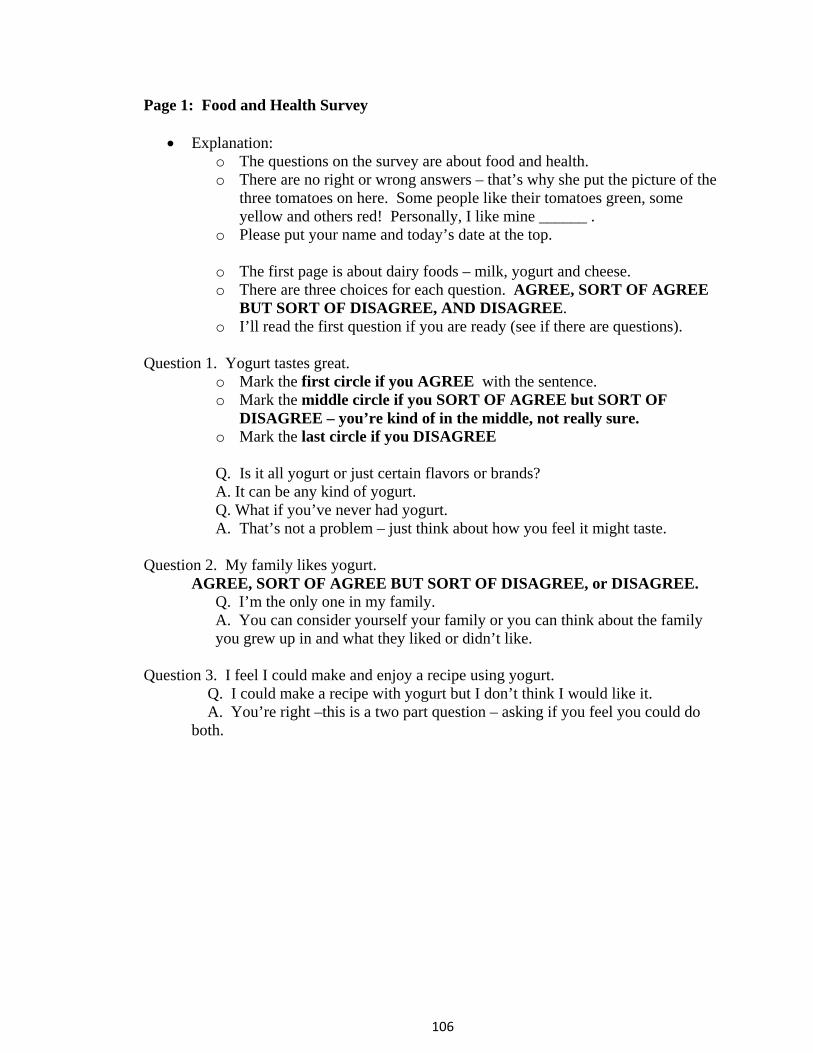
Page 1: Food and Health Survey
• Explanation: o The questions on the survey are about food and health. o There are no right or wrong answers – that’s why she put the picture of the
three tomatoes on here. Some people like their tomatoes green, some yellow and others red! Personally, I like mine ______ .
o Please put your name and today’s date at the top.
o The first page is about dairy foods – milk, yogurt and cheese. o There are three choices for each question. AGREE, SORT OF AGREE
BUT SORT OF DISAGREE, AND DISAGREE. o I’ll read the first question if you are ready (see if there are questions).
Question 1. Yogurt tastes great.
o Mark the first circle if you AGREE with the sentence. o Mark the middle circle if you SORT OF AGREE but SORT OF
DISAGREE – you’re kind of in the middle, not really sure. o Mark the last circle if you DISAGREE
Q. Is it all yogurt or just certain flavors or brands? A. It can be any kind of yogurt. Q. What if you’ve never had yogurt. A. That’s not a problem – just think about how you feel it might taste.
Question 2. My family likes yogurt.
AGREE, SORT OF AGREE BUT SORT OF DISAGREE, or DISAGREE. Q. I’m the only one in my family. A. You can consider yourself your family or you can think about the family you grew up in and what they liked or didn’t like.
Question 3. I feel I could make and enjoy a recipe using yogurt.
Q. I could make a recipe with yogurt but I don’t think I would like it. A. You’re right –this is a two part question – asking if you feel you could do both.
106

Page 1: Food and Health Survey, Continued Question 4. Low-fat cheese tastes great. Q. What kind of cheese do you consider low-fat?
A. Some low-fat cheeses are part-skim mozzarella, cheese that says it’s made from 2% milk, reduced fat cheese, fat-free cheese would also count.
Question 5. My family likes low-fat cheese. Question 6. I feel sure I could use and enjoy low-fat cheese. Question 7. I think about eating dairy foods most days. Q. I don’t think about eating them, but I think about drinking milk. A. Good point - this includes thinking about drinking milk. Question 8. I feel I am helping my body by eating dairy foods. Q. Does this include all dairy foods? A. It includes milk, yogurt and cheese. Q. Aren’t dairy foods high in fat?
A. Some dairy foods, like whole milk and regular cheese, are higher in fat than others. There are a variety of dairy foods to choose from , though, and many are low in fat.
Question 9. Dairy foods are worth the cost. Q. What do you mean, worth the cost?
A. Food prices are going up – but are they of value to you? Or do you think, they are too high, I’m not buying them for that price?
Question 10. I feel dairy foods can help lower blood pressure. Q. Is this for everyone or just for people with high blood pressure?
A. It’s for everyone.
107

Page 2: Food and Health Survey Explanation:
• Page 2 is on the back of Page 1. • The first section is about Fruit. • When you are thinking about fruit, think about all kinds of fruit – fresh, frozen,
canned and dried. Question 1. Most fruit tastes great.
o Mark the first circle if you AGREE with the sentence. o Mark the middle circle if you SORT OF AGREE but SORT OF
DISAGREE – you’re kind of in the middle, not really sure. o Mark the last circle if you DISAGREE
Question 2. My family likes fruit. Question 3. I can make a fruit dessert my family would like. Q. Do you consider pies fruit desserts? A. You could if you make them with fruit. Question 4. I think about eating fruit most days.
Q. Does this include drinking juice? A. You could include fruit juice.
Question 5. I feel I am helping my body by eating fruit. Question 6. Fruit is worth the cost. Question 7. Fruit is worth the effort to fix. Question 8. I feel fruit could help lower my blood pressure.
108
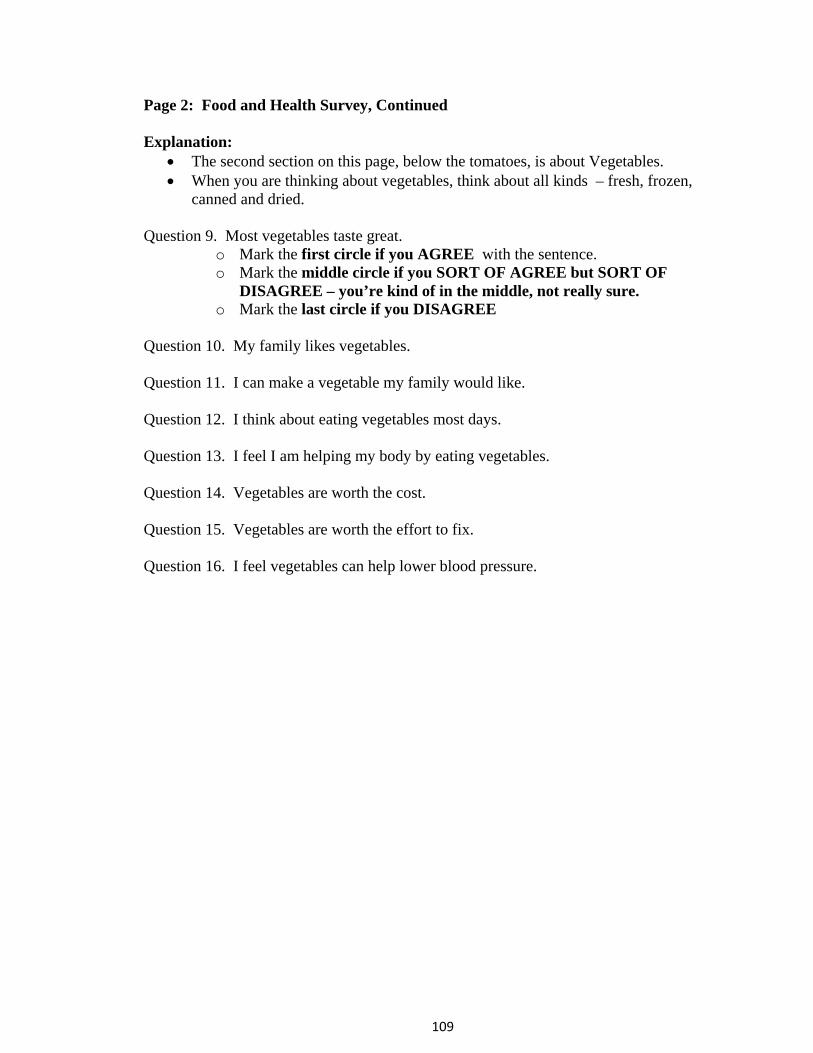
Page 2: Food and Health Survey, Continued Explanation:
• The second section on this page, below the tomatoes, is about Vegetables. • When you are thinking about vegetables, think about all kinds – fresh, frozen,
canned and dried. Question 9. Most vegetables taste great.
o Mark the first circle if you AGREE with the sentence. o Mark the middle circle if you SORT OF AGREE but SORT OF
DISAGREE – you’re kind of in the middle, not really sure. o Mark the last circle if you DISAGREE
Question 10. My family likes vegetables. Question 11. I can make a vegetable my family would like. Question 12. I think about eating vegetables most days. Question 13. I feel I am helping my body by eating vegetables. Question 14. Vegetables are worth the cost. Question 15. Vegetables are worth the effort to fix. Question 16. I feel vegetables can help lower blood pressure.
109
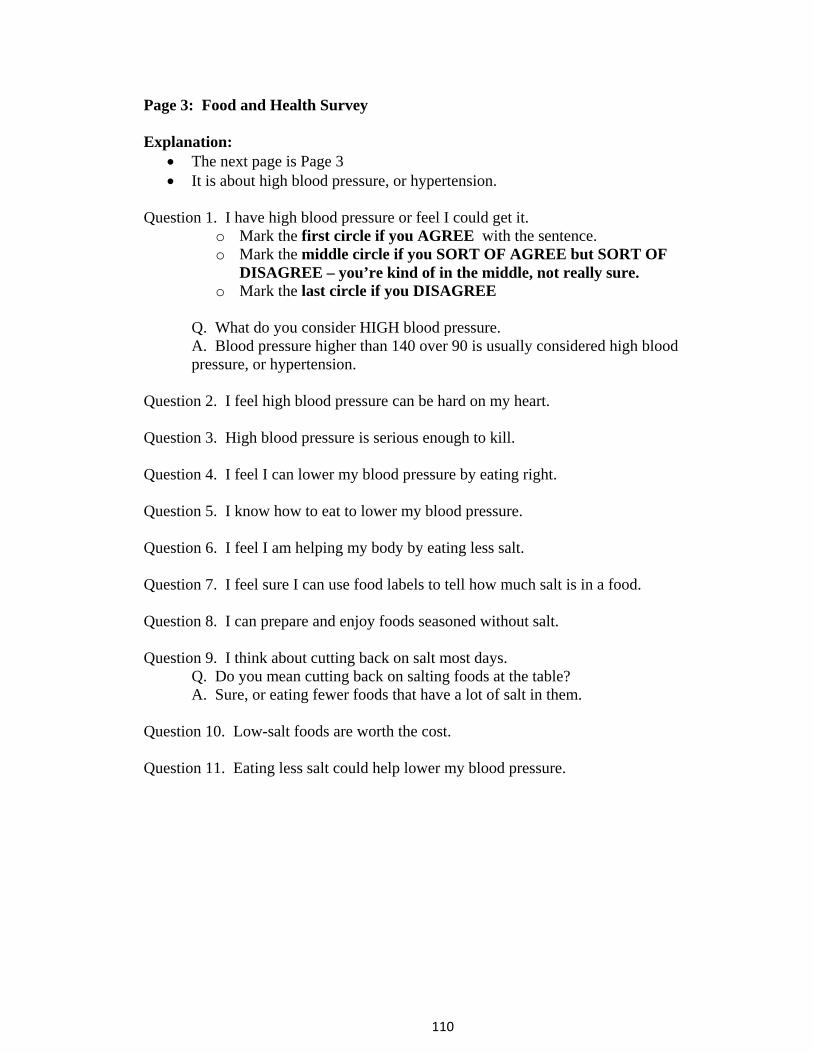
Page 3: Food and Health Survey Explanation:
• The next page is Page 3 • It is about high blood pressure, or hypertension.
Question 1. I have high blood pressure or feel I could get it.
o Mark the first circle if you AGREE with the sentence. o Mark the middle circle if you SORT OF AGREE but SORT OF
DISAGREE – you’re kind of in the middle, not really sure. o Mark the last circle if you DISAGREE
Q. What do you consider HIGH blood pressure. A. Blood pressure higher than 140 over 90 is usually considered high blood pressure, or hypertension.
Question 2. I feel high blood pressure can be hard on my heart. Question 3. High blood pressure is serious enough to kill. Question 4. I feel I can lower my blood pressure by eating right. Question 5. I know how to eat to lower my blood pressure. Question 6. I feel I am helping my body by eating less salt. Question 7. I feel sure I can use food labels to tell how much salt is in a food. Question 8. I can prepare and enjoy foods seasoned without salt. Question 9. I think about cutting back on salt most days. Q. Do you mean cutting back on salting foods at the table? A. Sure, or eating fewer foods that have a lot of salt in them. Question 10. Low-salt foods are worth the cost. Question 11. Eating less salt could help lower my blood pressure.
110

Page 4: Food and Health Survey Explanation:
• The back page is Page 4. • It is set up a little differently from the other pages. • Let’s talk about the first section.
Question 1. In your house, who is in charge of what foods to buy?
o The first circle is I AM, o Mark the middle circle is it is a SHARED DECISION o Mark the last circle if SOMEONE ELSE is in charge of what foods to
buy. Question 2. In your house, who is in charge of how to prepare the food?
o The first circle is I AM, o Mark the middle circle is it is a SHARED DECISION o Mark the last circle if SOMEONE ELSE is in charge of how to prepare
the food. Question 3. How would you describe your diet.
o Mark the circle under the word that you would use to describe your diet: Excellent, very good, good, fair or poor.
Q. What do you consider an excellent diet? A. Actually, here, we’re just interested in how YOU would describe it.
111
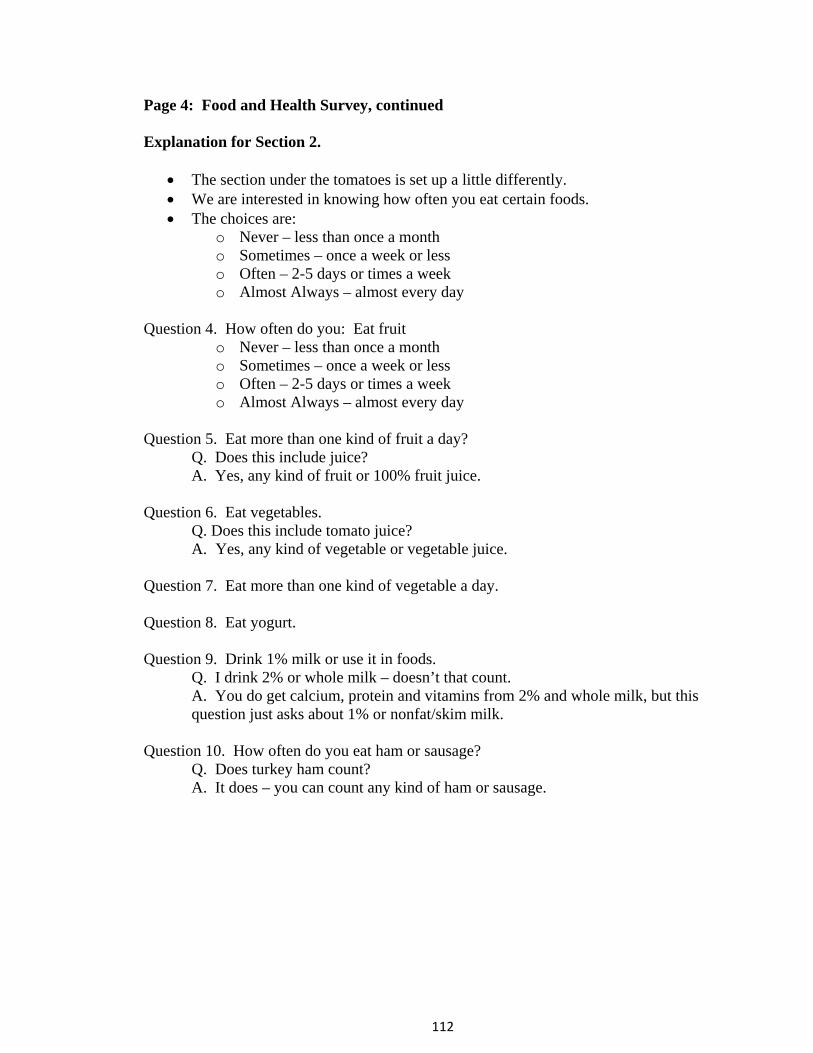
112
Page 4: Food and Health Survey, continued Explanation for Section 2.
• The section under the tomatoes is set up a little differently. • We are interested in knowing how often you eat certain foods. • The choices are:
o Never – less than once a month o Sometimes – once a week or less o Often – 2-5 days or times a week o Almost Always – almost every day
Question 4. How often do you: Eat fruit
o Never – less than once a month o Sometimes – once a week or less o Often – 2-5 days or times a week o Almost Always – almost every day
Question 5. Eat more than one kind of fruit a day? Q. Does this include juice? A. Yes, any kind of fruit or 100% fruit juice. Question 6. Eat vegetables.
Q. Does this include tomato juice? A. Yes, any kind of vegetable or vegetable juice.
Question 7. Eat more than one kind of vegetable a day. Question 8. Eat yogurt. Question 9. Drink 1% milk or use it in foods. Q. I drink 2% or whole milk – doesn’t that count.
A. You do get calcium, protein and vitamins from 2% and whole milk, but this question just asks about 1% or nonfat/skim milk.
Question 10. How often do you eat ham or sausage? Q. Does turkey ham count? A. It does – you can count any kind of ham or sausage.

APPENDIXEPROCESS EVALUATION
Survey Monkey - Survey Results Page 1 of5
Logged in as "ghanula" ILog Off I•' SurveyMonkey.com
, because knowtedge is everything
I Need Help?
You have a basic account.
Home 1 Create Survey I My Surveys I Address Book I My Account ITo remove the limits of a basic ac:x:::omt and get unlimited questions, upgrade nowl
survey title:
EFNEP Pilot Curriculum Study E~_i! T!!:le r design survey 1f coflect responses )r analyze results 1
(~ V"teW Summary
f at. Browse Responses
i 'Y Filler Responses
r [] Crosstab Responses
r _~ Download Responses ]
f ~ Share Responses
] r current report: DefaultReport. I
~ Response Summary Total Started Survey: 19
Total Completed Survey: 19 (100%)
I Page: Defaun Section
1. Which session are you commenting on?
Response Response
Percent Count
26.7% 4Food Talk
26.7% 4Stress-Free Mealtimes
20.0%Color Me Healthy
1Mnning Ways with Fast Food c:=:=JKeep vourseff Wen c:=:=J
Keep Your Health Out of Jeopardy c:=:=J
13.3%
13.3%
13.3%
Other (pSease specify) ~
answered question 15
skipped question 4
2. Was this the first time you used this lesson plan?
Response Response
Percent Count
Yes 46.7%
Not sure D 6.7%
No 46.7%
answered question 15
skipped question 4
3. How much do you think most of your group liked the session?
Response Response
Percent Count
Nat at an 0.0%
Not much 0.0%
Hard to ten 0.0% o
http://www.surveymonkey.comIMySurvey _Responses.aspx?sm=CVDSVDtRs%2bdTieG ... 3/28/2009
113

SurveyMonkey - Survey Results
A lot 73.3%
Page 2 of5
11
26.7%
IInswered question 15
4. How did most of the partkipants seem during the session (check an that apply)
Response Response
Percent Count
Not into it 0.0%
Bored 0.0%
Didn't participate 0.0%
Asked off-track questions D 6.3%
I cOuldn't tell how they seemed 0.0%
Interested 31.3%
ln1Dit 31.3%
Veryio1o ~ 25.0%
lots of discussion 43.8%
Asked questions re~ to topic 50.0%
Othef (please specify)
BIlSweted question 16
skipped question
5. Pfease tell us about any DESSERT rvcipes you used IN nttS SESSION.
What did the participants' do?
Watched demo and Only received copy of Response
sampledSampled only
recipe Count
Amazing Banana Pudding 100.0% (5) 0.0%(0) 0.0%(0)
Bluebeny parfaits 100.0%(3) 0.0%(0) 0.0%(0)
Cinnamon Dip 100.0%(1) 0.0%(0) 0.0%(0)
ereamy pineapple PudOong 83.3% (5) 16.7%(1) 0.0%(0)
_Muffins 25.0%(1) 75.0%(3) 0.0%(0)
Peach Crumble 7U%(5) 28.6%(2) 0.0%(0)
How did most feel about the ~ipe?
Did not like it Did not Ike it ResponseHard tote/I Ukedk Loved it••• n much Count
Amazing Banana ~ 0.0'lI.(0) 0.0'110(0) 0.1)%(0) o4O.0'lI.(2) 60.0% (3)
Bluebeny Parfaits 0.1)%(0) 0.0'110(0) 0.0'110(0) 66.7% (2) 33.3%(1)
Cinnamon Dip 0.0'110(0) 0.0'lI. (0) 0.0%(0) 0.0'lI.(0) 100.0%(2)
Creamy Pineapple Pudding 0.0'lI.(0) 0.0'lI.(0) 0.0'lI.(0) 33.3%(2) 66.7%(4)
http://www.surveymonkey.comIMySurveL Responses.aspx?sm=CVDSVDtRs%2bdTieG ...
114
3/28/2009
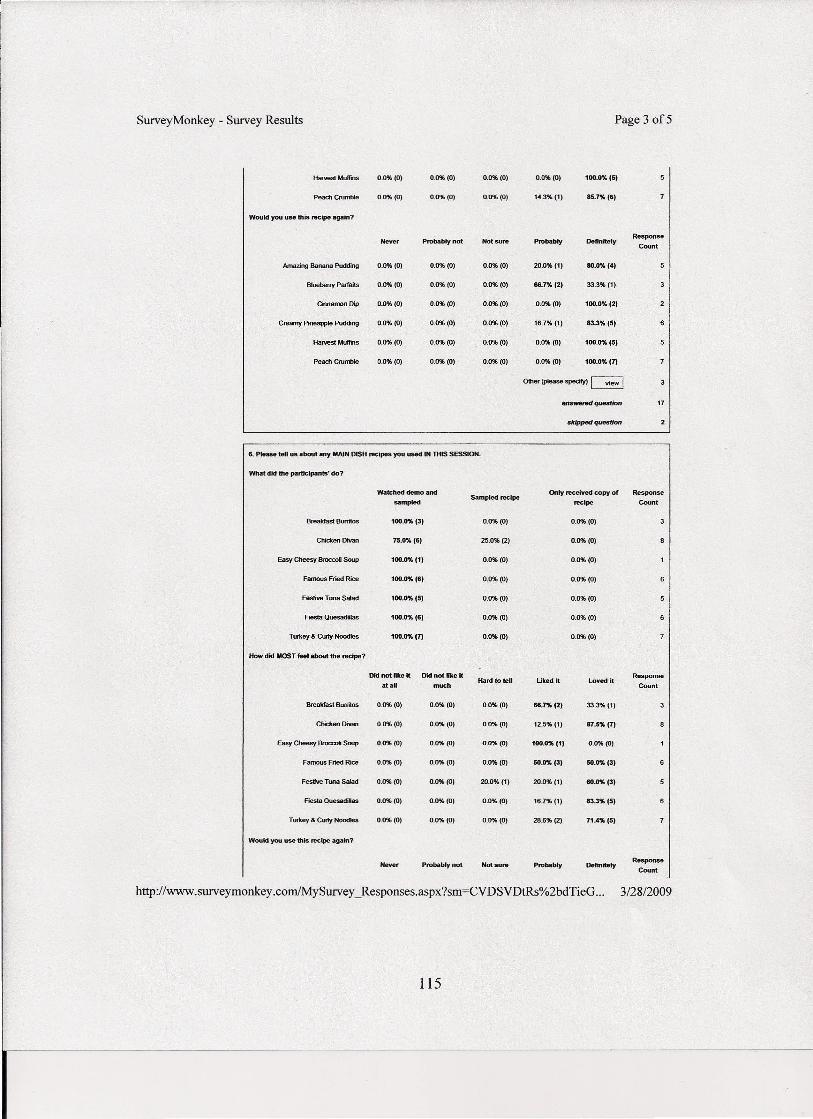
Survey Monkey - Survey Results Page 3 of5
_Muffins 0.1)%(0) 0.0%(0) 0.0%(0) 0.0%(0) 100.1)%(5)
Peacherun- 0.0%(0) 0.0%(0) 0.0%(0) 14.3%(1) 85.7%(6)
Would you use this recipe again?
Never Probably not Not sure Probably DefinitelyResponse
Count
Amazing Banana Pudding 0.0%(0) 0.0%(0) 0.0%(0) 20.0%(1) 80.0% (4)
Blueberry Parfaits 0.0%(0) 0.0%(0) 0.0%(0) 66.7% (2) 33.3%(1)
Cinnamon Dip 0.0%(0) 0.0%(0) 0.0%(0) 0.0%(0) 100.0% (2)
Creamy PioeappSe Pudding 0.0%(0) 0.0%(0) 0.0%(0) 16.7%(1) 83.3% (5)
Harvest Muffins 0.0%(0) 0.0%(0) 0.0%(0) 0.0%(0) 100.0% (5)
Peach Crumble 0.0%(0) 0.0%(0) 0.0%(0) 0.0%(0) 100.0% (7)
Other (ptease spedfy) ~
answenH1 question 17
skipped queslion
Wab;hed demo and Only received copy of Response
umpledSampled recipe
recipe Count
Breakfast Burritos 100.0%(3) 0.0%(0) 0.0%(0)
Chicken Divan 75.0% (6) 25.0%(2) 0.0%(0)
Easy Cheesy Br0cc06 Soup 100.0% (11 0.0%(0) 0.0%(0)
Famous Fried Rice 100.0%(6) 0.0%(0) 0.0%(0)
Festive Tuna Salad 100.0%(5) 0.0%(0) 0.0%(0)
Fiesta Quesadillas 100.0% (61 0.0%(0) 0.0%(0)
Turkey & Cw1y Noodles 100.0% (7) 0.0%(0) 0.0%(0)
How did MOST feel about the recipe?
Did not fike it Did not like it ResponseHard to tell Ukedlt loved it
at.U much Count
Breakfast Bunitos 0.0%(0) 0.0%(0) 0.0%(0) 66.7%(2) 33.3%(1)
Chicken Divan 0.0%(0) 0.0%(0) 0.0%(0) 12.5%(1) 87.5% (7)
Easy Cheesy _ Soup 0.0%(0) 0.0%(0) 0.0%(0) 100.0%(1) 0.0%(0)
Famous Fried Rice 0.0%(0) 0.0%(0) 0.0%(0) 50.0% (3) 50.0%(3)
Festive Tuna Salad 0.0%(0) 0.0%(0) 20.0%(1) 20.0%(1) 60.0%(3)
FIeSIa QuesadiIas 0.0%(0) 0.0%(0) 0.0%(0) 16.7%(1) 83.3%(5)
Turkey & Curly Noodles 0.0%(0) 0.0%(0) 0.0%(0) 28.6% (2) 71.4% (5)
Would you use this recipe agam?
Nev ••• Probably not Not sure Probably DelinilelyResponse
Count
http://www.surveymonkey.comIMySurveLResponses.aspx?sm=CVDSVDtRs%2bdTieG ... 3/2812009
6. Please tell us about my MAIN DISH recipes you used IN THIS SESSION.
What did the participants" do7
115

Survey Monkey - Survey Results
Breakfast Burritos 0.0%(0) 0.0%(0) 0.0%(0) 0.0%(0) 100.0% (3)
Chicken Divan 0.0%(0) 0.0%(0) 0.0%(0) 0.0%(0) 100.0% (8)
Easy Cheesy Broccoli Soup 0.0%(0) 0.0%(0) 0.0%(0) 0.0%(0) 100.0%(1)
Famous Fried Rice 0.1)%(0) 0.0%(0) 0.0%(0) 16.7%(1) 83.3% (5)
Festive Tuna Salad 0.0%(0) 0.0%(0) 0.0%(0) 20.0%(1) 80.0%(4)
Flesta QuesadiHas 0.0%(0) 0.0%(0) 0.0%(0) 16.7%(1) 83.3% (5)
Turkey & Cuffy Noodles 0.0%(0) 0.0%(0) 0.0%(0) 0.0%(0) 100.0% (7)
0IIler (please specify)
atrswemd question
skipped question
7. How did you feel about teaching this tesson plan?
Response Response
Percent Count
Didn't like it. 'NOfAd prefer not to teadl
it again0.0%
It was OK but I would recommend
_of changes0.0%
Not sere 0.0%
lit<ed ., but • needs a few changes c:J 7.7%
loved teaching it 92.3%
.".-question 13
skipped question
8. How did participants' feel about the activity in the lesson plan? (check all that apply)
Response Response
Percent Count
They didn't get into it 0.0%
I didn't use it because I dtdn't think it
wouIdwol1<0.0%
There wasn't an activity 0.0%
They iked it afot but I changed it aIillte
11.1%
n.8"J.They reaIy got into ~
tt led to alot of discussion 100.0%
stipped question 10
19. How closely did you follow the lesson guide?
Response
http://www.surveymonkey.comIMySurveL Responses.aspx?sm=CVDSVDtRs%2bdTieG ...
116
Page 4 of5
19
o
o
12
_I3128/2009

SurveyMonkey - Survey Results Page 5 of5
Percent Count
Not dosety at all 0.0%
Not much 0.0% 0
Not sure 0 6.7%
PreUy dosety 0 6.7%
Almost exacUy 86.7% 13
answered question 15
skipped queslion
10. Comments and Suggestions for Improvement - Thanksl
Response
Count
IIIJSwwed question
skipped quesOOn 14
Anti-Spam Policy Terms of Use Privacy Statement Opt OuUDpiin Contact Us
Copyright 191999-2009 SurveyMonkey.com. All Rights Reserved. No portion of this site may be copied without the express written consent of SurveyMonkey.com. 35
http://www.surveymonkey.com/MySurvey _Responses.aspx?sm=CVDSVDtRs%2bdTieG ... 3128/2009
117