Embed Size (px)
Citation preview
Evaluation of a Multi-regional Trial for Global Simultaneous Drug Development
Norisuke Kawai
Clinical Statistics, Pfizer Japan Inc.
Agenda Background 3-layer approach Statistical approaches for exploring regional
heterogeneity of the treatment effect Points to consider for partitioning the overall
sample size into each region Summary
Background
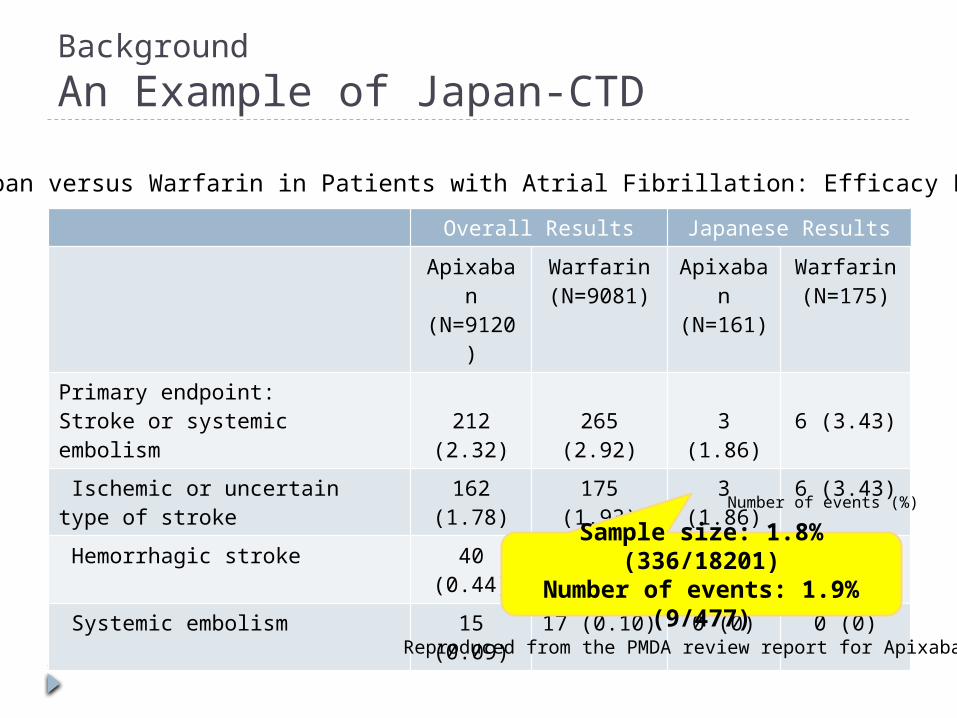
An Example of Japan-CTD
Overall Results Japanese Results
Apixaban(N=9120
)
Warfarin(N=9081)
Apixaban
(N=161)
Warfarin(N=175)
Primary endpoint:Stroke or systemic embolism 212
(2.32)265 (2.92) 3 (1.86) 6 (3.43)
Ischemic or uncertain type of stroke
162 (1.78)
175 (1.93) 3 (1.86) 6 (3.43)
Hemorrhagic stroke 40 (0.44) 78 (0.86) 0 (0) 2 (1.14)
Systemic embolism 15 (0.09) 17 (0.10) 0 (0) 0 (0)Number of events (%)
Reproduced from the PMDA review report for Apixaban
Apixaban versus Warfarin in Patients with Atrial Fibrillation: Efficacy Results
Sample size: 1.8% (336/18201)
Number of events: 1.9% (9/477)
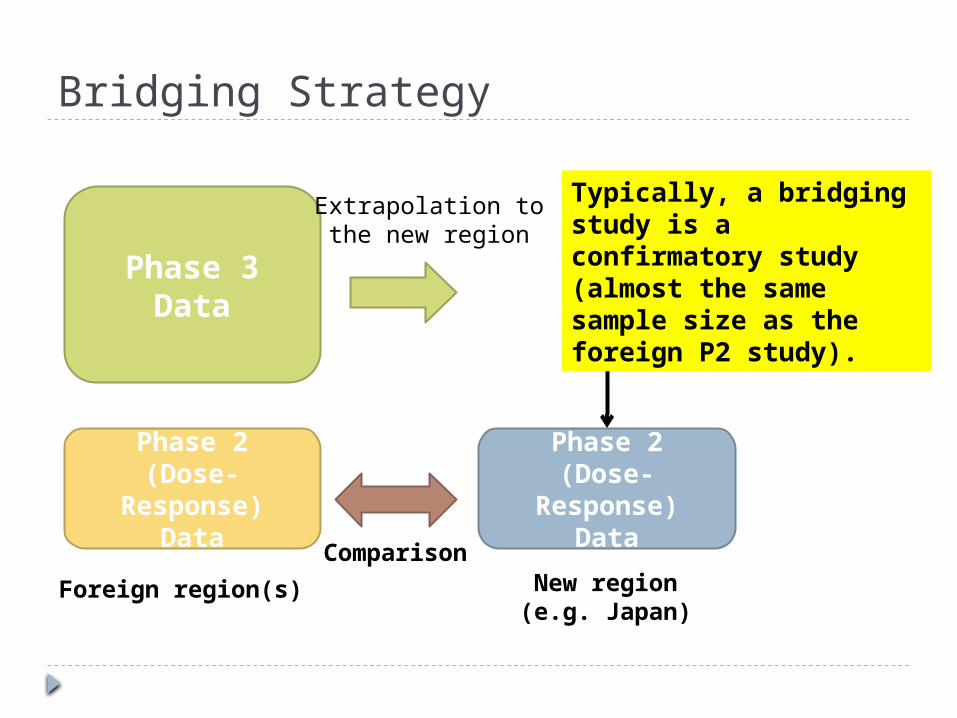
Bridging Strategy
Phase 2(Dose-
Response)Data
New region(e.g. Japan)
Foreign region(s)
Phase 3Data
Phase 2(Dose-
Response)Data
Comparison
Extrapolation tothe new region
Typically, a bridging study is a confirmatory study (almost the same sample size as the foreign P2 study).
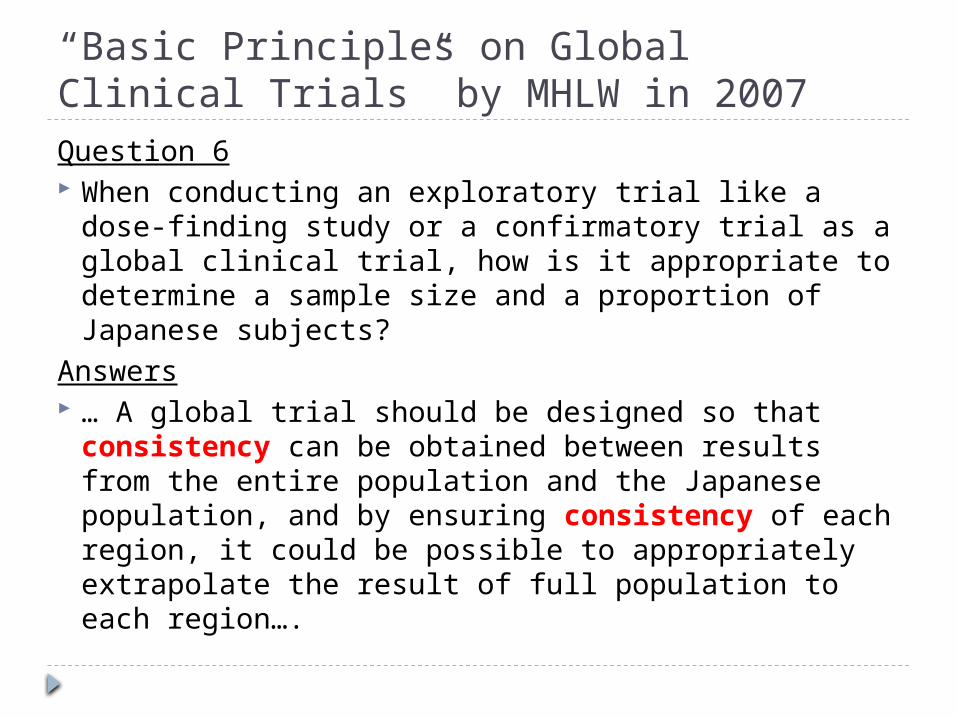
“Basic Principles on Global Clinical Trials” by MHLW in 2007Question 6 When conducting an exploratory trial like a dose-
finding study or a confirmatory trial as a global clinical trial, how is it appropriate to determine a sample size and a proportion of Japanese subjects?
Answers … A global trial should be designed so that
consistency can be obtained between results from the entire population and the Japanese population, and by ensuring consistency of each region, it could be possible to appropriately extrapolate the result of full population to each region….
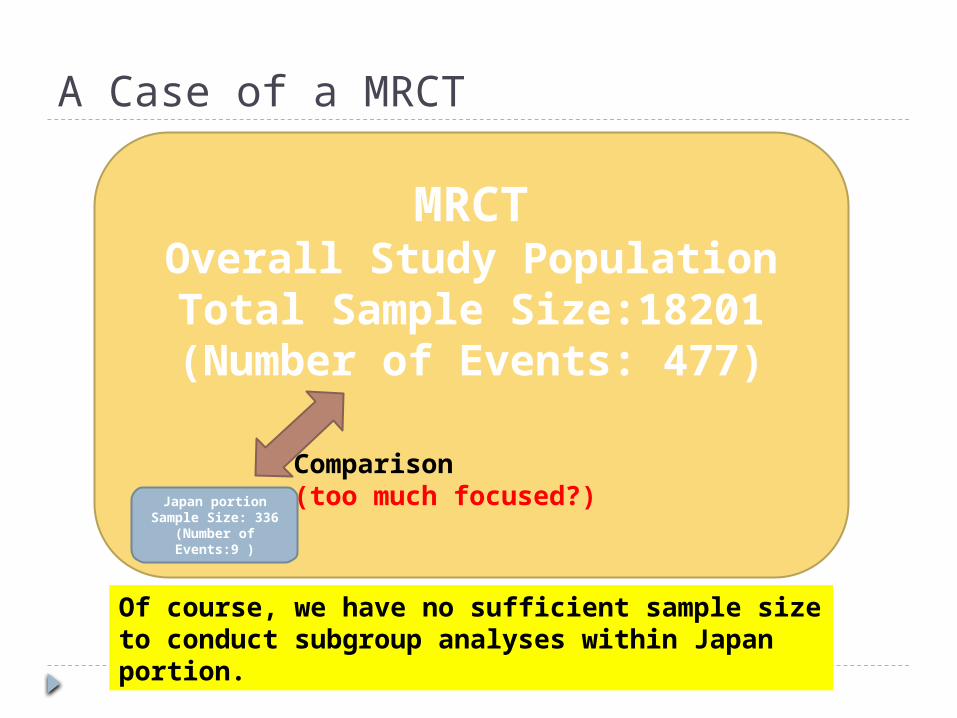
A Case of a MRCT
MRCTOverall Study PopulationTotal Sample Size:18201(Number of Events: 477)
Japan portionSample Size: 336
(Number of Events:9 )
Of course, we have no sufficient sample size to conduct subgroup analyses within Japan portion.
Comparison(too much focused?)
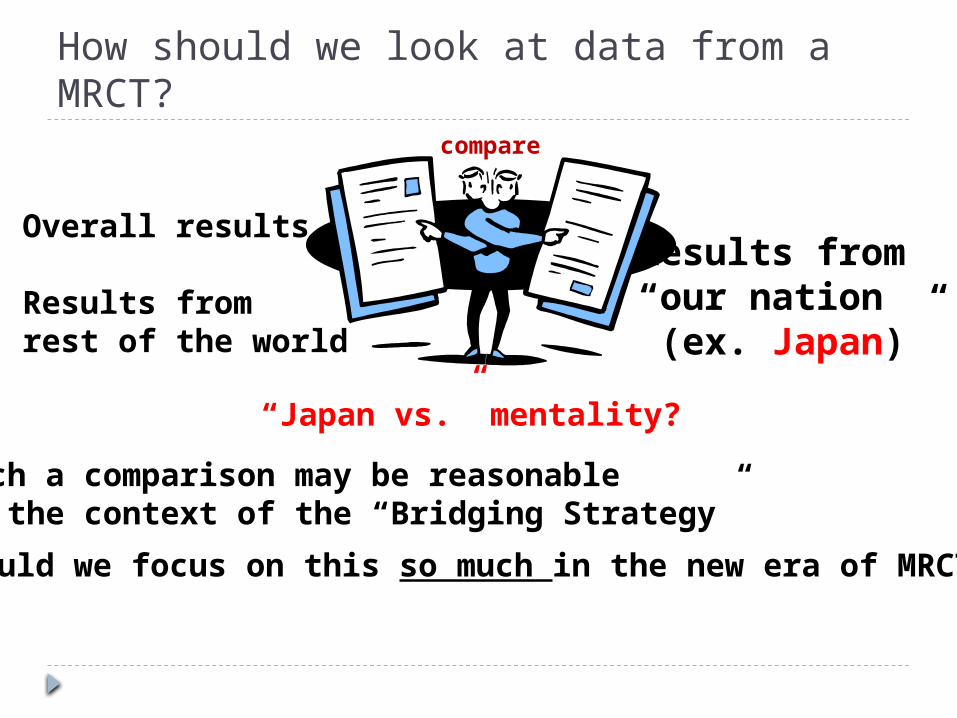
How should we look at data from a MRCT?
Overall results
Results fromrest of the world
Results from“our nation (ex. Japan)”
Such a comparison may be reasonablein the context of the “Bridging Strategy”
Should we focus on this so much in the new era of MRCTs ?
compare
“Japan vs.” mentality?
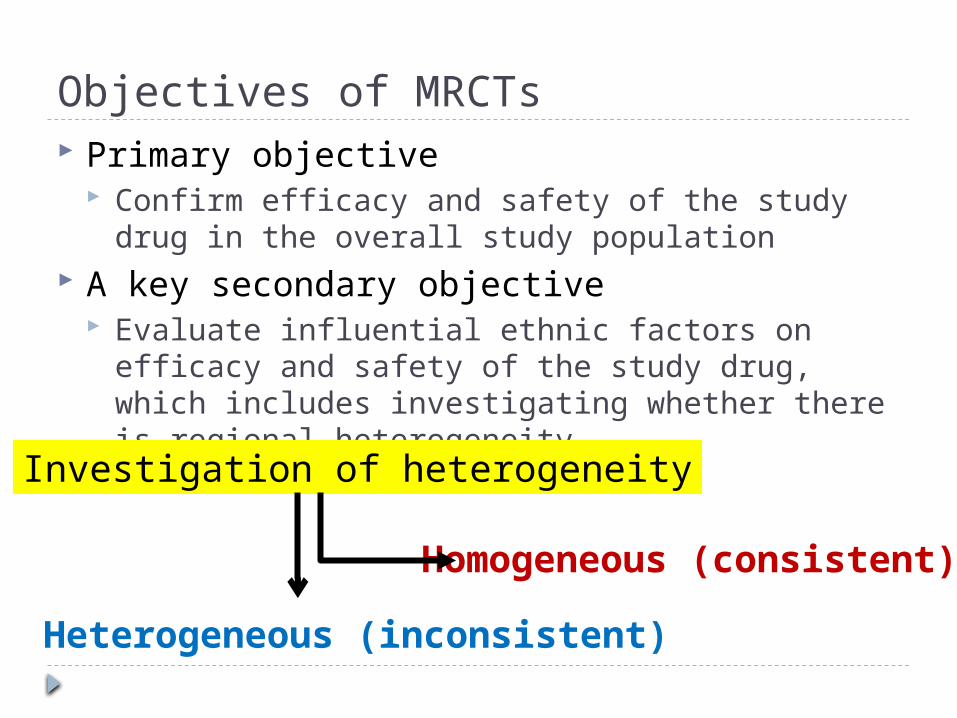
Objectives of MRCTs Primary objective
Confirm efficacy and safety of the study drug in the overall study population
A key secondary objective Evaluate influential ethnic factors on efficacy and
safety of the study drug, which includes investigating whether there is regional heterogeneity
Homogeneous (consistent)
Investigation of heterogeneity
Heterogeneous (inconsistent)
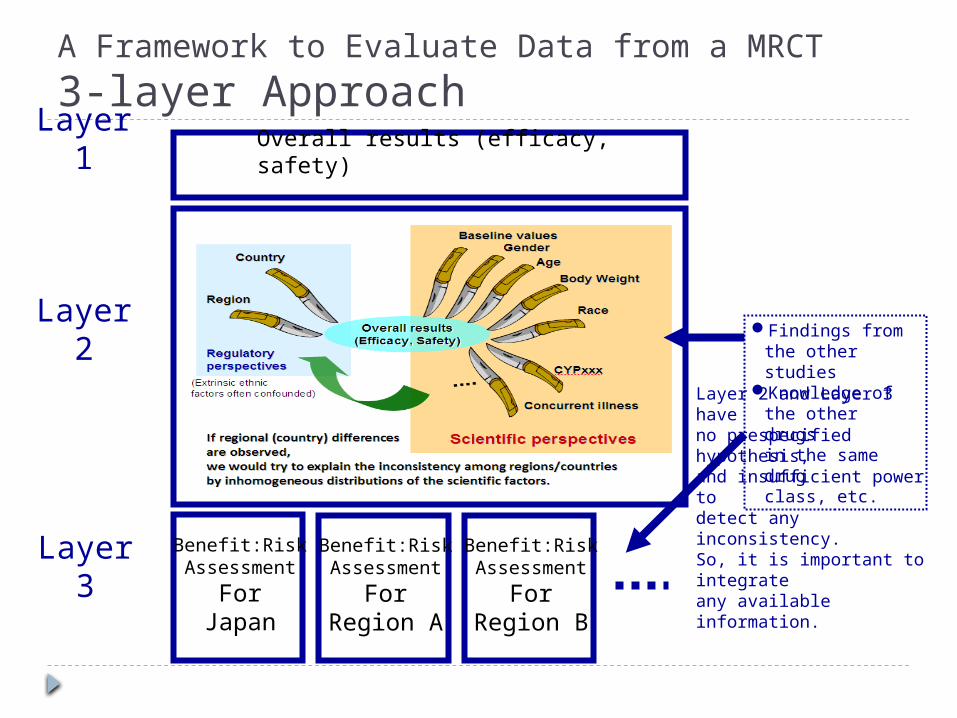
A Framework to Evaluate Data from a MRCT
3-layer Approach
Overall results (efficacy, safety)
Benefit:RiskAssessment
ForJapan
Benefit:RiskAssessment
ForRegion A
Benefit:RiskAssessment
ForRegion B
Findings from the other studies
Knowledge of the other drugsin the same drugclass, etc.
Layer 1
Layer 2
Layer 3
Layer 2 and Layer 3 haveno prespecified hypothesis, and insufficient power to detect any inconsistency. So, it is important to integrateany available information.
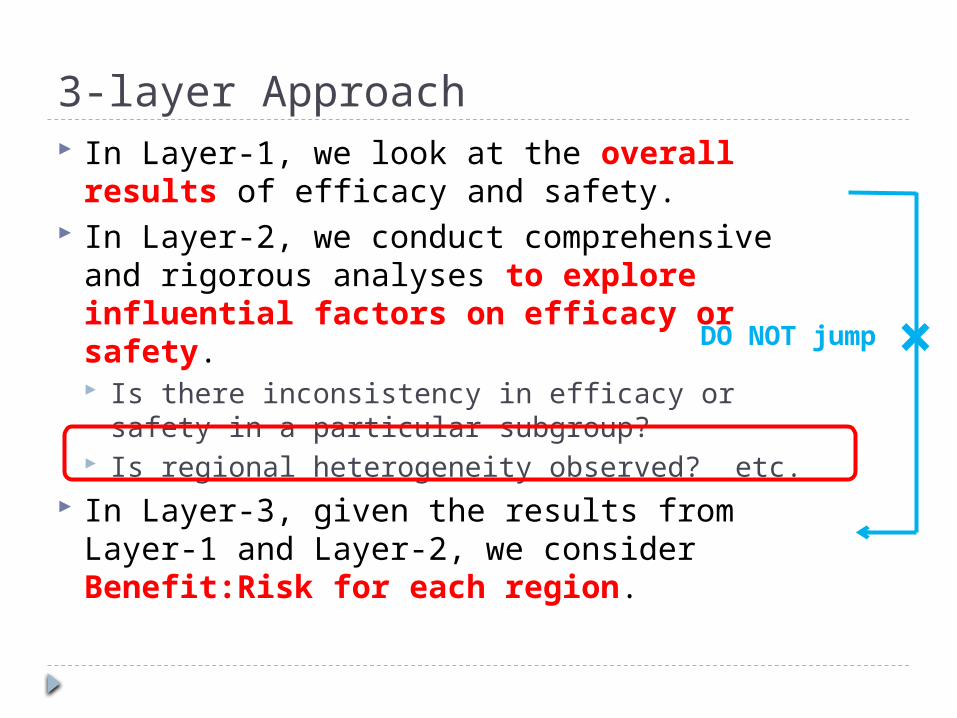
3-layer Approach In Layer-1, we look at the overall
results of efficacy and safety. In Layer-2, we conduct comprehensive
and rigorous analyses to explore influential factors on efficacy or safety. Is there inconsistency in efficacy or safety in
a particular subgroup? Is regional heterogeneity observed? etc.
In Layer-3, given the results from Layer-1 and Layer-2, we consider Benefit:Risk for each region.
DO NOT jump ×
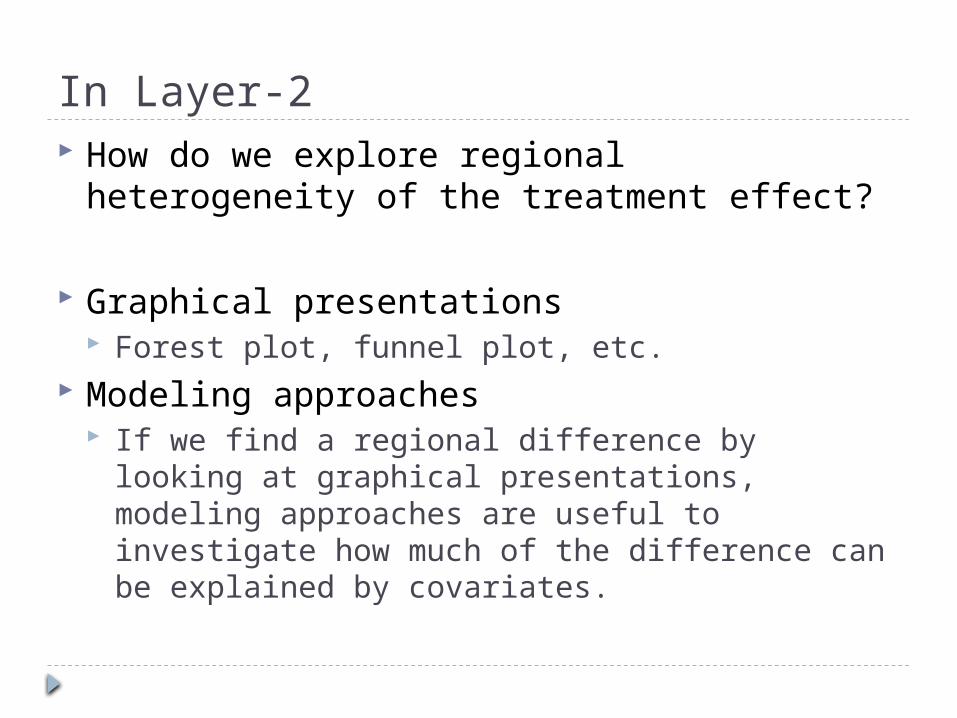
In Layer-2 How do we explore regional heterogeneity of
the treatment effect?
Graphical presentations Forest plot, funnel plot, etc.
Modeling approaches If we find a regional difference by looking at
graphical presentations, modeling approaches are useful to investigate how much of the difference can be explained by covariates.
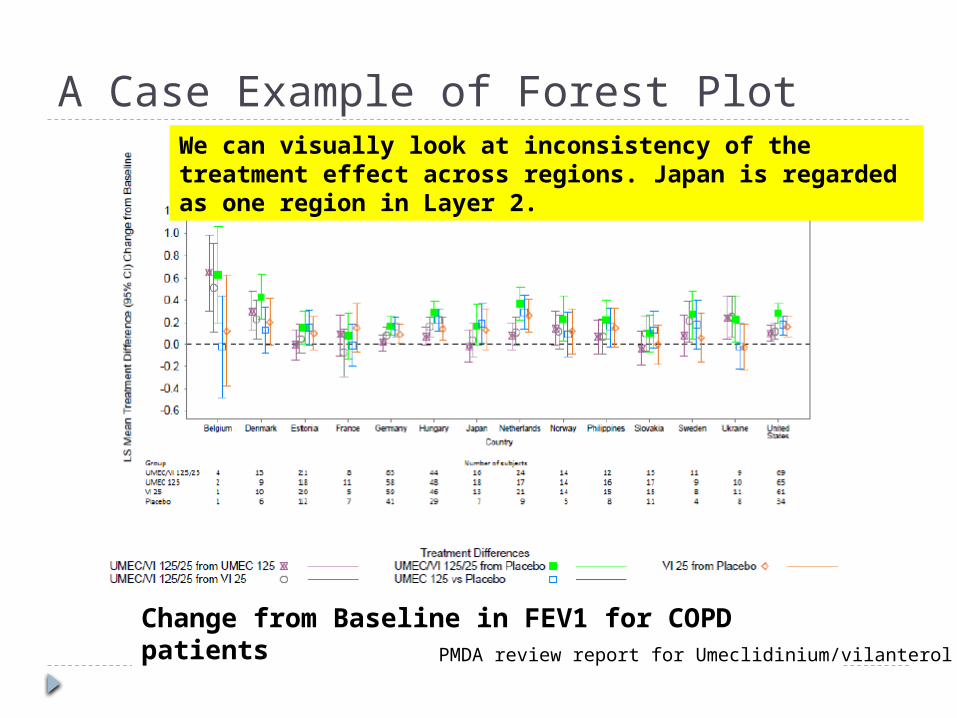
A Case Example of Forest Plot
Change from Baseline in FEV1 for COPD patients PMDA review report for Umeclidinium/vilanterol
We can visually look at inconsistency of the treatment effect across regions. Japan is regarded as one region in Layer 2.
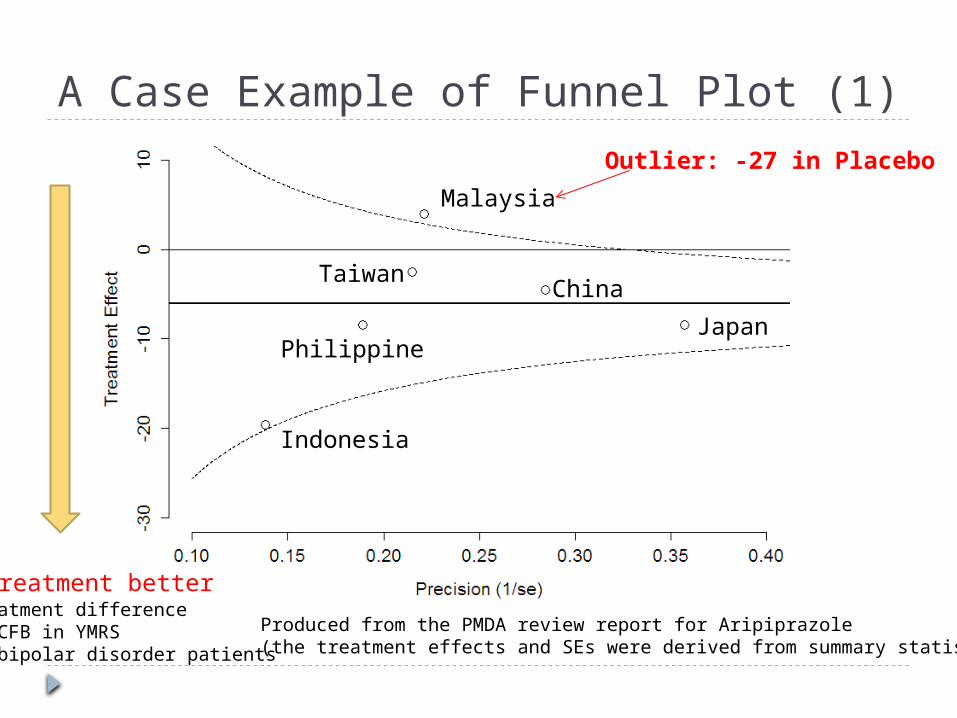
A Case Example of Funnel Plot (1)
Produced from the PMDA review report for Aripiprazole(the treatment effects and SEs were derived from summary statistics)
Indonesia
Japan
China
Philippine
Taiwan
Malaysia
Outlier: -27 in Placebo
Treatment betterTreatment difference of CFB in YMRSin bipolar disorder patients
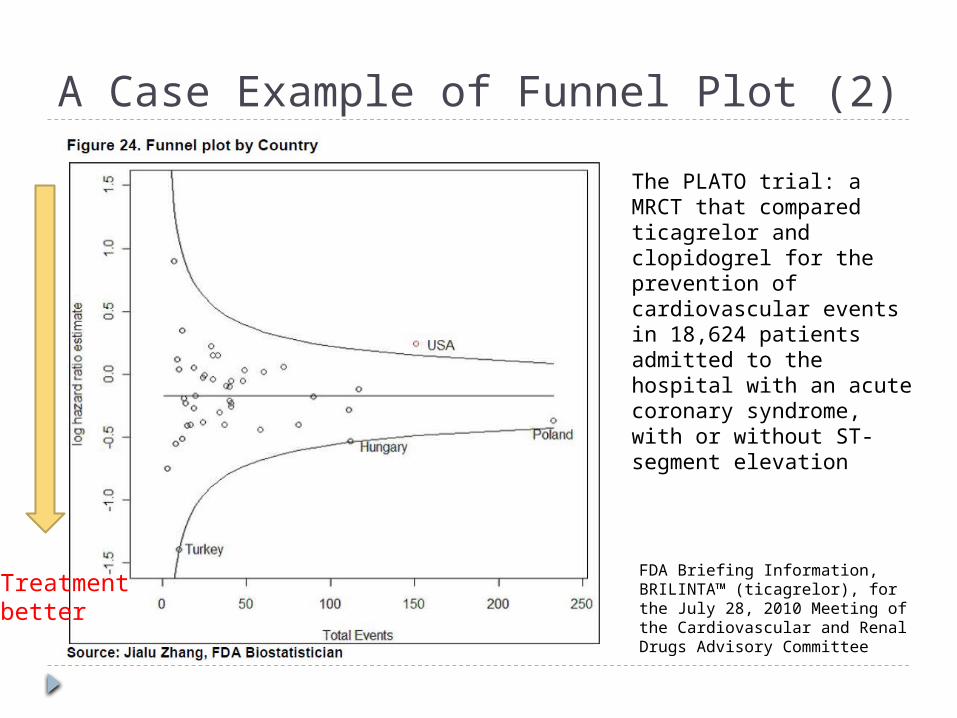
A Case Example of Funnel Plot (2)
FDA Briefing Information, BRILINTA™ (ticagrelor), for the July 28, 2010 Meeting of the Cardiovascular and Renal Drugs Advisory Committee
The PLATO trial: a MRCT that compared ticagrelor and clopidogrel for the prevention of cardiovascular events in 18,624 patients admitted to the hospital with an acute coronary syndrome, with or without ST-segment elevation
Treatmentbetter
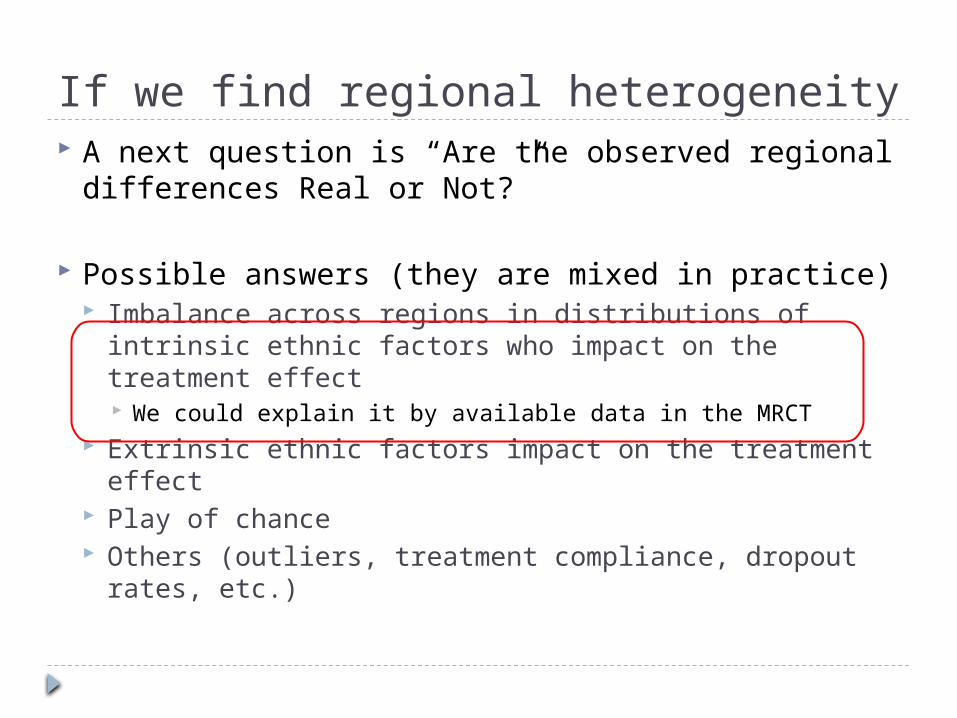
If we find regional heterogeneity A next question is “Are the observed regional
differences Real or Not?”
Possible answers (they are mixed in practice) Imbalance across regions in distributions of intrinsic
ethnic factors who impact on the treatment effect We could explain it by available data in the MRCT
Extrinsic ethnic factors impact on the treatment effect
Play of chance Others (outliers, treatment compliance, dropout
rates, etc.)
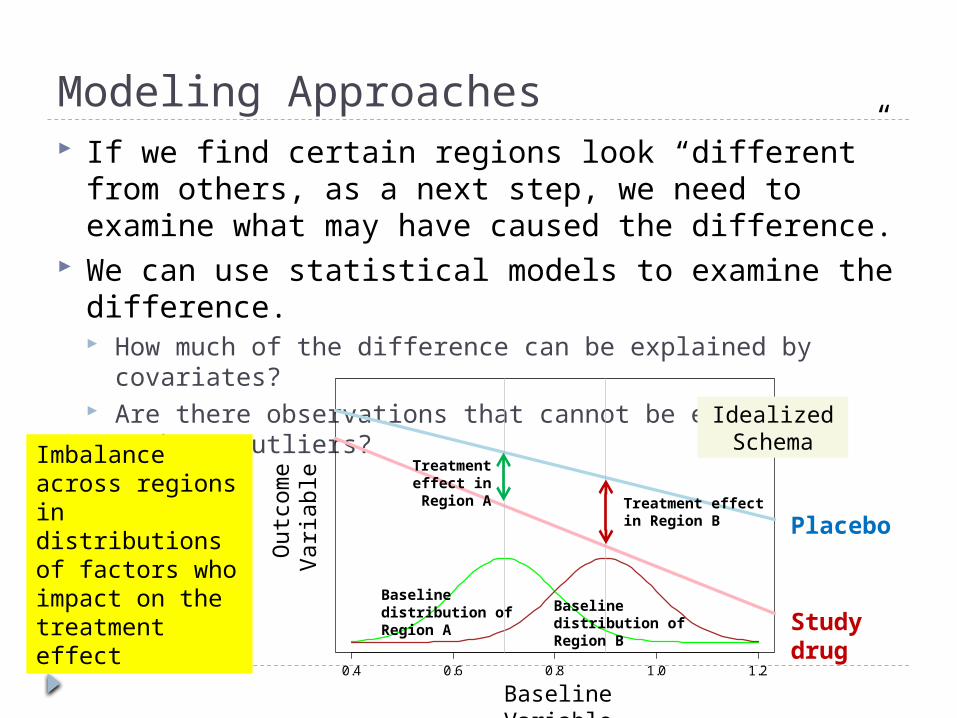
Modeling Approaches If we find certain regions look “different” from
others, as a next step, we need to examine what may have caused the difference.
We can use statistical models to examine the difference. How much of the difference can be explained by covariates? Are there observations that cannot be explained, such as
outliers?
0.4 0.6 0.8 1.0 1.2
BMD
Ou
tcom
e V
ari
ab
le
Baseline Variable
Baseline distribution of Region A
Baseline distribution of Region B
Treatment effect in Region B
Treatment effect in Region
A
Idealized Schema
Placebo
Study drug
Imbalance across regions in distributions of factors who impact on the treatment effect
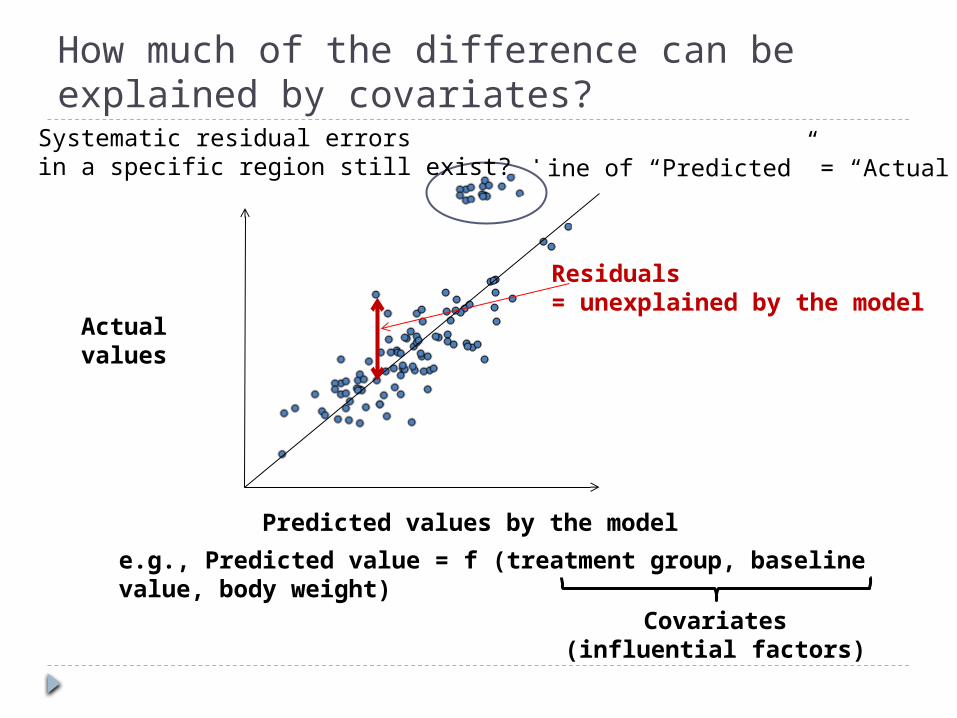
How much of the difference can be explained by covariates?
Predicted values by the model
Actual values
Line of “Predicted” = “Actual”
e.g., Predicted value = f (treatment group, baseline value, body weight)
Residuals = unexplained by the model
Covariates(influential factors)
Systematic residual errorsin a specific region still exist?
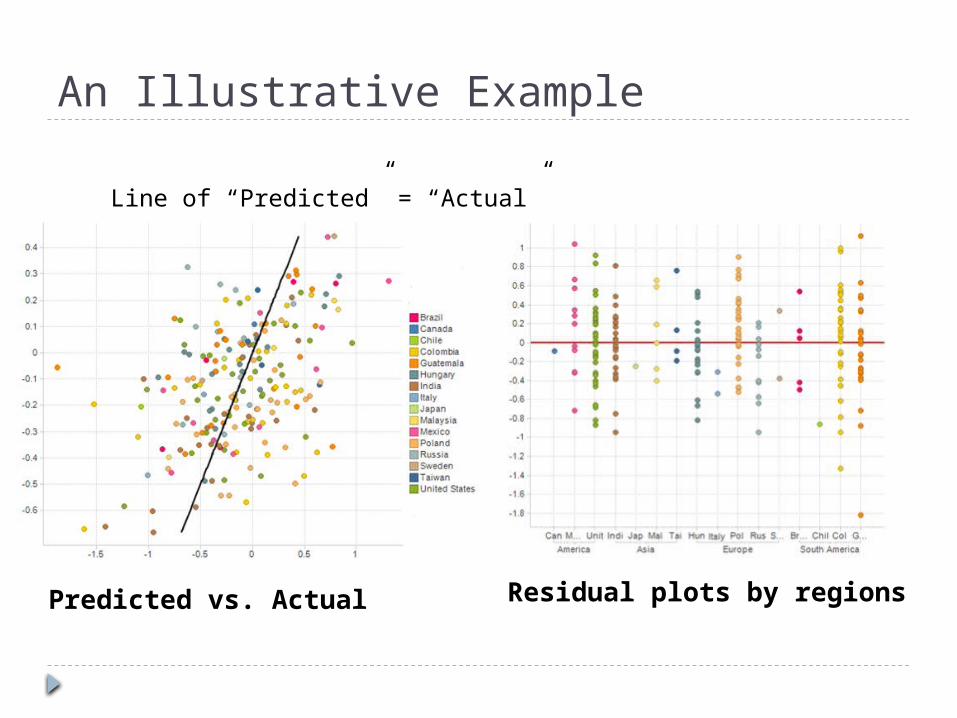
An Illustrative Example
Predicted vs. Actual Residual plots by regions
Line of “Predicted” = “Actual”
19
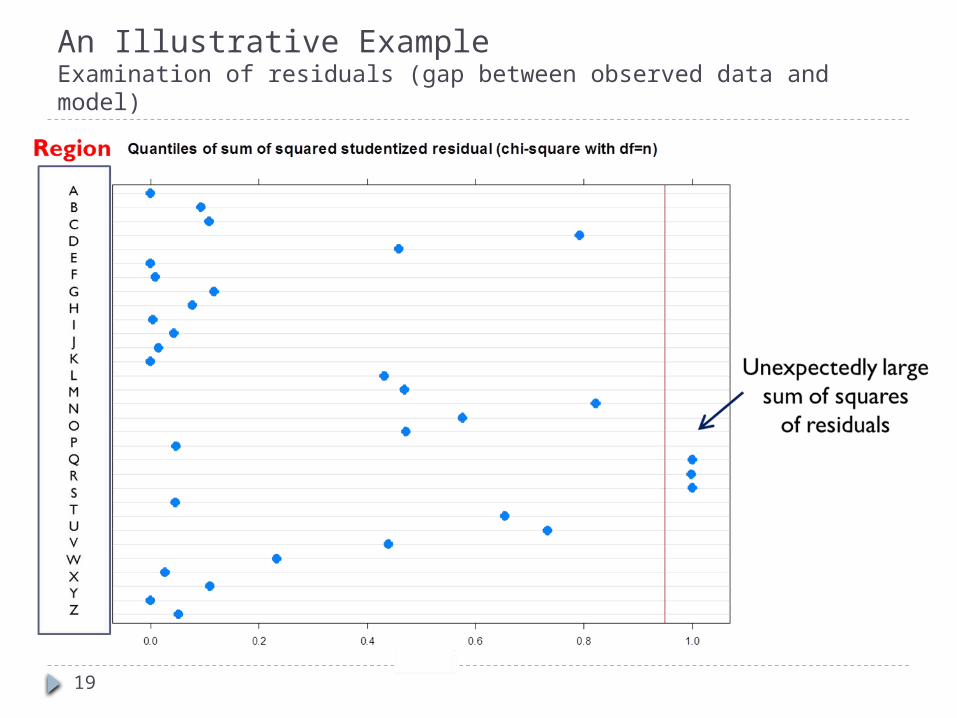
An Illustrative ExampleExamination of residuals (gap between observed data and model)
Points to consider for partitioning the overall sample size into each region Consistency perspective: Minimize the chance
for observing apparent differences across regions when the treatment effect is truly uniform across the regions. e.g. Method 1 or Method 2 in “Basic Principles on
Global Clinical Trials” by MHLW Another perspective: Be able to evaluate
influential factor(s) on important efficacy/safety endpoints, considering distributions of known influential factor(s) in each region
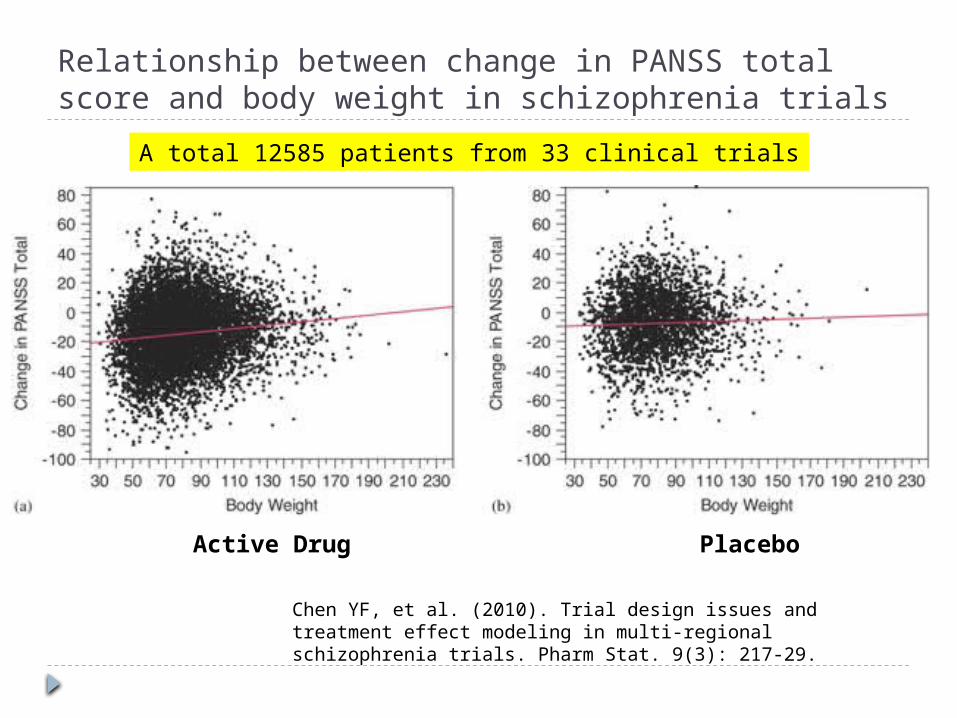
Relationship between change in PANSS total score and body weight in schizophrenia trials
Chen YF, et al. (2010). Trial design issues and treatment effect modeling in multi-regional schizophrenia trials. Pharm Stat. 9(3): 217-29.
A total 12585 patients from 33 clinical trials
Active Drug Placebo
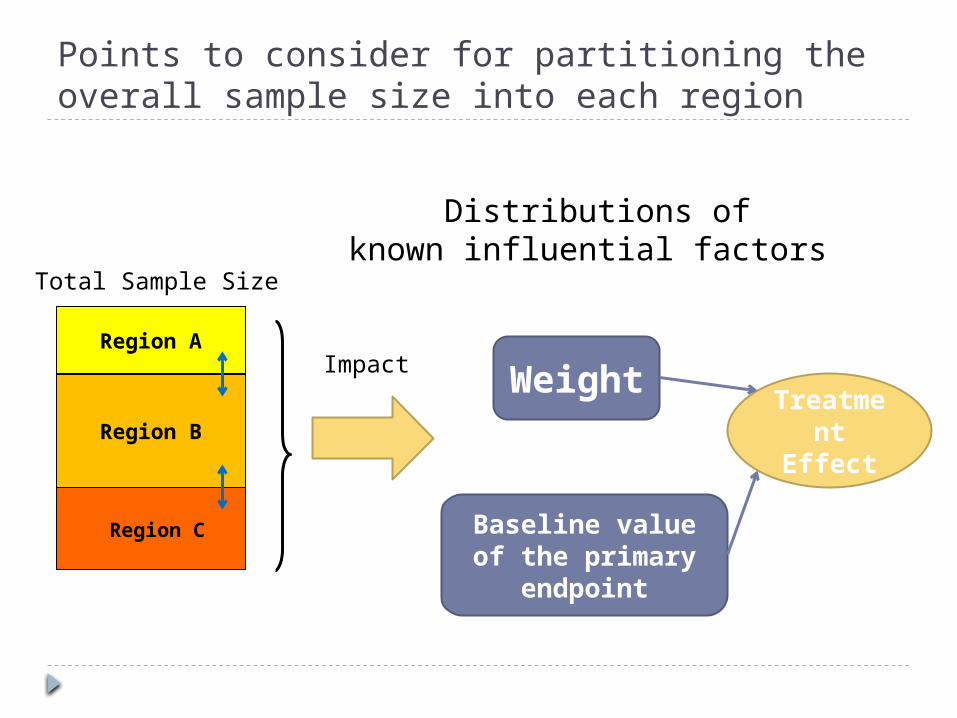
Points to consider for partitioning the overall sample size into each region
Region A
Region B
Region C
Total Sample Size
Weight
Distributions ofknown influential factors
Treatment
Effect
Baseline value of the primary
endpoint
Impact
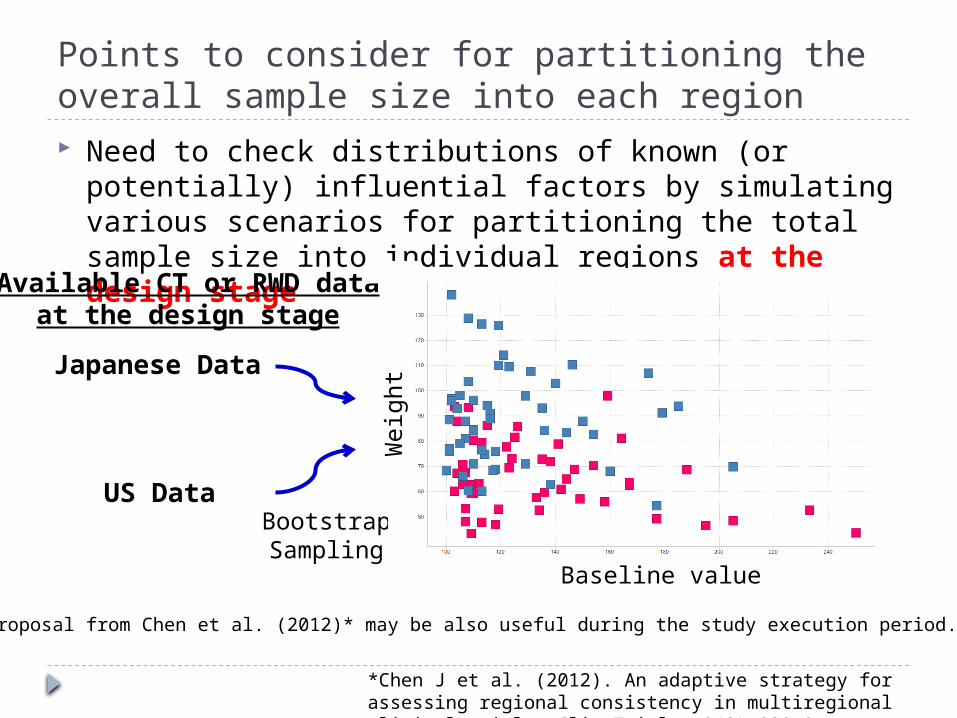
Points to consider for partitioning the overall sample size into each region Need to check distributions of known (or potentially)
influential factors by simulating various scenarios for partitioning the total sample size into individual regions at the design stage
Japanese Data
US DataBootstrapSampling
Weig
ht
Available CT or RWD dataat the design stage
Baseline value
*Chen J et al. (2012). An adaptive strategy for assessing regional consistency in multiregional clinical trials. Clin Trials. 9(3):330-9.
A proposal from Chen et al. (2012)* may be also useful during the study execution period.
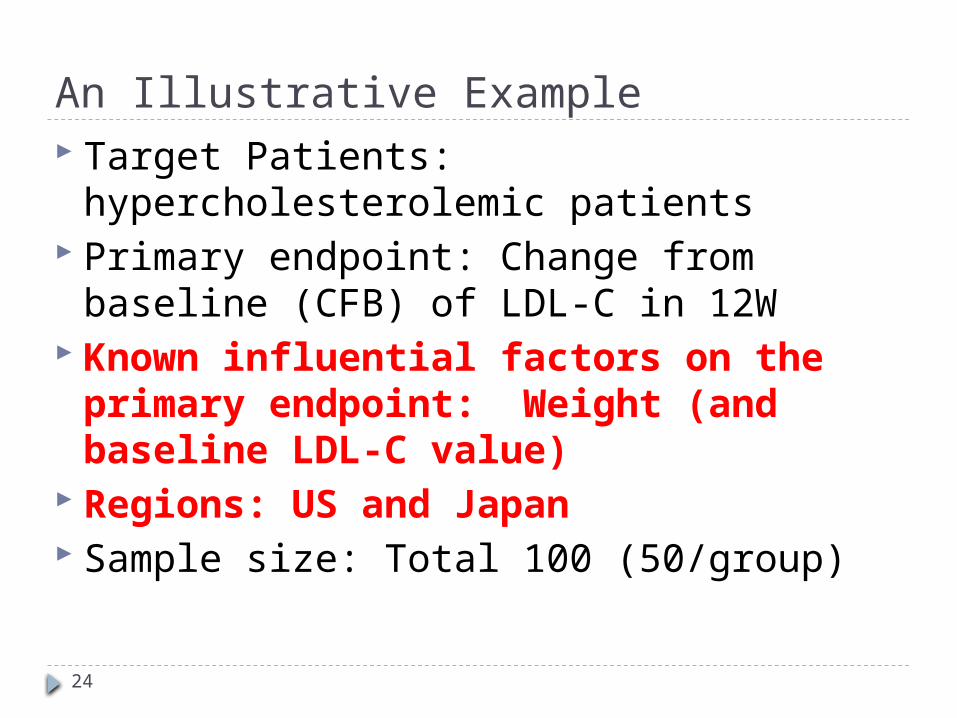
An Illustrative Example
24
Target Patients: hypercholesterolemic patients
Primary endpoint: Change from baseline (CFB) of LDL-C in 12W
Known influential factors on the primary endpoint: Weight (and baseline LDL-C value)
Regions: US and Japan Sample size: Total 100 (50/group)
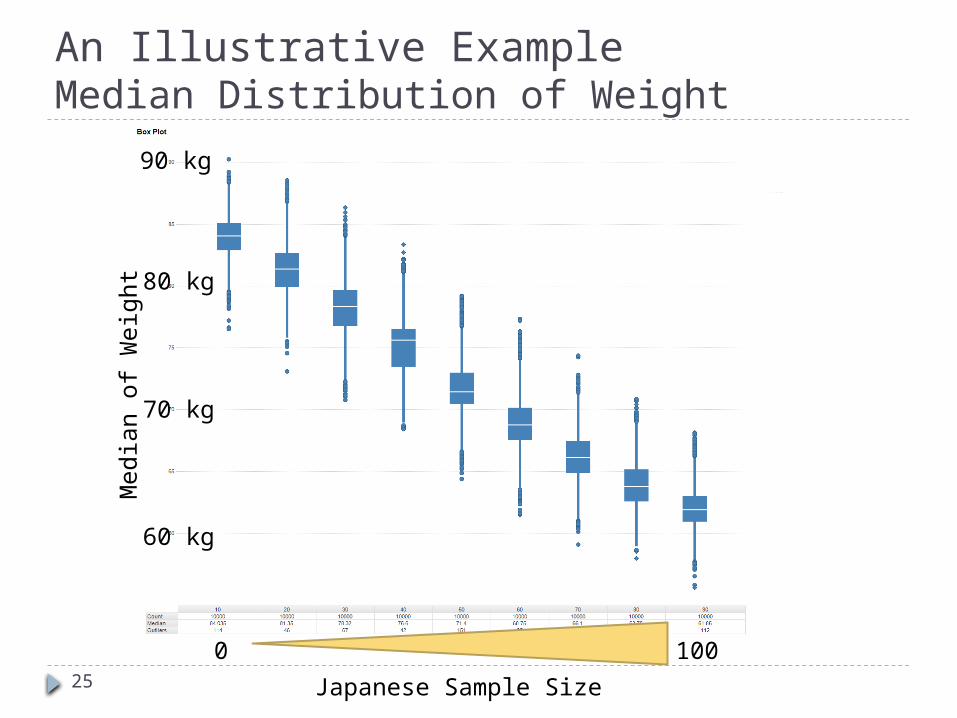
An Illustrative ExampleMedian Distribution of Weight
25 Japanese Sample Size
Media
n o
f W
eig
ht
60 kg
70 kg
80 kg
90 kg
0 100
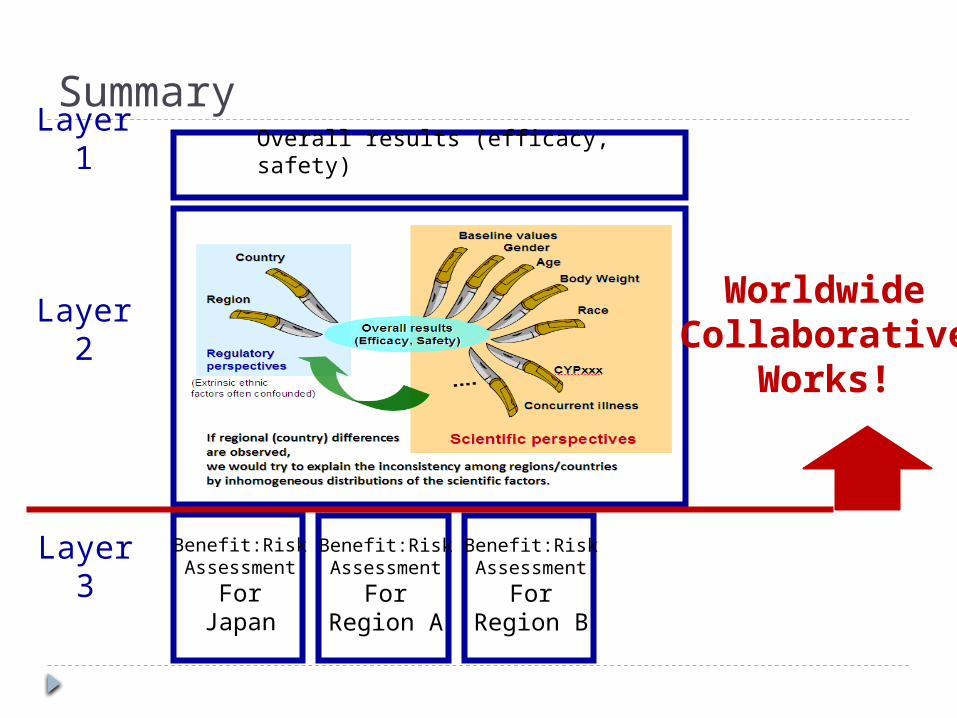
Summary
Overall results (efficacy, safety)
Benefit:RiskAssessment
ForJapan
Benefit:RiskAssessment
ForRegion A
Benefit:RiskAssessment
ForRegion B
Layer 1
Layer 2
Layer 3
WorldwideCollaborative
Works!