Embed Size (px)
Citation preview
Evaluation of a Novel Hand Held Gamma Camera for Intra-operative Single
Photon Emission Computed Tomography
A Thesis
Presented to
The faculty of the School of Engineering and Applied Science
University of Virginia
In partial fulfillment
of the requirements for the degree
Master of Science
by
Surabhi Balagopal Nair
December
2016

APPROVALSHEET
The thesis
is submitted in partial fulfillment of the requirements
for the degree of
Master of Science
The thesis has been read and approved by the examining committee:
Mark B. Williams Advisor
Craig H. Meyer
Lynn T. Dengel
Accepted for the School of Engineering and Applied Science:
Craig H. Benson, Dean, School of Engineering and Applied Science
December
2016
ABSTRACT
Cancer when detected at an early stage, before it has spread, can often
be treated successfully by surgery or local irradiation. However, when cancer is
detected only after it has metastasized, treatments are much less successful.
The lymphatic system is a primary path by which malignant cells can travel to
other organs in the body. Thus determination of the presence or absence of
malignant cells in lymph nodes to which a primary tumor drains is a key
component of cancer staging. Sentinel lymph node biopsy (SLNB) has been
developed over the past decade as a minimally invasive technique to assess
regional lymph node status in patients with malignancy.
Despite its routine role in clinical management of cancer, SLNB has a higher
false-negative rate (5- 10%) than is generally recognized. The current standard
of care in SLNB employs a non-imaging gamma probe to locate and excise the
sentinel nodes. We are exploring whether the use of a 3-D intraoperative
imaging system using a hand held gamma camera could provide advantages
compared to the use of the non-imaging probe. The 3-D intraoperative system
has been developed through a collaborative effort involving UVa, Dilon
Technologies Inc. (Newport News, Virginia), the Jefferson Lab (Newport News,
VA) and SurgicEye, (München, Germany).
iv
The system’s hand held camera has a circular field of view (FOV) of diameter
60 mm and comprises a pixelated NaI(Tl) crystal array coupled to an array of
silicon photomultipliers (SiPMs). In 3-D operation an optical tracking system
consisting of both visual and infrared (IR) cameras tracks the location and
orientation of the camera as it is moved by the surgeon. A fast iterative
reconstruction algorithm uses the streamed camera data to produce and display
the image of the nodes.
This thesis evaluates the 2-D and 3-D imaging performance of the hand
held gamma camera system. Performance metrics include energy resolution,
2D and 3D spatial resolution, gamma ray detection sensitivity, geometric
linearity, attenuation compensation, activity quantification accuracy, and the
effect of scatter radiation from the radiotracer injection site.
Chapter 1 gives an overview of the current practices of sentinel lymph
node biopsy and the various intra-operative surgical guidance modalities that
can be used for assistance in the detection of sentinel lymph nodes. This chapter
also throws light on some of the drawbacks associated with each of the
modalities. Chapter 2 gives a summary of some of the contemporary small
gamma cameras that have been developed and used for the detection of
cancerous masses and lesions. It also introduces the declipseSPECT system with
v
the gamma probe and the gamma camera, which forms the crux of this thesis.
Chapter 3 gives a detailed explanation of the performance evaluation
experiments that were carried out using this novel gamma camera. Chapter 4
concludes this thesis, summarizing the results and comparing them with the
other small gamma cameras. Chapter 5 briefly discusses the clinical studies
planned with the hand held SPECT system as the next step to validate the results
from this thesis.

ACKNOWLEDGMENT
I am very grateful to my adviser, Dr. Mark B. Williams for giving me the
opportunity to join his lab and fund me for the duration of the course. I thank
him for giving me this project, correcting me when I went the wrong way and
above all, teaching me how to do research in a scientific manner. He has been a
great motivator, helping me whenever I needed him. I would like to thank my
committee members, Dr. Craig Meyer for helping me with the ever important
statistical facet of research and Dr. Lynn Dengel for her enthusiasm and valuable
surgical point of view essential for this project. I thank my fellow lab-mates,
friends and family for giving me the support and encouragement, especially
when things hit a roadblock. They showed me the brighter side of the picture.

vii
TABLE OF CONTENTS Chapter 1 .............................................................................................. 1
Introduction ....................................................................................... 1
I. Current SLNB Protocol ................................................................. 4
II. Intra-Operative Surgical Guidance Modalities ............................ 7
A. Nuclear Medicine Imaging System ......................................... 7
A.i) Background ...................................................................... 7
B. Computed Tomography (CT) ................................................ 12
B.i) Background .................................................................... 12
B.ii) Clinical Study Results ..................................................... 13
C. Magnetic Resonance Imaging (MRI) ..................................... 14
C.i) Background .................................................................... 14
C.ii) Clinical Study Results ..................................................... 16
D. Fluorescence Molecular Imaging (FMI) ................................ 19
D.i) Background .................................................................... 19
D.ii) Clinical Study Results ..................................................... 20
E. Ultrasonography (US) ........................................................... 21

viii
E.i) Background ..................................................................... 21
E.ii) Clinical Study Results ..................................................... 23
III. Drawbacks ............................................................................... 25
Chapter 2 ............................................................................................ 28
NON-IMMAGING GAMMA PROBES AND Small Gamma cameras ..... 28
I. Introduction .............................................................................. 28
II. Contemporary Small Gamma Cameras (SGC) ........................... 30
III. DeclipseSPECT system ............................................................. 36
Chapter 3 ............................................................................................ 45
System characterization ................................................................... 45
I. Introduction .............................................................................. 45
A. Intrinsic Performance ........................................................... 45
B. Extrinsic performance .......................................................... 46
II. Performance Evaluation ........................................................... 46
A. Energy Resolution ................................................................ 46
A.i) Background .................................................................... 46
A.ii) Materials and methods ................................................. 49
ix
A.iii) Result ........................................................................... 49
B. Spatial Resolution – 2D ......................................................... 50
B.i) Background .................................................................... 50
B.ii) Materials and Methods ................................................. 52
B.iii) Result............................................................................ 53
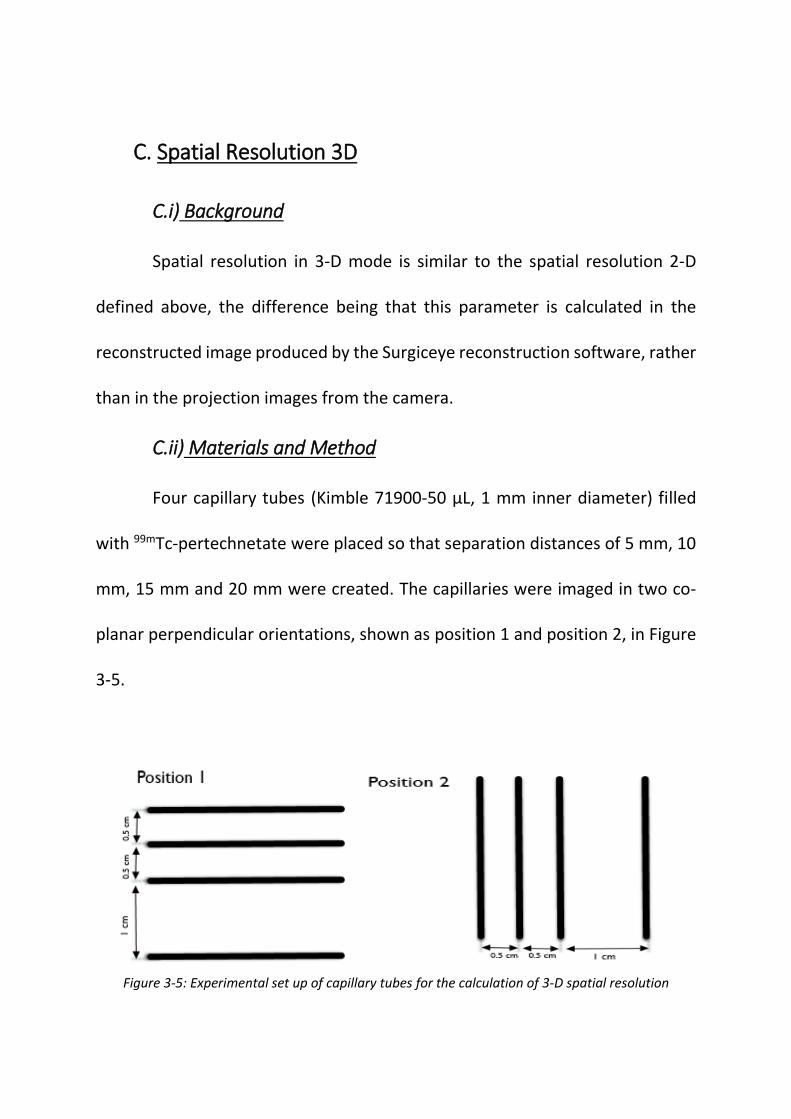
C. Spatial Resolution 3D ........................................................... 55
C.i) Background .................................................................... 55
C.ii) Materials and Method ................................................... 55
C.iii) Result ............................................................................ 56
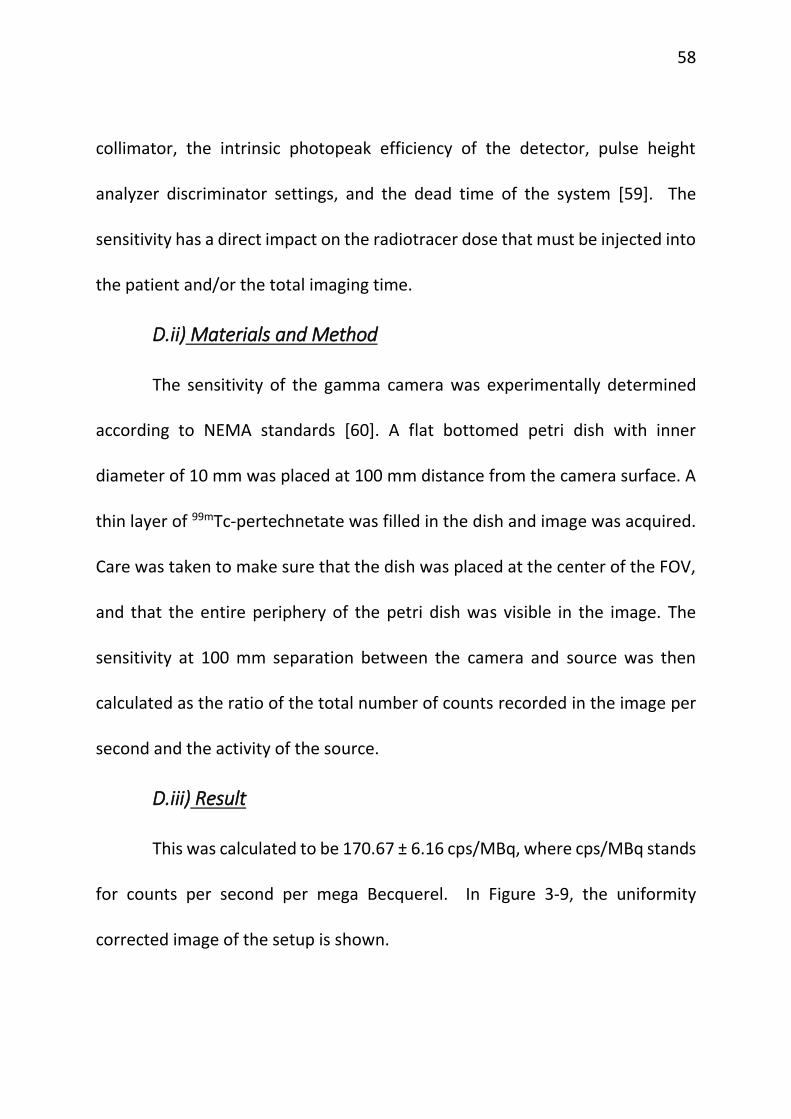
D. Sensitivity – 2D ..................................................................... 57
D.i) Background .................................................................... 57
D.ii) Materials and Method ................................................... 58
D.iii) Result ........................................................................... 58
E. Sensitivity – 3D ..................................................................... 59
E.i) Background ..................................................................... 59
E.ii) Materials and Method ................................................... 59
E.iii) Result ............................................................................ 60

x
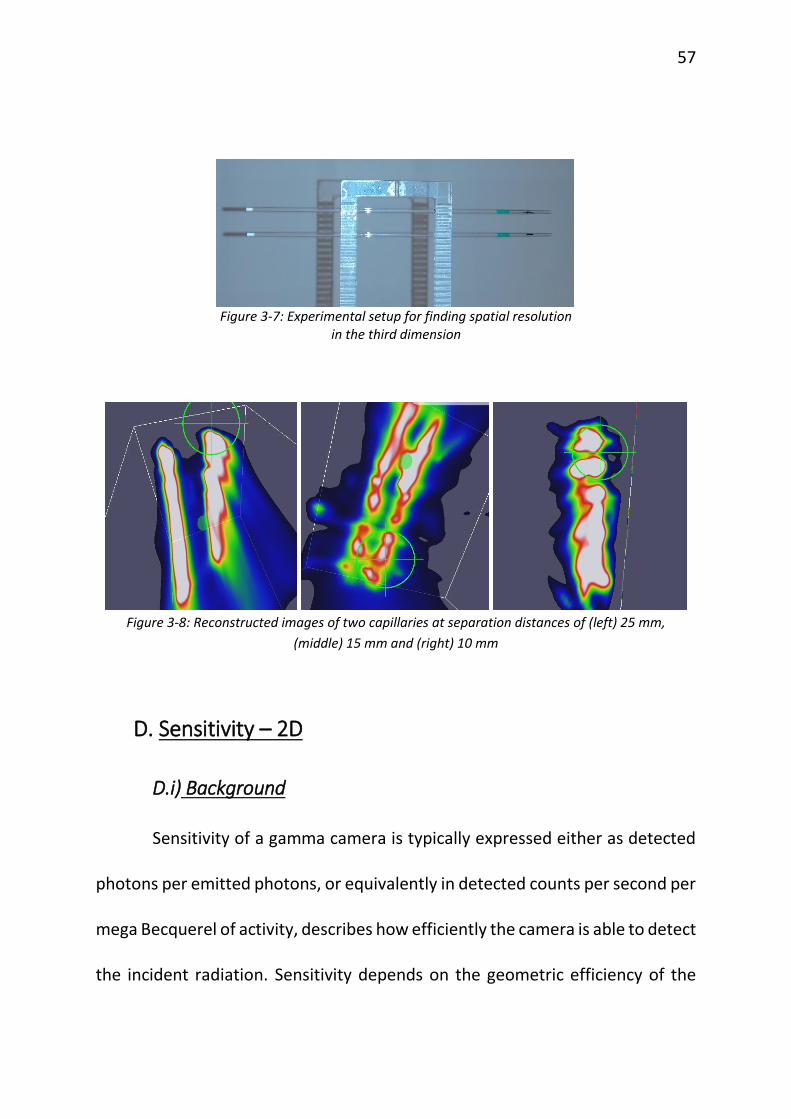
F. Depth Measurement ............................................................ 60
F.i) Background ..................................................................... 60
F.ii) Materials and Method ................................................... 61
F.iii) Result ............................................................................ 62
G. Geometric Linearity ............................................................. 63
G.i) Background .................................................................... 63
G.ii) Materials and Method................................................... 63
G.iii) Result ........................................................................... 66
H. Quantification of the Activity ............................................... 67
H.i) Background .................................................................... 67
H.ii) Materials and Method ................................................... 68
H.iii) Result ........................................................................... 68
I. Attenuation Correction .......................................................... 70
I.i) Background ..................................................................... 70
I.ii) Materials and Method .................................................... 71
I.iii) Result ............................................................................. 72
J. Effect of Injection Site ........................................................... 76

xi
J.i) Background ..................................................................... 76
J.ii) Materials and Method .................................................... 76
J.iii) Result ............................................................................ 78
Chapter 4 ............................................................................................ 81
Conclusion ........................................................................................ 81
Chapter 5 ............................................................................................ 84
Future Work ..................................................................................... 84
Reference ............................................................................................. 86

xii
TABLE OF FIGURES
FIGURE 1-1: METASTASIS VIA BLOOD AND LYMPH SYSTEM .................................................................................. 2
FIGURE 1-2: SCHEMATIC DIAGRAM OF SENTINEL LYMPH NODE BIOPSY IN THE CASE OF BREAST CANCER ......... 6
FIGURE 1-3: FUNCTIONAL IMAGE OF BRAIN .......................................................................................................... 7
FIGURE 1-4: COMPONENTS OF A GAMMA CAMERA .............................................................................................. 8
FIGURE 1-5: (LEFT) DIFFERENT TYPES OF COLLIMATORS; (RIGHT) ILLUSTRATION OF LIGHT ENERGY
PRODUCTION BY SCINTILLATORS WHEN EXCITED WITH IONIZING RADIATION.......................................... 9
FIGURE 1-6: PMT ARRAY ....................................................................................................................................... 10
FIGURE 1-7: A GENERAL ELECTRIC CT SCANNER; THE INTERNAL COMPONENTS OF A CT SCANNER ................... 14
FIGURE 1-8: A) RANDOM ALIGNMENT OF HYDROGEN NUCLEI IN THE ABSENCE OF AN EXTERNAL MAGNETIC
FIELD. B) IN THE PRESENCE OF STRONG MAGNETIC FIELD B1, THE NUCLEI PRECESS IN THE DIRECTION OF
THE FIELD ................................................................................................................................................... 15
FIGURE 1-9: IMAGES OBTAINED USING MRI MODALITY ...................................................................................... 16
FIGURE 1-10: SIMULTANEOUS, NIR FLUORESCENT PAN-LYMPH NODE MAPPING AND SENTINEL LYMPH NODE
MAPPING IN SWINE ................................................................................................................................... 21
FIGURE 1-11:(LEFT) REPRESENTATION OF AN ULTRASOUND SYSTEM;(RIGHT) INTERNAL PARTS OF A
TRANSDUCER ............................................................................................................................................. 22
FIGURE 1-12: (LEFT) ULTRASOUND SHOWING A SUSPICIOUS LYMPH NODE IN A WOMEN WITH BREAST
CANCER; (RIGHT) ULTRASOUND OF A BENIGN MASS IN BREAST .............................................................. 24
FIGURE 2-1: A. PHOTO OF THE CAMERA AND CONTROL COMPUTER USED IN THE STUDY OF REFERENCE [44];
B. THE DETECTOR ALONE; C. CONVENTIONAL LARGE FOV ANGER CAMERA IMAGE SHOWING A SINGLE
NODE (SOLID ARROW) AND THE INJECTION SITE (DASHED ARROW); D. SGC IMAGE CORRECTLY
SHOWING 3 SNS (SOLID ARROWS) ............................................................................................................ 31
FIGURE 2-2: A. THE SMALL CDTE GAMMA CAMERA SYSTEM IS COMPOSED OF: DETACHABLE DETECTOR HEAD
WHICH IS MOUNTED ON THE ARTICULATING ARM, CONTROL UNIT, AND POWER SUPPLY ON THE
MOBILE CABINET; B. MINICAM II CAMERA HEAD (CDTE DETECTOR); C. (TOP) BOTTOM VIEW OF THE

xiii
MEDIPROBE HEAD, C. (BOTTOM) OPEN VIEW OF THE DISASSEMBLED MEDIPROBE COMPACT GAMMA
CAMERA HEAD WITHOUT THE LEAD SHIELD; D. MEDIPROBE MOUNTED ON AN ARTICULATING ARM
[43]. ........................................................................................................................................................... 33
FIGURE 2-3: A. THE DECLIPSESPECT SYSTEM; B. HAND HELD GAMMA CAMERA WITH THE OPTICAL TRACKING
SYSTEM; C. GAMMA PROBE WITH THE OPTICAL TRACKING SYSTEM FIXED ON TOP ................................ 36
FIGURE 2-4: THE REFERENCE TARGETS THAT MAKE UP THE OPTICAL TRACKING SYSTEM .................................. 37
FIGURE 2-5: A. CAMERA SPECIFICATIONS TOP VIEW; B. CAMERA SPECIFICATIONS SIDE VIEW; C.
ARRANGEMENT OF THE 80 SIPMS; D. RED SQUARE SHOWING 17 X 17 CRYSTAL REGION USED FOR
IMAGING. ................................................................................................................................................... 41
FIGURE 2-6: RECONSTRUCTED IMAGE OVERLAID ON THE PHANTOM ................................................................. 43
FIGURE 3-1: ENERGY SPECTRUM OF 99MTC ........................................................................................................... 47
FIGURE 3-2: ENERGY SPECTRUM .......................................................................................................................... 50
FIGURE 3-3: A. THE EXPERIMENTAL SETUP CONSISTING OF AN ANGLED CAPILLARY; B. THE IMAGE OBTAINED
FROM THE ACQUISITION DISPLAYED USING IMAGE J ............................................................................... 52
FIGURE 3-4: MEAN SPATIAL RESOLUTION 2D VS DISTANCE WITH BARS INDICATING STANDARD DEVIATION. .. 54
FIGURE 3-5: EXPERIMENTAL SET UP OF CAPILLARY TUBES FOR THE CALCULATION OF 3-D SPATIAL RESOLUTION
................................................................................................................................................................... 55
FIGURE 3-6: RECONSTRUCTED IMAGE IN BOTH POSITIONS 1 AND 2 RESPECTIVELY. .......................................... 56
FIGURE 3-7: EXPERIMENTAL SETUP FOR FINDING SPATIAL RESOLUTION IN THE THIRD DIMENSION ................. 57
FIGURE 3-8: RECONSTRUCTED IMAGES OF TWO CAPILLARIES AT SEPARATION DISTANCES OF (LEFT) 25 MM,
(MIDDLE) 15 MM AND (RIGHT) 10 MM ..................................................................................................... 57
FIGURE 3-9: CORRECTED IMAGE OF THE 10 MM DIAMETER PETRI DISH AT 100 MM FROM THE CAMERA
SURFACE .................................................................................................................................................... 59
FIGURE 3-10: PLOT OF SENSITIVITY VS ACTIVITY .................................................................................................. 60
FIGURE 3-11: PLOT ILLUSTRATING THE DISTANCE AS MEASURED BY THE SYSTEM AND THE TRUE DISTANCE FOR
16 CASES. ................................................................................................................................................... 62

xiv
FIGURE 3-12: A. REPRESENTATIVE EXPERIMENTAL SET UP FOR EVALUATING THE GEOMETRIC ACCURACY OF
THE SYSTEM; B. REAL EXPERIMENTAL SET-UP .......................................................................................... 64
FIGURE 3-13: EXPERIMENTAL SET-UP ILLUSTRATING THE DIFFERENT CAMERA LOCATIONS AND VIEWS .......... 65
FIGURE 3-14: PLOT OF RATIO OF TRUE % AND OBSERVED % VS OBSERVED % OF ACTIVITY ............................... 68
FIGURE 3-15: BLAND ALTMAN PLOT COMPARING THE TWO TECHNIQUES USED TO MEASURE THE RELATIVE
PERCENTAGE OF THE RADIOACTIVE SOURCES. ......................................................................................... 69
FIGURE 3-16: EXPERIMENTAL SETUP .................................................................................................................... 72
FIGURE 3-17: EXPERIMENTAL SETUP WITH TWO CASES TO CHECK THE EFFECT OF SCATTER ORIGINATING AT
THE INJECTION SITE; (A) WITHOUT AN INJECTION SITE; (B) WITH AN INJECTION SITE OUTSIDE THE
CAMERA’S FOV .......................................................................................................................................... 77
FIGURE 3-18: EFFECTS OF SCATTER DUE TO INJECTION SITE A. ENERGY HISTOGRAM WITH NO INJECTION SITE
PRESENT; B. ENERGY HISTOGRAM WITH INJECTION SITE PRESENT; C. NODE IMAGES WITH NO
INJECTION SITE; D. NODE IMAGES WITH INJECTION SITE PRESENT. ......................................................... 78
FIGURE 3-19: EXPERIMENTAL SETUP TO CHECK THE EFFECT OF DISTANCE OF IS FROM NODES ........................ 79
FIGURE 3-20: PLOT SHOWING THE PERCENTAGE OF SCATTER OBSERVED IN THE UNIFORMITY CORRECTED
IMAGE WITH INCREASING DISTANCE FROM THE NODES .......................................................................... 80
CHAPTER 1
INTRODUCTION
According to the National Cancer Institute, cancer is the name given to a
collection of related diseases characterized by the abnormal proliferation of
cells. These have the ability to infiltrate and destroy normal body tissues, often
times spreading and damaging other parts of the body [1], [2]. This process of
cancerous cells breaking off and travelling to distant places in the body through
the blood or the lymphatic system and forming new tumors far from the original
tumors is called metastasis, as shown in Figure 1-1. When cancer is detected at
an early stage, before it has spread, it can often be treated successfully by
surgery or local irradiation, and the patient will be cured. However, when cancer
is detected after it is known to have metastasized, treatments are much less
successful[3].
The extent of lymph node metastasis is a major determinant for the
staging and the prognosis of most human malignancies and often guides
therapeutic decisions [4], [5]. Lymph nodes are a part of the lymphatic system
which also comprises of lymph vessels and the lymphatic fluid itself. Lymph is

2
the clear fluid that travels through the lymphatic system and carries cells that
help fight infections and other diseases.
Figure 1-1: Metastasis via blood and lymph system
Reference: http://www.cancer.gov/publications/dictionaries/cancer-terms?cdrid=46710
Lymph nodes are small structures that work as filters of harmful
substances. They contain immune cells that can help fight infection by attacking
and destroying germs that are carried in through the lymph fluid [6]. Normal
lymph nodes are tiny and can be hard to find, but when there’s infection,
inflammation, or cancer, the nodes can get larger. Those near the body’s surface
often get big enough to feel with your fingers, and some can even be seen. But

3
if there are only a few cancer cells in a lymph node, it may look and feel normal.
In that case, the doctor must check for cancer by either percutaneous biopsy or
removing all or part of the lymph node [6].
Sentinel Lymph Node Biopsy (SLNB) has developed over the past decade
as a minimally invasive technique to assess regional lymph node status in
patients with malignancy. Sentinel nodes are those located nearest the tumor(s)
and thus stand sentry to the rest of the nodal basin. Hence, the cancer can
spread to the nodal basin only through the sentinel nodes. Thus SLNB, in which
sentinel nodes are identified and tested for the presence of malignant cells,
helps in assessing the extent of metastasis by removing only a small number of
nodes. This is primarily being used to diagnose breast cancer and malignant
melanoma.
SLNB is elegantly simple in concept but quite often very difficult to
perform accurately in individual patients [7]. Despite its routine role in clinical
management of cancer, it has a higher false-negative rate than is generally
recognized. In case of melanomas, an assessment of the causes of false-negative
results reported that 44% of false negatives were due to failure of radiologic or
surgical identification of one or more sentinel lymph nodes [8]. Hence efficient
diagnostic tools are vital to ensure correct detection of cancers.
4
The pre-operatively obtained images are generally used to prepare the
overall surgical strategy before actual surgical procedures. During surgical
intervention, significant changes in tissue morphology and topology can occur.
Intra-operative image guidance would provide real-time surgical guidance by
providing anatomical and functional information about the operating site. This
would provide in situ tissue structure and function characterization. Thus real
time intra-operative imaging is essential for effective navigation throughout the
surgical process [9].
I. Current SLNB Protocol
To perform a sentinel lymph node biopsy, the physician performs a
lymphoscintigraphy, wherein a low-activity radioactive tracer is injected near
the tumor. The injected substance, filtered sulfur colloid, is tagged with the
radionuclide technetium-99m. This is taken up by the lymphatic system and
travels to the sentinel nodes. The sulphur colloid is slightly acidic and causes
minor stinging. A gentle massage of the injection sites spreads the sulphur
colloid, relieving the pain and speeding up the lymph uptake. This injection is
usually done several hours or the day before the actual biopsy[10].
Another method involves the injection of a harmless blue dye in the area
near the tumor. The dye is taken up by the lymphatic system and delivered to

5
the sentinel nodes, staining them bright blue. The blue dye is typically injected
just before the surgical procedure to remove the sentinel nodes. Typically
surgeons use both the radiotracer and blue dye techniques.
The SLNB is usually performed under general anesthesia. The surgeon
begins by making a small incision in the area over the lymph nodes. A small hand-
held instrument called a gamma detector (refer to chapter 2 for more details) is
used by the surgeon to determine where the radioactivity has accumulated and
identify the sentinel nodes. The blue dye stains the sentinel nodes bright blue,
allowing the surgeon to see them. The surgeon then removes these suspicious
sentinel nodes. As mentioned above, sentinel nodes are the first tiers of lymph
nodes to receive drainage from a malignant tumor that has metastasized. There
can be multiple sentinel nodes since there can be more than one node in the
vicinity of the tumor getting direct drainage from the tumor. All these nodes are
removed and sent to a pathologist to examine under a microscope for signs of
cancer. If cancer cells are found in the nodes by the pathologist, the lymph nodes
are identified as positive lymph nodes. A negative SLNB result (sentinel lymph
nodes were devoid of cancer cells) suggests that cancer has not developed the
ability to spread to nearby lymph nodes or other organs. A positive SLNB result
indicates that cancer is present in the sentinel lymph node and may be present
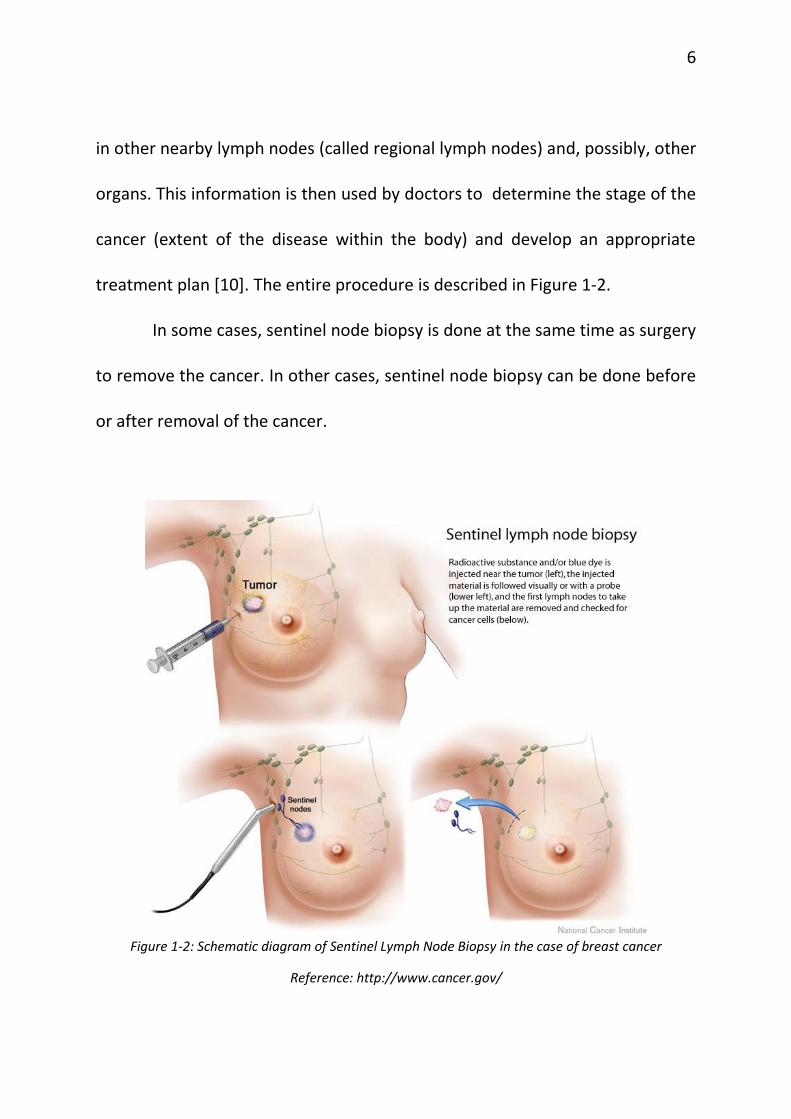
6
in other nearby lymph nodes (called regional lymph nodes) and, possibly, other
organs. This information is then used by doctors to determine the stage of the
cancer (extent of the disease within the body) and develop an appropriate
treatment plan [10]. The entire procedure is described in Figure 1-2.
In some cases, sentinel node biopsy is done at the same time as surgery
to remove the cancer. In other cases, sentinel node biopsy can be done before
or after removal of the cancer.
Figure 1-2: Schematic diagram of Sentinel Lymph Node Biopsy in the case of breast cancer
Reference: http://www.cancer.gov/

II. Intra-Operative Surgical Guidance Modalities
A. Nuclear Medicine Imaging System
A.i) Background
SLNB uses nuclear medicine imaging (lymphoscintigraphy) for pre-
surgically locating the sentinel nodes.
The National Institute of Biomedical Imaging and Bioengineering defines
nuclear medicine as a medical specialty that uses radioactive tracers
(radiopharmaceuticals) to assess bodily functions and to diagnose and treat
disease. Specially designed cameras allow doctors to track the path of these
radioactive tracers. Single Photon Emission Computed Tomography or SPECT
Figure 1-3: Functional image of Brain
Reference: https://www.nibib.nih.gov/science-education/science-topics/nuclear-medicine

8
and Positron Emission Tomography or PET scans are the two most common
imaging modalities in nuclear medicine. Figure 1-3 shows a functional image of
the brain obtained using nuclear medicine technology. In this thesis, I will be
focusing on SPECT specifically [11].
The specially designed camera in the case of SPECT is called a gamma
camera. The internal components that make up the camera as shown in Figure
1-4 are:
1. Collimator
2. Detector crystal
3. Photomultiplier tube array
4. Position logic circuit
Figure 1-4: Components of a gamma camera
Reference: http://199.116.233.101/index.php/Instrumentation_SPECT

9
Collimators use high-attenuation materials such as lead or tungsten to
permit only gamma incident in certain directions to reach the crystal. Apertures
(holes) in the collimator define the allowed incidence direction. These apertures
can be parallel to each other, converging or diverging providing parallel hole,
magnifying (converging) or minifying (diverging) collimators respectively. Refer
to Figure 1-5. The parallel hole collimator is the collimator type most often used
in either 2-D or 3-D single photon imaging. A parallel hole collimator permits
only those gamma rays that are incident in a direction parallel to the hole axes
to pass through.
Figure 1-5: (Left) Different types of collimators; (Right) Illustration of light energy production by scintillators when excited with ionizing radiation.
Reference:http://oftankonyv.reak.bme.hu/tikiindex.php?page=Collimators; http://www.slideshare.net/bohammarlund/scintx
10
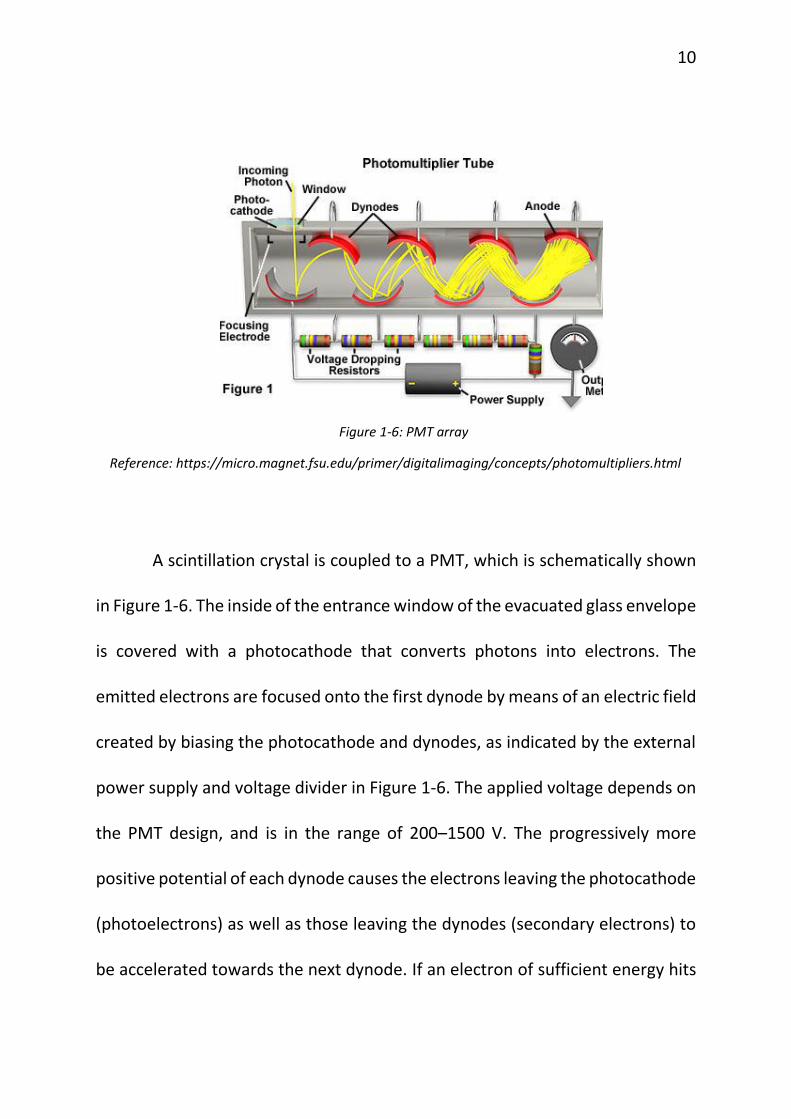
A scintillation crystal is coupled to a PMT, which is schematically shown
in Figure 1-6. The inside of the entrance window of the evacuated glass envelope
is covered with a photocathode that converts photons into electrons. The
emitted electrons are focused onto the first dynode by means of an electric field
created by biasing the photocathode and dynodes, as indicated by the external
power supply and voltage divider in Figure 1-6. The applied voltage depends on
the PMT design, and is in the range of 200–1500 V. The progressively more
positive potential of each dynode causes the electrons leaving the photocathode
(photoelectrons) as well as those leaving the dynodes (secondary electrons) to
be accelerated towards the next dynode. If an electron of sufficient energy hits
Figure 1-6: PMT array
Reference: https://micro.magnet.fsu.edu/primer/digitalimaging/concepts/photomultipliers.html
11
a dynode, electrons are released by secondary emission. Typical dynode
materials are BeO–Cu, Cs3Sb and GaP:Cs, which exhibit high secondary emission
properties. These electrons are then accelerated and focused onto the next
dynode and secondary electrons are emitted, etc. The number of dynodes n is
in the range of 8–12. The signal is obtained from the last electrode, the anode.
PMT electron gains of up to 106–107 are obtained [12]. The size of the charge
pulse arriving at the anode is proportional to the number of light photons
incident on the photocathode.
In a conventional gamma camera as shown in Figure 1-4 the light
photons originating from the point of gamma ray absorption in the crystal
spread out from the absorption point so that light is detected by multiple PMTs.
By connecting the anodes of the camera’s PMTs together using Anger circuitry
the centroid of the light pulse can be determined to a much greater degree of
precision than the PMT spacing. The sum of the charge from all PMTs is
proportional to the amount of energy deposited in the crystal by the gamma ray
[13]. Clinical trial results using gamma camera is discussed below in chapter 2.
12
B. Computed Tomography (CT)
B.i) Background
Computed tomography (CT) as defined by the National Cancer Institute
is an imaging procedure that uses special x-ray equipment to create detailed
pictures, or scans, of areas inside the body [14], [15].
As described by the National Institute of Biomedical Imaging and
Bioengineering, CT scanner consists a motorized x-ray source that rotates
around the circular opening of a donut-shaped structure called a gantry. During
a CT scan, the patient lies on a bed that slowly moves through the gantry while
the x-ray tube rotates around the patient, shooting narrow beams of x-
rays through the body. CT scanners use special digital x-ray detectors, which are
located directly opposite the x-ray source. As the x-rays pass through and leave
the patient, they are picked up by the detectors and transmitted to a computer.
After one full rotation of the x-ray source, the CT computer uses
sophisticated mathematical techniques to construct a 2D image slice of the
patient. The thickness of the tissue represented in each image slice usually
ranges from 1-10 millimeters. When a full slice is completed, the image is stored
and the motorized bed is moved forward incrementally into the gantry. The x-
ray scanning process is then repeated to produce another image slice. This

13
process continues until the desired number of slices is collected. These Image
slices can either be displayed individually or stacked together by the computer
to generate a 3D image of the patient that shows the skeleton, organs, and
tissues as well as any abnormalities the physician is trying to identify [15]. A CT
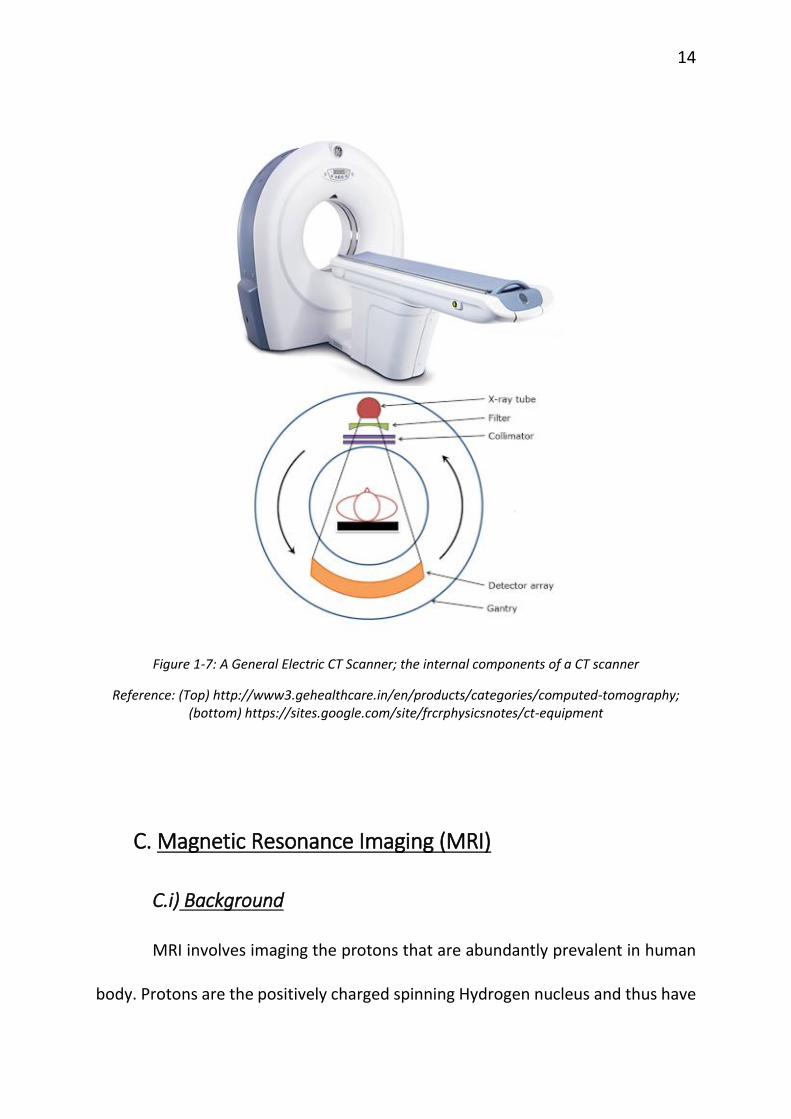
system and its internal structure of CT are shown in Figure 1-7.
B.ii) Clinical Study Results
CT in conjunction with Single Photon Emission Tomography (SPECT) or
SPECT/CT combination is a new tool which has potential application in sentinel
node imaging. This dual modality provides complementary functional and
anatomical information and thus is superior to planar imaging [16]. Images from
each modality can be fused or used separately.
Wagner et al. describes the advantages of using such a combination.
These include improved anatomical localization of sentinel lymph nodes and
alteration in the surgical approach, identification of false positive planar findings
of hot nodes and better detection rates of sentinel lymph nodes due to better
spatial resolution [16]. Valdes et al and other studies also provide similar result
[17].
14
Figure 1-7: A General Electric CT Scanner; the internal components of a CT scanner
Reference: (Top) http://www3.gehealthcare.in/en/products/categories/computed-tomography; (bottom) https://sites.google.com/site/frcrphysicsnotes/ct-equipment
C. Magnetic Resonance Imaging (MRI)
C.i) Background
MRI involves imaging the protons that are abundantly prevalent in human
body. Protons are the positively charged spinning Hydrogen nucleus and thus have
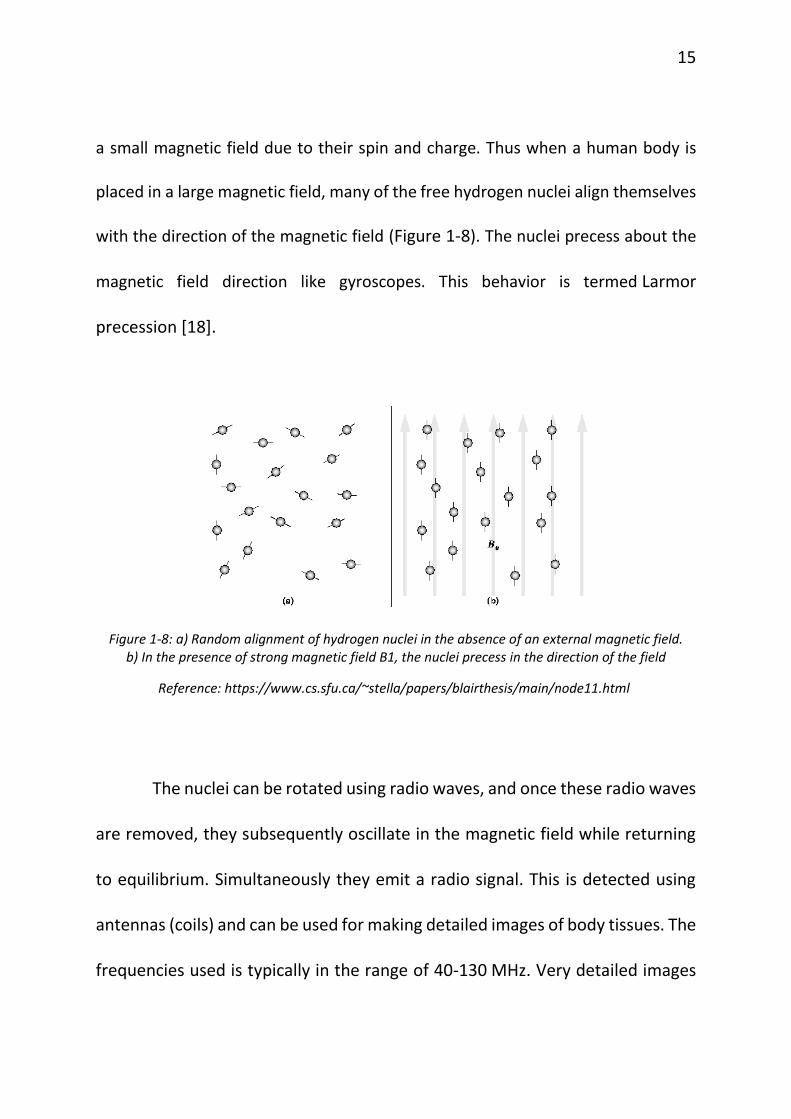
15
a small magnetic field due to their spin and charge. Thus when a human body is
placed in a large magnetic field, many of the free hydrogen nuclei align themselves
with the direction of the magnetic field (Figure 1-8). The nuclei precess about the
magnetic field direction like gyroscopes. This behavior is termed Larmor
precession [18].
Figure 1-8: a) Random alignment of hydrogen nuclei in the absence of an external magnetic field. b) In the presence of strong magnetic field B1, the nuclei precess in the direction of the field
Reference: https://www.cs.sfu.ca/~stella/papers/blairthesis/main/node11.html
The nuclei can be rotated using radio waves, and once these radio waves
are removed, they subsequently oscillate in the magnetic field while returning
to equilibrium. Simultaneously they emit a radio signal. This is detected using
antennas (coils) and can be used for making detailed images of body tissues. The
frequencies used is typically in the range of 40-130 MHz. Very detailed images
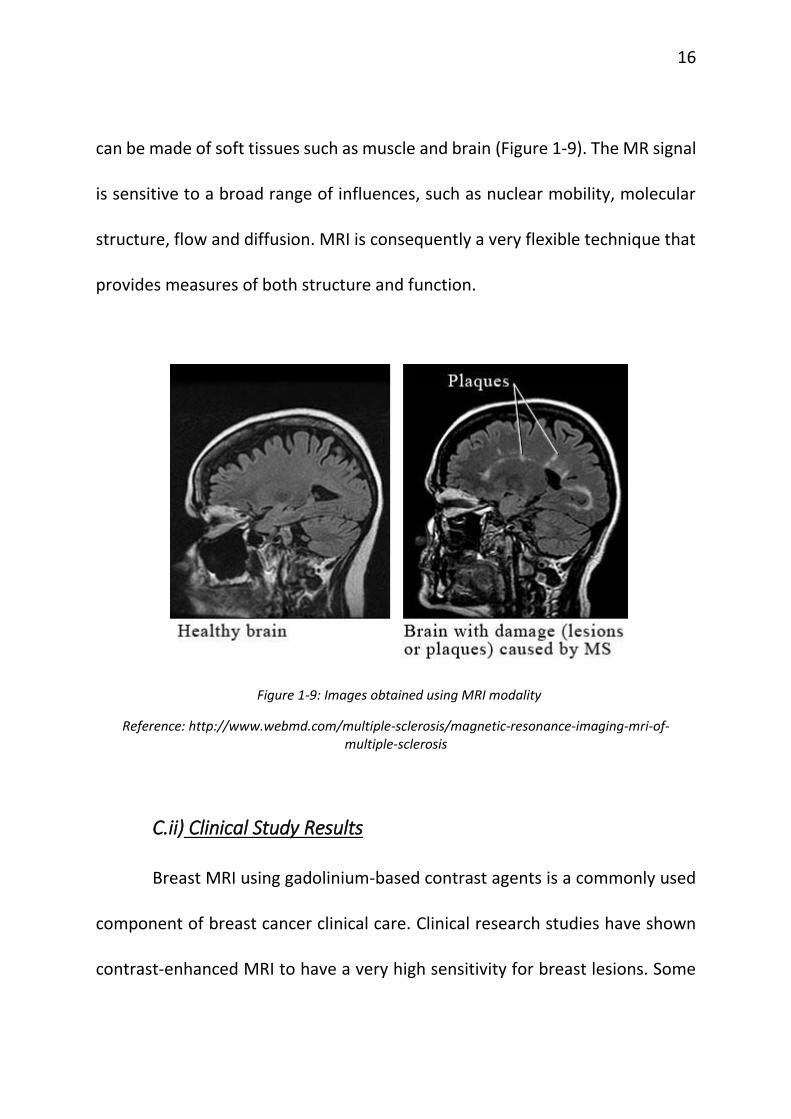
16
can be made of soft tissues such as muscle and brain (Figure 1-9). The MR signal
is sensitive to a broad range of influences, such as nuclear mobility, molecular
structure, flow and diffusion. MRI is consequently a very flexible technique that
provides measures of both structure and function.
Figure 1-9: Images obtained using MRI modality
Reference: http://www.webmd.com/multiple-sclerosis/magnetic-resonance-imaging-mri-of-multiple-sclerosis
C.ii) Clinical Study Results
Breast MRI using gadolinium-based contrast agents is a commonly used
component of breast cancer clinical care. Clinical research studies have shown
contrast-enhanced MRI to have a very high sensitivity for breast lesions. Some
17
lesions are, even in retrospect, not detectable in mammographic x-ray or breast
ultrasound images but are detectable via MRI. MRI breast imaging as a guide in
interventional procedures such as interstitial laser therapy (ILT), radiofrequency
ablation (RFA), high-intensity focused ultrasound (HIFU), microwave ablation
therapy, and cryotherapy is also being studied [19].
Another very recent study was conducted by Li et al. to evaluate
magnetic resonance lymphography with a gadolinium-based contrast agent (Gd-
MRL) in sentinel lymph node identification in patients with breast cancer. Sixty
patients (mean age: 46.2 ± 8.8 years) with stage T1- 2 breast cancer and clinically
negative axillary lymph nodes participated in this study. After 0.9 ml of contrast
material and 0.1 ml of mepivacaine hydrochloride 1% were mixed and injected
intradermally into the upper-outer periareolar areas, axillary lymph flow was
tracked and sentinel lymph nodes were identified by Gadolinium based
Magnetic Resonance Lymphography (Gd-MRL).
With Gd-MRL, the lymph vessels from the injection site to the axilla were
stained. The SLN was defined as the first lymph node visualized on the lymph
vessel draining directly from the injection site. In some patients, more than one
lymphatic vessel drained directly from the injection site. In these patients, the
first visualized lymph node along each lymphatic vessel draining directly from
18
the injection site was considered a sentinel node. This was followed by marking
the sentinel nodes using a skin marker method.
SLN biopsy and/or surgery was then performed and the efficacy of SLN
identification and consequently metastasis detection of Gd-MRL were examined
by the histopathologic evaluations of the resected lymph node. If the lymph
nodes were positive for lymph nodes, metastasis was established. Using blue
dye-guided methods as the gold standard, the sensitivity of Gd-MRL was 95.65%
and the false-negative rate was 4.3% for axillary lymphatic metastasis detection
[20].
The various studies conducted by different research groups indicate that
MRI as a diagnostic tool for excluding axillary lymph node metastases and can
potentially replacing SLNB. The diagnostic performance of some MRI protocols
approaches the negative predictive value (NPV) needed to replace SLNB.
However, current observations are based on studies with heterogeneous study
designs and limited population [21]. Another study indicates that sentinel nodes
can be detected accurately by a combination of SLNB and MRI guided lymph
node sampling [22]. Thus this approach needs to be studied more before coming
to a concrete conclusion.
19
D. Fluorescence Molecular Imaging (FMI)
D.i) Background
Fluorescence molecular imaging (FMI) is a powerful tool that can be used
for precise guidance and localization of malignant tissues intraoperatively. In
FMI an optical imaging system is used intraoperatively to help surgeons
distinguish between normal and malignant tissues following the injection of an
agent labeled with a fluorescent compound [23]. In most cases the fluorophore
emits in the near infrared (NIR) and is also excited with NIR light. NIR excitation
and emission permits much deeper tracer visualization compared with tracers
labeled with visible fluorophores because of the superior tissue penetration of
NIR light (wavelengths between ~700 nm and 1200 nm) compared to visible
light. The use of NIR excitation also has the advantage of reducing tissue auto-
fluorescence compared to that present with shorter wavelength light excitation.
Once the fluorescent agent is injected, a surgical navigation system is
required to activate the NIR fluorophore by illumination with NIR light. Video
rate images using a NIR-sensitive camera are provided by the system for surgical
guidance, typically after fast image registration of the NIR image with a
conventional visible light image. These techniques have been demonstrated to
be effective for providing surgeons with precise tumor detection in real-time
20
during surgery. Current studies suggest that FMI technology can assist surgeons
in resecting micro-cancer tissues down to the submillimeter size, thus improving
patient outcome [23], [24].
D.ii) Clinical Study Results
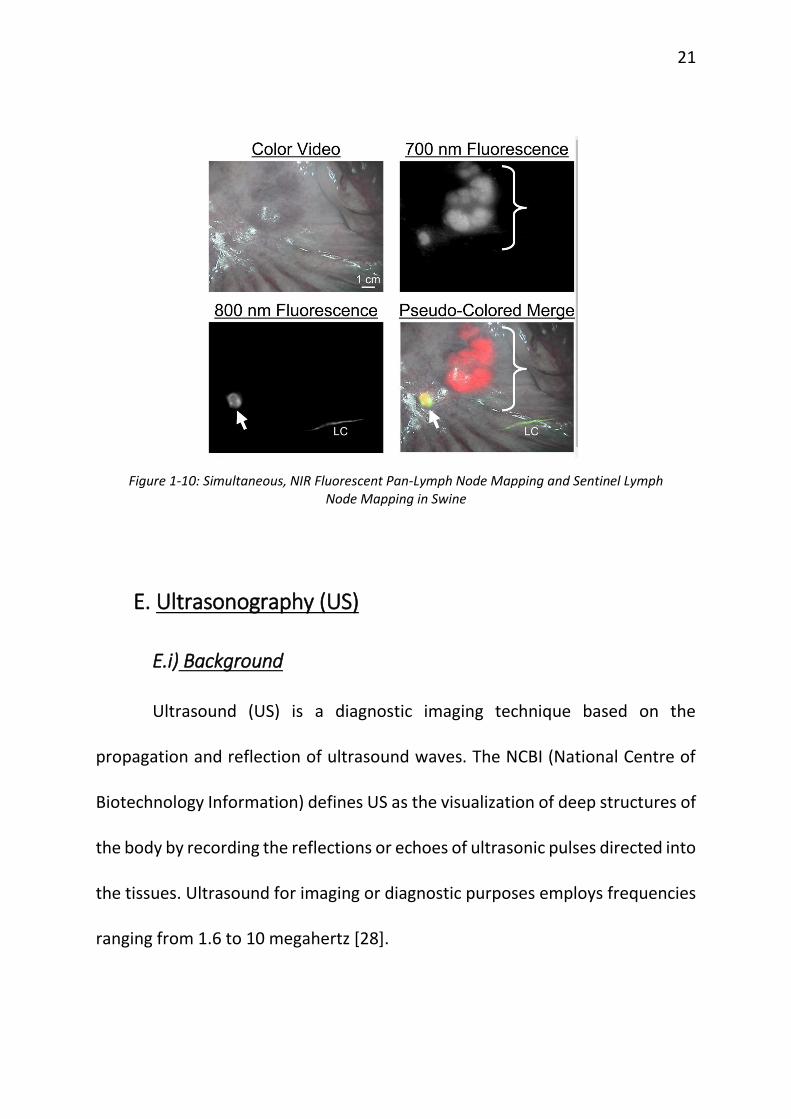
Khullar et al. developed the Fluorescence-Assisted Resection and
Exploration (FLARE™) system which utilizes NIR light-emitting diode (LED)
excitation, instead of a potentially harmful laser. It has the advantage of being
able to provide simultaneous color imaging, NIR fluorescence imaging, and
color-NIR merged images, allowing the surgeon to simultaneously visualize
invisible NIR fluorescence images within the context of surgical anatomy,
illustrated in Figure 1-10 [25].
Troyan et al. discusses the successful clinical translation of a new NIR
fluorescence imaging system for image-guided oncologic surgery [26]. Ngyuen
et al. discusses the use of fluorescently labelled markers for intra-operative
surgical molecular navigation to display tumors and nerves in real time. This
allows more complete tumour resection while preserving important structures
around the tumour [27].
21
Figure 1-10: Simultaneous, NIR Fluorescent Pan-Lymph Node Mapping and Sentinel Lymph Node Mapping in Swine
E. Ultrasonography (US)
E.i) Background
Ultrasound (US) is a diagnostic imaging technique based on the
propagation and reflection of ultrasound waves. The NCBI (National Centre of
Biotechnology Information) defines US as the visualization of deep structures of
the body by recording the reflections or echoes of ultrasonic pulses directed into
the tissues. Ultrasound for imaging or diagnostic purposes employs frequencies
ranging from 1.6 to 10 megahertz [28].
22
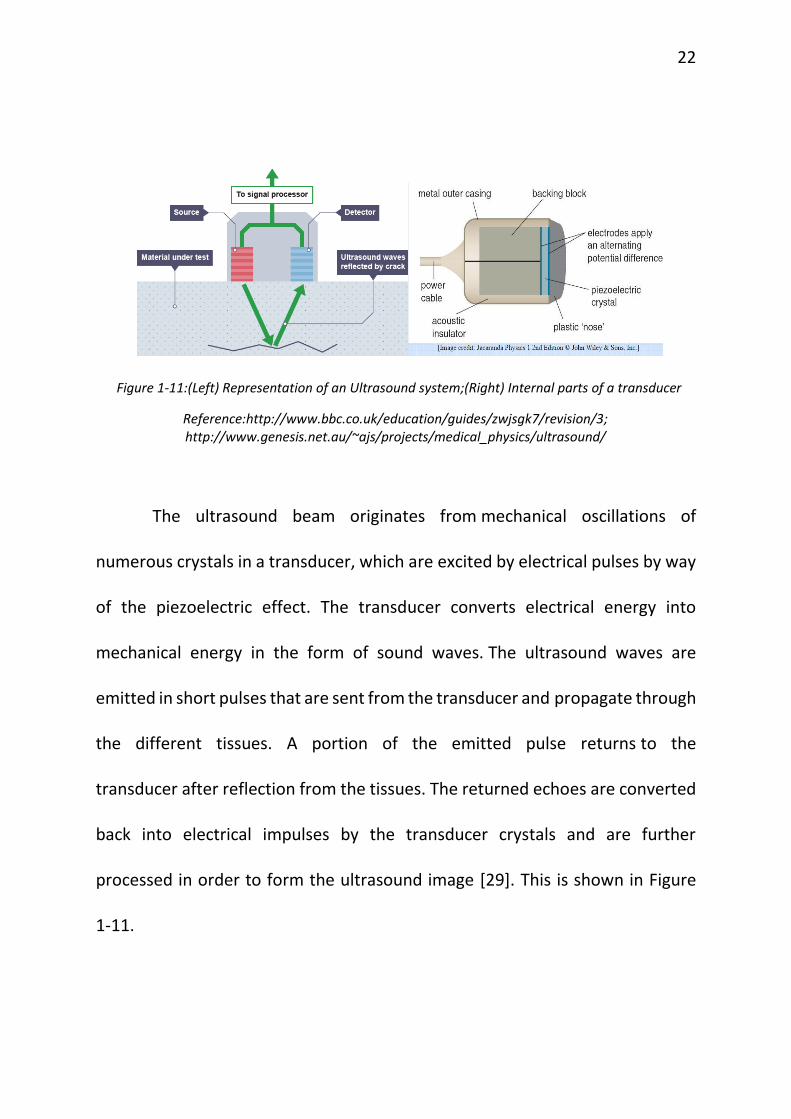
The ultrasound beam originates from mechanical oscillations of
numerous crystals in a transducer, which are excited by electrical pulses by way
of the piezoelectric effect. The transducer converts electrical energy into
mechanical energy in the form of sound waves. The ultrasound waves are
emitted in short pulses that are sent from the transducer and propagate through
the different tissues. A portion of the emitted pulse returns to the
transducer after reflection from the tissues. The returned echoes are converted
back into electrical impulses by the transducer crystals and are further
processed in order to form the ultrasound image [29]. This is shown in Figure
1-11.
Figure 1-11:(Left) Representation of an Ultrasound system;(Right) Internal parts of a transducer
Reference:http://www.bbc.co.uk/education/guides/zwjsgk7/revision/3; http://www.genesis.net.au/~ajs/projects/medical_physics/ultrasound/

23
E.ii) Clinical Study Results
Ultrasound images of a suspicious lymph node and a benign mass in the
human breast is shown in Figure 1-12. Axillary US in case of breast cancer
metastasis provides with identification of the lymph nodes, assessment of even
the smallest nodes, and in-depth evaluation of node morphology. In US, the
images of the nodes are generally assessed for size, shape, visibility and
morphology of the hilum (depression on the surface of lymph nodes through
which blood vessels enter and leave the node), vascularity, and focal cortical
thickening [30].
Nori et al. studied the preoperative diagnostic accuracy of axillary US.
Two shape parameters were considered: the ratio between longitudinal
diameter and transverse diameter (L/T ratio), which is ≥2 in normal lymph
nodes, and the ratio between hilum diameter (H) and longitudinal diameter (L)
of the lymph node (H/L ratio), normal lymph nodes being considered those with
a hilum diameter ≥50% of the overall longitudinal diameter (H/L ratio ≥50%).
Metastatic nodes tend to have globular morphology (L/T ratio = 1) and
compression or disappearance of the hilum (H/L ratio <50%).

24
Figure 1-12: (Left) Ultrasound showing a suspicious lymph node in a women with breast cancer; (Right) Ultrasound of a benign mass in breast
Reference: https://www2.mdanderson.org/depts/oncolog/articles/13/10-oct/10-13-1.html; http://oncozine.com/profiles/blogs/annual-screening-with-breast
The sonographic criteria considered suspicious for malignancy included:
(1) globular morphology and/or H/L ratio less than 50%; (2) disappearance of
hilum fat hyper-echogenicity (increased echo response due to fat deposits); and
(3) eccentric focal thickening and denting of the cortex (outer layer of node). The
final histologic results concerning lymph nodal involvement were compared
with the preoperative axillary node status as assessed by US. Sensitivity and
specificity of axillary US alone in the detection of metastatic nodes were 45.2%
and 86.6% respectively, and positive predictive value (PPV) and negative
predictive value (NPV) were 61.3% and 77.2%, respectively. Overall accuracy
was 73.5% [30].

25
Sever et al. intra-dermally injected microbubbles which act as US
reflectors, to identify and localize SLNs preoperatively by contrast-enhanced
sonography in patients with breast cancer. The microbubble contrast agent
readily enters breast lymphatic channels, passing into the draining SLN, and are
clearly visualized by contrast-enhanced ultrasound. SLNs were identified
successfully before surgery in 89% of patients [31].
III. Drawbacks
The standard of care used in the United States during SLNB requires the
use of (99m) Tc-labeled colloid, 1% isosulfan blue dye, or both to trace the
lymphatic drainage of a given neoplasm. Studies have found adverse reactions
to injection of isosulfan blue dye during sentinel lymph node mapping in breast
cancer [32]. Also, SLNB in women diagnosed with clinically node-positive breast
cancer after neoadjuvant chemotherapy proved to have higher false-negative
rate, varying from 7% to 25% [33], [34]. A meta-analysis carried out to evaluate
the significance of false negative rate (FNR) of sentinel lymph node biopsy in
patients with breast cancer concludes that blue dye alone method has the
highest FNR. This can be significantly lowered to 5% to 10% using radiotracer
along with the blue dyes to detect the sentinel nodes [35], [36]. But
intraoperative external gamma probe counting requires some skill for accurate
26
identification of the SLN. Also, the lack of being able to visualize the pre-incision
anatomical relationship between tumor, lymph vessels, and SLNs when using
this combination limits the surgeon’s ability to decide as to where to place the
surgical incision [20].
The disadvantage with CT involves greater exposure to radiation while
imaging the patients. It is difficult to identify very small sentinel lymph nodes of
the order of 2-3 mm using this technique. There can be potential false positive
results from lymph node calcifications as well [37]. Relative changes in lymph
node position before and during surgery might make CT lymphography less
effective, especially for the SLN located deep in the fatty axilla [38].
MR imaging has limited resolution and cannot reliably detect micro-
metastases in lymph nodes. In Gd-MRL, the intradermal toxicity or tolerance of
the Gd based contrast agent needs future investigation [20]. Current
observations are based on studies with heterogeneous study designs and limited
population. MRI based on diffusion weighted imaging has disadvantages of high
sensitivity to motion artefacts, limited spatial resolution and more pronounced
artefacts at higher field strengths [21]. Thus this approach needs to be studied
more before coming to a concrete conclusion.
27
In case of FMI, fluorescence imaging contrast agents with better
targeting properties need to be approved for clinical use by the Food and Drug
Administration (FDA). The fluorescent dye indocyanine green (ICG) obtained
approval and has been applied to sentinel lymph node (SLN) mapping and
hepatic micro-metastases detection. However, ICG lacks precise targeting
properties. ICG is not highly tumor-selective and has difficulty detecting
neoplastic lesions with high sensitivity and specificity [39]. Thus, more effective
contrast agents need to be designed and approved by FDA for the advancement
of this modality. Another disadvantage is this modality’s poor depth dependent
resolution [40].
The main disadvantages of US are its poor spatial resolution, the large
size of the microbubble and hence its slower rate of uptake, its limited use in
the thorax, and its dependence on operator experience [41].
CHAPTER 2
NON-IMMAGING GAMMA PROBES AND SMALL GAMMA CAMERAS
I. Introduction
Radio-guided surgery using a non-imaging gamma probe is an
established practice and has been widely introduced in sentinel lymph node
biopsies (SLNBs). The procedure provides surgeons with enhanced capabilities
for accurate identification of sentinel lymph nodes, and importantly permits
during-surgery histological determination of whether or not sentinel nodes
contain malignant cells. If the sentinel nodes in a given nodal basin are
determined to be negative, then the probability of other positive nodes in that
basin is very low and further removal of nodes can be avoided. The introduction
of the SLNB procedure in breast cancer has greatly reduced the post-surgical
morbidity associated with radical lymph node dissection and has been
demonstrated to provide similar outcomes [42].
The non-imaging gamma probe is a well-established tool frequently used
in cancer management. It measures the radiation emitted by a radionuclide and
gives an audio output whose frequency increases with increasing gamma
29
counting rate. These are particularly used in tumor localization to detect radio-
markers pre-operatively implanted in tumors and also to detect sentinel lymph
nodes following injection of a radiolabeled colloidal compound designed to
become trapped in the nodes.
In conventional SLNB, pre-surgical lymphoscintigraphy is performed
using a large field of view (FOV) gamma camera as described in Chapter 1.
Imaging takes place after the tracer is injected near the tumor, allowing
sufficient time for drainage to the nearby nodes. Then either later that day or
on the following morning, following pre-surgical review of the
lymphoscintigraphic images, a non-imaging gamma probe is used intra-
operatively to locate and excise the sentinel nodes. Intraoperative use of the
gamma probe, following inspection of the well trained teams to remove the
sentinel node(s) in about 10 minutes [43], [44].
However, a gamma probe can only provide count rate display and
variable-pitch audio output based on the local activity concentration. In
addition, SLN detection with both the large FOV camera and gamma probe (GP)
can be incomplete. The false negative rate in SLNB is reported to be 5% to 10%
[35], [36]. It is possible that such performance can be improved upon and the
process simplified by using technology that will allow intraoperative

30
visualization of the activity distribution in the anatomic region of interest. For
these reasons research has been undertaken to develop intraoperative imaging
tools that can be used in the operating theatres to help the surgeons[43], [44].
II. Contemporary Small Gamma Cameras (SGC)
SGCs have been used for sentinel lymph node imaging and in acquiring
biopsies of different types of cancer: breast cancer[45]–[47], gastrointestinal
cancer [48], laryngeal cancer[7], oral cancer[49], [50], prostate cancer[51], renal
cell carcinoma[52], testicular cancer[52], [53], malignant melanoma[50], [54],
and gynecologic cancer [55].
Scopinaro et al. developed a small gamma camera (SGC) with 1 inch
square field of view (FOV) [44]. The initial evaluation study aimed at
demonstrating that intra-operative detection and surgical removal of mammary
SLNs is quicker and more accurate when using the SGC and GP (gamma probe)
together than when using the GP only. The study enrolled 120 consecutive
patients with T1 breast cancer of the superior lateral breast quarter and clinically
negative nodes, who had been scheduled for breast conserving surgery with SLN
biopsy.

31
The SGC used for the study was a portable high resolution camera
especially designed for radio-guided surgery. Its detector weighs about 1 kg and
can be handheld during the operation. It is composed of a pure tungsten
collimator with CsI(Tl) crystals inserted into its holes, a 1 in2 FOV position
sensitive photomultiplier tube (PSPMT), homemade readout electronics
followed by ADCs, and a notebook computer serving as the acquisition console,
display, archive, and data processor for image revision. The spatial resolution
was calculated to be 3 mm at 1 cm distance from the source with an energy
window of 10% centered at the 140-keV peak.
a. b.
c. d.
Figure 2-1: a. Photo of the camera and control computer used in the study of reference [44]; b. the detector alone; c. conventional large FOV Anger camera image showing a single node (solid arrow)
and the injection site (dashed arrow); d. SGC image correctly showing 3 SNs (solid arrows)
32
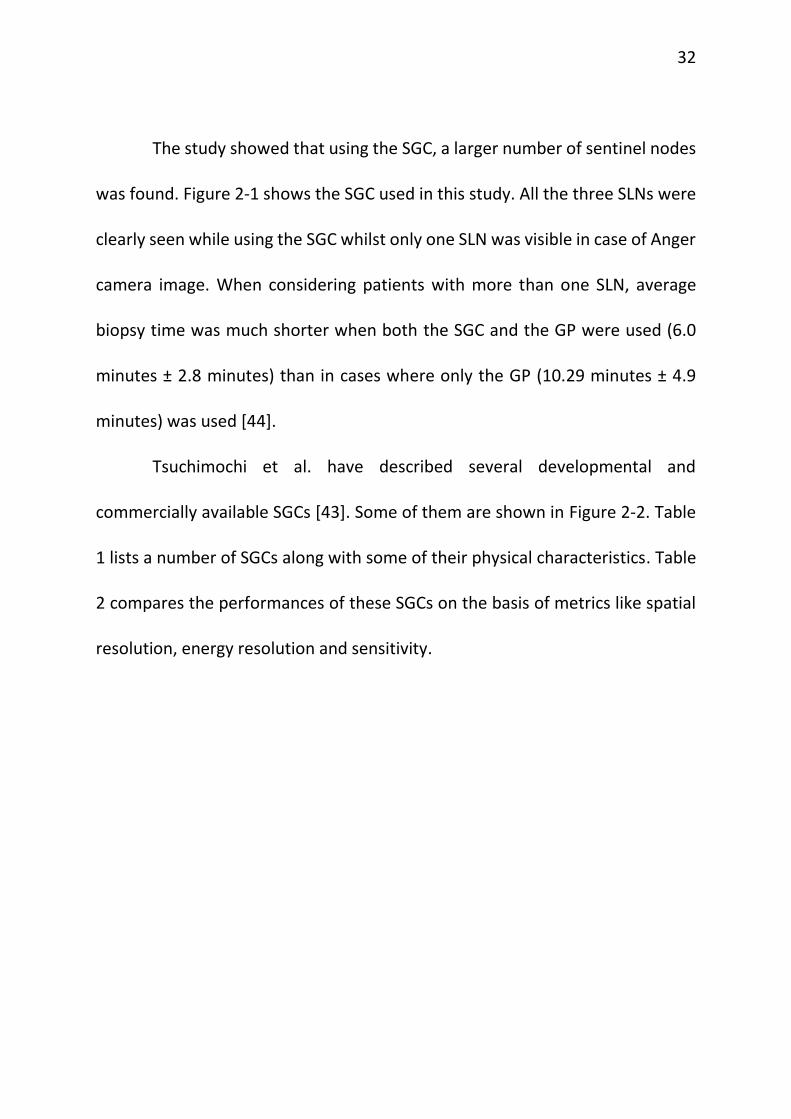
The study showed that using the SGC, a larger number of sentinel nodes
was found. Figure 2-1 shows the SGC used in this study. All the three SLNs were
clearly seen while using the SGC whilst only one SLN was visible in case of Anger
camera image. When considering patients with more than one SLN, average
biopsy time was much shorter when both the SGC and the GP were used (6.0
minutes ± 2.8 minutes) than in cases where only the GP (10.29 minutes ± 4.9
minutes) was used [44].
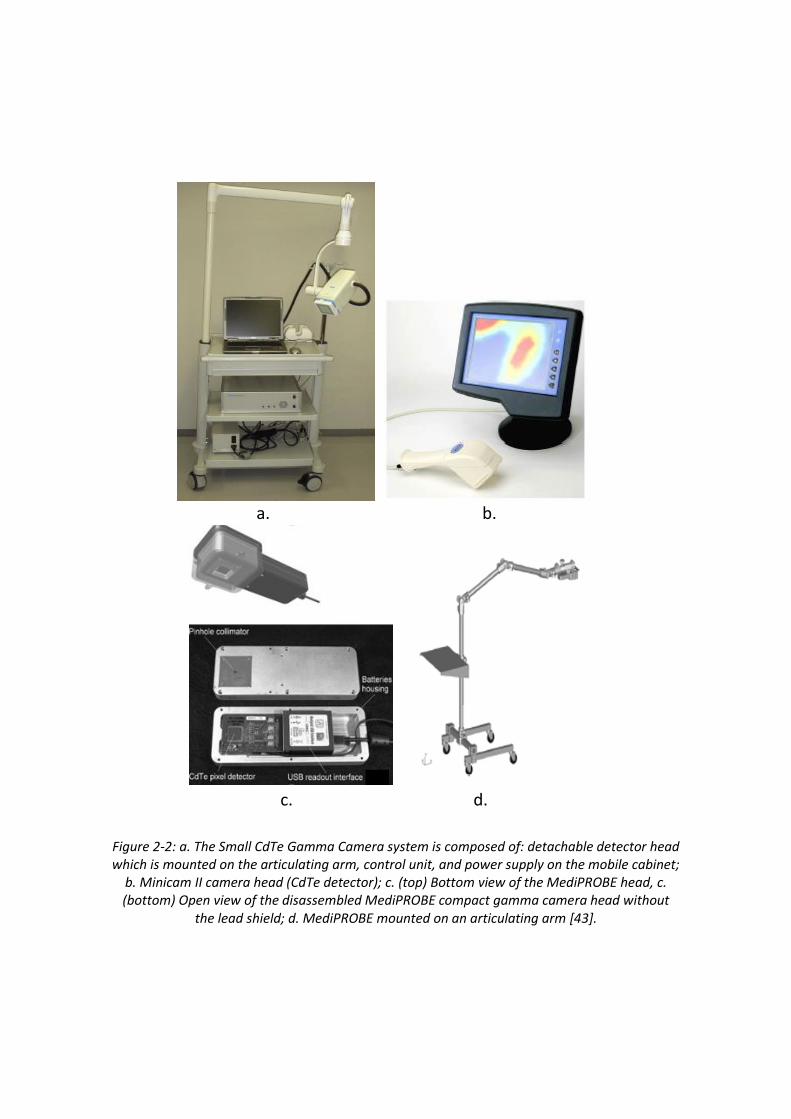
Tsuchimochi et al. have described several developmental and
commercially available SGCs [43]. Some of them are shown in Figure 2-2. Table
1 lists a number of SGCs along with some of their physical characteristics. Table
2 compares the performances of these SGCs on the basis of metrics like spatial
resolution, energy resolution and sensitivity.
a. b.
c. d.
Figure 2-2: a. The Small CdTe Gamma Camera system is composed of: detachable detector head which is mounted on the articulating arm, control unit, and power supply on the mobile cabinet;
b. Minicam II camera head (CdTe detector); c. (top) Bottom view of the MediPROBE head, c. (bottom) Open view of the disassembled MediPROBE compact gamma camera head without
the lead shield; d. MediPROBE mounted on an articulating arm [43].

Table 1: Characteristics of small gamma cameras [43]
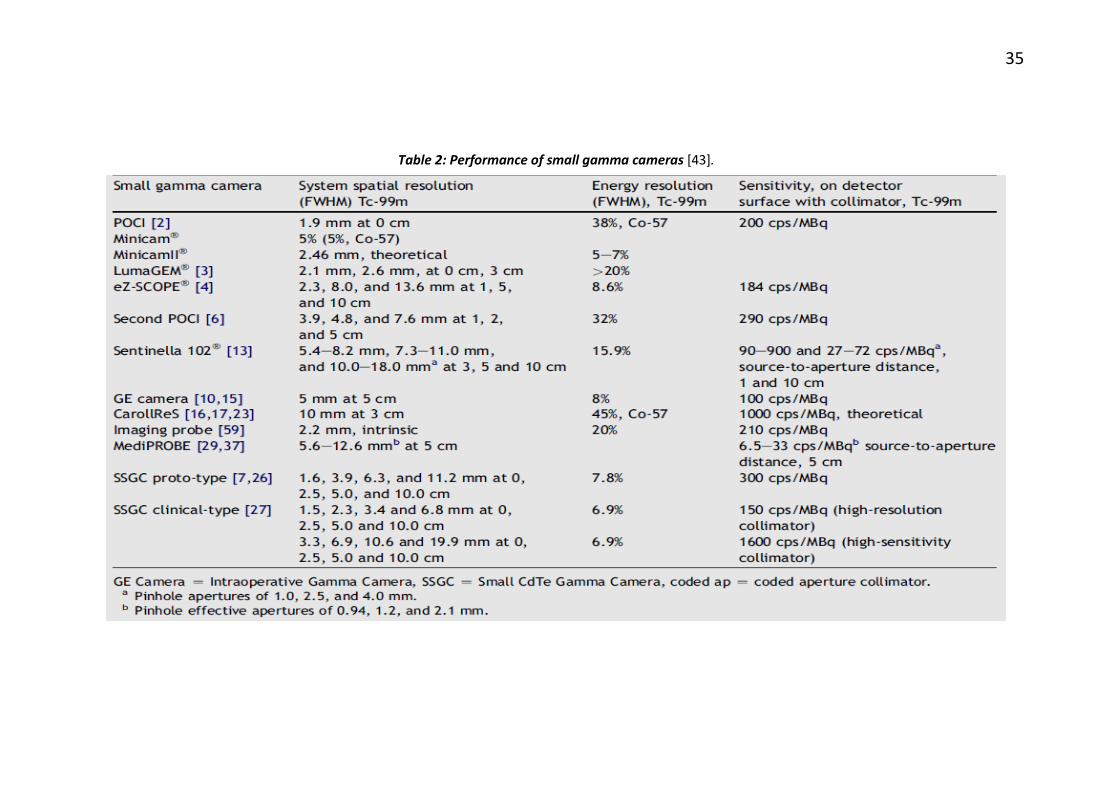
35
Table 2: Performance of small gamma cameras [43].
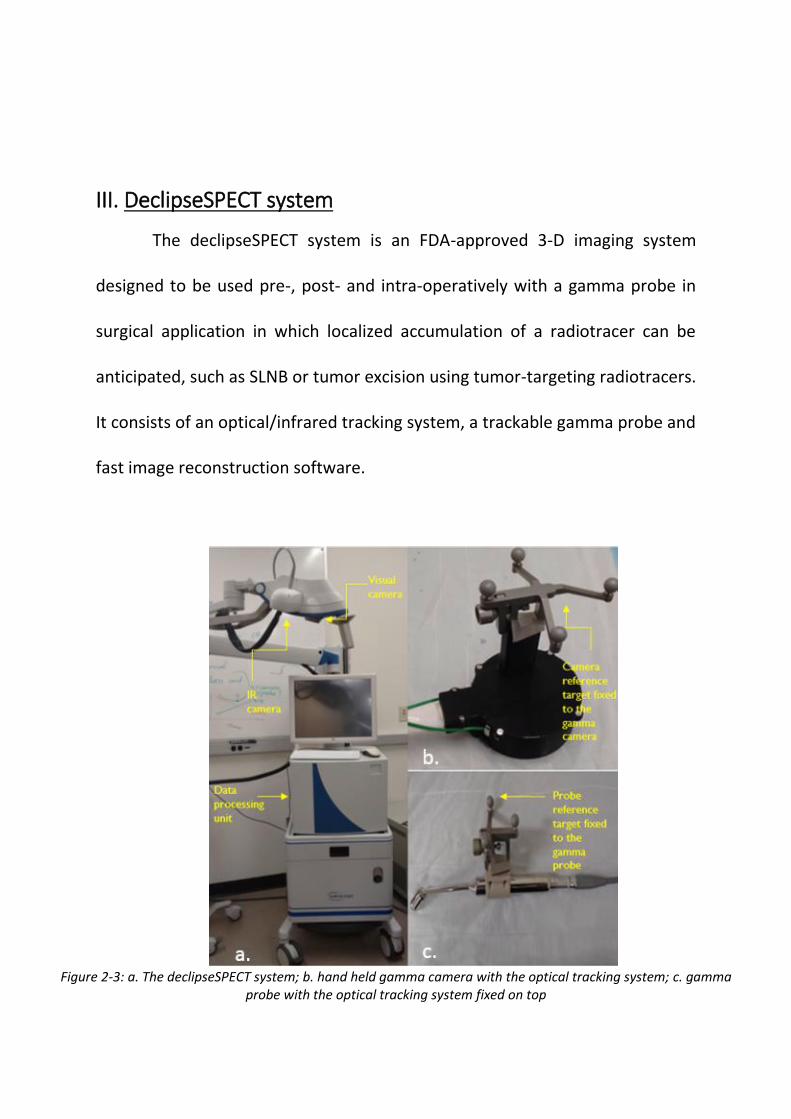
III. DeclipseSPECT system
The declipseSPECT system is an FDA-approved 3-D imaging system
designed to be used pre-, post- and intra-operatively with a gamma probe in
surgical application in which localized accumulation of a radiotracer can be
anticipated, such as SLNB or tumor excision using tumor-targeting radiotracers.
It consists of an optical/infrared tracking system, a trackable gamma probe and
fast image reconstruction software.
Figure 2-3: a. The declipseSPECT system; b. hand held gamma camera with the optical tracking system; c. gamma
probe with the optical tracking system fixed on top
37
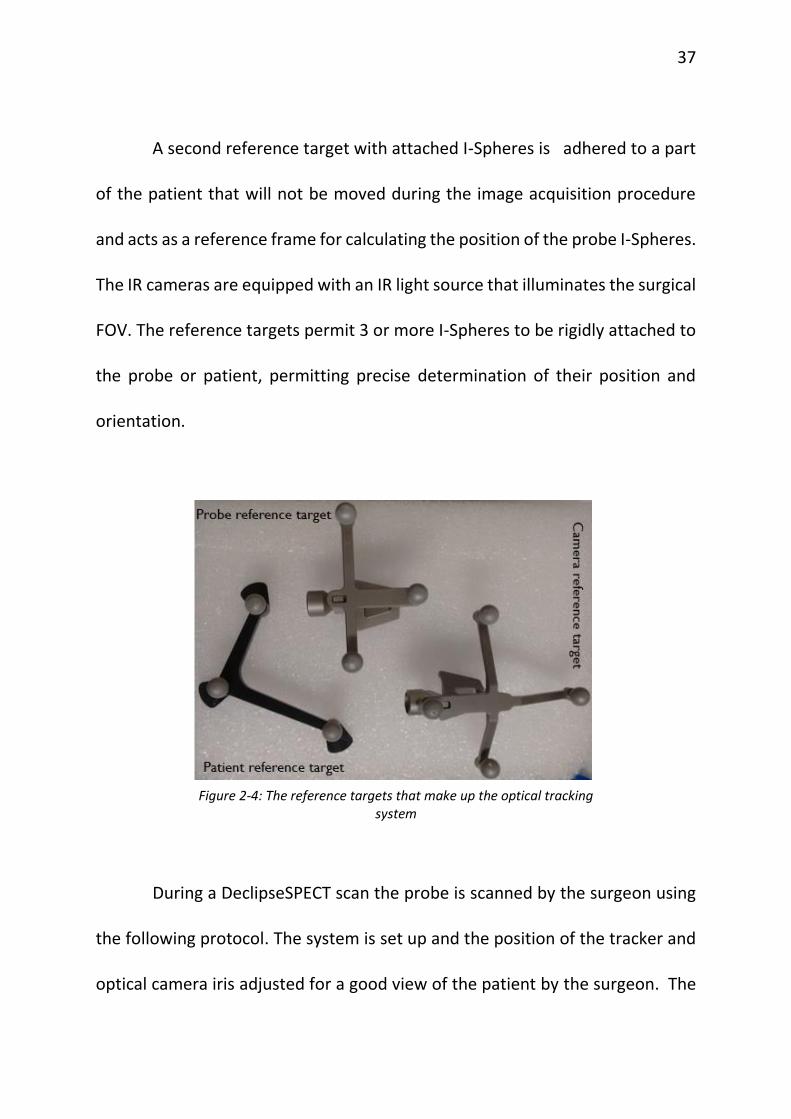
A second reference target with attached I-Spheres is adhered to a part
of the patient that will not be moved during the image acquisition procedure
and acts as a reference frame for calculating the position of the probe I-Spheres.
The IR cameras are equipped with an IR light source that illuminates the surgical
FOV. The reference targets permit 3 or more I-Spheres to be rigidly attached to
the probe or patient, permitting precise determination of their position and
orientation.
Figure 2-4: The reference targets that make up the optical tracking
system
During a DeclipseSPECT scan the probe is scanned by the surgeon using
the following protocol. The system is set up and the position of the tracker and
optical camera iris adjusted for a good view of the patient by the surgeon. The

38
patient is roughly scanned while monitoring the count rate by listening to the
audio output from the probe control box (Dilon Navigator2.0 gamma probe)
and the flowing bar graph at the top of the screen on the declipseSPECT
system. After the initial localization of basins containing hotspots in this
manner, 3-D scan is performed for the small region of interest (ROI). During the
3-D scan, the probe is kept over the ROI, pointing towards the suspicious area
as established from the rough scan till at least 600 counts are registered on the
system. This is followed by changing the probe position to a plane perpendicular
to the previous plane of scanning and letting another 600 counts to be
registered on the system. This is repeated to make sure that probe is scanned
over three perpendicular planes thus giving 3-D information with respect to the
suspicious lesions.
Count rates from the probe are streamed to the system computer during
the hand-held scanning procedure. The probe’s location and orientation, along
with the counting rate, are recorded and stored by the system. The resulting
time series data are fed to an iterative reconstruction algorithm, which
calculates the 3-dimensional distribution of the isotope within the system’s FOV.
Over the past two years, a partnership among UVa, Dilon Technologies,
SurgicEye, and the Jefferson Lab has interfaced a hand held gamma camera to
39
the data acquisition and image reconstruction components of the
DeclipseSPECT system. The camera can be used as an alternative to the gamma
probe. The potential advantages of replacing the non-imaging probe with a
camera include the estimation of shape, extent and depth of the radiotracer
uptake from the reconstructed images, better detection of sentinel lymph nodes
in complicated situations like anatomic location of the nodes or proximity to the
high-activity injection site and the ability to visualize the lesion area pre-incision
thus improving the false negative rate associated with the gamma probe [56].
The evaluation of the 3D hand held gamma camera is the main object of this
thesis and will be discussed in detail in the following chapters.
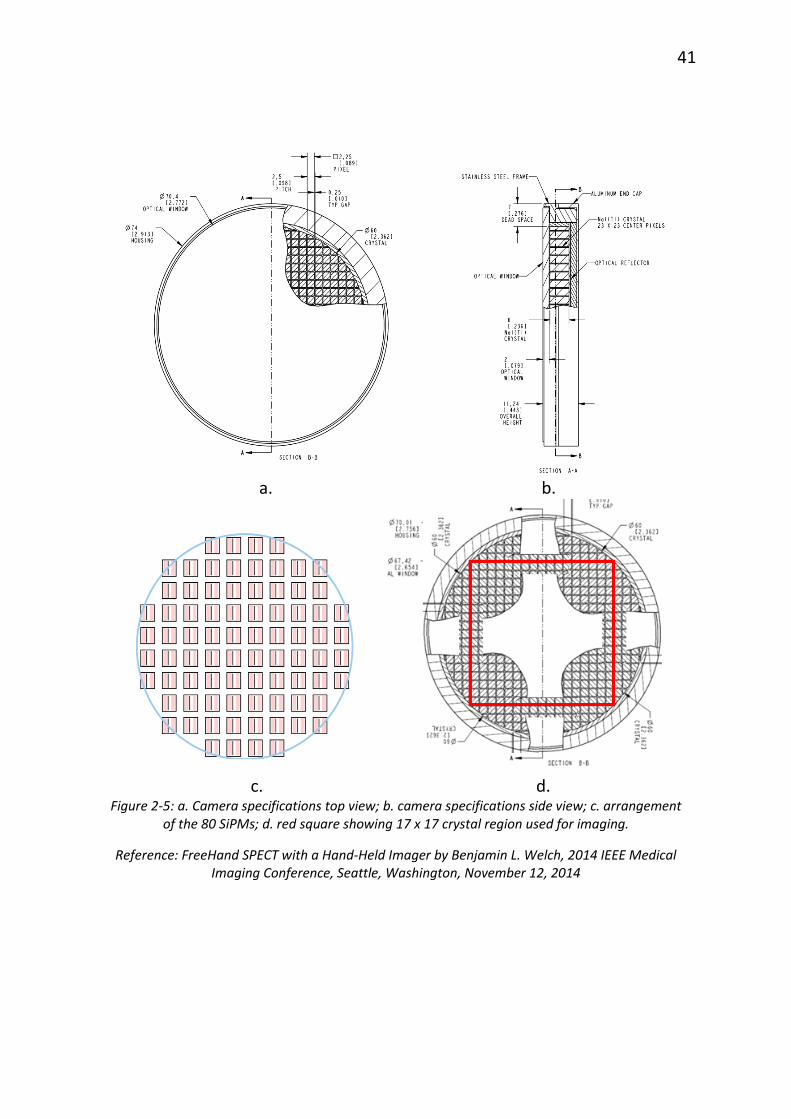
The small hand held gamma camera consists of a pixelated thallium
doped sodium iodide (NaI(Tl)) scintillator, an array of 80 silicon photomultipliers
(model S10362-33-050P from Hamamatsu Photonics, Hamamatsu, Japan) and a
two-layer custom-built parallel-hole collimator. The crystal is 6 cm in diameter
and 6 mm thick and is in a hermetically sealed package with a 1 mm thick glass
window, a 0.5 mm aluminum entrance window, and with an overall package
diameter of 7.5 cm and height of 9.5 mm. As described in Popovic et al. the
MPPCs (Multi-Pixel Photon Counter) or SiPM (Silicon Photomultipliers) are
arranged in a circular pattern with a central square array bounded on each side
40
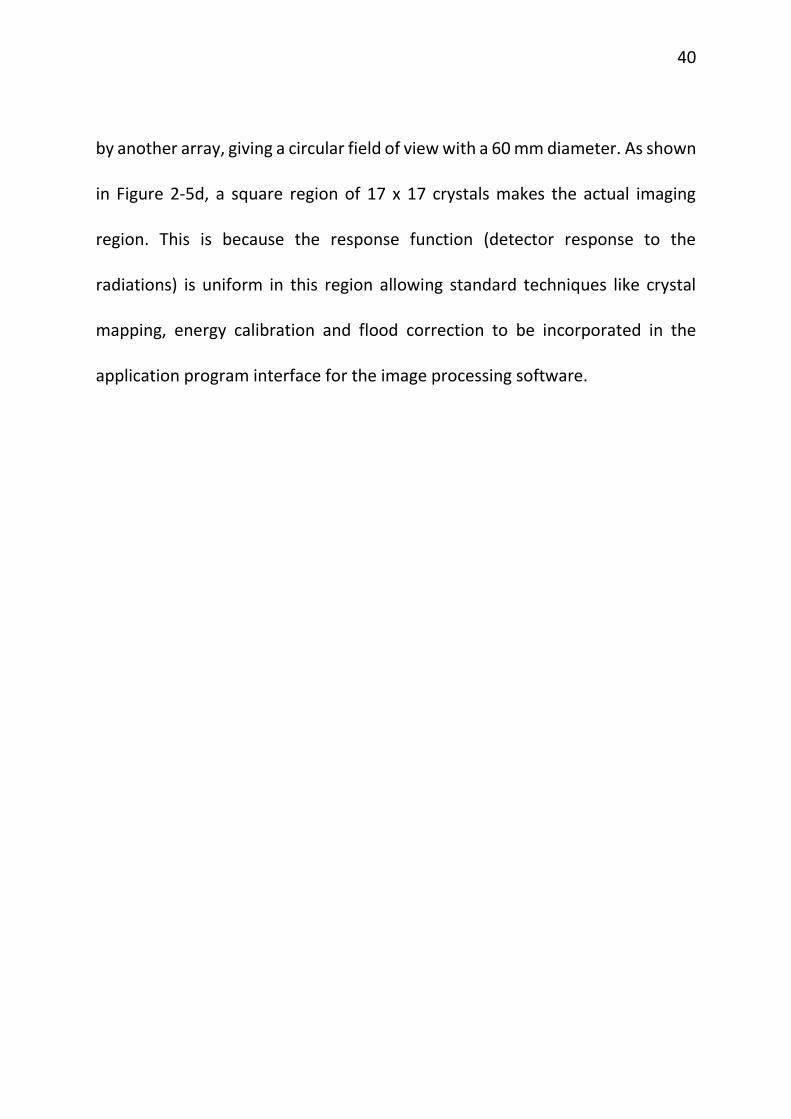
by another array, giving a circular field of view with a 60 mm diameter. As shown
in Figure 2-5d, a square region of 17 x 17 crystals makes the actual imaging
region. This is because the response function (detector response to the
radiations) is uniform in this region allowing standard techniques like crystal
mapping, energy calibration and flood correction to be incorporated in the
application program interface for the image processing software.
41
a. b.
c. d.
Figure 2-5: a. Camera specifications top view; b. camera specifications side view; c. arrangement of the 80 SiPMs; d. red square showing 17 x 17 crystal region used for imaging.
Reference: FreeHand SPECT with a Hand-Held Imager by Benjamin L. Welch, 2014 IEEE Medical Imaging Conference, Seattle, Washington, November 12, 2014
42
The disk-shaped camera housing is 75 mm in diameter, approximately
40.5 mm thick and has a mass of only 1.4 kg, permitting either hand-held or arm-
mounted use. The scintillator is coupled to the MPPC array using a
polydimethylsiloxane (PDMS) coupling compound to improve the scintillation
light transfer to the MPPCs and insure a sturdy coupling. All camera components
are integrated on a mobile cart that allows easy transport. The camera is
designed to be used in surgical procedures, including determination of the
location and extent of primary carcinomas, detection of secondary lesions, and
sentinel lymph node biopsy (SLNB) [57].
This small gamma camera follows freehand SPECT imaging. Before
starting the acquisition the camera is roughly moved over a broad region of
interest and a real-time window that shows any hot spots as bright area against
a black background is checked. These bright areas show the actual region of
interest and thus is focused for the actual acquisition. Once this area is
determined, the acquisition begins roughly for one minute. Scanning is followed
by reconstruction using SurgicEye declipseSPECT software. The reconstructed
image can be further filtered by focusing the region of interest and excluding the
noise from this region. Once this process is done, which usually takes thirty

43
seconds, the reconstruction image is overlaid on region scanned with the help
of the visual camera.
Figure 2-6: Reconstructed image overlaid on the phantom
A reconstructed image of a phantom with three posts having
radioactivity on top is shown in Figure 2-6. By tracking the camera’s location and
orientation using the NIR cameras, the system can display the continuously
updated separation between the camera surface and regions of reconstructed

44
focal radiotracer uptake (hotspots). As the camera is moved, the displayed
distance changes, thus letting surgeons know the location of the hotspots in
three dimensions relative to the camera. The software also calculates and
displays the relative activities of each separate hotspot expressed as a
percentage of the total activity within the reconstructed FOV of the system (see
Figure 2-6).
The next chapter deals with characterizing this small gamma camera
when operated in both 2-D and 3-D modes.
CHAPTER 3
SYSTEM CHARACTERIZATION
I. Introduction
Every imaging system needs to be evaluated based on its basic imaging
performance so that it can be used efficiently and capabilities and limitations
during human imaging can be predicted. This process also enables identification
of degraded performance, and troubleshooting to identify and correct the
source. This chapter discusses imaging performance evaluation of the hand held
gamma camera, used both in 2-D (scintigraphic) mode and in hand held SPECT
(3-D) mode in conjunction with the DeclipseSPECT system [58].
A. Intrinsic Performance
The International Atomic Energy Agency describes two general types of
gamma camera performance: extrinsic and intrinsic. Intrinsic performance is
generally evaluated for component of the imager under ideal conditions. For
gamma cameras, intrinsic performance is that with the collimator removed, and
characterizes the detector alone [58].
46
B. Extrinsic performance
Extrinsic or system performance characterization is usually done for the
entire nuclear medicine system under conditions that are clinically realistic. In
case of gamma cameras, it is done with the collimator in place. For 3-D (SPECT)
imaging characterization can include assement of image quality in reconstructed
images. The results of extrinsic performance measurements, when made with
realistic phantoms, can be indicators of clinical performance and may provide
useful information about system optimization for clinical studies.
In this thesis, all experiments were performed with the collimator on and
hence all results will be descriptive of extrinsic or system performance [58].
II. Performance Evaluation
A. Energy Resolution
A.i) Background
The amplitude of the signal obtained from the camera is directly
proportional to the energy deposited in the crystals by the γ-rays. The energy
spectrum of the detected gamma rays is obtained by plotting a histogram of the
detector pulse amplitudes. The shape of this spectrum depends on multiple
factors including: the radiotracer emission spectrum, the amount of Compton
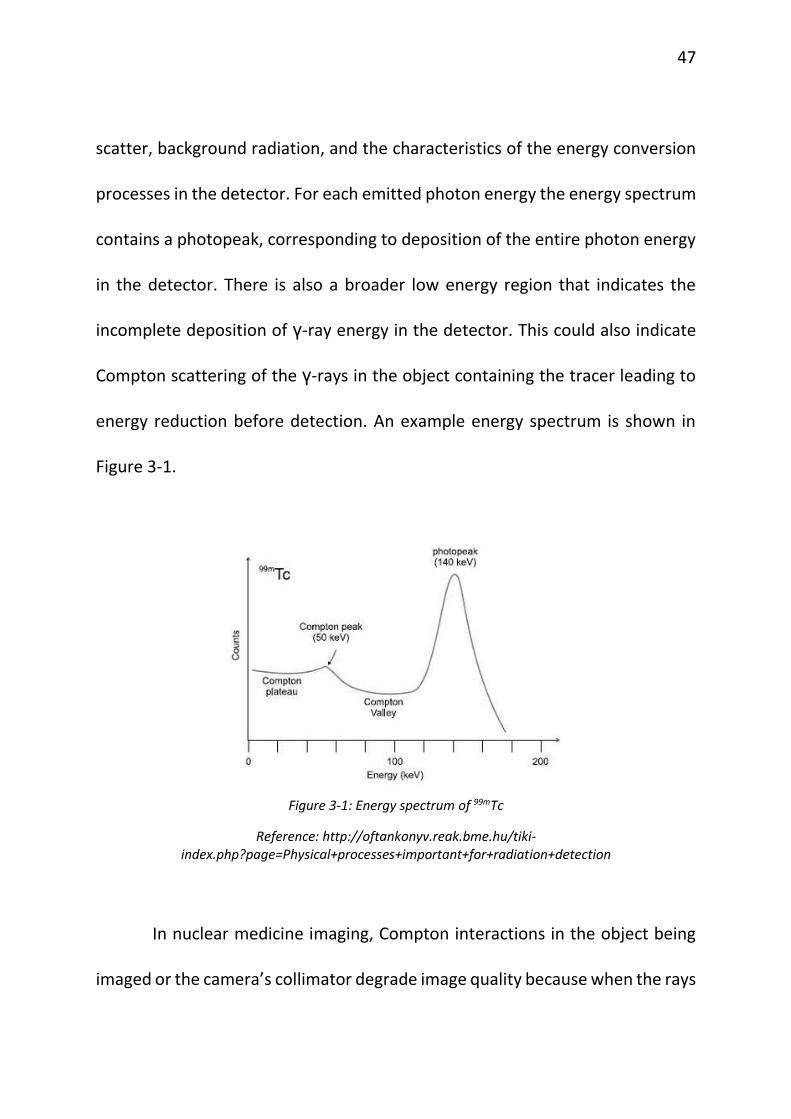
47
scatter, background radiation, and the characteristics of the energy conversion
processes in the detector. For each emitted photon energy the energy spectrum
contains a photopeak, corresponding to deposition of the entire photon energy
in the detector. There is also a broader low energy region that indicates the
incomplete deposition of γ-ray energy in the detector. This could also indicate
Compton scattering of the γ-rays in the object containing the tracer leading to
energy reduction before detection. An example energy spectrum is shown in
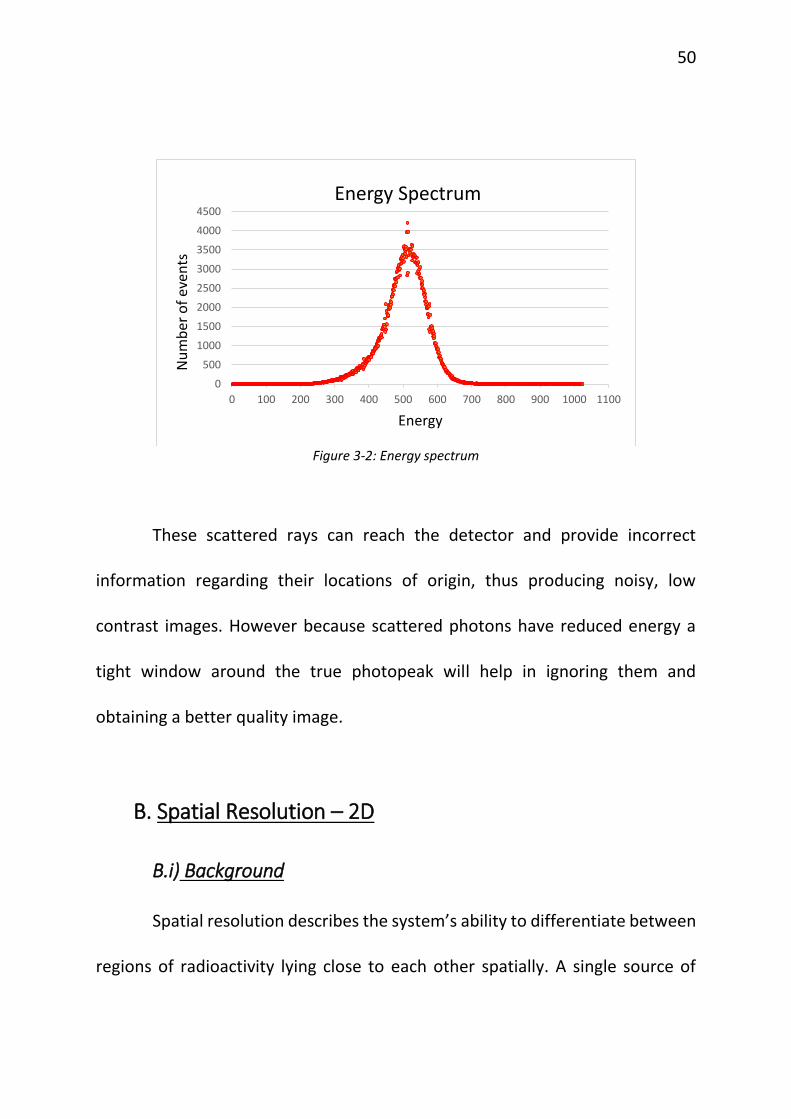
Figure 3-1.
Figure 3-1: Energy spectrum of 99mTc
Reference: http://oftankonyv.reak.bme.hu/tiki-index.php?page=Physical+processes+important+for+radiation+detection
In nuclear medicine imaging, Compton interactions in the object being
imaged or the camera’s collimator degrade image quality because when the rays
48
scatter in the object they change directions, thus the information regarding the
location of the original photon emission location is lost. The events with energies
below those in the photopeak in the energy spectrum of Figure 3-1 are Compton
events.
Energy resolution is a measure of the intrinsic ability of a detector to
distinguish γ rays of different energies. The energy resolution of a detector is
typically defined by the full width of the photopeak at one half of its maximum
amplitude, divided by the energy of the photopeak, and is typically expressed as
a percentage.
As the width of the spectral photopeak increases, the detector’s ability
to differentiate between γ rays whose energies are close to each other
deteriorates. Thus a smaller energy resolution is desirable. The reason that
energy resolution decreases at lower energies is greater statistical fluctuation in
the measured signal. This greater fluctuation is either because of detection of
fewer photoelectrons (in scintillation detectors with PMTs) or creation of fewer
e–h pairs (for semiconductors). In addition, slight differences in operating
characteristics between detectors can degrade the total energy resolution of a
complete imaging system as compared to that of small individual detectors
unless they are corrected for.

49
A.ii) Materials and methods
To measure the energy resolution of the hand held gamma camera a
petri dish of diameter 85 mm covering the entire field of view of the camera was
used. It was filled with ~1 mCi of 99mTc-pertechnetate forming a thin layer in the
petri dish and acting as a low-scatter flood source. This flood source was placed
on the gamma camera to obtain a high statistics flood image. The FWHM of the
photopeak in the resulting whole-FOV energy spectrum was calculated using
MATLAB programming language. The measurement was repeated seven times
to reduce the statistical error, and the FWHM energy resolution was calculated
for each trial.
A.iii)Result
The average energy resolution was calculated to be 21.5 ± 1.67 % (mean
± 95% confidence interval) at 140 keV. A good energy resolution is important
since this establishes how narrow the energy window can be that determines
which detected events are kept. The energy window is usually centered on the
photopeak and events falling outside the window are rejected.
50
Figure 3-2: Energy spectrum
These scattered rays can reach the detector and provide incorrect
information regarding their locations of origin, thus producing noisy, low
contrast images. However because scattered photons have reduced energy a
tight window around the true photopeak will help in ignoring them and
obtaining a better quality image.
B. Spatial Resolution – 2D
B.i) Background
Spatial resolution describes the system’s ability to differentiate between
regions of radioactivity lying close to each other spatially. A single source of
0
500
1000
1500
2000
2500
3000
3500
4000
4500
0 100 200 300 400 500 600 700 800 900 1000 1100
Nu
mb
er o
f ev
ents
Energy
Energy Spectrum
51
activity might appear to be spread over multiple pixels close to each other, thus
producing a blurring effect. Apart from blurring effect of small structures and
edges, poor resolution also decreases the contrast of small structures relative to
the surrounding background. This is caused by the object images being spread
into the nearby background. Thus differentiation between areas of increased
and decreased uptake might also become difficult.
The primary determinants of gamma camera spatial resolution are the
detector’s intrinsic spatial resolution and the geometric collimator resolution.
The latter is a function of the source-to-collimator separation. For a parallel hole
collimator the geometric spatial resolution, Rc is determined by length of the
holes L, the hole diameter d and the source to collimator distance z as
𝑅𝑐 = 𝑑.(𝐿 + 𝑧)
𝐿
The relationship between the detector and collimator spatial resolutions
and the overall (extrinsic) gamma camera resolution Re is determined by Rc and
the intrinsic resolution Ri as
𝑅𝑒 = √𝑅𝑖2 + 𝑅𝑐
2
This equation shows that except at very small source-to-collimator
separations the collimator is the primary factor determining the spatial

52
resolution. Intrinsic resolution Ri refers to how well the crystal and PMT system
localize an interaction in the crystal. It is affected by crystal thickness, gamma
ray energy and scatter in the crystal.
When detectors with pixelated crystals are used, the spatial resolution
of the system is limited by the pixel size. Spatial resolution is also affected by the
energy of the photon and efficiency of collection of the scintillation light by the
photomultipliers, with a greater number of photoelectrons leading to improved
resolution in PSPMT-based cameras.
In this study, only the extrinsic spatial resolution was measured. It was
calculated by measuring the full width at half maximum (FWHM) of the image
of a thin line source.
B.ii) Materials and Methods
a. b.
Figure 3-3: a. The experimental setup consisting of an angled capillary; b. the image obtained from the acquisition displayed using Image J
53
The thin line source was created using a small capillary tube (Kimble
71900-50 µL, 1 mm inner diameter). This capillary was filled with 99mTc-
pertechnetate and translated from the surface of the camera (0 mm) to 100 mm
away from the plane of the camera surface, obtaining images at every 10 mm in
this range. From the captured images, the line spread function (LSF) at each
source distance was found using Image J. The FWHM of the LSF is a measure of
the spatial resolution of the system. This dependence of the FWHM of the LSF
on source distance is important clinically, since nodes will be found at various
depths inside the tissue.
B.iii)Result
Figure 3-4 shows the mean FWHM at various source to collimator
distances with error bars depicting the standard deviation of the data values
from the mean. Table 3 gives the mean spatial resolution ± 95% confidence
interval at source to collimator distances ranging from 0 mm to 100 mm.

Figure 3-4: Mean Spatial resolution 2D vs Distance with bars indicating standard deviation.
Table 3: Mean spatial resolution with 95% confidence interval
Distance (mm) 0 10 20 30 40 50 60 70 80 90 100
Spat Res (pixels) 1.8 ± 0.07 2.2 ± 0.06 2.7 ± 0.06 3.2 ± 0.09 3.7 ± 0.2 4.4 ± 0.2 4.9 ± 0.2 5.5 ± 0.4 6.1 ± 0.3 6.6 ± 0.5 7.2 ± 0.5
Spat Res (mm) 4.6 ± 0.15 5.4 ± 0.13 6.7 ± 0.13 8.1 ± 0.20 9.3 ± 0.34 11.0 ± 0.48 12.3 ± 0.43 13.6 ± 0.78 15.2 ± 0.59 16.6 ± 1.0 18.1 ± 1.0
1.82.2
2.73.2
3.74.4
4.95.5
6.16.6
7.2
0.00
1.00
2.00
3.00
4.00
5.00
6.00
7.00
8.00
9.00
0 10 20 30 40 50 60 70 80 90 100
FWH
M in
pix
els
Distance in mm
Mean 2D Spatial Resolution Vs Distance
Average_Pix y = 0.0554x + 1.6024
0.00
1.00
2.00
3.00
4.00
5.00
6.00
7.00
8.00
9.00
0 10 20 30 40 50 60 70 80 90 100
FWH
M in
pix
els
Distance in mm
2D Spatial Resolution Vs Distance
w_pix_avg1
w_pix_avg2
w_pix_avg3
w_pix_avg4
w_pix_avg5
C. Spatial Resolution 3D
C.i) Background
Spatial resolution in 3-D mode is similar to the spatial resolution 2-D
defined above, the difference being that this parameter is calculated in the
reconstructed image produced by the Surgiceye reconstruction software, rather
than in the projection images from the camera.
C.ii) Materials and Method
Four capillary tubes (Kimble 71900-50 µL, 1 mm inner diameter) filled
with 99mTc-pertechnetate were placed so that separation distances of 5 mm, 10
mm, 15 mm and 20 mm were created. The capillaries were imaged in two co-
planar perpendicular orientations, shown as position 1 and position 2, in Figure
3-5.
Figure 3-5: Experimental set up of capillary tubes for the calculation of 3-D spatial resolution

56
Figure 3-6: Reconstructed image in both positions 1 and 2 respectively.
Similarly, the spatial resolution in the third dimension was also
measured. Two capillary tubes (Kimble 71900-50 µL, 1 mm inner diameter) were
filled with 99mTc-pertechnetate and the separation between them was varied
from 10 mm to 30 mm in 5 mm increments. The experimental setup is shown in
Figure 3-7.
C.iii) Result
The reconstructed image was analyzed and checked whether the system
could distinguish between the capillaries. From the reconstructed images, it is
observed that the limiting spatial resolution 3-D is 10 mm, as seen in Figure 3-6
and Figure 3-8.
57
Figure 3-7: Experimental setup for finding spatial resolution
in the third dimension
Figure 3-8: Reconstructed images of two capillaries at separation distances of (left) 25 mm,
(middle) 15 mm and (right) 10 mm
D. Sensitivity – 2D
D.i) Background
Sensitivity of a gamma camera is typically expressed either as detected
photons per emitted photons, or equivalently in detected counts per second per
mega Becquerel of activity, describes how efficiently the camera is able to detect
the incident radiation. Sensitivity depends on the geometric efficiency of the
58
collimator, the intrinsic photopeak efficiency of the detector, pulse height
analyzer discriminator settings, and the dead time of the system [59]. The
sensitivity has a direct impact on the radiotracer dose that must be injected into
the patient and/or the total imaging time.
D.ii) Materials and Method
The sensitivity of the gamma camera was experimentally determined
according to NEMA standards [60]. A flat bottomed petri dish with inner
diameter of 10 mm was placed at 100 mm distance from the camera surface. A
thin layer of 99mTc-pertechnetate was filled in the dish and image was acquired.
Care was taken to make sure that the dish was placed at the center of the FOV,
and that the entire periphery of the petri dish was visible in the image. The
sensitivity at 100 mm separation between the camera and source was then
calculated as the ratio of the total number of counts recorded in the image per
second and the activity of the source.
D.iii) Result
This was calculated to be 170.67 ± 6.16 cps/MBq, where cps/MBq stands
for counts per second per mega Becquerel. In Figure 3-9, the uniformity
corrected image of the setup is shown.

59
Figure 3-9: Corrected image of the 10 mm diameter petri dish at 100 mm from the camera surface
E. Sensitivity – 3D
E.i) Background
The 3-D sensitivity was based on the relative activities returned by the
system reconstruction algorithm. Similar to 2-D sensitivity, 3-D sensitivity was
defined as the ratio of total reconstructed image counts per second and the
activity of the source when the distance between the source and the camera
was 30 mm.
E.ii) Materials and Method
Eppendorf tubes were prepared with activities within the range of 3.59
µCi to 6060.27 µCi. The radioactive tube was then placed in the field of view of
the gamma camera at a distance of 30 mm. This set-up was scanned with the
gamma camera and the counts in each acquisition was noted down. The activity

60
sensitivity of the camera for each activity was then calculated as counts per
second per activity and is plotted in Figure 3-10.
E.iii) Result
As can be seen in the Figure 3-10, the sensitivity is uniform in this range
of activity with a mean sensitivity of 202.97 ± 19.51 cps/MBq.
Figure 3-10: Plot of Sensitivity vs Activity
F. Depth Measurement
F.i) Background
In addition to providing the relative activity of the sources in the region
of interest, the declipseSPECT software also tracks and reports the locations
1.00
10.00
100.00
1,000.00
0.10 1.00 10.00 100.00 1,000.00
Sen
siti
vty
(cp
s/M
Bq
)
Activity (MBq)
Sensitivity (cps/MBq)
61
these individual sources relative to the input surface of the gamma camera. Thus
the distance of these sources from the camera can be obtained in real time after
reconstruction of the image. Knowing the depth of the lesion provides the
surgeons with useful information that could help them decide where to make
the incision efficiently, or whether the depth of the node might be too great to
justify its excision. This section describes experiments designed to test the
accuracy of the distance measurement as reported by the system.
F.ii) Materials and Method
In this experiment, distance was defined as the separation between the
camera collimator and the lesion. The true distance was measured using a ruler
and compared to the distance displayed by the reconstruction software. Lesions
were simulated using small spheres filled with average radioactivity of 25.71 µCi,
and having activities varying from 18.18 µCi to 52.17 µCi. The first set of distance
determination were obtained with the camera surface in contact with the
lesions and hence the true distance is 0 mm in this case. Multiple scans were
performed at this position and the distances were noted down. The second set
was obtained with the distance between the camera surface and lesions being
35 mm.

62
F.iii) Result
Figure 3-11: Plot illustrating the distance as measured by the system and the true
distance for 16 cases.
Figure 3-11 summarises the data obtained from this study. It was
observed that the distances as measured by the system had an average error of
9.19 mm with a standard deviation of 2.71 mm. This error can be explained by
the fact that system displayed distance was from the source to the collimator of
the camera. However, there is an outer camera covering with a thickness of ~9
mm to help with thermal insulation and electrical noise shielding. Thus it can be
concluded that the distance as measured by the system corresponded well to
the true values but with an offset of 9.19 mm.
0
10
20
30
40
50
60
1 2 3 4 5 6 7 8 9 10 11 12 13 14 15 16
Dis
tan
ce in
mm
Displayed Distance Vs Actual Distance
Measured Distance Displayed Distance
63
G. Geometric Linearity
G.i) Background
In a SLNB procedure the nodes can be at any depth inside the tissue and
they can be located in any arrangement among themselves, in the case of
multiple nodes. A geometrically accurate imaging system should be able to
return the spatial separations of the nodes without any geometric distortions;
i.e. straight lines should be imaged as straight lines. This will provide surgeons
with a good visualization of the lymphatic drainage system and help them in the
surgical removal of sentinel lymph nodes.
G.ii) Materials and Method
To evaluate this characteristic of the camera, two wells of height 0.5 cm
(A) and 2.5 cm (B) were placed on a box phantom with a separation distance of
2 cm between them. Point radioactivity ~60 µCi each was placed on top of the
wells. This set-up was then scanned by the system and the reconstructed image
was analysed.
Figure 3-12a shows the diagram of the lesions illustrating the dimensions
of the wells and the separation between them. Figure 3-12b is the actual
experimental set up. After the reconstruction, the system returns the distance
between the camera collimator and imaged hotspots. The distance reported
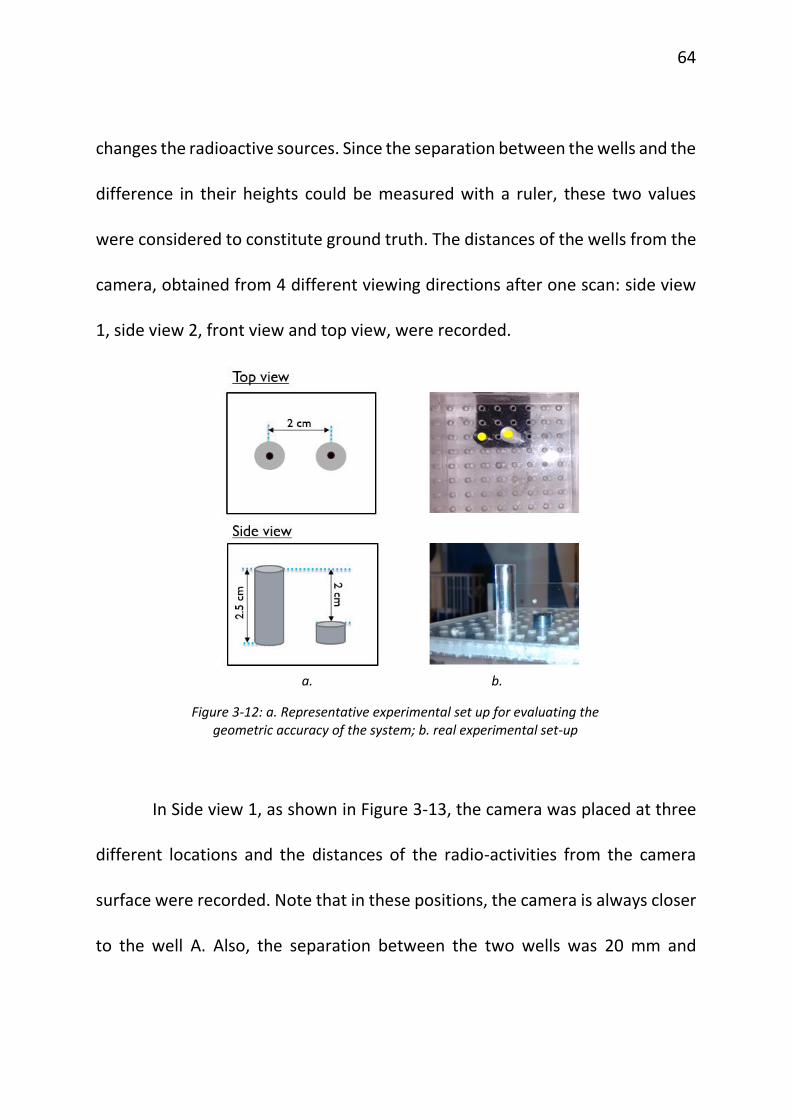
64
changes the radioactive sources. Since the separation between the wells and the
difference in their heights could be measured with a ruler, these two values
were considered to constitute ground truth. The distances of the wells from the
camera, obtained from 4 different viewing directions after one scan: side view
1, side view 2, front view and top view, were recorded.
In Side view 1, as shown in Figure 3-13, the camera was placed at three
different locations and the distances of the radio-activities from the camera
surface were recorded. Note that in these positions, the camera is always closer
to the well A. Also, the separation between the two wells was 20 mm and
a. b.
Figure 3-12: a. Representative experimental set up for evaluating the geometric accuracy of the system; b. real experimental set-up
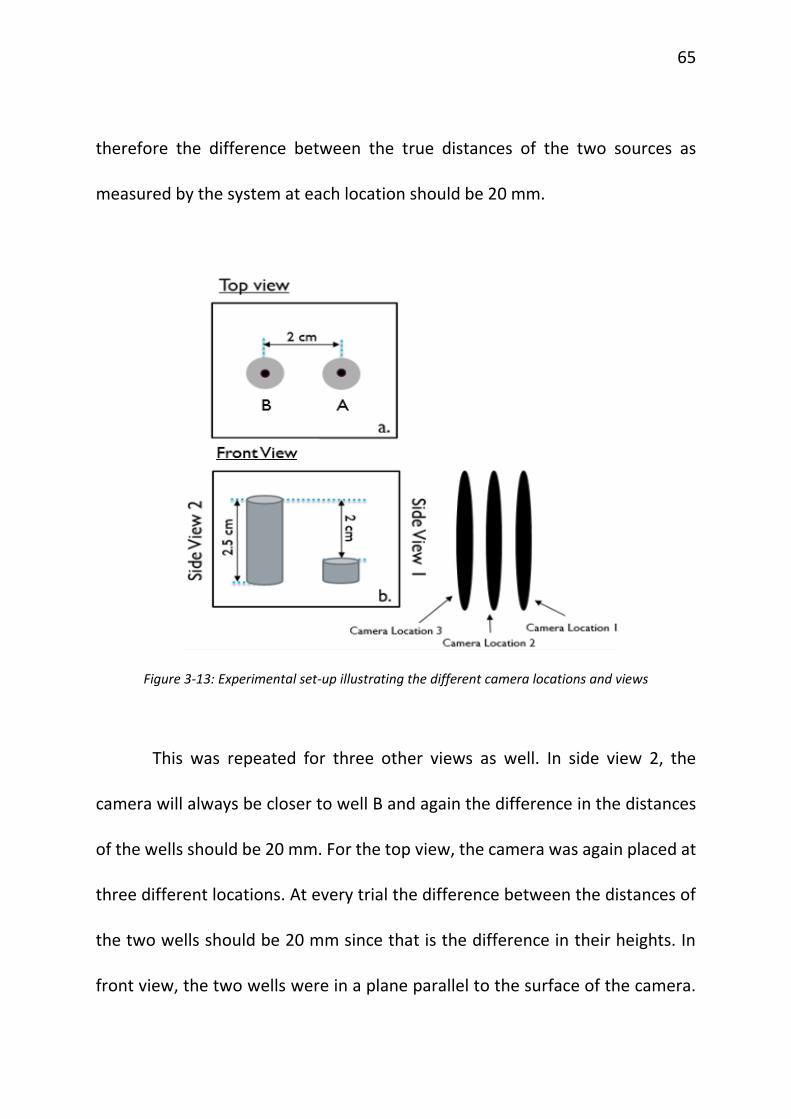
65
therefore the difference between the true distances of the two sources as
measured by the system at each location should be 20 mm.
Figure 3-13: Experimental set-up illustrating the different camera locations and views
This was repeated for three other views as well. In side view 2, the
camera will always be closer to well B and again the difference in the distances
of the wells should be 20 mm. For the top view, the camera was again placed at
three different locations. At every trial the difference between the distances of
the two wells should be 20 mm since that is the difference in their heights. In
front view, the two wells were in a plane parallel to the surface of the camera.
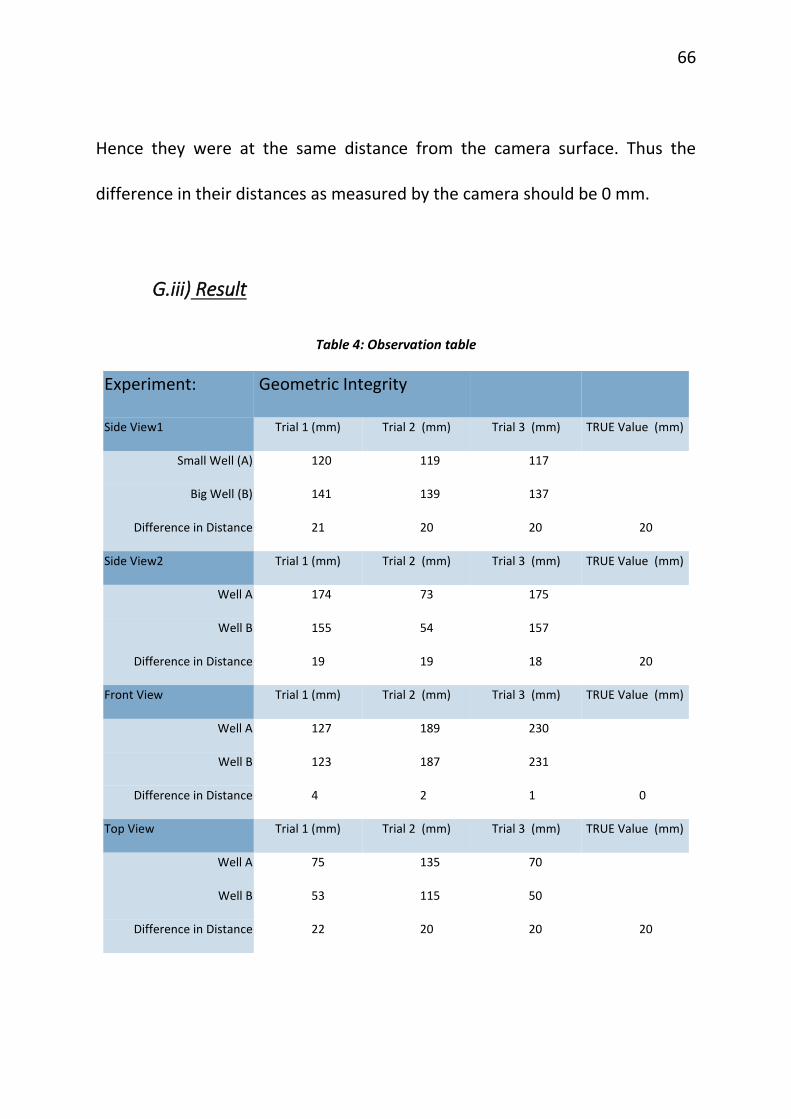
66
Hence they were at the same distance from the camera surface. Thus the
difference in their distances as measured by the camera should be 0 mm.
G.iii) Result
Table 4: Observation table
Experiment: Geometric Integrity
Side View1 Trial 1 (mm) Trial 2 (mm) Trial 3 (mm) TRUE Value (mm)
Small Well (A) 120 119 117
Big Well (B) 141 139 137
Difference in Distance 21 20 20 20
Side View2 Trial 1 (mm) Trial 2 (mm) Trial 3 (mm) TRUE Value (mm)
Well A 174 73 175
Well B 155 54 157
Difference in Distance 19 19 18 20
Front View Trial 1 (mm) Trial 2 (mm) Trial 3 (mm) TRUE Value (mm)
Well A 127 189 230
Well B 123 187 231
Difference in Distance 4 2 1 0
Top View Trial 1 (mm) Trial 2 (mm) Trial 3 (mm) TRUE Value (mm)
Well A 75 135 70
Well B 53 115 50
Difference in Distance 22 20 20 20

67
Table 4 summarises the observations obtained from this experiment.
From this data, error with which the system measures the distances of the
radioactive sources from the camera from all the different views was calculated.
The depth information of the lesions were accurately reproduced with a mean
absolute error of 1.2 ± 0.34 mm (95% confidence interval).
H. Quantification of the Activity
H.i) Background
As mentioned in Chapter 2III. , the system reports the relative activity of
the sources in terms of their percentage of the total activity imaged by the
system in the region of interest. This measure is clinically significant because of
the 10% rule followed by surgeons during sentinel lymph node biopsy. According
to this rule, all nodes with radiation activities more than 10% of that of the
hottest node and all blue dye stained nodes should be removed. Even though
recent studies show that following this rule results in removal of a larger number
of nodes than necessary, this is the current standard in hospitals [61], [62]. Thus
an attempt was made to test how well this investigational imaging system can
aide surgeons in making the decision about excision of nodes.
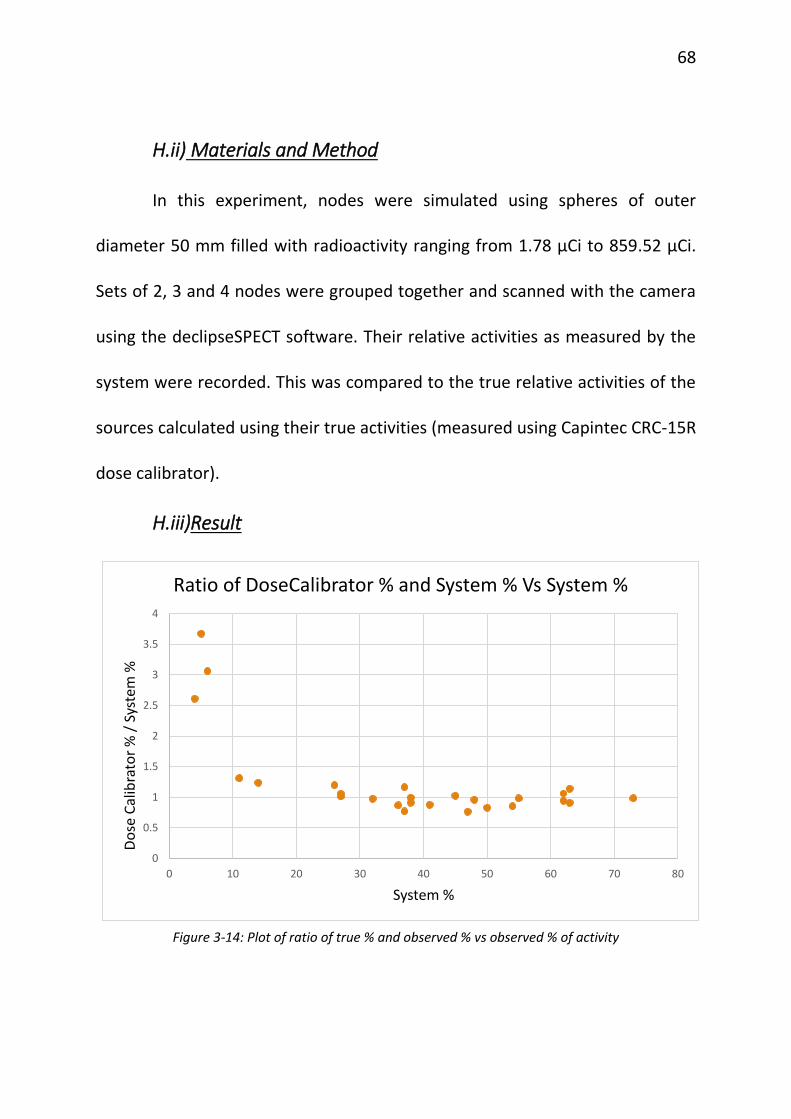
68
H.ii) Materials and Method
In this experiment, nodes were simulated using spheres of outer
diameter 50 mm filled with radioactivity ranging from 1.78 µCi to 859.52 µCi.
Sets of 2, 3 and 4 nodes were grouped together and scanned with the camera
using the declipseSPECT software. Their relative activities as measured by the
system were recorded. This was compared to the true relative activities of the
sources calculated using their true activities (measured using Capintec CRC-15R
dose calibrator).
H.iii)Result
Figure 3-14: Plot of ratio of true % and observed % vs observed % of activity
0
0.5
1
1.5
2
2.5
3
3.5
4
0 10 20 30 40 50 60 70 80
Do
se C
alib
rato
r %
/ S
yste
m %
System %
Ratio of DoseCalibrator % and System % Vs System %
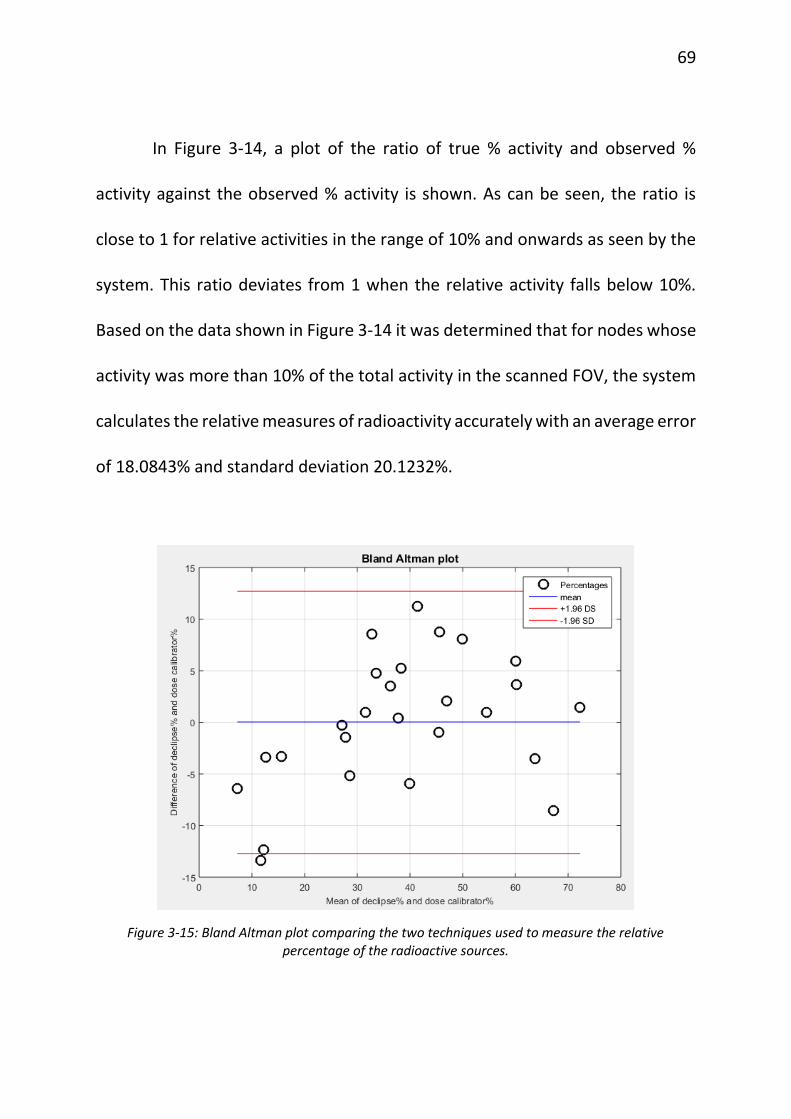
69
In Figure 3-14, a plot of the ratio of true % activity and observed %
activity against the observed % activity is shown. As can be seen, the ratio is
close to 1 for relative activities in the range of 10% and onwards as seen by the
system. This ratio deviates from 1 when the relative activity falls below 10%.
Based on the data shown in Figure 3-14 it was determined that for nodes whose
activity was more than 10% of the total activity in the scanned FOV, the system
calculates the relative measures of radioactivity accurately with an average error
of 18.0843% and standard deviation 20.1232%.
Figure 3-15: Bland Altman plot comparing the two techniques used to measure the relative percentage of the radioactive sources.
70
Figure 3-15 shows the Bland Altman plot comparing the two methods
used for the quantification of radio-activities. Since the mean of the difference
between observed % and true % is zero, there is no systematic bias associated
with the reporting of the relative activities by the system. The sentinel node was
correctly identified in each case with 100% accuracy.
I. Attenuation Correction
I.i) Background
Gamma rays emitted by a source (node or lesion) are attenuated
(absorbed and/or scattered) by any intervening material between the source
and the gamma camera. If a source is located deeper inside the tissue, the
gamma rays reaching the camera will be attenuated more than the rays reaching
the camera from a source located nearer to the camera in the same tissue. For
example this is a problem in SLNB when determining relative node activity using
a non-imaging probe, since deeper nodes appear to have lower activity than
they truly have. The activity of the rays Ao coming out of a material with linear
attenuation coefficient µ after travelling x distance in the attenuating material
is given by Beer’s law [63] as
𝐴𝑜 = 𝐴𝑖 ∗ 𝑒(−𝜇𝑥)

71
where Ai is the activity of the rays before entering the material.
However, attenuation compensation can be built into 3D reconstruction
algorithms if the attenuation of the intervening material is known or can be
approximated. These tests were performed to evaluate the degree to which the
investigational system’s reconstruction algorithm can perform attenuation
correction.
I.ii)Materials and Method
Two small spherical simulated lesions of average activity 24.5 µCi were
placed in a box phantom at varying depths (separation = 20 mm) from the
camera (see Figure 3-16). The camera surface is kept close to the box phantom
surface. In position 1, L1 was at a distance of 20 mm from the camera surface
and L2 was at 40 mm from the camera surface. This set-up was then scanned in
3D mode with the investigational system, first with no water in the box and next
with water in the box. For the in-water case two trials were performed. In all
cases the separation between the lesions was held fixed at 20 mm.
Following each scan the relative lesion activities calculated by the system
were recorded. This is represented by ‘System L1 percentage’ and ‘System L2
percentage’ in Table 5. Activities of lesions at the time of acquisition were given
by the quantities ‘True L1 Activity’ and ‘True L2 Activity’.
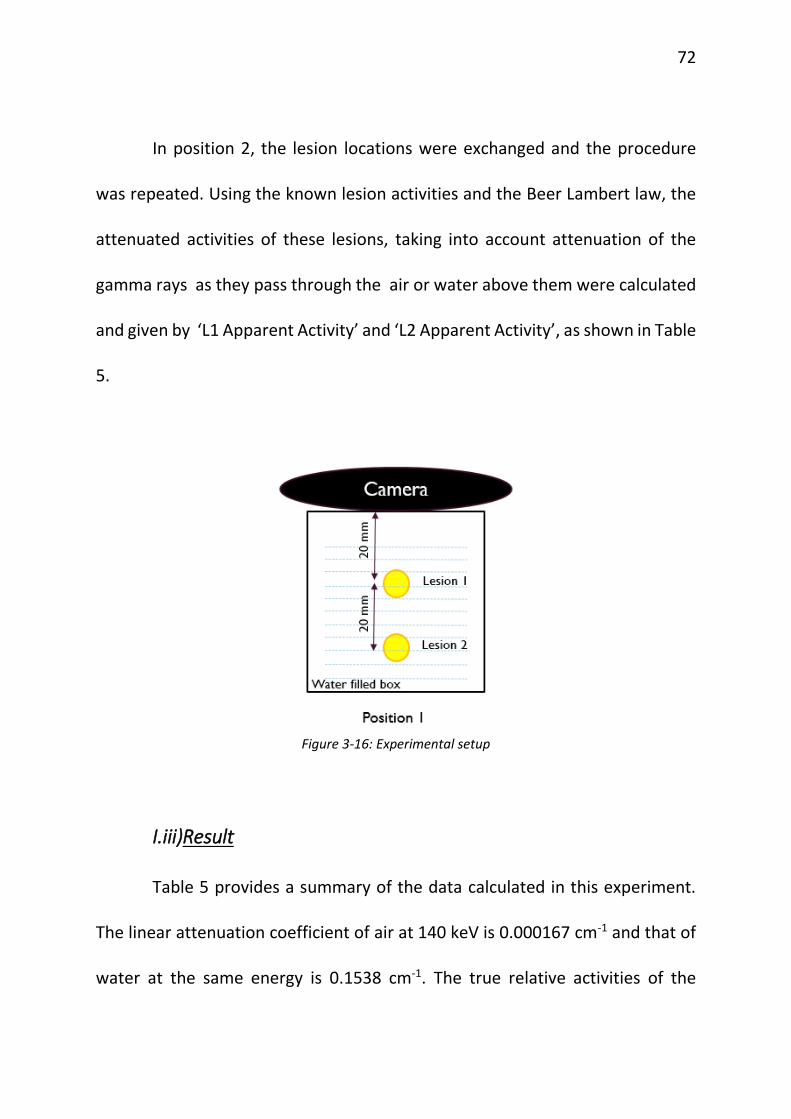
72
In position 2, the lesion locations were exchanged and the procedure
was repeated. Using the known lesion activities and the Beer Lambert law, the
attenuated activities of these lesions, taking into account attenuation of the
gamma rays as they pass through the air or water above them were calculated
and given by ‘L1 Apparent Activity’ and ‘L2 Apparent Activity’, as shown in Table
5.
Figure 3-16: Experimental setup
I.iii)Result
Table 5 provides a summary of the data calculated in this experiment.
The linear attenuation coefficient of air at 140 keV is 0.000167 cm-1 and that of
water at the same energy is 0.1538 cm-1. The true relative activities of the

73
lesions, expressed as percentages of their total activity were given by ‘True L1
Percentage and ‘True L2 Percentage. ‘Apparent L1 Percentage and ‘Apparent L2
Percentage were similar relative quantities but calculated using the Apparent
L1/L2 activities. ‘System L1 Percentage and ‘System L2 Percentage were the
percentages of the total activity calculated by the system for each lesion.
Table 6 shows that even though the lesions might deceptively look less
radioactive than they actually were owing to the effect of attenuation caused by
the water medium, the system compensated for this effect and correctly
identified the higher (or lower) active sources. True L1 Percentage column
shows the fraction of total activity actually contained in lesion 1, and that can
be compared to System L1 Percentage to see how well the imaging system was
able to perform attenuation correction. Similar comparisons can be made for L2.
The percentage error in the system-reported fractional activities, relative to the
known fractional lesion activities, is shown in the two rightmost columns.

Table 5: Data collected from the experiment. The true relative activities of the lesions, expressed as percentages of their total activity were given by ‘True L1 Percentage and ‘True L2 Percentage. ‘Apparent L1 Percentage and ‘Apparent L2 Percentage were similar relative quantities but calculated using the Apparent L1/L2 activities. ‘System L1 Percentage and ‘System L2 Percentage were the percentages of the total activity calculated by the system for each lesion.
In Air True L1 Activity
(µCi)
L1 Apparent activity (µCi)
True L1 Percentage
(%)
Apparent L1 Percentage
(%)
System L1 Percentage
(%)
True L2 Activity (µCi)
L2 Apparent activity (µCi)
True L2 Percentage
(%)
Apparent L2 Percentage
(%)
System L2 Percentage
(%)
Position #1 21.79 21.79 44.71 44.72 48.00 26.95 26.93 55.29 55.28 52.00
Position #2 21.54 21.54 44.71 44.72 42.00 26.64 26.62 55.29 55.28 58.00
In Water
Position #1 21.29 15.65 44.71 52.38 33.00 26.33 14.23 55.29 47.62 67.00
Position #1 20.93 15.38 44.71 52.38 22.00 25.88 13.99 55.29 47.62 78.00
Position #2 20.93 11.31 44.71 37.28 43.00 25.88 19.03 55.29 62.72 57.00
Position #2 20.69 11.18 44.71 37.28 48.00 25.58 18.81 55.29 62.72 52.00
75
Table 6: Comparison of the relative activities as detected by the system to the true activities. The percentage error in the system-reported fractional activities, relative to the known fractional lesion activities, is shown in the tow rightmost columns
In Air True L1
Percentage (%)
True L2 Percentage
(%)
Apparent L1 Percentage
(%)
Apparent L2 Percentage
(%)
System L1 Percentage
(%)
System L2 Percentage
(%)
System L1 % error
System L2 % error
Position 1 44.71 55.29 44.72 55.28 48.00 52.00 7.36 5.95
Position 2 44.71 55.29 44.72 55.28 42.00 58.00 6.06 4.90
In Water
Position 1 44.71 55.29 52.38 47.62 33.00 67.00 26.19 21.17
Position 1 44.71 55.29 52.38 47.62 22.00 78.00 50.79 41.07
Position 2 44.71 55.29 37.28 62.72 43.00 57.00 3.82 3.09
Position 2 44.71 55.29 37.28 62.72 48.00 52.00 7.36 5.95
J. Effect of Injection Site
J.i) Background
During the sentinel lymph node biopsy, the radioactive colloid is injected
using peri-tumoral, sub-dermal or sub-areolar injection techniques[64]–[67].
The drainage of the radioactive tracer from the point of injection then tracks the
path of putative cancer cells through the lymphatic system. Since the injection
is done in tissue and drainage is through the lymphatic system, drainage from
the injection site to the sentinel nodes will take about 24 hours. The amount of
injected activity that ends up in a sentinel node is only 3.5 ± 3.1% of the injected
activity [9] so the injection site is considerably more radioactive than the nodes
at the time of surgery. This significantly high radioactive source emits numerous
gamma rays some of which can scatter into the parallel holes of the gamma
camera collimator, producing background noise in the projection images.
J.ii) Materials and Method
To assess the degree of severity of this scatter radiation, the effect was
simulated with an experimental set up shown in Figure 3-17. Case 1 consisted of
two spherical radioactive node-simulating sources of approximately 4 µCi each,
similar in activity to sentinel nodes. These sources were immersed in a water
77
filled box phantom to simulate nodes embedded in the tissue. Refer to Figure
3-17a.
These nodes were placed in the centre of camera’s FOV and counts were
acquired for 5 minutes. Next, in Case 2, one lesion of approx. 425 µCi activity,
similar to the injected activity used at UVa for SLNBs, was taken to simulate the
injection site. The two nodes and the injection site were immersed in the water
filled box phantom. Only the two simulated nodes were placed in the centre of
camera’s FOV. Refer to Figure 3-17b. Care was taken to have the injection site
outside camera’s FOV. Again counts were acquired for 5 minutes. Table 7 clearly
shows the increase in counts in both the image histogram and the change in
shape of the energy spectrum due to the injection site in Case 2. Note the
a. b.
Figure 3-17: Experimental setup with two cases to check the effect of scatter originating at the injection site; (a) without an injection site; (b) with an injection site outside the camera’s FOV

78
additional lower energy counts in the second spectrum, which are from scatter
originating at the injection site.
J.iii) Result
a
b
C d
Figure 3-18: Effects of scatter due to injection site a. Energy histogram with no injection site present; b. energy histogram with injection site present; c. node images with no injection site; d.
node images with injection site present.
79
Table 7: Summary of the total counts calculated in each case
Corrected Energy Sum Corrected Image Sum
W/o scatter W/ Scatter Difference W/o scatter W/ Scatter Difference
25,918 49,202 23,284 25,821 48,251 22,430
Since the injection site (IS) causes a significant amount of scatter in the
field of view (FOV) of the camera, the effect on the amount of detected scatter
of the distance of the injection site from the nodes was investigated. For this
experiment, the setup shown in Figure 3-19 was used.
Figure 3-19: Experimental setup to check the effect of distance of IS from nodes
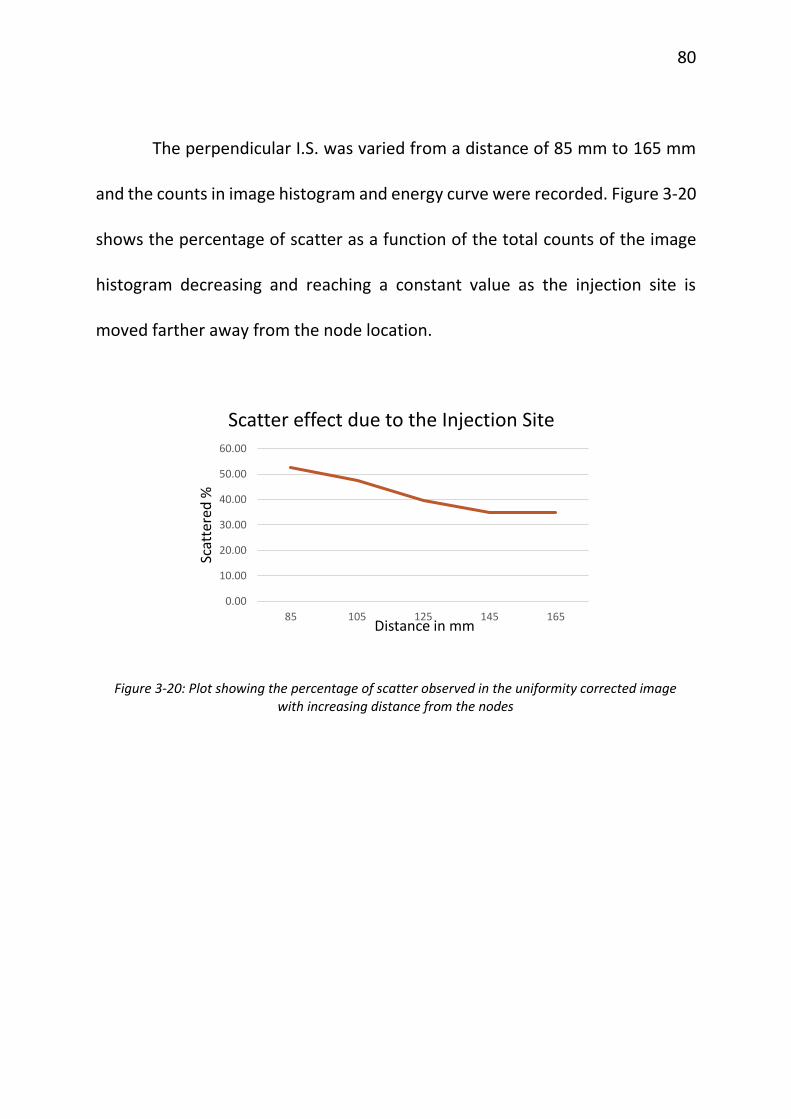
80
The perpendicular I.S. was varied from a distance of 85 mm to 165 mm
and the counts in image histogram and energy curve were recorded. Figure 3-20
shows the percentage of scatter as a function of the total counts of the image
histogram decreasing and reaching a constant value as the injection site is
moved farther away from the node location.
Figure 3-20: Plot showing the percentage of scatter observed in the uniformity corrected image with increasing distance from the nodes
0.00
10.00
20.00
30.00
40.00
50.00
60.00
85 105 125 145 165
Scat
tere
d %
Distance in mm
Scatter effect due to the Injection Site

81
CHAPTER 4
CONCLUSION
During surgical intervention, significant changes in tissue morphology
and topology can occur. This will contribute to the higher false-negative rate (5-
10%) than is generally recognized during SLNB. Intra-operative image guidance
would provide real-time surgical guidance by providing anatomical and
functional information about the operating site. This would provide in situ tissue
structure and function characterization.
This thesis has explored whether the use of a 3-D intraoperative imaging
system using a hand held gamma camera could provide advantages compared
to the use of the non-imaging probe. The potential advantages of replacing the
non-imaging probe with a camera include real time tracking of the changes in
the morphology and topology of the tissues, the estimation of shape, extent and
depth of the nodes and better detection of sentinel lymph nodes in complicated
anatomic location of the nodes or close proximity to the high-activity injection
site.

82
Compared to similar developmental and commercial small FOV gamma
cameras, the gamma camera described in this thesis shows comparable or
superior resolution and detection efficiency performance and in a hand-held
comfortable package. The results from this study can be summarized to provide
a better understanding of the performance of the novel hand held gamma
camera.
The average energy resolution of the investigational gamma camera was
calculated to be 21.5 ± 1.67 % (mean ± 95% confidence interval) at 140 keV. This
is higher than the energy resolution of small gamma cameras specified in Table
2.
An appreciable spatial resolution of 4.6 ± 0.15 mm at 0 mm source to
collimator distance was calculated in 2-D mode. One of the widely used gamma
probes in the hospitals of the United States of America, C-Trak Omni-Probe from
Care wise has a spatial resolution of 15 mm at 10 mm source to collimator
distance. Another gamma probe, ScintiProbe 15-B, pol.hi.tech has a spatial
resolution of 20 mm at 10 mm source to collimator distance. These are
considerably inferior to 5.4 ± 0.13 mm spatial resolution of the hand held gamma
camera calculated at the same source to collimator distance. Spatial resolution
of 1 cm was observed in 3-D mode.
83
Activity sensitivity in 2-D mode was recorded as 170.67 ± 6.16 cps/MBq
and 202.97 ± 19.51 cps/MBq in 3-D mode. The gamma probes, due to their poor
ability to reject scatter and pin-hole collimators have better sensitivity than the
hand held gamma camera. Maximum sensitivities of C-Trak Omni-Probe from
Care wise is 23000 cps/MBq and ScintiProbe 15-B, pol.hi.tech is 12000 cps/MBq.
The system preserves the geometric linearity of the object and gives the
depth measurement accurately with a minor error of 1.2 mm. Attenuation effect
due to distance of the lesions in a radiation attenuating material is accurately
corrected by the system. Thus the system provides for the attenuation effect
caused by the surrounding tissue. The sentinel nodes are detected by the system
with 100 % accuracy but quantification of the detected activity has an error of
18.0843%. This parameter can be modified for a better quantification result by
the system. Scatter from the injection site can affect the reconstructed images
and consequently detection of sentinel lymph nodes. Hence care should be
taken while scanning with the camera near the injection site.
This investigational system has several unique features and its
evaluation shows that surgeons can obtain valuable information from its use
during the surgery. This can be validated by conducting a clinical trial and
analyzing the results.
CHAPTER 5
FUTURE WORK
Following the characterization of the system, next step is to use the
system in the operating room (OR) for sentinel lymph node biopsy procedures
and validate the results obtained in this thesis. The proposed study is designed
to evaluate the new system for 3-D image guidance. The system will be used for
locating sentinel lymph nodes (SLNs) following standard injection of radiotracer
among melanoma patients. In addition to the investigational system two FDA-
approved system for SLN mapping will also be used in the study:
1) FGC-probe (current standard of care): Pre-operative, 2-D imaging with
a fixed gamma camera (FGC), followed by gamma probe used intraoperatively.
2) 3D probe: a novel FDA approved system that obtains 3-D images of
the radiotracer using a scanning non-imaging probe (SurgicEye declipseSPECT)
coupled to an FDA approved intraoperative gamma probe (Dilon 14 mm
Navigator GPS). The working of this probe is explained in Chapter 2. The two
systems (1 and 2) will be compared with the investigational hand held gamma

85
camera system to evaluate its usability in pre-surgical planning and
intraoperative localization of sentinel node.
REFERENCE
[1] “What Is Cancer?,” National Cancer Institute. [Online]. Available:
http://www.cancer.gov/about-cancer/understanding/what-is-cancer.
[Accessed: 08-Jun-2016].
[2] “Cancer - Mayo Clinic.” [Online]. Available:
http://www.mayoclinic.org/diseases-
conditions/cancer/basics/definition/con-20032378. [Accessed: 08-Jun-
2016].
[3] A. F. Chambers, A. C. Groom, and I. C. MacDonald, “Metastasis:
Dissemination and growth of cancer cells in metastatic sites,” Nat. Rev.
Cancer, vol. 2, no. 8, pp. 563–572, Aug. 2002.
[4] N. E. Tobler and M. Detmar, “Tumor and lymph node lymphangiogenesis—
impact on cancer metastasis,” J. Leukoc. Biol., vol. 80, no. 4, pp. 691–696,
Oct. 2006.
[5] S. A. Stacker, C. Caesar, M. E. Baldwin, G. E. Thornton, R. A. Williams, R. Prevo,
D. G. Jackson, S. Nishikawa, H. Kubo, and M. G. Achen, “VEGF-D promotes
the metastatic spread of tumor cells via the lymphatics,” Nat. Med., vol. 7,
no. 2, pp. 186–191, Feb. 2001.
87
[6] “Lymph Nodes and Cancer.” [Online]. Available:
http://www.cancer.org/cancer/cancerbasics/lymph-nodes-and-cancer.
[Accessed: 09-Jun-2016].
[7] R. F. Uren, “Cancer surgery joins the dots,” Nat. Biotechnol., vol. 22, no. 1,
pp. 38–39, Jan. 2004.
[8] L. T. Dengel, M. J. More, P. G. Judy, G. R. Petroni, M. E. Smolkin, P. K. Rehm,
S. Majewski, M. B. Williams, and C. L. Slingluff, “Intraoperative Imaging
Guidance for Sentinel Node Biopsy in Melanoma Using a Mobile Gamma
Camera,” Ann. Surg., vol. 253, no. 4, pp. 774–778, Apr. 2011.
[9] D. Elson and G.-Z. Yang, “The Principles and Role of Medical Imaging in
Surgery,” in Key Topics in Surgical Research and Methodology, T. Athanasiou,
H. Debas, and A. Darzi, Eds. Berlin, Heidelberg: Springer Berlin Heidelberg,
2010, pp. 529–543.
[10] “Sentinel node biopsy What you can expect - Mayo Clinic.” [Online].
Available: http://www.mayoclinic.org/tests-procedures/sentinel-node-
biopsy/basics/what-you-can-expect/prc-20013550. [Accessed: 13-Jun-
2016].
[11] “Nuclear Medicine,” National Institute of Biomedical Imaging and
Bioengineering, 15-May-2013. [Online]. Available:

88
https://www.nibib.nih.gov/science-education/science-topics/nuclear-
medicine. [Accessed: 14-Jun-2016].
[12] “Human Health Campus - Nuclear Medicine Handbook slides.” [Online].
Available: https://humanhealth.iaea.org/HHW/MedicalPhysics/e-
learning/Nuclear_Medicine_Handbook_slides/index.html. [Accessed: 14-
Jun-2016].
[13] T. E. Peterson and L. R. Furenlid, “SPECT detectors: the Anger Camera
and beyond,” Phys. Med. Biol., vol. 56, no. 17, pp. R145–R182, Sep. 2011.
[14] J. D. Mathews, A. V. Forsythe, Z. Brady, M. W. Butler, S. K. Goergen, G. B.
Byrnes, G. G. Giles, A. B. Wallace, P. R. Anderson, T. A. Guiver, P. McGale, T.
M. Cain, J. G. Dowty, A. C. Bickerstaffe, and S. C. Darby, “Cancer risk in 680
000 people exposed to computed tomography scans in childhood or
adolescence: data linkage study of 11 million Australians,” BMJ, vol. 346, no.
may21 1, pp. f2360–f2360, May 2013.
[15] “Computed Tomography (CT),” National Institute of Biomedical Imaging
and Bioengineering, 15-May-2013. [Online]. Available:
https://www.nibib.nih.gov/science-education/science-topics/computed-
tomography-ct. [Accessed: 13-Jul-2016].
89
[16] T. Wagner, J. Buscombe, G. Gnanasegaran, and S. Navalkissoor,
“SPECT/CT in sentinel node imaging:,” Nucl. Med. Commun., vol. 34, no. 3,
pp. 191–202, Mar. 2013.
[17] R. A. Valdés Olmos, D. D. Rietbergen, S. Vidal-Sicart, G. Manca, F.
Giammarile, and G. Mariani, “Contribution of SPECT/CT imaging to
radioguided sentinel lymph node biopsy in breast cancer, melanoma, and
other solid cancers: from ‘open and see’ to ‘see and open,’” Q. J. Nucl. Med.
Mol. Imaging Off. Publ. Ital. Assoc. Nucl. Med. AIMN Int. Assoc.
Radiopharmacol. IAR Sect. Soc. Radiopharm. Chem. Biol., vol. 58, no. 2, pp.
127–139, Jun. 2014.
[18] “2.2 Basic Principles of MRI.” [Online]. Available:
https://www.cs.sfu.ca/~stella/papers/blairthesis/main/node11.html.
[Accessed: 20-Jun-2016].
[19] W. A. Kaiser, S. O. R. Pfleiderer, and P. A. T. Baltzer, “MRI-guided
interventions of the breast,” J. Magn. Reson. Imaging, vol. 27, no. 2, pp. 347–
355, Feb. 2008.
[20] C. Li, S. Meng, X. Yang, D. Zhou, J. Wang, and J. Hu, “Sentinel lymph node
detection using magnetic resonance lymphography with conventional
90
gadolinium contrast agent in breast cancer: a preliminary clinical study,”
BMC Cancer, vol. 15, Apr. 2015.
[21] V. J. L. Kuijs, M. Moossdorff, R. J. Schipper, R. G. H. Beets-Tan, E. M.
Heuts, K. B. M. I. Keymeulen, M. L. Smidt, and M. B. I. Lobbes, “The role of
MRI in axillary lymph node imaging in breast cancer patients: a systematic
review,” Insights Imaging, vol. 6, no. 2, pp. 203–215, Mar. 2015.
[22] S. Oura, H. Tanino, T. Yoshimasu, T. Sakurai, Y. Kokawa, and Y. Okamura,
“The usefulness of sentinel node biopsy with MRI-guided lymph node
sampling in breast cancer,” Nippon Rinsho Geka Gakkai Zasshi, vol. 63, no. 7,
pp. 1607–1611, 2002.
[23] C. Chi, Y. Du, J. Ye, D. Kou, J. Qiu, J. Wang, J. Tian, and X. Chen,
“Intraoperative Imaging-Guided Cancer Surgery: From Current Fluorescence
Molecular Imaging Methods to Future Multi-Modality Imaging Technology,”
Theranostics, vol. 4, no. 11, pp. 1072–1084, Aug. 2014.
[24] G. Themelis, J. S. Yoo, K.-S. Soh, R. Schulz, and V. Ntziachristos, “Real-
time intraoperative fluorescence imaging system using light-absorption
correction,” J. Biomed. Opt., vol. 14, no. 6, pp. 64012-64012–9, 2009.
[25] O. Khullar, J. V. Frangioni, and Y. L. Colson, “Image-Guided Sentinel
Lymph Node Mapping and Nanotechnology-Based Nodal Treatment in Lung

91
Cancer using Invisible Near-Infrared Fluorescent Light,” Semin. Thorac.
Cardiovasc. Surg., vol. 21, no. 4, pp. 309–315, 2009.
[26] S. L. Troyan, V. Kianzad, S. L. Gibbs-Strauss, S. Gioux, A. Matsui, R.
Oketokoun, L. Ngo, A. Khamene, F. Azar, and J. V. Frangioni, “The FLARETM
Intraoperative Near-Infrared Fluorescence Imaging System: A First-in-Human
Clinical Trial in Breast Cancer Sentinel Lymph Node Mapping,” Ann. Surg.
Oncol., vol. 16, no. 10, pp. 2943–2952, Oct. 2009.
[27] Q. T. Nguyen and R. Y. Tsien, “Fluorescence-guided surgery with live
molecular navigation — a new cutting edge,” Nat. Rev. Cancer, vol. 13, no. 9,
pp. 653–662, Sep. 2013.
[28] “Ultrasonography - MeSH - NCBI.” [Online]. Available:
http://www.ncbi.nlm.nih.gov/mesh/68014463. [Accessed: 13-Jun-2016].
[29] M. M. Nadrljanski, “Physical principles of ultrasound | Radiology
Reference Article | Radiopaedia.org,” Radiopaedia. [Online]. Available:
http://radiopaedia.org/articles/physical-principles-of-ultrasound-1.
[Accessed: 13-Jun-2016].
[30] J. Nori, E. Vanzi, M. Bazzocchi, F. N. Bufalini, V. Distante, F. Branconi, and
T. Susini, “Role of axillary ultrasound examination in the selection of breast
92
cancer patients for sentinel node biopsy,” Am. J. Surg., vol. 193, no. 1, pp.
16–20, Jan. 2007.
[31] A. R. Sever, P. Mills, S. E. Jones, K. Cox, J. Weeks, D. Fish, and P. A. Jones,
“Preoperative Sentinel Node Identification With Ultrasound Using
Microbubbles in Patients With Breast Cancer,” Am. J. Roentgenol., vol. 196,
no. 2, pp. 251–256, Feb. 2011.
[32] L. L. Montgomery, A. C. Thorne, K. J. Van Zee, J. Fey, A. S. Heerdt, M.
Gemignani, E. Port, J. Petrek, H. S. Cody, and P. I. Borgen, “Isosulfan blue dye
reactions during sentinel lymph node mapping for breast cancer,” Anesth.
Analg., vol. 95, no. 2, p. 385–388, table of contents, Aug. 2002.
[33] Boughey JC, Suman VJ, Mittendorf EA, and et al, “Sentinel lymph node
surgery after neoadjuvant chemotherapy in patients with node-positive
breast cancer: The acosog z1071 (alliance) clinical trial,” JAMA, vol. 310, no.
14, pp. 1455–1461, Oct. 2013.
[34] “Sentinel Lymph Node Surgery Not Appropriate for All Women
Diagnosed With Breast Cancer,” Breastcancer.org. [Online]. Available:
I"7http://www.breastcancer.org/research-news/20131118:EF. [Accessed:
13-Jul-2016].
93
[35] S. Pesek, T. Ashikaga, L. E. Krag, and D. Krag, “The false-negative rate of
sentinel node biopsy in patients with breast cancer: a meta-analysis,” World
J. Surg., vol. 36, no. 9, pp. 2239–2251, Sep. 2012.
[36] Y. Wang, H. Dong, H. Wu, L. Zhang, K. Yuan, H. Chen, M. Jiao, and R. Fu,
“Improved false negative rate of axillary status using sentinel lymph node
biopsy and ultrasound-suspicious lymph node sampling in patients with early
breast cancer,” BMC Cancer, vol. 15, p. 382, 2015.
[37] K. J. Hachey and Y. L. Colson, “Current Innovations in Sentinel Lymph
Node Mapping for the Staging and Treatment of Resectable Lung Cancer,”
Semin. Thorac. Cardiovasc. Surg., vol. 26, no. 3, pp. 201–209, 2014.
[38] K. Suga, Y. Yuan, M. Okada, N. Matsunaga, A. Tangoku, S. Yamamoto, and
M. Oka, “Breast Sentinel Lymph Node Mapping at CT Lymphography with
Iopamidol: Preliminary Experience,” Radiology, vol. 230, no. 2, pp. 543–552,
Feb. 2004.
[39] Y. Liu, W. Akers, A. Q. Bauer, S. Mondal, K. Gullicksrud, G. Sudlow, J. P.
Culver, and S. Achilefu, “Intraoperative Detection of Liver Tumors Aided by
Fluorescence Goggle System and Multimodal Imaging,” The Analyst, vol. 138,
no. 8, pp. 2254–2257, Apr. 2013.
94
[40] S. Keereweer, J. D. F. Kerrebijn, P. B. A. A. Driel, B. Xie, E. L. Kaijzel, T. J.
A. Snoeks, I. Que, M. Hutteman, J. R. Vorst, J. S. D. Mieog, A. L. Vahrmeijer,
C. J. H. Velde, R. J. B. de Jong, and C. W. G. M. Löwik, “Optical Image-guided
Surgery—Where Do We Stand?,” Mol. Imaging Biol., vol. 13, no. 2, pp. 199–
207, Jul. 2010.
[41] F. Zhang, G. Niu, G. Lu, and X. Chen, “Preclinical Lymphatic Imaging,” Mol.
Imaging Biol. MIB Off. Publ. Acad. Mol. Imaging, vol. 13, no. 4, pp. 599–612,
Aug. 2011.
[42] A. Chatterjee, N. Serniak, and B. J. Czerniecki, “Sentinel Lymph Node
Biopsy in Breast Cancer: A Work in Progress,” Cancer J. Sudbury Mass, vol.
21, no. 1, pp. 7–10, 2015.
[43] M. Tsuchimochi and K. Hayama, “Intraoperative gamma cameras for
radioguided surgery: Technical characteristics, performance parameters,
and clinical applications,” Phys. Med., vol. 29, no. 2, pp. 126–138, Mar. 2013.
[44] F. Scopinaro, A. Tofani, G. di Santo, B. Di Pietro, A. Lombardi, M. Lo Russo,
A. Soluri, R. Massari, C. Trotta, and C. Amanti, “High-Resolution, Hand-Held
Camera for Sentinel-Node Detection,” Cancer Biother. Radiopharm., vol. 23,
no. 1, pp. 43–52, Feb. 2008.

95
[45] M. Tsuchimochi, H. Sakahara, K. Hayama, M. Funaki, R. Ohno, T.
Shirahata, T. Orskaug, G. Maehlum, K. Yoshioka, and E. Nygard, “A prototype
small CdTe gamma camera for radioguided surgery and other imaging
applications,” Eur. J. Nucl. Med. Mol. Imaging, vol. 30, no. 12, pp. 1605–1614,
Sep. 2003.
[46] J. N. Aarsvod, C. M. Greene, R. A. Mintzer, S. F. Grant, T. M. Styblo, N. P.
Alazraki, B. E. Patt, G. M. Caravaglia, J. Li, and J. S. Iwanczyk, “Intraoperative
gamma imaging of axillary sentinel lymph nodes in breast cancer patients,”
Phys. Med., vol. 21, pp. 76–79, Jan. 2006.
[47] C. Mathelin, S. Salvador, D. Huss, and J.-L. Guyonnet, “Precise
Localization of Sentinel Lymph Nodes and Estimation of Their Depth Using a
Prototype Intraoperative Mini γ-Camera in Patients with Breast Cancer,” J.
Nucl. Med., vol. 48, no. 4, pp. 623–629, Apr. 2007.
[48] H. Fujii, Y. Kitagawa, M. Kitajima, and A. Kubo, “Sentinel nodes of
malignancies originating in the alimentary tract,” Ann. Nucl. Med., vol. 18,
no. 1, pp. 1–12, Feb. 2004.
[49] M. Tsuchimochi, K. Hayama, T. Oda, M. Togashi, and H. Sakahara,
“Evaluation of the Efficacy of a Small CdTe γ-Camera for Sentinel Lymph Node
Biopsy,” J. Nucl. Med., vol. 49, no. 6, pp. 956–962, Jun. 2008.
96
[50] L. Vermeeren, R. A. V. Olmos, W. M. C. Klop, A. J. M. Balm, and M. W. M.
van den Brekel, “A Portable γ-Camera for Intraoperative Detection of
Sentinel Nodes in the Head and Neck Region,” J. Nucl. Med., vol. 51, no. 5,
pp. 700–703, May 2010.
[51] L. Vermeeren, R. A. V. Olmos, W. Meinhardt, and S. Horenblas,
“Intraoperative Imaging for Sentinel Node Identification in Prostate
Carcinoma: Its Use in Combination with Other Techniques,” J. Nucl. Med.,
vol. 52, no. 5, pp. 741–744, May 2011.
[52] L. Vermeeren, W. Meinhardt, A. Bex, H. G. van der Poel, W. V. Vogel, C.
A. Hoefnagel, S. Horenblas, and R. A. V. Olmos, “Paraaortic Sentinel Lymph
Nodes: Toward Optimal Detection and Intraoperative Localization Using
SPECT/CT and Intraoperative Real-Time Imaging,” J. Nucl. Med., vol. 51, no.
3, pp. 376–382, Mar. 2010.
[53] O. R. Brouwer, R. A. V. Olmos, L. Vermeeren, C. A. Hoefnagel, O. E.
Nieweg, and S. Horenblas, “SPECT/CT and a Portable γ-Camera for Image-
Guided Laparoscopic Sentinel Node Biopsy in Testicular Cancer,” J. Nucl.
Med., vol. 52, no. 4, pp. 551–554, Apr. 2011.
[54] P. Russo, A. S. Curion, G. Mettivier, M. Esposito, M. Aurilio, C. Caracò, L.
Aloj, and S. Lastoria, “Evaluation of a CdTe semiconductor based compact
97
gamma camera for sentinel lymph node imaging,” Med. Phys., vol. 38, no. 3,
pp. 1547–1560, Mar. 2011.
[55] S. Vidal-Sicart, P. Paredes, G. Zanón, J. Pahisa, S. Martinez-Román, X.
Caparrós, A. Vilalta, R. Rull, and F. Pons, “Added Value of Intraoperative Real-
Time Imaging in Searches for Difficult-to-Locate Sentinel Nodes,” J. Nucl.
Med., vol. 51, no. 8, pp. 1219–1225, Aug. 2010.
[56] P. Olcott, G. Pratx, D. Johnson, E. Mittra, R. Niederkohr, and C. S. Levin,
“Clinical evaluation of a novel intraoperative handheld gamma camera for
sentinel lymph node biopsy,” Phys. Med., vol. 30, no. 3, pp. 340–345, May
2014.
[57] K. Popovic, J. E. McKisson, B. Kross, S. Lee, J. McKisson, A. G.
Weisenberger, J. Proffitt, A. Stolin, S. Majewski, and M. B. Williams,
“Development and Characterization of a Round Hand-Held Silicon
Photomultiplier Based Gamma Camera for Intraoperative Imaging,” IEEE
Trans. Nucl. Sci., vol. 61, no. 3, pp. 1084–1091, Jun. 2014.
[58] IAEA, “Nuclear Medicine Physics,” 2015.
[59] G. B. Saha, “Performance Parameters of Gamma Cameras,” in Physics
and Radiobiology of Nuclear Medicine, Springer, 2013, pp. 127–151.
98
[60] “NEMA Publishes NEMA NU 1-2012 Performance Measurements of
Gamma Cameras - NEMA.” [Online]. Available:
https://www.nema.org/news/Pages/NEMA-Publishes-NEMA-NU-1-2012-
Performance-Measurements-of-Gamma-Cameras.aspx. [Accessed: 06-Jul-
2016].
[61] A. D. Murphy, A. Britten, and B. Powell, “Hot or not? The 10% rule in
sentinel lymph node biopsy for malignant melanoma revisited,” J. Plast.
Reconstr. Aesthetic Surg. JPRAS, vol. 67, no. 3, pp. 316–319, Mar. 2014.
[62] R. Dutta, A. Kluftinger, M. MacLeod, G. Kindrachuk, and C. Baliski,
“Revisiting the ‘10% rule’ in breast cancer sentinel lymph node biopsy: an
approach to minimize the number of sentinel lymph nodes removed,” Am. J.
Surg., vol. 203, no. 5, pp. 623–627, May 2012.
[63] V. T. D. M. D. Schatzlein, “Tutorial: Attenuation of X-Rays By Matter.”
[Online]. Available: http://www.spectroscopyonline.com/tutorial-
attenuation-x-rays-matter. [Accessed: 16-Jul-2016].
[64] S. P. Povoski, J. O. Olsen, D. C. Young, J. Clarke, W. E. Burak, M. J. Walker,
W. E. Carson, L. D. Yee, D. M. Agnese, R. V. Pozderac, N. C. Hall, and W. B.
Farrar, “Prospective randomized clinical trial comparing intradermal,
intraparenchymal, and subareolar injection routes for sentinel lymph node
99
mapping and biopsy in breast cancer,” Ann. Surg. Oncol., vol. 13, no. 11, pp.
1412–1421, Nov. 2006.
[65] K. Motomura, Y. Komoike, Y. Hasegawa, T. Kasugai, H. Inaji, S. Noguchi,
and H. Koyama, “Intradermal radioisotope injection is superior to subdermal
injection for the identification of the sentinel node in breast cancer patients,”
J. Surg. Oncol., vol. 82, no. 2, pp. 91-96-97, Feb. 2003.
[66] K. M. McMasters, S. L. Wong, R. C. Martin, C. Chao, T. M. Tuttle, R. D.
Noyes, D. J. Carlson, A. L. Laidley, T. Q. McGlothin, P. B. Ley, C. M. Brown, R.
L. Glaser, R. E. Pennington, P. S. Turk, D. Simpson, P. B. Cerrito, M. J. Edwards,
and University of Louisville Breast Cancer Study Group, “Dermal injection of
radioactive colloid is superior to peritumoral injection for breast cancer
sentinel lymph node biopsy: results of a multiinstitutional study,” Ann. Surg.,
vol. 233, no. 5, pp. 676–687, May 2001.
[67] V. S. Klimberg, I. T. Rubio, R. Henry, C. Cowan, M. Colvert, and S.
Korourian, “Subareolar Versus Peritumoral Injection for Location of the
Sentinel Lymph Node,” Ann. Surg., vol. 229, no. 6, p. 860, Jun. 1999.