Embed Size (px)
Citation preview
w a t e r r e s e a r c h 4 3 ( 2 0 0 9 ) 1 5 1 3 – 1 5 2 2
Avai lab le a t www.sc iencedi rec t .com
journa l homepage : www.e lsev ie r . com/ loca te /wat res
Evaluation of a photocatalytic reactor membrane pilotsystem for the removal of pharmaceuticals andendocrine disrupting compounds from water
Mark J. Benotti*, Benjamin D. Stanford, Eric C. Wert, Shane A. Snyder
Southern Nevada Water Authority, P.O. Box 99954, Las Vegas, NV 89193-9954, United States
a r t i c l e i n f o
Article history:
Received 18 July 2008
Received in revised form
10 October 2008
Accepted 16 December 2008
Published online 13 January 2009
Keywords:
Pharmaceuticals
Endocrine disrupting compounds
(EDCs)
Photocatalysis
Titanium dioxide (TiO2)
Yeast estrogen screen (YES) assay
Water treatment
Estrogenic activity
Advanced oxidation process (AOP)
* Corresponding author. Tel.: þ1 702 856 368E-mail address: [email protected]
0043-1354/$ – see front matter ª 2009 Elsevidoi:10.1016/j.watres.2008.12.049
a b s t r a c t
A photocatalytic reactor membrane pilot system, employing UV/TiO2 photocatalysis, was
evaluated for its ability to remove thirty-two pharmaceuticals, endocrine disrupting
compounds, and estrogenic activity from water. Concentrations of all compounds
decreased following treatment, and removal followed pseudo-first-order kinetics as
a function of the amount of treatment. Twenty-nine of the targeted compounds in addition
to total estrogenic activity were greater than 70% removed while only three compounds
were less than 50% removed following the highest level of treatment (4.24 kW h/m3). No
estrogenically active transformation products were formed during treatment. Additionally,
the unit was operated in photolytic mode (UV only) and photolytic plus H2O2 mode
(UV/H2O2) to determine the relative amount of energy required. Based on the electrical
energy per order (EEO), the unit achieved the greatest efficiency when operated in photo-
lytic plus H2O2 mode for the conditions tested.
ª 2009 Elsevier Ltd. All rights reserved.
1. Introduction particularly problematic as this pathway represents a vector
The presence of pharmaceuticals and endocrine disrupting
compounds (EDCs) in the environment has been a topic of
concern (Daughton and Ternes, 1999). Most environmental
data focus on the occurrence, fate, and transport of these
compounds in wastewater (Carballa et al., 2005; Conn et al.,
2006; Metcalfe et al., 2003; Sole et al., 2000) or receiving waters
(Kolpin et al., 2002). Their presence in source waters (Heberer
et al., 1997) and drinking water (Skutlarek et al., 2006; Snyder
et al., 2007; Stackelberg et al., 2004; Ternes et al., 2002) is
4; fax: þ1 702 856 3647.(M.J. Benotti).er Ltd. All rights reserved
for human exposure.
Another major concern over the presence of pharmaceu-
ticals and EDCs in the environment is the ability for some
compounds to act as endocrine disruptors and adversely
affect natural ecosystems. Several natural and synthetic EDCs
have been shown to impact aquatic organisms at low ng/L
concentrations, both as single compounds and as complex
mixtures (Brian et al., 2007; Brion et al., 2004; Labadie and
Budzinski, 2006). While direct links to human health through
drinking water exposure have not been proven, public fear
.
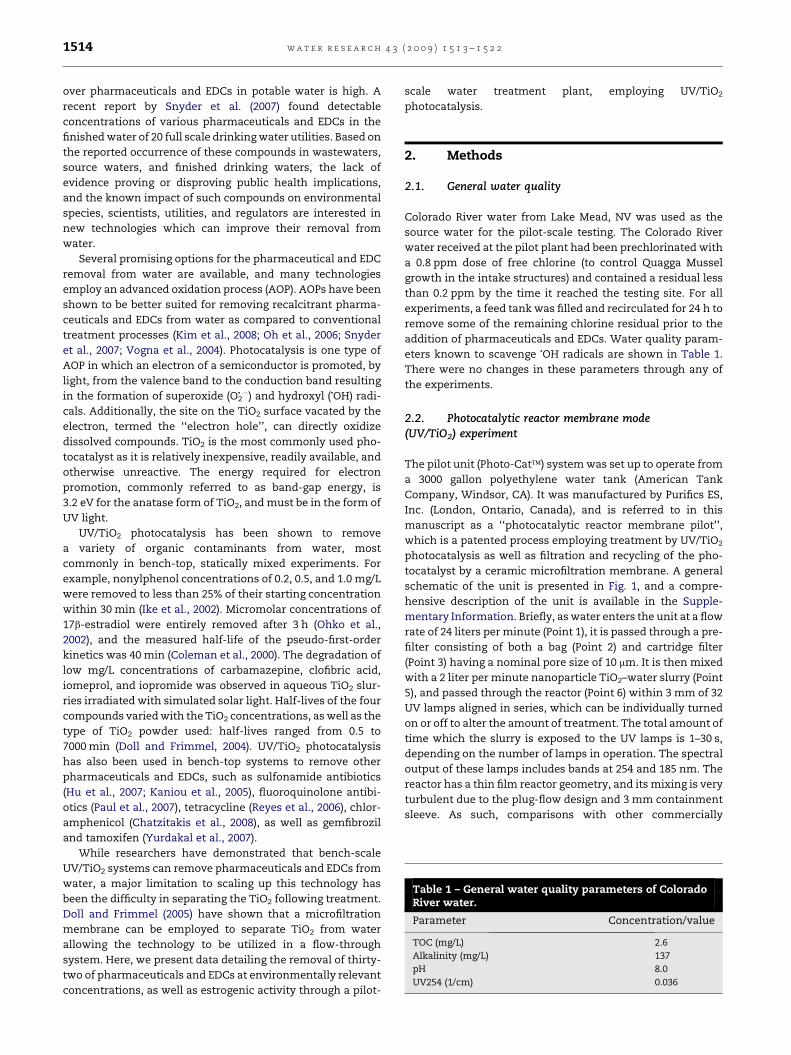
Table 1 – General water quality parameters of ColoradoRiver water.
Parameter Concentration/value
TOC (mg/L) 2.6
Alkalinity (mg/L) 137
pH 8.0
UV254 (1/cm) 0.036
w a t e r r e s e a r c h 4 3 ( 2 0 0 9 ) 1 5 1 3 – 1 5 2 21514
over pharmaceuticals and EDCs in potable water is high. A
recent report by Snyder et al. (2007) found detectable
concentrations of various pharmaceuticals and EDCs in the
finished water of 20 full scale drinking water utilities. Based on
the reported occurrence of these compounds in wastewaters,
source waters, and finished drinking waters, the lack of
evidence proving or disproving public health implications,
and the known impact of such compounds on environmental
species, scientists, utilities, and regulators are interested in
new technologies which can improve their removal from
water.
Several promising options for the pharmaceutical and EDC
removal from water are available, and many technologies
employ an advanced oxidation process (AOP). AOPs have been
shown to be better suited for removing recalcitrant pharma-
ceuticals and EDCs from water as compared to conventional
treatment processes (Kim et al., 2008; Oh et al., 2006; Snyder
et al., 2007; Vogna et al., 2004). Photocatalysis is one type of
AOP in which an electron of a semiconductor is promoted, by
light, from the valence band to the conduction band resulting
in the formation of superoxide (O2� �) and hydroxyl (�OH) radi-
cals. Additionally, the site on the TiO2 surface vacated by the
electron, termed the ‘‘electron hole’’, can directly oxidize
dissolved compounds. TiO2 is the most commonly used pho-
tocatalyst as it is relatively inexpensive, readily available, and
otherwise unreactive. The energy required for electron
promotion, commonly referred to as band-gap energy, is
3.2 eV for the anatase form of TiO2, and must be in the form of
UV light.
UV/TiO2 photocatalysis has been shown to remove
a variety of organic contaminants from water, most
commonly in bench-top, statically mixed experiments. For
example, nonylphenol concentrations of 0.2, 0.5, and 1.0 mg/L
were removed to less than 25% of their starting concentration
within 30 min (Ike et al., 2002). Micromolar concentrations of
17b-estradiol were entirely removed after 3 h (Ohko et al.,
2002), and the measured half-life of the pseudo-first-order
kinetics was 40 min (Coleman et al., 2000). The degradation of
low mg/L concentrations of carbamazepine, clofibric acid,
iomeprol, and iopromide was observed in aqueous TiO2 slur-
ries irradiated with simulated solar light. Half-lives of the four
compounds varied with the TiO2 concentrations, as well as the
type of TiO2 powder used: half-lives ranged from 0.5 to
7000 min (Doll and Frimmel, 2004). UV/TiO2 photocatalysis
has also been used in bench-top systems to remove other
pharmaceuticals and EDCs, such as sulfonamide antibiotics
(Hu et al., 2007; Kaniou et al., 2005), fluoroquinolone antibi-
otics (Paul et al., 2007), tetracycline (Reyes et al., 2006), chlor-
amphenicol (Chatzitakis et al., 2008), as well as gemfibrozil
and tamoxifen (Yurdakal et al., 2007).
While researchers have demonstrated that bench-scale
UV/TiO2 systems can remove pharmaceuticals and EDCs from
water, a major limitation to scaling up this technology has
been the difficulty in separating the TiO2 following treatment.
Doll and Frimmel (2005) have shown that a microfiltration
membrane can be employed to separate TiO2 from water
allowing the technology to be utilized in a flow-through
system. Here, we present data detailing the removal of thirty-
two of pharmaceuticals and EDCs at environmentally relevant
concentrations, as well as estrogenic activity through a pilot-
scale water treatment plant, employing UV/TiO2
photocatalysis.
2. Methods
2.1. General water quality
Colorado River water from Lake Mead, NV was used as the
source water for the pilot-scale testing. The Colorado River
water received at the pilot plant had been prechlorinated with
a 0.8 ppm dose of free chlorine (to control Quagga Mussel
growth in the intake structures) and contained a residual less
than 0.2 ppm by the time it reached the testing site. For all
experiments, a feed tank was filled and recirculated for 24 h to
remove some of the remaining chlorine residual prior to the
addition of pharmaceuticals and EDCs. Water quality param-
eters known to scavenge �OH radicals are shown in Table 1.
There were no changes in these parameters through any of
the experiments.
2.2. Photocatalytic reactor membrane mode(UV/TiO2) experiment
The pilot unit (Photo-Cat�) system was set up to operate from
a 3000 gallon polyethylene water tank (American Tank
Company, Windsor, CA). It was manufactured by Purifics ES,
Inc. (London, Ontario, Canada), and is referred to in this
manuscript as a ‘‘photocatalytic reactor membrane pilot’’,
which is a patented process employing treatment by UV/TiO2
photocatalysis as well as filtration and recycling of the pho-
tocatalyst by a ceramic microfiltration membrane. A general
schematic of the unit is presented in Fig. 1, and a compre-
hensive description of the unit is available in the Supple-
mentary Information. Briefly, as water enters the unit at a flow
rate of 24 liters per minute (Point 1), it is passed through a pre-
filter consisting of both a bag (Point 2) and cartridge filter
(Point 3) having a nominal pore size of 10 mm. It is then mixed
with a 2 liter per minute nanoparticle TiO2–water slurry (Point
5), and passed through the reactor (Point 6) within 3 mm of 32
UV lamps aligned in series, which can be individually turned
on or off to alter the amount of treatment. The total amount of
time which the slurry is exposed to the UV lamps is 1–30 s,
depending on the number of lamps in operation. The spectral
output of these lamps includes bands at 254 and 185 nm. The
reactor has a thin film reactor geometry, and its mixing is very
turbulent due to the plug-flow design and 3 mm containment
sleeve. As such, comparisons with other commercially
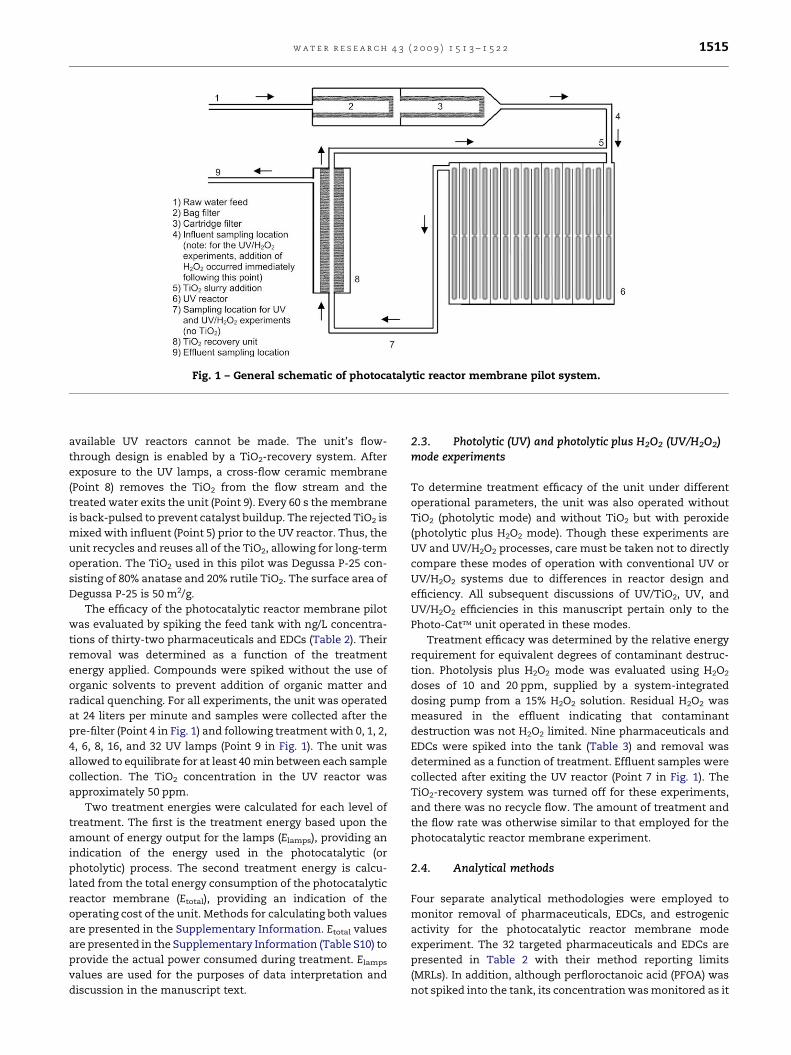
Fig. 1 – General schematic of photocatalytic reactor membrane pilot system.
w a t e r r e s e a r c h 4 3 ( 2 0 0 9 ) 1 5 1 3 – 1 5 2 2 1515
available UV reactors cannot be made. The unit’s flow-
through design is enabled by a TiO2-recovery system. After
exposure to the UV lamps, a cross-flow ceramic membrane
(Point 8) removes the TiO2 from the flow stream and the
treated water exits the unit (Point 9). Every 60 s the membrane
is back-pulsed to prevent catalyst buildup. The rejected TiO2 is
mixed with influent (Point 5) prior to the UV reactor. Thus, the
unit recycles and reuses all of the TiO2, allowing for long-term
operation. The TiO2 used in this pilot was Degussa P-25 con-
sisting of 80% anatase and 20% rutile TiO2. The surface area of
Degussa P-25 is 50 m2/g.
The efficacy of the photocatalytic reactor membrane pilot
was evaluated by spiking the feed tank with ng/L concentra-
tions of thirty-two pharmaceuticals and EDCs (Table 2). Their
removal was determined as a function of the treatment
energy applied. Compounds were spiked without the use of
organic solvents to prevent addition of organic matter and
radical quenching. For all experiments, the unit was operated
at 24 liters per minute and samples were collected after the
pre-filter (Point 4 in Fig. 1) and following treatment with 0, 1, 2,
4, 6, 8, 16, and 32 UV lamps (Point 9 in Fig. 1). The unit was
allowed to equilibrate for at least 40 min between each sample
collection. The TiO2 concentration in the UV reactor was
approximately 50 ppm.
Two treatment energies were calculated for each level of
treatment. The first is the treatment energy based upon the
amount of energy output for the lamps (Elamps), providing an
indication of the energy used in the photocatalytic (or
photolytic) process. The second treatment energy is calcu-
lated from the total energy consumption of the photocatalytic
reactor membrane (Etotal), providing an indication of the
operating cost of the unit. Methods for calculating both values
are presented in the Supplementary Information. Etotal values
are presented in the Supplementary Information (Table S10) to
provide the actual power consumed during treatment. Elamps
values are used for the purposes of data interpretation and
discussion in the manuscript text.
2.3. Photolytic (UV) and photolytic plus H2O2 (UV/H2O2)mode experiments
To determine treatment efficacy of the unit under different
operational parameters, the unit was also operated without
TiO2 (photolytic mode) and without TiO2 but with peroxide
(photolytic plus H2O2 mode). Though these experiments are
UV and UV/H2O2 processes, care must be taken not to directly
compare these modes of operation with conventional UV or
UV/H2O2 systems due to differences in reactor design and
efficiency. All subsequent discussions of UV/TiO2, UV, and
UV/H2O2 efficiencies in this manuscript pertain only to the
Photo-Cat� unit operated in these modes.
Treatment efficacy was determined by the relative energy
requirement for equivalent degrees of contaminant destruc-
tion. Photolysis plus H2O2 mode was evaluated using H2O2
doses of 10 and 20 ppm, supplied by a system-integrated
dosing pump from a 15% H2O2 solution. Residual H2O2 was
measured in the effluent indicating that contaminant
destruction was not H2O2 limited. Nine pharmaceuticals and
EDCs were spiked into the tank (Table 3) and removal was
determined as a function of treatment. Effluent samples were
collected after exiting the UV reactor (Point 7 in Fig. 1). The
TiO2-recovery system was turned off for these experiments,
and there was no recycle flow. The amount of treatment and
the flow rate was otherwise similar to that employed for the
photocatalytic reactor membrane experiment.
2.4. Analytical methods
Four separate analytical methodologies were employed to
monitor removal of pharmaceuticals, EDCs, and estrogenic
activity for the photocatalytic reactor membrane mode
experiment. The 32 targeted pharmaceuticals and EDCs are
presented in Table 2 with their method reporting limits
(MRLs). In addition, although perfloroctanoic acid (PFOA) was
not spiked into the tank, its concentration was monitored as it
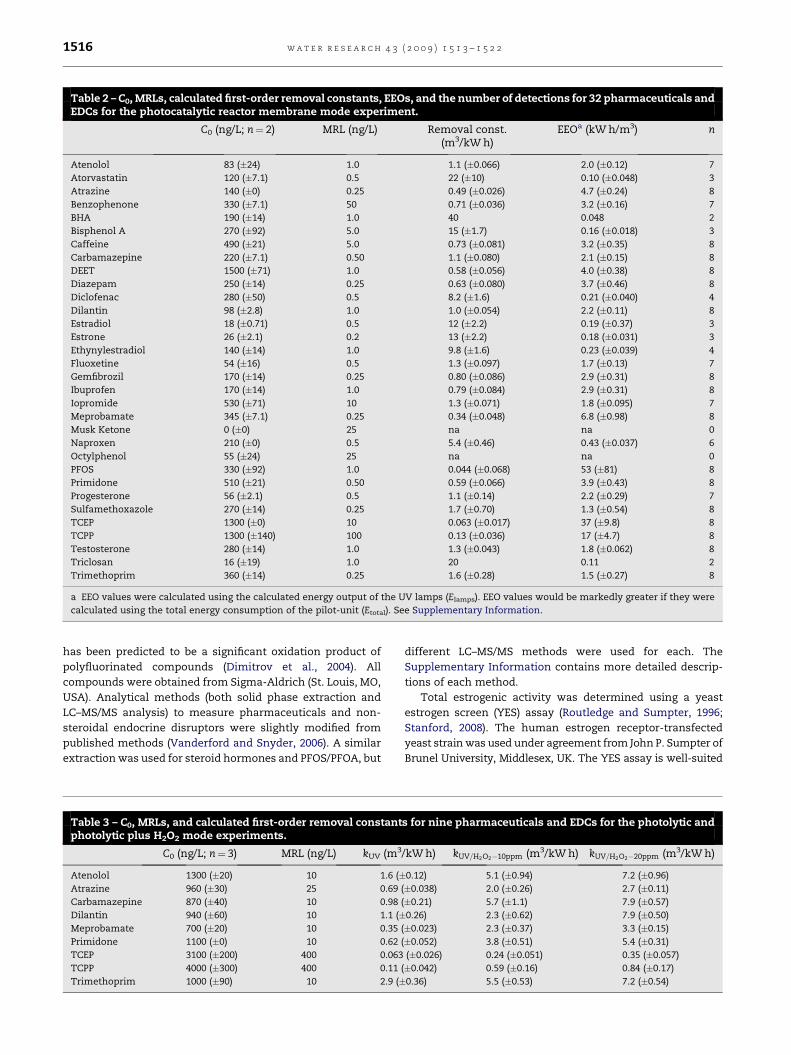
Table 2 – C0, MRLs, calculated first-order removal constants, EEOs, and the number of detections for 32 pharmaceuticals andEDCs for the photocatalytic reactor membrane mode experiment.
C0 (ng/L; n¼ 2) MRL (ng/L) Removal const.(m3/kW h)
EEOa (kW h/m3) n
Atenolol 83 (�24) 1.0 1.1 (�0.066) 2.0 (�0.12) 7
Atorvastatin 120 (�7.1) 0.5 22 (�10) 0.10 (�0.048) 3
Atrazine 140 (�0) 0.25 0.49 (�0.026) 4.7 (�0.24) 8
Benzophenone 330 (�7.1) 50 0.71 (�0.036) 3.2 (�0.16) 7
BHA 190 (�14) 1.0 40 0.048 2
Bisphenol A 270 (�92) 5.0 15 (�1.7) 0.16 (�0.018) 3
Caffeine 490 (�21) 5.0 0.73 (�0.081) 3.2 (�0.35) 8
Carbamazepine 220 (�7.1) 0.50 1.1 (�0.080) 2.1 (�0.15) 8
DEET 1500 (�71) 1.0 0.58 (�0.056) 4.0 (�0.38) 8
Diazepam 250 (�14) 0.25 0.63 (�0.080) 3.7 (�0.46) 8
Diclofenac 280 (�50) 0.5 8.2 (�1.6) 0.21 (�0.040) 4
Dilantin 98 (�2.8) 1.0 1.0 (�0.054) 2.2 (�0.11) 8
Estradiol 18 (�0.71) 0.5 12 (�2.2) 0.19 (�0.37) 3
Estrone 26 (�2.1) 0.2 13 (�2.2) 0.18 (�0.031) 3
Ethynylestradiol 140 (�14) 1.0 9.8 (�1.6) 0.23 (�0.039) 4
Fluoxetine 54 (�16) 0.5 1.3 (�0.097) 1.7 (�0.13) 7
Gemfibrozil 170 (�14) 0.25 0.80 (�0.086) 2.9 (�0.31) 8
Ibuprofen 170 (�14) 1.0 0.79 (�0.084) 2.9 (�0.31) 8
Iopromide 530 (�71) 10 1.3 (�0.071) 1.8 (�0.095) 7
Meprobamate 345 (�7.1) 0.25 0.34 (�0.048) 6.8 (�0.98) 8
Musk Ketone 0 (�0) 25 na na 0
Naproxen 210 (�0) 0.5 5.4 (�0.46) 0.43 (�0.037) 6
Octylphenol 55 (�24) 25 na na 0
PFOS 330 (�92) 1.0 0.044 (�0.068) 53 (�81) 8
Primidone 510 (�21) 0.50 0.59 (�0.066) 3.9 (�0.43) 8
Progesterone 56 (�2.1) 0.5 1.1 (�0.14) 2.2 (�0.29) 7
Sulfamethoxazole 270 (�14) 0.25 1.7 (�0.70) 1.3 (�0.54) 8
TCEP 1300 (�0) 10 0.063 (�0.017) 37 (�9.8) 8
TCPP 1300 (�140) 100 0.13 (�0.036) 17 (�4.7) 8
Testosterone 280 (�14) 1.0 1.3 (�0.043) 1.8 (�0.062) 8
Triclosan 16 (�19) 1.0 20 0.11 2
Trimethoprim 360 (�14) 0.25 1.6 (�0.28) 1.5 (�0.27) 8
a EEO values were calculated using the calculated energy output of the UV lamps (Elamps). EEO values would be markedly greater if they were
calculated using the total energy consumption of the pilot-unit (Etotal). See Supplementary Information.
w a t e r r e s e a r c h 4 3 ( 2 0 0 9 ) 1 5 1 3 – 1 5 2 21516
has been predicted to be a significant oxidation product of
polyfluorinated compounds (Dimitrov et al., 2004). All
compounds were obtained from Sigma-Aldrich (St. Louis, MO,
USA). Analytical methods (both solid phase extraction and
LC–MS/MS analysis) to measure pharmaceuticals and non-
steroidal endocrine disruptors were slightly modified from
published methods (Vanderford and Snyder, 2006). A similar
extraction was used for steroid hormones and PFOS/PFOA, but
Table 3 – C0, MRLs, and calculated first-order removal constantphotolytic plus H2O2 mode experiments.
C0 (ng/L; n¼ 3) MRL (ng/L) kUV (m3
Atenolol 1300 (�20) 10 1.6 (�Atrazine 960 (�30) 25 0.69
Carbamazepine 870 (�40) 10 0.98
Dilantin 940 (�60) 10 1.1 (�Meprobamate 700 (�20) 10 0.35
Primidone 1100 (�0) 10 0.62
TCEP 3100 (�200) 400 0.063
TCPP 4000 (�300) 400 0.11
Trimethoprim 1000 (�90) 10 2.9 (�
different LC–MS/MS methods were used for each. The
Supplementary Information contains more detailed descrip-
tions of each method.
Total estrogenic activity was determined using a yeast
estrogen screen (YES) assay (Routledge and Sumpter, 1996;
Stanford, 2008). The human estrogen receptor-transfected
yeast strain was used under agreement from John P. Sumpter of
Brunel University, Middlesex, UK. The YES assay is well-suited
s for nine pharmaceuticals and EDCs for the photolytic and
/kW h) kUV=H2O2�10ppm (m3/kW h) kUV=H2O2�20ppm (m3/kW h)
0.12) 5.1 (�0.94) 7.2 (�0.96)
(�0.038) 2.0 (�0.26) 2.7 (�0.11)
(�0.21) 5.7 (�1.1) 7.9 (�0.57)
0.26) 2.3 (�0.62) 7.9 (�0.50)
(�0.023) 2.3 (�0.37) 3.3 (�0.15)
(�0.052) 3.8 (�0.51) 5.4 (�0.31)
(�0.026) 0.24 (�0.051) 0.35 (�0.057)
(�0.042) 0.59 (�0.16) 0.84 (�0.17)
0.36) 5.5 (�0.53) 7.2 (�0.54)
w a t e r r e s e a r c h 4 3 ( 2 0 0 9 ) 1 5 1 3 – 1 5 2 2 1517
to measuring overall estrogenic activity as the human estrogen
receptor-transfected yeast employed for this study have been
shown to be resistant to interference from androgens (Sohoni
and Sumpter, 1998) and are able to respond to molecules
capable of binding with the estrogen receptor site. As such, the
assay is able to detect any loss of parent molecules in addition
to the formation of estrogenically active transformation prod-
ucts. Estrogenic activity was determined from the concentra-
tion of estradiol or the relative concentration of the sample
extract needed to induce 50% of the maximum response,
written as the EC50. Further information pertaining to the YES
assay methods used in this study, is available elsewhere
(Stanford, 2008).
A separate analytical method was employed to monitor
concentrations of the nine emerging contaminants through
the photolytic and photolytic plus H2O2 mode experiments.
This method employs an online solid phase extraction
(Symbiosis, Spark Holland, Emmen, The Netherlands), fol-
lowed by LC–MS/MS analysis. Although less time-consuming,
this method is not as sensitive as offline extraction methods,
and it was necessary to spike at slightly higher concentra-
tions. Spiked concentrations and method reporting limits
(MRLs) for the compounds targeted in this photolytic and
photolytic plus H2O2 mode experiments are presented in Table
3. Additional details of this method are provided in Supple-
mentary Information.
2.5. Experimental design
To spike the feed tank, approximately 5 mg of each compound
was transferred to a 2000 mL flask where most dissolved into
DI water. The contents of the flask were added to the 3000
gallon tank when it was full, and the flask was flushed with
volumes of water to transfer all of the undissolved material.
The tank was then topped off and its contents were circulated
for two days to homogenize. Samples were collected prior to
treatment at the start and finish of the experiment to ensure
homogenization. These samples also indicate that any
observed removal was due to photocatalysis, photolysis, or
photolysis plus H2O2, and not due to chemical insolubility,
slow dissolution, particle adsorption, adsorption to the tank
wall, or reaction with free chlorine present in the feed water.
Tables 2 and 3 list the mean concentrations of spiked
compounds in the feed water. Only one compound (musk
ketone) was entirely lost during homogenization of the tank,
perhaps due to the fact that it is a fragrance compound, and
therefore volatile. The low standard deviations of influent
concentrations (C0) measured throughout each experiment
illustrate that all spiked compounds were well-mixed in the
feed water. Raw data are available in the Supplementary
Information.
Additional samples were collected with zero UV lamps in
operation to determine whether or not compounds were
adsorbed to the TiO2 nanoparticles or the ceramic membrane
(for the photocatalytic reactor membrane experiment) or
reacted with the H2O2 (for the photolytic plus H2O2 mode
experiments). In these cases, the effluent concentrations
without any UV lamps in operation were similar to influent
concentrations, thus loss due to adsorption or direct reaction
with H2O2 was not observed.
2.6. Mathematical treatment to determine removalconstants and associated error
First-order removal constants (k) and their associated error
were calculated from the raw data using the Regression
Statistics associated with Microsoft Office’s Data Analysis
feature. The range of x-data data for this analysis were the
treatment energies (Elamps), the range of y-data were the
natural log of the concentration of a compound at a particular
energy (Ce) divided C0, and the regression was forced through
the origin. The standard deviation of the rate was calculated
from the standard error and number of observations associ-
ated with the slope of the regression. Removal constants and
their standard deviations are presented in Table 2 for the
photocatalytic reactor membrane mode experiment and in
Table 3 for the photolytic and photolytic plus H2O2 mode
experiments.
3. Results and discussion
3.1. Removal of pharmaceuticals and EDCs during thephotocatalytic reactor membrane mode experiment
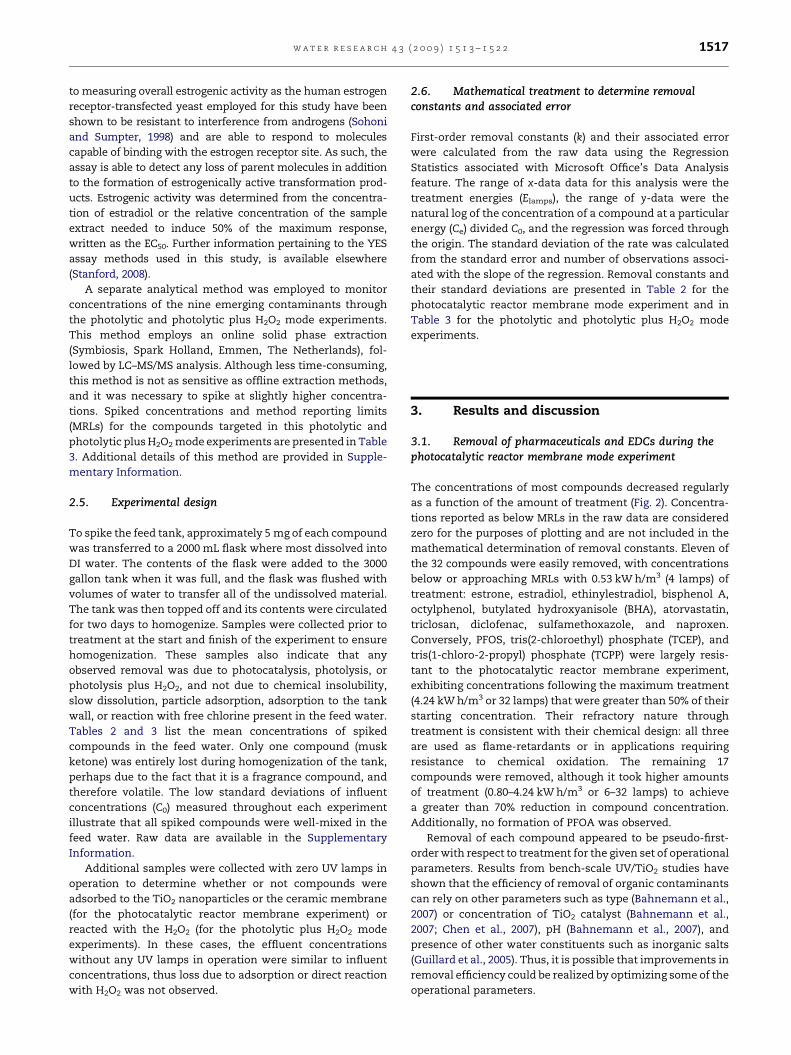
The concentrations of most compounds decreased regularly
as a function of the amount of treatment (Fig. 2). Concentra-
tions reported as below MRLs in the raw data are considered
zero for the purposes of plotting and are not included in the
mathematical determination of removal constants. Eleven of
the 32 compounds were easily removed, with concentrations
below or approaching MRLs with 0.53 kW h/m3 (4 lamps) of
treatment: estrone, estradiol, ethinylestradiol, bisphenol A,
octylphenol, butylated hydroxyanisole (BHA), atorvastatin,
triclosan, diclofenac, sulfamethoxazole, and naproxen.
Conversely, PFOS, tris(2-chloroethyl) phosphate (TCEP), and
tris(1-chloro-2-propyl) phosphate (TCPP) were largely resis-
tant to the photocatalytic reactor membrane experiment,
exhibiting concentrations following the maximum treatment
(4.24 kW h/m3 or 32 lamps) that were greater than 50% of their
starting concentration. Their refractory nature through
treatment is consistent with their chemical design: all three
are used as flame-retardants or in applications requiring
resistance to chemical oxidation. The remaining 17
compounds were removed, although it took higher amounts
of treatment (0.80–4.24 kW h/m3 or 6–32 lamps) to achieve
a greater than 70% reduction in compound concentration.
Additionally, no formation of PFOA was observed.
Removal of each compound appeared to be pseudo-first-
order with respect to treatment for the given set of operational
parameters. Results from bench-scale UV/TiO2 studies have
shown that the efficiency of removal of organic contaminants
can rely on other parameters such as type (Bahnemann et al.,
2007) or concentration of TiO2 catalyst (Bahnemann et al.,
2007; Chen et al., 2007), pH (Bahnemann et al., 2007), and
presence of other water constituents such as inorganic salts
(Guillard et al., 2005). Thus, it is possible that improvements in
removal efficiency could be realized by optimizing some of the
operational parameters.
0
0.2
0.4
0.6
0.8
1
1.2
1.4
PrimidoneGemfibrozilDiclofenacIbuprofenTrimethoprimSulfamethoxazoleNaproxenMeprobamate
0
0.2
0.4
0.6
0.8
1
1.2
1.4
0 1 2 3 4 5 0 1 2 3 4 5
AtenololIopromideCaffeineFluoxetineDilantinCarbamazepineDiazepamAtorvastatin
0
0.2
0.4
0.6
0.8
1
1.2
1.4
TestosteroneProgesteroneEstroneEstradiolEthynylestradiol
0
0.2
0.4
0.6
0.8
1
1.2
1.4
0 1 2 3 4 5 0 1 2 3 4 5
PFOSTCPPTCEP
0
0.2
0.4
0.6
0.8
1
1.2
1.4
Bisphenol ABenzophenoneOctylphenolBHAMusk Ketone
0
0.2
0.4
0.6
0.8
1
1.2
1.4
0 1 2 3 4 5 0 1 2 3 4 5
AtrazineDEETTriclosan
Ce/C
0C
e/C
0C
e/C
0
Energy per volume treated (kWh/m3)Energy per volume treated (kWh/m
3)
Pharmaceuticals Pharmaceuticals, cont.
Steroid hormones Flame retardant-like compounds
Non-steroidal EDCs Miscellaneous
A B
C D
E F
Fig. 2 – Removal of 32 pharmaceuticals and EDCs as a function of treatment energy by the photocatalytic reactor membrane
mode experiment separated by A) and B) pharmaceuticals, C) steroid hormones, D) flame retardant-like compounds, E) non-
steroidal EDCs, and F) miscellaneous.
w a t e r r e s e a r c h 4 3 ( 2 0 0 9 ) 1 5 1 3 – 1 5 2 21518
3.2. Removal of estrogenic activity during thephotocatalytic reactor membrane mode experiment
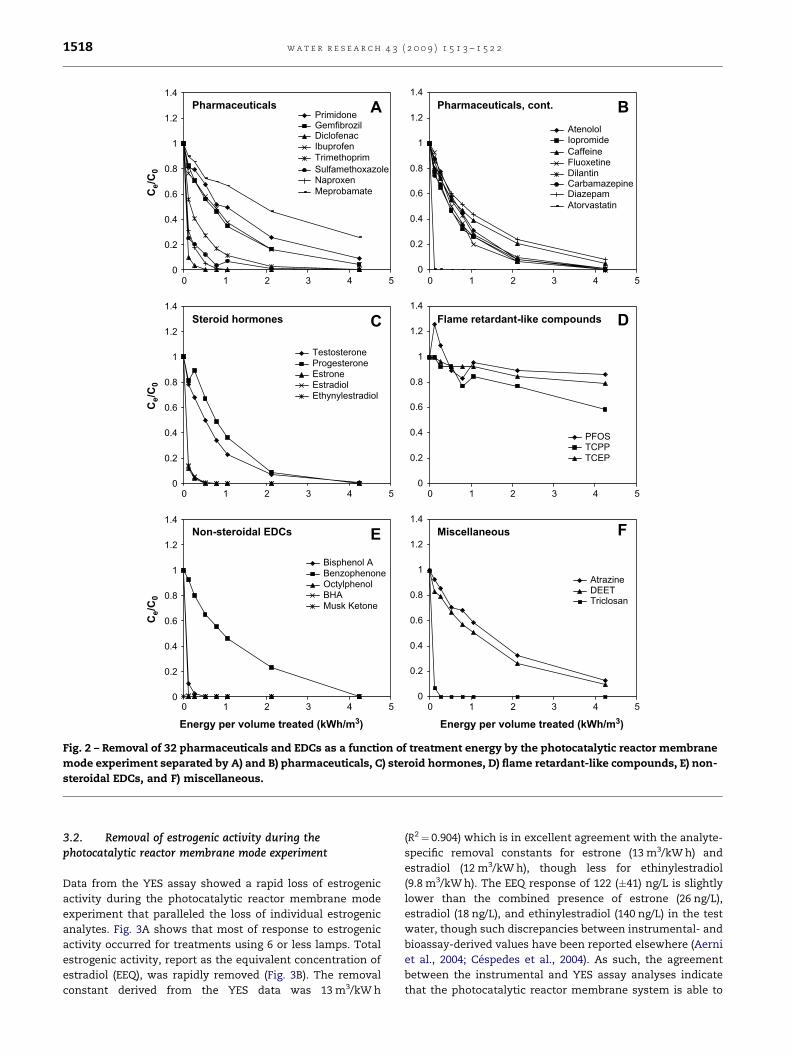
Data from the YES assay showed a rapid loss of estrogenic
activity during the photocatalytic reactor membrane mode
experiment that paralleled the loss of individual estrogenic
analytes. Fig. 3A shows that most of response to estrogenic
activity occurred for treatments using 6 or less lamps. Total
estrogenic activity, report as the equivalent concentration of
estradiol (EEQ), was rapidly removed (Fig. 3B). The removal
constant derived from the YES data was 13 m3/kW h
(R2¼ 0.904) which is in excellent agreement with the analyte-
specific removal constants for estrone (13 m3/kW h) and
estradiol (12 m3/kW h), though less for ethinylestradiol
(9.8 m3/kW h). The EEQ response of 122 (�41) ng/L is slightly
lower than the combined presence of estrone (26 ng/L),
estradiol (18 ng/L), and ethinylestradiol (140 ng/L) in the test
water, though such discrepancies between instrumental- and
bioassay-derived values have been reported elsewhere (Aerni
et al., 2004; Cespedes et al., 2004). As such, the agreement
between the instrumental and YES assay analyses indicate
that the photocatalytic reactor membrane system is able to
0
20
40
60
80
100
120
140
0.4
0.6
0.8
1.0
1.2
1.4
1.6
0 1 2 3 4 50 0.001 0.1 10
EE
Q (n
g/L
)
Energy per volume treated (kWh/m3)
A550-A
660
Concentration Factor
0 lamps 2 lamps
6 lamps
A B
Fig. 3 – Removal of estrogenic activity by the photocatalytic reactor membrane mode experiment by A) YES dose–response
curve and B) EEQ loss.
0
0.2
0.4
0.6
0.8
1
1.2
energy (kWh/m3)
Ce/C
0
0
0.2
0.4
0.6
0.8
1
1.2
energy (kWh/m3)
Ce/C
0
0
0.2
0.4
0.6
0.8
1
1.2
0 1 2 3 4 5
0 1 2 3 4 5
0 1 2 3 4 5
energy (kWh/m3)
Ce/C
0
AtenololAtrazineCarbamazepineDilantinMeprobamate
PrimidoneTCEPTCPPTrimethoprim
A
B
C
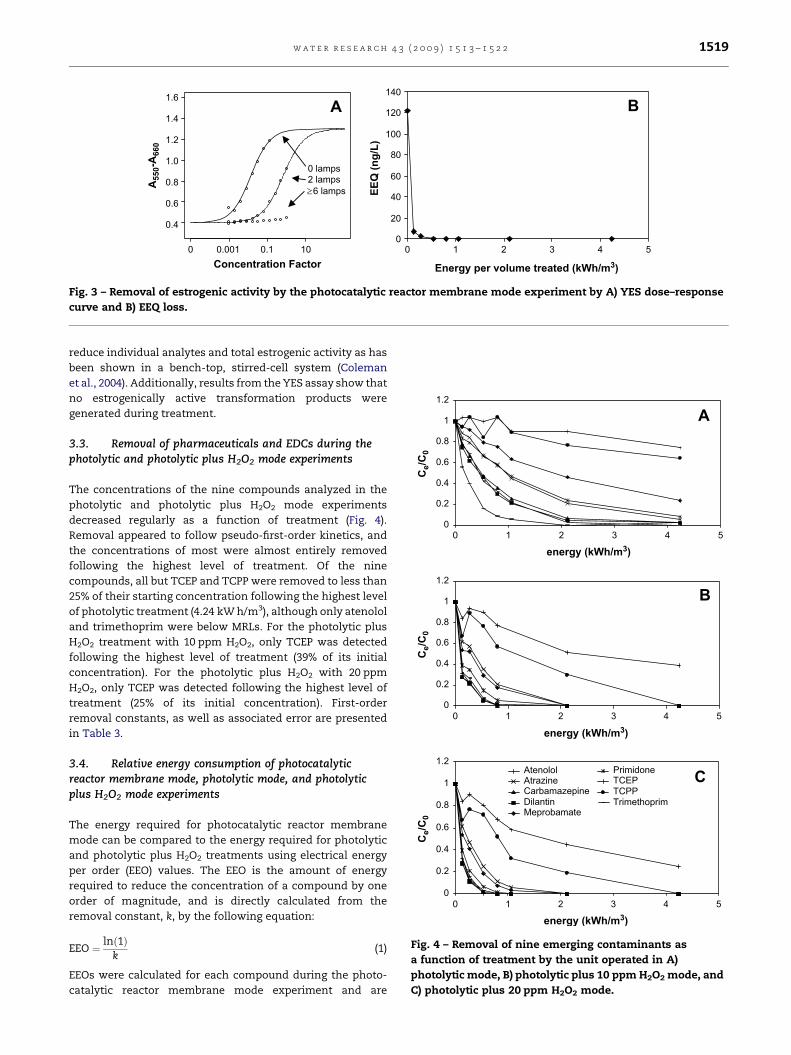
Fig. 4 – Removal of nine emerging contaminants as
a function of treatment by the unit operated in A)
photolytic mode, B) photolytic plus 10 ppm H2O2 mode, and
C) photolytic plus 20 ppm H2O2 mode.
w a t e r r e s e a r c h 4 3 ( 2 0 0 9 ) 1 5 1 3 – 1 5 2 2 1519
reduce individual analytes and total estrogenic activity as has
been shown in a bench-top, stirred-cell system (Coleman
et al., 2004). Additionally, results from the YES assay show that
no estrogenically active transformation products were
generated during treatment.
3.3. Removal of pharmaceuticals and EDCs during thephotolytic and photolytic plus H2O2 mode experiments
The concentrations of the nine compounds analyzed in the
photolytic and photolytic plus H2O2 mode experiments
decreased regularly as a function of treatment (Fig. 4).
Removal appeared to follow pseudo-first-order kinetics, and
the concentrations of most were almost entirely removed
following the highest level of treatment. Of the nine
compounds, all but TCEP and TCPP were removed to less than
25% of their starting concentration following the highest level
of photolytic treatment (4.24 kW h/m3), although only atenolol
and trimethoprim were below MRLs. For the photolytic plus
H2O2 treatment with 10 ppm H2O2, only TCEP was detected
following the highest level of treatment (39% of its initial
concentration). For the photolytic plus H2O2 with 20 ppm
H2O2, only TCEP was detected following the highest level of
treatment (25% of its initial concentration). First-order
removal constants, as well as associated error are presented
in Table 3.
3.4. Relative energy consumption of photocatalyticreactor membrane mode, photolytic mode, and photolyticplus H2O2 mode experiments
The energy required for photocatalytic reactor membrane
mode can be compared to the energy required for photolytic
and photolytic plus H2O2 treatments using electrical energy
per order (EEO) values. The EEO is the amount of energy
required to reduce the concentration of a compound by one
order of magnitude, and is directly calculated from the
removal constant, k, by the following equation:
EEO ¼ lnð1Þk
(1)
EEOs were calculated for each compound during the photo-
catalytic reactor membrane mode experiment and are
0.1
1
10
100
EE
O (kW
h/m
3)
UV/TiO2 photocatalysisUV photolysisUV/H2O2 (10ppm)UV/H2O2 (20ppm)
Aten
olol
Atra
zine
Car
bam
azep
ine
Dila
ntin
Mep
roba
mat
e
Prim
idon
e
TCEP
TCPP
Trim
etho
prim
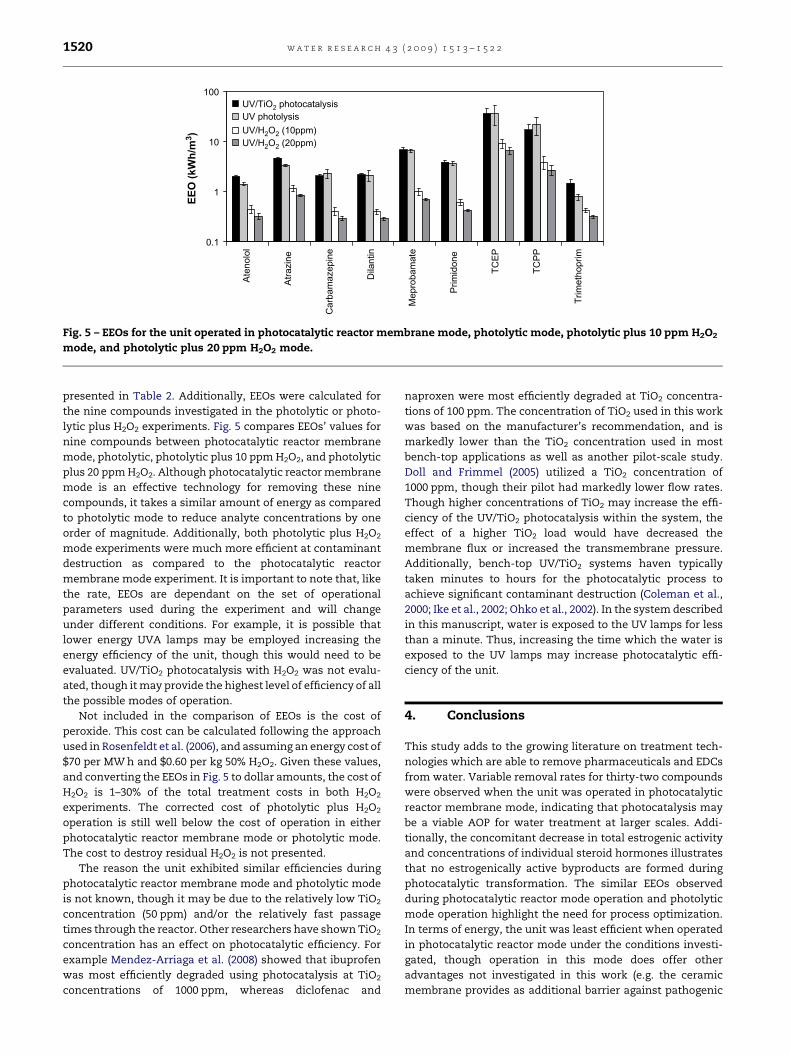
Fig. 5 – EEOs for the unit operated in photocatalytic reactor membrane mode, photolytic mode, photolytic plus 10 ppm H2O2
mode, and photolytic plus 20 ppm H2O2 mode.
w a t e r r e s e a r c h 4 3 ( 2 0 0 9 ) 1 5 1 3 – 1 5 2 21520
presented in Table 2. Additionally, EEOs were calculated for
the nine compounds investigated in the photolytic or photo-
lytic plus H2O2 experiments. Fig. 5 compares EEOs’ values for
nine compounds between photocatalytic reactor membrane
mode, photolytic, photolytic plus 10 ppm H2O2, and photolytic
plus 20 ppm H2O2. Although photocatalytic reactor membrane
mode is an effective technology for removing these nine
compounds, it takes a similar amount of energy as compared
to photolytic mode to reduce analyte concentrations by one
order of magnitude. Additionally, both photolytic plus H2O2
mode experiments were much more efficient at contaminant
destruction as compared to the photocatalytic reactor
membrane mode experiment. It is important to note that, like
the rate, EEOs are dependant on the set of operational
parameters used during the experiment and will change
under different conditions. For example, it is possible that
lower energy UVA lamps may be employed increasing the
energy efficiency of the unit, though this would need to be
evaluated. UV/TiO2 photocatalysis with H2O2 was not evalu-
ated, though it may provide the highest level of efficiency of all
the possible modes of operation.
Not included in the comparison of EEOs is the cost of
peroxide. This cost can be calculated following the approach
used in Rosenfeldt et al. (2006), and assuming an energy cost of
$70 per MW h and $0.60 per kg 50% H2O2. Given these values,
and converting the EEOs in Fig. 5 to dollar amounts, the cost of
H2O2 is 1–30% of the total treatment costs in both H2O2
experiments. The corrected cost of photolytic plus H2O2
operation is still well below the cost of operation in either
photocatalytic reactor membrane mode or photolytic mode.
The cost to destroy residual H2O2 is not presented.
The reason the unit exhibited similar efficiencies during
photocatalytic reactor membrane mode and photolytic mode
is not known, though it may be due to the relatively low TiO2
concentration (50 ppm) and/or the relatively fast passage
times through the reactor. Other researchers have shown TiO2
concentration has an effect on photocatalytic efficiency. For
example Mendez-Arriaga et al. (2008) showed that ibuprofen
was most efficiently degraded using photocatalysis at TiO2
concentrations of 1000 ppm, whereas diclofenac and
naproxen were most efficiently degraded at TiO2 concentra-
tions of 100 ppm. The concentration of TiO2 used in this work
was based on the manufacturer’s recommendation, and is
markedly lower than the TiO2 concentration used in most
bench-top applications as well as another pilot-scale study.
Doll and Frimmel (2005) utilized a TiO2 concentration of
1000 ppm, though their pilot had markedly lower flow rates.
Though higher concentrations of TiO2 may increase the effi-
ciency of the UV/TiO2 photocatalysis within the system, the
effect of a higher TiO2 load would have decreased the
membrane flux or increased the transmembrane pressure.
Additionally, bench-top UV/TiO2 systems haven typically
taken minutes to hours for the photocatalytic process to
achieve significant contaminant destruction (Coleman et al.,
2000; Ike et al., 2002; Ohko et al., 2002). In the system described
in this manuscript, water is exposed to the UV lamps for less
than a minute. Thus, increasing the time which the water is
exposed to the UV lamps may increase photocatalytic effi-
ciency of the unit.
4. Conclusions
This study adds to the growing literature on treatment tech-
nologies which are able to remove pharmaceuticals and EDCs
from water. Variable removal rates for thirty-two compounds
were observed when the unit was operated in photocatalytic
reactor membrane mode, indicating that photocatalysis may
be a viable AOP for water treatment at larger scales. Addi-
tionally, the concomitant decrease in total estrogenic activity
and concentrations of individual steroid hormones illustrates
that no estrogenically active byproducts are formed during
photocatalytic transformation. The similar EEOs observed
during photocatalytic reactor mode operation and photolytic
mode operation highlight the need for process optimization.
In terms of energy, the unit was least efficient when operated
in photocatalytic reactor mode under the conditions investi-
gated, though operation in this mode does offer other
advantages not investigated in this work (e.g. the ceramic
membrane provides as additional barrier against pathogenic
w a t e r r e s e a r c h 4 3 ( 2 0 0 9 ) 1 5 1 3 – 1 5 2 2 1521
microbes). Results from this study will be of interest to those
interested in the removal of pharmaceuticals and EDCs from
water, especially in areas with sensitive receiving waters as
the photocatalytic reactor membrane contains no chemical
residual in the treated water. In short, the photocatalytic
reactor membrane is a useful treatment technology for water
treatment as determined by pharmaceutical and EDC
destruction as well as the removal of estrogenic activity.
Acknowledgements
The authors gratefully acknowledge the WateReuse Founda-
tion’s financial, technical, and administrative assistance in
funding and managing the project through which this infor-
mation was discovered (Grant 06-012). The authors would also
like to thank Tony Powell and Brian Butters of Purifics ES, Inc.,
for use of the Photo-Cat� unit and the staff at the SNWA
Water Quality Research and Development Laboratory for the
analysis of trace contaminants.
Supplementary Information
Supplementary data associated with this article can be found
in the online version, at doi:10.1016/j.watres.2008.12.049.
r e f e r e n c e s
Aerni, H.-R., Kobler, B., Rutishauser, B., Wettstein, F., Fischer, R.,Giger, W., Hungerbuhler, A., Marazuela, M.D., Peter, A.,Schonenberger, R., Vogeli, A.C., Suter, M.F., Eggen, R.L., 2004.Combined biological and chemical assessment of estrogenicactivities in wastewater treatment plant effluents. Analyticaland Bioanalytical Chemistry 378 (3), 688–696.
Bahnemann, W., Muneer, M., Haque, M.M., 2007. Titaniumdioxide-mediated photocatalysed degradation of few selectedorganic pollutants in aqueous suspensions. Catalysis Today124 (3–4), 133–148.
Brian, J.V., Harris, C.A., Scholze, M., Kortenkamp, A., Booy, P.,Lamoree, M., Pojana, G., Jonkers, N., Marcomini, A., Sumpter, J.P., 2007. Evidence of estrogenic mixture effects on thereproductive performance of fish. Environmental Science &Technology 41 (1), 337–344.
Brion, F., Tyler, C.R., Palazzi, X., Laillet, B., Porcher, J.M., Garric, J.,Flammarion, P., 2004. Impacts of 17[beta]-estradiol, includingenvironmentally relevant concentrations, on reproductionafter exposure during embryo-larval-, juvenile- and adult-lifestages in zebrafish (Danio rerio). Aquatic Toxicology 68 (3),193–217.
Carballa, M., Omil, F., Lema, J.M., 2005. Removal of cosmeticingredients and pharmaceuticals in sewage primarytreatment. Water Research 39 (19), 4790–4796.
Cespedes, R., Petrovic, M., Raldua, D., Saura, U., Pina, B.,Lacorte, S., Viana, P., Barcelo, D., 2004. Integrated procedurefor determination of endocrine-disrupting activity in surfacewaters and sediments by use of the biological techniquerecombinant yeast assay and chemical analysis by LC–ESI–MS.Analytical & Bioanalytical Chemistry 378 (3), 697–708.
Chatzitakis, A., Berberidou, C., Paspaltsis, I., Kyriakou, G.,Sklaviadis, T., Poulios, I., 2008. Photocatalytic degradation anddrug activity reduction of chloramphenicol. Water Research42 (1–2), 386–394.
Chen, J.Q., Wang, D., Zhu, M.X., Gao, C.J., 2007. Photocatalyticdegradation of dimethoate using nanosized TiO2 powder.Desalination 207 (1–3), 87–94.
Coleman, H.M., Eggins, B.R., Byrne, J.A., Palmer, F.L., King, E., 2000.Photocatalytic degradation of 17-beta-oestradiol onimmobilised TiO2. Applied Catalysis B-Environmental 24 (1),L1–L5.
Coleman, H.M., Routledge, E.J., Sumpter, J.P., Eggins, B.R.,Byrne, J.A., 2004. Rapid loss of estrogenicity of steroidestrogens by UVA photolysis and photocatalysis over animmobilised titanium dioxide catalyst. Water Research 38(14–15), 3233–3240.
Conn, K.E., Barber, L.B., Brown, G.K., Siegrist, R.L., 2006.Occurrence and fate of organic contaminants during onsitewastewater treatment. Environmental Science & Technology40 (23), 7358–7366.
Daughton, C.G., Ternes, T.A., 1999. Pharmaceuticals and personalcare products in the environment: agents of subtle change?Environmental Health Perspectives 107, 907–938.
Dimitrov, S., Kamenska, V., Walker, J.D., Windle, W., Purdy, R.,Lewis, M., Mekenyan, O., 2004. Predicting the biodegradationproducts of perfluorinated chemicals using CATABOL. Sar andQsar in Environmental Research 15 (1), 69–82.
Doll, T.E., Frimmel, F.H., 2004. Kinetic study of photocatalyticdegradation of carbamazepine, clofibric acid, iomeprol andiopromide assisted by different TiO2 materials –determination of intermediates and reaction pathways. WaterResearch 38 (4), 955–964.
Doll, T.E., Frimmel, F.H., 2005. Cross-flow microfiltration withperiodical back-washing for photocatalytic degradation ofpharmaceutical and diagnostic residues-evaluation of thelong-term stability of the photocatalytic activity of TiO2.Water Research 39 (5), 847–854.
Guillard, C., Puzenat, E., Lachheb, H., Houas, A., Herrmann, J.M.,2005. Why inorganic salts decrease the TiO2 photocatalyticefficiency. International Journal of Photoenergy 7 (1), 1–9.
Heberer, T., Dunnbier, U., Reilich, C., Stan, H.J., 1997. Detection ofdrugs and drug metabolites in ground water samples ofa drinking water treatment plant. Fresenius EnvironmentalBulletin 6 (7–8), 438–443.
Hu, L.H., Flanders, P.M., Miller, P.L., Strathmann, T.J., 2007.Oxidation of sulfamethoxazole and related antimicrobialagents by TiO2 photocatalysis. Water Research 41 (12),2612–2626.
Ike, M., Asano, M., Belkada, F.D., Tsunoi, S., Tanaka, M., Fujita, M.,2002. Degradation of biotransformation products ofnonylphenol ethoxylates by ozonation and UV/TiO2treatment. Water Science and Technology 46 (11–12), 127–132.
Kaniou, S., Pitarakis, K., Barlagianni, I., Poulios, I., 2005.Photocatalytic oxidation of sulfamethazine. Chemosphere 60(3), 372–380.
Kim, I.H., Tanaka, H., Iwasaki, T., Takubo, T., Morioka, T., Kato, Y.,2008. Classification of the degradability of 30 pharmaceuticalsin water with ozone, UV and H2O2. Water Science andTechnology 57 (2), 195–200.
Kolpin, D.W., Furlong, E.T., Meyer, M.T., Thurman, E.M., Zaugg, S.D.,Barber, L.B., Buxton, H.T., 2002. Pharmaceuticals, hormones,and other organic wastewater contaminants in US streams,1999–2000: a national reconnaissance. Environmental Science &Technology 36 (6), 1202–1211.
Labadie, P., Budzinski, H., 2006. Alteration of steroid hormoneprofile in juvenile turbot (Psetta maxima) as a consequence ofshort-term exposure to 17[alpha]-ethynylestradiol.Chemosphere 64 (8), 1274–1286.
Mendez-Arriaga, F., Esplugas, S., Gimenez, J., 2008. Photocatalyticdegradation of non-steroidal anti-inflammatory drugs withTiO2 and simulated solar irradiation. Water Research 42 (3),585–594.
w a t e r r e s e a r c h 4 3 ( 2 0 0 9 ) 1 5 1 3 – 1 5 2 21522
Metcalfe, C.D., Koenig, B.G., Bennie, D.T., Servos, M., Ternes, T.A.,Hirsch, R., 2003. Occurrence of neutral and acidic drugs in theeffluents of Canadian sewage treatment plants.Environmental Toxicology and Chemistry 22 (12), 2872–2880.
Oh, B.S., Jung, Y.J., Oh, Y.J., Yoo, Y.S., Kang, J.W., 2006. Applicationof ozone, UV and ozone/UV processes to reduce diethylphthalate and its estrogenic activity. Science of the TotalEnvironment 367 (2–3), 681–693.
Ohko, Y., Iuchi, K.I., Niwa, C., Tatsuma, T., Nakashima, T., Iguchi, T.,Kubota, Y., Fujishima, A., 2002. 17 Beta-estrodial degradation byTiO2 photocatalysis as means of reducing estrogenic activity.Environmental Science & Technology 36 (19), 4175–4181.
Paul, T., Miller, P.L., Strathmann, T.J., 2007. Visible-light-mediatedTiO2 photocatalysis of fluoroquinolone antibacterial agents.Environmental Science & Technology 41 (13), 4720–4727.
Reyes, C., Fernandez, J., Freer, J., Mondaca, M.A., Zaror, C.,Malato, S., Mansilla, H.D., 2006. Degradation and inactivation oftetracycline by TiO2 photocatalysis. Journal of Photochemistryand Photobiology A: Chemistry 184 (1–2), 141–146.
Rosenfeldt, E.J., Linden, K.G., Canonica, S., von Gunten, U., 2006.Comparison of the efficiency of center dot OH radical formationduring ozonation and the advanced oxidation processesO-3/H2O2 and UV/H2O2. Water Research 40 (20), 3695–3704.
Routledge, E.J., Sumpter, J.P., 1996. Estrogenic activity ofsurfactants and some of their degradation products assessedusing a recombinant yeast screen. Environmental Toxicologyand Chemistry 15 (3), 241–248.
Skutlarek, D., Exner, M., Farber, H., 2006. Perfluorinatedsurfactants in surface and drinking water. EnvironmentalScience and Pollution Research 13 (5), 299–307.
Snyder, S.A., Wert, E.C., Lei, H.D., Westerhoff, P., Yoon, Y., 2007.Removal of EDCs and Pharmaceuticals in Drinking and ReuseTreatment Processes. Awwa Research Foundation, Denver,CO, p. 372.
Sohoni, P., Sumpter, J.P., 1998. Several environmental oestrogensare also anti-androgens. Journal of Endocrinology 158 (3),327–339.
Sole, M., Lopez de Alda, M.J., Castillo, M., Porte, C., Ladegaard-Pedersen, K., Barcelo, D., 2000. Estrogenicity determination insewage treatment plants and surface waters from theCatalonian Area (NE Spain). Environmental Science &Technology 34 (24), 5076–5083.
Stackelberg, P.E., Furlong, E.T., Meyer, M.T., Zaugg, S.D.,Henderson, A.K., Reissman, D.B., 2004. Persistence ofpharmaceutical compounds and other organic wastewatercontaminants in a conventional drinking-watertreatment plant. Science of the Total Environment329 (1–3), 99–113.
Stanford, B.D., 2008. Fate and Transport of Steroid Estrogens andNonylphenols through Soils. Dissertation, University of NorthCarolina at Chapel Hill, Chapel Hill, NC.
Ternes, T.A., Meisenheimer, M., McDowell, D., Sacher, F.,Brauch, H.J., Gulde, B.H., Preuss, G., Wilme, U., Seibert, N.Z.,2002. Removal of pharmaceuticals during drinking watertreatment. Environmental Science & Technology 36 (17),3855–3863.
Vanderford, B.J., Snyder, S.A., 2006. Analysis of pharmaceuticalsin water by isotope dilution liquid chromatography/tandemmass spectrometry. Environmental Science & Technology 40(23), 7312–7320.
Vogna, D., Marotta, R., Napolitano, A., Andreozzi, R., d’Ischia, M.,2004. Advanced oxidation of the pharmaceutical drugdiclofenac with UV/H2O2 and ozone. Water Research 38 (2),414–422.
Yurdakal, S., Loddo, V., Augugliaro, V., Berber, H., Palmisano, G.,Palmisano, L., 2007. Photodegradation of pharmaceuticaldrugs in aqueous TiO2 suspensions: mechanism and kinetics.Catalysis Today 129 (1–2), 9–15.