Embed Size (px)
Citation preview

TECHNICAL REPORT STANDARD TITLE PAGE
1. Report No. 2. Go..,ernrnent Accessidn No. 3. Recipient's Catalog No . . 4. Title and Subtitle 5. Report Oate
EVALUATION OF A PRESTRESSED PANEL, CAST-IN-PLACE September 1972 CONCRETE BRIDGE 6, Performing Organization Code
7. Author's) Eugene Buth 8. Performing Organization Report No.
Howard L. Furr 145-3 L. Jones Research Report
9. Performing Organization Nome and Address 10. Work Unit No.
Texas Transportation Institute Texas A & M University II. Contract or Grant No.
College Station, Texas 77843 IB!'!search Study 2-5 ... 70-145 13. Type of Report and Period Covered
12. Sponsoring Agency Nome and Address
Texas Highway Department Interim - September 1970
11th and Brazos September 1972
Austin, Texas 78701 14. Sponsoring Agency Code
15. Supplementary Notes Research performed in cooperation with DOT, FHWA. Research Study Title: "A Study of Prestressed Panels and Composite Action in Concret Bridges Made of Prestressed Beams, Prestressed Sub-deck .Panels, and Cast-in-Place Dec1
16. Abstract A relatively new type of beam and slab bridge which makes use of precast, prestressed ·panels as part of the slab was investigated. In this type of bridge construction, the panels are placed to span between the beams and serve as forms for the cast-in-place portion of the deck. They remain in place to become an integral part of the continuous structural slab. Composite action is obtained in the structure by bonding the prestressed elements together with the cast-in-place portion of the deck. This type of structure incorporates unproven structural details--the bonding of concrete at the interfaces and the inclusion of panel butt joints.
The purpose of this study was to experimentally and theoretically investigate the ability of this type of structure to distribute wheel. loads in a satisfactory manner and to behave as a composite unit.
A full-scale, simple span~ prestressed panel type bridge was structurally tested in the laboratory. The bridge was subjected to cyclic applications of design loads and finally to static failure loads. It performed satisfactorily under all l.oad conditions.
On the basis of information developed in this study, it was concluded that the use of prestressed panels is a suitable method of highway bridge construction.
17. Key Words bridge, prestressed concrete, 18. Distribution Statement
precast concrete panels, slab, repetitive loads, ultimate load, composite action
19. Security Clossif. (of this report) 20. Security Ciani f. (of this pogo) 21. No. of Pages 22. Price
Unclassified Unclassified 151
Form DOT F 1700.7 ••·••1


EVALUATION OF A PRESTRESSED PANEL, CAST-IN-PLACE CONCRETE BRIDGE
by
Eugene Buth Assistant Research Engineer
Howard L. Furr Research Engineer
Harry L. Jones Engineering Research Associate
Texas Transportation Institute Texas A&M University
College Station, Texas
and
A •. A. Toprac Center for Highway Research
The University of Texas Austin, Texas
Research Report 145-3
A Study of Prestressed Panels and Composite Action in Concrete Bridges Made of Prestressed Beams,
Prestressed Sub-deck Panels, and Cast-in-place Deck
Research Study Number 2-5-70-145
Sponsored by
The Texas Highway Department
in cooperation with the United States Department of Transportation
Federal Highway Administration
September 1972

ABSTRAC!
A relatively new type of beam and slab bridge which makes use
of precast, prestressed panels as ·part of the slab was investigated.
In this type of bridge construction, the panels are placed to span
between the beams and serve as forms for the cast-in-place portion
of the deck. They remain in place to become an integral part of the
continuous structural slab. Composite action is obtained in the
structure by bonding the prestressed elements together with the .
cast-in-place portion of the deck. This type of structure incorporates
unproven structural details--the bonding of concrete at the inter
faces and the inclusion of panel butt joints.
The purpose of this study was to experimentally and theoretically
investigate the ability of this type of structure to distrubute wheel
loads in a satisfactory manner and to behave as a composite· unit.
A full-scale, simple span, prestressed panel type bridge was
structurally tested in the laboratory. The bridge was subjected to
cyclic applications of design loads and finally to static failure
loads. It performed satisfactorily under all load conditions.
On the basis of information developed in this study, it was
concluded that the use of prestressed panels is a suitable method of
highway bridge construction.
Key Words: bridge, prestressed concrete, precast concrete
panels, slab, repetitive loads, ultimate load, composite action.
i

SUMMARY
A single span full-scale prestressed panel type bridge was
evaluated experimentally in the laboratory and theoretical studies
of the structure were made. The structure was subjected to cyclic
applications of design load plus impact and to static failure loads.
It performed satisfactorily under all test conditions.
Two million applications of simulated design axle load plus
impact were accomplished at three locations on the bridge structure.
The bond at the interface between the prestressed panels and the
cast-in-place concrete performed without any indication of distress
under these cyclic loads.
Two million cycles of design wheel load plus impact alternating
on opposite sides of an panel butt joint were applied at one'location
on the structure without causing distress. Satisfactory performance
was exhibited by the bridge slab when subjected to static failure
loads. The lowest value of cracking load measured experimentally was
3.8 times the design wheel load plus impact, and the lowest measured
ultimate load was 12.5 times the design wheel load plus impact.
The failure surfaces that developed in the static failure tests
intersected and continued across the panel to cast-in-place interface
and was not influenced by the interface.
The theory presented by Westergaard (the basis of present design
specifications) predicts local bending stresses in the slab of the
structure with reasonable accuracy if in-plane stresses resulting
ii

from spanwise bending of the entire structure are ignored. An elastic
analysis of the structure, including in-plane as well as bending
effects was developed for comparison with strains and displacements
measured in the bridge.
The following conclusions were drawn from the results of the
theoretical and experimental work reported herein.
1. The bond at the interface between the prestressed, precast
panels and the cast-in-place concrete performed without any
indication of distress under cyclic design loads and static
failure loads.
2. Wheel loads were transferred and distributed across transverse
panel joints in a satisfactorY manner.
3. It is feasible to design for composite action in a prestressed
panel bridge of the type studied.
The contents of this report reflect the views of the authors who are responsible for the facts and the accuracy of the data presented herein. The contents do not necessarily reflect the official views or policies of the Federal Highway Administration. This report does not constitute a standard, specification or regulation.
iii

IMPLEMENTATION STATEMENT
It has been demonstrated in the laboratory that a full-scale
simple span prestressed panel bridge performed satisfactorily under
cyclic applications of design axle and wheel loads and under static
failure loads. Comparisons between experimental data and the theory
of the AASHO Code indicate that present design practices ~re satis
factory for prestressed panel bridges.
Some cracking occurred in the upper surface of the cast-in-place
portion of the slab above the panel butt joints. This cracking
occurred in areas of the slab that had not been loaded as well as in
loaded areas. It did not increase with application of cyclic loads
and is apparently no serious problem.
The prestressed panel bridge slab does not meet the AASHO
requirements for longitudinal distribution steel and considerations
should be given to practical means of meeting these requirements. A
proven service record exists for structures designed in accordance
with AASHO and meeting these requirements would add to the assurance
that a prestressed panel bridge slab would perform satisfactorily.
iv

TABLE OF CONTENTS
ABSTRACT
SUMMARY
IMPLEMENTATION STATEMENT
TABLE OF CONTENTS
LIST OF FIGURES
LIST OF TABLES •
I. INTRODUCTION
1.1 Related Previous Work 1.2 Objective and Plan of Research
II. Experimental Program •
Full-scale Bridge Model Slab Model
• 2.1 2.2 2.3 2.4 2.5 2.6 2.7
Instrumentation of Full-scale Bridge Model Instrumentation of Slab Segment Model • • • Loading System for Full-scale Bridge Model Loading System for Slab Segment Model • • • Program of Tests for Full-scale Bridge and Slab Segment Models
III. Theoretical Analyses
3.1 Development of Slab Bending Moment Equations After Westergaard . • . . . . . . . • . . . . .
3.2 Folded Plate Analysis for Composite Slab and Beam Bridge . . . . . . . . . . . . . . . . .
3.3 Comparison With Examples from the Literature
IV. Presentation and Analysis of Results •
4.1 Repetitive Load Tests of Full-scale Bridge Model 4.2 Repetitive Load Tests of Slab Segment Model ••• 4.3 Static Load to Failure of Full-scale Bridge Model 4.4 Static Load to Failure of Slab Segment Model ••
v
Page
i
ii
iv
v
vii
xi
1
• 3 5
7
7 25 25 35 38 43
47
52
52
60 79
85
86 109
• 112 123

4.5 4.6
Assessment of Panel Butt Joint Performance Assessment of Shear Bond and Load Transfer Performance
v. Summary and Conclusions
REFERENCES
APPENDIX
vi
124
127
129
133
135

Figure
1
2
3
4
5
6
7
8
9
LIST OF FIGURES
Cut-away View of Prestressed Panel Type Bridge ••
Prestressed Panel Type Bridge Tested in This Study
Full-scale Test Bridge and Loading Equipment
Details of Prestressing Steel in Beams • • •
Properties of Beam Cross Section and Details of Conventional Reinforcement • •
Panel Details at Interior Beam
Details of Exterior Panel at Exterior Beam
Details of Interior Panels Used in Full-scale Bridge
Details of Exterior Panels Used in Full-scale Bridge
10 Z-bars Used in Selected Panels to Aid in Providing Structural Connection Between Panel and Cast-in-place
11
12
13
14
15
16
17
18
19
Deck • • • • • • • • • • . . . . . . . . . Grout Being Brushed onto Surface of Panel
Concrete Being Placed on "Non-grouted" Panel
Location and Identification of Various Structural Details in Full-scale Bridge • • • • • • • • •
Dowel Bars Used at Selected Panel Butt Joints
Slab Segment Model . . . . . . . . . . . Detail of Panels Used in Slab Segment for Loading No. 4 (Trinity River Bridge Panel) •••••
Dimensions and Layout of Slab Segment Model
Layout of Electrical Resistance and Beam Deflection Gages on Full-scale Bridge • • • • • • • • • • • •
Typical Electrical Resistance Strain Gage Patterns
vii
Page
2
8
9
11
12
13
13
14
15
21
22
22
23
24
26
27
28
30
31

Figure
20
21
22
23
24
25
26
27
28
29
30
31
32
33
34
35
36
Photograph of Electrical Resistance Strain Gage Pattern on Top of Cast-in-place Concrete •
Photograph of Electrical Resistance Strain Gage Switching and Balancing Unit and Readout Unit
Gage for Measuring Beam Deflection • • •
Positions for Panel-to-panel and Panel-to-beam Relative Displacement Dial Gages • • • • • • •
Linear Motion Dial Gages for Detecting Relative Displacements b.etween Panel and Beam and between Adjoining Panels • . . • • • . . • . • . . . . .
Positions of Strain Gages on Slab Segment Model
Hydraulic Ram and Loading Pad Applying Simulated Axle Loads
Arrangement for . . . . . . . System for Applying Simulated Axle Loads to Full-scale Br_idge . . . • . • .
Riehle-los Pulsating Unit
Strip Chart Record of Load and Deflection Recorded during Application of Load 3 • • • • • • • • •
Arrangement of Hydraulic Rams and.Loading Pads for Applying Cyclic, Alternating Simulated Wheel Loads
Strip Chart Record of Load vs. Time Recorded during Applications of Load 4 • • • • • • • • • • • • •
Hydraulic Ram and Loading Pad Arrangement for Static Failure Load Tests • • • • • • • • • • • • • • • •
Plan View of Structure Illustrating Load Positions
Position of Loads for Maximum Bending Moments
Comparison of Relationships between Applied Load and Maximum Slab Bending Moment in Transverse Direction
Typical Composite Slab and Beam Bridge • • • • • • •
viii
Page
33
33
34
36
37
39
40
41
41
42
44
45
46
49
58
58
61
Figure
37
38
39
40
41
42
43
44
45
46
47
Beam and Plate Elements for Analysis
Line Load on a Slab . . . . . . Fourier Series Representation of Line Load
Downward Displacement of Edge i
Rotation of Edge i • • . . . Lateral Translation of Edge i
Longitudinal Translation of Edge i
Edge Forces Resulting from Downward Displacement and Rotation of Edges i and j . . . • • . . • • . •
Edge Forces Resulting from Lateral and Longitudinal Translation of Edges i and j • . •
Fixed Edge Forces for Laterally Loaded Plate
Displacements for Beam Element • • • • . . . 48 Forces from Downward Displacement and Rotation of Beam
49
50
51
Element i . . . . . . . . . . . . . . . . . . . . Forces from Lateral and Longitudinal Translation of Beam Element i . . . . . . . . . . .
Joint Forces at Juncture of Beam and Plate Elements
Example Problem No.· 1 . . . . . . . . . 52 Theoretical and Experimental Beam Deflections for
Load 1 . . . . . . . . . . . . . . . . . . . . . . . . 53 Theoretical and Experimental beam Deflections for
54
55
Load 2 • • . • • • . • • • • . . . . . . . . . . . . . Theoretical and Experimental Beam Deflections for Load 3 . . . . . . . . . . . . . . . . . . . · ·
Stresses Computed from Experimental Strains near East Wheel Pad of Load 1 . . .•....•.••
ix
. . .
Page
63
64
64
67
67
68
68
69
69
70
74
75
75
77
80
87
88
89
95

Figure Page
56 Stresses Computed from Experimental Strains near West Wheel Pad of Load 2 . . . . . . . . . . . . . 96
57 Stresses Computed from Experimental Strains near East Wheel Pad Load 3 . . . . . . . . . . . . . . . . . . 97
58 Division of Longitudinal Slab Stresses into Components 100
59
60
61
62
63
64
65
66
67
68
69
In-plane and Bending Stress Components Computed from Experimental Strains near East Wheel Pad of Load 1 . In-plane and Bending Stress Components Computed from Experimental Strains near West Wheel Pad of Load 2 . In-plane and Bending Stress Components Computed from Experimental Strains near East Wheel Pad of Load 3
Comparison of Theoretical and Experimental Bending Stresses in Slab in Transverse Direction • • • • •
Comparison of Theoretical and Experimental Bending Stresses in Slab in Longitudinal Direction
Map of Cracking Pattern
Cracking Pattern Developed Load Test 6 and Typical of and 8 • • • • • • • •
in Slab in Static Failure Those Obtained in Tests 5 . . . . . . . .
Sections through Failure Surface for Load 5 (Similar failure surfaces were developed in tests 6 and 7.)
Sections through Failure Surface for Load 7
Differential Deflection across Panel Butt Joint vs. Applied Load in Static Failure Load Tests • • •
Comparison of Experimental Failure Loads with Theoretical Values • • • • • • • • • • • • • •
X
.. . . .
101
102
103
104
105
110
114
115
116
118
120

LIST OF TABLES
Table
1 Bending Moment Capacities of Slab
2 Concrete Statistics • • •
3 Loads Applied to Models
4 Comparison of Bending Moments for Example No. 1
5 Comparison of Bending Moments and Deflection for EXample No. 2 • • • . . . . .. . . . • • . • . .
6 Comparison of Transverse Bending Moments in the Deck Slab Adjacent to Beams for Example No. 2
7 Experimental and Theoretical Strains for Load Position 1 . . . .. . . . . . . . . . . . . .
8 Experimental and Theoretical Strains for Load Position 2 . . . . . . . . . . . . . . . . .
9 Experimental and Theoretical Strains for Load Position 3 • . • . . • . . •
10 Experimental Strains for Load 4
11 Experimental and Theoretical Strains for Load Position 4 . • • . • . • • .
12 Experimental Strains for Load 4A
13 Summary of Static Failure Load Test Results
xi
. • •
. . .
.
.
Page
16
17
48
82
82
83
90
91
92
107
108
111
119

I. INTRODUCTION
This report describes the laboratory study phase of a three
year investigation of highway bridges constructed with prestressed
concrete !-beams, prestressed panel subbdeck and a cast-in-place
slab. This type of construction, shown in Figure 1, has certain
relatively new features which reduce construction time and cost.
The precast panels serve as forms for the cast-in-place portion
of the deck and remain in place to become an integral part of the
deck. This feature eliminates the installation and removal of
forms and falsework on the underside. The cast-in-place deck is
mechanically connected to the beams by the beam stirrups which extend
into the deck in the same way as in conventional construction.
The cast-in-place concrete is placed over the surface of the
panels and into the space above the beams, thereby bonding all
elements together to act as a composite unit. The cast-in-place
concrete serves as the riding surface of the deck.
Two major deviations from established practices exist in a
prestressed panel type bridge. One is bonding of a new concrete to
old concrete with sufficient strength to develop an adequate structural
connection at the interface. The other is the inclusion of transverse
joints made by butting adjacent prestressed panels together. The
latter created some question as to the capacity of the slab to
accomplish longitudinal distribution of wheel loads and to resist
internal stresses. This transverse joint extends from top to bottom
1

CAST-IN-PLACE CONCRETE SLAB
REINFORCING
OPENING FOR BEAM STIRRUP
N
CONCRETE BEAM
Figure 1. Cut-away View of Prestressed Panel Type Bridge.

of the prestressed panels. It does not extend into the cast-in-place
concrete. Present governing specifications, written by the American
Association of State Highway Officials (AASHO) (~), do not deal
directly or by implication with these two structural details. This
report describes the results of an experimental and theoretical
investigation of the ability of this type of structure to distribute
wheel loads in a satisfactory manner and to behave as a composite
unit.
1.1 Related Previous Work
Three bridges of this type were built in Texas in the early
1960's and have been serving satisfactorily since that time. Two of
these bridges, located on U.S. Highway 75 in Grayson County, Texas,
were examined in the first phase of this study. A visual inspection
was conducted and crack patterns on the deck surface were mapped
for both bridges. Load tests were performed and core samples were
taken from one of the bridges to determine the condition of the
bond between prestressed panels and cast-in-place deck. This exam
ination indicated no distress in the bridges nor any signs of bond
failure. The details of the study are contained in Research Report
145-1, "Study of In-Service Bridges Constructed With Prestressed
Panel Sub-Decks." (b)
The prestressed panels in those bridges in Texas already completed
or under construction are typically 3 1/2 in. thick, 4 to 6 ft. wide,
and range in length from 5 1/2 to 7 ft. for panels between interior
3
beams. Prestressing strands are placed in the longitudinal direction
of the panels. The question of development length of strands in
such short members and the effects of cyclic loads on development
length was examined in the second phase of this study. An investiga
tion of 20 specially instrumented panels indicated that for strands
prestressed with an initial stress of 162 ksi, 22 in. of development
length was required for 3/8 in, diameter strands and 34 in. for 1/2
in. strands. The performance of a typical panel in a bridge structure
with these development lengths was examined analytically, and found
to perform satisfactorily. The details of this second phase of the
study are contained in Research Report 145-2, "Development Length of
Strands in Pretressed Panel Sub-Decks." (])
Sinno and Furr (~) conducted tests in the laboratory to deter
mine the direct shear strength of the bond of new concrete cast on
the surface of older concrete. In some tests, the old surface was
simply cleaned with water using· a hose and nozzle, then damp dried
prior to placement of the new concrete. Results of these tests indi
cated direct shear strengths between the old and new concrete of
about 200 psi. In other tests, the old surface was cleaned in the
same manner as above and grout was thoroughly brushed on it to aid
in bonding the new concrete. Direct shear strengths of 400 to 500
psi were obtained in these tests.
In 1971 Nosseir and Murtha (2) reported the results of tests
conducted on eight prestressed concrete split beams. These beams
were composite beams constructed by casting concrete onto the
4

previously cast prestressed portion of the beam. The geometry of
the cross section was such that the interface coincided with the
neutral surface of the composite section. Ultimate horizontal shear
strengths in excess of 400 psi were obtained in beams with smooth
interfaces. The effect of a rough interface was to increase the
strength by about 100 psi.
1.2 Objective and Plan of Research
The objective of the final phase of this study was to investigate
the feasibility of designing for composite action in a highway bridge
constructed of prestressed beams, prestressed panel sub-deck, and
cast-in-place deck. The research program consisted of theoretical
and experimental studies.
In the experimental study a full-scale, single span bridge and a
slab segment model were structurally tested in the laboratory. The
full-scale bridge was designed and constructed in accordance with
applicable sections of the AASHO and Texas Highway Department (THD)
Specifications (6). The structure was nominally 23 ft. wide and
spanned 50 ft. It was subjected to simulated cylic axle loads
representing a design truck axle, and to simulated cyclic wheel loads
alternating on either side of a panel butt joint to represent a
design truck wheel load rolling across a panel butt joint. The
bridge was finally subjected to static failure wheel loads at loca
tions adjacent to selected panel butt joints.
The slab segment model consisted of two prestressed panels
5

supported on spandrel beams, covered with a cast-in-place slab. The
model was subjected to simulated cyclic wheel loads alternating on
either side of the butt joint between panels, and then loaded to
failure.
The response of the full-scale bridge to static wheel loads was
predicted using an elastic analysis, which assumed complete composite
action between slab, panels and beams in order to obtain an accurate
prediction of strains at any point on the surface of the prestressed
panel-cast-in-place deck slab or the prestressed beams.
Electrical resistance strain gages and mechanical displacement
gages were installed at various locations on the full-scale bridge
model to monitor its response to static, simulated wheel loads.
Measured strains and deflections were then compared with values from
the analysis of the elastic fully composite structure, and discre
pancies between measured and predicted values were sought that would
indicate a lack of composite action in the full-scale bridge.
6

II. EXPERIMENTAL PROGRAM
The experimental segment of this study consisted of simulated
wheel loads, applied both statically and dynamically, to a full-scale
bridge structure and to a slab segment model constructed from two
prestressed panels. After completion of service load testing, the
structures were loaded to failure to determine ultimate capacity.
Structural response to static loads was measured with electrical
resistance strain gages and mechanical displacement gages.
2.1 Full~scale Bridge Model
The full-scale test structure consisted of two simulated bent
caps; four prestressed THD Type B beams; 3 1/4-in. thick, prestressed
panel subdeck; and conventionally reinforced 3 1/2-in. thick
cast-in-place deck. A layout of the structure is given in Figure 2,
and Figure 3 is a photograph of the complete structure and testing
facility. The 23-ft. wide, 50-ft. long structure, complete except
for side rails, simulated two lanes of a four-lane bridge. The deck
contained two types of panels; interior panels and exterior panels.
Interior panels spanned between prestressed beams and were supported
at each end by the top flange of a beam. The exterior panels were
supported at one end on a beam and were continuous over the outside
beam, with an overhang of approximately 2 ft.-6 in. The panels
became an integral part of the continuous structural deck when the
top portion of the deck was cast.
The entire structure was designed in accordance with AASHO
7

co
"' ~
LA -.--L ~--- T---- T-g;;;B~;s-.-;; -vrs;A~--~-----T---=---1 I t BEAM
~ ... ,I
':.:,t
"' "'
1 I I I I 1 • I I I I I I I L----it __ ! ______ _L ______ ! ______ .l ______ ! __ ---1-- ___ J I ... BEAM r-----"' --r------T ______ T ______ T ______ T_ --~ -, "'-1 "en I I I 1 I : I 1 <t I I I 1 "' I PANEL BUTT JOINTS 1 1 1
1 I
I ct: I I I I I I L----13 _!___ _!_ _____ !_ _____ • ______ !_ _!_ ____ J I ... BE r---· --r---- ------r·----T·-----T- - ·r·- --, 't. AM I ,~ 1 I I I I 1
0 I I 1 .I "'48AR11 I I ,., I I
I l I I I 1
: I I : I I I {BEAM I I I I 1 "' I I 1 I I 1 1 5 BAR I 1
I I I 1 I I
I " ' I I '"-A 50\0
THO TYPE B BEAM
s!...3"
...eb&l
CAST-IN-PLACE
s.~.C~JON
~BAR
PRESTRESSED PANEL
Y2 GASKET1
61-311
Figure 2. Prestressed Panel Type Bridge Tested in This Study.

Figure 3. Full-scale Test Bridge and Loading Equipment.
9
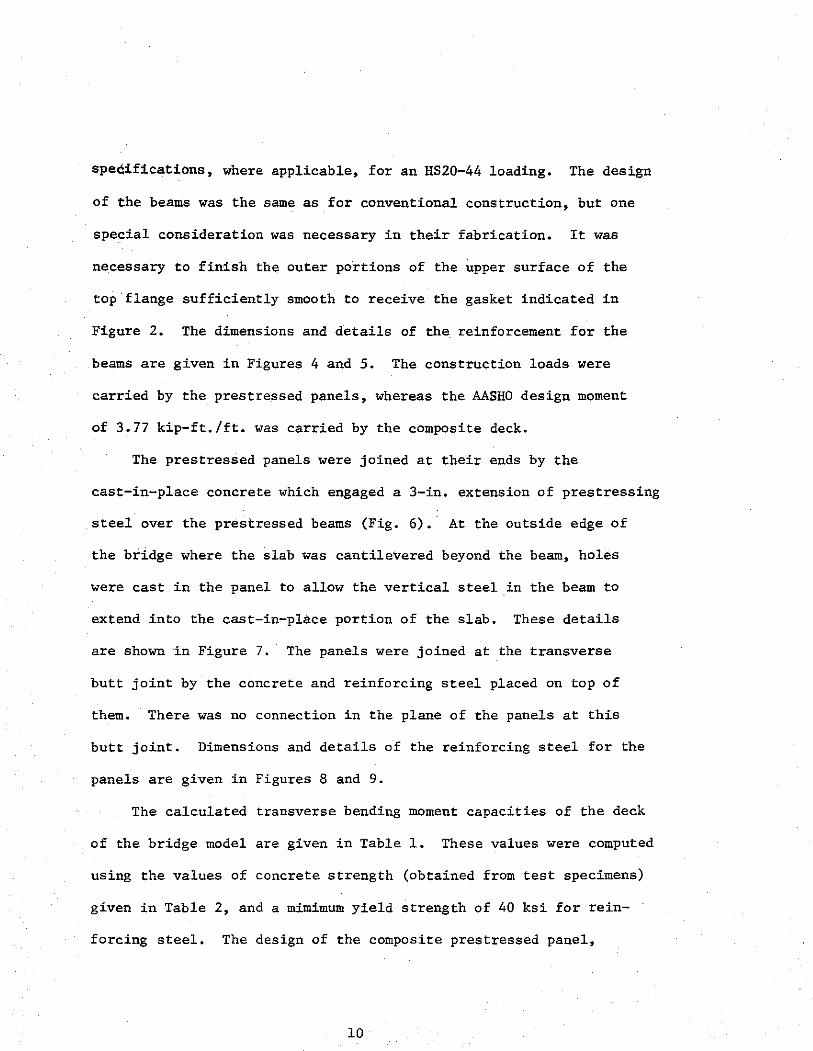
specifications, where applicable, for an HSZ0-44 loading. The design
of the beams was the same as for conventional construction, but one
special consideration was necessary in their fabrication. It was
necessary to finish the outer portions of the upper surface of the
top flange sufficiently smooth to receive the gasket indicated in
Figure 2. The dimensions and details of the. reinforcement for the
beams are given in Figures 4 and 5. The construction loads were
carried by the prestressed panels, whereas the AASHO design moment
of 3.77 kip-ft./ft. was carried by the composite deck.
The prestressed panels were joined at their ends by the
cast-in-place concrete which engaged a 3-in. extension of prestressing
steel over the prestressed beams (Fig. 6). · At the outside edge of
the bridge where the slab was cantilevered beyond the beam, holes
were cast in the panel to allow the vertical steel in the beam to
extend into the cast-in-place portion of the slab. These details
are shown in Figure 7. The panels were joined at the transverse
butt joint by the concrete and reinforcing steel placed on top of
them. There was no connection in the plane of the panels at this
butt joint. Dimensions and details of the reinforcing steel for the
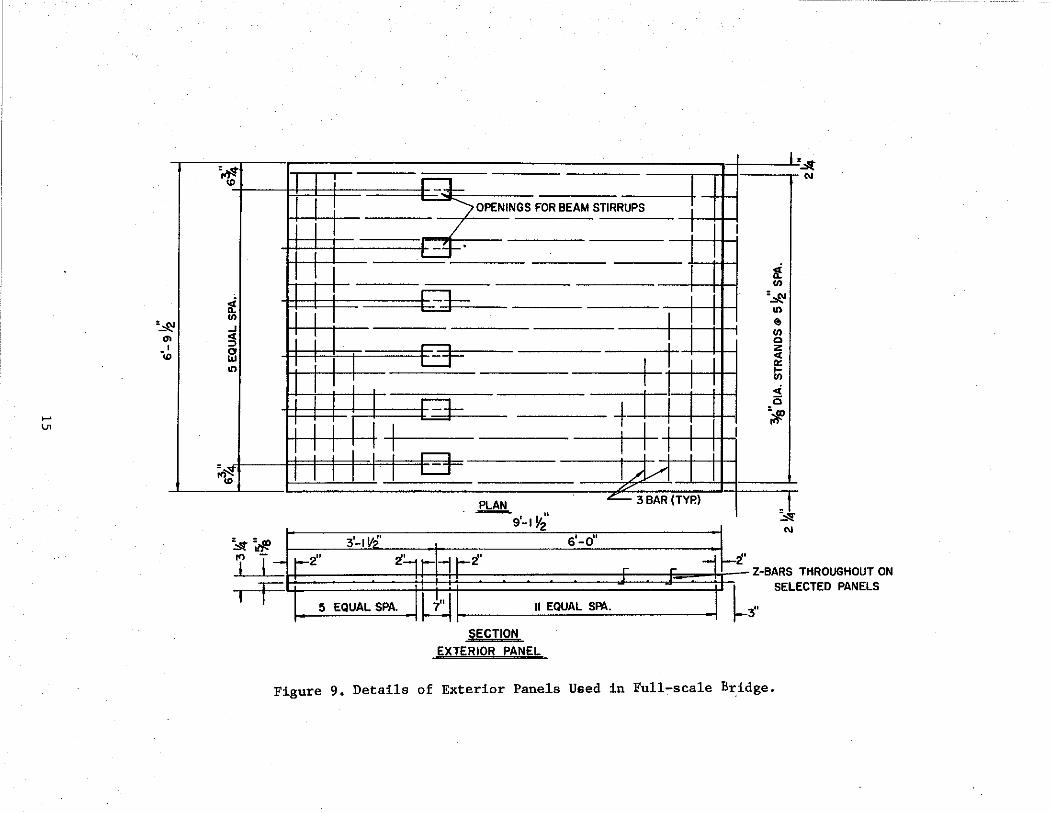
panels are given in Figures 8 and 9.
The calculated transverse bending moment capacities of the deck
of the bridge model are given in Table 1. These values were computed
using the values of concrete strength (obtained from test specimens)
given in Table 2, and a mimimum yield strength of 40 ksi for rein
forcing steel. The design of the composite prestressed panel,
10

,_.. ,_..
~
'··
END SECTION
¢.. SECTION
19'-ld' ,.., -,..., 5'-011
I
- - -PRESTRESSING STEEL~
-.:::: I
) ""~ - -
l II .L;;E DOWN POINTS
241-10
11
1- ---,
SIDE E"LI:VATION
NOTES• 1.) ULTIMATE STRENGTH OF STRANDS: 270ksi 2.)1NITIAL TENSION: 28,9kips
Figure 4. ·netails of Prestressing Steel in Beams.

-N
.. _.. 1." " .. 11 4 SPA.,~ 3 78 2 SPA:,.,~ 6 Te 18 ~PA.~, 1'- I\ z .. It,
~9 ,._,y... ,,/') ' ,. Jii .,.~· - 20'-··~, -·~ f--2"
I I 1)!," II 1- . -1-1-f-j- - f-t----
I I T
II 111 II I I I I I I I I II I ! ill I ! I I ! I
I I I
i i i I I I ll 'I I' tL-~~·cLEAR t-
£ -+---~ I I I I I L o-u I
CONCRETE
tSECTION
1 .• ~,0.. ''-J 9!QE ELJyAI!QN
NOTES! . 1.) CROSS SECTIONAL AREA: 360.31n.•
2J MOMENT OF INERTIA = 43,1771n~
Figure 5. Properties of Beam Cross Section and Details of Conventional Reinforcement.
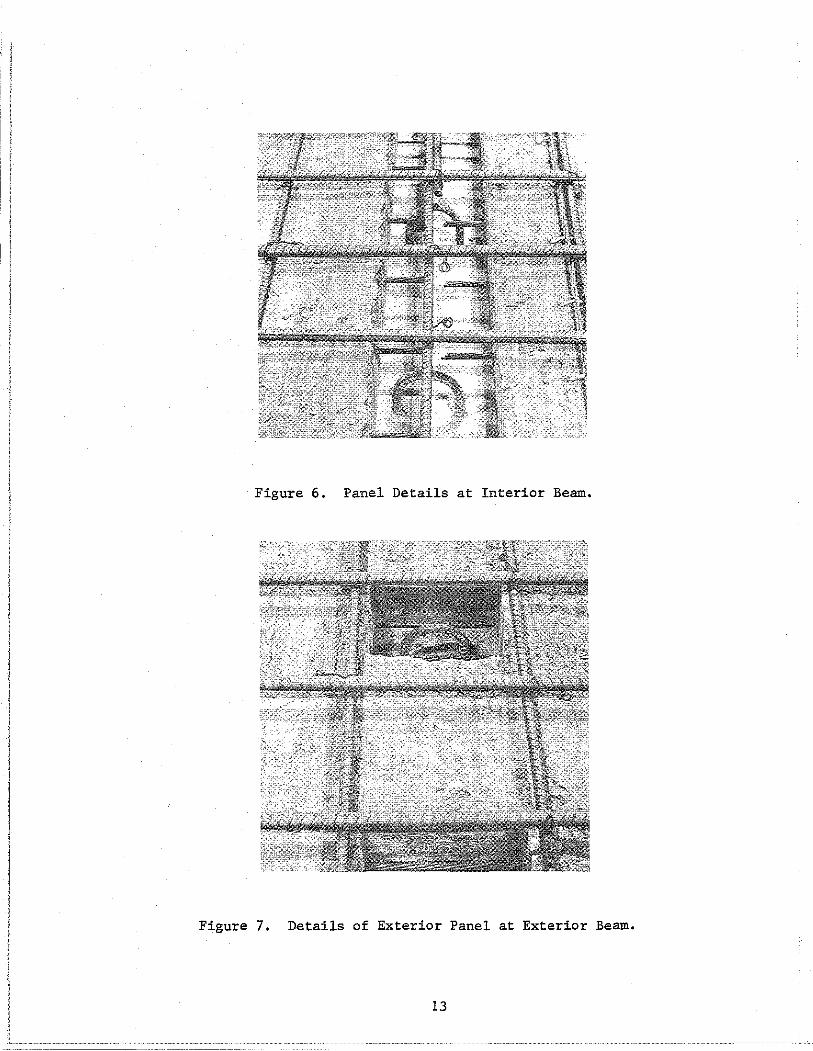
Figure 6. Panel Details at Interior Beam.
Figure 7. Details of Exterior Panel at Exterior Beam.
13

..... ..,.
=~ 0> _, ID
~·~ 2"
Ll
PRESTRESSING STEEL
I I I I I I ~3BAR I I I I I I I I I I I I I I I I I I I I I 1 I I I I I I I I
I I I I I I I I PLAN
5'-9" J-~
II EQUAL SPA. 2"
... ...
SECTION
NOTES:
10 1.) ULTIMATE STRENGTH OF
@) STRANDS = 270 ksl. (f) 0 z 2.)AREA OF% DIA. STRANDS=.OBsq.in. c( 0:
Iii 3.)1NITIAL TENSION= 16.1 kips.
<i i5 =~ ro
INTERIOR PANEL
I-- 3"(TYP.)
Z-BARS THROUGHOUT ON SELECTED PANELS
Figure 8· Details of Lnterior Panels Used in Full-scale Bridge.
.... lJ>
'.:§~!
"' -.;, -
'# ID
Ti. (I)
..J
~ g "'
;., .... ID
~~
i T-I F
I I -n-~OPENINGS FOR BEAM STIRRUPS
(-i
_/
I t.::.:J-'
+=1--- I ~
I i I ..----. I L.:J
I I I -+=1---- -tl
1 I i I ! I I ! I I r--1 i
II I I --c=r I# --- . ··-·
9'-1 y2 ~
3'-1V?' 61-011
1--211 2:...1r -J f-2' r r -
5 EQUAL SPA. W:l II EQUAL SPA.
SECTION
EXTERIOR PANEL
f-
I
I
I
r-:t'
~
I'
Ti. (I)
:.::R.J
"' 0 (I) 0 2 <( 0: !;; <i i5
'#
-"'! N
:.:It N
Z-BARS THROUGHOUT ON SELECTED PANELS
.3 ..
Figure 9. Details of Exterior Panels Ueed in Full-scale Br.idge.

TABLE 1
BENDING MOMENT CAPACITIES OF SLAB
Direction of Bending
Transverse Positive Bending
Transverse Negative Bending
Longitudinal Positive Bending, Not At Panel Joint
Longitudinal Negative Bending, Not At Panel Joint
Longitudinal Positive Bending, At Panel Joint
Longitudinal Negative Bending, At Panel Joint
Allowable Momenta Capacity
(kip-ft/ft)
4.05
1.72
1. 70
1. 70
Ultimate Momentb Capacity
(kip-ft/ft)
18.4
8.67
3.62
3.68
3.68
aCalculated in accordance with AASHO Bridge Design Specifications, except f' not limited to 4500 psi.
c
bCalculated in accordance with American Concrete Institute 318-71 Building Code.
~aximum moment possible with no net tensile stress in panel.
dCalculations baeed on net section at panel joint. No stress concentration assumed.
16

..... "
Item
Prestressed Beams
Prestressed Panels
Cast-in-place Deck
Date Cast
10-29-70 and 10-30-70
12-10-70
2-25-71
a Data not available
Fabricator
Crowe-Gulde Amarillo
Span, Inc. Dallas
TTib
bTexas Transportation Institute
TABLE 2
CONCRETE STATISTICS
"Release" Strength
(psi)
4810 4880
a
Compressive Strength
(psi) ASTM C 39
7590 @ 28 days and 7130 @ 28 days
8550 @ 316 days
5970 x 240 days
Tensile Dynamic Modulus Strength of Elasticity
(psi) (psi) ASTM C 496 ASTM C 215
6.19 X 10 6
640 @ 6 480 days 5.65 X 10
490 @ 6 400 days 5. 23 X 10
cast-in-place deck was governed by the requirements that: i) under
construction loads, no tensile stresses occur in the prestressed
panel, ii) the transverse allowable bending moment capacity of the
composite section be greater than or equal to the AASHO design moment
(3.77 kip-ft./ft.), and iii) no tensile stresses occur in the panel
as a result of transverse bending moment on the composite section
from service loads. These requirements were satisfied by a 3 1/4 in.
thick panel with prestressing as shown in Figure 8, and a 3 1/2 in.
thick cast-in-place slab with the transverse reinforcing shown in
Figure 2. Although the design thickness of the composite slab was
6 3/4 in., the actual slab measured 7 in., which is within the
tolerable limits specified by AASHO and THD. The bending moment
capacities shown in Table 1 are based on the measured slab thickness.
The values of longitudinal bending moment capacity of the deck
are shown in Table 1. No numerical value of bending moment capacity
in the longitudinal direction is specified by AASHO, but adequate
capacity in this direction is assured by the requirements of longi
tudinal distribution steel placed in the bottom of the slab for con
ventional slab construction. The amount of distribution steel required
by the specifications is expressed as a percentage of the main rein
forcement and is computed by 220;-g-with a maximum of 67 percent.
This requirement indirectly specifies that the slab be designed to
resist a given bending moment in the longitudinal direction and is a
conservative approximation of the expression for longitudinal bending
moment from plate theory. The ratio of longitudinal to transverse
18

bending moment, from plate theory, is a function of slab span length,
and its maximum value is about 67 percent for a span of 6ft. (2).
This ratio decreases for span lengths either greater or less than
this value. By AASHO specifications, the maximum value of 67 percent
would control for the test structure. The use of prestressed panels
precluded the placement of longitudinal distribution steel in its
intended position. Instead, a lesser amount of steel (No. 4 bars at
9 in. spacing) was laid on the surface of the prestressed panels,
beneath the No. 5 transverse reinforcing bars (Figs. 6 and 7). Two
values are shown in Table 1 for positive longitudinal moment capacity.
One set of values was ·obtained for locations other than a panel butt
joint. In this case, the full composite slab thickness of 7 in. was
used in the computations. The other set of values pertain to a
section through a butt joint. Here, only the depth of the cast-in
place slab is effective in resisting positive bending moments. For
positive moment capacity, the longitudinal No. 4 bars were assumed
to be effective as flexural reinforcement, although their effective
ness in this capacity would be greatly reduced by any deterioration
of the upper surface of the slab. The full depth of the composite
section was used to compute the negative moment capacity over a butt
joint. The nature of edge surfaces on adjacent panels at a joint
make this assumption questionable. Most likely, only those portions
of the edges that are in immediate contact with one another along with
the cast-in-place deck are effective for negative moment resistance.
No account was taken of stress concentrations, which undoubtably exist,
19

in the computation of moment capacity.
It was assumed in the design that all elements of the structure
would act as a composite unit. This assumption required that all
elements of the structure be bonded together in a suitable manner to
transfer all stresses across the interface between the cast-in-place
deck and the prestressed panels and at the slab to beam interfaces.
At the latter locations, the same proven methods that are used in
conventional beam and slab bridges were employed. Three methods, used
as test variables, were employed to bond the cast-in-place concrete
to the top surface of the prestressed panels. Z-bars, detailed in
Figure 10, were used to provide both shear and tensile bond over a
selected portion of the deck. In another area, portland cement grout
was thoroughly brushed onto the rough surfaces of the panels to serve
as a bonding agent (Fig. 11). The cast-in-place deck was placed over
the grout. There was no special treatment over the remainder of the
deck (Fig. 12). The locations of these areas on the structure are
shown in Figure 13. The surface of the panels was thoroughly cleaned
with water from a hose and nozzle and then damp dried shortly before
placement of the cast-in-place concrete. The grout, on the selected
panels, was applied immediately prior to concrete placement. The
progress of the grout brushing operation was regulated so that the
grout did not dry prior to placement of the concrete.
At selected transverse butt joints, dowel bars were placed on the
surface of the panels and extended across the butt joint (Fig. 14).
They were intended to aid in transferring a wheel load across the panel
20

TOP OF PANEL = "' -""
Figure 10. Z-bars Used in Selected Panels to Aid in Providing Structural Connection between Panel and Cast-in-place Deck.
21
Figure 11. Grout Being Brushed onto Surface of Panel.
Figure 12. Concrete Being Placed on "Non-grouted" Panel.
22
-------... ----------------

N w
INTERIOR PANELS GROUT AREA
llr- f 4== '> :'f:~ - ~ 'f iW#ffh#f~ffiti/V#If##lfJfl-BEAM I I I I I I I
-==--............. =----=---=--~-=--=--=-,.
Z-BARS
• '~ --
NO Z-BARS
=====+
I I I I I
-_ ::_ ; =--=----;------~--=-:;:--_--=-;;:.:_~..:_==
LJ....,-.'..,.,.,.,' ~' ~ .,-,' ,...- 0 ,_A <Fero--n-1,_,-J -~-1:-_-___ t_ ___ ~--~~~~--~~~~:CLt==~l~~·-----~~-~Jg ___ ~--~ DOWEL JOINTS
-BEAM 2
-BEAM 3
+--BEAM SUPPORT
BEAM4
Figure 13, Location and Identification of Various Structural Details in Full-scale Bridge.

REINFORCING STEEL
21-0
11
1/1111/~11/111
=~ ,..,
= ,.. """ ,..,
#5 BAR DOWELIOI'-o" SPA. ALONG JOINT
Figure 14. Dowel Bars Used at Selected Panel Butt Joints.
24

joint and distributing it in the longitudinal direction of the bridge.
The joints where dowels were used are also indicated in Figure 13.
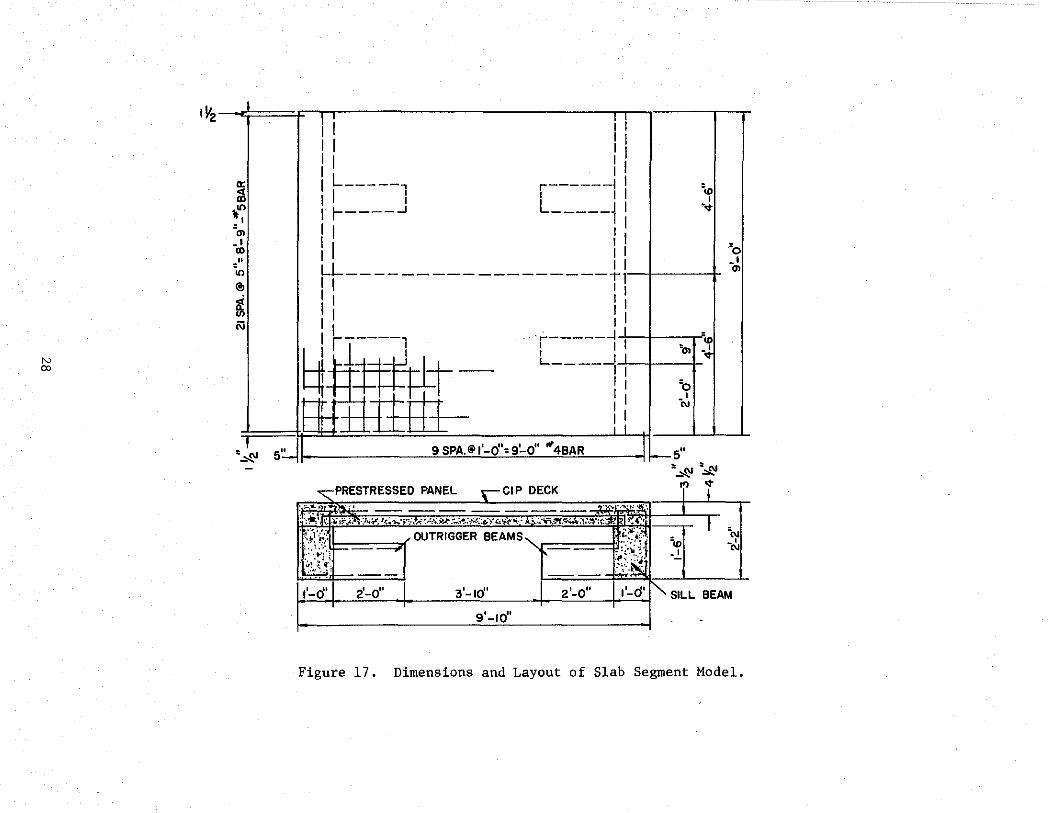
2.2 Slab Model
The slab segment model shown in Figure 15 was used to evaluate a
panel butt joint reinforcing detail proposed for use on a bridge on
IH 635 near Dallas, Texas. Figure 16 shows the mechanical connectors
embedded in the two prestressed panels which made up the model. This
detail was indentical to the dowel bar detail used in the full-scale
bridge model (see Figs. 13 and 14), in that Z-bars and dowel bars
were both used. In addition, a No. 4 bar was bent into loops and
embedded parallel to and 6 in. from each edge of the panel, as indi
cated by the V-bars in Figure 16. The dowel bars were layed across
the joint through these loops to provide additional anchorage (see
Fig. 17). The two prestressed panels rested on sill beams which
resisted rotation of the slab, as would occur if they were an integral
part of a bridge structure. A 4 1/2 in. thick deck was cast on the
panels.
2.3 Instrumentation of Full-scale Bridge Hodel
Instrumentation was planned to detect a breakdown in the overall
performance of the full-scale bridge model and to reveal any local
failure that might develop in the vicinity of the applied loads. The
structure was instrumented using mechanical gages for measuring
deflection and for detecting relative movement between elements, and
electrical resistance gages for measuring strains in the beams and deck.
25

Figure 15. Slab Segment Model,
26
----- ····----------·

N
"
'ID
·' <t
'<t r<f-
~ ':§.
<t 0 (/) 0 z <(
~ ... 5
',;f ' !!l
;#
' '"'I
V-BARS OF ""4 BAR
'"'I l r 16 SPA. SU~:~-~~0" (•3 BAR) ~ ~2 ,~6 PLAN
V-BAR rZ-BARS THROUGHOUT
1 1\ Ar Af £v: £\ I -;+ 13 ¥;· SECTION
Figure 16. Detail of Panels Used in Slab Segment for Loading No. 4 (Trinity River Bridge Panel).
"' 00
I I I I 1V2 / I
I I a: il'i
"'"' I 'm .I CD
·" in @>
~ N
' ~~
,------j l I I L _____ { I
'<D I
•q-
111 l'c: I I ~ ·m ------h;-+---, --- II
I I I I
I I -:-----: ! ""F! L-- I I .
1 I ·o I I I 1 ·ru I I _L
~----- ,. I II I II #" 5~ 9SPA.Ii>I-O •9-0 4BAR'--5"
:=-~~
!:<lL:: =(OUTRIGGER BEAMS
SILL BEAM
Figure 17. Dimensions and Layout of Slab Segment Model.
The positions of the electrical resistance strain gages on the
full-scale structure are shown in Figure 18, and detailed dimensions
of typical patterns are given in Figure 19. The gages on the full-scale
model, indicated by a number in Figure 18, were mounted on the top
of the slab and bottom of the prestressed panel and on the top and
bottom of the beams. Gages with odd numbers were on the top, and
those with even numbers were on the bottom. The slab gages were de
signed to provide information that would indicate bond failure between
slab and panel if such developed at the gage. These gages were grouped
close to the load pads where shear and bending were most severe in the
slab.
Signals from these strain gages were channeled through a
multi-channel switching and balancing unit to a manually operated
strain indicator. The switching and balancing unit was originally
capable of accommodating only one temperature compensating gage for
the entire system. This caused two immediate problems. First, the
single compensating gage did not provide satisfactory temperature
induced strain compensation for each of the active gages at the various
locations on both the upper and lower surface of the structure.
Second, the compensating gage being in the circuit at all times and a
given active gage being in the circuit only when that particular gage
was selected caused some differential self heating to occur. This
differential heating caused the indicated strain reading to drift for
a significant time after any given channel was selected. These
problems were overcome by the installation of an auxiliary selector
29

w 0
"' -'
·..,I • ., _1 I .. -.,
-:,cl :'?I . ., _II "' ~J. ~
I
:r ... _l
1
LD-16 ~-12 ,o-8 D-4"""'\ r-
~~0~20---l----:~::~: :::~~=~ 1~~~6-;-~3:~~~:- ;fil;:; r~--;;1~(-v:.-~~ ~::~:-- -~ 1 1
159 1160--..t 'I C;.1 t.: ,-L..__25126 1 =-"-.65166 I I I 163 I 167 331134 - 2913p 27128 1 11112 6917<1 67168 1 I I s I I 73174 105 I I L - __ j__21122~45lkl47 _@!!_4_ t':::•!_L---==- I~ L -~6_1_ -- J
r\_ i 1).1 -r i-~~~g5~--- -;;-_-;;-;------ - -;;-T -p1 1 14 I "-..._~ I .£-85UJ6 107 D-3J
I D-19 I I 151 87~88 : r-113 107 I I I 141")j... 1491 I """ I I I I ) iJ 142 :
91 I 1091110--l I l--1111112 I I
1 D-18 1 1371138 f., 0-10 93 I D-6 I 0 2 I
4--4 --------'----- --"¥=-----1...~~ --OJ I t.:::rD-14 1 1391140 95~1 ~ ,r"' Hll2 : 135~ #;3_4_j ____ :__""\ I
r-------=-~--- - 15f 51152~-,- !1~~~.;; : 127:Jl99192 l - I I I 53154 I 47148 I I 131 I -.., 1 I 191 I 1 1 45146 1 1 -J,L~ : I I 63164}1 I"( I 103196. -4=-13i91190 I
'~~
~
T 1 I I I 55156 1 _iffl\::_101494 I -., ' LD-17 : I 61162 I 59160 I 57158 I 129\l :
'0 - I I I I I .L I ---r-z:=----l-1 I I I I I
I Z5 I I !::- · 1 I 112 I D-1;1
I ' ,, .. 6 -9 72.
I c:::I'-2>A
I D-1~ I D-9 1 I D-5 I I _l_ __________ _L ------------ I _____ _____j_
L ' ,,.. J ' ... J ' ... I ' V' I ' ,,.. I ' ,,.. I - 6-9,2 - 6-9'2: - 6-9'2 -- 6-912 -- 6-972 -- 6-972 -,- ,-
so'-o"
Figure 18. Layout of Electrical Resistance and Beam Deflection Gages on Full-scale Bridge.

s'-9 Y2.'
ilBEAM
I I I I
4"1411 3·-o3/; ~o314' 4111 411
I I I I I I I '., ..L!..G ::L I _, "' I
=_.s:;! I I STRAIN GAGES I -.,. I <l BEAM
(a) Top of Slab a~d Bottom of Panel for Axle Load 3, at Quarter Span, (Plan View).
-., I
"'
" s'-9 !12
<l BEAM
tBEAM
(b) Top of Slab and Bottom of Panel for Axle L.oads 1 and 2, at llidspan, (Plan View).
Figure 19· Typical Electrical Resistance Strain Gage Patterns.
31

switch which allowed multiple compensating gages to be used in the
system. Ten com~ensating gages were installed on a separate concrete
slab placed on top of the structure, and an additional ten were used
on another slab under the structure. Figures 20 and 21 are photographs
of this strain gage system.
Readings under zero load were made at the beginning, and com
pletion of each static load response test and the stability obtained
in the system over the relatively short period of time required for
this test was sufficient to determine the response of the structure.
A zero datum for the strain gages was not maintained throughout the
testing program which was conducted over a 10-month period. Such a
datum was not considered necessary nor was it considered possible
with the system employed. The test area was inside a large metal
building, and there was an almost continuous change in temperature
and humidity in that area. There were differences, too, in tempera
tures at various locations on the structure, especially between loca
tions on the top and bottom surfaces. The rate of response of the
full-scale structure to transient temperature conditions was different
than that in the slabs on which the temperature compensating gages
were mounted. For this reason, the static tests were conducted
during the time of the day when temperature changes were at a minimum.
Positions for measurement of beam deflections with linear motion
dial gages are marked by "d" followed by a number in Figure 18. A
dial gage mounted in a holder, Figure 22, was used for making these
measurements. Information from the beam deflection and beam strain
32

Figure 20. Photograph of Electrical Resistance Strain Gage Pattern on Top of Cast-in-place Concrete.
Figure 21. Photograph of Electrical Resistance Strain Gage Switching and Balancing Unit and Readout Unit.
33

Figure 22. Gage for Measuring Beam Deflection
34

gages enables one to determine if the overall structure maintains
its integrity throughout a loading sequence. Loss of composite
action as a result of failure of the bond between the beams and the
slab would result in increases in strains and deflections in the
beams. These increases would be proportional to the ratio of the
section modulus of the composite unit to the sum of the section
moduli of the individual elements.
Linear motion dial gages were installed to detect any relative
vertical motion between abutting prestressed panels and to detect
transverse and longitudinal relative movement between the prestressed
panels and beams. Locations of those gages are indicated in Figure
23, and photographs of typical installations are shown in Figure 24.
Relative vertical movement between adjacent panels would indicate
that either a vertical crack through the cast-in-place slab had
developed or that bond between the panel and cast-in-place slab had
failed. Either of these vertical movements would indicate a local
deficiency in the structure. Any relative horizontal movement that
might be detected between the beam and the slab would indicate
slippage resulting from failure of the bond between those twa elements.
2.4 Instrumentation of Slab Segment Model
The instrumentation for the slab segment model was planned with
the same objectives as that for the full-scale bridge model and con
sisted of electrical resistance strain gages mounted on the top of
the cast-in-place deck and on the underside of the prestressed panels
35

.....,
"'
r-
....
I ; I : : I I I
I I
~ t t I "t t I I I I I I
..1 L L -=<!>="{:) L ...L _en~ L T I -r T I T I I I I I I
I e. I I t I I I I I
I I J I I I f------ _i ___ - --L--- _1. L L
T- I T I r- T I I I I I I I I -t ~ I ~ I I I I I I I I I - - $-e. I - ..L I I
I I :
I
: I I I I I .
LEGEND: DIAL GAGE <I> :ji
Figure 23. Positions for Panel-to-panel and Panel-to-beam Relative Displacement Dial Gages.
.-
.
-~-=:::::: I-
c=
I-

Figure 24. Linear Motion Dial Gages for Detecting Relative Displacements between Panel and Beam and between Adjoining Panels.
37
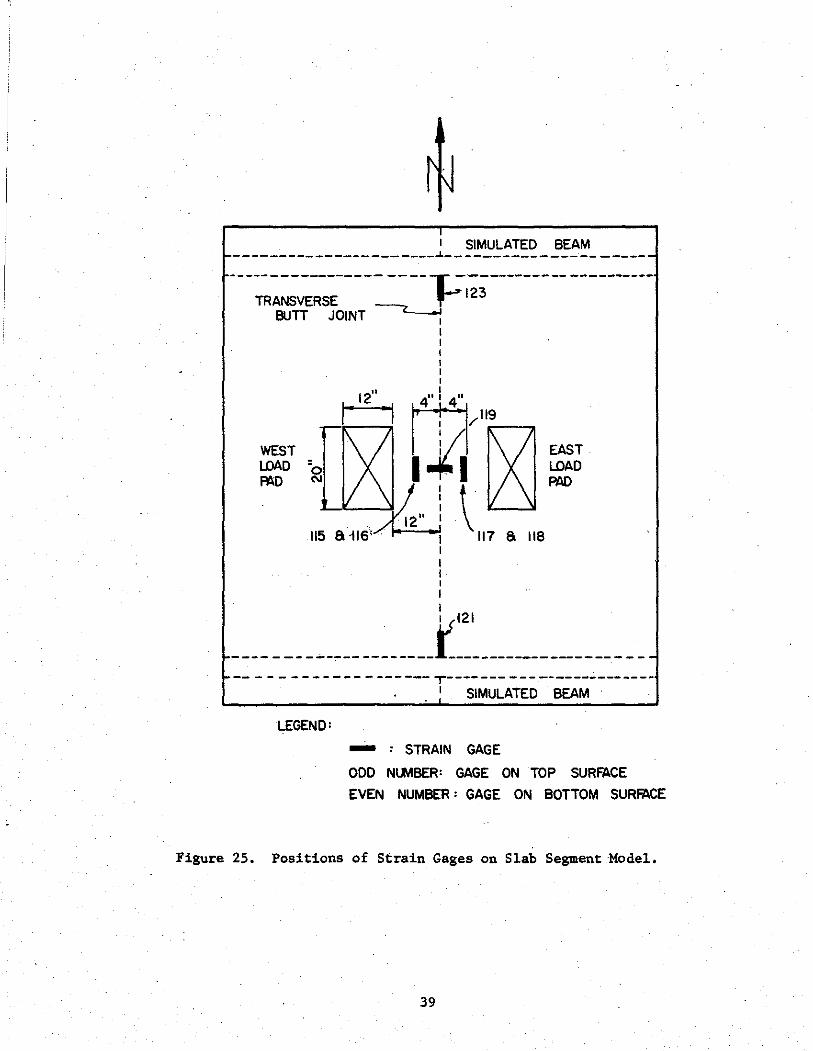
and a mechanical gage for measuring differentail vertical movement
between panels. The gages were clustered in the vicinity of the butt
joint between panels, as illustrated in Figure 25. Gages mounted on
the top of the deck have odd numbers, while gages on the underside of
the prestressed panels have even numbers. The signals from these
gages were channeled through the same switching and balancing unit
and strain indicator used for the full-scale bridge model tests.
Temperature compensating circuitry was similar to that used in the
bridge modeL
2.5 Loading System for Full-scale Bridge Model
Two types of loading arrangements were used to simulate loads
due to traffic. Simulation of axle loads was accomplished with the
hydraulic ram and loading pad arrangement, illustrated in Figures 26
and 27. The two pads representing the dual wheels of a single heavy
axle of a design H20 truck were 12 in. by 20 in. in plan and spaced
6 ft. on centers. A Riehle-Los hydraulic testing machine, shown in
Figure 28, operated a ram for both the static and dynamic axle
loadings. The cyclic loading capability of this equipment was
derived from a piston and flywheel arrangement driven by an electric
motor. The system resulted in a nearly simusodial loading for these
particular tests (Fig. 29).
Pressure gages in the loading system were calibrated by means
of a calibrated load cell placed between the ram and the loading pad.
Prior to loading in each load position, both static and cyclic load
calibrations were made. The load cell was removed during cyclic loading,
38
SIMULATED BEAM ------------------ ____ .J, __ -------------- -----
---~~~~:~-s~----- -----,:.:-~;~--------- ----------BUTT JOINT~ I
I I I I I I I
411 I 411 ffl/" ..... 9 -...,
~ST I i/'1 ~D -2 I+ I
.L..-L.-. ~ I l \ 115 a ~16'~ 111 a 11a
I I I I I I
EAST LOAD PAD
------- -~---- ________ r~~~------------------------------------- T------- -----------------
LEGEND=
1 SIMULATED BEAM
- : STRAIN GAGE
ODD NUMBER: GAGE ON TOP SURFACE
EVEN NUMBER : GAGE ON BOTTOM SURFACE
Figure 25. Positions of Strain Gages on Slab Segment ·Model.
39

12" X 20"X d1~ STEEL PAD (TYP.) --+-- LI)AO CELL
WIDE FLANGE BEAM
BRIDGE DECK
o'-10"
Figure 26. Hydraulic Ram and Loading Pad Arrangement for Applying Simulated Axle Loads.
40
ld'

Figure 27. System for.Applying Simulated Axle Loads to Full-scale Bridge.
Figure 28. Riehle-Los Pulsating Unit.
41

~ N
DOWNWARD DEFLECTION
INCREASING I LOAD
1 --,-·----·-·····-··.-·· ·'·t········.·.-t'j ···.-·ct..-.r.--... , . .--·.-t·.·c~·r·t I/ t 1 ,._ - _. .cc-' ""'' .c'.-'·' cc'_. o':'' .:-.c·c .c:: '-.-:-:c -'C:' .-:''·rcc .· .cc' .".-::,_:-':1 c'cf'o·). c .. -; .' ...... c.. f . I - C/ -------- ---- ---- ..... ---- ---- ·-- - --- . - ...... ····--. r~~~'!!:~
...... ---- --~ -· - - ----.:.: _. :.:: - ~ -- ·-··· --- :_-_--...... --··.' .. - ..... ··-- .. _- \ .. -1:·::% ::::-:::::t-.. ::,
Tl V · · ·· · · I 1·.- \. ~ · -----_-:- ~-~:::..: ~:.::. :~---:·1:~~-:..t::<c·_:.
!7T~I I I 1\T' I ttr~T'"l!d l 1 !rl1:l \ IT Vl i r·T T-f'
" · 1\ I I I I I I ).._. I· lll V I \ I I \ I I \1 1 1 1 11 1 1 \ 1 1 · ··~ 1-J. l-c..ln• "~~I~ \ll7r1 I I \ \ I \ N l.-Y\ I I \ I \
\ YTr\-\.1 \ \=r.l~rJo \r,.\..,.\ \ \ \ \ IT\ -y-x:--\ \ \ n
··-Figure 29. Strip Ghart Record of Load and Reflection Recorded
during Application of Load 3.
and the pressure gages were used to control the load.
Simulation of a wheel load rolling across a transverse butt
joint between prestressed panels was accomplished with two hydraulic
rams acting on loading pads positioned on opposite sides of and
adjacent to the transverse joint (Fig. 30). The load alternated
between the two rams, and one ram loaded and unloaded while the other
remained inactive. The pulsator used to produce this alternating
wheel loading produced a nearly trapezoidal load-time trace (Fig. 31),
with approximately a 21 kip peak.
The static failure load tests were eonducted with the hydraulic
ram and loading pad, arranged as illustrated in Figure 32. A 400 kip
hydraulic ram was used for these tests, and a simple high pressure
oil pump was used to supply hydraulic pressure to the ram. A cal
ibrated load cell was used to measure the load applied to the structure.
2.6 Loading System for Slab Segment Model
The purpose of constructing and testing the slab segment model
was to evaluate the performance of the reinforcing detail at the butt
joint between panels (Figs. 16 and 17) to cyclic simulated service
loads and to determine its ultimate strength characteristics. Thus,
an alternating load, identical to that used on the full-scale bridge
(see Section 2.5), was applied on either side of the panel butt joint
to simulate rolling of a wheel across the joint. The positions of
the two rams used to produce this effect are shown in Figure 25. The
sequence of alternating loads between east and west load pads was the
43

CAST IN PLACE CONCRETE
BOKIP HYDRAULIC
RAMS
LOAD CELLS
6'
/
liX20XI v; STEEL PAD
PRESTRESSED PANEL
PANEL BUTT JOINT
Figure 30. Arrangement of Hydraulic Rams and Loading Pads for Applying Cyclic, Alternating Simulated Wheel Loads.
44

.... "'
INCREASE
I LOAD
-:~_'?"'.~ __ , .. r-·
~' -·J, ·- ---!-"'/" •J·· f •t ''!" ···j- -; •• _,._,.,. - ' .... ' . . ---- ...... -- - . .. . .. . ,., . - ----- ... ... . -·· --I
- '----· .... -------- .... ---- ' . . - - - . - -· "·-· ..... ---...... -- .
•t"'.f-''"f'- ''f' _-_f •'-• .t l~itJ-__ •: ::_•: .::-:c :,o. _-_. -- •-r.
----- __ _,_ __ _ . __ .. ___ ...._ ___ ................... __ .__
F-J-:•T_ { --~·-·'_-'-·_-----._-_-_---
- .... ----- ...... . ·.6-~-<--- .......... .::t":::" _·::t:.:-.. =t .. · .:..-=~~--·- --- . --.. - '-·-- ............ - ... __ _.__ --· .... :::::t::::3..:::.::·:t::: .. ·."t.::·.:::t.::.~:.t.: ............. ______. - ----<-----·---·---.... ---- . ---. --- -
·• ---·-- -·--~·-1:~·:.7:1:7:.:..., ___ _ :,f•:-_\·--_,.rc:,Jcc-.-J':-,•,"J•::tt":•;::oo:l._•:.L:J-,-c:o.t=:··
--·--·---·.~l::~~:lllilll!i"~ill~~~ti;~II~!III.ax~i~*&ti&\._ki-BEGIN @ GFIAPHIC CONTPOLS CORPORIITlOf\J BUFFALO NEW YORK PFliNTl'O !N u 5 A END ··r·--t- _,.-,,'f_---_-,_--,_,1', -·r----r•-'1" -- r-T·- -"" - ---- ---- ---=c:rc--_,oc-=pw .,,,.,--"_,__-- .cot.c~ _.,_--:.r ,_-J--_-F ·· · - •;•·--.t· .-.-,_--"I ·J ~- I · J :'T •''i-' .f"ccr:::•1oc·c··r:c,F'-':1:•oc1::•.t'-'-'i-':":'-'"' •'"'' "-''1'-'c•L•'- r-'-'',•''-T--'-'-'F-_ _-c:~ . .-_-:_,,_,~"~''-'' -":C-'+'-'---f'-':-'r-'---''='r:Cc'l-'•''-7-' '- •.:'' •:,::;'::. :;-_-:-___,_.,,_: t-. - 1 • ·.· . -
-- ._ • - __ ,_.. '_- ,, _--.: c:~:;-- ~~:~ ,,--, --•"··-- ,_-_,:--:_\- -:-::· :--:-: ,--:--;- :::------ _'-,'• -:-~--- _- - •_:_:,: ·:--:--: '_- ,:.-.: :--'.:: ._:•:• ------~---- -___'': -:_--; ~::: :·--- _-:•: :.: _- _, _- - : _- --
•-~·----· -._ .. _ -··••·· .:~-c--.· ~·:~~ ~·--~- ig --:_ -~ ~- ~- g_ .:-; ·--~ z -_ ... -:_ -___ .;. ---~; ~r~~t rt::: _-· __ ------~- t~~~---. - ---·· . J 1- I -·-__ -, --- T::·-- ---------- ---·:ct-o ---------- -r_-,_-_ _-:--- -- ·- ------c~;,--- -------------------- ·· -- ------------ -_-
~i •:·.·_ .. :. : .. - _- ··-.-:· ~--;~1~f~.=- 'Ji: j: ~~--- c;~ ~~~E~_; --~; .~~. -:;_. :·::; ~{_ -.~~~. ~-; ~--~--- ··;;_ ,::: "'. ·_ -.----- ·.· -,-- . _:·-·.··_ ····-:\ -\:.- \· 1- t:c_.-_
. \":T :: - -·-t- : ,-,_ :cc :·:,TF c'~ot-_-•- · - •- - -_-: · -_-_ _- · ---- ---, ·co·cc_ ,-_: -_-,:: --- ______ _-__ ·- --_ :.: : _
'\lt'I't.:LI--F1:--:~'LiFl·-- -,-.-.• -... -IJg~-f-C::_- :y:•_ r-•'1-Y•\\ ---_···A.:., \~ f1 .. ------- ------ . r----
-0.4 SEC. biz SEC. 0.30 SEC. ~SEC. I \ rv n~
INCR~ASE -LOAD
Figure 31. Strip Chart Record of Load vs. Time Recorded During Applications of Load 4.

12X20XI ~ STEEL PAD
CAST-IN-PLACE CONCRETE
400KIP HYDRAULIC
RAM
6"
PRESTRESSED PANEL
PANEL BUTT JOINT
Figure 32. Hydraulic Ram and Loading Pad Arrangement for Static Failure Load Tests.
46

same at that shown in Figure 31 for the_ north and south load pads
on the bridge model. The peak ampitude load on either pad was
approximately 21 kips.
2.7 Program of Tests For Full-Scale Bridge and Slab Segment Models
The structures were subjected to cyclic design loads, and after
completion of these, to static failure loads. In the application of
the cyclic loads, the condition of the structure was determined by
periodically measuring its response to static load. Gage readings
under application of a static load were made before the start of
cyclic loading, at predetermined intervals, and after completion of
cyclic loading at each load position.
The loading plan, designed to accomplish a complete evaluation
of the structures, is shown in Table 3. The positions of the loads
on the full-scale bridge model are indicated in Figure 3·3. Loads
1 through 3, applied to the bridge model, were cyclic loads and simu
lated an AASHO design axle load plus impact of 41.6 kips. Load 4
was a cyclic load and alternated on either side of a panel butt joint
to simulate an AASHO design wheel load plus impact of a total 20.8
kips, rolling across the joint. Loading 4A in Table 3 designates the
alternating load applied to either side of the butt joint between
panels in the slab segment model. Loads 5 through 8 were static
failure loads and were applied to the bridge model through a loading
pad that simulated a wheel. Load SA was a single wheel, static load
to failure, applied through the west load pad of the slab segment
model. The simulated axle loads were designed to evaluate both the
47

Load No.
1
2
3
""" 00 4
4A
5
6
7
8
SA
Type of Simulated Load
Cyclic axle
Cyclic axle
Cyclic axle
Cyclic, alternating wheel
Cyclic, alternating wheel
Static wheel
Static wheel
Static ~~heel
Static wheel
Static wheel
TABLE 3
LOADS APPLIED TO MODELS
Purpose
To determine behavior of bond between panel and cast-in-place concrete with Z-bars and dowels, but no grout.
To determine behavior of bond between panel and cast-in-place concrete with Z-bars, but no dowels or grout.
To determine behavior of bond between panel and cast-in-place concrete with no Z-bars of dowels. One wheel pad was on grouted area, and the other one was not.
To determine ability of deck to support load simulating wheel crossing joint between two panels with no dowels or Z-bars.
To determine ability of deck to support load simulating wheel crossing joint between two panels with dowels, hair pins, and Z-bars. Panels identical to those in IH635 Trinity River bridge.
To determine the failure load of the structure in an area with no dowels or Z-bars.
To determine the failure load of the structure in an area with no dowels or Z-bars.
To determine the failure load of the structure in an area with Z-bars, but no dowels.
To determine the failure load of the structure in an area with Z-bars and dowels.
To determine the failure load of the simulated slab segment panels identical to those in IH635 Trinity River bridge.

..,_
"'
I I I
25'-d'
: I~ I I L ----': II= -, T
)!." 3'-474
1 I 1 _,
l LOAD 8 -+-~1-o<> 1
_
I ---1 1'-o" I ·<t I I _ _j_]
~ I ___ l_ ~-II= T r- l=o
I 1 I al I I I -".Lffi.--1 I I I I I I I 1 I -+ ----+--r-----1+-----r--- I
I
LOAD 3
12'-o" 13'-o"
Figure 33. Plan View of Structure Illustrating Load Positions.

overall and local behavior of composite action in the structures.
The wheel load was designed to evaluate the local behavior of' the
slab at a transverse panel butt joint. The static failure loads
were designed to determine the magnitude of the failure load, the
mode of failure, and to indicate the influence of dowels and Z-bars.
The detailed procedure for evaluation of the behavior of each
of the two models under cyclic loading was as follows:
1. Determine the response to a static design load by reading
the strains and deflections at all gage locations.
2. Subject the structure to a number of cycles of load.
3. Again determine the response to static load.
4. Visually inspect the structure each time the static load
is applied to determine if any form of distress has occurred.
S. Compare the responses to static loads obtained in 1 and
3 above to determine if any distress has occurred in the
structure.
For load 1 through 3, static load response tests·were conducted
as follows:
1. Prior to loading, make initial readings on all beam
deflection gages (bridge model only) and all strain gages.
2. Subject the structure to increments of load of 16 kips
beginning at zero and continuing to 48 kips axle load.
3. Read all gages at each load increment.
4. Return to zero load in one step and again read all gages.
S. Visually inspect the structure under zero load and under
so

the full 48 kips axle load.
This static load evaluation was conducted before cyclic loading was
started, after 1/2 million cycles, after 1 1/2 million cycles, and
at the end of 2 million cycles.
The design axle load, including 30 percent increase for impact,
was 41.6 kips. The minimum that the cyclic loading equipment was
capable of producing on the low end of the load cycle was 8 kips.
Since the·stress range as well as the maximum stress is considered
to be an influential parameter in fatigue testing, it was decided
that the cyclic load range should be the full design value of 41.6
kips and was applied at approximately 160 cycles per minute (2.67
cycles per second). The natural flexural frequency of vibration of
the bridge model was calculated to be 9.2 cycles per second as
compared to a measured value of 10 cycles per second. The natural
frequency of the slab segment model was observed to be much higher
but was not calculated.
The static load response tests for load 4 were conducted
basically as indicated above except that the loads were alternately
applied with each of the two rams.
The cyclic loading equipment used to apply the alternating
wheel load was capable of producing a zero load on the low end of
the cycle. Therefore, this cyclic load ranged from zero to 20.8 kips
and was applied at approximately 50 cycles per minute.
51

III. THEORETICAL ANALYSES
Two theoretical investigations were made in the course of this
study. The first was undertaken to examine the basis for the current
AASHO specification and to determine its applicability to bridges
constructed with prestressed panel subdeck and cast-in-place slab.
Simplified equations for longitudinal and transverse bending moments
in a bridge deck in the vicinity of concentrated forces are developed
and compared with experimental values. The second theoretical dev
elopment was a rigorous method of elastic analysis to predict the
response of a bridge to static loads. The method incorporates all.
pertinent effects, with the exception of beam stiffening provided by
interior diaphrams and the effect of discontinuities in the deck at
butt joints between panels. This method of analysis, which is an
adaptation of a technique developed by Goldberg and Leve ~) for
folded plate structures, was programmed for digital computer and the
results of analyses were compared with experimentally measured strains
and displacements in the full-scale bridge to determine if composite
action was present under static service load conditions.
3.1 Development of Slab Bending Moment Equations After Westergaard
State and federal highway bridges in the United States are
designed to conform to specifications of the AASHO. These specifi
cations, developed through the years, are meant to insure adequate
bridge design practices. The concept of the design method for a beam
and slab bridge is to transfer the wheel loads to the beams by a
52

reinforced concrete slab. The slab is designed to resist a specified
distribution of bending moments. Distribution of the wheel loads in
the longitudinal direction.is assured by the use of longitudinal
reinforcing commonly referred to as distribution steel. This design
method is based on derivations from elastic plate theory and has been
shown to be adequate through the performance of bridge decks in service.
The relationships specified by AASHO for computing the magnitude
of slab bending moments are based on work by Westergaard. (§).
Westergaard applies elastic theory to the problem of bending stresses
in bridge slabs assuming the slab material to be homogeneous, isotropic,
and linearly elastic. Under these assumptions, the slab behavior is
expressed by the classical Lagrange equation:
A concentrated load on the slab is represented by:
n p = 2P E
s 1 Sin~ Sin~
s s
(1)
(2)
Westergaard first considers a slab with a finite span length, S, in the
x-direction, unbounded extensions in the y-direction, and simple
supports along the edges x=O and x = S. The slab is subjected to a
concentrated load, P, at (u, 0).
The solution to this problem is:
n w = ~ E _j_ (1 +
21T3D 1 n3
53
S . n1Tu S. n1Tx J.n -- J.n --
S S (3)

This leads to the following function first introduced by Nadai (£):
P n --l:
7T 1 -n11y/S e
n1ru n'lfX Sin- Sin-
S S (4)
The bending and twisting moments are then expressed in terms of ~ by:
1 -11 aq, 1 + jJ M =-
X 2 <1> + -2- Yay
1 +JJ 1-11 a.p M =--q,
y 2 ---y-
2 ay
1 - JJ a~ Mxy =- -2-y ay
(5)
(6)
(7)
Westergaard further considers a finite form of Eq. 4, also developed
by Nadai. With the origin of coordinates at the center of the span
and the concentrated load, P, at (-v, 0), this function is:
nV2w p B
~ = = 4rr loge A (8)
11Y 7T(X - v) Where A = Cosh S + Cos s
7TY 7T(X + v) B = Cosh s- Cos s
Substitution of Eq. 8 into Eqs, 5 through 7 leads to the expressions
for moments as follows:
54
(1 + )J)P A (1 - )J) '11Y 1 1 M = log - + PySinh S (-- -)
X 8'11 e B 8S B A
(1 + ll)P A (1 - \J) PySinh '1!y (1 - !:.) M = log --y 8'11 e B 8S s B A
(9)
(1 - ll) 1 '11(X - v) 1 '11(X + v)) M =- Py (-Sin +- Sin
xy 8S A s B s
These expressions become undefined at the point of application of the
load. In order to overcome this problem, the load is considered to be
distributed over a circular area of diameter, C, which actually repre-
sents a truck wheel load more realistically than does a concentrated
load. The expressions for bending moment at midspan, with the load
positioned at midspan and \J = 0.15, then become:
M0
x = 0.21072P [log10 *- log10 (
2 0.4 .=...... + 1 - 0.675) + 0.1815]
h2
M = M - 0.0676P (11) oy ox
The deck thickness for a conventional slab and beam concrete
bridge is generally 6 to 8 in. Footprints of a number of dual tire
(10)
truck wheels were measured in this study, and the dimensions were found
to average about 12 in. by 20 in. Therefore, the deck thickness, h, was
assumed to be 7 in., and the diameter, c, of the loaded area was
assumed to be 16 in. in Eq. 10 which then becomes:
M ox 0.2107 [log S + .3810)P
10
55
(12)

Westergaard further presents an expression which gives approximately
the same results as Eq. 10 by using the "effective width" concept (~).
The bending moment at midspan is considered to be that produced at
midspan of a beam of some effective width and subjected to a line load
across its width at midspan. The maximum bending moment in such a
beam is expressed:
(13)
The effective width is a function of the ratio of span length to slab
thickness, but an approximate expression given by Westergaard is:
b = 0.58S + 2c (14)
The approximate expression for maximum bending moment than becomes:
PS M =--.;;..;.-- (15)
ox 2.32S + 8c
In order to account for the effects of edge fixity, Westergaard
considers a rectangular slab with simply supported edges at x = ± S/2
andy = ± ~/2, and loaded by a single force, P, at the center. The
solution for this problem is shown to be:
PR-2 w = "2ii'3D
Cos WnY [(Tanh " n
" n --.,..--.) Cosh w x Cosh2 n "n
-w x Tanh " Sinh w x - Sinh w x + w x Cosh w x] n n n n n n
mrS Where: " = --n 2i
56
(16)

Rotations of the edges of the slab at x = ± S/2 are elimited by super
imposing the following expression for deflection:
= -
Cos w y n
Ct. Tanh Ct. n n
Sinh 2et. + 2et. n n
- w x Sinh w x n n
[et. Tanh Ct. n n
Cosh w x n (17)
The following expressions for the bending moments at the center of a
r ctangular slab with simply supported edges at y = + 2.5TIS, fixed edges
at x = ± S/2, and ~ = 0.15 are given by Westergaard:
M' = M -0.0699 P ox ox
(18)
M' = M -0.1063 P oy ox
(19)
In considering the effects of additional loads acting in the
proximity of the load considered above, Westergaard develops expressions
for ·the maximum bending moments due to: (1} an additional load, P2 ,
placed at a distance, a, from the first load, in the positive x-direction,
(2) an additional load, P3
, placed at a distance, b, in the positive
y-direction, (3) and finally a. fourth load, P4
, placed so as to produce
a rectangular load pattern when combined with the other three loads.
With one axle load on the slab, it is hown by differential calculus
that, for a ~ 0.59035, the maximum bending moment is obtained with
loads P1
and P2
(P1
= P2) positioned as indicated in Figure 34.
57

CONSTANT SLAB THICKNESS, h
Figure 34. Position of Loads for Maximum Bending Moments.
0.4 (Eq.20)
MP'' + 0 _2107 Lo9jJ Cot (v a/4S)j
(Eq.l2) I - 0.3 0.2107 (Lo~0S+0.3810] ., .,
I ... .J ... z !il (Eq.l5) z ... s 2 e.
:iiQ. ADJUSTMENT FOR FIXING EDGES
0.1
S+2 32
AASHO
00 2 4 6 8
SPAN (ft.)
Figure 35. Comparison of Relationships between Applied Load and Maximum Slab Bending Moment in Transverse Direction.
58
10
With ~ = 0.15, that moment is given by:
"a M = M + 0.2107 P log (Cot. 4S" )
X OX 10 2 (20)
For a > 0.59038 the maximum bending moment is obtained by placing only
one of the loads on the slab.
The minimum transverse spacing of truck wheels is obtained when
two trucks are placed side by side. The center-to-center spacing in
this case, if AASHO design dimensions are used, is 4 ft. which is
represented by "a" in Eq. 20. When a= 4ft., two wheel loads on
a beam and slab span is greater than (4 f 0.5903) approximately 6.8 ft.
When considering two axles of the same truck on the slab, two situations
occur--the tandem axle arrangement, which is usually considered to be
two axles spaced 4 ft. apart, and two adjacent fully loaded axles
spaced a minimum of 14 ft. apart. The tandem axles are considered by
AASHO to collectively carry the same load as a single axle and, therefore,
produce a less critical situation than does the single axle. Adjacent
full loaded axles on a truck and wheel loads from trucks in adjacent
traffic lanes can possibly combine to produce the largest possible
bending moments in the longer span slabs. Since it is not the purpose
of this discussion to give a detailed treatment of the numerous
possibilities that exist in loading, the additional situation will not
be analyzed.
Figure 35 presents and compares expressions from Westergaard and
the current AASHO Code for maximum bending moments in slabs. The curve
59

representing Eq. 12 expresses the maximum moment coefficient, M /P, ox
as a function of span length, for a simply supported slab subjected to
a single wheel load. This equation, as discussed earlier, was developed
from Eq. 10 assuming h = 7 in. and c = 16 in. Changes in the position
of this curve would occur if other values of c and h were assumed.
The curve parallel to and below this curve gives the maximum moment
coefficient for the same conditions except that the edges of the slab
are fixed against rotation. The maximum moment coefficient obtained
using the effective width concept is given by the curve for Eq. 15.
This curve compares reasonably well with the more complicated one
for Eq, 12.
As the span of the slab increases, a point is reached where the
maximum bending moment is created by placing two wheel loads on the
span instead of one. For spans where it is geometrically possible
to place two trucks side, this point is reached at a span length of
about 6 •. 8 ft. Eq. 20 is applicable to spans between 6.8 ft, and 10 ft.
and is also included in Figure 35. The two linear relationships
expressed by (S + 2)/32 and by 0.8 of that amount are the current
AASHO provisions for maximum positive and negative transverse bending
moments. The expression containing the factor 0.8 is to be applied
in the case of slabs continous over three or more supports.
3.2 Folded Plate Analysis for Composite Slab and Beam Bridge
The typical simple span, composite slab and beam bridge shown in
Figure 36 is analyzed by breaking the structure into two types of
60

"' .... ~LOAD
Figure 36.
~LOAD
/DECK SLAB../
~LOAD DIAPHRAM (ENDS ONLY)
Typical Composite Slab and Beam Bridge.
SIMPLE SUPPORT

elements;. plates and beams. A plate element consists of the portion
of deck slab contained between two lines of beams ,as shown in Figure 37.
The width of the plate element is the center-to-center lateral spacing
of the beams, its length is the span of the bridge and its thickness
is equal to the combined thicknesses of the prestressed panel and cast-
in-place deck. It is supported by, and rigidly attached to, beams
along its longitudinal edges and is supported by diaphrams with neg-
ligible torsional stiffness at each end. No intermediate diaphrams
are present in the bridge. The plate is assumed to be homogeneous
and linearly elastic. A beam element consists of a single beam
whose length is the span of the bridge. Its ends are restrained
against twisting by the end diaphrams. A beam element is assumed
to be homogeneous and linearly elastic.
The predominant feature of this method of analysis is the use of
Fourier series expansions to represent the loads applied to the bridge
and to represent the force-displacement relationships for each plate
and beam element. The bridge is analyzed for each term in the load
series expansion, and the results from each term are superimposed to
obtain the total response of the bridge to loads. As an example of
a Fourier series representation of a load on a plate, consider the
line load of magnitude Q over a length a shown in Figure 38. This
load may be represented by the series
M
a(x) = I (21) m=l
62

"' w
PLATE ELEMENT "-._ '\__PLATE ENT ELEM ~
'\__PLATE ELEMENT
Figure 37. Beam and Plate Elements for Analysis.

y
h
EDGE
Figure 38. Line Load on a Slab.
q q1 :: 40 SIN Tf"' SIN Tf"" 1T 2a a
X
q = .1Q_ SIN 3Tfc<. SIN 31T'\' 3 31T 2a a
j!Q-L.L..LL...b.....,,..-,.--.--.,-,,........,,£.-.1.,.....!.,-_1_:1-...r. ... ...:~c:...__ THIRD HARMONIC (m = 3) X
FUNCTION
TERM APPROXIMATION
k~_LLU_l...:S....._"""'_==:::::=..;...- SUPERPOSITION OF THREE X HARMONICS
Figure 39. Fourier Series Representation of Line Load.
64

where the amplitude qm of the ~ harmonic is given by
4Q ID1Hl =-sin--
11m 2a
m11~ sin-
a (22)
The contribution of the first three terms (harmonics) of this series
to the representation of the actual load are shown in Figure 37, to-
gether with their superimposed result. By using a sufficient number
of terms (the index Min Eq. 21), it is possible to obtain a repre-
sentation to any desired accuracy. Relationships between edge-forces
and edge-displacements can be derived for a plate element using series
expansions similar to those used for loads. These relationships
reduce the analysis of a plate to the consideration of forces and
displacements along each of its longitudinal edges. The series ex-
pansion for each component of edge-force or edge-displacement will
contain an amplitude (analogous to ~ in Eq. 21) multiplied by a sine
or cosine term. Similarly, relationships between forces applied to a
beam element and the resulting displacements that occur in the beam at
points where it is bonded to the plates it supports can be written in
series form. Equations for the equilibrium of forces at the juncture of
plates and beam can then be stated in terms of edge displacement series.
Upon canceling common sine or cosine terms from these series, a set of
simultaneous linear equations in the unknown displacement amplitudes is
obtained. The solution of the system of equations provides values for
edge displacement amplitudes which can be used to compute moments, stresses,
strains, etc. at any point in a beam or plate element.
65

3.2.1 Edge-force/edge-displacement Relationships for a Plate Element
Each longitudinal edge of a plate element undergoes four types
of displacements when the bridge is subjected to loads; i) a downward
movement, ii) a rotation about the longitudinal axis of the plate,
iii) a lateral translation, and iv) a longitudinal translation. For
a plate element (i, j) with longitudinal edges numbered i and j, the m11x
displacements for edge i are denoted by i) W .. sin-a-, 1Jm
m11x ii) <P. • sin-a-, . 1Jm
mTix mTix iii) V .. sin~, and iv) U .. cos~, where the first term in each expres-
1Jm 1Jm
sion is the amplitude of the sine or cosine series, and the subscripts
denote the ith edge of plated (i, j) for the~ harmonic. Figures 40
through 43 illustrate these types of displacements for edge i. Similar m11x
displacements along edge j of this plate are denoted by W .. sin-a-, J1m
m11x U •• cos-a-.
J1m These edge displacements give
rise to forces along each longitudinal edge of the plate, and for edge
i are denoted by m11x
R.j sin-a-, 1m ·
m1rx mnx M .. sin-a-, N •• sin-a- and
1Jm 1Jm
m11x S .. cosa-, as 1Jm
shown in Figures 44 and 45. The resulting forces along edge j are
denoted in a similar manner, with the order of subscripts i and j
reversed.
If plate (i, j) is subjected to a lateral load, which can be
approximated by the block loading shmm in Figure 46, and its long-m11x
itudinal edges are fixed against displacement, edge forces Rf .. sin-a-, 1Jm
mTIX ffi'ITX IDTIX Mf .. sin~, Rf .. sin~ and Mf .. ·sin~ result. The expressions for
1Jm 1Jm 1Jm
these fixed edge forces, in terms of the load parameters P, a, S,n.~.
and plate dimensions a, b, h are given in Appendix A. The final forces
on each edge of plate element (i, j) will be the sum of the fixed-edge
66

y
y
EDGE
Figure 40. Downward Displacement of Edge i.
Figure 41. Rotation of Edge i.
67
EDGE
EDGE j
X
EDGE j
X

y
j
EDGE
Figure 42. Lateral Translation of. Edge i.
EDGE j
X
Figure 43. Longitudinal Translation of Edge i.
68

y
y
EDGE
Figure 44. Edge Forces Resulting from Downward Displacement and Rotation of Edges i and j.
Figure 45. Edge Forces Resulting from Lateral and Longitudinal Translation of Edges i and j.
69

b
I
t l
a CLAMPED EDGE
TOTAL LOAD P DISTRIBUTED UNIFORMLY OVER AREA o< BY ~
EDGE
CLAMPED. EDGE
Figure 46. Fixed Edge Forces for Laterally Loaded Plate.
70

forces and edge-displacement induced forces. For edge i, the final
forces will be given by
{Mf.j + cl .. $.. + c2 .. L. - c3<J'mw<J'm ~ m ~Jm ~Jm ~Jm J~m ~ ~
m1rx Rijmsin-a- ~ {Rfijm + C5ijm$ijm + C6ijm$jim - C7ijmWijm
m1rx sin-a-
m1rx Nijmsin-a-~ {Nfijm- C9ijmVijm + ClOijmVjim
+ cl2'. u .. } ~Jm J~m
m1rx sin-a--'
m1rx 8ijmcos-a-~ {sfijm- cl3ijmvijm- cl4ijmvjim- cl5ijm0ijm
m1rx cos--a-"
(23)
Canceling sine and cosine terms from each side of the equations, and
using a more compact matrix notation, Eqs, 23 become,
71

M = Mf + cl c2 -c3 c4 0 0 0 0 ~ij
R Rf c5 c6 -c7 ca 0 0 0 0 <I> ji
N 0 0 0 0 0 -c9 clO-cllcl2 wij
s ijm 0 ijm 0 0 0 0 -cl3-cl4-cl5cl6 ijm w .. Jl.
(24)
V.j l. .
V .. Jl.
uij
uji m
For edge j, the final forces for the~ harmonic are
M = M c2
c1
-c4 c3
o 0 0 0 ~ij
R R -c6-c5 c8-c
7 o 0 0 0 ~ji
N 0 0 0 0 0 c1o -c9 -cl2 en wij
s im 0 im 0 0 0 0 cl4 cl3 cl6-cl5 jim wji
V .. l.J
vji
u .. l.J
uji m
The constants Clijm through c16ijm are dependent on the dimensions and
material properties of the plate, Expressions for them are given in
Appendix A.
3.2.2 Force/displacement Relationships for a Beam Element
The beam elements are assumed to be rigidly attached to the bottom
72
face of the plates they support, and must therefore undergo displace-
ments which are compatible with those of the edges of the plate
elements. The edge-displacements of the plate elements are for
points on the longitudinal edge of the plate, at mid-depth. Thus,
to insure compatibility between plate and beam displacements, the
force/displacement relationships for the beam element are referred
to a reference point at mid-depth of the plates, as shown in Figure
47(a). The beam element is assumed to undergo the same four components
of displacement as the edge of the plate. These are illustrated in
Figure 47(b) through 47(e) for beam element i, and consist of i) a m~x m~x
downward displacement W. sin-.r-, ii) a rotation ~- sin-.r-, iii) a 1m 1m m ·x ·
lateral movement V. sin-.r-, and iv) a longitudinal translation ~m
mrrx U. ocs~. These displacement components result in forces at the ~m
mTix mnx mnx mnx reference point of R. sin~, M. sin-.r-, N. sin-.r-and S. sin~,
1m 1m J.m 1m
as shown in Figures 48 and 49. The relationships between the force
and displacement components are given by
M 1 Bl 0 Bz 0 4> I R I 0 B3 0 B4 w ' I (26)
I N B5 0 B6 0 v
s J im 0 0 B7 B8 im u im
where the constants B1
. through B8 . are listed in Appendix A. 1m 1m
73

" ....
REFERENCE POINT FOR DISPLACEMENTS AND FORCES
.h. • " i!t=-----.EE 2 '------ ~ • h ~ -r=-r ----1
v • 1r
i!
COORDINATE SYSTEM FOR BEAM AT C.G.
BEAM ELEMENT
(a)
Vi
wim --i
v • 1e
1.
i!
(b) (c)
11 r1 y X
v.. 1e 4~ ~ ~~
i!
i!
(d) (e)
Figure 47. Displacements for Beam Element.

y
X BEAM ELEMENT
Figure 48. Forces from Downward Displacement and Rotation of Beam Element i.
Figure 49. Forces from Lateral and Longitudinal Translation of Beam Element i. X
BEAM ELEMENT
75
3.2.3 Joint-force Equilibrium Equations
For the bridge structure to be in equilibrium under a set of
loads, the summation of forces at the juncture of a beam element and
the plate elements it supports must be zero, for all beam-plate joints
in the bridge. The forces acting on a typical interior joint, between
plates (i, j), (j,k) and beam j are shown in Figure 50. For the mth
harmonic in the load series expansion, a summation of forces along
the three coordinate axes and a summation of movements, at the reference
point yields the equations;
l:F 0 {S .. sjkm + s. } ~
= = + cos a X J~m Jm
m1rx EF = 0 = {Njim + Njkm + Njm } sin a-y (27)
m1rx EF = 0 = {Rjim + Rjkm + Rjm} sin---a-z
m1rx l:M = 0 = {Mjim + Mjkm + Mjm} sin-a
X
A cancellation of the sine or cosine terms in the product yields a
linear set of equations in the force amplitudes. Letting the amplitudes
of the four components of displacement at joints i, j and k be
denoted by (¢. , W. , V. , U. ) , ("¢. , W. , V. , UJ.m) and (~km' Wkm' ~m ~m ~m ~m Jm Jm Jm
vkm, Ukm) and noting that compatibility of displacements requires
-~ ~ ~ ~
l;' w w w = (28)
v = v v v
u ijm u im u kjm u km
76

REFERENCE POINT
~ EDGE i EDGE j t:jim f' 1 \.1" ~~-y r ~~ ~ Ebj-r Mjim f! s ..
PLATE ELEMENT( i , j) Jim
~ 2
-..J -..J
Rim .
Ml~Nlm Sjmr=---,
Y• 10
2
BEAM ELEMENT
u.Am EDGE j EDGE k ~ N~I .. Y ·X I~
Mjkm 5Jkm r PLATE ELEMENT ( j , k )
~ 2
Figure SO. Joint Forces at Juncture of Beam and Plate Elements.
4> = 4> = 4> = 4>
w w w w
v v v v (29)
u u u u jim jm "jkm jm
leads to a set of simultaneous linear equations in the joint displace-
ment components. Substituting Eqs. 24, 25, and 26 into 27, gives the
following four simultaneous equations in joint displacements:
+ Bl. ) <j>. + (C3 .. - C3jkm + B2. ) WJ.m Jm Jm ~Jm Jm
-Rfjim -Rfjkm = -C6ijm ~im -C8ijm Wim+ (-CSijm + CSjkm) (30)
~jm + (-C7ijm -C7jkm + B3jm) Wjm + B4jm Ujm
- -+ (Cl6jkm + cl6ijm + BSjm) ujm+ cl3jkm vkm
In a similar manner, four additional equations can be determined for each
78

plate-beam joint in the bridge. The resulting system of equations re
lates the amplitudes of displacement components at each joint in the
bridge to the amplitudes of the series expansions for the loads on the
bridge, for.a particular harmonic in the series expansion. The solu
tion of these equations determines values for the displacement ampli
tudes, which can then be used to compute moments, stresses or strains
at any point in a plate or beam element. The results of an analysis
for each harmonic used in the load series expansion can then be
superimposed to obtain the total moments, stresses and strains exist
ing in the loaded structure.
3.3 Comparison With Examples From the Literature
The method of analysis described in the preceding section was
programmed for digital computer, and the program was used to analyze
several plate and beam structures described in the literature to
test the validity of the method.
The first example considered, taken from Reference (11), was the
rectangular plate shown in Figure 51 (a). The plate was simply sup
ported on all four edges and carried a uniformly distributed load
of 0.625 lbs,/in2 over a 40 in. by 40 in. area at the center of
the plate. The plate is 6.0 in. thick, with a modulus of elasticity
of 106 psi and Poisson's ratio of 0.3.
The structure shown in Figure 51 (c), with supporting beams
along the two edges of the plate parallel to the X-axis, was used
79

40"
SIMPLE SUPPORT
(a)
BEAM
UNIFORM LOAD OF 0.625 lb./in2
r.ri r.ri
100"
(c)
y
CLAMPED SUPPORT
0 .,.
(b)
----X
VI VI
Figure 51. Example Problem No. 1.
80
--X

to simulate the plate in Figure Sl(a). The simple support conditions
along the two edges parallel to the X-axis were obtained for the
structure in Figure Sl(c) by setting the torsional resistance of the
beams to zero and assigning a large value (108) to their moments
of inertia. The bending moments in the x and y directions at the center
of the plate were computed by the program, and are compared with those
from Reference (!!) in Table .4.
The second example tested was identical to the first, except that
the edges of the plate parallel to the X-axis were clamped (see ~ig. Sl(b)).
The fixed edge condition was simulated with the computer model by setting
both the torsional stiffness and moment of inertia of the beams equal
to a large number. A comparison of bending moments and downward dis
placement at the center of the plate are compared with those from Ref
erence (11) in Table 5.
As a final check, the methods of analysis developed for this study
was used to analyze·· a 100 ft. span composite slab and girder bridge.
This example was considered in Reference (12) using the finite element
technique. The bridge consisted for four steel plate girders, with
14.0 in. by 1.75 in. flanges and a 71.6 in. by 0.375 in. web, spaced
laterally at 100 in. centers. The slab was 7.5 in. thick and overhung
the out side girders by 50 in. Reference {]d) did not give material
properties, so modulus of elasticity values of 29 million and 3.2
million were assumed for the beams and slab, respectively. Poisson's
ratio for the slab was taken as 0.166 and the torsional stiffness was
81

TABLE 4
COMPARISON OF BENDING MOMENTS FOR EXAMPLE NO. 1
M M X y
(in-lb/in) (in-lb/in)
Ref. ()J) 168.0 138.0
Folded Plate 167.8 138.4 Analysis
TABLE 5
COMPARISON OF BENDING MOMENTS AND DEFLECTION FOR EXAMPLE NO. 2
M M w X y
(in-lb/in) (in-lb/in) (in)
Ref. (11) 36.7 32.0 .00166
Folded Plate 37.2 32.0 .00168 Analysis
82

co w
Load Position
Line Load
on Outside
Beam A
Line Load
on Inside
Beam B
TABLE 6
COMPARISON OF TRANSVERSE BENDING MOMENTS IN THE DECK
SLAB ADJACENT TO BEAMS FOR EXAMPLE NO. 2
Location Solution Transverse Slab Moment M .at Beam: y
A B c D
Ref. (12) 1.46 -11.86 -6.49 -0.37 1/4 span
Folded Plate 1.19 Analysis -11.06 -5.55 -0.26
Ref. (12) 2.06 -16.76 -9.14 -0.52 1/2 span
Folded Plate 1.77 Analysis -15.64 -7.91 -0.37
Ref. (12) -0.43 19.06 -0.20 -0.60 1/4 span
Folded Plate -0.43 17.86 Analysis -0.89 -0.50
Ref. (12) f-0.61 26.92 -0.30 -0.85 1/2 span
Folded Plate !-0.61 25.26 Analysis -1.25 -0.71

assumed to be zero. The bridge was analyzed for two load conditions
a line load sin ~ applied over an outside beam and over an inside L
beam. Table 6 lists a comparison of transverse bending moments ad-
jacent to each beam at quarter and mid-span for each load condition.
84

IV. PRESENTATION AND ANALYSIS OF RESULTS
The loading and instrumentation systems used for the testing
of the full-scale bridge model and the slab segment model were
devised to monitor changes in the static response of the structures
after the application of cyclic loads. The capacity of the loading
system was chosen so that loads large enough to cause failure in the
deck slab could be applied. The sequence of cyclic load-static
response load tests and the static load to failure tests was des
cribed in Section 2.7. This section presents a summary of the
results of those tests and an evaluation of the overall performance
of the structures.
The primary means used to determine the state of composite
action between beams, panels and cast-in-place deck was by compari
son of static load response, as reflected by strain and deflection
measurements, before and after cyclic loading, and by comparison of
the response to that predicted for a fully composite structure, as
determined from the folded plate analysis method developed in Chapter
3. It should be noted that this mathematical model does not identi
cally duplicate the physical prototype because of the discontinuity
in the deck at butt joints between panels. Thus, in the area immedi
ately adjacent to a joint, the actual stress distribution should
differ somewhat from that predicted by mathematical model.
The stresses, strains and displacements from the folded plate
analysis which are used for comparison with measured quantities were
85
obtained by imputing the actual loads, the dimensions and material
properties of the bridge model to the computer program and speci
fying that stresses, strains and displacements be computed at those
points on the structure where instrumentation was located.
4.1 Repetitive Load Tests of Full-Scale Bridge Model
Plots of beam deflections for static load applied at positions
1 through 3 (see Fig. 33) before cyclic loading and after 2 million
cycles of load are presented in Figures 52 through 54. Close com
parisons of deflections before and after cyclic loading indicate that
no loss of stiffness was caused by the loading. This statement is
further supported by the fact that no slippage between the beams and
the slab was indicated by the relative displacement dial gages. Had
composite action between the beams and the slab not existed, the de
flections would have increased above those for composite action •.
The increase in deflections would be proportional to the ratio of
the moments of inertia for the composite and noncomposite sections-
other influences such as loss of torsional stiffness being ignored.
This ratio for the test structure was about 2.4.
Experimentally measured strains at the upper and lower surface
of the slab at locations in the proximity of the simulated wheel pads
are presented in Tables 7 through 9. The generally close agreement
between values obtained from the static load response tests made
before and after cyclic loading indicate that no distress was caused
by the cyclic loading. In some isolated instances, such as gages 26,
86
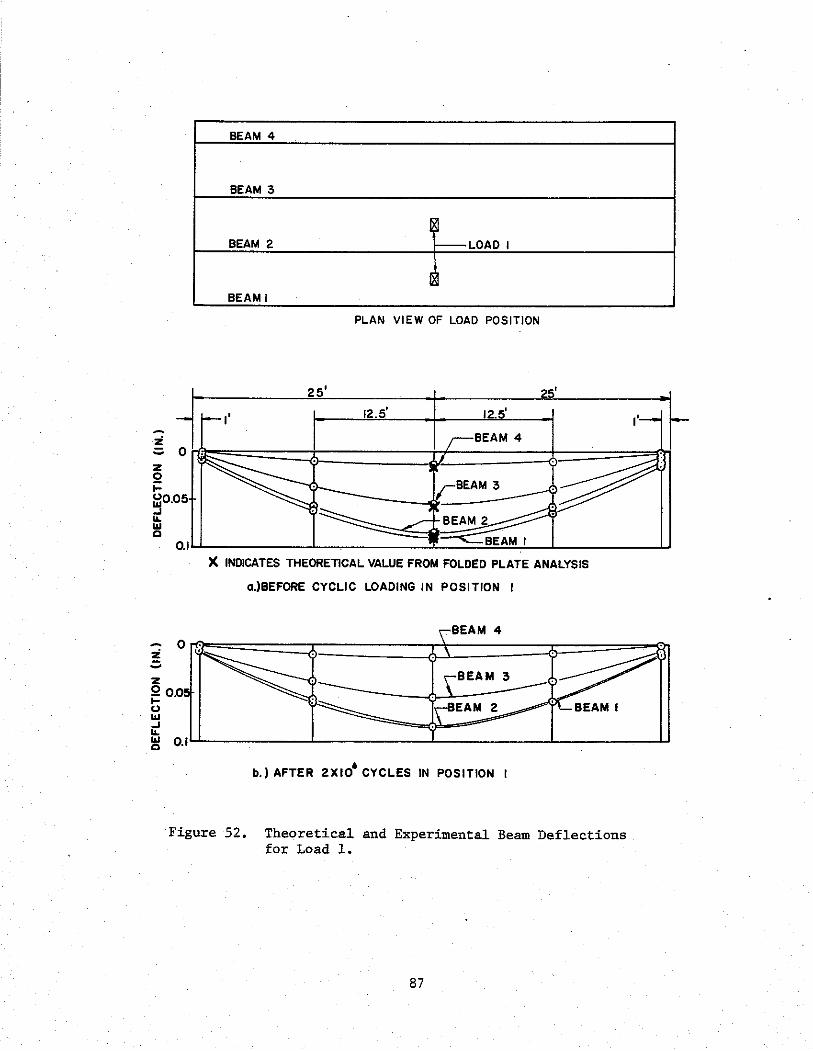
z 0 z
BEAM 4
BEAM 3
~ BEAM 2 f----LOAD I
[ BEAM I
PLAN VIEW OF LOAD POSITION
25'
12.5'
BEAM 4
BEAM 3
BEAM 2
BEAM I O.IL.L _____ .L_ ____ ___.::t_-==..!:=!!.2...-.L...------'-'
X INDICATES THEORETICAL VALUE FROM FOLDED PLATE ANALYSIS
a.)BEFORE CYCLIC LOADING IN POSITION
BEAM 4
Q 0.0 .... <> "' ..J ... l!l O.IL.L ______ L_ ______ L ______ L_ _____ ...u
b.) AFTER 2XI06
CYCLES IN POSITION I
Figure 52. Theoretical and Experimental Beam Deflections for Load 1.
87

BEAM 4
BEAM ::5 -LOAD 2
BEAM 2
BEAM I
PLAN VIEW OF LOAD POSITION
1r-l· 25'
'i' 12.5' 12.5'
BEAM I - 0 . ! z Q 1-Q05 <J
~ ... loJ 0 OJ
~0.05 ... <J
~
X INDICATES THEORETICAL VALUE FROM FOLDED PLATE ANALYSIS
a.) BEFORE CYCLIC LOADING IN POSITION 2
BEAM I
I' r
... ~~::5 "' O.IU..------L.=:...::::::::...:~-L------L-----..W 0
b.) AFTER 2XIO.CYCLES IN POSITION 2
Figure 53. Theoretical and Experimental Beam Deflections for Load 2.
88
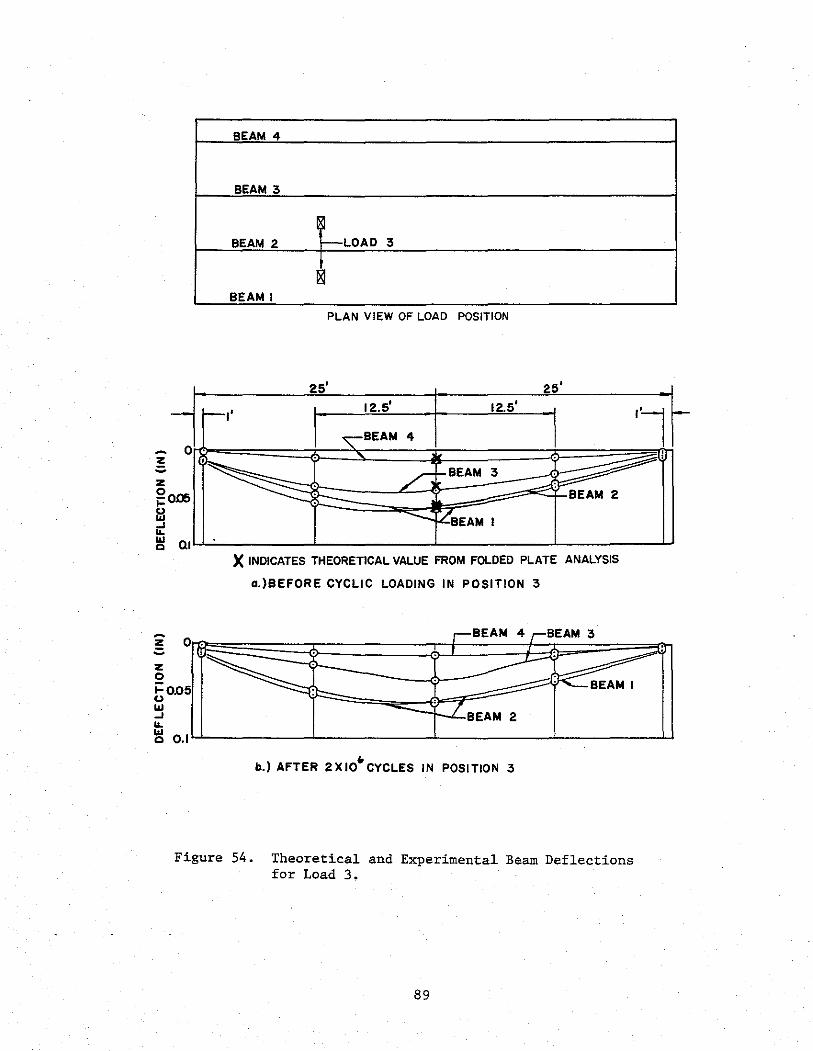
BEAM 4
BEAM 3
BEAM 2 r--LOAD 3
~ BEAM I
PLAN VIEW OF LOAD POSITION
25' 25'
f--1'
I I ll ""BEAM 4
12 5' 125'
iJ,... -< ·~l!
/ !-BEAM 3 . :...--z -
z 0 i=o.o u
"' ....1 ....
I
5
~ 0 .I
~ := :?-- BEAM 2 -ZBEAM 1
X INDICATES THEORETICAL VALUE FROM FOLDED PLATE ANALYSIS
a.)BEFORE CYCLIC LOADING IN POSITION 3
r' ,.-• BEAM 4 BEAM 3
r~ :
_..-: :1<- BEAM I
' LBEAM 2
b.) AFTER 2XIO" CYCLES IN POSITION 3
Figure 54. Theoretical and Experimental Beam Deflections for Load 3.
89
:

TABLE 7. EXPERIMENTAL AND THEORETICAL STRAINS FOR LOAD POSITION 1
Axle Load of 48 kips
Strain Gage Experimental Strain Theoretical Strain Identification micro. in. per in. from Folded Plate
Analysis Before Cyclic After Cyclic micro. in. per in. Loading Loading
25a -11 -15 -27 26 -26 -17 -28
27 -14 -13 -22 ., 28 -20 -14 -34 Q)
Oil «< 29 -56 -56 -56 <!)
30 + 1 - 2 - 2 ...... «< a 31 -16 -14 -22 .... .,
32 -19 -15 -34 ::l .... .... Oil 33 -15 -14 -27 a 0 34 -16 -13 -28 o-l
35 -18 -23 -24 36 +14 +26 +31
37 -39 -27 -29
"' 38 +20 +33 +37 Q) Oil
"' 39 -74 -76 -65 <!)
Q) 40 +61 +74 +71 ., ... Q)
41 -28 -24 -29 :> ., 42 +25 +36 +37 a
"' ... E-< 43 -39 -38 -24
44 +18 +24 +31
a Odd numbered gages were on top surface and even numbered gages were directly below on bottom surface of slab.
90

TABLE 8. EXPERIMENTAL AND THEORETICAL STRAINS FOR LOAD POSITION 2
Axle Load of 48 kips
Strain Gage Experimental Strain Theoretical Strain Identification micro. in. per in• from Folded Plate
Analysis Before Cyclic After Cyclic micro. in. per in. Loading Loading
45a - 9 - 5 -18 46 -15 -14 -21
47 - 3 - 4 -13
"' 48 -17 -14 -27 "' bO
"' 49 -32 -32 -46 C!l
so + 7 + 1 + 5 ..... "' c:: 51 - 7 - 7 -13 .... "" 52 -23 -19 -27 ::> .... .... bO 53 -23 -24 -18 c:: 0 54 -23 -19 -21 ,..,
55 -21 -21 -23 56 +22 +24 +30
57 -31 -27 -28 "' 58 +47 +34 +35 "' bO
"' C!l 59 -77 -62 -63
"' 60 +75 +76 +69 "' '"' "' 61 -32 -29 -28 :> "' 62 +31 +36 +35 c:: "' ,..
H 63 -11 -12 -23 64 +25 b +30
a Odd numbered gages were on top surface and even numbered gages were directly below on bottom surface of slab.
b No data.
91

TABLE 9. EXPERIMENTAL AND THEORETICAL STRAINS FOR LOAD POSITION 3
Axle Load of 48 kips
Strain Gage Experimental Strain Theoretical Strain Identification micro. in. per in. from Folded Plate
Analysis Before Cyclic After Cyclic micro. in. per in. Loading Loading
65a - 4 -10 -17 66 - 8 -14 -11
., 67 - 6 -11 -17 ., 68 -10 -18 -13 00
"' C!> 69 -12 -18 -34
...; 70 -13 -21 - 5 "' " ..... "' 71 -13 -18 -36 "' .u 72 - 3 -20 - 8 ..... 00
" 0 73 -16 -25 -20 ,..., 74 + 3 + 3 -24
75 - 7 -14 -11 76 +13 + 9 +16
77 -12 -20 -14 ., 78 +17 +13 +19 ., 00
"' C!> 79 -52 -59 -54 ., 80 +53 +51 +48 ., .... .,
81 -50 -58 -54 :> ., 82 +66 +56 +58 " "' ....
E-< 83 -54 -57 -40 84 +50 +40 +45
a Odd numbered gages were on top surface and even numbered gages were directly below on bottom surface of slab.
92

36, 37, 38, 42, 58, 68, 72, and 75 (Fig. 18), the agreement is not
close, but no consistent pattern that would indicate distress could
be extracted from the data. Gage 25, which is directly above 26, -
showed a slight increase in longitudinal strain and gage 26 showed
a decrease. Gages 37 and 38 showed a decrease in transverse strain
on the top and an increase on the bottom. Changes in the measured
strains that would be expected as a result of bond failure would be
related to changes in the section modulus of the slab. The total
section modulus of the slab in the case of no bond at the panel to
cast-in-place interface is only half that of the section modulus of
the composite slab. Therefore, total failure of the bond at this
interface, over a widespread area, would be indicated by an increase
of about 100 percent in the slab strains caused by local bending.
The strains can be grouped on the basis of gage location, into two
groups--those adjacent to a panel butt joint and those that are not.
Excellent agreement between theoretical (folded plate analysis) and
experimental strains was obtained for gage positions not adjacent to
a panel joint. (Compare, for example, the measured and theoretical
strain values for gages 29, 30, 39, and 40 in Table 7; 49, 50, 59,
and 60 in Table 8; and 69, 70, 79, and 80 in Table 9.) Transverse
gages adjacent to a panel butt joint show less satisfactory agreement,
but no apparent trends are indicated. (Compare the measured and
theoretical values for gages 35, 36, 37, 38, 41, 42, 43, and 44 in
Table 7; gages 55, 56, 57, 58, 61, 62, 63, and 64 in Table 8; and
93

gages 75, 76, 77, 78, 81, 82, 83, and 84 in Table 9.) Longitudinal
gages adjacent to butt joints showed the poorest agreement among
all gages, with theoretical values being consistently higher than
measured ones. (Compare the measured and theoretical values for
gages 25, 26, 27 • 28, 31, 32, 33, and 34 in Table 7; gages 45, 46,
47, 48, 51, 52, 53, and 54 in Table 8; and gages 65, 66, 67, 68, 71,
72, 73, and 74 in Table 9.) Discrepancies in these readings were
expected, since the folded plate analysis does not account for the
discontinuity at panel butt joints.
Stresses were computed from the measured slab strains using the
plane stress relationships:
E
crL : 1 - ~2 (EL + ~ET)
E (31) crT : (ET + ~EL) 1 - ~2
where
crL : stress in the longitudinal direction of bridge
crT : stress in the transverse direction of bridge
EL : strain in the longitudinal direction
ET = strain in the transverse direction
E : 5.23 X 10⁶psi. for cast-in-place concrete 5.65 X 10⁶psi. for prestressed panel concrete
~ = 0.15
Strains from adjacent longitudinal and transverse gages were assumed
94

EAST WHEEL PAD
LOAD I
_L _L ~ _L _L
z GAGES 25 THRU 44
~~--~~~--~-
l-1591 [-89] (-215) -221
+90 (+127) [+89] 1+1531
l-1751 [+40J (-105) -112
-77 (-54) [-401 l-1261
PLAN SHOWING GAGE POSITIONS
l-1851 l-4161 [ -125] [-444] (-140)
TOP OF DECK (-452)
-163 -441
COMPRESSION
TENSION
BOTTOM OF DECK
+128 +353 (+195) (+426) [+1251 [T444J j+l76j 1+3591
TRANSVERSE STRESSES (psi)
l-1521 l-3751 [+421 [-1291 (-94) (-361) -103 TOP OF DECK -359
\ COMPRESSION
~~~ BOTTOM OF DECK
-88 (-56) [-421 l-1561
LONGITUilNAL
+59 (+53) t+l291 1+541
STRESSES ( psi)
l-1951 [-125] (-155) -220
+98 (+179) [+1251 1+1761
l-1521 [+421 ( -91) -106
-98 (-52) [-421 l-1561
l-1591 [-89] (-135)
-105
+58 (+136) [+891 1+1531
l-1751 [+401 (-99) -73
MIDSPAN /' EAST
; WHEEL
+
'
LONGITUDINAL AXIS
tTRANSVERSE
~NGITUDINAL
Figure 55. Stresses Computed from Experimental Strains near East Wheel Pad of Load 1.
95
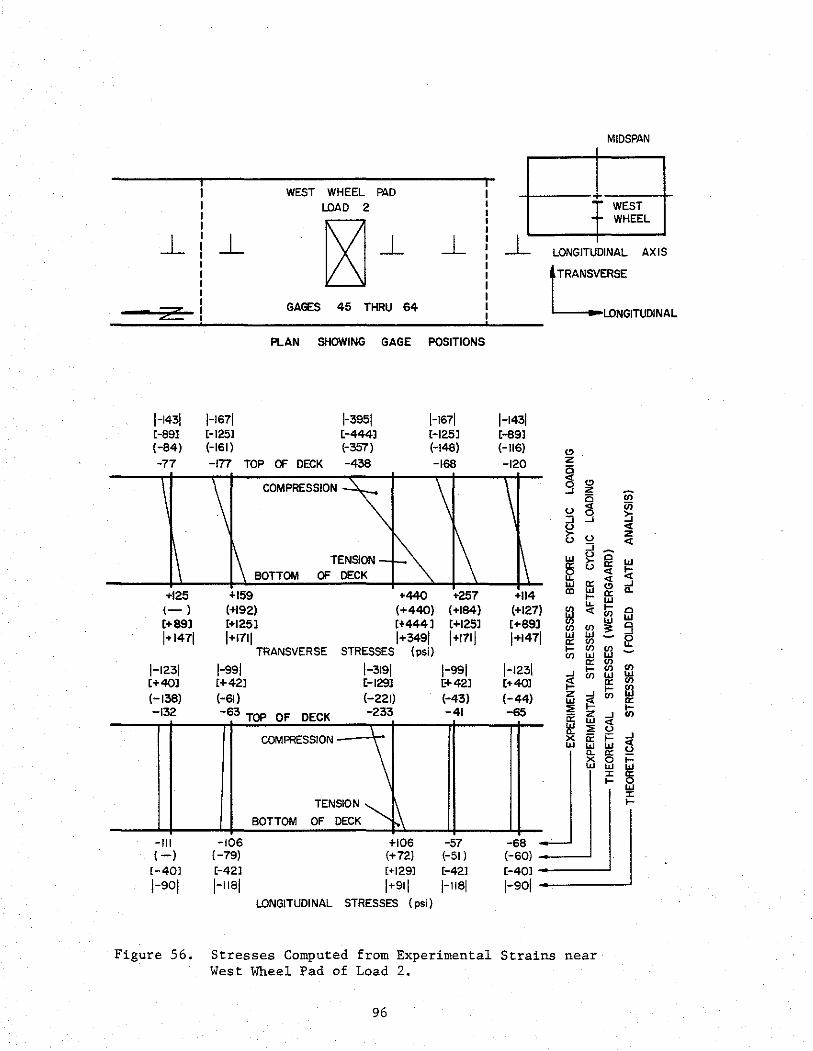
j_
z
l-1431 [-89! (-84)
-77
+125 (-) [+893 1+1471
l-1231 [+403 (-138) -132
-Ill ( -)
[-401
l-901
l-1671 [-1251 (-161)
WEST WHEEL PAD LOAD 2
~_L GAGES 45 THRU 64
PLAN SHOWING GAGE
-177 TOP OF DECK
l-3951 L-4443 {-357)
-438
COMPRESSION
TENSION BOTTOM OF DECK
+159 +440
j_
POSITIONS
l-1671 £-1253 (-148)
-168
+257 (+192) (+440) (+184) [+1253 [+4443 [+1253 I+17JI 1+3491 I mil
TRANSVERSE STRESSES (psi)
l-991 l-3191 l-991 [+423 H29J [+423 (-61) (-221) (-43) -63 TOP OF DECK -233 -41
COMPRESSION I
\ BOTTOM
TENSION'~ OF DECK l\
-106 +106 -57 (-79) (+72) (-51) [-421 [+1291 [-421 l-1181 I+9JI l-1181
l.ONGITUDI NAL STRESSES ( psi)
~
l-1431 [-891 (-116)
-120
+114 (+127) [+89] 1+1471
l-1231 [+401 (-44) -65
-68 (-60) L-401 l-901
MIDSPAN
+ WEST
·~ WHEEL
LONGITUDINAL AXIS
t:ERSE
LONGITUDINAL
"' z 0 "' "' g z ;;; 0 u g (ij
::; ...J ?:; ~ "' u z u ::; "' "' ~ @" "' ~ u
"' !::; <I
"' n: "' ...J
CD "' n: a. ,_ "' ~
"- ,_ "' 0
"' "' "' "' "' ;t 9 "' "' 12 n: "' ,_ en "' en "' "' n: "' "' ,_
"' ...J en "' "' ;:!: n: en ,_ ffl z ...J en "' ;:!: n: :::;; ,_ ;;:: z ...J "' "' "' II: :::;; u X ;;:: ;::: ...J
"' "' "' <I
a. n: !2 X 0 ,_ "' "' "' :z: @5 ,_
"' :z: ,_
Figure 56. Stresses Computed from Experimental Strains near West Wheel Pad of Load 2.
96

(MIDSPAN
EAST WrlEEL PAD -r--=- ,... LOAD 3
J I EAST
j_~ WHEEL
_j_ _L _L _j_ \._ LONGITUDINAL AXIS t TRANSVERSE
I
z GAGES 65 THRU 84 I ... LONGITuDINAL
l-2451 [-2081 (-325) -302
+292 (+234) [-t-2081 l+228j
l-1481 [t221 (-180) -129
\ II
+61. (-52) [+22 j-95J
PLAN SHOWING GAGE POSITIONS
l-335j l-3331 ~961 [-2941 [-2771 [-50] (-325) (-330) Hl6)
-278 TOP CF DECK -288 -69
COMPRESSION I
BOTTOM OF DECK
+379 (+306) [+294J J+319l
+295 (+277) [+277] J+319l
+90 (+60) [+501 1+961
TRAI~SVERSE STRESSES (psi)
j-251j [-20l (-143)
-II O TOP CF DECK
I COMPRESSION-
TENSION
BOTTOM OF r:£CK
+40 (-67) t+20J l+lol
j-243j 1-nol [-201 [+261 (-144) (-75) -106 -42
\ ' I I I I I
i I -29 -43
(-77) (- 9'3) [+20J [-26J j+26l l-541
LONGITUDINAL STRESSES (psi)
r781 [-371 (-83) -41
+68 (+40) [+37J Jt79J
j-IC4j [+13J (-€5) -27
,! ! j
i i
" z i5 "' <( z g i5 g '-' :::; §' <.J
:::; '-' §' w '-' c: 0 c: "-w w ID I-
"-<(
Figure 57. Stresses Computed from experimental Strair.s near East Wheel Pad of Load 3.
97
en c;; :::; <( z
0 <I
c: <( w <I !;;: "' c: I[ UJ ,__ (f) "' w z ~ g
0 ...

to be at the same point for purposes of these calculations, although
the midpoints of the strain gages were separated by approximately
2 in. as shown in Figure 19. The results of these calculations are
presented in Figures 55 through 57. Also shown there, for comparison,
are two sets of theoretical stresses. One set of theoretical values
was obtained from the folded plate analysis,.and the other set from
the slab bending moment equations developed in Section 3.1.
Transverse stresses were calculated from the second of Eqs. (9),
with an adjustment for the effect of continuity of the slab with the
beams. The magnitudes of the adjustments were taken to be 50 percent
of that obtained from Westergaard's solution for the effect of
fixity; this choice being based on the following recommendation by
Jensen:
It may toM of tR~
be observed from ••• that the correction due to continuity of the slab is 42 percent correction due to fixing the slab. Similarly
it may be observed that the correction due to continuity is 49 percent of the correction to M due to fixing the slab. It is apparent, therefo~¥, that the continuos slab is not in this instance, one having a definite "percentage of fixity", but may, nevertheless, be treated as "SO percent fixed" with a satisfactory degree of approximation. (13)
The concrete and steel areas were all transformed, on the basis of
their relative moduli of elasticity, to an equivalent area of
cast-in-place concrete. This transformation had negligible effect
on the location of the neutral axis, but did increase the moment of
inertia above that for the section without transformed areas.
The longitudinal stresses were computed using the first of
98

Eqs. (9). These computed stresses are due solely to local bending
of the slab and do not include those stresses resulting from bending
of the entire structure as a composite unit. More meaningful com
parison between measured and theoretical values can be obtained by
dividing longitudinal stresses into two components--one resulting
from local bending of the slab only. The distribution of stresses
into these two components was accomplished in the following manner.
The values of the component of bending stresses attributable to
bending of the composite structure, at the top and bottom surface of
the slab, were assumed to be proportional to the distances of these
two surfaces from the neutral surface of the composite ~nit (Fig. 58).
The components of stress resulting from local bending of the slab
were arbitrarily assigned equal values, of opposite sign, at the top
and bottom surface of the slab. This allowed a unique solution for
the distribution of the total stresses into the two components.
Stresses computed from strain measurements made both before and after
cyclic loading in each case were used for these computations. Values
of stress obtained in this manner are presented in Figures 59 through
61.
Futher comparisons between experimental stresses and those
predicted by theory as a function of longitudinal distance from the
wheel pad are made in Figures 62 and 63. Adjustments to Eqs. 9 and
12 for 50 percent edge fixity, as discribed above, were made in
arriving at the theoretical curves. Experimental data points for
these plots were taken from Figures 55 through 57 and 59 through 61.
99

,_. 0 0
BEAM
LOCAL M SLAB ONLY Oj u. - ..... ~ ,..;L,---
-~ - +
-
Yz. -
NEUTRAL AXIS FOR COMPOSITE BEAMS a S
M FOR COMPOSITE BEAM a SLAB
STRESSEI TO BEND!
TOTAL STRESSES COMPUTED FROM MEASURED STRAINS
AB
f0"2 I
I
"i•"j+0"3
o-b- o-;r-o-3
Oj•(YvYz)o-2
ATTRIBUTABLE NG OF COMPOSITE UNIT
-0"3
STRESSES ATTRIBUTABLE TO LOCAL BENDING OF
SLAB
Figure 58. Division of Longitudinal Slab Stresses into Components.

>--' 0 >--'
j_
t az
[+40]
I ~- ~~-~-~-~--~ ~--.
I I
I I I I I I
I
EAST WHEEL PAD I LOAD I I
I I
j_ [Jj_ j_! "---JJ
t I I I GAGES 25 THRU 44 I I
l PLAN SHOWING GAGE POSITIONS
I r
j_
- MIDSPAN
...-EAST WHEEL
1/ "!"
LONGITUDINAL AXIS
TRANSVERSE
L cooom"'"
UJ 0:
~ UJ m
0: UJ .... IL <t
(-117) (+12} HIO) [+421 (+16}
[-129) (-226) (-135} (-105}
[+42]" [+40] (+14} (-128} (+29} rn f3 cn
~ (/) LLJ -138 +26 -144 +36,TOP OF DECK -220 -139 -150 •44-1~ •82 <fJ <fJ <fJ
-51 -26 (-42} (+12}
[-40]
!'---TENSION
VCOMPRESSION
'BOTTOM OF DECK
-52 -36 (-40} (-16}
Hal
\ 1\
-8 +139 (-82} (+135}
[+12~
-5 -4 (-38} (-14}
[-42]
UJ UJ <fJ 0:: 0:: UJ-1- (!) 1- (!) 0:: 0 (I) ~ (I) !: t;; ~ ...Jo ...J c j:!g~g<i~ 2 z ow wuWoj::I~:J ~:J w(l) a:: (.) a:: 0 a:: ~ w>-W>-O;> o.u a.u wx X :r UJ UJ ....
<-4n <-29}~/ J I [-40]
-5 -82-
Figure 59. In-plane and Bending Stress Components Computed from Experimental Strains near East Wheel Pad of Load 1.

.... 0 N
_L
I -::2:
'
,--- -------- --- -----------··-----------------...,
j_ I I I I I I
I
-'' _,
WEST WHEEL PAD
LOAD 2
~ j_ IL-ll I
GAGES 45 THRU 64
j_
PLAN SHOWING GAGE POSITIONS
I ~-- L I -1 I (+4~
' I I I I I
:
_L
-
MIU:::it-'AN
.... rWEST
WHEEL
LONGITUDINAL AXIS
TRANSVERSE
CGITUDINAL
~ I[ w ID
a:: w .... IL <(
(/) (/)
(-) .( -)(-103) (+42) (-109) (-112) (-69) (+26) E-76) [+4Q] (+32) w w (/) (/) (/) w
-lfts
-65 -4 (-) ( -)
r4o]
4b -124 til ""-l vr- vr ut:.vr.
~TENSION
/COMPRESSION
~OTTOM OF DECK
-4 -61 (-37) (-42)
[-42)
-~~ -I'IU
\ \
-34 +140 (-40) (+112)
[+12!ij
-r~ -'1 -!:tH ~ t3 ~ U) tr 0:: r:a .... (/) (,!) 1- (!) Q:: -
2 (I)'Z 1- c ...~a ...JO tn ~ :0: <(0 <( c( ..J <( r- 1- 0 <t (!) z...lz..Jua:::
~2~~~~ O:dct:dtr~ W>- ~>- 03: ~uxu~w w ....
-26 -31 -35 -33 (-76) (-32) I I I
[-4o] (-25) (-26)
[-4~
Figure 60. In-plane and Bending Stress Camponents Computed from Experimental Strains near East Wheel Pad of Load 2.

~
0 w
I --- ----- I
I ... z
[+22] (-94) (-86) -50 -79
i I I I I I
I
_oA ~7Q
EAST WHEEL PAD
LOAD 3
[g) _l ~ I
GAGES 65 THRU 84
PLAN SHOWING GAGE POSITIONS
. ' f-2~ (-154)(+11) -52 -58, ,-1uP u~ uo:.o.;K
;--COMPRESSION
VTENSION
I I t20]
I
(-162) (+18) -99 -7
-OA .&.~i:,R LROTTOM OF -?? .7
(-123) -62
-?::-.
l..
I I I I I I I I I I I I I I I I
l
-1-
[+26]" [+19] (+48)(-101) (+36) + ~ -4~ ... ,s
-~0 -17 -IR-
LONGITUDINAL AXIS
TRANSVERSE
L LONGITUDINAL
w
~ w m
II: w f-11. <{
"' "' w w "' "' "' w "' "' "' w w "' II: II: w li; (!) li; (!) ~ 0
z z.--a: -l 0 -l i3 (/) <(
~ <( ;:! C3 <I. ~ zgz_.ga: w w 1- w 20:::!!0wt-ii: :J ii: :J ~ ffl wOwoW3= Q. ~ Q. 1:; :X: -l:i ~ 1-
(-34) (+86) (•56) (-II) DECK (+59) (-18) (-45) (-48) (-37) [-26)
;- I I I (-36) -·---- .
i:-2Zl [+2Ql i!-20] [-19] -·-----
Figure 61. In-plane and Bending Stress Cempenents Computed from Experimental Strains near East Wheel Pad of Load 3.
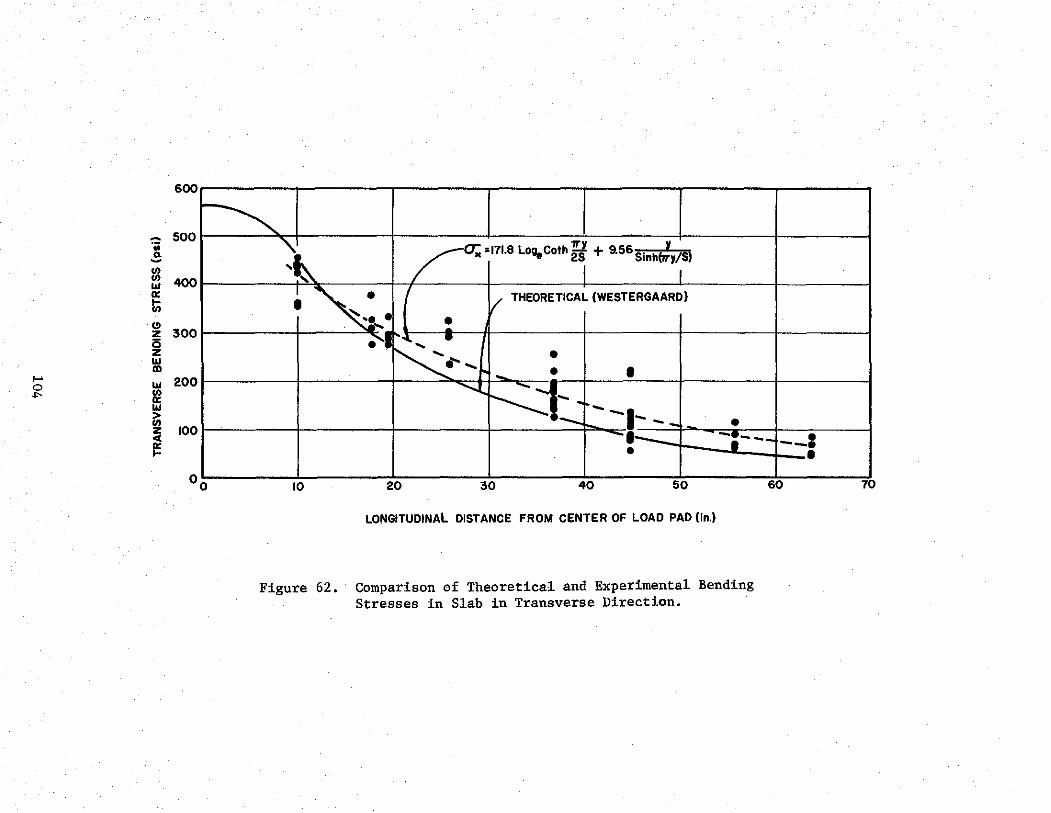
,.... 0 ..,_
600r---------r---------.---------.---------.---------.---------.-------~
~ :!1 6 y ~ 500 ~~ G;; •171.8 Log,Coth 25 + 9.5 Sinhbry/Sl .e
"' ::! 400 •
~ 1/ THEORETICAL (WESTERGAARD)
" l!: 300 •
~ • I I I I I : 200 ::::f_ .
~ -• --•- -~ • :l I ~ ·--- ·-;-- __ , ~ ~ . . 0 0 10 20 30 40 50 60 70
LONGITUDINAL DISTANCE FROM CENTER OF LOAD PAD (ln.)
Figure 62. Comparison of Theoretical and Experimental Bending Stresses in Slab in Transverse Direction.

42 r ,,..
;; a. -II) ) 15 II) Ill 0: Iii C!l 10 ) z c z Ill ID
) 5' ...J c( z
..... i5 0 :::> "' !::
I
C!l z g -50 )
• -10_0
\ Oji •1.9BLog8 Coth;t- 8.74 Sinl(17'y/S)
~/ 1-
I . I
~ ~ 1---THEORETICAL (WESTERGAARD)
• ,, ./ •• ~~ ........ • • • • _I I -- - ~----· . • • •
• 10 20 30 40 50
LONGITUDINAL DISTANCE FROM CENTER OF LOAD PAD(InJ
Figure 63. Comparison of Theoretical and Experimental Bending Stresses in Slab in Longitudinal Direction.
60
I
I i I
l
70
These stresses on both the top and bottom surface of the slab were
assigned the same sign as the bending moment at that point--com-
pression on the top surface being positive moment. Curves were fitted
to the experimental data by the method of least squares to facili-
tate comparisons between experimental and theoretical values. The
function chosen to fit the experimental values was based on the form
of the theoretical expressions for bending moments and was:
TIY 2s sinh ~
s
(32)
where cl and c2 were constants determined from the least squares fit.
Equation (32) is shown in dashed lines in Figures 62 and 63. The
maximum difference between the theoretical curve and the least square
fit to the data for transverse bending is about 45 psi and is less
than 15 psi for longitudinal bending.
Strain readings made before and after application of load 4,
a cyclic, alternating wheel load, are given in Table 10 and are
compared with theoretical values in Table 11. It is observed that
the average ratio of strain readings after cyclic loading to readings
before cyclic loading is 1.00 for data obtained with load on the
north ram and 0.97 with load on the south ram. Closer observations
of the individual gage readings do not indicate any consistent
trends in the data for load on the north ram, but do indicate a
possible trend in the data for load on the south ram. The after-to-
before ratios are consistently low for the top gages and high for
the bottom gages. However, the largest difference in strains is
106

..... 0 ....,
Gage
109
110
111
112
113
Before Cyclic Loading
-94
+74
-76
+62
-88
TABLE 10
EXPERIMENTAL STRAINS FOR LOAD 4
Values are in micro in. per in. NORTH -
20.8 kip Load on 20.8 kip Load on North Ram South Ram
After After Before After After 2,000,000 Cyclic 2,000,000 --
Cycles Before Loading Cycles Before
-97 1.03 -71 -60 0.84
+74 1.00 +56 +63 1.13
-70 0.92 -100 -78 0. 78
+63 1.02 +81 +92 1.14
-92 1.05 -99 -95 0.96
Avg. = 1.00 Avg. = 0.97

TABLE 11
EXPERIMENTAL AND TiffiORETICAL STRAINS FOR LOAD POSITION 4
Strain Gage
Identification
109
110
111
112
113
109
110
111
112
113
Experimental Strain
micro .in. per in.
Before Cyclic
Loading
After Cyclic
Loading
Wheel Load of 20.8 kips on North Ram
-94 -97
+74 +74
-76 -70
+62 +63
-88 -92
Wheel Load of 20.8 kips on South Ram
-71 -60
+56 +63
-100 -78
+81 +92
-99 -95
108
Theoretical Strain
from Folded Plate
Analysis
micro. in. per in.
-64
+67
-54
+56
-31
-53
+55
-63
+66
-30

only 22 micro in. per in.,. and this is not considered to be conclusive
evidence of distress. No distress was observed visually. Static
failure load test 5 was conducted at this same position, and the ul
timate load obtained in this test as compared to other failure tests
did not indicate that this area of the slab had been weakened.
Prior to application of load 3, minute cracks were discovered
above some transverse joints between panels. The widths of these
cracks were measured with a microscope and were found to be 0.002
in. and less. These cracks were not found upon inspection after·
conclusion of load 2. Some cracks were in the vicinity of a panel
joint near the north end of the bridge, far removed from the loads,
and it is believed that they were caused by shrinkage or thermal
strains, or both, and not due to load. A pattern of these cracks is
presented in Figure 64. A limited number of core samples taken after
completion of the testing program indicated that some of the cracks
extended as deep as 2 in. below the surface, lacking at least 1 1/2
in. of penetrating through the cast-in-place slab.
4.2 Repetitive Load Tests of Slab Segment Model
Table 12 lists the experimentally measured strains on the top
surface of the cast-in-place deck and the underside of the prestressed
panels. The strains were recorded under static loads and applied
before and after the application of an alternating wheel load on
either side of the panel joint. If all gages are included in a com
parison of strains before and after cyclic loading, ratios of 1.29
and 1.39 are obtained for loads on the north and the south ram
109

f-' f-' 0
r-~RACK ON UPPER SURFACE~ ,.....
T 'il/ .. \f_ I J7 ~¥ I ~ 11 I } }
I ~ __ L _____ I r J -~-----J - ' T r - a - 1 ----~
{ I I /1 I \1
J : : p .1 I I I I (I '\. ~
I ~- _l _____ I__ 1. L _L__ I ::1 I
.., I r r ' 'l. ~ I I rl' I I I 1 I \1
/ I J 1 I 'I' y f l\ 1 I I_ I I I~ I I I I 1 i 11 ! l i
1-
'\L_ PANEL BUTT JOINTS
Figure 64. Map of Cracking Pattern.

TABLE 12
EXPERIMENTAL STRAINS FOR LOAD 4A
Values are in micro in. per in.
20.8 kip Load on 20.8 kip Load on North Ram South Ram
Before After After Before After After Gage Cyclic 2,000,000 Before Cyclic 2,000,000 Before ..... Loading Cycles Loading Cycles ..... .....
115 -70 -69 .99 -52 -56 1.08
116 +56 +34 .60 +38 +42· 1.05
117 -53 -55 1.04 -75 -79 1.05
118 +40 +43 1.01 +64 +66 1.03
119 -18 -18 1.00 -16 -16 1.00
121 +36 +83 2.31 +38 +90 2.37
123 +42 +88 2.10 +40 +87 2.18
Avg. = 1. 29 Avg. = 1. 39

respectively. The significant discrepancies from 1.00 are attributable
to the two gages adjacent to the slab edges (gages 121 and 123, Fig.
25). If these two gages are removed from the data, the average
ratios of strain before cyclic loading to strain after loading drops
to .93 and 1.04. No specific cause could be found for the large
strain increases recorded by these two gages. The fact that the
strains after cycling were approximately twice the values measured
before cycling suggests a localized bond failure between prestressed
panels and cast-in-place deck. This possibility is questionable,
however, since the other strain gages, which were also in high stress
areas gave essentially constant readings.
Some transverse cracking in the cast-in-place portion of the deck
over the panel joint was observed prior to loading of the slab segment
model. They appeared approximately six weeks after the cast-in-place.
deck was poured, and were unquestionably the result of shrinkage
effects. The cracks were of the same general size and extent as those
which occurred in the bridge model (Fig. 64).
4.3 Static Load to Failure of Full-Scale Bridge Model
The static failure loads were applied in 10 kip increments, and
strain and deflection gage readings were made after each load incre
ment. Cracking in the concrete in each test was first detected on
the upper surface of the slab. These cracks occurred in the negative
moment regions, on either side of the load, above the inside faces
of the adjacent beams. The cracking load varied from 80 to 120 kips
112

for the four tests. Cracking was observed on the lower surface of
the slab, under the load pad, at a load 20 to 30 kips higher than
the load causing the first top surface crack. With additional
loading, the cracks on both surfaces grew until the load reached
220 to 240 kips. At this load, the rate of progression of the cracks
slowed considerably, almost ceasing to extend but opening wider with
additional load. The upper surface cracks generally extended parallel
to the beams, and eventually, began turning away from the beam into
the span of the slab being loaded. The lower surface cracks crossed
to form an "X" under the load and extended until they reached the
beams. A third crack, much shorter in length, passed through the
center of the "X" and extended parallel to the beams. Additional
load increments were applied until a punching shear type failure
occurred in each case. A typical pattern of the flexural cracking
is shown in Figure 65.
The untimate failure surface formed a truncated pyramid, typical
of a punching failure in a slab. In tests 5, 6, and 8 the surface
showed no apparent influence of the panel butt joint. However, in
tests 7 one segment of the surface intersected a panel joint and did
not develop in the adjacent panel. Vertical sections through failure
surfaces for tests 5 and 7 are given in Figures 66 and 67 respectively.
It is interesting to compare the effective width for this slab
with the extent of cracking in the longitudinal direction. The
computed effective width was 5 1/2 ft. as compared to the 6 to 7 ft.
longitudinal extent of the experimental upper surface cracking. The
113

FACE OF BEAM \ 4_BEAM
\ ~w, ]!!!3- ,,.... ~· ,.. ~~~ ~ f.-- ' ----0 •
-I
1-- PANEJ BUTT JOINT
'-L- GRID LINES
LOAD ,KIPS, LOAD u i--- WHEN CRACKING 6
J':-011 OBSERVED-
l =o I AASHO EFFECT:VE WIDTH I ' -~· .,..,
~~ ,~,:?'
1so .. 1,-~ ~ ~
7 - --~. , ... 130 Ito 110 "• ~~;:.-.;:-~, 0 -f--\ ~-~ ~ c-l r::.~c /do a•
> ... eao
L BEAM FACE OF BEAM \
TOP SURFACE
~ FACE OF BEAM
~ v
~ I I v ~
I--PANEL BUTT JOINT v I
11-011 ~
t----~v v
=o [__.)/ 6 "-.. "" I I/ - ~ v ......
~ ~ / ~
L FACE OF BEAM
Bottom Surface
Figure 65. Cracking Pattern Developed in Slab in Static Failure Load Test 6 and Typical of Those Obtained in Tests 5 and 8.
114'

.... .... en I
NORTH
~----------~,~--~r~-=v~-Li~ 3~~~~~~~--------~ CAST-IN-PLACE CONC. ';,,•:,'1_:,~," I I
._. _ _1. ,I ,.('Vl:' b-~ 12" }------~·~ :.''··· PANEL 'o!! /,:~; ';;( .~J'l''"
• LEVEL OF
PRESTRESSING STEEL
NORTH-SOUTH SECTION
WEST
•t--... ~ '_}\·~1-,. 32 ..__,. ' " ··'-~- '"'""" . """""~~)1w~ ... ;£:f>:f' '<..<::~ls~t:~ ~-
CAST-IN-PLACE CONC /(~:;.':~·<•:.&. .:::::130" -~ '. t ',,,.-"' ,~"(.•·""''
F!'A
-----'' • ""·.r.-.P.''"'' .. li:""''' NEL : -~:f'<~}'"-" · _y.--.; .. -~.1.!·:'&' :!:;.·
1911
2011
1911
EAST-WEST SECTION
Figure 66. Sections through Failure Surface for Load 5. (Similar failure surfaces were developed in tests 6 and 7.)
I

,_. ,_. "'
NORTH
~so zO!::::::,._ ~ .... ··:·<::,':<··,.:;;:> I ; -------~J·~·.~;;~~~··-~·:~.,·.,;~d"l"'jl ' ~·u~· '·
PANEL
4 WEST
1211
NORTH-SOUTH SECTION
LEVEL OF
PRESTRESSING STEEL
....--::130" 35° "t->.. ,r------------~ •. ~."~~~.~~~~.~~-.w~·~·~L7.,.~~~
2d' ,~~~-~~wrr.,•~.Y~~,h-~~·~~:~·~::;~:.•.~-%-.----------,7
EAST-WEST SECTION
Figure 67. Sections through Failure Surface for Load 7.

effective width of the slab at ultimate strength, then, was about
10 percent greater than the AASHO effective width for working load
analysis.
Plots of differential deflection of panels on opposite sides
of the panel butt joint adjacent to the load pad are given in Figure
68. The values reflect elastic deformations as well as abrupt de
formations resulting from cracking. A summary of the static failure
load test results is given in Table 13. Experimental and theoretical
values of failure load are compared in Figure 69. A yield line
analysis, using a two-fan failure mechanism, was made to determine
the theoretical load. This mechanism and its dimensions were selected
on the basis of the cracking pattern that was observed in the tests.
In this analysis, the slab was transformed into an equivalent ortropi
cally reinforced slab (14). The ultimate load. was computed to be
195 kips. Since the failure mode obtained experimentally was not a
flexural failure, it can only be said that the ultimate flexural
failure load for this slab was greater than the values attained when
the punching shear failure occurred. One would have expected the
predicted flexural failure load from the yield line analysis to be
greater than the 280 kips obtained experimentally, particularly since
the analysis r~sults in an upper bound solution. However, this is
seen not to be the situation. The first and most obvious factor that
could have caused the actual flexural strength of the slab to be
greater than that predicted by the yield line analysis is the enhance
ment of the strength of the slab by in-plane compressive stresses.
117

..... ..... "'
~ 0
.5 ;: (.) w !i ID w dl c <(
-' rn <( w - "' !z <(
w "' tr w tr t:: 0 i5 ...
12
I LO~D 7 (NO DEFLE6TION DATA)
p I l/ ~~~D·I 1'-o" j \CAST-IN-PLACE (;)-.
\PRECAST PANEL ·~ f////.A )8 f-- ·. ~\'.::t··:E-··Y:·;·:;.:·-~. ~?~i~itf~ 1'7: .. ·~:~·· ... ,..,.,.., ..... ,;.,? ~~·~I't•::!.t.;~;~:. 1/ }:J. i'•,,ll:'·:·:·.~?~ .... ·:>.~
01" r·0 f....s LOAD 5
I GAGE A- -GAGEB I " ''"1111/1 LLOADS
I -- -' I 'LOAD 6 I
I £ I ..... ~ --50 ·--100
-..,::•) ... _ 150 ---200
... _ .... 250
LOAD (kips)
Figure 68. Differential Deflection across Panel Butt Joint vs. Applied Load in Static Failure Load Tests.
300

TABLE 13
SU~~RY OF STATIC FAILURE LOAD TEST RESULTS
Load Date Cracking Failure Failure Position Tested Load Load Mechanism Remarks
(kips) (kips)
5 3-09~72 90 270 Punching shear Significant flexural
- distress had occurred. -0 6 2-17-72 110 280 Punching shear Significant flexural
distress had occurred.
7 4-06-72 120 250 Punching shear Truncated pyramid did not fully develop in adjacent panel.
8 3-23-72 80 260 Punching shear Significant flexural distress had occurred.

300
-fl. 200 .;g 0
C3 ..J
~ <1: :::;
s 100 ,_. ::J
"' 0
0
;-r-
r-;-
<!> I ;<;
;- ; "' - - - -<.>-o 1-<tw "'a: Ua:: ..J::J w <to "' a: r-t=g <1: ::J a:
"' CD .... Q) 0 X <1: l!; ..J w w 0 0 0 0 ~ :z:
C3 <1: C3 C3 ..J Cl)
3_ -r- w I .'-I-..J - ..J_ ..J W- w 1- -:z: z ~ :; ~ a: - - 0 z w D. <!> 0 ili w o; ..J a: w I CD w :;::: <3 0 N
<1: "' n EXPERIMENTAL THEORETICAL
Figure 69. Comparison of Experimental Failure Loads with Theoretical Values.

•
•
Such stresses existed in the longitudinal direction of the slab due
to bending of the entire structure as composite unit• Another source
of in-plane compressive stresses has been observed in lightly rein
forced slabs where the failure mechanism is confined to an interior
portion of the slab (15, 16). With application of a concentrated
load and partial development of the failure mechanism, in-plane
extension of the slab occurs in the area of the failure mechanism.
This extension is restrained by the surrounding portion of the slab
and compressive in-plane stresses are thereby created in the area of
the failure mechanism. This phenomenon, in a "rigidly" restrained
slab, was observed by Wood (14) to increase the flexural strength
of a lightly reinforced slab by 10.9 times. This same phenomenon
also enhances the punching shear capacity of a slab (16).
The AASHO Code relationship between .a wheel load and the maximum
slab bending moment for this structure is M = 0.18P. If this relation
ship is used along with the ultimate moment capacity of the section,
an ultimate wheel load can be calculated. This load is somewhat mean
ingless because the load-moment relationship is intended for an
elastic slab, and the relationship would be disrupted by yielding and
redistribution of stresses. Nonetheless, such a calculation results
in an ultimate load of 123 kips.
The shear strength of concrete slabs is a very complex subject,
and at present is handled with semi-empirical methods of analysis.
The primary difficulties are the lack of understanding of the behavior
121

of concrete under multi-axial states of stress and inability to deter-
mine the state of stress at any given point in a concrete slab. An
analysis of the slab studied.l here is further complicated by the use
of both prestressed and conv,entionally reinforced concrete. The '
American Concrete Institute (ACI) (17) Code provisions for slabs and
footings specify that the nominal shear stress for two-way action
(neglecting the capacity reduction factor) be computed.by v = V /bd, u u
and this shear stress is specified not to exceed 41fT . If the c
average value of compressive strength for the slab from Table 2 is
used, this method predicts the ultimate load, V , to be 140 kips if u
a panel butt joint is assumed, and 156 kips is no joint is assumed.
The experimental failure surface did not intersect the panel joint
in tests 5, 6 and 8, and the results of these tests should be compared
with the predicted value of 156 kips. It should be realized that the
ACI Code provision is a simplified design equation intended to provide
a lower bound on the ultimate load. An equation which more closely
approximates the lower bound of experimental data than does 4~ is c
(18):
v = 4(d/r + 1) If' u c
(33)
Where: d = the effective depth of the slab
r = side dimension of the loaded area
This equation results in an ultimate shear strength of 457 psi if the
average compressive strength for the slab is used. The resulting
ultimate punching shear loads are 186 kips and 210 kips for the con-
122

ditions of an assumed joint and no assumed joint respectively.
Experimental values, given in Table 13, exceed these theoretical
values by 25 to 35 percent. Experimental values given in the ACI
Committee Report (18) exceed the theoretical values by zero to 100
percent.
4.4 Static Load to Failure of Slab Segment Model
The static failure load was applied in 10 kip increments, with
data being recorded after each load increment. Negative moment .cracks
initially occurred on the upper surface of the deck above the vertical
faces of the beams nearest the loading pad. As loading progressed,
the cracking extended the full length of the slab in the longitudinal
direction of the beams. Upon further application of load, new cracks
began to branch from these and eventually formed a curcular pattern
around the loading pad. The circular crack pattern was disrupted on
the west side of the loading pad where it intersected the edge of the
structure. Two flexural tensile cracks initiated on the. bottom face
of the panel under the load pad and eventually extended the full width
of that panel. No cracking was detected in the adjacent panel. At
a load of 185 kips, it became necessary to release the load and place
a thicker bearing pad between the loading ram and the testing frame.
On reapplication of load, a punching shear failure occurred at 155
kips. The shear failure surface formed a truncated pyramid, similar
to those observed during the full-scale bridge model tests.
123
4.5 Assessment of Panel Butt Joint Performance
A comparison between measured strains and those predicted from
elastic analysis (Tables 7 through 11) are in rather poor agreement
for longitudinal strains in the vicinity of butt joints between
panels. This result was expected, since the folded plate analysis
used to predict strains did not include the effect of this discontin
uity in the slab. The discrepancy .is most apparent for those cases
where the load is in a position which causes a great deal of localized
bending in the slab adjacent to a joint (load positions 3 and 4).
For loading 4,.the longitudinal compressive strain on the top of the
deck, directly over the butt joint (Table 11, gage 113), were approx
imately three times greater than those predicted by elastic analysis.
At the joint, most likely only the cast-in-place portion of the deck
is effective in resisting longitudinal stress. At joints toward the
ends of the bridge, where in-plane compressive stresses due to the
overall bending of the bridge are relatively small, the localized
bending of the slab adjacent to wheel load should produce tensile
stresses in the underside of the cast-in-place slab that are approx
imately equal to the compressive stresses in the top of the deck.
In spite of this concentration of tensile stresses at the bottom of
the cast-in-place deck, no tendency toward premature cracking was
observed. Several core samples and the observed failure surfaces
after ultimate load (Figs. 66 and 67) showed no inherent weakness
in the joint.
During the simulated service load testing phase of this investi-
124
gation, cracks in the upper surface of the cast-in-place deck, directly
over butt joints between panels, were detected (Fig. 64). Since
these cracks were small (.002 in. or less in width), occurred in both
loaded and unloaded areas of the deck, and did not appear until
several months after construction of the bridge, they most likely
were formed through shrinkage and thermal effects. Cores taken after
ultimate load tests of the structure indicated that the average
depth of these cracks was approximately half the depth of the
cast-in-place slab. In only one of the four ultimate load tests
(load no. 7) was there any evidence that these cracks involved in
the final failure of the deck (Fig. 67).
Similar crack patterns in the top surface of the cast-in-place
deck were observed in an inspection of two existing bridges of the
same type of construction as the full-scale laboratory model
(Reference (3), Appendix A). Cores taken from those bridges indi
cated that the cracks also extended approximately half way through
the cast-in-place portion of the deck. Load tests on one of the
bridges indicated that transfer of wheel loads across the joints was
unaffected by the presence of these cracks.
The diaphrams used in these two bridges were positioned so that
they provided a transverse line of support for the deck. The shorter
end spans of each bridge contained one line of diaphrams, while the
longer interior spans contained two rows of diaphrams. With this
type of diaphram arrangement, negative longitudinal moments are
developed in the deck on both. sides of the diaphram as wheel loads
125

move along the bridge. The magnitude of these localized longitudinal
bending moments are fairly independent of the position of the wheel
along the span. The substantial positive longitudinal moment pro
duced in the deck by the overall bending of the ·bridge tends to cancel
the localized negative moment produced as the wheel approaches a
diaphram, when the load and diaphram are in the central portion of
the span, and the span is sufficiently long to produce large overall
positive bending moments. The net result is that the top surface
of the deck is subjected only to compressive stresses. For shorter
spans, and for regions adjacent to either end of longer spans, the
compressive stresses in the top of the deck produced by overall
bending of the bridge are not as large as the tensile stresses
produced by localized bending of the deck adjacent to diaphrams.
This results in longitudinal tensile stresses which can, under suffi
ciently high loads, cause transverse cracks to form in the top of
the deck. If these cracks have already been initiated by shrinkage
and thermal effects, as appears to be the case when prestressed panel,
cast-in-place deck construction is used, these tensile stresses will
cause the cracks to open and propagate under service load conditions.
This phenomenon can be observed in the nature and extent of the
crack patterns found on the two in-service bridges which were inspected.
The transverse cracks were more frequent and more severe along the
wheel paths of the more heavily traveled traffic lane. The frequency
of cracks was also higher for the shorter end spans, and toward
either end of the longer interior spans.
126

The full-scale bridge model tested in the laboratory had one
line of diaphrams at center-span, positioned so that they did not
support the deck. As a result, no longitudinal tensile strains in
the top of the cast-in-place deck were observed for any of the load
tests, not was there any tendency for the transverse shrinkage
cracks to grow and propagate under load.
4.6 Assessment of Shear, Bond and Load Transfer Performance
Mechanical shear connectors (Z-bars) and special surface treat
ment (grouting) were used in certain areas of the bridge deck (Fig.
13) to determine if they would enhance the bond between prestressed
panel and cast-in-place deck. Dowel bars (Fig. 13) and dowel bars
plus V-bars (Figs. 16 and 17) were located over some panel butt
joints to determine if they would assist in transferring wheel loads
across the joint.
The results of the load tests performed indicate that none of
these details provide any measurable improvement in the performance
of a bridge. Under the action of simulated service load conditions,
no consistent distinguishing trends in measured strains (Tables 7
through 11) could be found to indicate superior performance, in
terms of bond or load transfer, of one area of the deck over another.
The range in values of failure load was 30 kips, which is only 12
percent of the lowest failure load. Recalling that load positions
5 and 6 (highest failure loads) were in areas where no grout, Z-bars,
or dowels were employed leads to the conclusion that ultimate load
127

capacity of the deck was not enhanced by these special detials. The
loads at which cracking first occurred were not greatly different,
and the modes of failure were similar in all cases except load 7.
It is readily observed that the load at which cracking occurred
and the ultimate load far exceeded the design wheel load. The
lowest value of cracking load obtained experimentally was 3.8 times
the design wheel load plus impact, the lowest ultimate load obtained
experimentally was 12 times the design wheel load plus impact.
128

V. SUMMARY AND CONCLUSIONS
A full-scale bridge model and a slab segment model were evaluated
experimentally in the laboratory and theoretical studies of the bridge
model were made.- The structures were subjected to cyclic simulated
service loads and static failure loads.
The full-scale bridge model was designed in accordance with the
provisions for conventional concrete slab and prestressed beam bridges
of the AASHO Specifications. A rigorous elastic analysis of the bridge
model was performed, assuming that prestressed beams, prestressed
panels and cast-in-place deck behaved as a full composite unit. Strains
predicted by analysis were compared with measured strains at various
locations on the deck after application of static wheel loads. A
comparison between measured and predicted strains and between strains
measured before and after cyclic loading were examined to detect
indications of bond failure between prestress panel and cast-in-place
deck in the vicinity of the applied loads. Mechanical gages were also
installed on the underside of the bridge deck to detect any relative
motion between adjacent prestressed panels or between prestressed
panels and the beams which supported them. Such motion would be
possible only after bond failure between panels and cast-in-place
deck or between panels and beams. An inspection of the data obtained
from both types of instrumentation for both the full-scale bridge model
and the slab segment model revealed no indications of bond failure in
129

either structure as a result of cyclic loading.
Several special reinforcing details and a special prestressed
panel surface preparation were studied to determine if they would
provide an improvement in the performance of the bridge. The results
of the testing program indicate that such devices and preparations
do not enhance performance. Under service load conditions, no
distinction in performance between areas of the bridge deck with
special reinforcing or surface treatment and those areas without
them could be made. In static load to failure tests, the areas
of the deck which required the greatest load to initiate signifi
cant cracking were those without special treatment or rE)inforcing.
The failure load and mechanism for final failure of the deck appeared
to be independent of the area of the deck where they were applied.
Although no comparisons of the performance of the slab segment model
with an identical structure without dowel and V-bar reinforcing of
the butt-joint could be made, the test results gave no indication
of superior performance as a result of these special reinforcing
details.
A simplified prediction of the ultimate flexural strength of
the bridge deck was made using yield line theory. The load predicted
to cause flexural failure was considerably below all failure loads ob
tained from tests. In addition, the mode of failure observed in all
tests was not flexural, but punching shear. A prediction of load at
failure by the punching shear mode, based on the recommendations of
130

an ACI Committee Report (18) also gave very conservative results.
The following conclusions are drawn from the results of
the theoretical and experimental work reported herein.
1. The bond at the interface between the prestressed, precast
panels and the cast-in-place concrete performed well, with no indica
tion of distress under cyclic design loads and static failure loads.
2. No distinction in performance between those areas of the
deck with mechanical shear connectors (Z-bars) and grouting treat
ment, and those areas without could be made for 2 million cycles of
design load or for static load to failure tests.
3. Wheel loads were transferred and distributed across trans
verse panel butt joints in a satisfactory manner. Those joints
reinforced with dowel bars gave no indication of superior performance
under 2 million cycles of alternating service wheel loads or static
failure loads, when compared with those joints without special rein
forcing.
4. With this type of construction, some small transverse crack
ing in the cast-in-place deck over panel butt joints is to be expected
as a result of thermal and shrinkage effects. Such cracks have not
been found to be detrimental to the overall performance of a bridge.
Interior diaphrams should be positioned so that they do not provide
a transverse line of support for the deck. If the diaphrams do support
the slab, they produce negative longitudinal bending moments which tend
to expedite the growth and propagation of these transverse cracks.
131

S. The full scale bridge model was designed in accordance with
AASHO Specifications for conventional slab and prestressed beam con
struction. No special precautions were taken in the design to reflect
the presence of a prestressed panel-cast-in-place slab interface or
of the butt joint between panels. The only distinction between this
design and conventional design was the calculations to determine the
prestressed panel dimensions and reinforcing. The resulting bridge
performed satisfactorily for all load tests.

REFERENCES
1. Standard Specifications for Highway Bridges, Tenth Edition, American Association of State Highway Officials, Washington, D. C., 1969.
2. Jones, H. L. and Furr, H. L., "Study of In-Service Bridges Constructed with Prestressed Panel Sub-Deck," Research Report 145-1, Texas Transportation Institute, Texas A&M University, July 1970.
3. Jones, H. L. and Furr, H. L., "Development Length of Strands in Prestressed Panel Sub-Decks," Research Report 145-2, Texas Transportation Institute, Texas A&M Univeristy, December 1970.
4. Sinno, R. and Furr, H. L., "A Study of Reinforced Concrete Bridge Deck Deterioration: Repair," Research Report 130-1, Texas Transportation Institute, Texas A&M University, March 1969.
5. Nossier, S. B. and Murtha, R. N., "Ultimate Horizontal Shear Strength of Prestressed Split Beams," Technical Report R707, Naval Civil Engineering Laboratory, Port Hueneme, California, January 1971.
6. Standard Specifications for Road and Bridge Construction, Texas Highway Department, Austin, Texas, January 1962.
7. Erps, H. R. and Googins, A. L., "Distribution of Wheel Loads and Design of Reinforced Concrete Bridge Floor Slabs," Public Roads, Vol. 18, No. 8, October 1937.
8. Westergaard, H. M., "Computation of Stresses in Bridge Slabs Due to Wheel Loads," Public Roads, Vol. 11, No. 1, March 1930.
9. Kelley, E. F.'· "Effective Width of Concrete Bridge Slabs Supporting Concentrated Loads," Public Roads, Vol. 7, No. 1, March 1926.
10. Goldberg, J; E. and Leve, H. L., "Theory of Prismatic Folded Plate Structures," International Association for Bridge and Structural Engineering Publications, Vol. 16, 1957, pp. 59-86.
11. Timoshenko, S. and Woinowsky-Krieger, s., Theory of Plates and Shells, McGraw Hill Book Co., Inc., New York, 1959, pp. 135.
133

12. Gustafson, W. C. and Wright, R.N., "Analysis of Skewed Composite Girder Bridges," Journal of the Structural Division, ASCE, Vol. 94, No. ST4, April 1968, pp. 919.
13. Jensen, V. P., "Solutions for Certain Rectangular Slabs Continuous Over Flexible Supports," Bulletin No. 303, Engineer-ing Experiment Station, University of Illinois, Urbana, Illinois, June 1938.
14. Wood, R. H., "Plastic and Elastic Design of Slabs and Plates," Ronald Press So., New York, 1961.
15. Jacobson, Anunon, "Membrane-Flexural Failure Modes of Restrained Slabs," Journal of the Structural Division, ASCE, Vol. 93, No. ST5, October 1967.
16. Batchlor, B. De V. and Tong, P. Y., "An Investigation of the Ultimate Shear Strength of Two-way Continuous Bridge Slabs Subjected to Concentrated Loads," Report on Project Q-43, Department of Civil Engineering, Queen's University, Kingston, Ontario, September 1970.
17. Building Code Requirements for Reinforced Concrete, (ACI 318-71) American Concrete Institute, Detroit, Michigan 1971.
18. ACI-ASCE Committee 426 (326), "Shear and Diagonal Tension," ACI Journal. Vol. 59, No. 1-3, January-March 1962, pp. 1-30, 277-334, and 352-396.
134

APPENDIX A
135

A.l Expressions for Fixed-edge Forces in Equation (23)
The parameters P, a, S, n, ~. a, b, and hare defined in Figure
46. Additional parameters contained in the fixed-edge force
expressions are listed below.
n = Poisson's ratio for plate material
E = modulus of elasticity of plate material
Eh3 D = 12(1-nz)
A = (a secha + sinha )•1 lm m m m
Eh A = (a cscha - cosha )-1 2m m m m
T = (l+n) z ktm = a tanha
mnb m m a = 2a m k = a cotha
em m m 16P si mn~ sin
mna ~ =
n2asm a 2a a I S 'IT B = Alm ~mb ~ sin (n -)
m 2 n = 1,3, . . .
A 1 . nnn . nnS a =- s1n -- sl.n --n n b 2a A = -k B m tm m
s 1 mrn . mrS a =-cos b sJ.n ~ n n
a L A 'IT D = A 2m ~mb n ~ cos (n -)
m 2 n = 2,4, . . .
A
~n a n
=
D[(~/ + (nn/12
a b
B = -k D m em m
s
~ a n
=
D( (ID1f) 2 + (nn)2]2 a b
The fixed-edge forces are given by
Mfl.·J·m = D(m'1r) 2{ (1-n)A cosha . + (2cosha + (1-n)a .sinha ]B + (1-n) ' a m m m m mm
136

c sinha + [2sinha + (1-n)a cosha ]D - a L[(an)2 + n] • m m m m m '1n bm
n = 1, 3, . . .
OS cos(n~) - q Lf(an)2 + n]OA sin(~)}si~ 1nn 2 '1n mb 1nn 2 a
(A-1)
n = 2, 4, ...
MfJ·=· = D(m11)
2{- (1-n)A cosha - [2cosha + (1-n)a ,c5inha ]B + a m m m m mm
(1-n)Cmsinham + [2sinham + (1-n)amcosham]Dm + ~ Irc::) 2 + nl '
n =,1, 3,
OS cos(n:!!:.) -a ncan)2 + n]OA sin(n:!!:.)}sinm11x 1nn 2 '1n bm 1nn 2 a
n = 2, 4, • • •
Vf1.J.m = D(m11
) 3 { (n-1)A sinha + [ (l+n)sinham + (n-1)a cosha ] B + (n-1) • a m m m m -m
C cosha + [(1+n)cosha + (n-1)a sinha ]D + a~b L[(abn) 2 + 2-nl ' m m m m m m -rom. m
n = 1, 3, ..
nOS sin(n:!!:.) - q...,!!_ Lf(an) 2 + 2- n]nOA cos(~)}si~ 'mn 2 mnb mb 1nn 2 a
Vf .. = D(~)3{(n-1)A sinha + [(1+n)sinha + (n-1)a cosha ]B -(n-1) • Jl.ID a m m m m m m
c cosha - [(1+n)cosha + (n-1)a sinha ]D + a~b L[(abn) 2 + 2-nl m m m m m m 'illDl m
n = 1, 3, ..
nos sin(~) +a~ Ircan) 2 + 2 - n]nOAcos(~)}si~ 1nn 2 "tnmb mb 1nn 2 a
n = 2, 4, •••
137
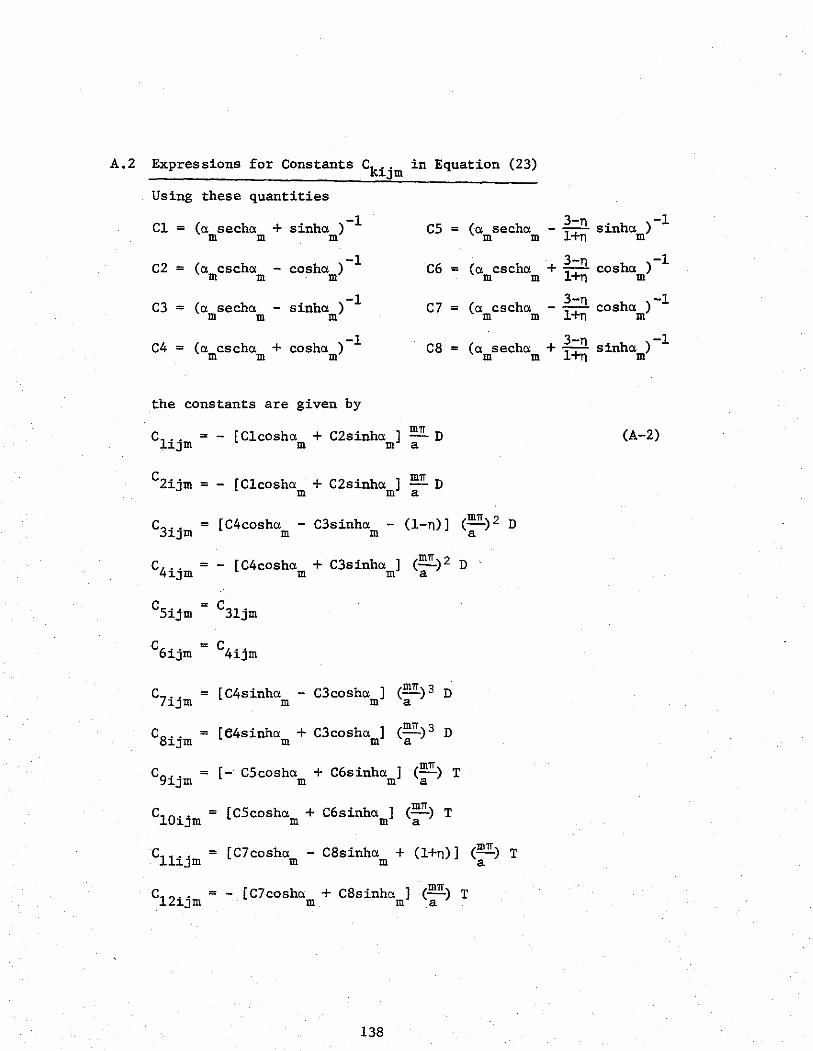
A.2 Expressions for Constants ckijm in Equation (23)
Using these quantities
C1 (a. secha. + -1 cs (a. secha. 3-n -1 = sinha. ) = - -- sinha. ) m m m m m 1+n m
C2 (a. cscha. - -1 (a. cscha. 3-n -1 = cosha. ) C6 = + 1+n cosha.m) m m . m m m
C3 (a. secha. - -1 C7 (a. cscha. 3-n -1 = sinha. ) = - -- cosha. ) m m m m m 1+n m
C4 (a. cscha. + -1 C8 3-n -1 = cosha. ) = (a. secha. + 1+n sinha. ) m m m m m m
the constants are given by
=- [ C1cosha. + C2sinha. ] !!!!!.. D m m a
(A-2)
c2ijm = - [C1cosha. + C2sinha. ] !!!!!..n m m a
c3ijm = [C4cosha. - C3sinha. - (1-n) l (m")2 D m m a
c4ijm = - [C4cosha. + C3sinha. ] (m")z D m m a
c7ijm = [C4sinha. - C3cosha. ] (m")3 D m m a
c8ijm = [e4sinha. + C3cosha. ] (m")3 D m m a
c9ijm = [- CScosha. + C6sinha. ] (m") T m m a
c10ijm = [CScosha. + C6sinha. m] (m") T m a
cllijm = [C7cosha. - C8sinha. + (1+n)] (m") T m m a
= - [C7cosha. + C8sinha. ] (m") T m m a
138

c14ijm = c12ijm
= [- C7sinhct + C8coshct ] (m11) T
m m a
= [C7sinhct + C8coshct ] (m11) T
m . m a
A.3 Expressions for Constants Bkim in Equation (26)
The constants are defined in terms of the parameters
d = distance from center of gravity of beam cross section to
top face of beam
h = thickness of two slabs which beam supports
E = modulus of elasticity of beam material
G = shear modulus of beam material
J = polar moment of inertia of cross section
Iz = moment of inertia about the Z-axis (see Fig. 47)
I = moment of inertia about the y-axis y
A = cross sectional area of beam
giving
Blim = (:11
)4 (d2 +db+ h2/4) EIZ + (:11
)2 GJ (A-5)
=- (:11
) 4 (d + h/2) EIZ
=- (m11
)'> [EI + EA(d2 + dh + h2/4)] a y
-39

BSim = (:rr) 4 EI2 (d + h/2)
B . = - (m11
) 4 EI 61m a Z
B . = EA (mrr) 3 (d + h/2 7~m a
m1T 2 B. =-EA(-) 81m a
140