Embed Size (px)
Citation preview

Evaluation of ACESwith HB 110 Proposal
Roger MarksLogsdon & Associates
House FinanceMarch 15, 2011
1

Overview
I. How ACES Operates / Problems it CreatesII. International CompetitivenessIII. Current Evidence of Problems from ACESIV. Proposal to Fix ACES
2

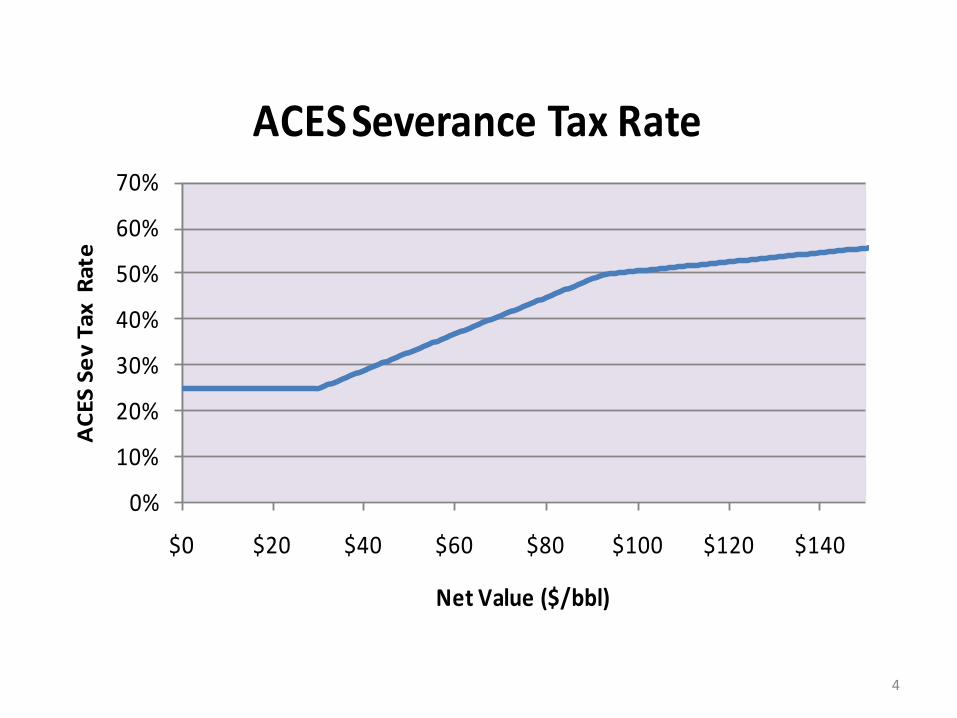
Tax Rate under ACES
• Base rate of 25% of net value (after deducting all costs)
• Progressivity element when net value per barrel exceeds $30/bbl:– (Net value per barrel value - $30) X .004
• If oil market price is $90/bbl:– Net value per barrel is $58/bbl– Progressivity = ($58 - $30) X .004 = 11.2%– Total tax rate = 25% + 11.2 = 36.2%– 36.2% X $58 X 0.875 (non-royalty) = $18.37/bbl– APPLIES TO ENTIRE NET VALUE
3
4
0%
10%
20%
30%
40%
50%
60%
70%
$0 $20 $40 $60 $80 $100 $120 $140
ACE
S Se
v Ta
x Ra
te
Net Value ($/bbl)
ACES Severance Tax Rate
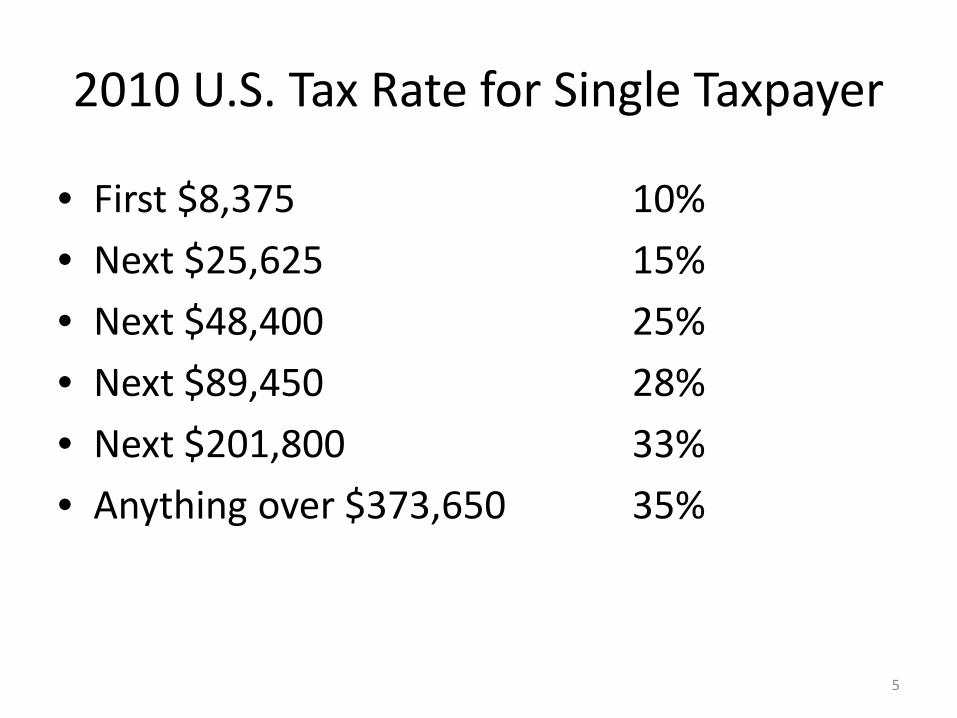
2010 U.S. Tax Rate for Single Taxpayer
• First $8,375 10%• Next $25,625 15%• Next $48,400 25%• Next $89,450 28%• Next $201,800 33%• Anything over $373,650 35%
5

20%25%30%35%40%45%50%55%60%
Tax
Rate
on
the
Firs
t D
olla
r of
Val
ue
Net Value per Barrel ($/bbl)
What Happens to the First Dollar of Value under ACES
6

7
0%
10%
20%
30%
40%
50%
60%
70%
80%
90%
100%
$50 $60 $70 $80 $90 $100 $110 $120 $130 $140 $150
Ma
rgin
al
Ta
x R
ate
ANS Market Price ($/bbl)
Marginal Tax Rate under ACES (All State & Federal Taxes & Royalties)How Much Gov't Gets When Price Goes Up $1

8
0%
5%
10%
15%
20%
25%
$40 $60 $80 $100 $120 $140 $160 $180 $200 $220 $240
Prob
abili
ty o
f Cer
tain
Pric
e
Oil Price ($/bbl)
Hypothetical Expected Price Outlook

International Competitiveness
9

10
0%
10%
20%
30%
40%
50%
60%
70%
80%
90%
U.S. GOM U.K. Alberta Thailand Australia Brazil Norway Alaska -ACES
Mar
gin
al T
ax R
ate
@ $
10
0/b
bl
International Marginal Tax Rates @ $100/bbl Market PriceTax & Royalty Regimes

11
Where $100/bbl ($25B) Went in 2008
Government$56/bbl($14B)
State: $11BSev tax: $7B
Feds: $3B
Costs$24/bbl($6B)
Producers$20/bbl($5B)

12
After-Tax Income that Would Have Been Earned in Alaska in 2008 With Rates from Other Tax & Royalty Regimes
($billions)
Gulf of Mexico $10.3U.K. $9.0Alberta $8.2Thailand $8.2Australia $6.9Brazil $6.6Alaska $5.0Norway $4.1

13
ConocoPhillips Financial Performance: Alaska vs. Rest of World ($millions)2008 ($100/bbl) vs. 2009 ($60/bbl)
Alaska Rest of World
Additional pre-tax income 2009 over 2008 $3,673 $14,707
Additional taxes 2009 over 2008* $2,898 $7,163
Additional after-tax income 2009 over 2008 $775 $7,544
Percentage of additional pre-tax income retained after-tax 21% 51%
* Alaska: 80% severance tax / 20% income tax; Rest of World: 10% severance tax / 90% income tax

14
OIL SEVERANCE TAX RATES BY STATE
State Rate (% of gross) : State Rate (% of gross) :
Iowa NONE : Illinois 5.00%New York NONE : Colorado 5.00%Pennsylvania NONE : West Virginia 5.00%Ohio 10 cents/bbl : Utah 5.00%California 0.10% : Mississippi 6.00%Indiana 1.00% : Wyoming 6.00%Nebraska 3.00% : Michigan 6.60%New Mexico 3.75% : Oklahoma 7.00%Alabama 4.00% : Florida 8.00%Kansas 4.30% : North Dakota 11.50%Kentucky 4.50% : Louisiana 12.50%South Dakota 4.50% : Montana 12.50%
Texas 4.60% : ALASKA @ $90 market (25 % of gross equivalent)Arkansas 5.00%

The State is Making Lots of Money Now:
What is the Problem?
15

16
2
2.2
2.4
2.6
2.8
3
3.2
3.4
2002 2003 2004 2006 2007 2009
Bill
ions
of b
arre
ls
Year of DNR Forecast
A History of DNR Forecasts of Total Production between 2010 and 2020
(billions of barrels)
PPT Passes
ACES Passes

17
450,000
500,000
550,000
600,000
650,000
700,000
750,000
800,000
850,000
900,000
2010 2011 2012 2013 2014 2015 2016 2017 2018 2019 2020
AN
S Pr
oduc
tion
For
ecas
t (b
bls/
day)
Dept of Natural Resources ANS Production ForecastBefore & After PPT (bbls/day)
May 2006 Forecast (last forecast before PPT) Current Forecast (November 2009)

18
0500
10001500200025003000350040004500
Core Fields w/Satellites*
Pt. Thomson Nikaitchuq NPRA Oooguruk
Mill
ions
of B
arre
lsOil Production Forecast 2010-2050
(Millions of Barrels)
Source: DNR Division of Oil & Gas 2009 Annual Report: p. 29
*Core fields are Prudhoe, Kuparuk, Alpine, Endicott, Milne Pt., Northstar

19
-100
0
100
200
300
400
500
600
700
800
900
Prod
ucti
on L
osse
s (m
illio
ns o
f ba
rrel
s)Total Forecasted Production Losses 2010-2020
between 2006 and 2009 Forecasts(millions of barrels)

Investment: The Big Picture
• Production requires capital investment• At the corporate level Alaska competes for
capital with other jurisdictions– Capital is finite– Capital is fluid– Capital will go to where it gets the best deal
20

Resource Potential
• 2007 Department of Energy report: 10 billion barrels of additional economically recoverable oil on the North Slope in current core producing area.*
• DNR’s current production forecast is for 5 billion barrels between now and 2050.
* Department of Energy, National Energy Technology Laboratory, “Alaska North Slope Oil & Gas: A Promising Future or an Area of Decline?,” August 2007, pp. 2 - 152-153.
21

22
02468
101214161820
2005 2006 2007 2008 2009 2010
Num
ber o
f Exp
lora
tory
Wel
ls D
rille
d
North Slope Exploratory Wells Drilled: 2005-2010

Context of Spending
• Core fields down*• Non-core fields up* (Nikaitchuq and Pt.
Thomson)– A small share of potential reserves
• No other new fields on the horizon• Gold-plating
* Department of Revenue “Oil and Gas Production Tax Status Report to the Legislature,” January 18, 2011, p. 8.
23

24
GOLD-PLATING Spending more because someone else is picking up the tab
Spend $1Before in Capital
ANS Market Price $90.00 $90.00 Less: Transportation Cost $6.00 $6.00 Capital Cost $13.00 $14.00 Operating Cost $13.00 $13.00 Net value $58.00 $57.00
Severance Tax Severance Tax Rate 36.20% 35.80% Credit $2.60 $2.80 Severance Tax $15.77 $15.06
Pre-income tax income $42.23 $41.94 Combined state/federal income tax (41%) $17.31 $17.20 After-income tax income $24.91 $24.75
Reduction in income $0.17
Bottom Line: Spent $1 but reduced income by only 17 cents The purchase only cost 17 cents after-tax The other 83 cents picked up by the state/feds in reduced taxes

25
0%10%20%30%40%50%60%70%80%90%
100%
$50 $60 $70 $80 $90 $100 $110 $120 $130 $140 $150Pct
. of
Cap
ex
Pai
d b
y P
rod
uce
rs A
fte
r-Ta
x
ANS Market Price ($/bbl)
Gold-Plating: Percentage of Capital Cost Paid by Producers After-Tax under ACES
(with 20% capital credit)

Implications of Gold-Plating
• Gold-plating is not efficient spending (spending to produce barrels)
• Gold-plating happens because of high marginal tax rates at high prices under ACES
• Gold-plating may explain a lot of spending without the commensurate increase in production
26

Fixing ACES
27

Fair Share:Economic Aspect
• Maximizing benefit to people– Long-term benefit– Linked to maximizing long-term production– Production maximized by continual investment
• In designing a tax need to be mindful of how Alaska stacks up internationally
• What is “fair” is what you can get in a competitive environment
28

29
$0
$10
$20
$30
$40
$50
$60
$50 $60 $70 $80 $90 $100 $110 $120 $130 $140 $150Pe
r B
arre
l Cre
dit
/Se
vera
nce
Tax
ANS U.S. West Coast Price ($/bbl)
Cash Flow Impact: Credits vs. ACES Severance Tax
per/bbl credits per/bbl sev tax

Proposal for Fix:Bracketed Tax Structure
• The problem is not progressivity – but the progressivity structure
• Changing the progressivity structure– HB 110:– Bracketed progressivity structure
• Values within structure
30

Proposed Bracket Structure: HB 110 (Existing Units)*
Based on Net Value p/bbl**
• $0/bbl - $30.00/bbl 25.0%• Next $12.50/bbl ($30.00 - $42.50/bbl) 27.5% • Next $12.50/bbl ($42.50 - $55.00/bbl) 32.5%• Next $12.50/bbl ($55.00 - $67.50/bbl) 37.5%• Next $12.50/bbl ($67.50 - $80.00/bbl) 42.5%• Next $12.50/bbl ($80.00 - $92.50/bbl) 47.5%• Anything over $92.50/bbl 50.0%
* For other fields outside existing units the tax rates are 10 percentage points less** These net values are approximately $30 less than market values (the ANS West Coast price).
31

32
0%
10%
20%
30%
40%
50%
60%
$0 $20 $40 $60 $80 $100 $120 $140
Seve
ranc
e Ta
x Ra
te
Net Value
Comparison of Effective Severance Tax Rates(Before Credits)
ACES HB 110 - Existing Units HB 110 - Other Fields

33
0%
10%
20%
30%
40%
50%
60%
70%
80%
90%
100%
$50 $60 $70 $80 $90 $100 $110 $120 $130 $140 $150
Mar
gina
l Tax
Rat
e
ANS Market Price ($/bbl)
Marginal Tax Rates(All state & federal taxes and royalties)
ACES HB 110 - Existing Units HB 110 - Other Fields

34
0%
10%
20%
30%
40%
50%
60%
70%
80%
90%
U.S. GOM U.K. Alberta Thailand Australia Brazil Alaska - HB 110 - Other
Fields
Alaska - HB 110 -
Existing Units
Norway Alaska -ACES
Mar
gina
l Ta
x Ra
te @
$10
0/bb
lInternational Marginal Tax Rates @ $100/bbl Market Price
Tax & Royalty Regimes

35
0%
10%
20%
30%
40%
50%
60%
70%
80%
90%
100%
$50 $60 $70 $80 $90 $100 $110 $120 $130 $140 $150
Pct.
of C
apex
Pai
d by
Pro
duce
rs A
fter
-Tax
ANS Market Price ($/bbl)
Gold-Plating: HB 110 (Existing Units) vs. ACES(Pct. of Capex Paid by Producers After-Tax)
HB 110 - 20% Credit HB 110 - 40% Credit ACES

Revenue Losses from Proposal?
• Initial revenue losses likely• DOR’s production forecast does not consider
availability of capital– Very plausible that status quo production forecast is
too high • Very plausible that with lower taxes there will be
greater investment and production – Very plausible that production forecast under HB 110
is too low• Cannot compare revenues between taxes using
the same number of barrels
36