Embed Size (px)
Citation preview

Landscape Architecture and Regional Planning 2020; 5(1): 12-20
http://www.sciencepublishinggroup.com/j/larp
doi: 10.11648/j.larp.20200501.12
ISSN: 2637-4358 (Print); ISSN: 2637-4374 (Online)
Evaluation of CBR Characteristics of Waste Dust from Construction Debris as Pavement Material
Md. Murad Hasan1, *
, Mehejabin Chowdhury Ankan2, Md. Ebrahim Shaik
3
1Western Bangladesh Bridge Improvement Project (WBBIP), Oriental Consultant Global (OCG) Limited, Jashore, Bangladesh 2Western Bangladesh Bridge Improvement Project (WBBIP), Jashore, Bangladesh 3Department of Civil Engineering, Northern University of Business & Technology, Khulna, Bangladesh
Email address:
*Corresponding author
To cite this article: Md. Murad Hasan, Mehejabin Chowdhury Ankan, Md. Ebrahim Shaik. Evaluation of CBR Characteristics of Waste Dust from Construction
Debris as Pavement Material. Landscape Architecture and Regional Planning. Vol. 5, No. 1, 2020, pp. 12-20.
doi: 10.11648/j.larp.20200501.12
Received: December 2, 2019; Accepted: December 17, 2019; Published: May 28, 2020
Abstract: In this study an attempt is made to investigate the properties and CBR characteristics of fine sand and waste dust
from construction debris. Attempts are also made to study the effect of soaking period on CBR value of waste dust from
construction debris. Waste dusts passing through 600 µm sieve from construction debris and river sand are selected for
investigation. Standard Test procedures specified by AASHTO are followed in this investigation. The testing includes the
determination of specific gravity, sieve analysis, optimum moisture content, dry density and CBR value. Dense unit weight,
specific gravity and fineness modulus of construction debris is 1273.44 Kg/m3, 2.43 and 1.36 respectively and for fine sand
1132.25 Kg/m3, 2.62 and 1.64 respectively. Un-soaked CBR value of construction debris and fine sand are 10.36% and 12.5%
respectively. Soaked CBR values of construction debris and fine sand are 5.36% and 6.07% respectively. The study reveals that
waste dust from construction debris is as good as fine sand for construction of sub-grade from the stand point of properties and
CBR characteristics.
Keywords: CBR, Construction Debris, Fine Sand, Socked, Un-soaked
1. Introduction
The recycled waste materials are usually generated from
Construction and Demolition (C&D) or mercantile and
industrial works. C&D materials are surplus or squander
components connected to the construction and destruction of
roads and buildings, such as concrete, brick, salvaged asphalt,
steel, wood, plastics as well as other construction materials
and goods. Concrete waste is a by-product which is generated
from demolition operation of concrete structure. Based on the
implementation in the field, these concrete pieces are
squashed into aggregates of differential dimensions.
Reclaimed asphalt pavement (RAP) is the label given to
asphalt at the time of dismantling of roadway, and these
recycled wastes (RAP) are thrown into trash without
applying any viable method for reuse [1].
The important research in the recycled construction waste
has been examined how the technical characteristics like
California Bearing Ratio (CBR), moisture content,
compaction efficiency affected the construction quality, when
recycled construction and demolition waste (CDW) are being
used in pavement construction [6].
Construction wastes are usually described as the debris
from demolished buildings and pavements. In recent time, a
worldwide concern has emerged regarding recycling and
reuse of construction elements, and statistics shown that
quantity of waste material is raised continuously [2].
Reuse of waste dust form construction relics has long been
established as a potential method to save natural resources
and abate the power used during its manufacture. The
substitution of traditional aggregates with recycled
aggregates, in whole or in part, has been and is being
examined in many trials. Recycled aggregates are being used
to replace local materials in various phases, such as pavement

Landscape Architecture and Regional Planning 2020; 5(1): 12-20 13
construction, marine foundations, building construction,
structural concrete or non-structural concrete [3].
The production of non-decaying waste materials in
association with a rising number of users has led to a global
hazardous waste crisis. Conversion of recycling waste into
commercial products by applying suitable process can be a
solution to overcome the recession. Hence, research on
creative use of waste elements is regularly proceeding. There
are lot of private companies, government organizations
relevant to pavement construction is trying to check the
possibility, affectivity and performance of recycled materials
in pavement construction. These practices are focusing to
meet the local demand for healthy disposal of waste material
and requirement of highway construction trades for cost-
effective construction [4].
Though Construction and Demolition (C&D) waste is one
of the vital reasons of environment pollution, the reuse of
such salvage materials can be cost effective and easily
available in ample quantity in pavement construction.
European countries like Netherland and Denmark has been
implementing reuse of recycled waste in pavement
construction, and the utilizing rate is above 94% [5]. Reuse
of waste dust from construction salvage is very common in
Netherlands, and sustainable improvement of road
construction activities is the primary objective to recycling of
the waste disposal [6].
Recently reuse of waste material in construction sector has
got worldwide preference [7]. The origination of
Construction and demolition waste (CDW) debris is raised
remarkably in recent years, and it affects on environment
adversely due to its improper management system. Recycling
of these debris materials becomes the great concern to
mitigate the nocuous effect on environment and objective of
sustainable prosperity [16].
There are few methods to enhance the engineering
behavior of material to make more effective for construction.
Application of waste dust from construction debris either in
mix with binder such as cement, lime etc. or without mixing
with any ingredients is one of them [8].
Research on recycling of construction waste material
ensure that reuse of these elements have high potentiality as
aggregate in pavement construction. The aggregate from
construction material is remarkable alternative material for
base and sub-base course in road construction due to its high
level of resistance and non-expansive property. Therefore, the
quality of these recycled materials varies and a bit tough to
control the quality, but few proper measures needed during
process and application to pursue desire outcome [10].
Recycled materials derived from construction debris can be
used as replacement of virgin aggregate in the pavement
layer construction of highway as unbound material [3].
2. Literature Review
Extensive research relevant to properties and act of recycled
materials is not available in the literature. The study on
mechanical properties of reused construction waste material is
quite easy and flexible process to justify the effectiveness in
road construction. Barbudo, et. al., conducted a research to
focus the possible co-relation between various ingredients of
recycled aggregates and their mechanical properties for
implementing in pavement construction. In this regard, they
studied on 31 types of various aggregate, where four types
were natural and another twenty seven types were generated
from different eleven treatment plants. Finally the sample were
taken into test (C. B. R.), Modified Proctor, Los Angeles
coefficient) to find out mechanical properties. Then the result
was justified with standard statistical tests ANOVA and linear
correlation analysis (both simple and multiple) [3]. On-site
recycling of construction debris as the pavement construction
material reduces the transportation expenses [12]. Arulrajah,
A., et. al., conducted another extensive laboratory analysis of
the geotechnical and geo-environmental characteristics, where
five construction waste materials were taken into count for
research. The Construction and Demolition (C&D) elements
checked were recycled concrete aggregate (RCA), crushed
brick (CB), waste rock (WR), reclaimed asphalt pavement
(RAP), and fine recycled glass (FRG). California bearing ratio
(CBR), water absorption, particle size distribution, particle
density, compaction, Los Angeles abrasion, flakiness index,
and hydraulic conductivity and post compaction sieve analysis
tests were included in the assessment of geotechnical. A
triaxial test was performed, which revealed the shear strength
characteristics of the sample. Drained cohesion value from 41
kPa to 46 kPa and drained friction angle ranging from 49° to
51° were found after performing consolidated drained triaxial
tests of reused materials [1]. There are few difficulties still
remain to recycle construction and demolition waste (CDW)
including shortage of confidence of stakeholders, doubtfulness
of environmental favor, distance between waste sites and
treatment plant of recycling etc., though recycling is the most
efficient way to control CDW [13].
The investigation was performed aiming recycling the
construction waste as the major ingredients in flexible
pavement construction. To check the quality of performance
of material, sample was undertaken in laboratory test [4].
Reusing of construction and demolition waste material is
vital technique to promote the sustainable improvement of
the globe. The process reduces the transit and production cost,
as well as requirement of the fresh construction material [14].
Gobieanandh, V., & Jayakody, S., examined a research on
waste from construction debris to analysis the feasibility as
recycled material in base or sub base road construction, as
well as explained the impact in pavement construction if
recycled construction and demolition (C&D) aggregate is
mixed with traditional aggregates [5]. Few strategies are
applied in Europe for recycling of C&D waste aggregate
intending to lessen execution of fresh aggregate in
construction activities and to alleviate the adverse
environmental effect on construction business [15].
An experiment was conducted to check the technical
durability of construction debris as material for pavement
layers construction of highway. In this regard, efficiency of
pavement composed concrete, ceramic waste aggregate and

14 Md. Murad Hasan et al.: Evaluation of CBR Characteristics of Waste Dust from Construction
Debris as Pavement Material
asphalt mix was checked through a field research [6].
Vegas, I., et. al., conducted an investigation to explain the
experimental process used and reveal the analysis for
implementing technical methods regarding utilizing of
recycling of construction waste in pavement construction.
The methodology of investigation was generated from
previous study relevant to the research [7]. Recycled
construction material usually two types, one generates from
crushed concrete named Recycled Concrete Aggregate (RCA)
and another one is from construction and demolition waste
(CDW). In Recent times lot of research have been done on
both type of aggregates. Recycling of waste material rescued
the environment from undesirable pollution; simultaneously
these wastage materials are recycled [17].
A research showed the affects of waste dust on, California
bearing ratio (CBR), unconfined compressive strength, liquid
limit, shear strength parameters, plastic limit, compaction
characteristics, plasticity index, and swelling pressure of an
extensive soil [8]. A study on the analysis of quality and
strength of the concrete that is produced from recycled waste
material from various sources. In this regard, rejected waste
material was collected from precast industries and concrete
fabricated in laboratory were utilized [9]. Application of
recycling construction debris instead of fresh virgin concrete
assists to alleviate the landfill pressures and promotes the
environment quality [18].
A research was conducted to analysis the possibility of
reuse of waste in pavement construction generated from
construction and demolition. Bearing capacity test and
repeated triaxial test were done in a laboratory, which
conducted by geotechnical characterization. The study
revealed that the composition and the compactive effect on
the physical characteristics of the recycled aggregate [10].
Recycled waste material is used in pavement construction
effectively. Fly ash, tire chips and wood chips are the most
significant waste item to be used as recycled material in road
construction [11].
3. Materials and Investigations
3.1. Materials
A sub grade soil is normally composed of sand, silt and
clay. The sands are generally divided into coarse, moderately
coarse and fine fraction according to the size of individual
particles. The following sections include the description of
sand, clay and sandy clay mix used in this study.
3.1.1. Fine Sand
The friction of soil lies between 1.60 mm and 0.075 mm
size is called fine sand. Dhopa-ghata river sand from
Jhenaidah, Bangladesh was used as the source of fine sand
(Figure 1). The physical appearance of that sand is shown in
Figure 2.
3.1.2. Construction Debris
Construction and demolition (C&D) debris is
nonhazardous, uncontaminated material resulting from
construction, remodeling, repair, or demolition of utilities,
structures, and roads. Construction debris was collected from
construction site of extension of Barda base camp (WBBIP
project), Jhenaidah, Bangladesh. Construction debris was
sieved by 600 µm sieve to separate the larger particles. The
physical appearance of construction debris and construction
debris after passing through 600 µm sieve is shown in Figure
3 and Figure 4 respectively.
Figure 1. Source of fine sand.
Figure 2. Physical appearance of fine sand.
Figure 3. Source of construction debris.
Figure 4. Construction debris after passing through 600 µm sieve.
3.2. Laboratory Tests for the Properties of Materials (Fine
Sand and Construction Debris)

Landscape Architecture and Regional Planning 2020; 5(1): 12-20 15
The test were performed to determine the compacted unit
weight, specific gravity, fineness modulus (FM), gradation,
optimum moisture content (OMC) and maximum dry density
according to the procedure specified by ASTM standard. The
results are summarized in Table 1, Grain size analysis data of
fine sand is given in Table 2, and the curve is shown in Figure 5.
Table 1. Properties of fine sand and construction debris.
Sample Dense unit weight
(Kg/m3) Specific gravity
Fineness modulus
(FM)
Optimum moisture content
(%)
Maximum dry
density (gm/cc)
Fine sand 1132.25 2.62474 1.64 16.5 1.50
Construction debris 1273.44 2.43268 1.36 13.5 1.01
Table 2. Grain-size analysis of construction debris and fine sand.
Sieve size, mm % Passing
Construction debris Fine sand
4.75 100 100
2.36 100 100
1.70 100 100
1.18 100 100
0.60 99.6 98.4
0.30 87.6 78.8
0.212 58 39.3
0.150 18.4 19.62
0.075 0.8 1.22
Figure 5. Grain size distribution curves of fine sand and construction debris.
3.3. Testing Set-up Apparatus
In this study, compaction testing and CBR testing setup
were used. In the testing setup Compaction
Mould and Rammer, Balance and Steel Straight Edge,
CBR Test Apparatus were included. The following Figure 6,
Figure 7, Figure 8 respectively are shown the equipments.
Figure 6. Compaction mould and rammer.
Figure 7. Balance, straight edge and measuring cylinder.
Figure 8. CBR testing apparatus.
3.4. Experimental Program
In the study, fine sand and construction debris were used to
investigate the CBR characteristics of sub grade at different
soaking period. The following programs were fixed up for
the investigation program.
3.4.1. Testing Procedure
The mould with the specimen was clamped over the base
plate and same surcharge weights of 2.5 kg were placed on
the specimen centrally such that the penetration test could be
conducted. The mould with base plate was placed under the
penetration plunger (5 cm diameter) of the loading machine
(Figure 8). The penetration plunger was placed at the center
of the specimen and was brought in contact with the top
surface of the sample by applying a seating load of 4.0 kg.
The dial gauge for measuring the penetration value of the
plunger was fitted in position. The dial gauge of the proving
ring and the penetration dial gauge were set to zero. The load
was applied through the penetration plunger at a uniform rate
of 1.25 kg/min. The load readings were recorded at
penetration readings of 0.0, 0.5, 1.0, 1.5, 2.0, 2.5, 3.0, 4.0, 5.0,
7.5, 10.0 and 12.5 mm. In case the load readings starts
16 Md. Murad Hasan et al.: Evaluation of CBR Characteristics of Waste Dust from Construction
Debris as Pavement Material
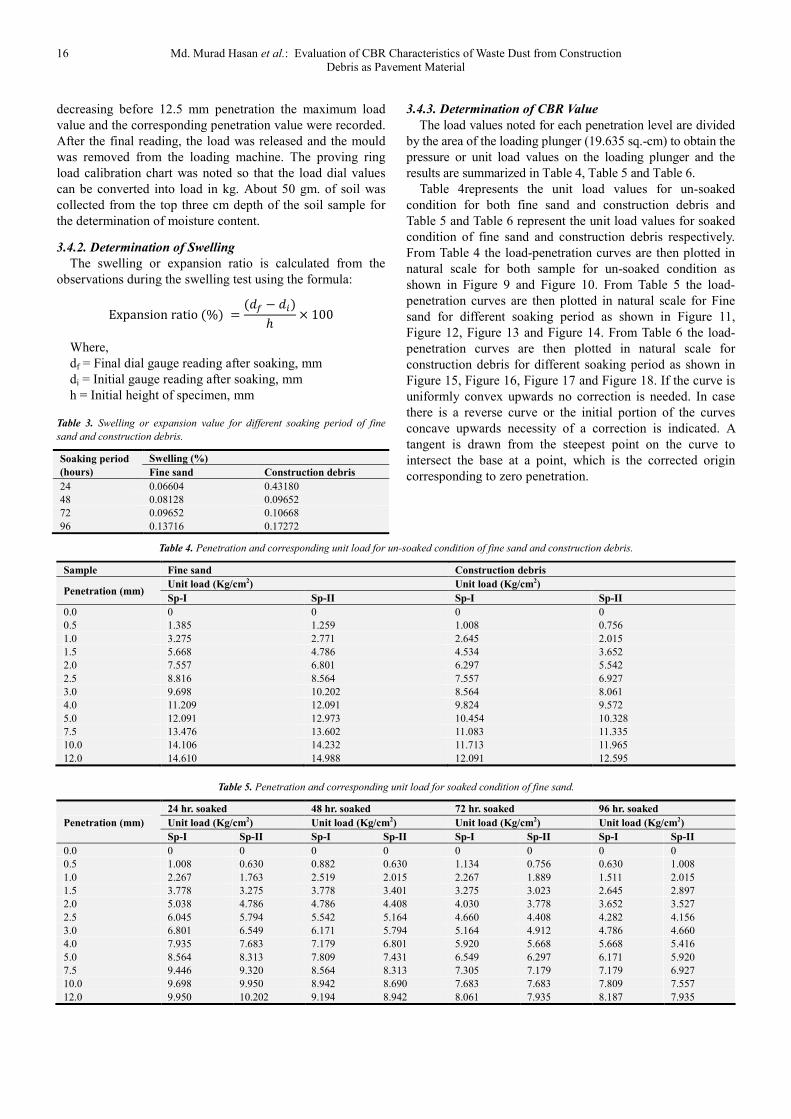
decreasing before 12.5 mm penetration the maximum load
value and the corresponding penetration value were recorded.
After the final reading, the load was released and the mould
was removed from the loading machine. The proving ring
load calibration chart was noted so that the load dial values
can be converted into load in kg. About 50 gm. of soil was
collected from the top three cm depth of the soil sample for
the determination of moisture content.
3.4.2. Determination of Swelling
The swelling or expansion ratio is calculated from the
observations during the swelling test using the formula:
Expansionratio(%) =(�� − ��)
ℎ× 100
Where,
df = Final dial gauge reading after soaking, mm
di = Initial gauge reading after soaking, mm
h = Initial height of specimen, mm
Table 3. Swelling or expansion value for different soaking period of fine
sand and construction debris.
Soaking period
(hours)
Swelling (%)
Fine sand Construction debris
24 0.06604 0.43180
48 0.08128 0.09652
72 0.09652 0.10668
96 0.13716 0.17272
3.4.3. Determination of CBR Value
The load values noted for each penetration level are divided
by the area of the loading plunger (19.635 sq.-cm) to obtain the
pressure or unit load values on the loading plunger and the
results are summarized in Table 4, Table 5 and Table 6.
Table 4represents the unit load values for un-soaked
condition for both fine sand and construction debris and
Table 5 and Table 6 represent the unit load values for soaked
condition of fine sand and construction debris respectively.
From Table 4 the load-penetration curves are then plotted in
natural scale for both sample for un-soaked condition as
shown in Figure 9 and Figure 10. From Table 5 the load-
penetration curves are then plotted in natural scale for Fine
sand for different soaking period as shown in Figure 11,
Figure 12, Figure 13 and Figure 14. From Table 6 the load-
penetration curves are then plotted in natural scale for
construction debris for different soaking period as shown in
Figure 15, Figure 16, Figure 17 and Figure 18. If the curve is
uniformly convex upwards no correction is needed. In case
there is a reverse curve or the initial portion of the curves
concave upwards necessity of a correction is indicated. A
tangent is drawn from the steepest point on the curve to
intersect the base at a point, which is the corrected origin
corresponding to zero penetration.
Table 4. Penetration and corresponding unit load for un-soaked condition of fine sand and construction debris.
Sample Fine sand Construction debris
Penetration (mm) Unit load (Kg/cm2) Unit load (Kg/cm2)
Sp-I Sp-II Sp-I Sp-II
0.0 0 0 0 0
0.5 1.385 1.259 1.008 0.756
1.0 3.275 2.771 2.645 2.015
1.5 5.668 4.786 4.534 3.652
2.0 7.557 6.801 6.297 5.542
2.5 8.816 8.564 7.557 6.927
3.0 9.698 10.202 8.564 8.061
4.0 11.209 12.091 9.824 9.572
5.0 12.091 12.973 10.454 10.328
7.5 13.476 13.602 11.083 11.335
10.0 14.106 14.232 11.713 11.965
12.0 14.610 14.988 12.091 12.595
Table 5. Penetration and corresponding unit load for soaked condition of fine sand.
Penetration (mm)
24 hr. soaked 48 hr. soaked 72 hr. soaked 96 hr. soaked
Unit load (Kg/cm2) Unit load (Kg/cm2) Unit load (Kg/cm2) Unit load (Kg/cm2)
Sp-I Sp-II Sp-I Sp-II Sp-I Sp-II Sp-I Sp-II
0.0 0 0 0 0 0 0 0 0
0.5 1.008 0.630 0.882 0.630 1.134 0.756 0.630 1.008
1.0 2.267 1.763 2.519 2.015 2.267 1.889 1.511 2.015
1.5 3.778 3.275 3.778 3.401 3.275 3.023 2.645 2.897
2.0 5.038 4.786 4.786 4.408 4.030 3.778 3.652 3.527
2.5 6.045 5.794 5.542 5.164 4.660 4.408 4.282 4.156
3.0 6.801 6.549 6.171 5.794 5.164 4.912 4.786 4.660
4.0 7.935 7.683 7.179 6.801 5.920 5.668 5.668 5.416
5.0 8.564 8.313 7.809 7.431 6.549 6.297 6.171 5.920
7.5 9.446 9.320 8.564 8.313 7.305 7.179 7.179 6.927
10.0 9.698 9.950 8.942 8.690 7.683 7.683 7.809 7.557
12.0 9.950 10.202 9.194 8.942 8.061 7.935 8.187 7.935

Landscape Architecture and Regional Planning 2020; 5(1): 12-20 17
Table 6. Penetration and corresponding unit load for soaked condition of construction debris.
Penetration (mm)
24 hr. soaked 48 hr. soaked 72 hr. soaked 96 hr. soaked
Unit load (Kg/cm2) Unit load (Kg/cm2) Unit load (Kg/cm2) Unit load (Kg/cm2)
Sp-I Sp-II Sp-I Sp-II Sp-I Sp-II Sp-I Sp-II
0.0 0 0 0 0 0 0 0 0
0.5 1.134 0.882 0.630 0.882 0.630 0.504 0.378 0.504
1.0 2.645 2.267 1.511 2.015 1.637 1.385 1.134 1.511
1.5 3.778 3.652 2.393 3.023 2.645 2.519 2.015 2.645
2.0 4.408 4.534 3.275 3.904 3.275 3.527 2.897 3.527
2.5 5.038 5.164 4.156 4.534 3.904 4.156 3.652 4.156
3.0 5.542 5.794 4.912 5.038 4.408 4.660 4.156 4.660
4.0 6.423 6.675 6.045 5.794 5.416 5.290 5.038 5.290
5.0 7.053 7.305 6.549 6.297 6.045 5.794 5.668 5.668
7.5 8.313 8.187 7.305 7.053 6.927 6.675 6.549 6.297
10.0 9.068 8.816 7.935 7.557 7.557 7.305 7.053 6.801
12.0 9.698 9.446 8.313 7.935 8.187 7.683 7.683 7.305
Figure 9. Unit load-penetration curve for fine sand (un-soaked).
Figure 10. Unit load-penetration curve for construction debris (un-soaked).
Figure 11. Unit load-penetration curve for fine sand (24 hr. soaked).
Figure 12. Unit load-penetration curve for fine sand (48 hr. soaked).
Figure 13. Unit load-penetration curve for fine sand (72 hr. soaked).
Figure 14. Unit load-penetration curve for fine sand (96 hr. soaked).

18 Md. Murad Hasan et al.: Evaluation of CBR Characteristics of Waste Dust from Construction
Debris as Pavement Material
Figure 15. Unit load-penetration curve for construction debris (24 hr.
soaked).
Figure 16. Unit load-penetration curve for construction debris (48 hr.
soaked).
Figure 17. Unit load-penetration curve for construction debris (72 hr.
soaked).
Figure 18. Unit load-penetration curve for construction debris (96 hr.
soaked).
The unit load values corresponding to 2.50 mm and 5.0
mm penetration values are found from graphs and recorded
in Table 7 and Table 8 for fine sand and construction debris
respectively.
The CBR value is calculated from this formula:
CBR(%� ������� !" ##�$!%&'���' ()�$ �!$���$!)$�$�# �����$*$�
������ !" ##�$!%&'� �! #!"#+',$!'���$ � %�*$)$�$�# �����$*$�� 100
The unit load values on standard crushed stones are 70
kg/cm2 and 105 kg/cm
2 for 2.5mm and 5.0 mm penetration
respectively. The CBR values at 2.5 mm and 5.0 mm
penetration are calculated for each sample from
corresponding graphs and recorded in Table 9 to Table 10.
Generally the CBR value at 2.5 mm penetration is higher and
this value is adopted. However if higher value is obtained at
5.0 mm penetration, the test is to be repeated to verify the
results; if the value at 5.0 mm penetration is again higher, this
is adopted as the CBR value of the sample. % CBR values
for different soaking period of fine sand and construction
debris are summarized in Table 11.
Table 7. Unit load values corresponding to 2.5 mm and 5.0 mm penetration for different soaking period for fine sand.
Penetration
(mm) Specimen
Un-soak 24 hr. Soaking 48 hr. Soaking 72hr. Soaking 96 hr. Soaking
Unit load
(Kg/cm2) % CBR
Unit load
(Kg/cm2) % CBR
Unit load
(Kg/cm2) % CBR
Unit load
(Kg/cm2) % CBR
Unit load
(Kg/cm2) % CBR
2.5 Sp-I 9 12.86 6.5 9.29 5 7.14 4.25 6.07 4.5 6.43
Sp-II 8.5 12.14 6 8.57 5.5 7.86 5 7.14 4 5.71
5.0 Sp-I 12 11.43 8.5 8.10 8 7.62 6.5 6.19 6 5.71
Sp-II 12.5 11.90 8 7.62 7.5 7.14 6.5 6.19 6.5 6.19
Table 8. Unit load values corresponding to 2.5 mm and 5.0 mm penetration for different soaking period for construction debris.
Penetration
(mm) Specimen
Un-soak 24 hr. Soaking 48 hr. Soaking 72hr. Soaking 96 hr. Soaking
Unit load
(Kg/cm2) % CBR
Unit load
(Kg/cm2)
%
CBR
Unit load
(Kg/cm2)
%
CBR
Unit load
(Kg/cm2)
%
CBR
Unit load
(Kg/cm2)
%
CBR
2.5 Sp-I 7.5 10.71 5 7.14 4.5 6.43 4 5.71 3.5 5.00
Sp-II 7 10.00 5.5 7.86 4 5.71 4 5.71 4 5.71
5.0 Sp-I 10.5 10.00 7 6.67 6.5 6.19 5.5 5.24 5 4.76

Landscape Architecture and Regional Planning 2020; 5(1): 12-20 19
Penetration
(mm) Specimen
Un-soak 24 hr. Soaking 48 hr. Soaking 72hr. Soaking 96 hr. Soaking
Unit load
(Kg/cm2) % CBR
Unit load
(Kg/cm2)
%
CBR
Unit load
(Kg/cm2)
%
CBR
Unit load
(Kg/cm2)
%
CBR
Unit load
(Kg/cm2)
%
CBR
Sp-II 10.5 10.00 7.5 7.14 6.5 6.19 6.25 5.95 5.5 5.24
Table 9. CBR value for different soaking period of fine sand.
Penetration (mm) Specimen
CBR (%)
Soaking period
0 hr. 24 hr. 48 hr. 72 hr. 96 hr.
2.5
Sp-I 12.86 9.29 7.14 6.07 6.43
Sp-II 12.14 8.57 7.86 7.14 5.71
Average 12.50 8.93 7.50 6.61 6.07
5.0
Sp-I 11.43 8.10 7.62 6.19 5.71
Sp-II 11.90 7.62 7.14 6.19 6.19
Average 11.67 7.86 7.38 6.19 5.95
Table 10. CBR value for different soaking period of construction debris.
Penetration (mm) Specimen
CBR (%)
Soaking period
0 hr. 24 hr. 48 hr. 72 hr. 96 hr.
2.5
Sp-I 10.71 7.14 6.43 5.71 5.00
Sp-II 10.00 7.86 5.71 5.71 5.71
Average 10.36 7.50 6.19 5.71 5.36
5.0
Sp-I 10.00 6.67 6.19 5.24 4.76
Sp-II 10.00 7.14 6.19 5.95 5.24
Average 10 6.90 6.19 5.24 5.00
Table 11. % CBR value for different soaking period of fine sand and construction debris.
Sample % CBR
0 hr. soaked 24 hr. soaked 48 hr. soaked 72 hr. soaked 96 hr. soaked
Fine sand 12.50 8.93 7.50 6.61 6.07
Construction debris 10.36 7.50 6.19 5.71 5.36
4. Results and Discussions
4.1. General
In this chapter, the experimental test results are presented.
The properties of selected materials and behavior of
construction debris on CBR value are discussed. The effects
of soaking period on the CBR value of construction debris
are also presented.
4.2. Properties of Selected Materials
The dense unit weight, specific gravity and fineness
modulus of selected materials are presented in Table 12.
4.3. CBR Characteristics of Construction Debris
The CBR values of Fine sand and Construction Debris for
un-soaked condition are given in Table 13.
4.4. Effect of Soaking Period on the CBR Value
The relationship between CBR and soaking period for
selected samples are shown in Figure 19.
Table 12. Compacted unit weight, specific gravity and fineness modulus of
fine sand and construction debris.
Sample Dense unit
weight (Kg/m3)
Specific
gravity
Fineness
modulus
Fine sand 1132.25 2.62474 1.64
Construction debris 1273.44 2.43268 1.36
Table 13. CBR values of fine sand and construction debris for un-soaked
condition.
Types of materials % CBR Limiting value*
Fine sand 12.50 5
Construction debris 10.36 5
Figure 19. Relationship between CBR value and soaking period.

20 Md. Murad Hasan et al.: Evaluation of CBR Characteristics of Waste Dust from Construction
Debris as Pavement Material
5. Conclusions
On the basis of experimental results of this study, it can be
recapitulated that waste dust passing through 600 µm sieve
from construction debris is suitable as sub-grade soil from
the consideration of physical properties. Un-soaked and
soaked CBR value of construction debris are 10.36% and
5.36% which are very close to the respective value 12.50%
and 6.07% of fine sand. CBR value decreases with the
increase of soaking period. This variation for construction
debris is similar for fine sand.
References
[1] Arulrajah, A., Piratheepan, J., Disfani, M. M., & Bo, M. W. (2012). Geotechnical and geo-environmental properties of recycled construction and demolition materials in pavement sub-base applications. Journal of Materials in Civil Engineering, 25 (8), 1077-1088.
[2] Arulrajah, A., Disfani, M. M., Horpibulsuk, S., Suksiripattanapong, C., &Prongmanee, N. (2014). Physical properties and shear strength responses of recycled construction and demolition materials in unbound pavement base/subbase applications. Construction and Building Materials, 58, 245-257.
[3] Barbudo, A., Agrela, F., Ayuso, J., Jiménez, J. R., & Poon, C. S. (2012). Statistical analysis of recycled aggregates derived from different sources for sub-base applications. Construction and Building Materials, 28 (1), 129-138.
[4] deRezende, L. R., & de Carvalho, J. C. (2003). The use of quarry waste in pavement construction. Resources, conservation and recycling, 39 (1), 91-105.
[5] Gobieanandh, V., & Jayakody, S. (2016). Evaluate the strength of cement treated recycled construction and demolition aggregates as a pavement material. In 7th International Conference on Sustainable Built Environment (pp. 62-67).
[6] Herrador, R., Pérez, P., Garach, L., & Ordóñez, J. (2011). Use of recycled construction and demolition waste aggregate for road course surfacing. Journal of Transportation Engineering, 138 (2), 182-190.
[7] Vegas, I., Ibañez, J. A., Lisbona, A., De Cortazar, A. S., & Frías, M. (2011). Pre-normative research on the use of mixed recycled aggregates in unbound road sections. Construction and Building Materials, 25 (5), 2674-2682.
[8] Sabat, A. K. (2012). Stabilization of expansive soil using waste ceramic dust. Electronic Journal of Geotechnical Engineering, 17 (Bund. Z).
[9] Pedro, D., De Brito, J., & Evangelista, L. (2014). Influence of the use of recycled concrete aggregates from different sources on structural concrete. Construction and Building Materials, 71, 141-151.
[10] daConceiçãoLeite, F., dos Santos Motta, R., Vasconcelos, K. L., & Bernucci, L. (2011). Laboratory evaluation of recycled construction and demolition waste for pavements Construction and Building Materials, 25 (6), 2972-2979.
[11] Vipulanandan, C., Basheer, M., & O’Neill, M. (1996). Recycled materials in embankments, except glass. The Center for Innovative Grouting Materials and Technology Research Report 0–1351, Preliminary Report, Houston, Texas.
[12] Robinson Jr, G. R., Menzie, W. D., & Hyun, H. (2004). Recycling of construction debris as aggregate in the Mid-Atlantic Region, USA. Resources, Conservation and Recycling, 42 (3), 275-294.
[13] Silva, R. V., De Brito, J., & Dhir, R. K. (2014). Properties and composition of recycled aggregates from construction and demolition waste suitable for concrete production. Construction and Building Materials, 65, 201-217.
[14] Rahman, M. A., Imteaz, M., Arulrajah, A., & Disfani, M. M. (2014). Suitability of recycled construction and demolition aggregates as alternative pipe backfilling materials. Journal of Cleaner Production, 66, 75-84.
[15] Pepe, M., Toledo Filho, R. D., Koenders, E. A., & Martinelli, E. (2014). Alternative processing procedures for recycled aggregates in structural concrete. Construction and Building Materials, 69, 124-132.
[16] Ossa, A., García, J. L., & Botero, E. (2016). Use of recycled construction and demolition waste (CDW) aggregates: a sustainable alternative for the pavement construction industry. Journal of Cleaner Production, 135, 379-386.
[17] Pérez, P., Agrela, F., Herrador, R., & Ordoñez, J. (2013). Application of cement-treated recycled materials in the construction of a section of road in Malaga, Spain. Construction and Building Materials, 44, 593-599.
[18] Huang, Y., Bird, R. N., & Heidrich, O. (2007). A review of the use of recycled solid waste materials in asphalt pavements. Resources, conservation and recycling, 52 (1), 58-73.