Embed Size (px)
Citation preview
Research ArticleEvaluation of CO2-Fluid-Rock Interaction in EnhancedGeothermal Systems: Field-Scale Geochemical Simulations
Feng Pan,1,2 Brian J. McPherson,1,2 and John Kaszuba3,4
1Energy & Geoscience Institute, The University of Utah, Salt Lake City, UT 84108, USA2Department of Civil and Environmental Engineering, The University of Utah, Salt Lake City, UT 84112, USA3Department of Geology & Geophysics, The University of Wyoming, Laramie, WY 82071, USA4School of Energy Resources, The University of Wyoming, Laramie, WY 82071, USA
Correspondence should be addressed to Feng Pan; [email protected]
Received 31 March 2017; Revised 3 August 2017; Accepted 5 September 2017; Published 18 October 2017
Academic Editor: Tianfu Xu
Copyright © 2017 Feng Pan et al.This is an open access article distributed under the Creative CommonsAttribution License, whichpermits unrestricted use, distribution, and reproduction in any medium, provided the original work is properly cited.
Recent studies suggest that using supercritical CO2(scCO
2) instead of water as a heat transmission fluid in Enhanced Geothermal
Systems (EGS) may improve energy extraction. While CO2-fluid-rock interactions at “typical” temperatures and pressures of
subsurface reservoirs are fairly well known, such understanding for the elevated conditions of EGS is relatively unresolved.Geochemical impacts of CO
2as a working fluid (“CO
2-EGS”) compared to those for water as a working fluid (H
2O-EGS) are
needed.The primary objectives of this study are (1) constraining geochemical processes associatedwith CO2-fluid-rock interactions
under the high pressures and temperatures of a typical CO2-EGS site and (2) comparing geochemical impacts of CO
2-EGS to
geochemical impacts of H2O-EGS.The St. John’s Dome CO
2-EGS research site in Arizona was adopted as a case study. A 3Dmodel
of the site was developed. Net heat extraction and mass flow production rates for CO2-EGS were larger compared to H
2O-EGS,
suggesting that using scCO2as aworking fluidmay enhanceEGSheat extraction.More aqueousCO
2accumulateswithin upper- and
lower-lying layers than in the injection/production layers, reducing pHvalues and leading to increased dissolution and precipitationof minerals in those upper and lower layers. Dissolution of oligoclase for water as a working fluid shows smaller magnitude in ratesand different distributions in profile than those for scCO
2as a working fluid. It indicates that geochemical processes of scCO
2-rock
interaction have significant effects on mineral dissolution and precipitation in magnitudes and distributions.
1. Introduction
Recent studies suggest that supercritical CO2(scCO
2) as a
heat transmission fluid in Enhanced Geothermal Systems(EGS) can improve energy extraction compared to conven-tional water-based EGS [1–3]. We refer to such systems asCO2-EGS and to EGS with water as a working fluid as
H2O-EGS. Advantages of using CO
2as a heat transmission
fluid include larger expansivity (compressibility) and lowerviscosity compared to water; CO
2is also a poor mineral
solvent compared to water [1]. Disadvantages of CO2as a
working fluid include a lower mass heat capacity than water,reducing its net energy content per unit volume, as well as thepropensity for aqueous CO
2to promote chemical reactions
leading to changes in reservoir rock porosity and perme-ability [4]. However, CO
2-EGS data, as well as comparisons
of CO2-EGS to H
2O-EGS, are limited. A primary goal of
this study is to constrain geochemical reactions induced byCO2-fluid-rock interactions in EGS reservoirs. An additional
goal is to compare geochemical impacts of CO2-EGS to the
geochemical impacts of H2O-EGS.
Several recent experimental and numerical efforts quan-tify geochemical reactions associated with CO
2injection in
EGS reservoirs [2, 3, 5–10]. Pruess [2, 3] compared CO2and
water with respect to heat extraction rate and mass flowrate in EGS reservoirs. Heat extraction and flow rate largelyincrease with CO
2as the working fluid, suggesting that CO
2
offers potential benefits as a working fluid in EGS reservoirs.Rosenbauer et al. [8] experimentally tested CO
2-brine-rock
interactions at 120∘C and 20–30MPa. Results suggested thatdissolved CO
2may enhance water-rock interaction and CO
2
HindawiGeofluidsVolume 2017, Article ID 5675370, 11 pageshttps://doi.org/10.1155/2017/5675370
2 Geofluids
sequestration in carbonate minerals. Lo Re et al. [6] con-ducted five hydrothermal experiments to evaluate geochem-ical and mineralogical response of fractured granitic rocksto CO
2injection at geothermal conditions of at 250∘C and
25–45MPa. Experimental results suggest that precipitationof clay (smectite and illite) may affect reservoir porosity andpermeability, and carbonate formation may require extendedperiods of time. Jung et al. [5] performed reactive trans-port modeling to study fluid-rock interactions in a typicalgeothermal system and calibrated the geochemical model byadjusting the reactive surface area to fit the experimental dataof mineral dissolution. Na et al. [7] performed laboratoryexperiments to study CO
2-fluid-rock chemical reactions at
high temperatures and pressures in geothermal systems andconducted batch simulations to analyze the experimentaldata. Wan et al. [9] and Xu et al. [10] simulated geochemicalprocesses of fluid-rock interactions within CO
2-EGS under
high pressures and temperatures, and results suggest thatsignificant CO
2may be stored in EGS reservoirs by mineral
trapping by precipitation of carbonate minerals. Xu et al. [11]also performed batch geochemical simulations for three dif-ferent aquifer lithologies to evaluate long-term CO
2disposal
in deep aquifers. Results suggest that CO2sequestration by
mineral trapping varies largely with rock type and mineralcomposition, and porosity decreases due to precipitationof carbonates. Andre et al. (2007) conducted numericalmodeling of fluid-rock chemical interactions of two CO
2
injection scenarios, CO2-saturated water and supercritical
CO2, in a deep carbonate aquifer. Their results suggest that
geochemical reactivity with supercritical CO2injection was
much lower than reactivity with CO2-saturated water.
Although these experimental and numerical studiesaddress many aspects of geochemical reactions induced byCO2-fluid-rock interactions in geothermal systems, three-
dimensional (3D) geochemical simulations of CO2-fluid-
rock interaction at high temperature and pressure in EGSreservoirs are relatively rare. Therefore, a primary objectiveof this study is to simulate and evaluate geochemical pro-cesses induced by CO
2-fluid-rock interactions at the elevated
temperatures and pressures of a CO2-EGS. A secondary
objective is to compare geochemical impacts within a CO2-
EGS to those within an H2O-EGS. The TOUGHREACT
model [12] with the ECO2Hmodule [13] was used to conductsimulations of CO
2-fluid-rock interactions in a CO
2-EGS
reservoir. The St. John’s Dome CO2-EGS research site in
Arizona was used as a case study example.
2. Material and Methods
2.1. St. John’s Dome CO2-EGS Research Site. St. John’s Domeis located along the boundary between Arizona and NewMexico, about half way between the Four Corners area andthe Mexican Border. St. John’s Dome is part of the ColoradoPlateau and covers an area of approximately 1,800 km2 ([14];Rauzi, personal communication, 2013). The dome consistsof a broad, asymmetric anticline that trends northwest withan axis that plunges to the northwest and the southeast.The dome is notable for hosting a gas field consisting of
nearly pure CO2; the Fort Apache, Big A Butte, and Amos
Wash members of the Supai Formation (Permian) are theprimary CO
2reservoirs. The caprock above each CO
2-rich
zone consists of anhydrite and mudstones [15]; basementconsists of Precambrian granite.
Exploration and research of the geothermal potential ofSt. John’s Dome extends back at least into the 1970s. Morethan 40 wells have been drilled to determine the gas reserves.Bottom-hole temperature measurements have been takenin seven of these wells. Temperature gradients appear tobe highest in the south-central portion of the dome; thetemperature at a depth of 3 km in this part of the dome is150∘C or greater. Based on identified geothermal resourcesand large volumes of CO
2, the St. John’s Dome is uniquely
suitable for developing CO2-EGS because it greatly reduces
the risk and cost of testing and developing the technology.
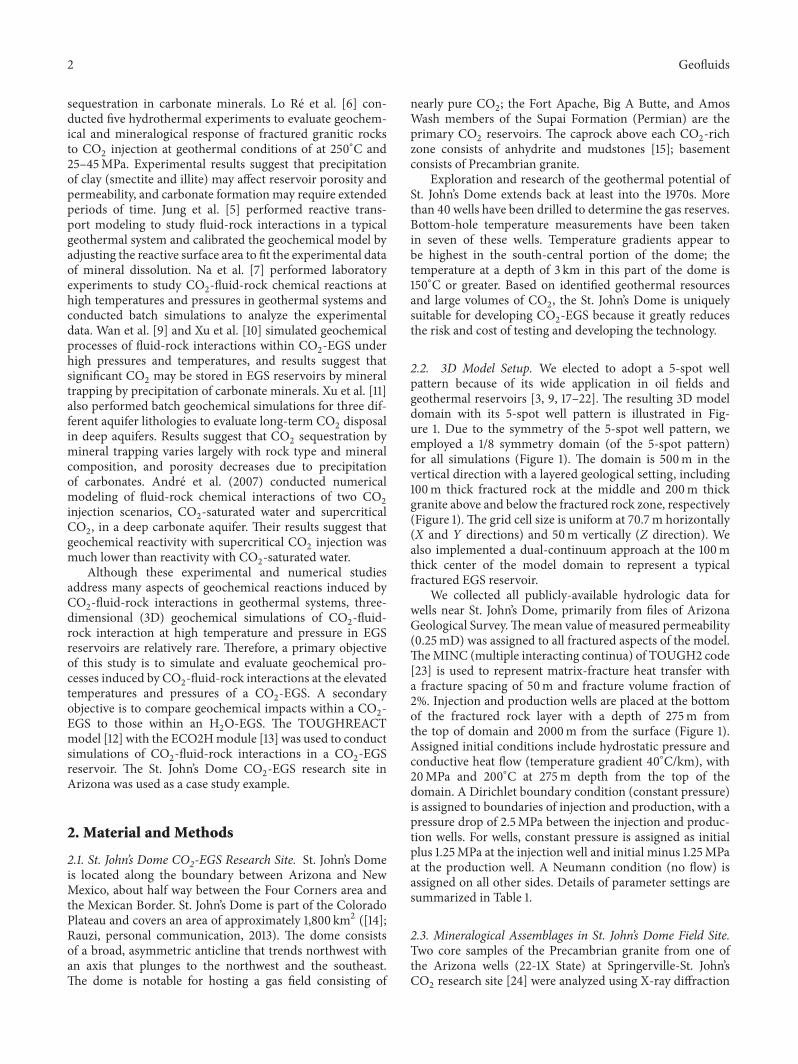
2.2. 3D Model Setup. We elected to adopt a 5-spot wellpattern because of its wide application in oil fields andgeothermal reservoirs [3, 9, 17–22]. The resulting 3D modeldomain with its 5-spot well pattern is illustrated in Fig-ure 1. Due to the symmetry of the 5-spot well pattern, weemployed a 1/8 symmetry domain (of the 5-spot pattern)for all simulations (Figure 1). The domain is 500m in thevertical direction with a layered geological setting, including100m thick fractured rock at the middle and 200m thickgranite above and below the fractured rock zone, respectively(Figure 1). The grid cell size is uniform at 70.7m horizontally(X and Y directions) and 50m vertically (Z direction). Wealso implemented a dual-continuum approach at the 100mthick center of the model domain to represent a typicalfractured EGS reservoir.
We collected all publicly-available hydrologic data forwells near St. John’s Dome, primarily from files of ArizonaGeological Survey.Themean value of measured permeability(0.25mD) was assigned to all fractured aspects of the model.TheMINC (multiple interacting continua) of TOUGH2 code[23] is used to represent matrix-fracture heat transfer witha fracture spacing of 50m and fracture volume fraction of2%. Injection and production wells are placed at the bottomof the fractured rock layer with a depth of 275m fromthe top of domain and 2000m from the surface (Figure 1).Assigned initial conditions include hydrostatic pressure andconductive heat flow (temperature gradient 40∘C/km), with20MPa and 200∘C at 275m depth from the top of thedomain. A Dirichlet boundary condition (constant pressure)is assigned to boundaries of injection and production, with apressure drop of 2.5MPa between the injection and produc-tion wells. For wells, constant pressure is assigned as initialplus 1.25MPa at the injection well and initial minus 1.25MPaat the production well. A Neumann condition (no flow) isassigned on all other sides. Details of parameter settings aresummarized in Table 1.
2.3. Mineralogical Assemblages in St. John’s Dome Field Site.Two core samples of the Precambrian granite from one ofthe Arizona wells (22-1X State) at Springerville-St. John’sCO2research site [24] were analyzed using X-ray diffraction
Geofluids 3
Injection
Injection
Injection
Injection
Production
Model domain
Fractured rock 2000 m
1000 m1000
m
100
m 500
m
Figure 1: Schematic of the 3D numerical model domain with a 5-spot well pattern (1/8 system domain used for all simulations).
Table 1: Hydrologic parameters, initial, and injection/productionboundary conditions used for 3D simulations of a 5-spot wellpattern.
PropertiesFractured rock permeability 2.47 ∗ 10
−16m2 (0.25mD)High granite permeability 9.87 ∗ 10
−18m2 (0.01mD)Fracture spacing 50mFracture volume fraction 2%Fracture porosity 0.50Granite porosity 0.08Fracture tortuosity 1.0Thermal conductivity 2.51W/m∘CRock specific heat 1000 J/kg∘CRock grain density 2650 kg/m3
Initial conditionReservoir fluid All water
Initial temperature200∘C at the layer of
production well with 40∘C/kmgeothermal gradient
Initial pressureHydrostatic pressure with20Mpa at the layer of
production wellProduction/injection condition
Injection/production 707mWell distanceInjection pressure Initial +1.25MPaInjection temperature 50∘CProduction pressure Initial −1.25MPa
(XRD) at the Energy & Geoscience Institute, Universityof Utah. The Arizona well 22-1X State is located near the
Table 2: Mineral assemblages of core samples from Precambriangranite in Arizona well 22-1X State in the St. John’s CO
2field.
Minerals Minerals composition(Sample 1 at 640.8m)
Minerals composition(Sample 2 at 647.4m)
Quartz 50% 45%Plagioclase 26% 30%K-feldspar 21% 19%Biotite 1% 2%Muscovite 2% 3%Total 100% 99%
northern boundary of the St. John’s CO2field at an elevation
of 1949m at the ground level; the well penetrates the PermianSupai Formation at a depth from 195m to 628m belowthe surface and Precambrian granite below that [14]. Thetwo core samples for Precambrian granite were collectedat depths of 640.8m and 647.4m. The two samples consistmainly of quartz (45–50%), plagioclase (26–30%), and K-feldspar (19–21%). An average percentage of the mineralog-ical assemblages of the two samples (Table 2) were used inthe simulations. Potential secondaryminerals were identifiedusing equilibrium batch modeling, as follows. Firstly, CO
2
was added to the initial formation brine in contact withthe primary mineral assemblage, and the saturation indicesof all minerals present in the database were calculated andanalyzed. Minerals that became supersaturated and have thepotential to form under the given conditions were includedas secondary minerals. Then, batch models were reexecutedwith the new (resulting) mineral assemblage until an equi-librium aqueous solution was reached. The primary mineralassemblage and possible secondary minerals are listed inTable 3; kinetic properties for these minerals are listed inTable 4. The kinetic properties (rate constant, activation

4 Geofluids
Table 3: Chemical composition and initial volume fractions of primary and secondary minerals for geochemical simulations of the St. John’sCO2field site.
Mineral Chemical composition Initial volume fraction of mineralsPrimary
Quartz SiO2
0.475Oligoclase Na
0.77Ca0.23
Al1.23
Si2.77
O8
0.280K-Feldspar KAlSi
3O8
0.200Annitea KFe
3AlSi3O10(OH)
20.0075
Phlogopitea KAlMg3Si3O10(OH)
20.0075
Muscovite KAl3Si3O10(OH)
20.025
SecondaryCalcite CaCO
30.0
Magnesite MgCO3
0.0Illite (K,H
3O)(Al,Mg,Fe)
2(Si,Al)
4O10[(OH)
2,(H2O)] 0.0
Smectite K0.04
Ca0.5(Al2.8Fe0.53
Mg0.7)(Si7.65
Al0.35
)O20(OH)
40.0
Kaolinite Al2Si2O5(OH)
40.0
Chlorite Mg2.5Fe2.5Al2Si3O10(OH)
80.0
Albite NaAlSi3O8
0.0Hematite Fe
2O3
0.0Dolomite CaMg(CO
3)2
0.0Ankerite CaMg
0.3Fe0.7(CO3)2
0.0Dawsonite NaAlCO
3(OH)
20.0
Siderite FeCO3
0.0aBiotite is assumed as 50% of Annite and 50% of Phlogopite.
Table 4: Kinetic rate parameters of primary and secondaryminerals and reactive surface area for the geochemical simulations of the St. John’sCO2research site.
Mineral Neutral mechanism Acid mechanism Base mechanism Reactive surface arealog 𝑘a 𝐸
𝑎
b log 𝑘a 𝐸𝑎
b𝑛c log 𝑘a 𝐸
𝑎
b𝑛c (cm2/g)
PrimaryQuartz −13.99 87.7 — — — — — — 9.8Oligoclase −11.84 69.8 −9.67 65.0 0.457 — — — 9.8K-feldspar −12.41 38.0 −10.06 51.7 0.500 −21.2 94.1 −0.823 9.8Annited −12.55 22.0 −9.84 22.0 0.525 — — — 9.8Phlogopite −12.40 29.0 — — — — — — 9.8Muscovite −13.55 22.0 −11.85 22.0 0.370 −14.55 22.0 −0.220 151.6
SecondaryCalcite −5.81 23.5 −0.30 14.4 1.000 — — — 9.8Magnesite −9.34 23.5 −6.38 14.4 1.000 — — — 9.8Illitee −13.55 22.0 −11.85 22.0 0.370 −14.55 22.0 −0.220 151.6Smectite −12.78 35.0 −10.98 23.6 0.340 −16.52 58.9 −0.400 151.6Kaolinite −13.16 22.2 −11.31 65.9 0.777 −17.05 17.9 −0.472 151.6Chlorite −12.52 88.0 −11.11 88.0 0.500 — — — 9.8Albite −12.56 69.8 −10.16 65.0 0.457 −15.6 71.0 −0.572 9.8Hematite −14.60 66.2 −9.39 66.2 1.000 — — — 9.8Dolomite −7.53 52.2 −3.19 36.1 0.500 −5.11 34.8 0.500 9.8Ankeritef −7.53 52.2 −3.19 36.1 0.500 −5.11 34.8 0.500 9.8Dawsonite −7.00 62.8 — — — — — — 9.8Siderite −8.90 62.8 −3.19 36.1 0.500 — — — 9.8Note. Kinetic rate parameters from Palandri and Kharaka [16]; alog k: kinetic rate constant k at 25∘C (mol/m2/s); b𝐸𝑎: activation energy (KJ/mol); c𝑛: powerterm with respect to H+; dset to Biotite; eset to Muscovite; f set to Dolomite.
Geofluids 5
Mas
s flow
rate
(kg/
s)
Time (years)
Hea
t ext
ract
ion
rate
(MW
)
#/2 flow at injection#/2 flow at productionLiquid flow at injectionLiquid flow at productionNet heat extraction
200
150
100
50
0
250
200
150
100
50
0
101
100
10−1
10−2
Gas
satu
ratio
n
Tem
pera
ture
(∘#
) Temperature at injection wellTemperature at production wellGas saturation at injection wellGas saturation at production well
Time (years)10
110
010
−110
−2
1.2
1.0
0.8
0.6
0.4
0.2
0.0
220
200
180
160
140
120
100
80
60
40
20
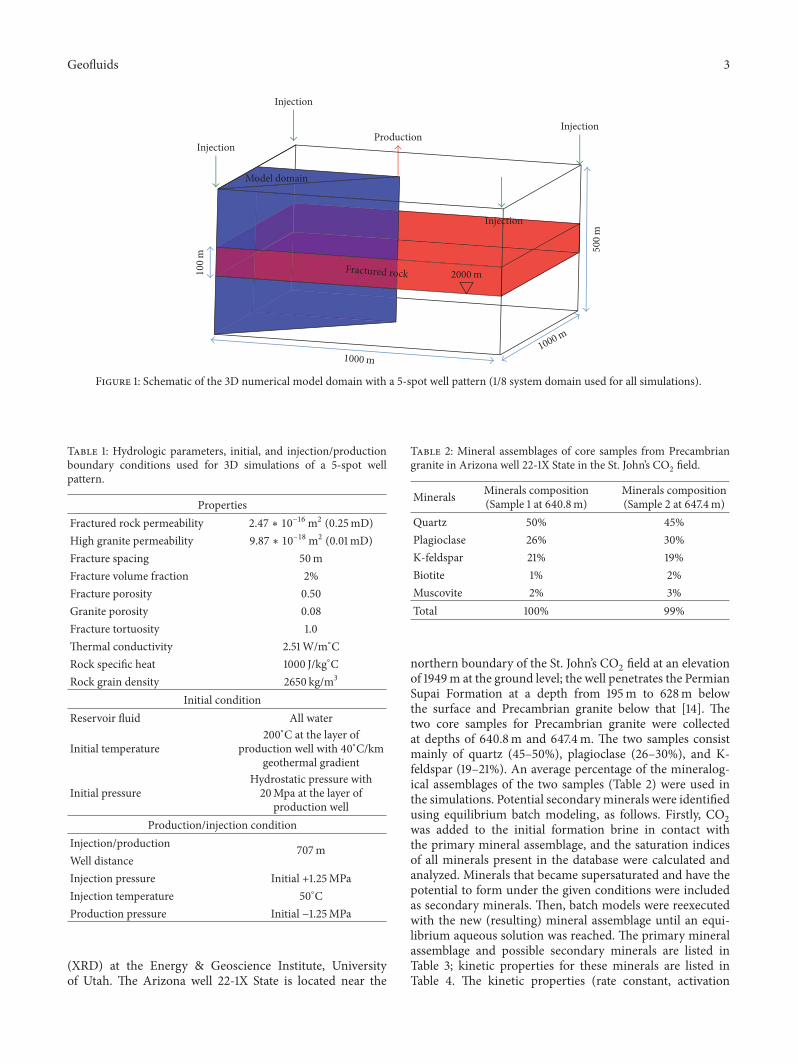
Figure 2: Simulated heat extraction rate, mass flow rate, temperature, and gas saturation next to production well for scCO2(solid line) and
water (dash line) as working fluids, respectively.
energy, and power term) of multiple mechanisms (neutral,acid, and base) for primary and possible secondary mineralsare taken from Palandri and Kharaka [16]. The reactivesurface areas of some minerals (e.g., quartz, oligoclase,albite, K-feldspar, calcite, magnesite, kaolinite, siderite, illite,and smectitie) are taken from Xu et al. [11]. Values forother minerals are assumed as 9.8 cm2/g. All geochemicalsimulations utilize the EQ3/6 thermodynamic database v7.2b(data0.dat; [25]), and all flow aspects are simulated (for 50-year simulation time) using the TOUGHREACT/ECO2Hmodel [12, 26]. A set of batch simulations were conductedfirst, to obtain initial aqueous solutions that would be inequilibrium with the primary minerals.
2.4. NumericalModels. TheTOUGHREACTmodel [12] withits ECO2H module [13] was used to conduct all geochem-ical simulations. The TOUGHREACT code was developedto simulate nonisothermal multicomponent reactive fluidflow and geochemical transport by addressing reactive geo-chemistry with multiphase flow and heat flow [12, 26].TOUGHREACThas been applied to subsurface thermophys-ical-chemical processes in various environmental problemsand geologic systems. The ECO2H module of TOUGHRE-ACT code is designed for applications to geological seques-tration of CO
2in saline aquifers at high temperature and
pressure [13]. The resident equation of state provides an
accurate and comprehensive description of thermodynamicsand thermophysical properties of water-brine-CO
2mixtures
to 243∘C and 67.6MPa [19].
3. Results
3.1. Results of Flow and Heat Simulation at St. John’s DomeSite. Figure 2 plots net heat extraction rate, mass flow rate,temperature and gas saturation at the gridblock next to theinjection, and production wells for the model with scCO
2as
the working fluid. Results for water as a working fluid are alsoplotted in Figure 2. For the case of scCO
2as a working fluid,
flow containing water only is produced at a rate of ∼180 kg/sduring the initial stages of simulation. After 0.05 years, theproduced water flow rate sharply decreases as the flow rate ofproduced CO
2increases, demonstrating the mixture of water
and CO2produced when scCO
2has reached the production
well. With continuous CO2injection and increases in gas
saturation at the production well, the produced CO2flow
rate significantly increases with no water production. Theoscillation in mass flow and heat extraction rate at theearly stages of simulation (Figure 2) is a simulation artifact.Specifically, this minor oscillation is a numerical responseto maintain constant pressure at the wellbore; an absoluteconstant pressure in a wellbore cannot exist in nature, andto force such in a simulation translates to some oscillatory

6 Geofluids
X (m)
Z(m
)
X
Z
7006005004003002001000
450
400
350
300
250
200
150
100
50
X (m)Z
(m)
X
Z
7006003002001000
450
400
350
300
250
200
150
100
50
400 500
T
5060708090100110120130140150160170180190200
Sg
0.0
0.1
0.2
0.3
0.4
0.5
0.6
0.7
0.8
0.9
1.0
Figure 3: Simulated 3D profiles of gas saturation and temperature after 30-year injection of scCO2as a working fluid.
variability in flows. We adopted fixed wellbore pressure atdepth, despite the minor oscillation artifact, because it is acommon approach of analysis. The net heat extraction rateis around 120MW in the initial stage of simulation anddecreases to 60MW after 0.1 years, a trend similar to theproduced water flow rate. With increases of produced CO
2
flow rate, the net heat extraction increases to its maximumof 80MW after 5 years of CO
2injection. With continuous
increase of CO2gas saturation at the production well, the
net heat extraction decreases to 12MW after 50 years of CO2
injection. This is due to more rapid thermal depletion ofCO2compared to water, associated with the rapid decrease of
simulated temperature (Figure 2). The CO2saturation next
to the injection well becomes 100% after 0.2 years of CO2
injection. The CO2flow breaks through to the production
well after 0.06 years of injection and gas saturation continuesincreasing to 1.0 after 10 years of CO
2injection. However, the
gas saturation decreases from 1.0 to 0.6 at the production wellafter 20 years of CO
2injection, demonstrating possible CO
2
leakage to upper-lying layers (Figure 3).The temperature nextto the injection well decreases from the initial temperature of200∘C to the injection temperature of 50∘C.The temperaturenext to the production well remains constant at the initialtemperature of 200∘C until around 2 years of CO
2injection
and then drops to 65∘C after 50 years of CO2injection.
Figure 3 plots simulated 3D profiles of gas saturation andtemperature after 30 years of scCO
2injection (as a working
fluid). The gas saturation at the layer of injection/productionwell decreases from 1.0 to 0.5 toward the production wellafter 30 years. The gas saturation varies from 0.2 to 0.5 inthe area of upper-lying layers after 30 years, demonstratingthat simulated CO
2leakage occurs and CO
2breakthrough in
caprock may constitute a leakage risk. The gas saturation isaround 0.5 in the layer just below the injection/productionwell (Figure 3). The 3D temperature profile exhibits a similartrend as the gas saturation profile, which increases from50∘C at the injection well to 80∘C at the production well(Figure 3), similar to the results in Figure 2. The temperaturedrop also occurs in the layers just above and below the injec-tion/production layer, associated with large gas saturation inthat area.
For water as a working fluid, the mass flow rate nextto the production well decreases from 100 kg/s at the initialstage of simulation to 53 kg/s after 50 years of water injection(Figure 2), which is less than the 180 kg/s initial rate andless than the 150 to 250 kg/s of the produced CO
2flow rate
at the late stage of simulations with scCO2as a working
fluid. A possible explanation for this phenomenon is thelower viscosity of scCO
2compared to water. The net heat
extraction for water as a working fluid has similar trends
Geofluids 7
X (m)
Z(m
)
450
400
350
300
250
200
150
100
50
7006005004003002001000
X (m)Z
(m)
450
400
350
300
250
200
150
100
50
7006005004003002001000
X
Z
X
Z
Dissolved#/2
0.000
0.006
0.012
0.018
0.024
0.030
0.036
0.042
0.048
0.054
0.060
pH
0.51.01.52.02.53.03.54.04.55.05.5
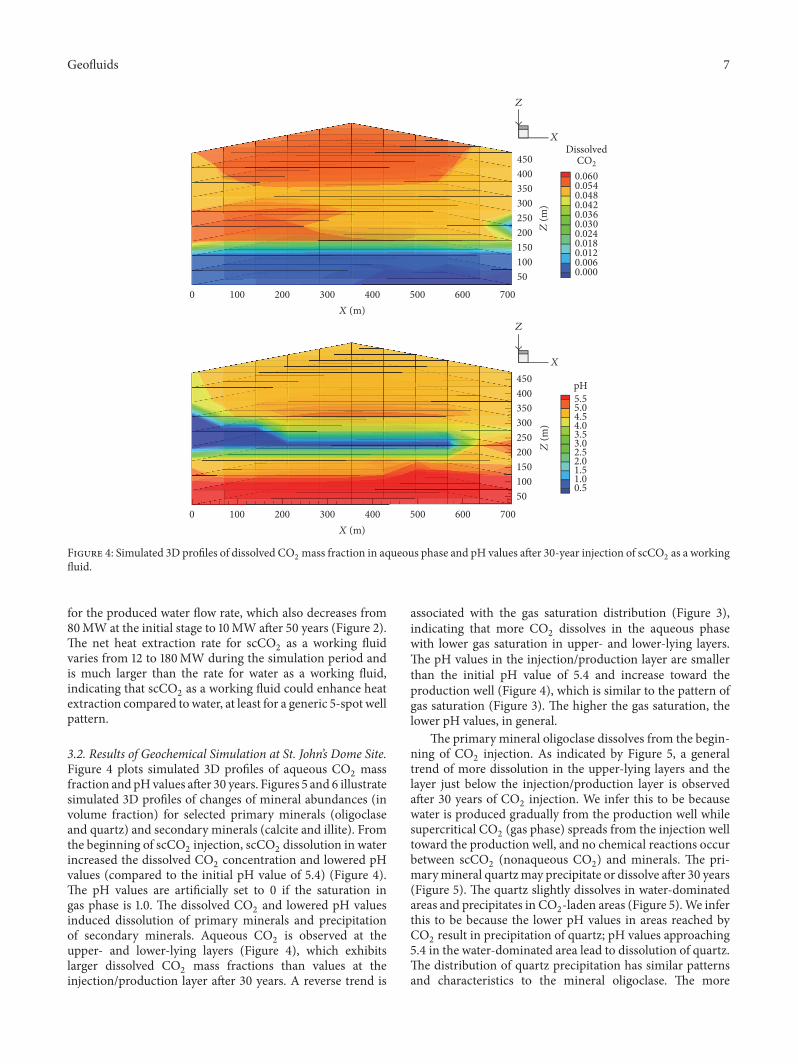
Figure 4: Simulated 3D profiles of dissolved CO2mass fraction in aqueous phase and pH values after 30-year injection of scCO
2as a working
fluid.
for the produced water flow rate, which also decreases from80MW at the initial stage to 10MW after 50 years (Figure 2).The net heat extraction rate for scCO
2as a working fluid
varies from 12 to 180MW during the simulation period andis much larger than the rate for water as a working fluid,indicating that scCO
2as a working fluid could enhance heat
extraction compared to water, at least for a generic 5-spot wellpattern.
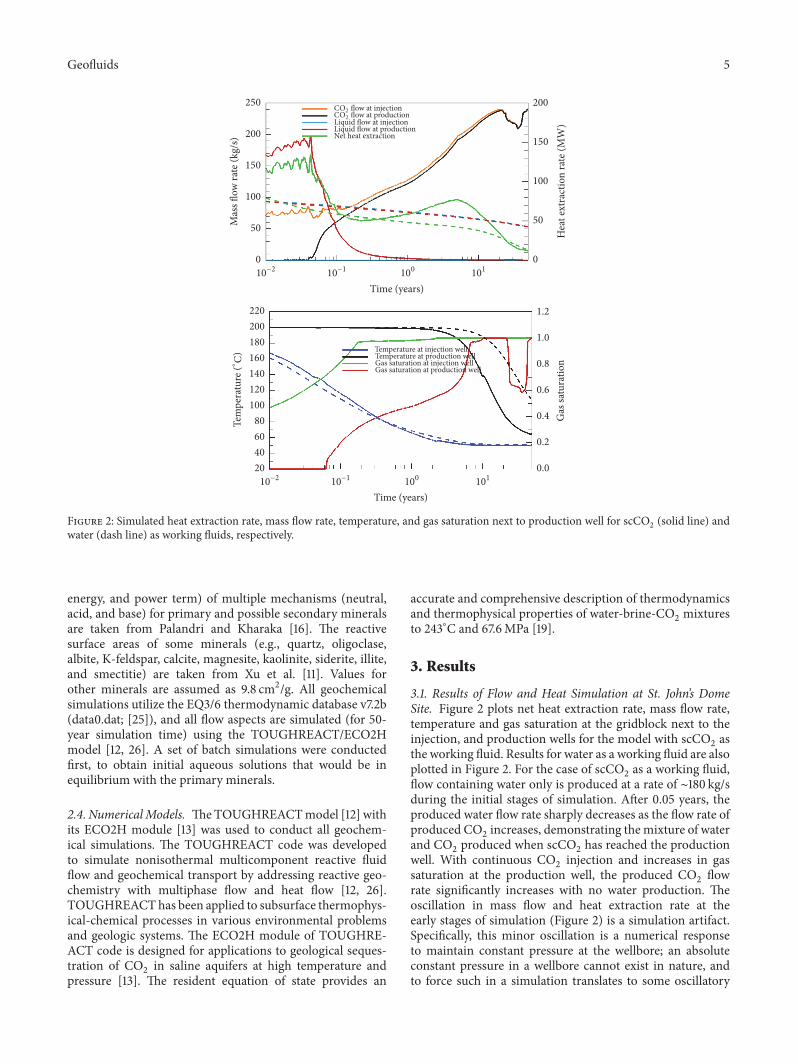
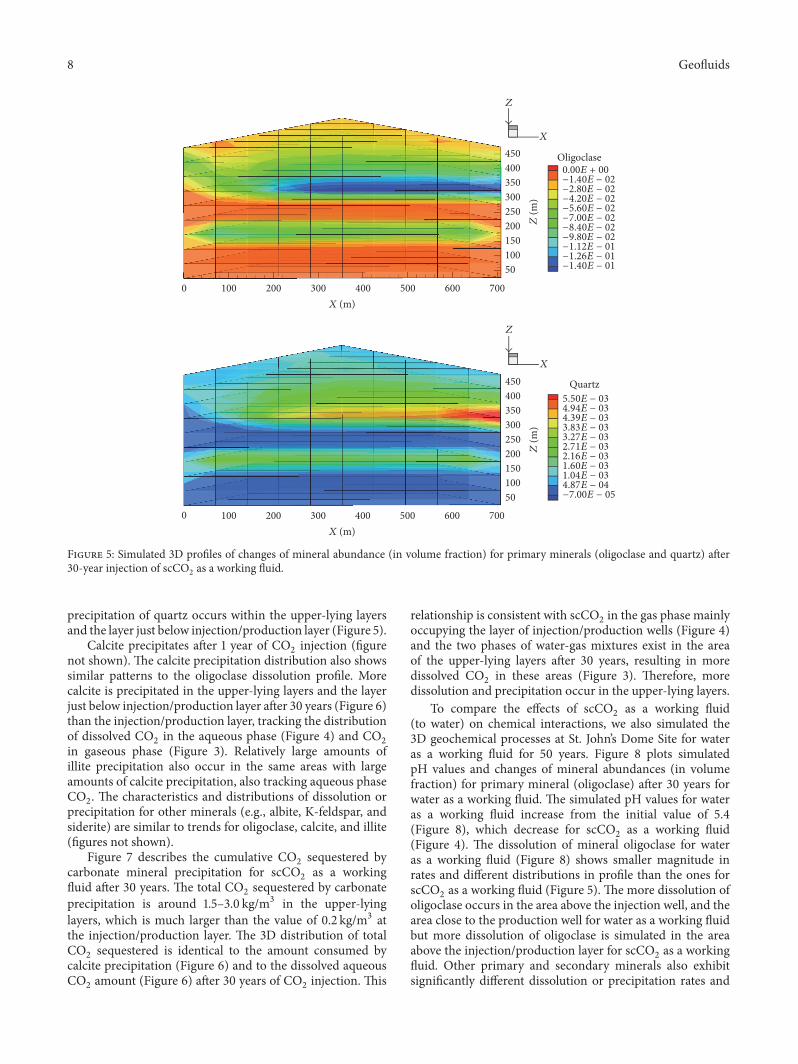
3.2. Results of Geochemical Simulation at St. John’s Dome Site.Figure 4 plots simulated 3D profiles of aqueous CO
2mass
fraction and pHvalues after 30 years. Figures 5 and 6 illustratesimulated 3D profiles of changes of mineral abundances (involume fraction) for selected primary minerals (oligoclaseand quartz) and secondary minerals (calcite and illite). Fromthe beginning of scCO
2injection, scCO
2dissolution in water
increased the dissolved CO2concentration and lowered pH
values (compared to the initial pH value of 5.4) (Figure 4).The pH values are artificially set to 0 if the saturation ingas phase is 1.0. The dissolved CO
2and lowered pH values
induced dissolution of primary minerals and precipitationof secondary minerals. Aqueous CO
2is observed at the
upper- and lower-lying layers (Figure 4), which exhibitslarger dissolved CO
2mass fractions than values at the
injection/production layer after 30 years. A reverse trend is
associated with the gas saturation distribution (Figure 3),indicating that more CO
2dissolves in the aqueous phase
with lower gas saturation in upper- and lower-lying layers.The pH values in the injection/production layer are smallerthan the initial pH value of 5.4 and increase toward theproduction well (Figure 4), which is similar to the pattern ofgas saturation (Figure 3). The higher the gas saturation, thelower pH values, in general.
The primary mineral oligoclase dissolves from the begin-ning of CO
2injection. As indicated by Figure 5, a general
trend of more dissolution in the upper-lying layers and thelayer just below the injection/production layer is observedafter 30 years of CO
2injection. We infer this to be because
water is produced gradually from the production well whilesupercritical CO
2(gas phase) spreads from the injection well
toward the production well, and no chemical reactions occurbetween scCO
2(nonaqueous CO
2) and minerals. The pri-
marymineral quartzmay precipitate or dissolve after 30 years(Figure 5). The quartz slightly dissolves in water-dominatedareas and precipitates in CO
2-laden areas (Figure 5).We infer
this to be because the lower pH values in areas reached byCO2result in precipitation of quartz; pH values approaching
5.4 in the water-dominated area lead to dissolution of quartz.The distribution of quartz precipitation has similar patternsand characteristics to the mineral oligoclase. The more
8 Geofluids
X (m)
Z(m
)
450
400
350
300
250
200
150
100
50
7006005004003002001000
X (m)Z
(m)
450
400
350
300
250
200
150
100
50
7006005004003002001000
Oligoclase
−1.40E − 01
−1.26E − 01
−1.12E − 01
−9.80E − 02
−8.40E − 02
−7.00E − 02
−5.60E − 02
−4.20E − 02
−2.80E − 02
−1.40E − 02
0.00E + 00
Z
X
Z
X
Quartz
−7.00E − 05
4.87E − 04
1.04E − 03
1.60E − 03
2.16E − 03
2.71E − 03
3.27E − 03
3.83E − 03
4.39E − 03
4.94E − 03
5.50E − 03
Figure 5: Simulated 3D profiles of changes of mineral abundance (in volume fraction) for primary minerals (oligoclase and quartz) after30-year injection of scCO
2as a working fluid.
precipitation of quartz occurs within the upper-lying layersand the layer just below injection/production layer (Figure 5).
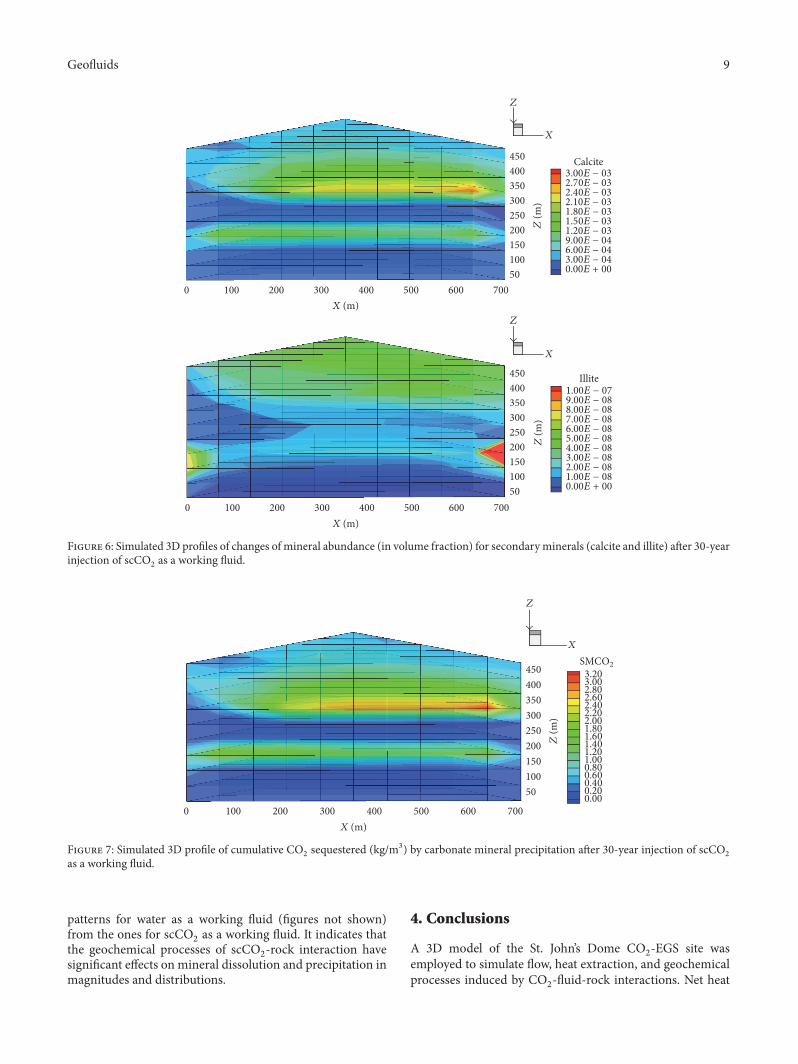
Calcite precipitates after 1 year of CO2injection (figure
not shown). The calcite precipitation distribution also showssimilar patterns to the oligoclase dissolution profile. Morecalcite is precipitated in the upper-lying layers and the layerjust below injection/production layer after 30 years (Figure 6)than the injection/production layer, tracking the distributionof dissolved CO
2in the aqueous phase (Figure 4) and CO
2
in gaseous phase (Figure 3). Relatively large amounts ofillite precipitation also occur in the same areas with largeamounts of calcite precipitation, also tracking aqueous phaseCO2. The characteristics and distributions of dissolution or
precipitation for other minerals (e.g., albite, K-feldspar, andsiderite) are similar to trends for oligoclase, calcite, and illite(figures not shown).
Figure 7 describes the cumulative CO2sequestered by
carbonate mineral precipitation for scCO2as a working
fluid after 30 years. The total CO2sequestered by carbonate
precipitation is around 1.5–3.0 kg/m3 in the upper-lyinglayers, which is much larger than the value of 0.2 kg/m3 atthe injection/production layer. The 3D distribution of totalCO2sequestered is identical to the amount consumed by
calcite precipitation (Figure 6) and to the dissolved aqueousCO2amount (Figure 6) after 30 years of CO
2injection. This
relationship is consistent with scCO2in the gas phase mainly
occupying the layer of injection/production wells (Figure 4)and the two phases of water-gas mixtures exist in the areaof the upper-lying layers after 30 years, resulting in moredissolved CO
2in these areas (Figure 3). Therefore, more
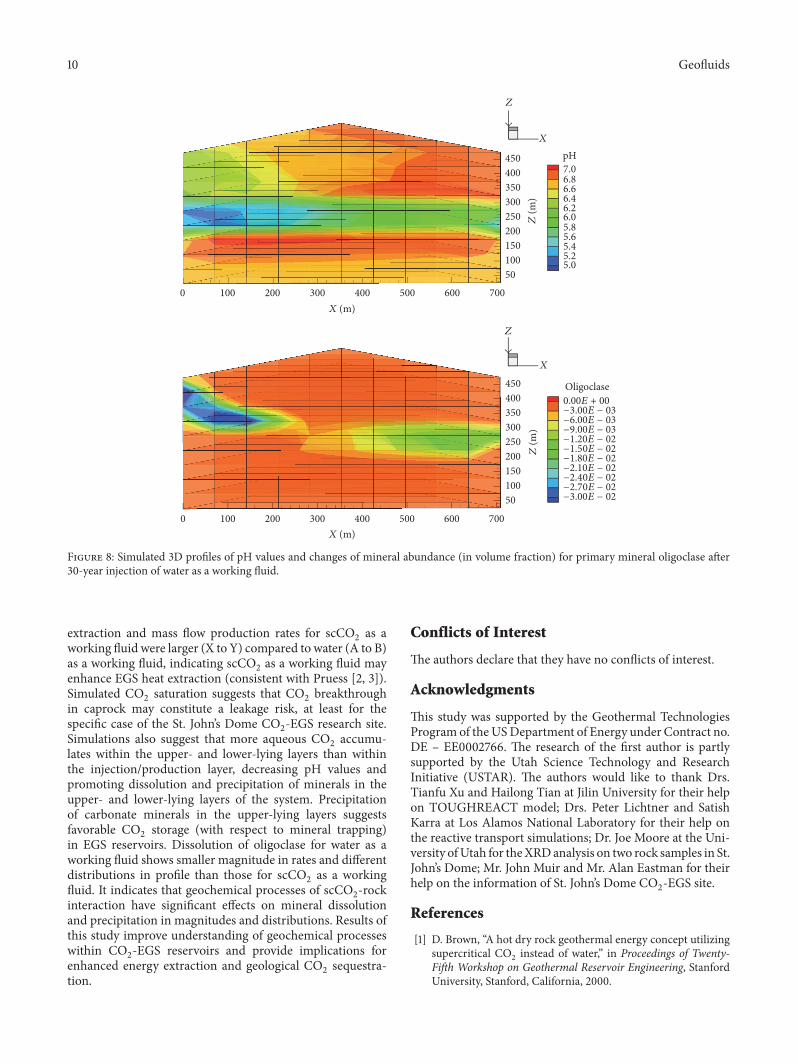
dissolution and precipitation occur in the upper-lying layers.To compare the effects of scCO
2as a working fluid
(to water) on chemical interactions, we also simulated the3D geochemical processes at St. John’s Dome Site for wateras a working fluid for 50 years. Figure 8 plots simulatedpH values and changes of mineral abundances (in volumefraction) for primary mineral (oligoclase) after 30 years forwater as a working fluid. The simulated pH values for wateras a working fluid increase from the initial value of 5.4(Figure 8), which decrease for scCO
2as a working fluid
(Figure 4). The dissolution of mineral oligoclase for wateras a working fluid (Figure 8) shows smaller magnitude inrates and different distributions in profile than the ones forscCO2as a working fluid (Figure 5). The more dissolution of
oligoclase occurs in the area above the injection well, and thearea close to the production well for water as a working fluidbut more dissolution of oligoclase is simulated in the areaabove the injection/production layer for scCO
2as a working
fluid. Other primary and secondary minerals also exhibitsignificantly different dissolution or precipitation rates and
Geofluids 9
X (m)Z
(m)
450
400
350
300
250
200
150
100
50
7006005004003002001000
X (m)
Z(m
)
450
400
350
300
250
200
150
100
50
7006005004003002001000
Illite
0.00E + 00
1.00E − 08
2.00E − 08
3.00E − 08
4.00E − 08
5.00E − 08
6.00E − 08
7.00E − 08
8.00E − 08
9.00E − 08
1.00E − 07
Calcite
0.00E + 00
3.00E − 04
6.00E − 04
9.00E − 04
1.20E − 03
1.50E − 03
1.80E − 03
2.10E − 03
2.40E − 03
2.70E − 03
3.00E − 03
Z
X
Z
X
Figure 6: Simulated 3D profiles of changes of mineral abundance (in volume fraction) for secondary minerals (calcite and illite) after 30-yearinjection of scCO
2as a working fluid.
X (m)
Z(m
)
450
400
350
300
250
200
150
100
50
7006005004003002001000
0.000.200.400.600.801.001.201.401.601.802.002.202.402.602.803.003.20
X
Z
3-#/2
Figure 7: Simulated 3D profile of cumulative CO2sequestered (kg/m3) by carbonate mineral precipitation after 30-year injection of scCO
2
as a working fluid.
patterns for water as a working fluid (figures not shown)from the ones for scCO
2as a working fluid. It indicates that
the geochemical processes of scCO2-rock interaction have
significant effects on mineral dissolution and precipitation inmagnitudes and distributions.
4. Conclusions
A 3D model of the St. John’s Dome CO2-EGS site was
employed to simulate flow, heat extraction, and geochemicalprocesses induced by CO
2-fluid-rock interactions. Net heat
10 Geofluids
Z(m
)
450
400
350
300
250
200
150
100
50
X (m)7006005004003002001000
X (m)Z
(m)
450
400
350
300
250
200
150
100
50
7006005004003002001000
X
Z
X
Z
pH
Oligoclase
−3.00E − 02
−2.70E − 02
−2.40E − 02
−2.10E − 02
−1.80E − 02
−1.50E − 02
−1.20E − 02
−9.00E − 03
−6.00E − 03
−3.00E − 03
0.00E + 00
5.05.2
5.4
5.6
5.8
6.06.2
6.4
6.6
6.8
7.0
Figure 8: Simulated 3D profiles of pH values and changes of mineral abundance (in volume fraction) for primary mineral oligoclase after30-year injection of water as a working fluid.
extraction and mass flow production rates for scCO2as a
working fluid were larger (X to Y) compared to water (A to B)as a working fluid, indicating scCO
2as a working fluid may
enhance EGS heat extraction (consistent with Pruess [2, 3]).Simulated CO
2saturation suggests that CO
2breakthrough
in caprock may constitute a leakage risk, at least for thespecific case of the St. John’s Dome CO
2-EGS research site.
Simulations also suggest that more aqueous CO2accumu-
lates within the upper- and lower-lying layers than withinthe injection/production layer, decreasing pH values andpromoting dissolution and precipitation of minerals in theupper- and lower-lying layers of the system. Precipitationof carbonate minerals in the upper-lying layers suggestsfavorable CO
2storage (with respect to mineral trapping)
in EGS reservoirs. Dissolution of oligoclase for water as aworking fluid shows smaller magnitude in rates and differentdistributions in profile than those for scCO
2as a working
fluid. It indicates that geochemical processes of scCO2-rock
interaction have significant effects on mineral dissolutionand precipitation in magnitudes and distributions. Results ofthis study improve understanding of geochemical processeswithin CO
2-EGS reservoirs and provide implications for
enhanced energy extraction and geological CO2sequestra-
tion.
Conflicts of Interest
The authors declare that they have no conflicts of interest.
Acknowledgments
This study was supported by the Geothermal TechnologiesProgram of theUSDepartment of Energy under Contract no.DE – EE0002766. The research of the first author is partlysupported by the Utah Science Technology and ResearchInitiative (USTAR). The authors would like to thank Drs.Tianfu Xu and Hailong Tian at Jilin University for their helpon TOUGHREACT model; Drs. Peter Lichtner and SatishKarra at Los Alamos National Laboratory for their help onthe reactive transport simulations; Dr. Joe Moore at the Uni-versity ofUtah for theXRDanalysis on two rock samples in St.John’s Dome; Mr. John Muir and Mr. Alan Eastman for theirhelp on the information of St. John’s Dome CO
2-EGS site.
References
[1] D. Brown, “A hot dry rock geothermal energy concept utilizingsupercritical CO
2instead of water,” in Proceedings of Twenty-
Fifth Workshop on Geothermal Reservoir Engineering, StanfordUniversity, Stanford, California, 2000.

Geofluids 11
[2] K. Pruess, “Enhanced geothermal systems (EGS): Comparingwater and CO
2as heat transmission fluids,” in Proceedings of
New Zealand Geothermal Workshop, Auckland, New Zealand,2007.
[3] K. Pruess, “On production behavior of enhanced geothermalsystems with CO
2as working fluid,” Energy Conversion and
Management, vol. 49, no. 6, pp. 1446–1454, 2008.[4] T. Xu, G. Feng, Z. Hou, H. Tian, Y. Shi, and H. Lei, “Well-
bore–reservoir coupled simulation to study thermal and fluidprocesses in a CO
2-based geothermal system: identifying favor-
able and unfavorable conditions in comparison with water,”Environmental Earth Sciences, vol. 73, no. 11, article 6, pp. 6797–6813, 2015.
[5] Y. Jung, T. Xu, P. F. Dobson, N. Chang, and M. Petro, “Exper-iment-based modelling of geothermal interactions in CO2-based geothermal systems,” in Proceedings of Thirty-EighthWorkshop on Geothermal Reservoir Engineering, Stanford Uni-versity, Stanford, California, 2013.
[6] C. Lo Re, J. P. Kaszuba, J. N.Moore, and B. J.McPherson, “Fluid-rock interactions in CO
2-saturated, granite-hosted geother-
mal systems: Implications for natural and engineered systemsfrom geochemical experiments and models,” Geochimica etCosmochimica Acta, vol. 141, pp. 160–178, 2014.
[7] J. Na, T. Xu, Y. Yuan, B. Feng, H. Tian, and X. Bao, “Anintegrated study of fluid-rock interaction in a CO
2-based
enhanced geothermal system: A case study of Songliao Basin,China,” Applied Geochemistry, vol. 59, pp. 166–177, 2015.
[8] R. J. Rosenbauer, T. Koksalan, and J. L. Palandri, “Experimentalinvestigation of CO
2-brine-rock interactions at elevated tem-
perature and pressure: Implications for CO2sequestration in
deep-saline aquifers,” Fuel Processing Technology, vol. 86, no. 14-15, pp. 1581–1597, 2005.
[9] Y. Wan, T. Xu, and K. Pruess, “mpact of fluid-rock interactionson enhanced geothermal systemswithCO
2as heat transmission
fluid,” in Proceedings of Thirty-Sixth Workshop on GeothermalReservoir Engineering, StanfordUniversity, Stanford, California,2011.
[10] T. Xu, K. Pruess, and J. Apps, “Numerical studies of fluid-rockinteractions in enhanced geothermal systems (EGS) with CO2as working fluid,” in Proceedings of Thirty-third Workshop onGeothermal Reservoir Engineering, Stanford University, Stan-ford, California, 2008.
[11] T. Xu, J. A. Apps, and K. Pruess, “Numerical simulation ofCO2disposal by mineral trapping in deep aquifers,” Applied
Geochemistry, vol. 19, pp. 917–936, 2004.[12] T. Xu, E. Sonnenthal, N. Spycher, and K. Pruess, “TOUGH-
REACT—A simulation program for non-isothermal multi-phase reactive geochemical transport in variably saturatedgeologic media: Applications to geothermal injectivity and CO
2
geological sequestration,” Computers & Geosciences, vol. 32, pp.145–165, 2006.
[13] N. Spycher and K. Pruess, “A model for thermophysical prop-erties of CO
2-brine mixtures at elevated temperatures and
pressures,” in Proceedings of Thirty-six Workshop on Geother-mal Reservoir Engineering, Stanford University, Stanford, Calif,USA, 2011.
[14] S. L. Rauzi, “Carbon dioxide in the St. John’s – Springerville area,Apache County, Arizona,” ArizonaGeological SurveyOpen-fileReport 99-2, Tucson, Arizona, 1999.
[15] D. Coblentz, “Quarterly progress report, activities descrip-tion: national risk assessment partnership,” AARRA QuarterlyReport, 2011.
[16] J. L. Palandri and Y. K. Kharaka, “A compilation of rateparameters of water-mineral interaction kinetics for applicationto geochemical modelling,” in U.S. Geological Survey Open FileReport, Menlo Park, California, 2004.
[17] K. Pruess, “Enhanced geothermal systems (EGS) using CO2
as working fluid—a novel approach for generating renewableenergy with simultaneous sequestration of carbon,” Geother-mics, vol. 35, no. 4, pp. 351–367, 2006.
[18] N. Spycher and K. Pruess, “A Phase-partitioning model forCO2-brine mixtures at elevated temperatures and pressures:
application toCO2-enhanced geothermal systems,”Transport in
Porous Media, vol. 82, no. 1, pp. 173–196, 2010.[19] A. Borgia, K. Pruess, T. J. Kneafsey, C. M. Oldenburg, and L.
Pan, “Simulation of CO2-EGS in a fractured reservoir with salt
precipitation,” inProceedings of the 11th International Conferenceon Greenhouse Gas Control Technologies, GHGT 2012, pp. 6617–6624, jpn, November 2012.
[20] J. B. Randolph and M. O. Saar, “Combining geothermal energycapture with geologic carbon dioxide sequestration,” Geophysi-cal Research Letters, vol. 38, 2011.
[21] F. Pan, B. J. McPherson, Z. Dai et al., “Uncertainty analysis ofcarbon sequestration in an active CO2-EORfield,” InternationalJournal of Greenhouse Gas Control, vol. 51, pp. 18–28, 2016a.
[22] F. Pan, B. J. McPherson, R. Esser et al., “Forecasting evolutionof formation water chemistry and long-term mineral alterationfor GCS in a typical clastic reservoir of the SouthwesternUnitedStates,” International Journal of Greenhouse Gas Control, vol. 54,pp. 524–537, 2016b.
[23] K. Pruess, C. Oldenburg, and G. Moridis, “TOUGH2 User’sGuide Version 2,” Tech. Rep. LBNL-43134, Lawrence BerkeleyNational Laboratory, Berkeley, Calif, USA, 1999.
[24] J. Moore,M. Adams, R. Allis, S. Lutz, and S. Rauzi, “Mineralogi-cal and geochemical consequences of the long-term presence ofCO2in natural reservoirs: an example from the Springerville-
St. Johns Field, Arizona, and New Mexico, U.S.A,” ChemicalGeology, vol. 217, no. 3-4, pp. 365–385, 2005.
[25] T. J. Wolery, “Software package for geochemical modelingof aqueous system: Package overview and installation guide(version 8.0),” Lawrence LivermoreNational Laboratory ReportUCRL-MA-110662 PT I, Livermore, California, USA, 1992.
[26] T. Xu, N. Spycher, E. Sonnenthal, G. Zhang, L. Zheng, and K.Pruess, “TOUGHREACT version 2.0: a simulator for subsur-face reactive transport under non-isothermal multiphase flowconditions,” Computers & Geosciences, vol. 37, no. 6, pp. 763–774, 2011.

Submit your manuscripts athttps://www.hindawi.com
Hindawi Publishing Corporationhttp://www.hindawi.com Volume 2014
ClimatologyJournal of
EcologyInternational Journal of
Hindawi Publishing Corporationhttp://www.hindawi.com Volume 2014
EarthquakesJournal of
Hindawi Publishing Corporationhttp://www.hindawi.com Volume 2014
Mining
Hindawi Publishing Corporationhttp://www.hindawi.com Volume 2014
Journal of
Hindawi Publishing Corporation http://www.hindawi.com Volume 201
International Journal of
OceanographyInternational Journal of
Hindawi Publishing Corporationhttp://www.hindawi.com Volume 2014
Journal of Computational Environmental SciencesHindawi Publishing Corporationhttp://www.hindawi.com Volume 2014
Journal ofPetroleum Engineering
Hindawi Publishing Corporationhttp://www.hindawi.com Volume 2014
GeochemistryHindawi Publishing Corporationhttp://www.hindawi.com Volume 2014
Journal of
Atmospheric SciencesInternational Journal of
Hindawi Publishing Corporationhttp://www.hindawi.com Volume 2014
OceanographyHindawi Publishing Corporationhttp://www.hindawi.com Volume 2014
Advances in
Hindawi Publishing Corporationhttp://www.hindawi.com Volume 2014
MineralogyInternational Journal of
Hindawi Publishing Corporationhttp://www.hindawi.com Volume 2014
MeteorologyAdvances in
The Scientific World JournalHindawi Publishing Corporation http://www.hindawi.com Volume 2014
Paleontology JournalHindawi Publishing Corporationhttp://www.hindawi.com Volume 2014
ScientificaHindawi Publishing Corporationhttp://www.hindawi.com Volume 2014
Hindawi Publishing Corporationhttp://www.hindawi.com Volume 2014
Geological ResearchJournal of
Hindawi Publishing Corporationhttp://www.hindawi.com Volume 2014
Geology Advances in