Embed Size (px)
Citation preview
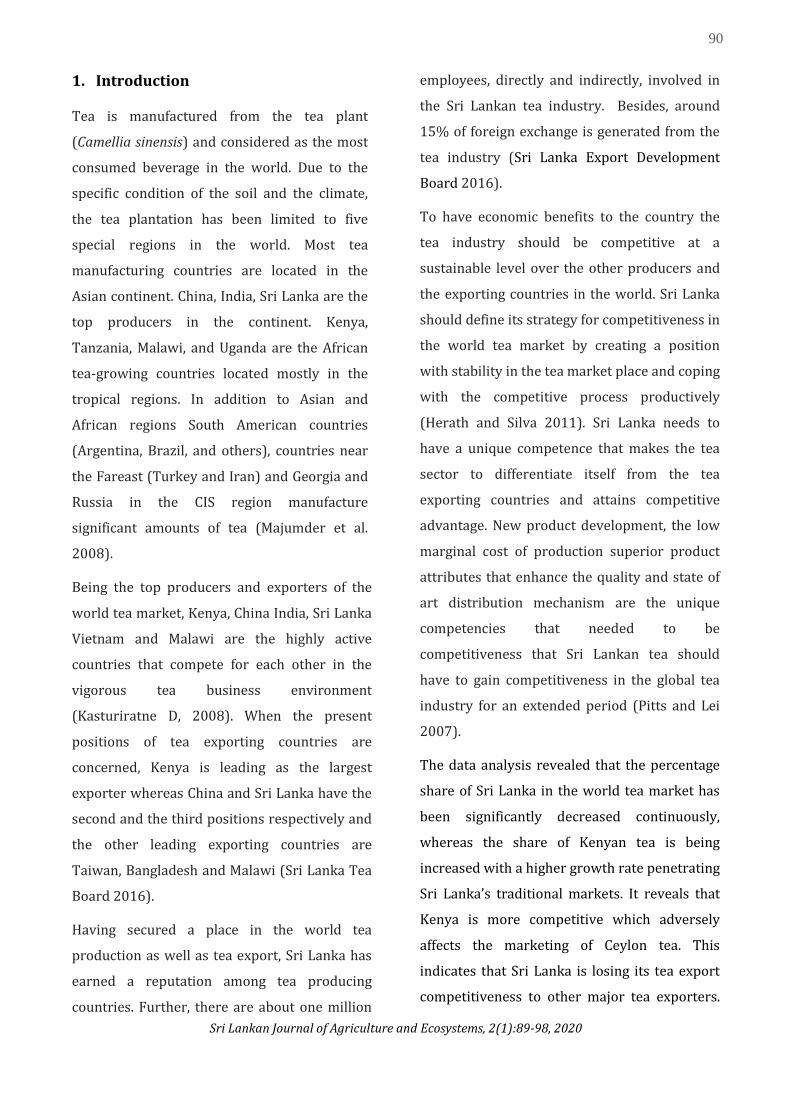
Volume: 2, Issue: 1, (June, 2020), pp 89-98
www.rjt.ac.lk/agri/sljae
SRI LANKAN JOURNAL OF AGRICULTURE AND ECOSYSTEMS e-ISSN: 2673-1401
ORIGINAL ARTICLE
Evaluation of Competitiveness of Ceylon Tea in the World Market
K.H.S Kumara Kithsiri1*, V.S. Jayamanna2, L. M Abewickrama2
Date of Submission: 20-11-2019
Date of Acceptance: 10-05-2020
Abstract
Competitiveness and being competitive is vitally needed to enhance the
performance and to tackle challenges in the highly competitive world tea market.
The prestige brand Ceylon Tea established in the past has been enjoyed by Sri
Lanka having no analysis done to determine the competitiveness of Ceylon Tea in
its major destinations. This study was carried out by using the CMS model to
determine the competitiveness and to test the possibility of using the model for
such purposes. The total change of exported quantity to a particular country could
be differentiated into three corporates such as market growth effect, composition
effect and the residual effect or competitive effect by using the Constant Market
Share (CMS) model. Fifteen destinations of Ceylon Tea markets were selected for
the study based on the total quantity of Ceylon Tea exported and the potential of
the country to import Ceylon Tea. Tea import data of last fifteen years from 2003
to 2015 were used for the study. The results revealed that Ceylon Tea is found to
be competitive in Russia, Kuwait, Japan, Turkey, Germany, Australia, USA, and
India, and Azerbaijan, Iran, UK and Libya are found to be having potential for being
competitive for Ceylon Tea. However, Sri Lanka could have maintained its share of
export and increased the market share in many of these destinations by enhancing
the market growth as well as composition effect. Therefore, this model could be
used to determine the competitiveness of Ceylon Tea in its destination. Further,
tea promotion policy decisions including brand promotion through effective
marketing communication could be achieved.
Keywords: Ceylon Tea, CMS model, Competitive advantage
SLJAE
1Tea Commissioner’s Division, Sri Lanka Tea Board, Head Office, 574, Galle Road, Colombo 03, Sri Lanka.
2Department of Food Science, Faculty of Agriculture, University of Ruhuna, Mapalana, Kamburipitiya, Sri Lanka.
2Department f Agric. Economics and Extension, Faculty of Agriculture, University of Ruhuna, Mapalana, Kamburipitiya, Sri Lanka.
Correspondence: 1 [email protected] ORCID: 0000-0003-3563-417X
Sri Lankan Journal of Agriculture and Ecosystems, 2(1):89-98, 2020
1. Introduction
Tea is manufactured from the tea plant
(Camellia sinensis) and considered as the most
consumed beverage in the world. Due to the
specific condition of the soil and the climate,
the tea plantation has been limited to five
special regions in the world. Most tea
manufacturing countries are located in the
Asian continent. China, India, Sri Lanka are the
top producers in the continent. Kenya,
Tanzania, Malawi, and Uganda are the African
tea-growing countries located mostly in the
tropical regions. In addition to Asian and
African regions South American countries
(Argentina, Brazil, and others), countries near
the Fareast (Turkey and Iran) and Georgia and
Russia in the CIS region manufacture
significant amounts of tea (Majumder et al.
2008).
Being the top producers and exporters of the
world tea market, Kenya, China India, Sri Lanka
Vietnam and Malawi are the highly active
countries that compete for each other in the
vigorous tea business environment
(Kasturiratne D, 2008). When the present
positions of tea exporting countries are
concerned, Kenya is leading as the largest
exporter whereas China and Sri Lanka have the
second and the third positions respectively and
the other leading exporting countries are
Taiwan, Bangladesh and Malawi (Sri Lanka Tea
Board 2016).
Having secured a place in the world tea
production as well as tea export, Sri Lanka has
earned a reputation among tea producing
countries. Further, there are about one million
employees, directly and indirectly, involved in
the Sri Lankan tea industry. Besides, around
15% of foreign exchange is generated from the
tea industry (Sri Lanka Export Development
Board 2016).
To have economic benefits to the country the
tea industry should be competitive at a
sustainable level over the other producers and
the exporting countries in the world. Sri Lanka
should define its strategy for competitiveness in
the world tea market by creating a position
with stability in the tea market place and coping
with the competitive process productively
(Herath and Silva 2011). Sri Lanka needs to
have a unique competence that makes the tea
sector to differentiate itself from the tea
exporting countries and attains competitive
advantage. New product development, the low
marginal cost of production superior product
attributes that enhance the quality and state of
art distribution mechanism are the unique
competencies that needed to be
competitiveness that Sri Lankan tea should
have to gain competitiveness in the global tea
industry for an extended period (Pitts and Lei
2007).
The data analysis revealed that the percentage
share of Sri Lanka in the world tea market has
been significantly decreased continuously,
whereas the share of Kenyan tea is being
increased with a higher growth rate penetrating
Sri Lanka’s traditional markets. It reveals that
Kenya is more competitive which adversely
affects the marketing of Ceylon tea. This
indicates that Sri Lanka is losing its tea export
competitiveness to other major tea exporters.
90
Sri Lankan Journal of Agriculture and Ecosystems, 2(1):89-98, 2020
Therefore, to implement an effective marketing
communication system, it is needed to assess
the competitiveness of major tea exporters in
importing countries.
The overall objective of this study is to find out
the competitiveness of Ceylon Tea in the global
tea market. Employing suitable models to
determine the competitiveness of Ceylon tea
and estimating the growth, composition, and
competitive effect to differentiate the countries
that are competitive, and have the potential to
be competitive and accordingly make
recommendations for suitable promotional
policies in implementing marketing
communication strategies were the objectives
specific for this study. There had no model been
tested to determine the competitiveness of
Ceylon tea. Therefore, it was vitally essential to
analyse the existing and potential markets for
their competitiveness; besides, applying the
model at two phases, it is expected to see the
change of the output of the model over time and
observe the impact of different marketing
policies and strategies applied at two phases as
deem necessary.
2. Materials and Methods
As there had been no similar case study in the
tea sector the following Indian study on the
competitiveness of pepper was taken as the
experience for this study. According to the
study, the import growth effect represents the
potential change in total exports of a country
assuming a constant market share of the base
period. The market effect is the difference
between the market-specific growth effect and
overall import growth effect. The competitive
effect is the residual after subtracting import
growth effect and market effect from the total
change in exports. In the study import growth
effects for Indian pepper were 41, -18, 25, -20, -
10 and 19 in the USA, USSR, Canada, Italy
Germany, and other markets respectively.
Market effects were –15, 27, 8 –27, 2, -3 in the
USA, USSR, Canada, Italy Germany, and other
markets respectively. Competitive effects were
74, -55, 68, -53, -92 and –116 in the USA, USSR,
Canada, Italy Germany, and other markets
respectively. The above results showed that
import growth, market and competitive effects
of Indian pepper are positive in the USA and
Canadian markets indicating competitiveness
in these two markets for Indian pepper while
in other markets it was not competitive.
However, the overall competitive effect is
negative (-104) and therefore, it is required to
adopt strategies to make Indian pepper
competitive in the world market (Mamatha and
Chengappa 1997).
The requirement of data was met collecting
from sources of secondary data such as the
International Tea Committee, the Sri Lanka
customs, the Sri Lanka Tea Board, the Central
Bank of Sri Lanka, and the Export Development
Board of Sri Lanka. Other sources of
publications such as research articles, web-
references, annual reports, journals and books
were also associated with the extraction of data.
The two criteria for selection of fifteen
countries which import Ceylon tea were the
quantity of export and the potential of countries
to import Ceylon Tea. Selected countries with
its quantity of imports (in million kg.) and the
91
Sri Lankan Journal of Agriculture and Ecosystems, 2(1):89-98, 2020
percentage (within the brackets) were Russia
(44.1, 14.6%), Turkey (38.5, 12.8%), Iraq (1.3,
7.4%), Iran (31, 10.3%), Azerbaijan (10, 3.3%),
Syria (15.6, 5.2%), Libya (9, 2.9%), Germany
(7.8, 2%), Australia (2.5, 0.73%) and India (1.9,
0.63%) (Sri Lanka Tea Board 2015). Data
extracted during the past thirteen years from
2003 to 2015 was used for carrying out the
research. Data included the annual total import
of Ceylon Tea by each country, annual total
import by each country and total annual import
of tea (from all tea importing countries) by each
country in terms of quantity and US$ value. The
Constant Market Share model was employed as
analytical tool to evaluate the competitive
advantage of Ceylon Tea. According to the
Constant Market Share model if the market
share of any country is increased in a particular
market that country should have a competitive
advantage over the other countries. Several
models can be used to analyse the
competitiveness and effects of trade
liberalization on trading in a particular country.
Mamatha and Chengappa (1997) showed that
“The constant market share model (CMS) is the
most convenient and suitable to analyse
bilateral trade flows between two countries”.
The relatively simple way of analysis, the ability
to provide insight into competitiveness in
designing export strategies and impact of
existing policies evidence of using this model in
the Indian pepper industry for the same
purpose are the key factors that lie rationality
of selecting this model. Foundation with strong
theories as well as concisely summarized key
aspects of the large volume of data is the major
strength of the CSM model. Whereas a model
being descriptive and not causal, the chance of
flowing measurement error directly into results
and varying the share of trade from year to year
specially at the aggregate levels, are the major
weak area of this model. The simple way of
analysing complex growth patterns was the
main reason for selecting the CSM model over
others (Gilbert 2017).
This model was employed to disintegrate
change of a Ceylon tea market of a country into
growth, competitive and market composition
effects assuming that a country’s export share
in a Ceylon tea market hasn’t been changed
over time. As per the model, the total change of
exports between two periods is the sum of
import growth effect, market effect, and
competitive effect. The import growth effect
represents the potential change in total exports
of a country assuming a constant market share
of the base period. The market effect is the
difference between the market-specific growth
effect and overall import growth effect. The
competitive effect is the residual after
subtracting import growth effect and market
effect from the total change in exports.
Data analysis
Evaluation of competitiveness in Ceylon tea was
done employing Market Share Model. The
model was arranged with the following
expressions and formula.
The total exports of Sri Lanka to a selected
country during period 0 (base period).
qi Export Ceylon Tea to the selected country.
92
Sri Lankan Journal of Agriculture and Ecosystems, 2(1):89-98, 2020
M Rate (percentage) of increment of the
total imports of the selected country from 0 to t
(period).
mi Rate (percentage) increment of the
total tea imports of the selected country from 0
to t (period).
If Sri Lanka maintains its export market share
in a particular country’s market, Sri Lanka’s
exports to a particular country could increase
by MQ .
MQQ )1(
2)0()0()()0()0()( MQQtQMQQtQ
The exports of Sri Lanka to particular country
consists of many commodities and for a tea the
equation was,
)0()( qitiq )0()0()()0( miqiqitqimiqi
)3(
)4(....21 qnqqqiQ
By aggregating equation (3) for all commodities
imported by particular country and by
rearranging,
)0()()0()( qtqiQtQ
)}0()0()({)}0(){()0(
)}0()0()({)0(
miqiqitqiqimiMMqi
miqiqtqimiqi
)5(
)6()()()(
)}0()0()({)}0(){()0()0()(
rcgQ
miqiqtqiqimiMMQQtQ
(g) = growth effect (general increment selected
country’s imports).
(c) = commodity composition (market effect).
(r) = competitive effect (an unexplained
residual difference).
This analysis is based on the shares of imports
in fifteen destinations of Ceylon tea maintained
by Sri Lanka exports assuming that if
competitiveness is not changed, Sri Lanka
should maintain the constant share of the
export market. To avoid the annual variation of
exports and imports, averages of the three
consecutive years (triennium averages) were
taken for the analysis. Average shares over a
longer period or moving averages can be a
remedial action to correct the year to year of
trade share variations especially at the
aggregate level. The competitiveness was
assessed for two phases so that change
competitiveness for Ceylon tea in a selected
country over time could be judged. The first
phase is from 2003 to 2010 and second phase is
from 2010 to 2015. For the first phase
triennium average of 2003 to 2005 as the base
period and the same of 2008 to 2010 as the
period after base period were considered.
Triennium average of 2008 to 2010 as the base
period and the same of 2013 to 2015 as the
period after base period were considered for
second phase. All the value of exports and
imports were converted into US$ to nullify the
inflationary pressure.
In the interpretation of results, a market to be
competitive to Ceylon tea, the value for
competitive effect should be positive. The
countries having negative values but relatively
low, those countries can be ranked as countries
having potential to become competitive. When
a positive figure resulted in market effect, that
93
Sri Lankan Journal of Agriculture and Ecosystems, 2(1):89-98, 2020
particular country has a good demand for
Ceylon tea or other origin teas.
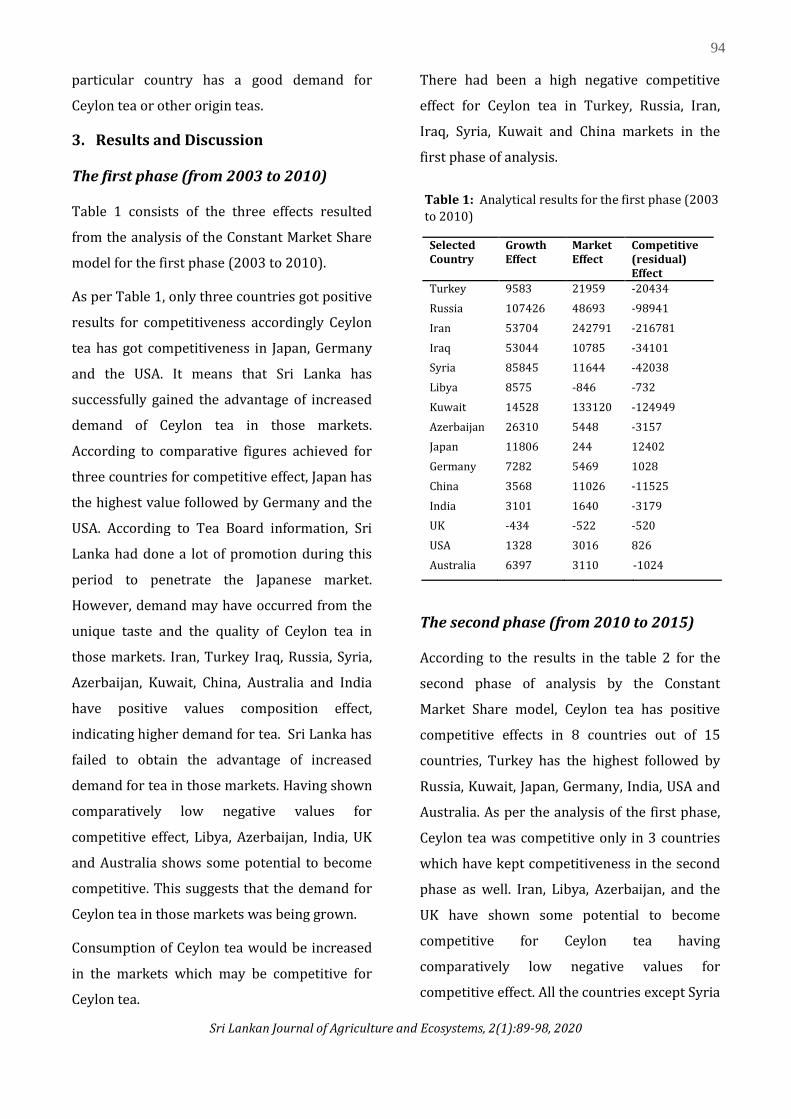
3. Results and Discussion
The first phase (from 2003 to 2010)
Table 1 consists of the three effects resulted
from the analysis of the Constant Market Share
model for the first phase (2003 to 2010).
As per Table 1, only three countries got positive
results for competitiveness accordingly Ceylon
tea has got competitiveness in Japan, Germany
and the USA. It means that Sri Lanka has
successfully gained the advantage of increased
demand of Ceylon tea in those markets.
According to comparative figures achieved for
three countries for competitive effect, Japan has
the highest value followed by Germany and the
USA. According to Tea Board information, Sri
Lanka had done a lot of promotion during this
period to penetrate the Japanese market.
However, demand may have occurred from the
unique taste and the quality of Ceylon tea in
those markets. Iran, Turkey Iraq, Russia, Syria,
Azerbaijan, Kuwait, China, Australia and India
have positive values composition effect,
indicating higher demand for tea. Sri Lanka has
failed to obtain the advantage of increased
demand for tea in those markets. Having shown
comparatively low negative values for
competitive effect, Libya, Azerbaijan, India, UK
and Australia shows some potential to become
competitive. This suggests that the demand for
Ceylon tea in those markets was being grown.
Consumption of Ceylon tea would be increased
in the markets which may be competitive for
Ceylon tea.
There had been a high negative competitive
effect for Ceylon tea in Turkey, Russia, Iran,
Iraq, Syria, Kuwait and China markets in the
first phase of analysis.
The second phase (from 2010 to 2015)
According to the results in the table 2 for the
second phase of analysis by the Constant
Market Share model, Ceylon tea has positive
competitive effects in 8 countries out of 15
countries, Turkey has the highest followed by
Russia, Kuwait, Japan, Germany, India, USA and
Australia. As per the analysis of the first phase,
Ceylon tea was competitive only in 3 countries
which have kept competitiveness in the second
phase as well. Iran, Libya, Azerbaijan, and the
UK have shown some potential to become
competitive for Ceylon tea having
comparatively low negative values for
competitive effect. All the countries except Syria
Selected Country
Growth Effect
Market Effect
Competitive (residual) Effect
Turkey 9583 21959 -20434
Russia 107426 48693 -98941
Iran 53704 242791 -216781
Iraq 53044 10785 -34101
Syria 85845 11644 -42038
Libya 8575 -846 -732
Kuwait 14528 133120 -124949
Azerbaijan 26310 5448 -3157
Japan 11806 244 12402
Germany 7282 5469 1028
China 3568 11026 -11525
India 3101 1640 -3179
UK -434 -522 -520
USA 1328 3016 826
Australia 6397 3110 --1024
Table 1: Analytical results for the first phase (2003
to 2010)
94
Sri Lankan Journal of Agriculture and Ecosystems, 2(1):89-98, 2020
and UK have positive values for market effects
showing the expanded market for tea.
Comparing the competitive effect gained
by the countries in the first and the
second phases.
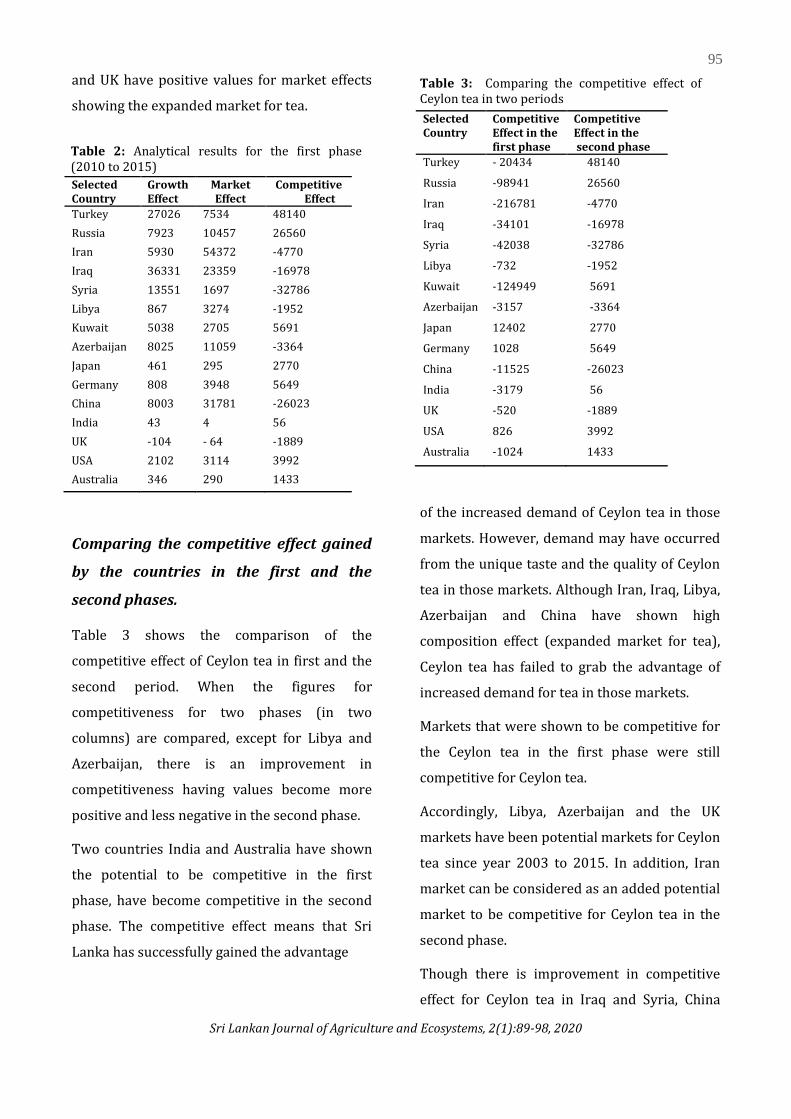
Table 3 shows the comparison of the
competitive effect of Ceylon tea in first and the
second period. When the figures for
competitiveness for two phases (in two
columns) are compared, except for Libya and
Azerbaijan, there is an improvement in
competitiveness having values become more
positive and less negative in the second phase.
Two countries India and Australia have shown
the potential to be competitive in the first
phase, have become competitive in the second
phase. The competitive effect means that Sri
Lanka has successfully gained the advantage
of the increased demand of Ceylon tea in those
markets. However, demand may have occurred
from the unique taste and the quality of Ceylon
tea in those markets. Although Iran, Iraq, Libya,
Azerbaijan and China have shown high
composition effect (expanded market for tea),
Ceylon tea has failed to grab the advantage of
increased demand for tea in those markets.
Markets that were shown to be competitive for
the Ceylon tea in the first phase were still
competitive for Ceylon tea.
Accordingly, Libya, Azerbaijan and the UK
markets have been potential markets for Ceylon
tea since year 2003 to 2015. In addition, Iran
market can be considered as an added potential
market to be competitive for Ceylon tea in the
second phase.
Though there is improvement in competitive
effect for Ceylon tea in Iraq and Syria, China
Selected Country
Growth Effect
Market Effect
Competitive Effect
Turkey 27026 7534 48140
Russia 7923 10457 26560
Iran 5930 54372 -4770
Iraq 36331 23359 -16978
Syria 13551 1697 -32786
Libya 867 3274 -1952
Kuwait 5038 2705 5691
Azerbaijan 8025 11059 -3364
Japan 461 295 2770
Germany 808 3948 5649
China 8003 31781 -26023
India 43 4 56
UK -104 - 64 -1889
USA 2102 3114 3992
Australia 346 290 1433
Selected Country
Competitive Effect in the first phase
Competitive Effect in the second phase
Turkey - 20434 48140
Russia -98941 26560
Iran -216781 -4770
Iraq -34101 -16978
Syria -42038 -32786
Libya -732 -1952
Kuwait -124949 5691
Azerbaijan -3157 -3364
Japan 12402 2770
Germany 1028 5649
China -11525 -26023
India -3179 56
UK -520 -1889
USA 826 3992
Australia -1024 1433
Table 2: Analytical results for the first phase (2010 to 2015)
Table 3: Comparing the competitive effect of Ceylon tea in two periods
95
Sri Lankan Journal of Agriculture and Ecosystems, 2(1):89-98, 2020
have higher negative effects as per the analysis in
the second phase. According to the analysis done
for the first phase, there had been no
competitiveness for Ceylon tea in Turkey, Russia
and Kuwait markets. However, in the second phase,
Ceylon tea has strongly emerged as competitive in
those countries. This may be due to the awareness
of health benefit and other campaign launched by
leading the Ceylon tea brand and Sri Lanka Tea
Board. Further, in the first period, there was no
considerable competitiveness of Ceylon tea in the
Iran market. In the second period, though Iran was
having a negative value for the competitiveness of
Ceylon tea it has a large improvement compared to
the first phase. This situation is justified by Iran
becoming one of the top buyers of Ceylon tea in
2015. Altogether, there had been considerable
improvements in the competitiveness of Ceylon tea
towards the latter part of the second phase.
When empirical data of the export quantity and
export revenue data of Ceylon tea, during the
period in which the competitive analysis (2003 to
2015) is concerned, there had been a clear increase
in export revenue towards the end of the second
phase. This can be taken as a qualitative measure to
justify the finding of the competitive analysis has
increased the number of countries with competitive
advantage and improvement in the overall
competitiveness of 13 countries out of selected 15
countries (Fig. 1 and Fig. 2).
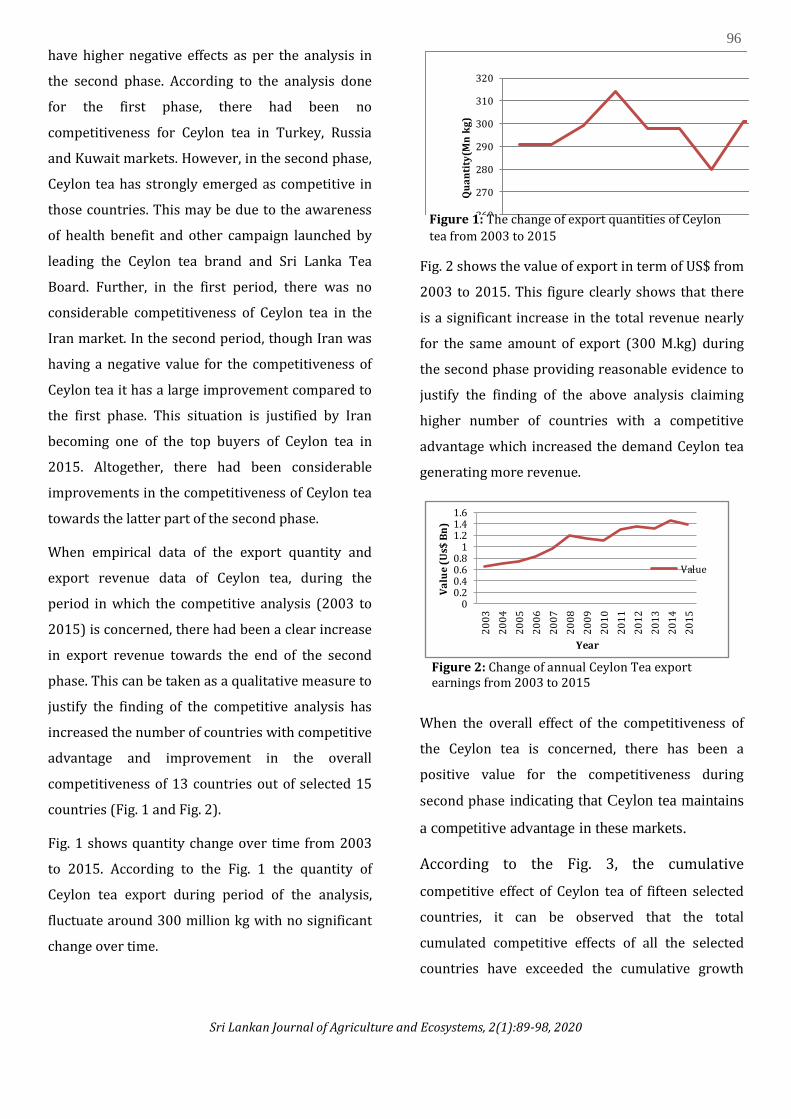
Fig. 1 shows quantity change over time from 2003
to 2015. According to the Fig. 1 the quantity of
Ceylon tea export during period of the analysis,
fluctuate around 300 million kg with no significant
change over time.
260
270
280
290
300
310
320
Qu
an
tity
(Mn
kg
)
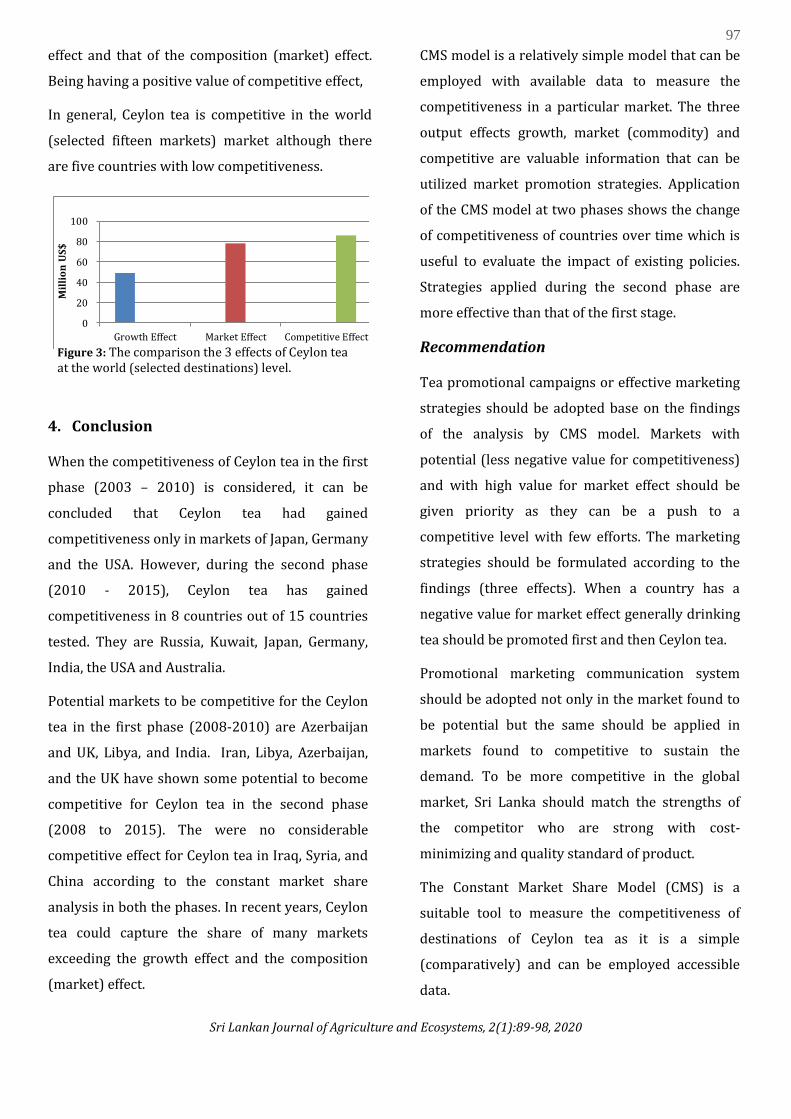
Fig. 2 shows the value of export in term of US$ from
2003 to 2015. This figure clearly shows that there
is a significant increase in the total revenue nearly
for the same amount of export (300 M.kg) during
the second phase providing reasonable evidence to
justify the finding of the above analysis claiming
higher number of countries with a competitive
advantage which increased the demand Ceylon tea
generating more revenue.
00.20.40.60.8
11.21.41.6
20
03
20
04
20
05
20
06
20
07
20
08
20
09
20
10
20
11
20
12
20
13
20
14
20
15
Va
lue
(U
s$ B
n)
Year
Value
When the overall effect of the competitiveness of
the Ceylon tea is concerned, there has been a
positive value for the competitiveness during
second phase indicating that Ceylon tea maintains
a competitive advantage in these markets.
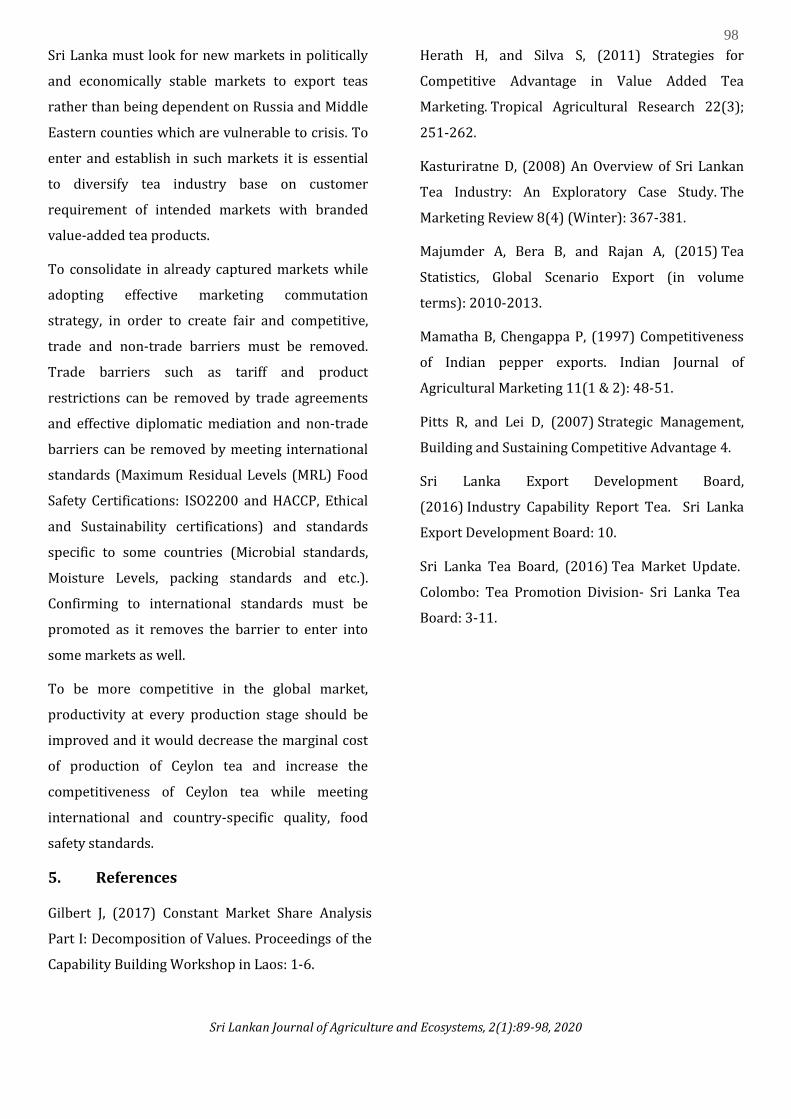
According to the Fig. 3, the cumulative
competitive effect of Ceylon tea of fifteen selected
countries, it can be observed that the total
cumulated competitive effects of all the selected
countries have exceeded the cumulative growth
Figure 1: The change of export quantities of Ceylon
tea from 2003 to 2015
Figure 2: Change of annual Ceylon Tea export earnings from 2003 to 2015
96
Sri Lankan Journal of Agriculture and Ecosystems, 2(1):89-98, 2020
effect and that of the composition (market) effect.
Being having a positive value of competitive effect,
In general, Ceylon tea is competitive in the world
(selected fifteen markets) market although there
are five countries with low competitiveness.
0
20
40
60
80
100
Growth Effect Market Effect Competitive Effect
Mil
lio
n U
S$
4. Conclusion
When the competitiveness of Ceylon tea in the first
phase (2003 – 2010) is considered, it can be
concluded that Ceylon tea had gained
competitiveness only in markets of Japan, Germany
and the USA. However, during the second phase
(2010 - 2015), Ceylon tea has gained
competitiveness in 8 countries out of 15 countries
tested. They are Russia, Kuwait, Japan, Germany,
India, the USA and Australia.
Potential markets to be competitive for the Ceylon
tea in the first phase (2008-2010) are Azerbaijan
and UK, Libya, and India. Iran, Libya, Azerbaijan,
and the UK have shown some potential to become
competitive for Ceylon tea in the second phase
(2008 to 2015). The were no considerable
competitive effect for Ceylon tea in Iraq, Syria, and
China according to the constant market share
analysis in both the phases. In recent years, Ceylon
tea could capture the share of many markets
exceeding the growth effect and the composition
(market) effect.
CMS model is a relatively simple model that can be
employed with available data to measure the
competitiveness in a particular market. The three
output effects growth, market (commodity) and
competitive are valuable information that can be
utilized market promotion strategies. Application
of the CMS model at two phases shows the change
of competitiveness of countries over time which is
useful to evaluate the impact of existing policies.
Strategies applied during the second phase are
more effective than that of the first stage.
Recommendation
Tea promotional campaigns or effective marketing
strategies should be adopted base on the findings
of the analysis by CMS model. Markets with
potential (less negative value for competitiveness)
and with high value for market effect should be
given priority as they can be a push to a
competitive level with few efforts. The marketing
strategies should be formulated according to the
findings (three effects). When a country has a
negative value for market effect generally drinking
tea should be promoted first and then Ceylon tea.
Promotional marketing communication system
should be adopted not only in the market found to
be potential but the same should be applied in
markets found to competitive to sustain the
demand. To be more competitive in the global
market, Sri Lanka should match the strengths of
the competitor who are strong with cost-
minimizing and quality standard of product.
The Constant Market Share Model (CMS) is a
suitable tool to measure the competitiveness of
destinations of Ceylon tea as it is a simple
(comparatively) and can be employed accessible
data.
Figure 3: The comparison the 3 effects of Ceylon tea at the world (selected destinations) level.
97
Sri Lankan Journal of Agriculture and Ecosystems, 2(1):89-98, 2020
Sri Lanka must look for new markets in politically
and economically stable markets to export teas
rather than being dependent on Russia and Middle
Eastern counties which are vulnerable to crisis. To
enter and establish in such markets it is essential
to diversify tea industry base on customer
requirement of intended markets with branded
value-added tea products.
To consolidate in already captured markets while
adopting effective marketing commutation
strategy, in order to create fair and competitive,
trade and non-trade barriers must be removed.
Trade barriers such as tariff and product
restrictions can be removed by trade agreements
and effective diplomatic mediation and non-trade
barriers can be removed by meeting international
standards (Maximum Residual Levels (MRL) Food
Safety Certifications: ISO2200 and HACCP, Ethical
and Sustainability certifications) and standards
specific to some countries (Microbial standards,
Moisture Levels, packing standards and etc.).
Confirming to international standards must be
promoted as it removes the barrier to enter into
some markets as well.
To be more competitive in the global market,
productivity at every production stage should be
improved and it would decrease the marginal cost
of production of Ceylon tea and increase the
competitiveness of Ceylon tea while meeting
international and country-specific quality, food
safety standards.
5. References
Gilbert J, (2017) Constant Market Share Analysis
Part I: Decomposition of Values. Proceedings of the
Capability Building Workshop in Laos: 1-6.
Herath H, and Silva S, (2011) Strategies for
Competitive Advantage in Value Added Tea
Marketing. Tropical Agricultural Research 22(3);
251-262.
Kasturiratne D, (2008) An Overview of Sri Lankan
Tea Industry: An Exploratory Case Study. The
Marketing Review 8(4) (Winter): 367-381.
Majumder A, Bera B, and Rajan A, (2015) Tea
Statistics, Global Scenario Export (in volume
terms): 2010-2013.
Mamatha B, Chengappa P, (1997) Competitiveness
of Indian pepper exports. Indian Journal of
Agricultural Marketing 11(1 & 2): 48-51.
Pitts R, and Lei D, (2007) Strategic Management,
Building and Sustaining Competitive Advantage 4.
Sri Lanka Export Development Board,
(2016) Industry Capability Report Tea. Sri Lanka
Export Development Board: 10.
Sri Lanka Tea Board, (2016) Tea Market Update.
Colombo: Tea Promotion Division- Sri Lanka Tea
Board: 3-11.
98