Embed Size (px)
Citation preview

Lincoln LaboratoryMASSACHUSETTS INSTITUTE OF TECHNOLOGY
LEXINGTON, MASSACHUSETTS
Project ReportATC-385
Evaluation of Consolidated Storm Prediction for Aviation (CoSPA) 0–8 Hour
Convective Weather Forecast Using the Airspace Flow Program Blockage-based
Capacity Forecast (“The Matrix”)
R.A. DeLauraY-H. Lin
R.K. JordanJ.C. VenutiJ.E. Evans
9 November 2011
Prepared for the Federal Aviation Administration,
Washington, D.C. 20591
This document is available to the public through the National Technical Information Service,
Springfield, Virginia 22161

This document is disseminated under the sponsorship of the Department of
Transportation, Federal Aviation Administration, in the interest of information exchange. The United States Government assumes no liability for its contents or use thereof.

17. Key Words 18. Distribution Statement
19. Security Classif. (of this report) 20. Security Classif. (of this page) 21. No. of Pages 22. Price
TECHNICAL REPORT STANDARD TITLE PAGE
1. Report No. 2. Government Accession No. 3. Recipient's Catalog No.
4. Title and Subtitle 5. Report Date
6. Performing Organization Code
7. Author(s) 8. Performing Organization Report No.
9. Performing Organization Name and Address 10. Work Unit No. (TRAIS)
11. Contract or Grant No.
12. Sponsoring Agency Name and Address 13. Type of Report and Period Covered
14. Sponsoring Agency Code
15. Supplementary Notes
16. Abstract
Unclassified Unclassified 70
FORM DOT F 1700.7 (8-72) Reproduction of completed page authorized
R.A. DeLaura. Y-H. Lin, R.K. Jordan, J.C. Venuti, and J.E. Evans
MIT Lincoln Laboratory 244 Wood Street Lexington, MA 02420-9108
This report is based on studies performed at Lincoln Laboratory, a federally funded research and development center operated by Massachusetts Institute of Technology, under Air Force Contract FA8721-05-C-0002.
This document is available to the public through the National Technical Information Service, Springfield, VA 22161.
ATC-385
Evaluation of Consolidated Storm Prediction for Aviation (CoSPA) 0–8 Hour Convective Weather Forecast Using the Airspace Flow Program Blockage-based Capacity Forecast (“The Matrix”)
Department of Transportation Federal Aviation Administration 800 Independence Ave., S.W. Washington, DC 20591
Project Report
ATC-385
9 November 2011
The CoSPA 0–8 hour convective weather forecast provides deterministic forecast products that can be used by strategic traffic management planners, and can be readily translated into forecasts of aviation capacity impacts for use in automated decision support tools. An operational CoSPA prototype was evaluated at several FAA Air Traffic Control facilities during the summer of 2010. As part of this evaluation, CoSPA forecasts were translated into forecasts of capacity impacts on traffic flows through two Flow Constrained Areas (FCAA05 and FCAA08) commonly used to control arrival traffic into the highly congested northeastern United States. This report describes an objective and operationally relevant evaluation of the accuracy of CoSPA-based forecasts of FCA capacity.
FA8721-05-C-0002

This page intentionally left blank.

iii
EXECUTIVE SUMMARY
Key NextGen concepts, such as Trajectory Based Operations (TBO) and improved Collaborative Air Traffic Management (CATM), rely on long forecast horizons (2–8 hours or more) for both traffic demand and weather impacts to improve strategic planning. Flow Constrained Areas (FCA), airspace regions where severe weather or traffic congestion impacts are anticipated, provide a mechanism that will be used in early and mid-term NextGen by traffic managers to control traffic flows and to keep en route demand and capacity in balance. The Airspace Flow Program (AFP) is a traffic management initiative (TMI), currently used in the National Airspace System (NAS), that allows planners to manage traffic flows across predefined FCA boundaries that traverse critical regions of airspace, such as the eastbound arrival flows to the northeastern US.
Strategic planning during periods of convection is particularly challenging, due to the high degree of uncertainty in forecasting convection and the difficulty in translating thunderstorms into air traffic impacts. The CoSPA 0–8 hour convective weather forecast, which provides deterministic forecasts of Vertically Integrated Liquid (VIL) and echo top height that can be directly translated into measures of convective weather impacts, was deployed as an operational prototype and evaluated by a number of ATC facilities in the summer of 2010. In addition, a shadow system translated the CoSPA weather forecasts into forecasts of impacts on traffic flows across the FCAs associated with the most commonly used AFPs: FCAA05 (controlling eastbound flows through the Cleveland Air Route Traffic Control Center [ARTCC] to Boston, New York, Philadelphia and Washington, DC), and FCAA08 (northbound traffic to the same destinations through the Washington ARTCC).
FCA capacity forecasts from this system, known as “the Matrix,” were compared to “true” impacts (calculated from observed weather) for approximately 15,000 Matrix forecasts in June, July, and August, and the technical performance of the Matrix was determined. Since the Matrix forecasts are largely dependent on the CoSPA forecast, the Matrix performance results provide an operationally relevant forecast scoring metric for CoSPA. In addition to the forecast performance statistical analysis, a model was developed to reduce Matrix forecast errors and predict Matrix forecast error bounds in real time. Finally, several case studies were conducted, in which CoSPA and Matrix forecasts, operational decisions, and observed weather impacts on air traffic were analyzed to determine the potential utility of the Matrix for AFP decision support.
Overall, Matrix capacity forecasts were fairly accurate. The median error for Matrix forecasts of “light impact” (capacity ranging between 81% and 100% of fair weather capacity) was near 0, and 80% of forecast errors (forecast capacity–true capacity) fell in the interval between –5% (underestimation of capacity) and +15% (overestimation of capacity). A relatively
iv
small number of light impact forecasts (<10%) had significant capacity overestimation errors due to the occasional inability of CoSPA to forecast the onset of convection.
The median error for moderate impact FCA capacity forecasts (41%–80% capacity) was approximately –10%, indicating a bias toward capacity underestimation, due to a tendency to overestimate convective growth once convection appears in the forecast. The bias was slightly more evident in the 3–5 hour forecast horizons, and forecast volatility (the tendency of capacity forecasts for a given future valid time to change as CoSPA forecast updates are received) was also greatest during these forecast horizons. The 80% error envelope for moderate impact forecasts was approximately –25% to +20%, and the error envelope was fairly constant for forecast horizons from 7 to 3 hours. The behavior of the heavy impact forecasts (0%–40% capacity) was similar; the bias and 80% envelope ranges were slightly greater than those for moderate impact forecasts, but this result may be due in part to the much smaller number of heavy impact forecasts. Forecast errors for the northern and southern halves of the FCAA05 AFP showed similar behavior; although the error range was slightly larger, the behavior suggests that the Matrix can be scaled to smaller FCAs.
CoSPA implicitly generates time ensemble forecasts in that there are a number of different forecasts for a fixed valid time. An innovative model was developed to use the time ensemble results to provide an improved FCA capacity estimate as well as real time error bounds. The model virtually eliminated the Matrix capacity forecast bias and reduced the range of the 80% error envelope for all impact levels. The model can also be extended to predict the Matrix error bounds of individual forecasts, although this work was not completed by publication time.
Several case studies were analyzed to determine the potential operational value of the Matrix. Since the Matrix provides a single, easily understood capacity forecast metric, trends in impact forecast severity and volatility could be readily identified. In some cases, the Matrix provides insights into forecast trends that are not readily discernable by scrutinizing CoSPA forecast images. However, other forecast characteristics, such as storm organization, location, and extent, are lost in the Matrix. The combination of the Matrix and visualization of time-lagged CoSPA ensemble forecasts (displays of successive CoSPA forecasts all valid at the same future time) show complementary views of forecasts and forecast uncertainty that can guide planners in managing TMIs and weather avoiding reroutes. The case studies also highlighted the need for tactical decision support when rapidly evolving, difficult to forecast thunderstorms impact either the FCA airspace or downstream arrival airspace, just beyond the FCA.
The report concludes with four recommendations for follow-on work:
1. continued improvement in the CoSPA and Matrix forecasts to address the primary deficiencies identified in this report and the 2010 CoSPA evaluation (missed convective

v
initiation, overestimation of growth in forecast convection, and volatility in forecasts, particularly in the 3–5 hour forecast horizon),
2. evaluation of the utility of the Matrix and time-lagged CoSPA ensemble visualizations in actual operational traffic flow management planning,
3. development of operational concept and tools to support the transition from strategic to tactical planning, and
4. assessment of the utility of other weather forecast products in reducing the errors and uncertainty in Matrix forecasts.

This page intentionally left blank.

vii
TABLE OF CONTENTS
Page
Executive Summary iii List of Illustrations ix
1. OVERVIEW 1
2. GENERATION OF FCA THROUGHPUT FORECASTS 7
3. ANALYSIS OF MATRIX FORECAST ACCURACY 11
4. MODELING AND REDUCING AFP CAPACITY FORECAST ERROR 27
5. ASSESSING THE POTENTIAL OPERATIONAL UTILITY OF THE MATRIX VIA CASE STUDIES 33
6. SUMMARY 47
7. RECOMMENDATIONS FOR FUTURE WORK 51
Glossary 55 References 57

This page intentionally left blank.
ix
LIST OF ILLUSTRATIONS
Figure Page No.
1 Definitions of FCAA05 and FCAA08, both used to manage en route traffic inbound to Boston, New York, Philadelphia, and Washington, DC metro airports. 2
2 Illustration of the capacity Matrix output. 4
3 Illustration of the adapted RAPT route blockage algorithm used in the Matrix capacity forecast. 8
4 Matrix capacity forecast algorithm. 9
5 Jet routes crossing FCAA05 and FCAA08 that carry traffic inbound to east coast airports. 9
6 Illustration of the sequence of CoSPA forecasts needed to calculate a route blockage. 10
7 Distribution of Matrix capacity forecasts by impact range. The figure at right is an expanded view of the distribution of just the moderate and high impact forecasts. 12
8 Illustration of missed convective initiation in the CoSPA forecast. 13
9 Illustration of CoSPA overestimation of storm growth. 14
10 Histogram showing the number of Matrix forecast transitions that resulted in changes (increase/decreases in capacity) from one capacity impact range (none, low, moderate, high) to another. 15
11 Illustration of CoSPA and Matrix forecast volatility due to overestimation of convective growth once convection is initiated. 16
12 Comparison of Matrix capacity forecast error for different FCA boundaries. 17
13 Matrix capacity forecast errors for forecasts of light and no impact. 18
14 Matrix capacity forecast errors for forecasts of moderate impact. 19
15 Matrix capacity forecast errors for forecasts of heavy impact. 20
16 Illustration of the forecast volatility metric. 21

LIST OF ILLUSTRATIONS (Continued)
Figure No. Page
x
17 Probability of volatility in forecasts as a function of degree of impact forecast. 22
18 Histogram of Matrix capacity forecast accuracy when forecasting capacity impact ranges. 23
19 Comparison of the volatility of the capacity forecast algorithm at the FCA and route spatial scales. 24
20 Comparison of Matrix capacity forecast errors for the full FCAA05 boundary, and the northern and southern halves. 25
21 Illustration of the random forest algorithm applied to the Matrix capacity forecast. 28
22 Removal of bias and reduction of error in moderate (41–80% capacity) impact Matrix capacity forecasts, resulting from the application of the random forest regression model. 29
23 Removal of bias and reduction of error in heavy (0–40% capacity) impact Matrix capacity forecasts, resulting from the application of the random forest regression model. 30
24 Results of impact severity forecasts for heavy, moderate, and light predictions. 31
25 Weather and traffic flow on July 20, 2010. Note the arrival traffic (red arrows in white circle in the upper right) deviating across departure traffic (white arrows) to avoid weather. 34
26 Time-lagged CoSPA forecast ensemble images, truth, and FCAA08 Matrix valid for 19Z on July 20, 2010. 35
27 Time-lagged forecast ensemble images, truth, and FCAA08 Matrix valid for 22Z on July 20, 2010. 36
28 Weather and traffic at 21Z on August 4, 2010. 38
29 Time-lagged forecast ensemble images, truth, and split FCAA05 Matrix valid for 21Z on August 4, 2010. 39
30 Weather and traffic at 21Z on August 5, 2010, and 00Z on August 6, 2010. 40

LIST OF ILLUSTRATIONS (Continued)
Figure No. Page
xi
31 Time-lagged forecast ensemble images, truth, and FCAA08 Matrix valid for 21Z on August 5, 2010. 42
32 Time-lagged forecast ensemble images, truth, and FCAA08 Matrix valid for 00Z on August 6, 2010. 43
33 Traffic and weather at 1930Z and 2345Z on July 19, 2010. 45
34 CoSPA forecasts valid at 20Z, shortly after the onset of severe impacts in the New York arrival airspace resulted in extensive holding of New York arrivals to the west and in the TRACON (white circles). 46
35 Matrix baseline and to-do list developed for 2010 evaluation. 51

This page intentionally left blank.

1
1. OVERVIEW
Key NextGen concepts, such as Trajectory Based Operations (TBO) and improved Collaborative Air Traffic Management (CATM), are based on an assumption that detailed information about potential convective weather impacts all along a planned flight trajectory will be available from preflight planning up to final approach. Flow Constrained Areas (FCA) that quantitatively characterize the capacity impact associated with forecast convective weather impacts will be made available to both flight planners and air traffic managers, who can use this information to develop and implement weather impact mitigation plans [1, 2]. FCAs are used to manage congestion in today’s largely manual system via Airspace Flow Programs (AFPs) and are a key element of emerging concepts for collaborative congestion resolution, such as the Collaborative Trajectory Options Program (CTOP).
This report presents the results of analyzing the performance of an FCA capacity forecast derived from the CoSPA forecasts through quantitative analysis based on measured weather data and case studies. The performance results described here are germane to
1. quantitatively characterizing the accuracy and uncertainty in the CoSPA forecasts, and 2. assessing the possible operational utility of CoSPA derived FCA capacity forecasts to
improve NAS operational decision making during convective weather.
Background
AFPs were operationally deployed in the NAS in June, 2006 and are currently in use. Figure 1 shows the most commonly used AFPs in the NAS with the associated FCAs. The FCAs shown control arrival traffic into the northeast and Washington airports so as to reduce the frequency of arrivals deviating into departure airspace, which can lead to disruption and closing of departure flows, hence causing gridlock at the major Northeast airports.

2
Figure 1. Definitions of FCAA05 and FCAA08, both used to manage en route traffic inbound to Boston, New York, Philadelphia, and Washington, DC metro airports.
Currently, AFPs function similarly to Ground Delay Programs (GDPs): aircraft are delayed prior to departure to meet TFM objectives, and CDM principles are used to allocate delay equitably. However, AFPs differ from GDPs in that the constrained resource is not an airport but an FCA.
To implement an AFP, traffic managers at the Federal Aviation Administration (FAA) Air Traffic Control System Command Center first define the FCA, which can be any capacity-constrained NAS resource, such as a fix, sector, or arbitrary region of airspace. Traffic managers can then filter the FCA to only include certain aircraft, as desired; available filters include arrival/departure airports and Air Route Traffic Control Centers (ARTCCs), minimum/maximum altitudes, and aircraft categories (jet, prop, turboprop). Once an FCA is defined, TFMS data are used to identify flights planning to transit the FCA. Using the Flight Schedule Monitor (FSM), FCA “arrival” slots are generated at a rate that matches the predicted capacity of the FCA, leaving an appropriate number of slots for predicted “pop-up” traffic (i.e., unknown traffic at the time of AFP implementation). Customers have the option to reroute around AFPs, trading ground delay for airborne delay.
Since AFPs are intended as strategic traffic management initiatives that seek to control demand prior to take off, extended (0–8 hours or more) convective weather forecasts, such as

3
CCFP, LAMP, and CoSPA, are key inputs to the FCA capacity specification. However, there is significant uncertainty in the prediction of convective weather on scales that are meaningful to air traffic operations in the traffic flow planning time horizons (2 to 8 hours). An objective model to translate the weather forecasts into FCA capacity forecasts and to translate weather forecast uncertainty into capacity forecast uncertainty is needed to guide traffic planners in determining how aggressively to respond to forecast information. However, modeling uncertainty in long range convective weather forecasts is difficult; even defining uncertainty in meaningful operational terms poses significant challenges.
In addition to the problem of expressing and managing forecast uncertainty, there is the challenge of translating forecast weather inputs into FCA flow rates. This manual translation is a complex process, which is made even more difficult when one must consider the uncertainty inherent in the forecasts. These subjective estimates of weather impacts are highly dependent on the judgment of the individual making the estimate, and capacity estimates may vary significantly and inconsistently according to the judgment of different individuals, particularly if there is no objective estimate against which the traffic manager can calibrate his or her evaluation. The lack of an objective estimate of weather impacts to the capacity of an FCA makes it difficult to plan traffic management initiatives, including obtaining consensus between various FAA facilities and the customers on the need and extent of an AFP. Objective capacity metrics are also needed to evaluate the operational effectiveness of an AFP, both during operations and in next-day analyses. Studies of AFP use have shown that AFPs shown in Figure 1 are often put in much later than is desirable [3, 4] and, that on many occasions, the AFPs have not been effective in sufficiently reducing the arrival demand.
Focus of This Report
This report describes the use of an FCA route-blockage based capacity forecast that is a candidate as a decision support tool for AFP decision making as well as a tool to evaluate and characterize uncertainty in the CoSPA convective weather forecast [5]. The weather impact translation to ATM impact model presented here provides an objective measure of the capacity of an FCA that is associated with an AFP, estimated as a percentage of “unimpacted” capacity (FCA capacity in the absence of weather). The capacity forecasts are derived from the application of the RAPT route blockage algorithm [6] to Weather Avoidance Fields (WAF) [7, 8], calculated from CoSPA VIL and echo tops forecasts. The evaluation and modeling of the capacity forecast uncertainty is a far simpler task than modeling uncertainty of the weather forecasts themselves. While the capacity forecast uncertainty is an indirect and somewhat incomplete proxy for weather forecast uncertainty, it is, nonetheless, an operationally meaningful one, and the analysis of the capacity forecast behavior provides valuable insights into the characteristics and degree of weather forecast uncertainty that are meaningful to operational planners.

4
Since the capacity forecast provides an automated translation of weather forecasts into operationally meaningful measures of weather-impacted capacity, it also addresses the traffic planner’s need for an objective forecast of impacts that can improve decision making. The quantitative estimates of FCA capacity are presented as a matrix, where the rows represent a forecast issued at a particular time, and the columns represent the sequence of forecasts valid at a particular time (Figure 2). Both the forecasts and the display format will be referred to as the “Matrix” in the subsequent discussion.
Figure 2. Illustration of the capacity Matrix output.
We focus on an analysis of convective weather impact forecasts on traffic crossing the two Flow Program (AFP) boundaries shown in Figure 1: FCAA05 (eastbound traffic crossing the western boundary of the Cleveland ARTCC) and FCAA08 (northbound traffic passing through the Washington, DC ARTCC), based on the use of the quantitative objective estimates of the FCA capacity derived from the CoSPA forecast. These FCAs are the most frequently used AFPs during the convective season [3, 4].
Truth, 1 – 7 hour forecasts issued at 18Z
Successive forecasts, truth valid at 20Z
Grid box color indicates capacities:Green = truthOrange = high impact (0-40% capacity)Yellow = moderate impact (41-80% capacity)White = low / no impact(81-100% capacity)

5
This report is presented in the following five sections. First, the Matrix algorithm is described in section 2. Next, the analysis of Matrix forecast accuracy is presented and sources of error are identified. An objective error model, which can be used in real time to reduce Matrix forecast error and to estimate the Matrix forecast error bounds is described in section 3. Section 4 presents several case studies that provide insights into ways that the Matrix forecast may be used in traffic planning and decision making, and that illustrate some of the potential difficulties that arise due to uncertainties in both the CoSPA and Matrix forecasts. A summary is presented in section 5; recommendations for future work are presented in section 6. Although this study considers only the FCAA05 and FCAA08s, the methods may be adapted to any arbitrary FCA boundary with a similar scale and route structure traversing it.

This page intentionally left blank.

7
2. GENERATION OF FCA THROUGHPUT FORECASTS
FCA capacity forecasts, expressed as a percentage (0–100) of fair weather capacity, were calculated every fifteen minutes throughout the summer of 2010 based on the CoSPA VIL and echo tops forecasts. “True” capacities were also calculated, based on the observed CoSPA VIL and echo tops.
In order to calculate FCA capacity, VIL and echo top forecasts from CoSPA [5] are first translated into WAF forecasts using the en route Convective Weather Avoidance Model (CWAM) [7, 8]. Blockages on each route traversing the FCA boundary are then calculated from the WAF, using the RAPT route blockage algorithm [6]. Previous research has shown that
1. sector capacity estimates based on the RAPT route blockage algorithm are reasonably good [9], and
2. the FCA throughputs computed using actual weather agree well with actual traffic flow through an FCA [3, 4].
Furthermore, operational experience with WAF-based route blockage in the RAPT operational prototype since 2008 has shown that route blockage (expressed as a percentage, with 0 indicating that the route is completely closed, and 100 indicating that the route is completely free of weather impact) is both operationally realistic and useful [10].
The operational RAPT route blockage algorithm was modified slightly to reduce its sensitivity to small details of the CoSPA forecast. Point blockages are calculated within a box centered at each trajectory point along these routes. The length of the box is approximately two minutes of flight time, and the width is 40 km. The point blockage is a number between 0 and 100 that indicates to what degree the route is blocked by weather (0 indicates completely blocked; 100 indicates no weather), and is calculated using the same algorithm used in RAPT. Unlike operational RAPT, which simply sets the route blockage to the maximum of all point blockages along the route, the Matrix assigns route blockage by applying a 5-point moving average of blockage at each trajectory point and taking the 90th percentile of all trajectory point blockages (Figure 3).

8
Figure 3. Illustration of the adapted RAPT route blockage algorithm used in the Matrix capacity forecast.
After the individual route blockages are calculated, they are aggregated into a single FCA blockage. Three aggregation options were considered: simple average, traffic weighted average based on daily route demand, and time-based traffic weighted average. Since the primary focus of this study was the accuracy and behavior of the weather and weather impact forecasts, a simple average was used; the inclusion of traffic demand in the AFP capacity forecast would have resulted in FCA forecast behaviors that were influenced both by weather and traffic demand forecasts. The final step is calculation of FCA capacity from FCA blockage; capacity is defined as simply (100 minus blockage). Capacity forecasts and truth are then rounded to the nearest 10. Figure 4 summarizes the Matrix capacity forecast algorithm.
40 km, (algorithm parameter)
FCA-Crossing Route
Aircraft location(1 minute spacing)
Point blockage calculation box(aircraft at center)
25 km(algorithm parameter)
Point blockage = average of 5 blockages
Route blockage = 90th percentile of all point blockages in route

9
Figure 4. Matrix capacity forecast algorithm.
Figure 5 illustrates the routes through the FCAA05 and FCAA08 boundaries, which carry arrival traffic to the Northeast major airports (principally, the New York airports, Boston Logan Airport [BOS], Philadelphia International Airport [PHL], and the Washington, DC airports). For AFP FCAA05, these routes are J16, J106, J70, J554, J190, J584, J146, J82, J34, J162, J152, and J30. For FCAA08, we use J8, J24, J147, J42, J51, J14, J52, J165, J40, J55, J191, and J121. We only consider the portion of each route near the relevant boundary, starting from a flight time of 15 minutes before reaching the boundary to 30 minutes after (assuming a speed of 850 km/h). A route therefore normally consists of 46 trajectory points. The operational FCAA05 boundary (shown in Figure 1) has been modified to ensure that the eastbound routes extend into New York arrival airspace.
Figure 5. Jet routes crossing FCAA05 and FCAA08 that carry traffic inbound to east coast airports.
CoSPA 0-8 hour forecasts(VIL, echo tops)
Weather avoidance field (WAF)
RAPT route blockage
Route blockage aggregation into AFP
FCAA05 FCAA08
To Boston
To New York
To Philadelphia
To DC
To DC
To New York, Philadelphia
To Boston

10
In order to calculate blockage along the trajectories passing through the FCA boundary, four time-lagged CoSPA forecasts are required, with the “valid time” of the blockage forecast corresponding to the time at which the flight would cross the FCA boundary. For example, the blockage forecast valid at 1900Z will include CoSPA forecasts from 1845Z, 1900Z, 1915Z, and 1930Z. Since the CoSPA forecast extends for 8 hours, FCA blockage forecasts can only be issued out to 7 hours (Figure 6).
Figure 6. Illustration of the sequence of CoSPA forecasts needed to calculate a route blockage.
FCA capacities are represented in the matrix described in the previous section, and illustrated in Figure 2. Forecast cells with a forecast value greater than 80 are colored white; cells with a forecast value between 40 and 80 are yellow; forecast values less than 40 are colored orange. The truth values on the diagonal are colored green. The color/impact thresholds chosen for this study represent our best initial determination of operationally significant impact levels, based on experience with RAPT. The need to define impact thresholds and the choice of threshold values is a topic for future research into the operational use of the Matrix. The same is true of the graphical Matrix presentation used here; further research will determine the form of the operational user interface.
Forecast times contributing to forecast valid at 19Z
AFP crossing at 19Z
1845Z 1900Z 1915Z 1930Z

11
3. ANALYSIS OF MATRIX FORECAST ACCURACY
The Matrix forecast was evaluated in terms of accuracy, volatility, and operational usability. Accuracy refers to whether the forecasts match the truth (i.e., capacity forecast using actual weather); volatility refers to the variation of forecast values as CoSPA forecast updates occur (variability among time-lagged CoSPA forecasts with the same valid time); operational usability refers to whether the Matrix forecasts can be useful for decision support in an air traffic control operational environment. This section presents an analysis of statistics measuring accuracy and volatility, and a qualitative comparison of forecast images to capacity forecasts was made in an effort to identify forecast characteristics that had the greatest impact on AFP capacity. In section 4, we analyze some cases to assess potential operational suitability.
Since the FCA capacity forecasts are derived directly from the CoSPA forecasts, the Matrix provides a way to evaluate the performance of CoSPA that is coupled to specific traffic management requirements. The evaluation data set consists of more than 15,000 capacity forecasts for FCAA05 and FCAA08 from all the days in June, July, and August 2010, excluding times when CoSPA was down.
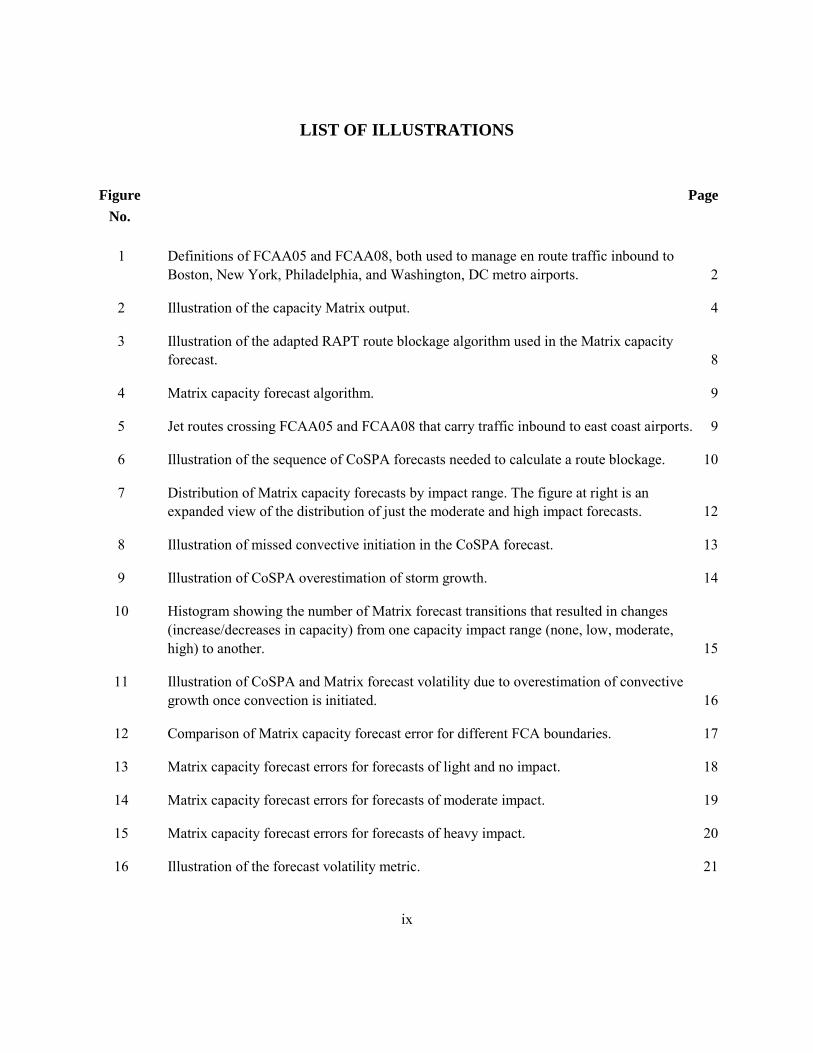
Figure 7 shows the percentage of capacity forecasts falling into each of four different ranges as a function of forecast horizon: 0–40% (high impact), 41–80% (moderate impact), 81–99% (light impact), and 100% (no impact). Overall, the longer range Matrix forecasts (5–7 hours) tended to overestimate capacity (i.e., they underestimated weather impacts), while shorter range forecasts (1–4 hours) tended to underestimate capacity (overestimate weather impacts), compared to the truth. These statistics are consistent with the findings of a recent evaluation of CoSPA forecast performance [11]: CoSPA tends to miss or underestimate convective initiation, and so frequently misses storms (Figure 8). However, forecasted storms tend to be overdeveloped, both in intensity and area, leading to overestimating weather impact (underestimating capacity) for forecasted storms (Figure 9).

12
Figure 7. Distribution of Matrix capacity forecasts by impact range. The figure at right is an expanded view of the distribution of just the moderate and high impact forecasts.
Number of forecasts in each capacity range(by forecast horizon)
Bar color indicates true impact:Orange = high impact (0-40% capacity)Yellow = moderate impact (41-80% capacity)Green = low impact (81-99% capacity)White = no impact(100% capacity)
13
Figure 8. Illustration of missed convective initiation in the CoSPA forecast.
Issue: 20Z Valid 02Z Issue: 22Z Valid 02Z Issue: 00Z Valid 02Z Truth 0145Z
Echo tops
VIL
Key:EWR, LGA, JFK departuresEWR, LGA, JFK arrivalsPHL departuresPHL arrivalsBOS, DC traffic
July 21, 2010

14
Figure 9. Illustration of CoSPA overestimation of storm growth.
Figure 10 shows the number of times a forecast update resulted in a change (increase or decrease) in forecast capacity from one range to another, again as a function of the forecast horizon. The large spike in decreasing forecast capacities at the transition between the 5 and 4 hour forecasts, along with a similar but less-pronounced tendency evident in the neighboring transitions (6 to 5 hour and 4 to 3 hour) suggests a potential overemphasis of convective growth in this range of CoSPA forecast horizons (3–5 hours). This overemphasis was particularly evident in the echo tops forecast, which contributes significantly to the WAF that underlies the Matrix capacity forecast algorithm. The CoSPA forecast images shown in Figure 11 illustrate forecast volatility as a result of an overly aggressive storm growth forecast.
Issue: 13Z Valid 19Z Issue: 15Z Valid 19Z
August 5, 2010
Truth 19Z
Key:EWR, LGA, JFK departuresEWR, LGA, JFK arrivalsPHL departuresPHL arrivalsBOS, DC traffic
Echo tops
VIL

15
Figure 10. Histogram showing the number of Matrix forecast transitions that resulted in changes (increase/decreases in capacity) from one capacity impact range (none, low, moderate, high) to another.

16
Figure 11. Illustration of CoSPA and Matrix forecast volatility due to overestimation of convective growth once convection is initiated.
Figures 12 through 15 provide a more detailed look at Matrix forecast performance. These plots give the distribution of forecast error (forecast–true capacity), in deciles, as a function of forecast horizon, for different subsets of the Matrix forecast dataset. The outer pair of dotted lines defines the error range in which 80% of all forecasts fall; the inner dotted line is the median error.
Figure 12 compares the error of all forecasts (both FCAA05 and FCAA08) with capacity less than 100% to forecast error for each FCA individually. Since the Matrix is dependent on the definition of routes in the FCA airspace (in particular the number and geographic distribution of routes), this comparison is necessary to ensure that the Matrix site adaptation and route blockage and blockage aggregation algorithms are not overtuned to the details of the underlying airspace of either FCA. The magnitudes and characteristics of the forecast error from each FCA are similar; the median errors are close to 0 for both FCAA05 and FCAA08, and “error envelopes” that bound 80% of the forecasts range from approximately –10% to +15% for both FCAs. This suggests that the Matrix forecast is sufficiently general that its performance is consistent for both FCAs. Unless otherwise noted, the remainder of the analysis combines data from both FCAs.
FCAA08
June 6, 2010
Issue: 18Z Valid 01Z Issue: 21Z Valid 01ZTruth 01Z

17
Figure 12. Comparison of Matrix capacity forecast error for different FCA boundaries.
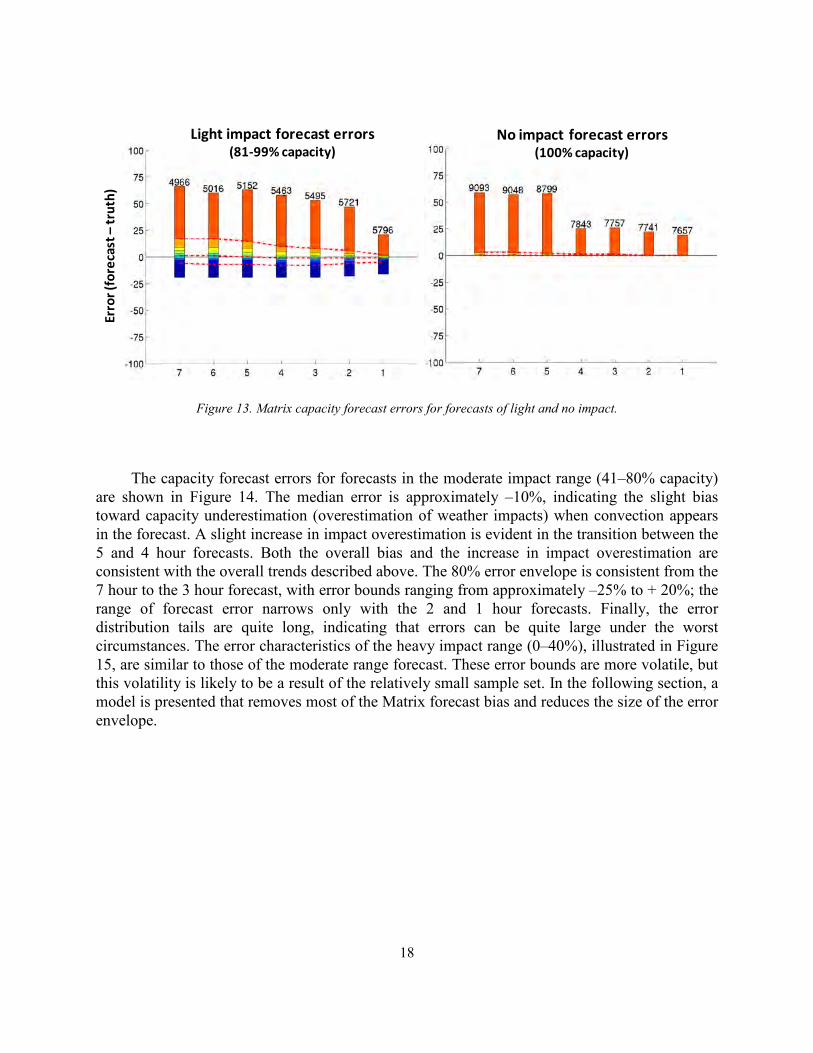
Figure 13 shows error for forecasts of light impacts (81–99% capacity) and no impacts (100% capacity). The median error is very close to 0, and the error envelope for the low impact forecasts ranges from approximately –5% (underestimation of capacity) to +15% (overestimation). The error envelope decreases as the forecast horizon shortens, as expected. Note the “long tail” of the error distribution (the orange blocks representing the largest 10% forecast errors―in this case underestimation of weather impacts), which represents the low impact forecasts with significant error due to missed convective initiation. Light impact forecasts significantly underestimate the weather impact (error greater than 15%) about 10% of the time. The frequency of no impact forecast errors as large as 15% is well less than 10%.
All forecasts FCAA05 forecasts FCAA08 forecasts
Erro
r (fo
reca
st –
trut
h)
Forecast horizon (hours)
Key:
Capacity overestimation(underestimation of impact)
Capacity underestimation(overestimation of impact)
Number of forecasts
10th percentile error 90th percentile error
median error
Error deciles
Matrix Capacity Forecast Error
18
Figure 13. Matrix capacity forecast errors for forecasts of light and no impact.
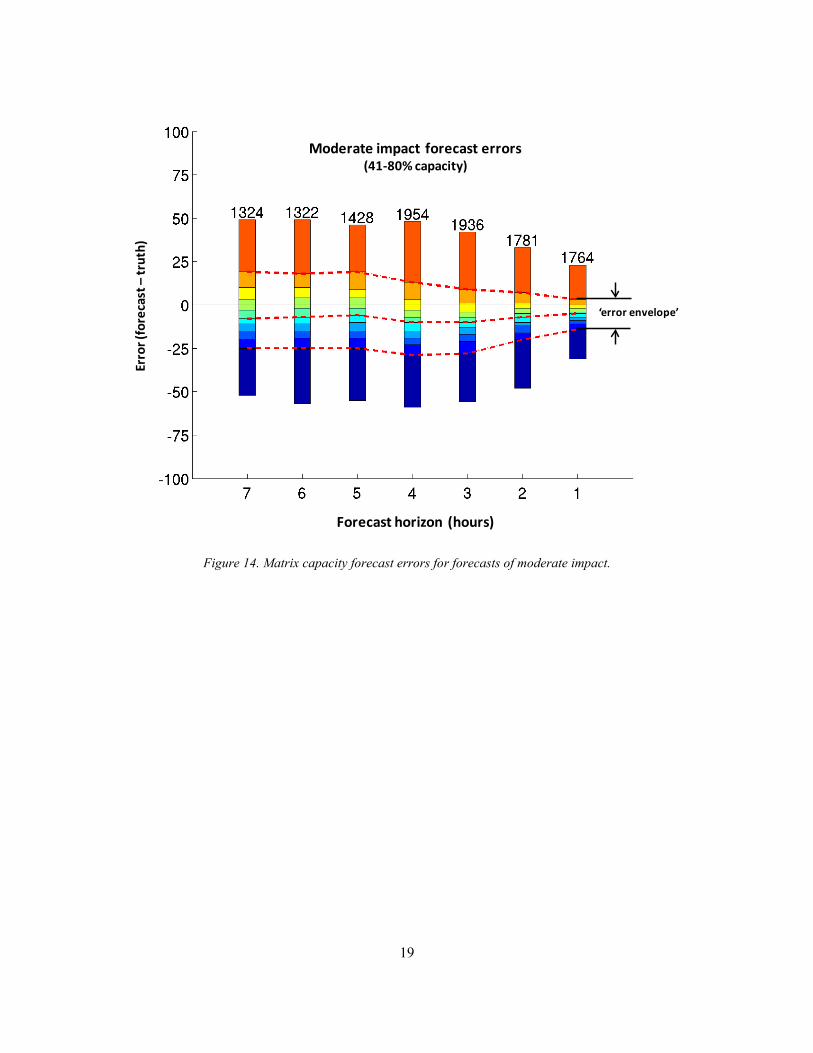
The capacity forecast errors for forecasts in the moderate impact range (41–80% capacity) are shown in Figure 14. The median error is approximately –10%, indicating the slight bias toward capacity underestimation (overestimation of weather impacts) when convection appears in the forecast. A slight increase in impact overestimation is evident in the transition between the 5 and 4 hour forecasts. Both the overall bias and the increase in impact overestimation are consistent with the overall trends described above. The 80% error envelope is consistent from the 7 hour to the 3 hour forecast, with error bounds ranging from approximately –25% to + 20%; the range of forecast error narrows only with the 2 and 1 hour forecasts. Finally, the error distribution tails are quite long, indicating that errors can be quite large under the worst circumstances. The error characteristics of the heavy impact range (0–40%), illustrated in Figure 15, are similar to those of the moderate range forecast. These error bounds are more volatile, but this volatility is likely to be a result of the relatively small sample set. In the following section, a model is presented that removes most of the Matrix forecast bias and reduces the size of the error envelope.
Light impact forecast errors(81-99% capacity)
No impact forecast errors(100% capacity)
Erro
r (fo
reca
st –
trut
h)
19
Figure 14. Matrix capacity forecast errors for forecasts of moderate impact.
‘error envelope’
Moderate impact forecast errors(41-80% capacity)
Erro
r (fo
reca
st –
trut
h)
Forecast horizon (hours)

20
Figure 15. Matrix capacity forecast errors for forecasts of heavy impact.
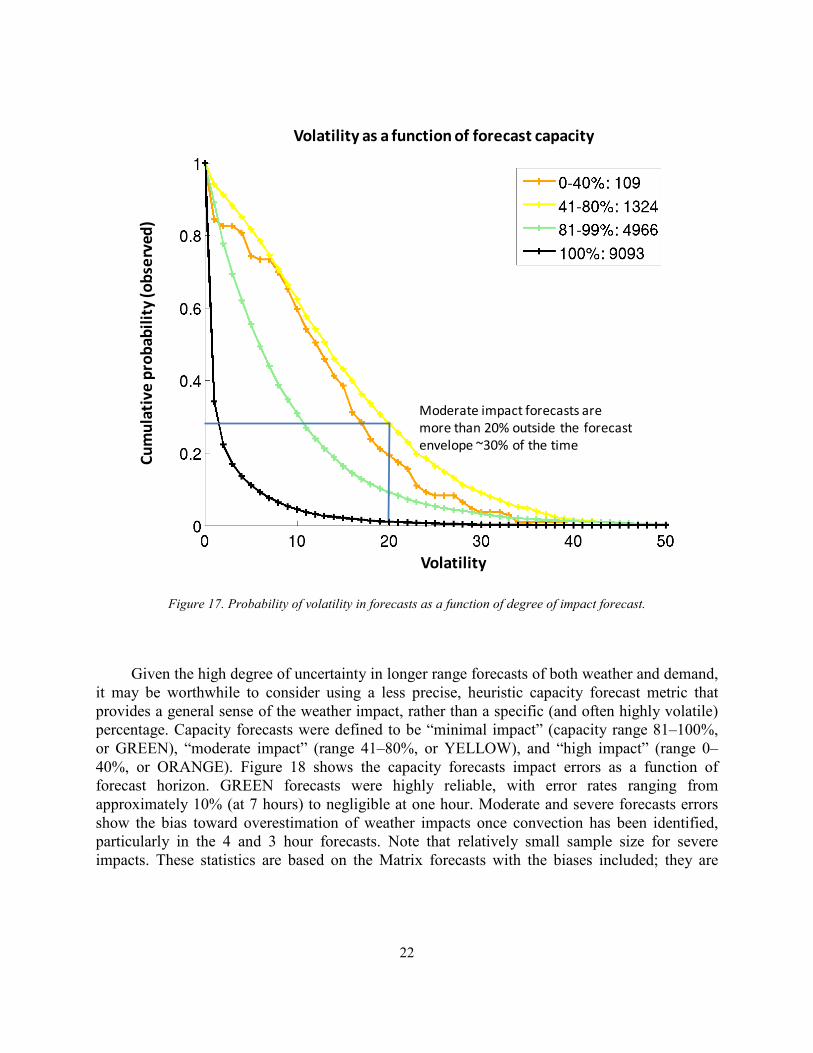
The volatility of the capacity forecast is also important to the operational decision maker. A highly volatile forecast that changes dramatically with forecast updates cannot be consistently correct and is of little value to the user since it cannot be determined when the forecast can be trusted. A measure of forecast volatility was created, in which the degree to which each forecast was an outlier was determined, based on its distance from the forecast envelope defined by the 7 hour forecast and the true capacity (Figure 16). The forecast volatility was calculated for all forecasts in each forecast impact interval (Figure 17). Forecasts of moderate impact (41–80% capacity) were outliers (more than 20% beyond the forecast envelope) 30% of the time, indicating that the moderate impact CoSPA and Matrix forecasts were rather volatile, more so than forecasts of impacts in the other ranges.
Heavy impact forecast errors(0-40% capacity)
Erro
r (fo
reca
st –
trut
h)
Forecast horizon (hours)

21
Figure 16. Illustration of the forecast volatility metric.
Forecast range
Forecasts within the forecast range have volatility = 0
Forecasts outside the forecast range are outliers with volatility = | forecast – range boundary |
| 96 – 80 | = 16
22
Figure 17. Probability of volatility in forecasts as a function of degree of impact forecast.
Given the high degree of uncertainty in longer range forecasts of both weather and demand, it may be worthwhile to consider using a less precise, heuristic capacity forecast metric that provides a general sense of the weather impact, rather than a specific (and often highly volatile) percentage. Capacity forecasts were defined to be “minimal impact” (capacity range 81–100%, or GREEN), “moderate impact” (range 41–80%, or YELLOW), and “high impact” (range 0–40%, or ORANGE). Figure 18 shows the capacity forecasts impact errors as a function of forecast horizon. GREEN forecasts were highly reliable, with error rates ranging from approximately 10% (at 7 hours) to negligible at one hour. Moderate and severe forecasts errors show the bias toward overestimation of weather impacts once convection has been identified, particularly in the 4 and 3 hour forecasts. Note that relatively small sample size for severe impacts. These statistics are based on the Matrix forecasts with the biases included; they are
Volatility
Cum
ulat
ive
prob
abili
ty (o
bser
ved)
Volatility as a function of forecast capacity
Moderate impact forecasts are more than 20% outside the forecast envelope ~30% of the time

23
compared to results based on the outputs of a bias-reduction model in the following section. The use of impact range forecasts in decision support tools will be based on the bias-corrected Matrix outputs described in the following section.
Figure 18. Histogram of Matrix capacity forecast accuracy when forecasting capacity impact ranges.
Finally, the Matrix forecast errors are also dependent on the scale of the region under consideration. FCA forecasts that aggregate several routes over a large area are likely to average out errors and forecast volatility. As the number of routes and area of airspace decreases, forecasts become more sensitive to smaller errors in the CoSPA forecast, and forecast uncertainty increases. Figure 19 illustrates the high degree of volatility and inaccuracy in the forecast of individual route blockages compared to the FCA blockage as a whole. However, as operational planning horizons shrink, forecasts of progressively smaller scales of airspace (for instance, traffic flows to an individual airport or TRACON corner post) are needed to guide traffic management planning. It is important for decision makers to know when a forecast is sufficiently accurate to support both strategic and tactical planning at progressively smaller scales.
Forecast Horizon
Coun
ts (T
rue
Occ
urre
nces
)
Heavy Impact Forecasts(0-40% capacity)
Moderate Impact Forecasts(41-80% capacity)
Little or No Impact Forecasts(81-100% capacity)
Accuracy of Forecasts by Degree of Impact
Bar color indicates ‘true’ impact:Orange = high impact (0-40% capacity)Yellow = moderate impact (41-80% capacity)Green = low / no impact (81-100% capacity)

24
Figure 19. Comparison of the volatility of the capacity forecast algorithm at the FCA and route spatial scales.
Traffic flows across FCAA05 can be divided into two halves: FCAA05 north, with Boston and New York arrival routes, and FCAA05 south, with metro Washington, DC and PHL arrival
5-hour forecast 4-hour forecast
CoSPA forecasts valid at 22Z
Individual route capacitiesJ191 (illustrated below)AFP aggregate capacity
Capacity Forecasts Valid at 22Z
J191
Forecast horizon (hours)
Capa
city
25
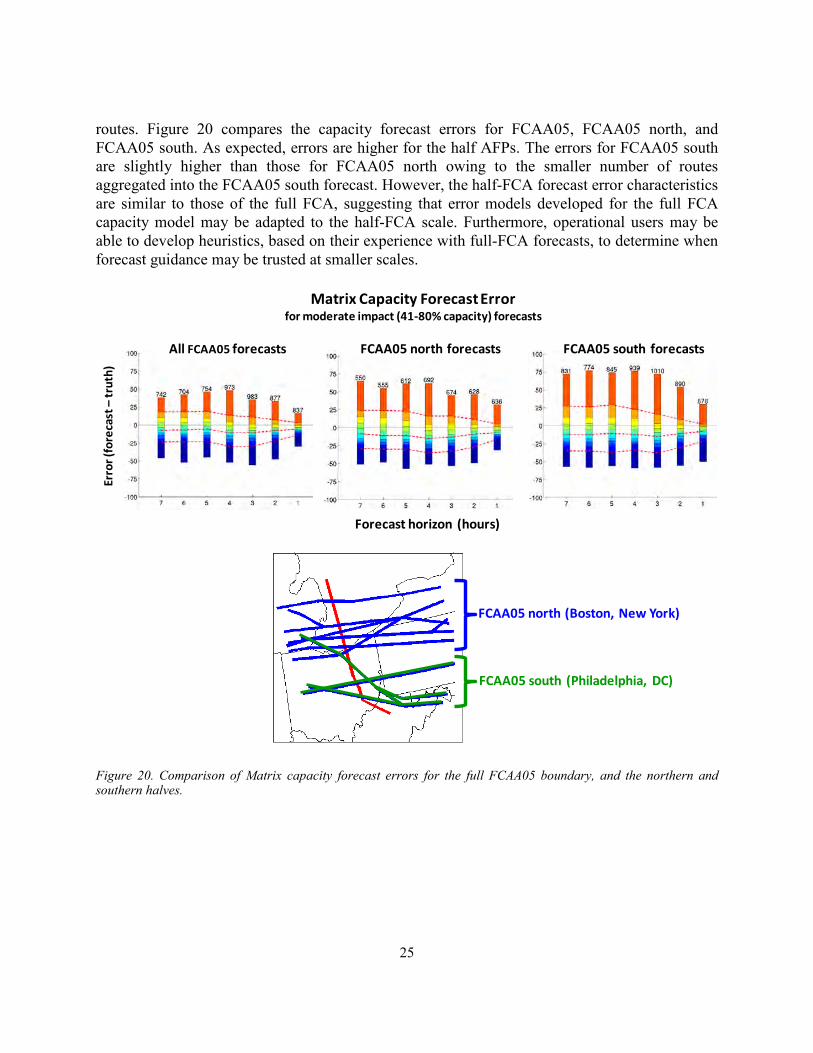
routes. Figure 20 compares the capacity forecast errors for FCAA05, FCAA05 north, and FCAA05 south. As expected, errors are higher for the half AFPs. The errors for FCAA05 south are slightly higher than those for FCAA05 north owing to the smaller number of routes aggregated into the FCAA05 south forecast. However, the half-FCA forecast error characteristics are similar to those of the full FCA, suggesting that error models developed for the full FCA capacity model may be adapted to the half-FCA scale. Furthermore, operational users may be able to develop heuristics, based on their experience with full-FCA forecasts, to determine when forecast guidance may be trusted at smaller scales.
Figure 20. Comparison of Matrix capacity forecast errors for the full FCAA05 boundary, and the northern and southern halves.
All FCAA05 forecasts FCAA05 north forecasts FCAA05 south forecasts
Erro
r (fo
reca
st –
trut
h)
Forecast horizon (hours)
Matrix Capacity Forecast Errorfor moderate impact (41-80% capacity) forecasts
FCAA05 north (Boston, New York)
FCAA05 south (Philadelphia, DC)

26
The statistical analysis of the Matrix capacity forecast errors may be summarized as follows:
1. On average, longer range forecasts (7–5 hours) tended to overestimate capacity (underestimate weather impacts), primarily due to missed convective initiation in the CoSPA forecast (somewhat less than 10% of all no- or low-impact forecasts).
2. When the CoSPA forecast initiates convection, resulting in capacity forecasts in the moderate (41–80% capacity) and high (0–40% capacity) impact ranges, the Matrix capacity forecast tended to underestimate capacity (i.e., overestimate weather impact). This tendency was most pronounced in the 5, 4, and 3 hour forecast horizons. The capacity underestimation bias was approximately 10% for moderate impact forecasts and close to 20% for high impact forecasts. Such known forecast bias can be removed from the forecast capacity before the results are presented to operational users (see the algorithm discussed in the next section).
3. Forecast error bounds, encompassing 80% of all forecasts, and forecast bias, were fairly consistent for all forecast horizons from 7 to 3 hours, although the forecast bias was slightly higher for the 4 and 3 hour forecasts.
4. Forecast volatility was greatest in the moderate impact forecasts and was most pronounced in the 5, 4, and 3 hour forecast horizons.
5. The Matrix capacity forecast scaled reasonably well to smaller aggregate flows in a “split” AFP (FCAA05 north and FCAA05 south) that may be used to support decision makers as they transition to more tactical modes of operations.
The FCA Matrix capacity forecast error statistics were in general agreement with the observations made in the CoSPA forecast field evaluation. The relationship between the CoSPA forecast and the Matrix capacity forecast, and their potential impacts on operational decision making will be examined in the case study descriptions in section 5.

27
4. MODELING AND REDUCING AFP CAPACITY FORECAST ERROR
Given the high degree of uncertainty inherent in convective weather forecasts in the planning time horizon (2–8 hours), FCA capacity forecast error estimates must be available to traffic managers during real time operations, as forecasts and decisions are being made. The forecast error model must be based on information that is objective, automated, and available at the time of forecast. There are several challenges in modeling the impact forecast error. The forecast error is not normally distributed, and forecasts could be very volatile, with errors that did not decrease monotonically with reduced forecast horizon. Unlike CIWS, which generates forecast error estimates from the past real time performance on the day of the forecast [12], CoSPA cannot accurately predict errors for longer lead time forecasts based on forecast performance earlier in the day, as this would require the assumption that current forecasts will behave the same way as forecasts issued several hours earlier. (For instance, errors for late afternoon forecasts issued around noontime are assumed to be similar to those of noontime forecasts issued in the early morning―a very poor assumption given the dynamic nature of convection.) Fortunately, the CoSPA/Matrix forecast generation process implicitly generates time ensemble estimates of the FCA capacity which can be used to generate forecast error estimates.
A random regression forest [13], which uses the various CoSPA/Matrix forecasts to generate an ensemble of regression trees, is used to predict errors and error bounds in the Matrix forecasts. Regression trees are attractive for this application because they are nonparametric (i.e., they make no assumptions of linearity, nonlinearity, Gaussian noise, etc.), and they output both a mean value and a standard deviation for each prediction [14]. Unlike individual regression trees, random forests are not typically prone to overfitting of the data, and they are also relatively insensitive to outliers.
The random forest model uses only a single predictor―the sequence of previous capacity forecasts plus the current forecast for a particular valid time―to adjust the AFP capacity forecast for that valid time, and to estimate the error bounds. So, the 7 hour Matrix capacity forecast, valid at a given time, is adjusted using regression trees based on the 7 hour forecast only, the 6 hour forecast valid at that time is adjusted using both the 7 and 6 hour forecasts (also valid at the given time), the 5 hour forecast is adjusted using the 7, 6, and 5 hour forecasts, and so on (Figure 21). The model outputs an adjusted AFP capacity, and can also provide the expected forecast error bounds (this work was not completed in time for inclusion in this report). The model was trained on a randomly selected subset (80%, or approximately 12,000 forecasts) of all forecasts, and tested against the remaining 20% (approximately 3000 forecasts).

28
Figure 21. Illustration of the random forest algorithm applied to the Matrix capacity forecast.
Figures 22 and 23 compare the error and error envelope (90th and 10th percentiles) statistics for the unadjusted and adjusted AFP capacity forecasts from the 20% test set for forecasts of moderate (41–80% capacity) and heavy (0–40% capacity) forecasts, respectively. There are several characteristics of the adjusted capacity forecasts that are common to all capacity impact ranges:
1. the bias toward underestimating capacity (overestimating impacts) when convection is forecast is eliminated,
2. the magnitude of the median error is significantly reduced, and 3. the magnitude of the error envelope (10th to 90th percentile) is also reduced, is largely
symmetrical about zero error, and decreases with shortening forecast horizons.
The higher degree of volatility in the high impact forecasts most likely results from the relatively small sample size in the test data set.
Forecast issue time16Z 17Z 18Z
Fore
cast
hor
izon
(hou
rs)
7
7 6
7 6 5
…
Predictor trees
Predictor trees
Predictor trees
Matrix capacity forecasts
Random forest
Forecast 1Forecast 2Forecast 3, etc.
Forecast 1Forecast 2Forecast 3, etc.
Forecast 1Forecast 2Forecast 3, etc.
Forecast ensembles
Refined forecast and error bounds
7 hour forecast + error bounds
6 hour forecast + error bounds
5 hour forecast + error bounds
…

29
Figure 22. Removal of bias and reduction of error in moderate (41–80% capacity) impact Matrix capacity forecasts, resulting from the application of the random forest regression model.
Forecast horizon (hours)
Fore
cast
err
or (f
orec
ast –
trut
h) Model 90th percentile
Model median
Model 10th percentile
Matrix 90th percentile
Matrix 10th percentile
Matrix median
Median Error, Error Envelopes for Matrix and Model Capacity ForecastsForecasts of Moderate Impacts (41-80% Capacity)

30
Figure 23. Removal of bias and reduction of error in heavy (0–40% capacity) impact Matrix capacity forecasts, resulting from the application of the random forest regression model.
The corrected Matrix forecasts were assigned to impact “bins” (heavy, moderate, and light), as in Figure 18 in the previous section, and the forecasts were evaluated for the accuracy of bin assignment. Figure 24 shows a comparison of the accuracy of the corrected Matrix vs. the uncorrected. Prediction errors are less frequent for both high and moderate impact corrected forecasts, compared to the uncorrected forecasts. The forecast bias in moderate impact forecasts is also reduced (but not eliminated) in the corrected forecast, as evidenced by the more even distribution of forecast errors. Thresholding can introduce edge effects that may accentuate the forecast bias; small forecast errors near a threshold boundary can skew the statistics if they result in a change of impact class. In any event, it is necessary to recognize that the presentation of thresholded impacts presented here is notional; the selection of thresholds is somewhat arbitrary. Furthermore, if Matrix capacity forecasts are thresholded for use in decision support tools, some additional algorithmic processing would be applied to reduce volatility and misclassification of impacts due to thresholding edge effects.
Forecast horizon (hours)
Fore
cast
err
or (f
orec
ast –
trut
h)
Model 90th percentile
Model median
Model 10th percentile
Matrix 90th percentile
Matrix 10th percentile
Matrix median
Median Error, Error Envelopes for Matrix and Model Capacity ForecastsForecasts of Heavy Impacts (0-40% Capacity)

31
Figure 24. Results of impact severity forecasts for heavy, moderate, and light predictions. Corrected Matrix results are shown in the leftmost bar of each pair, uncorrected results in the rightmost. The bottom color bars in each plot represent the percentage of correct predictions.
Several refinements of the capacity adjustment and error model are possible. For instance, the AFP capacity at the time of forecast issuance may be included as a predictor to capture how much convection is already present. Time series of the forecasts of individual route blockages may be included to capture a sense of the spatial scale and organization of expected convection. Other measures of the spatial organization of the convection might be included. Another possibility is to include information from other objective, quantitative convective forecasts such as LAMP. Separate models could also be developed for each range of forecast impact (heavy, moderate, light, none). All of these potential refinements are being considered for future work.
Bar color indicates ‘true’ impact:Orange = high impact (0-40% capacity)Yellow = moderate impact (41-80% capacity)Green = low / no impact (81-100% capacity)
Heavy Impact Forecasts(0-40% capacity)
Moderate Impact Forecasts(41-80% capacity)
Little or No Impact Forecasts(81-100% capacity)
Cum
ulat
ive
Perc
enta
ge
Corrected Matrix
Uncorrected MatrixForecast Horizon (hours)
6 5 4 3 2 6 5 4 3 25 4 3 2

This page intentionally left blank.

33
5. ASSESSING THE POTENTIAL OPERATIONAL UTILITY OF THE MATRIX VIA CASE STUDIES
Four case studies are presented that illustrate the relationship between the Matrix capacity forecasts and CoSPA, and how both views of weather impacts can provide useful insights for AFP planning and decision making. The most critical period for AFP05 and/or AFP08 implementation is roughly 18–23Z when arrival traffic is heaviest, so these analyses focus primarily on forecasts issued starting around 13Z up until 19Z.
It is important to recognize that these case studies alone are insufficient to assess potential operational utility of Matrix, since so many factors at work in the operational environment must be inferred from the data that are available. For example, case study analysis cannot readily ascertain the concerns and objectives of different planners, or the information needed to improve collaboration. Human in the loop (HITL) studies may provide some insight into these elements of decision making, but HITLs cannot reproduce the complexities of the NAS northeast decision making environment that includes highly complex and evolving patterns of weather impact and traffic demand, and with key decision makers and participants scattered among FAA and airline operational facilities as is shown in [12].
In section 7, we will discuss complementing the case study analyses discussed here with a Matrix real time operational evaluation that includes observation of the decision making processes at several coordinating facilities and post-event data analysis.
20 July 2010: Good Forecast of Moderate Impact Resulting in no AFP on FCAA08 (Documented CoSPA Benefit)
This was a case of afternoon convection, typical in the summer, impacting en route airspace and potentially blocking northbound traffic into the major New York and Washington, DC airports. Starting around 17Z, thunderstorms began to develop in Kentucky and West Virginia. By 19Z, these storms had intensified and moved eastward into Virginia. From approximately 21Z to 01Z the following day, there were moderate impacts on northbound arrivals in New York, Philadelphia, and metro DC, with impacts greatest between 22Z and 23Z. All impacts were managed tactically, and traffic flow disruptions were limited to the 22Z to 23Z hour period, when southbound departures out of New York were slowed to allow room for northbound arrivals deviating to avoid weather (Figure 25).

34
Figure 25. Weather and traffic flow on July 20, 2010. Note the arrival traffic (red arrows in white circle in the upper right) deviating across departure traffic (white arrows) to avoid weather.
Both CoSPA and the Matrix forecast weather impacts accurately on this day. Forecasts issued prior to 16Z showed little impact on FCAA08 airspace prior to 21Z. Starting around 16Z, CoSPA began to forecast scattered convection throughout West Virginia, Virginia, and North Carolina beginning around 21Z. Because of the highly disorganized nature of the storms, there is some volatility in the CoSPA forecast, particularly in the details of individual storm placement and intensity. However, the overall picture presented by CoSPA and the Matrix forecast is one of moderate impacts up until 22Z (Figure 26). By 19Z, the Matrix identifies the likelihood of moderate impacts starting around 21Z or 22Z, and continuing for 3 or 4 hours; by 20Z, the
July 20, 2010
VIL
Echo tops
Key:EWR, LGA, JFK departuresEWR, LGA, JFK arrivalsPHL departuresPHL arrivalsBOS, DC traffic
19Z 2215Z

35
forecast of moderate impacts extending out to 01Z or 02Z is well established. The CoSPA and Matrix forecast trends for the 22Z forecast are illustrated in Figure 27.
Figure 26. Time-lagged CoSPA forecast ensemble images, truth, and FCAA08 Matrix valid for 19Z on July 20, 2010. These CoSPA forecasts were used to decide against implementing an AFP for FCAA08. Dotted blue lines on the forecast images are the AFP arrival routes.
July 20, 2010
Issue 13ZValid 19Z
Issue 14ZValid 19Z
Truth 19Z
CoSPA forecast issue, truth times shown
Issue 15ZValid 19Z
FCAA08 Matrix

36
Figure 27. Time-lagged forecast ensemble images, truth, and FCAA08 Matrix valid for 22Z on July 20, 2010. CoSPA and the Matrix accurately forecast the onset of higher impact weather, which resulted in deviations of New York arrivals into New York departure airspace, disrupting the departure flow for approximately an hour.
On this day, the decision was made not to implement an AFP across FCAA08 and to manage impacts tactically, based on the CoSPA forecast. CoSPA evaluation field observers noted that the decision was difficult, requiring a careful analysis of the forecast details prior to the 1515Z strategic planning telecom [11]. The decision was a good one, as traffic was managed successfully throughout the period of impact using tactical means. However, the interpretation of the CoSPA forecast in circumstances like this, where there is considerable volatility in the details of the forecast but the overall impact is fairly consistent, can be very difficult when the user has only images of echo tops and VIL from the most currently issued forecast on which to base decisions. The Matrix predicted very little impact prior to 21Z, and only moderate impacts thereafter, information that could have made the decision more certain. In cases like this, where detailed analysis of the CoSPA forecast may be required to make a decision, the combination of
July 20, 2010
Issue 18ZValid 22Z
Truth 22ZIssue 19ZValid 22Z
FCAA08 Matrix

37
a time-lagged ensemble view of CoSPA images, in which several successive CoSPA forecasts valid at a particular time are displayed side-by-side, and the Matrix, which provides a summary of impact forecast trend information, could provide insights that may be helpful in trying to interpret the CoSPA forecasts and translate them into action.
4 August 2010: Potential Application of Split AFP on FCAA05
During the afternoon of 4 August 2010, a large storm with several strong convective cells moved into the southern FCAA05 region, blocking the arrival routes into the Washington, DC metro area while leaving the arrival routes into New York relatively clear. Smaller airmass storms formed farther south, impacting the western FCAA08 routes. The FCAA05 storm moved eastwards from Illinois throughout the day, strengthening in intensity and reaching mid-Ohio by 1800Z. This system included a strong leading line, effectively blocking all air traffic through the storm; this impenetrability led to a severe impact on DC traffic for most of the afternoon. Impacts on the Boston and New York flows around the northern edge of the storm were moderate, resulting in some deviations between 20Z and 21Z. However, these deviations appeared to be managed tactically, without impacting nearby departures (Figure 28). At 1643Z, an AFP was implemented for FCAA05, with a rate of 85, and an end time of 02Z the following day.
The CoSPA forecasts were generally good on this day, although early forecasts (14Z, 15Z) placed the storm too far north, over Lake Erie between 18Z and 20Z. By the 16Z forecast, the storm was more correctly located further south and east, and the differences between weather impacts on the northern and southern halves of the AFP boundary, starting around 19Z, were becoming apparent in the Matrix forecasts for the northern and southern halves of the AFP (Figure 29). The AFP was canceled early, at 2240Z; again, both CoSPA and Matrix forecasts showed that impacts on the Boston and New York flows through the northern half of the AFP were minimal from about 21Z forward. Eastbound traffic bound for DC metro and Philadelphia, through the southern half of the AFP, were managed through a combination of first-tier ground stops and reroutes.

38
Figure 28. Weather and traffic at 21Z on August 4, 2010. Note eastbound New York arrivals deviating to avoid weather being managed without impacting nearby departure traffic.
August 4, 2010
21Z
VIL
Echo tops
Key:EWR, LGA, JFK departuresEWR, LGA, JFK arrivalsPHL departuresPHL arrivalsBOS, DC traffic
39
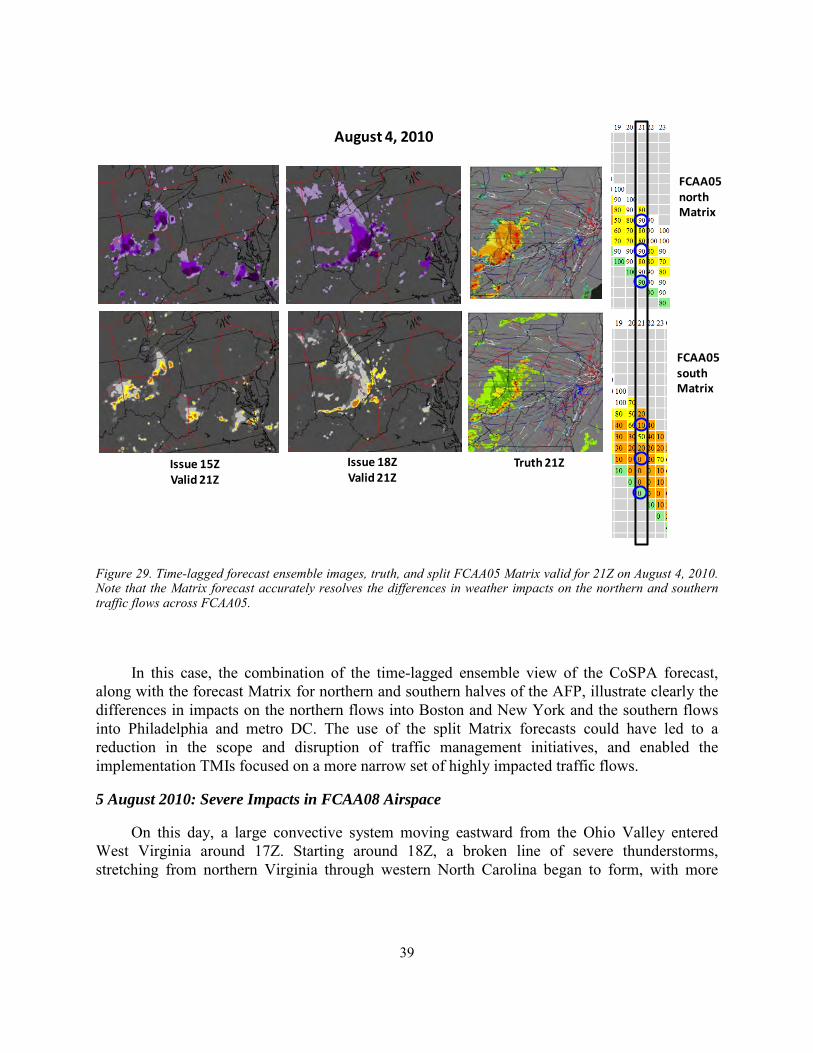
Figure 29. Time-lagged forecast ensemble images, truth, and split FCAA05 Matrix valid for 21Z on August 4, 2010. Note that the Matrix forecast accurately resolves the differences in weather impacts on the northern and southern traffic flows across FCAA05.
In this case, the combination of the time-lagged ensemble view of the CoSPA forecast, along with the forecast Matrix for northern and southern halves of the AFP, illustrate clearly the differences in impacts on the northern flows into Boston and New York and the southern flows into Philadelphia and metro DC. The use of the split Matrix forecasts could have led to a reduction in the scope and disruption of traffic management initiatives, and enabled the implementation TMIs focused on a more narrow set of highly impacted traffic flows.
5 August 2010: Severe Impacts in FCAA08 Airspace
On this day, a large convective system moving eastward from the Ohio Valley entered West Virginia around 17Z. Starting around 18Z, a broken line of severe thunderstorms, stretching from northern Virginia through western North Carolina began to form, with more
August 4, 2010
FCAA05 north Matrix
FCAA05 southMatrix
Issue 15ZValid 21Z
Issue 18ZValid 21Z
Truth 21Z

40
thunderstorms developing behind it to the west in Kentucky and Tennessee. By 21Z, severe thunderstorms covered most of Virginia and central North Carolina, heavily impacting north-south traffic through the region. Significant impacts on northbound arrivals continued until 01Z the following day. An AFP was issued for FCAA06, limiting traffic entering the FCAA08 airspace from the west, making it possible to manage demand through the FCAA08 airspace by reroutes out of the airspace (both to the west and over the ocean) and tactical maneuvering of a small number of flights through it (Figure 30). An AFP was issued for FCAA05, due to volume, from 18Z until 00Z the following day, with a rate of 100 for the first hour, and 85 for subsequent hours to accommodate anticipated reroutes to avoid the weather in the southeast. Recovery began around 00Z, when northbound New York arrivals, previously rerouted to the west, we brought back to their typical, northbound routes through FCAA08 airspace.
Figure 30. Weather and traffic at 21Z on August 5, 2010, and 00Z on August 6, 2010. Note holding of DC metro arrival traffic (purple arrows in leftmost white oval at 21Z) and New York departures and arrivals sharing the same airspace as they deviate to avoid weather (rightmost white oval at 21Z). Recovery began shortly before 00Z, as previously rerouted New York arrivals from the south are brought back to their northbound preferred routes (red arrows in white oval at 00Z).
August 5, 2010
21Z
VIL
Echo tops
00Z
FCAA06
Key:EWR, LGA, JFK departuresEWR, LGA, JFK arrivalsPHL departuresPHL arrivalsBOS, DC traffic

41
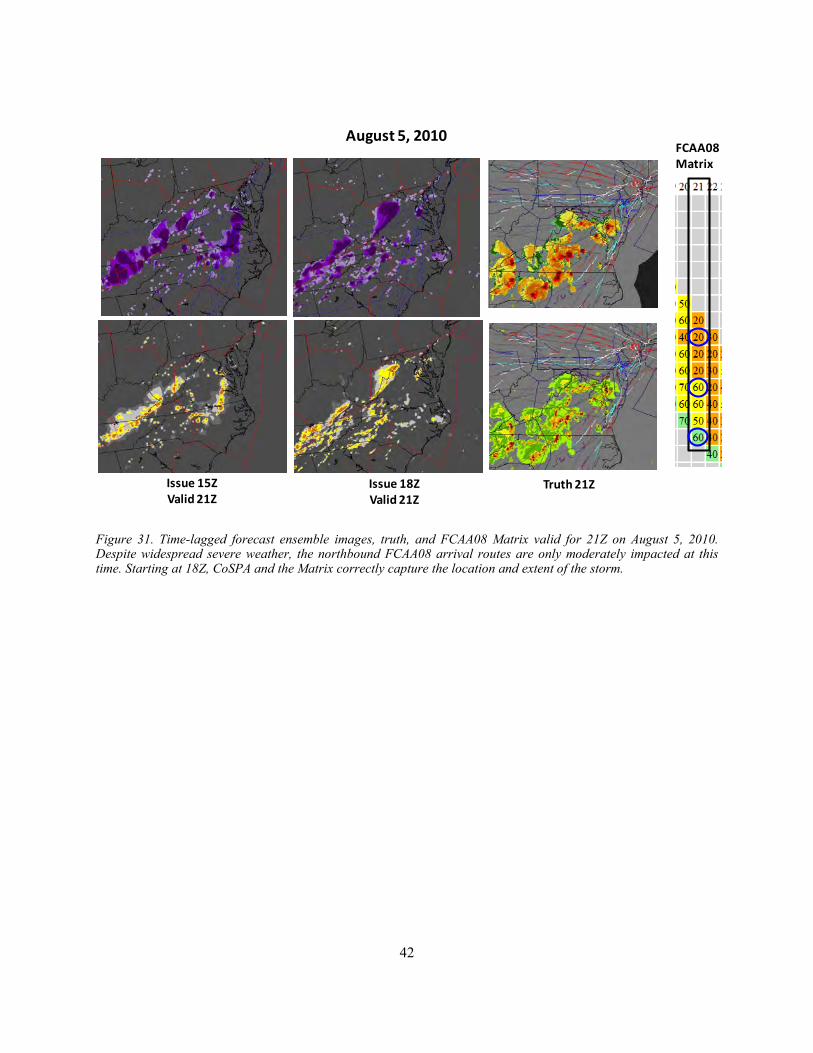
Overall, traffic management was successful, although the AFP rate of 85 on FCAA05 appeared overly restrictive, given the lack of weather impact and the need to reroute a large volume of New York bound traffic into the FCA due to the impacts on en route airspace to the south. Although the combination of the AFP through FCAA06 and proactive rerouting appears to have moved the majority of demand out of the area, holding of several New York arrivals in North Carolina, and the deviation of several New York arrivals into southbound departure airspace around 22Z suggest possible overdelivery of traffic into the impacted airspace. CoSPA forecast both the severe storms and impacts in FCAA08 airspace, and the minimal weather impacts in FCAA05 airspace. Impact forecasts were consistent in the Matrix, showing the onset of moderate impacts starting around 19Z, with severe impacts starting around 21Z and continuing for several hours (Figure 31). The advance warning of severe impacts provided by CoSPA and the Matrix might have enabled traffic management to avoid the impacts of overdelivery around 22Z and to have planned for more reroutes over the ocean.
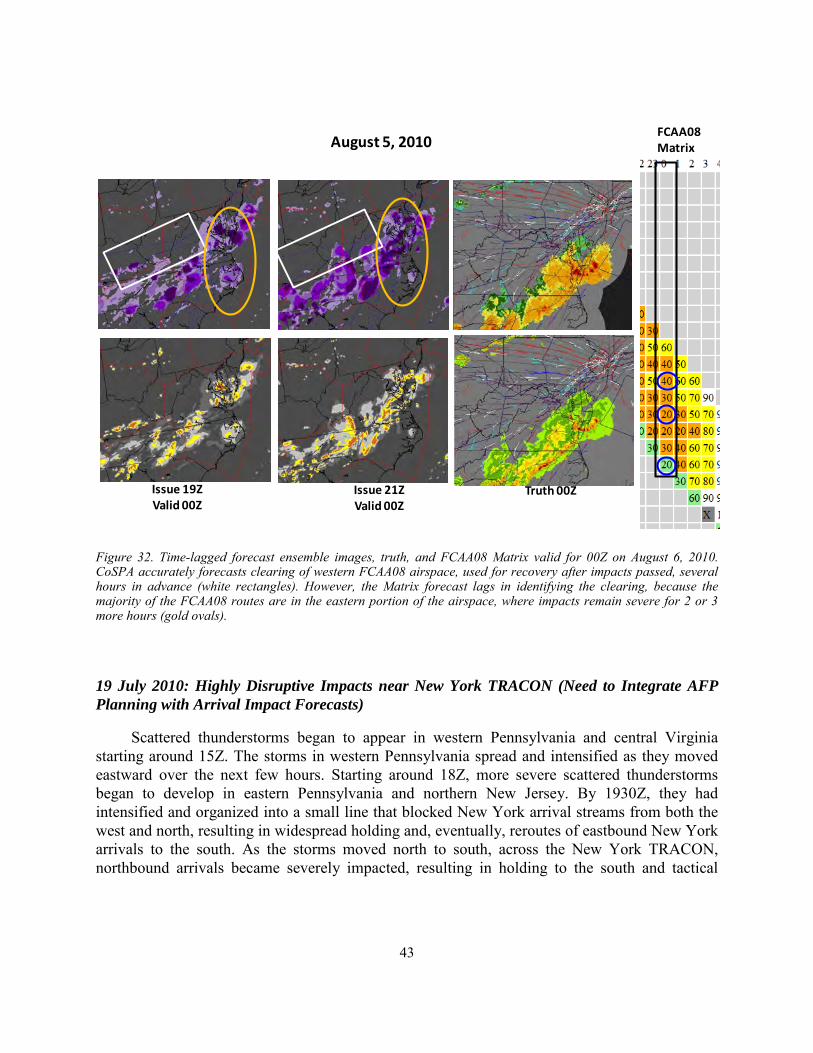
Post-impact recovery began around 00Z with the airborne rerouting of northbound New York arrivals from the western routes through Cleveland ARTCC (ZOB) back to their preferred northbound routes, after en route impacts cleared. CoSPA forecasted clearing accurately several hours in advance (Figure 32); however, the Matrix did not identify the opportunity until much later, since several of the northbound FCAA08 routes to the east were heavily impacted until much later. This example highlights the critical operational need for forecasts that accurately predict both the onset and the dissipation of weather impacts, and illustrates the need for intermediate impact forecast scales.
42
Figure 31. Time-lagged forecast ensemble images, truth, and FCAA08 Matrix valid for 21Z on August 5, 2010. Despite widespread severe weather, the northbound FCAA08 arrival routes are only moderately impacted at this time. Starting at 18Z, CoSPA and the Matrix correctly capture the location and extent of the storm.
FCAA08 Matrix
Issue 15ZValid 21Z
Issue 18ZValid 21Z
Truth 21Z
August 5, 2010
43
Figure 32. Time-lagged forecast ensemble images, truth, and FCAA08 Matrix valid for 00Z on August 6, 2010. CoSPA accurately forecasts clearing of western FCAA08 airspace, used for recovery after impacts passed, several hours in advance (white rectangles). However, the Matrix forecast lags in identifying the clearing, because the majority of the FCAA08 routes are in the eastern portion of the airspace, where impacts remain severe for 2 or 3 more hours (gold ovals).
19 July 2010: Highly Disruptive Impacts near New York TRACON (Need to Integrate AFP Planning with Arrival Impact Forecasts)
Scattered thunderstorms began to appear in western Pennsylvania and central Virginia starting around 15Z. The storms in western Pennsylvania spread and intensified as they moved eastward over the next few hours. Starting around 18Z, more severe scattered thunderstorms began to develop in eastern Pennsylvania and northern New Jersey. By 1930Z, they had intensified and organized into a small line that blocked New York arrival streams from both the west and north, resulting in widespread holding and, eventually, reroutes of eastbound New York arrivals to the south. As the storms moved north to south, across the New York TRACON, northbound arrivals became severely impacted, resulting in holding to the south and tactical
FCAA08 Matrix
Issue 19ZValid 00Z
Issue 21ZValid 00Z
Truth 00Z
August 5, 2010
44
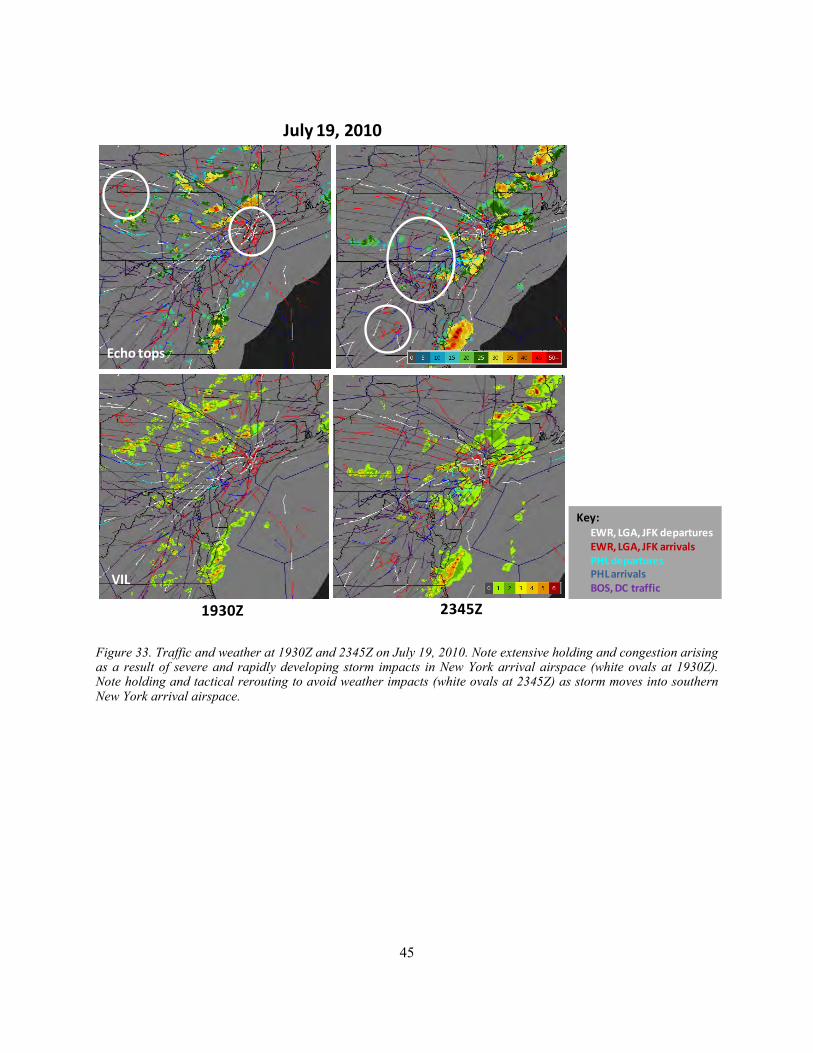
reroutes of northbound traffic to the west, which led to holding on the eastbound arrival streams as well. Even though restrictive AFPs were in place from 19Z on both FCAA05 (85 rate) and FCAA08 (90 rate), the inbound traffic still exceeded arrival capacity by a significant amount, and widespread holding and tactical reroutes were required to manage the arrival demand (Figure 33).
CoSPA and Matrix forecasts were fairly accurate for the en route airspace. However, the onset of the impacts between 19Z and 20Z were not well forecast, as CoSPA was highly volatile until approximately 18Z (Figure 34). Although these impacts were beyond the en route airspace managed by the AFP (and forecast by the Matrix), this case illustrates a critical need for tools to forecast weather impacts on traffic making the transition from en route airspace managed by strategic initiatives such as AFPs to highly constrained arrival airspace in busy metro regions such as New York or Washington, DC. Even when the Matrix gives accurate forecasts of weather impacts in the en route airspace, it is also necessary to take into account terminal area impacts that may ripple back into the en route airspace. Decision support is needed to help traffic managers identify which en route flows must be throttled due to impacts in downstream arrival airspace, and which flows can continue through en route airspace unimpeded. Furthermore, when earlier forecast uncertainty results in overdelivery of demand into constrained arrival airspace, decision support is needed to aid in the tactical management of traffic (for instance, better timing of tactical reroute initiatives and reopening of closed routes), based on shorter range, more accurate forecasts of weather and impacts (“arrival RAPT”).
45
Figure 33. Traffic and weather at 1930Z and 2345Z on July 19, 2010. Note extensive holding and congestion arising as a result of severe and rapidly developing storm impacts in New York arrival airspace (white ovals at 1930Z). Note holding and tactical rerouting to avoid weather impacts (white ovals at 2345Z) as storm moves into southern New York arrival airspace.
July 19, 2010
1930Z
VIL
Echo tops
2345Z
Key:EWR, LGA, JFK departuresEWR, LGA, JFK arrivalsPHL departuresPHL arrivalsBOS, DC traffic

46
Figure 34. CoSPA forecasts valid at 20Z, shortly after the onset of severe impacts in the New York arrival airspace resulted in extensive holding of New York arrivals to the west and in the TRACON (white circles). CoSPA forecasts do not capture the location, orientation, and severity of the storms until approximately 60–90 minutes before impact. While this warning may be insufficient for strategic planning purposes, it can be used advantageously in tactical decision support.
Issue 16ZValid 20Z
Issue 18ZValid 20Z
Truth 1930Z
July 19, 2010
Issue 17ZValid 20Z

47
6. SUMMARY
Flow Constrained Areas (FCA) characterize the capacity impact associated with forecast convective weather impacts, and are used to manage congestion in critical en route airspace leading into the northeastern US via Airspace Flow Programs (AFPs). AFPs are intended as strategic traffic management initiatives that seek to control demand prior to take off, so extended (0–8 hours or more) convective weather forecasts are key inputs to the FCA capacity specification. However, there is significant uncertainty in the prediction of convective weather on scales that are meaningful to air traffic operations in the traffic flow planning time horizons (2 to 8 hours).
The Matrix algorithm provides an automated, objective forecast of convective weather impacts on traffic flows through an FCA boundary for use in AFP planning and execution, based on the deterministic CoSPA convective weather forecast. The Matrix capacity forecasts analyzed in this report appear to be useful both as an operationally focused convective weather forecast evaluation metric, and as a decision support improved traffic flow management. This report presented an objective evaluation of the Matrix capacity forecast algorithm, a description of insights it provides into the behavior of the CoSPA forecast on which it is based, and potential applications of the Matrix and CoSPA to TMI (especially AFP) planning.
The Matrix forecast provides an estimate of FCA capacity, expressed as a percentage of fair weather maximum capacity. The capacity estimate is based on an adaptation of the RAPT route blockage algorithm, applied to WAF calculated from 0–8 hour VIL and echo top forecasts from the CoSPA convective weather forecasts. Although the Matrix forecast is dependent on the underlying airspace structure, the analysis demonstrated that forecast characteristics were consistent for different FCA boundaries, so long as the number of routes and the spatial scale of the airspace are similar.
The capacity forecast error bounds (middle 80% of forecasts) ranged from –5% (capacity underestimate) to +10 % (capacity overestimate) when the Matrix capacity forecast predicted little or no weather impacts (capacity in the range 81–100%). A “long tail” of capacity overestimation (impact underestimation) forecast errors (somewhat less than 10% of low-impact forecasts) reflected the previously reported observation that CoSPA occasionally misses convective initiation in its longer forecast time horizons. Missed initiation is an important issue that needs to be addressed through combined strategic-tactical traffic management, as it can lead to traffic plans that overdeliver demand into en route airspace, which, in turn, has the potential for very disruptive tactical responses if there has not been preplanning for tactical adjustments. Specific recommendations for addressing this issue are discussed below.
48
Forecast capacity error bounds for moderate impact (capacity in the 41–80% range) and high impact (0–40% range) ranged from approximately –25% (capacity underestimation) to +20% (capacity overestimation), with a bias of approximately –10% to –20% (capacity underestimation) in the “raw” FCA capacity forecasts. This bias toward capacity underestimation in forecasts of moderate and high impacts reflect previous observations that CoSPA forecasts tend to overestimate convective growth and intensity (particularly in the echo tops) once convection is forecast to occur. Finally, the forecast error bounds for all levels of forecast impact were fairly constant for forecast time horizons ranging from 7 to 3 hours; errors decreased significantly only at the 2 and 1 hour forecast horizons.
This analysis also considered the application of the Matrix forecast to intermediate scales of route aggregation―for example, forecasting the capacity through both halves of a split AFP. This report presented a comparison of errors for the full FCAA05 AFP and a northern split (FCAA05 north) that includes Boston and New York arrival flows, and a southern split (FCAA05 south) that includes metro DC flows. Although forecast errors for the split AFPs were greater than for the AFP as a whole, the characteristics of the split AFP errors were reasonable and accurate enough for potential operational use.
Matrix forecast volatility―the degree to which the forecast for a particular valid time changes as the CoSPA forecast is updated―was greatest in the moderate impact forecast range, with approximately 30% of moderate forecasts showing significant volatility. This volatility was related primarily to volatility in the CoSPA forecast at the 3–5 hour forecast horizon times.
We described an objective model to predict Matrix forecast error, based on predictors that can be automatically generated in real time during operations. The model refines the Matrix forecast predictions, resulting in the removal of the observed capacity forecast bias and a reduction in overall forecast error. The model can be readily adapted to predict forecast error bounds for specific operational forecasts, and could provide automated, objective estimates of capacity forecast error to operational planners in real time. Capacity estimate errors, along with visualizations of time-lagged CoSPA forecast ensemble images (images of several successive CoSPA forecasts all valid at the same future time), could provide valuable insights into the degree, nature, and location of future impacts, forecast errors, and possible tactical convective impact mitigation strategies (e.g., which flows or airspace are most likely to have useful capacity).
Four case studies, that illustrate the relationship between the CoSPA forecast, the Matrix capacity forecast, and operational planning and decision making, were also presented. The combination of CoSPA forecast animation, time-lagged ensemble image visualization, and Matrix capacity forecasts provides a set of complementary tools that the operational planner can use to determine severity, location, and degree of uncertainty in weather impact forecasts, and to identify the most likely opportunities for tactical management to mitigate the effects of forecast errors. In particular, when there is a high degree of variation in the fine details of successive

49
CoSPA forecasts (e.g., the exact placement, organization, and severity of several small storms scattered throughout the region), the capacity forecast Matrix can provide insights into the consistency of overall AFP impacts―despite the many differences in forecast detail, the overall impact on traffic flows may not change significantly. At the same time, the time-lagged ensemble visualizations provide information about the potential distribution of impacts across the airspace―information that is lost in the overall AFP average capacity estimation. The volatility in the Matrix forecasts, along with guidance that may be provided by an objective forecast model, provides the planner with an operationally relevant measure of forecast uncertainty.

This page intentionally left blank.

51
7. RECOMMENDATIONS FOR FUTURE WORK
The ability to forecast FCA capacity impact is essential for the NextGEN Trajectory Based Operations (TBO) and Collaborative Air Traffic Management (CATM) initiatives. The Matrix system for generating objective quantitative forecasts of FCA capacity as well as explicit quantitative estimates of the uncertainty in the FCA capacity estimates provides an objective, operationally meaningful method to evaluate weather forecast performance and uncertainty, provides a platform on which near-term development of some of the NextGEN CATM concepts (e.g., Collaborative Automated Congestion Resolution CACR]) can be refined, and has the potential to improve NAS management of convection impacts in the highly congested Northeast airspace when convective weather occurs. The Matrix baseline system (Figure 35) translates CoSPA 0–8 hour forecasts into forecasts of operational impacts on FCA traffic flows by taking advantage of the RAPT route blockage forecasting technology, and provides an explicit measure of uncertainty in the capacity forecast and additional information that can be used to plan impact mitigation strategies.
Figure 35. Matrix baseline and to-do list developed for 2010 evaluation.
CoSPA and Uncorrected MATRIX
Bias Correction, Error Reduction, and Error
Modeling
Decision Support Outcome Analysis and Metrics
1. CoSPA forecast improvements (initiation, overestimation of growth)
2. Matrix improvements (robustness, reduced volatility)
3. Further reduction of forecast errors
1. Concept development2. Information extraction for decision support3. Presentation / user interface4. Development of forecast requirements5. Decision support for transition from planning
to tactical (‘arrival RAPT’)6. Evaluation of CCFP, LAMP utility in refining
capacity forecasts and estimating uncertainty
1. Metric definition2. Improved calibration of
capacity forecasts to achievable traffic flow
Existing Baseline from 2010 Evaluation
To-Do List

52
Figure 35 presents a “to-do list” of possible next steps. Four key next steps are as follows:
1. Improving the performance of the CoSPA forecast, the Matrix capacity forecast, and error models for both forecasts
Three significant deficiencies of the CoSPA forecast have been identified:
(a) missed convective initiation (especially between 13Z and 17Z),
(b) excessive growth, once convection has been forecast, and
(c) volatility in the forecasts at fixed valid time (particularly in the 3–5 hour forecast horizon).
Addressing these CoSPA forecast deficiencies will significantly improve the ability of CoSPA to provide decision support for congestion resolution in convective weather. Changes to both the HRRR and the CoSPA blending algorithms are underway. We strongly recommend that as a part of testing such algorithm enhancements, some of the cases used in the studies presented above be rerun to see if the FCA capacity forecasting performance has been improved.
At the same time, it is also important to recognize that accurately forecasting convective initiation hours in advance with the very sparse currently available information on the state of the atmosphere (especially, temperature, humidity and surface winds) is very difficult scientifically and computationally. Hence, it will be important to develop robust strategies for working around some of these deficiencies (see item 3 below) as well as continued research on the FCA capacity forecast modeling and error analysis that was discussed above in section 4.
2. Evaluation of the operational utility of the Matrix and time-lagged CoSPA ensemble forecasts in actual operational traffic flow management planning and decision making
The operational experience with CIWS [12] and RAPT [10] has shown that the operational environment associated with NAS Northeast traffic management in convective weather is virtually impossible to simulate in the laboratory at this time. The current state of the Matrix is similar to that of RAPT in 2008: an automated algorithm whose characteristics are reasonably well-understood and which predicts a key operational metric (FCA capacity) has been developed. Field evaluations of the manual use of the convective weather forecast (CIWS and ITWS in the case of RAPT, CoSPA in the case of the Matrix) have identified some of the critical issues that must be addressed for effective TFM decision making with the

53
convective weather forecast, but the role of explicit translation of weather forecasts into capacity impact forecasts as a part of decision support was not yet well developed. The 2008 RAPT field evaluation [10] was critical to the success of RAPT. It identified the key benefits scenario (reopening closed departure routes efficiently after weather impacts had cleared), and resulted in a more focused concept of operations, and slight changes in the RAPT route blockage algorithms, display and training. Those changes led to a tripling of benefits due to RAPT use in 2009 [14].
Hence, real time evaluations in the Northeast portion of the NAS are a logical next step for Matrix operational concept development, including information extraction and presentation, and refining the CoSPA forecast requirements for operationally effective decision support. The evaluation would include making the Matrix forecast and time-lagged ensemble visualizations available to operational users, field observations of decision making, and post-event data analysis.
3. Development of operational concepts and tools to support the transition of en route traffic management for arrival airspace from strategic planning to tactical planning
We saw in section 3 that the individual route impact forecasts vary much more with time than does the FCA capacity forecast. The initial FCA capacity estimation studies [4] showed that the actual route capacities (estimated using the actual weather) also vary much more in time than the FCA capacity (estimated using the actual weather). In particular, individual routes may lose all of their capacity for a significant time period (e.g., an hour) even though there is only a moderate impact on the overall FCA capacity.
Hence, it will be necessary to develop operational concepts with associated decision support tools for managing the loss of individual arrival routes. It has been suggested that the RAPT algorithms could be adapted to provide an “arrival RAPT” capability for ascertaining availability of alternative arrival routes if the normal arrival route were blocked. However, the operational use of such an in-flight rerouting capability would be feasible only if there were prior strategic planning to identify alternative routes and decision points for reroutes and to insure that the aircraft had sufficient fuel to take all of the candidate alternative routes. The ability of the CoSPA forecast to support the transition from full FCA management, through intermediate scales of traffic management (e.g., split FCAs), down to the handoff to tactical decision support should be explored.

54
4. Assessment of the utility of other contemporary forecasts to provide useful decision support for FCA capacity forecasting as an adjunct to the Matrix
Studies should be conducted to see if either CCFP and/or LAMP offer any useful ability for the identification of situations where the Matrix FCA capacity estimates are likely to be significantly in error. One of the main challenges in such an investigation is that no tested concepts currently exist for translation of either CCFP or LAMP into quantitative FCA forecasts.

55
GLOSSARY
AFP Airspace Flow Program
ARTCC Air Route Traffic Control Center
ATC Air Traffic Control
ATM Air Traffic Management
BOS Boston Logan Airport
CATM Collaborative Air Traffic Management
CCFP Collaborative Convective Forecast Product
CIWS Corridor Integrated Weather System
CTOP Collaborative Trajectory Options Program
CWAM Convective Weather Avoidance Model
FAA Federal Aviation Administration
FCA Flow Constrained Areas
FSM Flight Schedule Monitor
GDPs Ground Delay Programs
HITL Human in the loop
LAMP Localized Aviation Model Output Statistics (MOS) Product

56
NAS National Airspace System
NextGen Next Generation air transport system
PHL Philadelphia International Airport
RAPT Route Availability Planning Tool
TBO Trajectory Based Operations
TFMS Traffic Flow Management System
TMI Traffic Management Initiative
TRACON Terminal Radar Approach Control
VIL Vertically Integrated Liquid
WAF Weather Avoidance Fields

57
REFERENCES
1. Brennan, M., “Airspace Flow Programs―A Fast Path to Deployment,” Journal of Air Traffic Control, 49(1), pp. 51-55 (2007).
2. Doble, N.A., M. Brennan, N. Arora, and C. Ermatinger, “Simulation and Operational Analysis of Airspace Flow Programs for Traffic Flow Management,” 6th AIAA Aviation Technology, Integration, and Operations Conference (ATIO), Wichita, KS (2006).
3. Robinson, M., R. DeLaura, B. Martin, J.E. Evans, and M.E. Weber, “Initial Studies of an Objective Model to Forecast Achievable Airspace Flow Program Throughput from Current and Forecast Weather Information,” 14th Conference on Aviation, Range, and Aerospace Meteorology (ARAM): Special Symposium on Weather–Air Traffic Integration, Phoenix, AZ (2009).
4. Robinson, M., R.A. DeLaura, B.D. Martin, and J.E. Evans, “Initial Studies of an Objective Model to Forecast Achievable Airspace Flow Program Throughput from Current and Forecast Weather Information,” MIT Lincoln Laboratory, Lexington, MA, Project Report ATC-343 (2008).
5. Wolfson, M.M., W.J. Dupree, R. Rasmussen, M. Steiner, S. Benjamin, and S. Weygandt, “Consolidated Storm Prediction for Aviation (CoSPA),” 13th Conference on Aviation, Range, and Aerospace Meteorology (ARAM), New Orleans, LA (2008).
6. DeLaura, R., M. Robinson, M.L. Pawlak, and J.E. Evans, “Modeling Convective Weather Avoidance in Enroute Airspace,” 13th Conference on Aviation, Range, and Aerospace Meteorology (ARAM), New Orleans, LA (2008).
7. Matthews, M., and R. DeLaura, “Assessment and Interpretation of En Route Weather Avoidance Fields from the Convective Weather Avoidance Model,” 10th AIAA Aviation Technology, Integration, and Operations (ATIO) Conference, Fort Worth, TX (2010).
8. DeLaura, R., M. Robinson, R.F. Todd, and K. MacKenzie, “Evaluation of Weather Impact Models in Departure Management Decision Support: Operational Performance of the Route Availability Planning Tool (RAPT) Prototype,” 13th Conference on Aviation, Range, and Aerospace Meteorology (ARAM), New Orleans, LA (2008).
9. Martin, B., “Model Estimates of Traffic Reduction in Storm Impacted En Route Airspace,” 7th AIAA Aviation Technology, Integration, and Operations (ATIO) Conference, Belfast, Ireland (2007).

58
10. Robinson, M., R. DeLaura, and N. Underhill, “The Route Availability Planning Tool (RAPT): Evaluation of Departure Management Decision Support in New York during the 2008 Convective Weather Season,” 8th USA/Europe Air Traffic Management Research and Development Seminar (ATM2009), Napa, CA (2009).
11. Operational Readiness and Impact Team Aviation Weather Group, “2010 CoSPA–LCH Operational Evaluation: Consolidated Summary Report for 2010 Assessment Activities,” Federal Aviation Administration ATO Operations Planning, Atlantic City, NJ (18 January 2011).
12. Robinson, M., and J.E. Evans, “Assessment of Air Traffic Control Productivity Enhancements from the Corridor Integrated Weather System (CIWS),” MIT Lincoln Laboratory, Lexington, MA, Project Report ATC-325 (2006).
13. Breiman, Leo, “Random Forests,” Machine Learning 45 (1): 5–32 (2001).
14. Moore, A.W., “Decision Trees,” http://www.cs.cmu.edu/~awm/tutorials
15. R. DeLaura, J.E. Evans, and M. Robinson, “Weather-ATM Integration,” Briefing to the REDC Committee, MIT Lincoln Laboratory, Lexington, MA (March 24, 2010).