Embed Size (px)
Citation preview
EVALUATION OF DIFFERENT METHODS TO
PRODUCE FREE RADICALS FOR THE OXIDATION
OF ORGANIC MOLECULES IN INDUSTRIAL
EFFLUENTS AND POTABLE WATER
WITH REFERENCE TO CAV-<
WRC Report
submitted to the
Water Research Commission
by
S Winship
Pollution Research GroupSchool of Chemical Engineering
University of Natal, Durban 4041, South Africa
WRC Report No 388/1/99ISBN No 1 86845 484 3

EXECUTIVE SUMMARY
EVALUATION OF DIFFERENT METHODS TO PRODUCE FREERADICALS FOR THE OXIDATION OF ORGANIC MOLECULES IN
INDUSTRIAL EFFLUENTS AND POTABLE WATERWITH SPECIAL REFERENCE TO CAV-OX®
Compiled by
Sue Winship
Pollution Research Group
Department of Chemical Engineering
University of Natal, Durban
South Africa
July 1995
Supplementary lo Final Report to llie Water Research Commission on Project No. 38S :
Evaluation of Different Methods to produce Free Radicals for the Oxidation of Organic Molecules in
Industrial Effluents and Potable Water (with special reference to CAV-OX®)
Head of Pollution Research Group : Professor C A Buckley
Project Leader : Ms S J Winship
Project Team : Ms C J Kaiser
Mr S Chetty
Mr D J Meyer
Mr G W Schwikkard

BACKGROUND TO THE PROTECT
Environmental legislation and the increasing pollution of water supplies have necessitated the evaluation of
existing technologies and the development of new technologies for the removal of organic pollutants from
industrial effluents and potable water, and for the disinfection of potable water by the inactivation of bacteria
and pathogens.
Recently, advanced oxidation processes have developed as potentially powerful methods for the treatment of
organic pollutants in water and the disinfection of potable water. These processes involve the generation of
highly reactive free radical intermediates such as the hydroxyl radical. The advantage of these oxidation
processes is that organic pollutants can be completely mineralised to carbon dioxide, water and a small amount
of acids, while the degradation process usually operates at or near ambient temperature and pressure. In some
cases, complete mineralisation may not be achieved due to excessive reaction times, nevertheless, advanced
oxidation processes are potentially beneficial as pretreatment steps that complement other treatment processes.
For example, advanced oxidation processes can be used to enhance the biodegradation of highly toxic
pollutants.
The rates of advanced oxidation processes are greatly enhanced compared to those of oxidation with
conventional oxidants because of the high reactivity of the radical species, primarily hydroxyl radicals. The
reaction rates of hydroxyl radicals are typically 106 to 10* times faster than the corresponding reaction rates of
strong oxidants such as ozone (Yuc. 1992). In order for advanced oxidation processes to be used for water
treatment purposes, hydroxyl radicals must be generated in excess. One way in which to achieve this is the
irradiation of hydrogen peroxide with ultraviolet (UV) light which induces the decomposition of hydrogen
peroxide to form two hydroxyl radicals. Advanced oxidation technologies include processes involving
hydrogen peroxide, ozone, ultrasound and UV radiation, or combinations of these.
The rates of chemical reactions can be increased by concentration, pressure, catalysts, ultraviolet light and
cavitntion. Cavitation is defined as the formation, expansion and implosion of bubbles in a liquid (Perry,
1973; Suslick, 1988; Young, 1989; Riesz, et ai., 1990). Bubbles are formed due to the reduction of local
pressure in a liquid to the vapour pressure of the liquid at a specific temperature. Theoretical calculations
indicate that a minimum pressure (known as the cavitation threshold) of 1 013 MPa is required to form bubbles
(Shutilov, 1988). However, experimental observations indicate that the cavitation threshold varies from 101 to
2 532 kPa, although a cavitation threshold of 20 260 kPa has also been reported (Chetty, 1994). The cavities
collapse when the local pressure is greater than the vapour pressure of the liquid. Collapse of these bubbles
leads to the release of considerable energy which is claimed to generate sufficient localised temperatures and
pressures to form hydroxyl and hydrogen radicals from the thermal dissociation of water molecules (Chang,
et al.. 1981). It has been predicted that localised temperatures between 2 273 K and 5 000 K and pressures
ranging from 101 MPa to 101 300 MPa occur upon collapse of the bubbles (Noltingk and Neppiras, 1950 in
Hughes and Nyborg. 1962; Pelersen and Zaleiko, 1981; Suslick, 1988; Mason, 1990a). Cavitation can be
produced in a liquid by four different methods:

• Hydrodynamic cavitation is produced as a result of pressure variations in a flowing liquid due to the
geometry of the system.
• Acoustic cavitation is produced by sound waves in a liquid which cause pressure variations.
• Optic cavitation is produced by photons of high intensity light (i.e. laser) that rupture a liquid.
• Particle cavitation is a result of any type of elementary particles, e.g. protons, rupturing a liquid.
The formation of free radicals due lo the dissociation of water molecules into hydroxyl and hydrogen radicals
has been reported under the conditions of acoustic cavitation (Makino, et al , 19S2) and hydrodynamic
cavitation has claimed to result in the production of hydroxyl radicals (Petersen and Zaleiko, 1981).
Watergroup (USA) has developed an advanced oxidation technology (CAV-OX® process) that employs UV
radiation, hydrogen peroxide and hydrodynamic cavitation to degrade organic compounds present in water at
mg/£ concentrations to nondetectable levels by photolysis and oxidation (EPA, 1993). Ideally, the end products
of the process are water, carbon dioxide, halides and, in some cases, organic acids. The major components of a
CAV-OX® system are the cavitation chamber, UV reactor and control panel. In addition to the production of
hydroxyl radicals by the UV photolysis of hydrogen peroxide in the UV reactor, it is claimed that
hydrodynamic cavitation, induced in a venturi nozzle in the cavitalion chamber, generates hydroxyl and
hydrogen radicals which rccombine to form hydrogen peroxide and hydrogen gas (EPA, 1993). The
CAV-OX® system has been used to treat groundwater contaminated with volatile organic compounds such as
trichloroethylene, benzene, toluene and xylene (EPA, 1993). A similar oxidative process combining hydrogen
peroxide, hydrodynamic cavitation and ultraviolet radiation has resulted in up to 98 % decreases in the organic
concentrations of various wastes, e.g. beverage-making effluent, tannery waste, activated sludge and raw
sewerage (Lipowicz, 1981; Petersen and Zaleiko, 1981).
Preliminary evaluation of a CAV-OX® system in 1990 by the Pollution Research Group on the behalf of
Diarec Diamonds indicated that hydrodynamic cavitation enhanced the effect of hydrogen peroxide and UV
radiation on the decolourisation of dye effluent thus supporting the claims thai hydrodynamic cavitation
generates hydroxyl radicals (Neytzell-de Wilde and Chetty. 1990). It was also proposed that hydrodynamic
cavitation alone may have the potential lo inactivate pathogenic bacteria since UV radiation and hydrogen
peroxide, the other constituents of the CAV-OX® system, are known to successfully inactivate bacteria.
Hydrodynamic cavitation could therefore provide a less capital intensive technique to the present use of
chlorine as a disinfectant for raw water treatment since cavitalion venturi nozzles could be installed in water
systems to exploit the existing pressure/velocity head, e.g. for rural water supply.
PROTECT AIMS
This project was initiated to evaluate different methods far the production of free radicals for the oxidation of
organic molecules in industrial effluents and potable water. The aims of this project were to :

D Investigate the oxidation rate and daughter products of various advanced oxidation processes, or
combinations thereof, on a sequence of model organic compounds.
D Investigate the disinfection properties of various advanced oxidation processes on model microbiological
indicators.
D Investigate the effectiveness of these processes on a selected number of process streams such as coloured
textile effluent and toxic organic chemical stenms.
Due to the possible application of hydrodynamic cavilation as a method for the production of free radicals
without further chemical addition, the emphasis of this research project was to investigate hydrodynamic
cavilation and evaluate its ability to produce free radicals for the treatment of potable water and industrial
effluents, with particular reference to the CAV-OX® system. Ultrasonic cavitation was also investigated
during this research project; as a comparative technique to hydrodynamic cavitalion since the cavitation effects
of sonic waves have been well documented , as well as a treatment method for industrial pollutants.
PROTECT OBIECTIVES
The aims of the project were to be achieved by investigation of the following research areas:
• The microbiological assessment of hydrodynamic cavitation for the treatment of raw water.
D The evaluation of hydrodynamic cavitation in the CAV-OX® system.
• The effect of ultrasonic cavitation on organic pollutants in industrial effluents.
D The computational fluid dynamics of hydrodynamic cavitation in a venturi.
The potential for the use of hydrodynamic cavitation as a raw water treatment process was assessed by
determining the effect of hydrodynamic cavitalion on the inactivation of viable bncterin in raw water. The
original intention was to use a model, single bacteria species, e.g. Escherichin coli. as an indicator of the
effectiveness of hydrodynamic cavitalion for bacterial inactivation. However, as naturnlly-occuring bacteria
are believed to be more resilient to treatment than laboratory-cultured species, raw water containing a variety
of bacteria, was initially used as the indicator since it provided a realistic representation of the bactericidal
efficiency of hydrodynamic cavitation. Once the efficiency of a process has been established, the
microbiological quality of the water can be evaluated by using selected species of bacteria as indicators.
The CAV-OX® system supplied to the Pollution Research Group by Diarec Diamonds was investigated
primarily to determine the concentration of hydrogen peroxide produced by hydrodynamic cavitation in the
cavitation chamber. Prior to this, the efficiency of hydrodynamic cavitation produced by the venturi nozzle of
the cavitation chamber was determined. Factors affecting the rate of peroxide formation during cavitation
were also investigated.
The effect of ultrasonic cavitation on organic pollutants in industrial effluents was investigated as part of an
allied Sasol research project in which ihe viability of ultrasound to degrade hydantoin compounds to more

biodegradable products was considered. Hydnntoin compounds are formed during the coal gasification process
by combination of cyanide, ammonia, carbon dioxide and a kctone. and accumulate in the effluent stream from
the coal gasification plant at Sasol. Ultrasound was used as a degradation technique instead of hydrodynamic
cavitation since ii is widely reported that ultrasound produces cavitation from which hydroxyl radicals are
formed. It was postulated that the hydroxyl radicals formed during sonication would oxidise the hydantoin
compounds and the degradation products could then be identified and assessed for their biodegradability.
Computational fluid dynamics was investigated as a method to determine the experimental conditions which
could lead to cavitation in a venturi. The STAR-CD program was used to determine numerical results for
experimental flow conditions in a venturi. Good agreement of the experimentally determined and numerically
simulated results for the same flow conditions was used to validate the numerical results.
4 SUMMARY OF RESULTS
In this report, the results from the four areas of research that compiled this project are organised and discussed
in terms of the theoretical, physical, chemical and biological effects of cavitation as each of the research topics
could encompass more than one of these aspects.
4.1 Theoretical Effects of Cavitation
This section discusses the results obtained from the investigation of the flow conditions that initiate
hydrodynamic cavitation using computational fluid dynamics. The STAR-CD program was used to
numerically simulate the flow conditions in a venturi (the dimensions of which were reported in literature) and
these numerical results were validated by comparison with the published experimental results. It was
concluded from this investigation that the numerical nielhod using the STAR-CD program is capable of
simulating flow conditions up to cavitation. i.e. to indicate the potential of cavitation in a fluid. In addition,
using computational fluid dynamics, it is possible to estimate the local velocities at any point within a venturi
thus enabling the determination of local cavitation conditions (as defined by a cavitation number) at any point
in a fluid.
4.2 Physical Effects of Cavitation
The characteristics and events of ultrasonic cavitation produced in an ultrasonic cleaning bath and
hydrodynamic cavitation produced in two sets of equipment, i.e. the cavitation chamber of the CAV-OX®
system {Figure 1) and specially constructed hydrodynamic cavitation rig (Figure 2), were investigated.

feed tank
feedpressure
(P)
flow controlvalves
feed pump
gas line
FIGURE 1 : Modified CAV-OX® system used for experiments
Flow meier
cavitation dischargepressure pressure
Cavitation chamber
—CxiV4
(Fp Pressure transducer
( n ) Inlet pressure gauge
QlJ Throat pressure gauge
Q£) Outlet pressure gauge
( ? ) Flow meter
f 1 Cavitation nozzle
X Valve
V3
10m
FIGURE 2 : Process instrumentation diagram of the hydrodynnmic cavitation rig
Prior to experimentation, the CAV-OX® system was modified by disconnecting the cnvitalion chamber from
the ultraviolet reactors and connecting the system so that water could be recirculaied through the cavitation
chamber that contained the nozzle. The hydrodynamic cavitation rig was constructed to maximise the

intensity of cavitation and thus facilitated a large range of operating conditions. This rig was designed to
enable the recirculation of feed water (raw water) through a venturi nozzle which was a perspex replica of the
nozzle used in the CAV-OX& unit. The nozzle was installed about 10 metres above the free liquid surface in
the feed tank thereby creating a low pressure on the discharge side of the nozzle which favours cavilation.
The physical characteristics of the hydrodynamic cavitation produced in the CAV-OX® chamber and the
hydrodynamic cavitation rig were investigated in terms of appearance of bubbles (a phenomenon of captation),
nozzle flow characteristics, cavitation number (this indicates the intensity of cavitation; the lower the
cavitation number, the greater the intensity of cavitation produced) and sound emission. The presence of
bubbles, which formed in the throat and collapsed in the divergent section of the chamber, indicated that
hydrodynamic cavitation occurred in both systems. The mass of bubbles increased with increasing flow rate,
increasing throat pressure and decreasing discharge pressure. From this it was concluded that the degree
(intensity) of hydrodynamic cavitation increases with increasing flow rate and as the pressure drop across the
nozzle is increased (this was also observed in the investigation of computational fluid dynamics of
hydrodynamic cavitation). This was confirmed by the results for the cavitation numbers for the CAV-OX®
chamber and hydrodynamic cavitalion rig.
The cavitation number is a dimensionless parameter which describes the susceptibility of a fluid to cavitate. It
is the ratio of static pressure {P-Pt.) to dynamic pressure (X pit') where P is the local fluid static pressure;
P,, is the saturated vapour pressure at the fluid temperature; p is the fluid density; and it is the local fluid
velocity (Young, 1989). The lower the cavitation number, the more intense the cavilation. Throat cavitation
numbers in the CAV-OX® chamber ranged from 0,006 to 0.563 and hydrodynamic cavitation, as indicated by
the presence of bubbles, was only observed in the CAV-OX© chamber when the throat cavitalion number was
less than the threshold cavitation number (which was predicted from extrapolation of literature results to be
0,250 for the CAV-OX® chamber). Cavitation numbers in the hydrodynamic cavilation rig ranged from 0,025
to 0,482; the greatest flow rate and pressure drop across the nozzle resulted in the lowest cavitation number
thus confirming that these flow conditions produced the greatest degree of cavitation. Since the collapse of
bubbles emit sound, the sound pressure levels determined in the CAV-OX® chamber and hydrodynamic
cavitation rig increased with increasing flow rate and pressure drop across the nozzle. The sound pressure
levels emitted by the hydrodynamic cavitalion rig reached at maximum of 82 dB al 4 000 Hz for the most
intense condition of cavitation.
The ultrasonic cavitation produced in a ultrasonic cleaning bath was also characterised in terms of its physical
effects. It was proposed that stable ultrasonic cavitalion occurs with an intensity of 9,6 kW/nr in the
ultrasonic cleaning bath. However, this intensity is reduced in the reaction vessel.
4.3 Chemical Effects of Cavitation
The chemical characteristics of hydrodynamic cavitalion were determined by evaluating the concentration of
hydrogen peroxide produced in the CAV OX® chamber and hydrod\rnamic cavitation rig. No detectable
amount of hydrogen peroxide was produced by the hydrodynamic cavitation of water in the CAV-OX®

chamber, even in the presence of oxygen (which enhances hydrogen peroxide production). Similarly, no
detectable amount of hydrogen peroxide was produced by the hydrodynamic cavitation (using the most intense
cavitation conditions) of water in the hydrodynamic cavilation rig. The minimum detection limit of hydrogen
peroxide for these experiments was 0,034 nig/Z using the spectropholometric analytical method of Baga, et al.
(1988).
The concentration of hydrogen peroxide produced by the ultrasonic cavitntion of water in the ultrasonic
cleaning bath was determined to be approximately 0,06 mg/£. This result supports the reports that hydroxyl
radicals (which combine to form hydrogen peroxide) are formed during ultrasonic cavitalion. Saturation of
water with oxygen prior to ultrasonic cavitation (sparged for 15 min prior to sonicalion) significantly enhanced
the concentration of hydrogen peroxide (3,5 mg/£) formed. It was concluded that continuous sparging with
oxygen was necessary in order to maintain the enhancement of the radical reactions in the presence of oxygen.
The degradation of 1-methylhydantoin by ultrasonic cavitation was investigated and it was demonstrated that
partial degradation (approximately 25 to 30 %) occurs, possibly due to oxidation by the radical species
(especially hydroxyl radicals) that are formed during ultrasonic cavitalion. Degradation of 1-melhylhydantoin
is enhanced by the addition of 1 332 mg/£ hydrogen peroxide (approximately 62 % degradation), and further
degradation (approximately 68 %) occurs with the addition of hydrogen peroxide and oxygen saturation prior
to sonication.
Investigation into the identification of the sonochemical and photochemical1 degradation products of
1-methylhydantoin in the presence of hydrogen peroxide indicated that similar products were formed. One of
the products formed in the photochemical and sonochemical degradation of 1-methylhydantoin in the presence
of hydrogen peroxide was tentatively identified as 1-methylparabanic acid. Oxamide was a suspected product
in the sonochemical degradation of 1-mcthylhydantoin in the presence of hydrogen peroxide and oxygen.
4.4 Biological Effects of Cavitation
As there was no detectable decrease in the colony forming units of raw water bacteria as enumerated by the
heterotrophic plate count technique, it was concluded that hydrodynamic cavitation does not inactivate raw
water bacteria. However, it was observed from scanning electron micrographs that hydrodynamic cavitation of
raw water caused increased dispersal of bacterial aggregates which caused a increase in the turbidity
measurements. Consequently, the combination of hydrodynamic cavitation and ultraviolet irradiation was
assessed to determine if the dispersal of bacterial aggregates by hydrodynamic cavitation prior to ultraviolet
irradiation would enhance bacterial inactivation by ultraviolet light. No significant enhancement in bacterial
inactivation was observed when compared wiLh only ultraviolet irradiation. Significant inactivation of raw
1 Hydrogen peroxide and UV radiation were used to enable the degradation of more concentrated solutions
of 1-methylhydantoin in shorter time periods to produce sufficient quantities of products for separation,
collection and identification.

•water bacteria (1,6 to 2 log reduction units) occurred upon ultrasonic cavitation of the water in the ultrasonic
cleaning bath.
5 KEAUSATION OF OBJECTIVES
From the results obtained during the project, it would appear that the objectives of the project have been
achieved. The potential use of hydrodynnrnic cavilalion for the treatment of raw water without the addition of
chemicals has been disproved since hydrodynamic cavitation is not an effective method the inactivation of
bacteria in raw water. Similarly, the application of hydrodynamic cavitalion as a single advanced oxidation
process is not recommended as the concentration of hydrogen peroxide produced by the hydrodynarnic
cavitation of water (less than 0,034 mg/£) would be ineffective for the oxidation of organic pollutants in
industrial effluents and potable water. These results also invalidate the manufacturer's claims about role of
hydrodynamic cavitation in the production of hydroxyl and hydrogen radicals in the CAV-OX® system. From
the results obtained during this research project, it was concluded that the function of hydrodynamic cavitation
produced in the cavitation chamber of the CAV-OX® system is to disperse the effluent to be treated prior to its
oxidation with hydrogen peroxide and ultraviolet light. The results obtained for the degradation of
1-methylhydantoin (an organic pollutant in Sasol effluent) by ultrasonic cavitalion in the ultrasonic cleaning
bath indicate the potential of sonochemistry as an advanced oxidation process for the treatment of industrial
effluents. The sonochemical formation of hydroxyl radicals by ultrasonic cavitation can be enhanced for
industrial treatment purposes by the addition of hydrogen peroxide and oxygen. The flow conditions, i.e. fluid
velocities and pressure drops, which initiate hydrodynamic cavitation in a fluid can be simulated using
computational fluid dynamics. However, whilst it has been demonstrated that computational fluid dynamics is
a useful tool to indicate the potential of a fluid to undergo cavitation. the numerical simulation of
hydrodynamic cavitation which involves two-phase flow using computational fluid dynamics has not been
achieved in this project because the flow system is too complex.
6 RECOMMENDATIONS
D No further investigation into the CAV-OX® process.
D Further investigation into ultrasonic cavitation on a laboratory and pilot-plant scale for the treatment of
industrial effluents.
D Investigation of the combination of ultrasonic cavitation and ultraviolet treatment using industrial
effluents.
D Investigation of effect of dispersion using hydrodynamic cavilation prior to disinfection with chlorine or
ozone on the dose of these disinfectants.
D No further work on the computational fluid dynamics of hydrodynamic cavitation since detailed flow
conditions that occur during cavitation cannot be modelled at present.

7 TECHNOLOGY TRANSFER
• The use of computational fluid dynamics in this project by ihc University of Polchcfsiroom for Christian
Higher Education to describe hydrodynamic cavitation in a venturi has resulted in further application of
this method in the Water Research Commission Project No. 6-18 : The Application of Computational Fluid
Dynamics to Improve the Design and Operation of Water and Wastewater Treatment Works.
D Technical assistance and information has been given to Snsol. Eskom, CG Smith nnd the University of
Durban-Westvilie on aspects of advanced o.\idation technology, in particular sonochemistry.
8 REFERENCES
Baga, AN, Johnson, G R A , Nazhat. N B and Saadalla-Nnzhat, RA, A Simple Spcctrophotometric
Determination of Hydrogen Peroxide at Low Concentrations in Aqueous Solution, Analytica Chimica
Ada. 1988, 204, 349-353.
Chang, I L., Zaleiko. N S and Pctersen. S A. UV Oxidation and Recovery System for Tannery Unhairing
Waste, American Leather Chemists Association. 77th Annual Meeting. Hilton Head Island, SC, 14-18
June 1981.
Chetty, S, The Evaluation of the Cavitation Process to produce Radical Species capable of Oxidising
Organic Pollutants in Industrial Wastewatcrs and Potable Water, AIScEng Thesis, 1994, University of
Natal, South Africa.
EPA (United States Environmental Protection Agency). CAV-OX® Ultraviolet Oxidation Process -
Magnum Water Technology, Superfund Innovative Technology Evaluation Demonstration Bulletin,
August 1993.
Hughes, D E and Nyborg, VV L. Cell Disruption by Ultrasound, Science, 1962.138. p. 10S.
Lipowicz, M, Rapid Oxidation Destroys Organ tcs in Wastcwater. Chemical Engineering, 1981, November,
40-41.
Makino, K, Mossaba. M M and Reisz, P, Chemical Effects of Ultrasound on Aqueous Solutions. Evidence
for OH and H radicals by Spin Trapping. Journal of the American Chemical Society, 1982, 104,
3537-3539.
Mason, T J, Sonochemistry : The Uses of Ultrasound in Chemistry, 1990, TJ Mason (ed), The Royal
Society of Chemistry, Cambridge.
Neylzell-de Wilde, F G and Chetty, S. Evaluation of Different Methods to Produce Free Radicals for the
Oxidation of Organic Molecules in Industrial Effluents and Potable Water. Report to Water Research
Commission , Project No. 388, February 1990.
Perry, R H, Chemical Engineer's Handbook, 1973, 5th Edition, McGraw Hill, Tokyo.
Petersen, S A and Zaleiko, N S, Innovative Oxidation Technology for Waste Pretreatment,
Water /Engineering <£ Management, 1981, February, 32-36.

10
Reisz, P, Kondo. T and Krishna. C M Sonochcmistry of Volatile and Non-volatile Solutes in Aqueous
Solutions. A Spin Trapping Study. Free Radical Research Conwiimicatrons. 1990,1(1-2). 27-35.
ShuLilov, V A, Fundamental Physics of Ultrasound. 1988. OPA Publishers, Amsterdam.
Suslick, K S, Ultrasound - Its Chemical, Physical and Biological Effects. 1988. VCH Publishers. New York.
Young. F R, Cavitation, 1989, McGraw Hill. London.
Yue, P L, Degradation of Organic Pollutants by Advanced Oxidation, Transactions of the Institute of
Chemical Engineers, 1992, 70 (Part B), 145-148.

Acknowledgements
The work in this report was undertaken for the Water Research Commission sponsored project entitled
Evaluation of Different Methods to produce Free Radicals for the Oxidation of Organic Molecules in
Industrial Effluents and Potable Water (with special reference to CAV-OX®)- The funding of this project by
the Water Research Commission is gratefully acknowledged.
The guidance and assistance of the following people involved in the Steering Committee are appreciated :
Dr 0 0 Hart Water Research Commission (Chairman)
Mr Z Ngcakani Water Research Commission (Chairman)
Mr PW Weideman Water Research Commission (Secretary")
Mr P Smit Water Research Commission (Secretary)
Mr G Offringa Water Research Commission
Mr JA McWilliam Diarec Diamonds
Mr RG Tracey Diarec Diamonds
Mr FJ du Toit SASTECH, Secunda
Dr P Stegman SASTECH, Secunda
Prof FG Neytzell-de Wilde University of Natal, Durban
Mr RJJ Egenes University of Natal, Durban
Dr M Starzak University of Natal, Durban
The research team for the project consisted of the following people :
Prof CA Buckley University of Natal, Durban
Dr BS Martincigh University of Natal, Durban
Prof JP Meyer Potchefstroom University for Christian Higher Education
Ms SJ Winship University of Natal, Durban
Ms CJ Botha University of Natal, Durban
Mr S Chetty University of Natal, Durban
Ms B Duvel University of Natal, Durban
Mr DJ Meyer Polchefslroom University for Christian Higher Education
Mr GW Sctnvikkard University of Natal, Durban
The contributions of various people and organisations to this work are gratefully appreciated. Thanks is
extended to:
Mr RG Tracey Diarec Diamonds
Mr J McWilliam Diarec Diamonds
Mr I Bailey and Ms J Abbot Umgeni Water, Pietemaritzburg
Dr P Stegman SASTECH, Secunda

Table of Contents
List of Figures
List of Tables
List of Annexures
Abbreviations
Glossary
Page
iv
viii
ix
x
xi
Chapter 1 : Introduction 1-1
Chapter 2 : Cavitation
2.1 Ultrasonic Cavitation
2.2 Hydrodynamic Cavitation
2-1
2-2
2-5
Chapter 3 : Effects or Cavitation 3-1
3.1 Theoretical Effects of Cavitation 3-1
3.1.1 Numerical Method 3-1
3.1.1.1 Assumptions 3-1
3.1.1.2 Modifications of the Numerical Method 3-2
3.1.2 Verification of the Numerical Method • 3-2
3.1.3 Captation in a Venturi 3-5
3.1.4 Cavitation Number 3-7
3.2 Physical Effects of Cavitation 3-8
3.2.1 Hydrodynamic Cavitation 3-8
3.2.1.1 Operating Conditions of the CAV-OX® System 3-8
3.2.1.2 Operating Conditions of the Hydrodynamic Cavitation Rig 3-10
3.2.1.3 Cavitation Numbers 3-11
3.2.1.4 Photographic Studies 3-12
3.2.1.5 Sound Emission 3-16
3.2.2 Ultrasonic Cavilalion 3-18
3.2.2.1 Sound Levels of the Ultrasonic Bath 3-19
3.2.2.2 Intensity of the Ultrasonic Bath 3-19
3.2.2.3 Temperature Profile of Water in the Ultrasonic Bath and Reaction Vessel 3-20

I l l
Page
3.3 Chemical Effects of Cavitation 3-22
3.3.1 Hydrodynamic Cavitation 3-22
3.3.1.1 Factors affecting Hydrogen Peroxide Determination in the CAV-OX® 3-22
System
3.3.1.2 Quantitation of Hydrogen Peroxide produced by Hydrodynamic Cavitation 3-26
3.3.2 Ultrasonic Cavitation 3-28
3.3.2.1 Hydrogen Peroxide Formation in the Ultrasonic Bath 3-28
3.3.2.2 Dissolved Oxygen in the Ultrasonic Bath 3-29
3.3.2.3 Degradation Kinetics of 1-Methythydantoin 3-30
3.3.2.4 Identification of Degradation Products from 1-Methylhydantoin 3-32
3.4 Biological Effects of Cavitalion 3-34
3.4.1 Hydrodynamic Cavitation 3-34
3.4.2 Ultrasonic Cavitation 3-39
3.4.3 Cavitation and Ultraviolet Irradiation 3-42
Chapter 4 : Conclusions
4.1 Theoretical Effects of Cavitation
4.2 Physical Effects of Cavitation
4.3 Chemical Effects of Cavitation
4.4 Biological Effects of Cavitation
4.5 Summary of Conclusions
4-1
4-1
4-1
4-2
4-3
4-3
Chapter 5 : Recommendations 5-1
Chapter 6 : Technology Transfer
6.1 Interaction with Other WRC Projects
6.2 Technology Transfer Aspects
6.3 Publications
6.3.1 Papers Presented at Conferences and Seminars
6.3.2 Poster Presentations
6.3.3 Papers in Journals
6.3.4 Theses
6.3.5 Other
6.4 Archiving of Data
6-1
6-1
6-1
6-1
6-1
6-2
6-2
6-2
6-2
6-2
References R-l

IV
List of Figures
FIGURE 1.1: Schematic diagram of the CAV-OX® system (EPA, 1993)
FIGURE 2 . 1 : Schematic diagram of the ultrasonic bath and temperature control system
(Schwikkard, 1992)
FIGURE 2.2 : Modified CAV-OX® system used for experiments (Chetty, 1994)
FIGURE 2.3 : Process instrumentation diagram of the hydrodynamic cavitation rig {Botha, 1993)
FIGURE 2.4 : Geometry and dimensions of the venturi used in the simulation of hydrodynamic
cavitation from a transverse view (a) and a cross-sectional view (b) (from
Meyer, 1993a)
FIGURE 3.1 : Comparison of normalised, numerically simulated velocity profile from STAR-CD
and the numerical results obtained using Launder's method (Launder and Spalding,
1973) with the experimentally determined velocity profile (Nikaradse in Mar t in i^
& Pollard, 1989; Pollard & Martinuzzi, 1989) for fully developed, turbulent flow in a
pipe at a Reynolds number of 380 000
FIGURE 3.2 : Numerically-simulated axial pressure drop profile for turbulent flow conditions
having a Reynolds number of 380 000 in a hydraulically smooth pipe with a radius of
6,477 mm using the STAR-CD program
FIGURE 3.3 : Comparison of cavitation in a venturi for numerically simulated results and
experimentally determined results {Hamit, etal., 1965) under the same flow
conditions (Reynolds number of 302 000)
FIGURE 3.4 : Theoretical velocity and pressure distributions in the CAV-OX® chamber (graphs (a)
and (b) respectively)

FIGURE 3.5 : Experimental hydraulic characteristics of the nozzle in the hydrodynamic cavitation
rig for different absolute inlet pressures. AP is equal to the difference in the inlet and
outlet pressures of the nozzle. Points A, B and C on the graph represent operating
conditions oflow, medium and high intensities of cavitation
FIGURE 3.6(i): Photographs of hydrodynamic cavitation produced in the CAV-OX® chamber for a
flow rate of 25 £/min and discharge pressures of (a) 0 kPa (a) and (b) 70 kPa
FIGURE 3.6(ii): Photographs of hydrodynamic cavitation produced in the CAV-OX® chamber for a
flow rate of 48 (Jmin and discharge pressures of (c) 18 kPa and (d) 70 kPa
FIGURE 3.7 : Photographs of hydrodynamic cavitation produced in the hydrodynamic cavitalion rig
under (a) low intensity, (b) medium intensity and (c) high intensity operating
conditions
FIGURE 3.8 : Sound pressure levels recorded in the CAV-OX® chamber for different flow rates.
The blank was determined by replacing the cavitation chamber with a stainless steel
pipe and recording the sound levels at different flow rales
FIGURE 3.9 : Octave frequency band spectra measured in the hydrodynamic cavitation rig for (a)
low intensity, (b) medium intensity and (c) high intensity cavitation conditions. The
backpressure conditions (outlet absolute pressures) at which the sound levels were
recorded for each intensity of cavilation are give in the legend of each graph
FIGURE 3.10 Temperature profile of 5 £ of water sonicated in the ultrasonic bath for 360 min
FIGURE 3.11 : Temperature profiles of the water in the reaction vessel and ultrasonic bath sonicated
for 360 min when the temperature of the bath was uncontrolled and when the
temperature of the bath was controlled at 25 °C
FIGURE 3.12: Decomposition of hydrogen peroxide solutions (a) exposed to light, (b) at a
temperature of 32 °C, (c) in the feed tank of the CAV-OX® equipment, and (d) in the
sample port of the equipment. The initial concentration of the hydrogen peroxide
solution was 1,5 mg/£

VI
FIGURE 3.13 : Decomposition of hydrogen peroxide solutions (a) exposed to light, (b) at a
temperature of 32 °C, (c) in the feed tank of the CAV-OX® equipment, and (d) in the
sample port of the equipment. The initial concentration of the hydrogen peroxide
solution was 0,6 mg/£
FIGURE 3.14 : Decomposition of 1,5 mg/£ hydrogen peroxide solution in the CAV-OX® equipment
at a flow rate of 48 £/min
FIGURE 3.15: Comparison of the decomposition rates for cavitated (indicated by •) and
non-cavitated (indicated by — ) hydrogen peroxide solutions for the various operating
conditions A, B, C and D in the CAV-OX® chamber
FIGURE 3.16 : Effect of dissolved oxygen on the formation of hydrogen peroxide in water
ultrasonically cavitated in the ultrasonic bath. The control represents hydrogen
peroxide produced in water in the absence of oxygen
FIGURE 3.17 : Dissolved oxygen concentration in 10 m£ water ultrasonically cavitated over 24 h in
the ultrasonic bath
FIGURE 3.18 : Sonochemical degradation of 1-methylhydantoin (1MH) solution (50 mg/i) in (a) the
absence of hydrogen peroxide and oxygen, (b) the presence of 1 332 mg/£ hydrogen
peroxide and absence of oxygen, and (c) the presence of 1 332 mg/£ hydrogen
peroxide with oxygen saturation prior to sonication. The control solutions were
identical unsonicated solutions maintained at a constant temperature
FIGURE 3.19: Comparison of the sonochemical degradation conditions for 50 mg/£
1-methylhydantoin
FIGURE 3.20 : Effect of (a) low intensity, (b) medium intensity, and (c) high intensity hydrodynamic
cavitation generated in the hydrodynamic cavitation rig on colony forming units in
raw water
FIGURE 3.21: Scanning electron micrographs of non-cavilated (Micrographs 1, 3 and 4) and
cavitated (Micrograph 2) samples of raw water

VII
FIGURE 3.22 : Plate counts for raw water sonicated for 2 h in the ultrasonic bath
FIGURE 3.23 : Scanning electron micrographs for unsonicated (Micrographs 5 and 6) and sonicated
(Micrographs 7 and 8) samples of raw water
FIGURE 3.24 : Plate counts for raw water sonicated for I min prior to UV irradiation
FIGURE 3.25 : Plate count for raw water sonicated for 10 min prior to UV irradiation
FIGURE 3.26 : Death curve for raw water bacteria irradiated with UV light of 254 nm
FIGURE 3.27 : Plate counts for raw water cavitated for 3 min prior to UV irradiation

VI11
List of Tables
TABLE 1.1: Second order reaction rates of ozone and hydroxyl radicals with various categories of organic
compounds (Yue, 1992)
TABLE 3.1 : Gauge pressures and flow rates measured in the cavitation chamber of the CAV-OX®
system during operation
TABLE 3.2: Operating conditions in the hydrodynamic cavitation rig selected for study where
ApnOzz.c = PWM - Pauuc (as absolute pressures)
TABLE 3.3 : Cavitation numbers and flow parameters for the venturi throat of the CAV-OX® chamber
TABLE 3.4 : Cavitalion numbers for the operating conditions selected for study in the hydrodynamic
cavitation rig
TABLE 3.5 : Operating conditions selected for the evaluation of hydrogen peroxide production in the
CAV-OX® chamber
TABLE 3.6 : Turbidity measurements and plate counts for raw water cavitaled at the highest cavitation
intensity (APnonJt = 472 kPa) in the hydrodynamic cavitation rig. (-) indicates no analysis

List of Annexures
ANNEXURE A : GW Schwikfcard. The Industrial Uses ofSonocheniistry, Report to Sasol. 1995
ANNEXURE B S Chetty, F G Ne)tzell-de Wilde and C A Buckley, Evaluation of Hydrogen Peroxide
and Ultraviolet Radiation of Oxidised Organic Molecules in Industrial Effluents and
Potable Water, 2nd Biennial Conference/Exhibition, Water Institute of Southern
Africa, World Trade Centre, Kempton Park, South Africa, 13 - 16 May 1991
ANNEXURE C Candace J Botha and Chris A Buckley, A Study of Hydrodynamic Cavitation as a
Method of Water Disinfection, Journal of Water Supply Research and Technology
- Aqua, 1995, Vol. 13, No. 2, in print

Abbreviations
AOP Advanced oxidation process
CFU Colony forming unit
DMP 2,9-Dimethyl-l,10-phennnthro]ine
EPA Environmental Protection Agency, United States of America
GAC Granulated activated carbon
HPLC High performance liquid chromatography
1MH l-Methylhydantoin
RO Reverse osmosis
UV Ultraviolet
WRC Water Research Commission, South Africa

Glossary
Agar
Bactericidal
Carcinogenic
Colony
Culture
Disinfection
Disinfectant
Escherichia coli
Faecal coliforms
Fluorescence
Heterotrophic Plate Count
(HPC)
Hydantoin
Inactivation
Oxidation
Radical
Raw water
Spore
A polysaccharide obtained from Gelidium (red alga) and other seaweeds;
used as a solidifying agent in culture media.
Capable of killing bacteria.
A cancer-producing substance.
A macroscopicaily visible growth of microorganisms on a solid culture
medium.
Any growth, population, or cultivation of microorganisms.
Destruction {or removal) of organisms capable of causing infection.
An agent that destroys the vegetative cells of infectious microorganisms.
Faecal conforms which lest indole-positive at 44,5 °C. Indication of faecal
contamination.
Conform bacteria that produce gas from lactose in a specially-buffered
broth incubated at 44,5 °C. Indicator of faecal pollution.
The immediate emission of visible light from a substance which has
absorbed radiation of a shorter wavelength from another source.
An enumeration technique which selects for aerobic heterotrophic
microorganisms. Also referred to as Standard Plate Count.
Five-membered ring compound containing two nitrogen atoms and two
carbonyl groups.
Loss of the ability to reproduce (cf death).
A chemical reaction in which a substance loses electrons, or hydrogen
atoms, or gains an oxygen atom.
An atom or group of atoms that posses an unpaired electron.
Water in an untreated state.
A type of resting cell characterised by its resistance to unfavourable
environmental conditions.

Chapter 1
Introduction
Environmental legislation and the increasing pollution of water supplies have necessitated the evaluation of
existing technologies and the development of new technologies for the removal of organic pollutants from
industrial effluents and potable water, and for the disinfection of potable water by the inactivation of bacteria
and pathogens.
Traditionally, organic contaminants in industrial effluents and potable water have been removed by separation
processes such as adsorption by granulated activated carbon (GAC), air stripping, fiocculation and filtration.
However, these methods merely transfer the pollutants from one phase to another resulting in problems in the
disposal of the waste. Chemical disinfectants, such as chlorine, chlorine dioxide and ozone, are currently used
in the production of potable water but there is increasing concern over the formation of potentially hazardous
by-products of these processes, e.g. trihalomethanes are toxic residuals formed in the chlorination of potable
water and are believed to be carcinogenic.
Recently, advanced oxidation processes (AOP's) have developed as potentially powerful methods for the
treatment of organic pollutants in water and the disinfection of potable water. These processes involve the
generation of highly reactive free radical intermediates such as the hydroxyl radical. The advantage of AOP's
is that organic pollutants can be completely mineralised to carbon dioxide, water and a small amount of acids,
while the degradation process usually operates at or near ambient temperature and pressure. In some cases,
complete mineralisation may not be achieved due to excessive reaction times, nevertheless. AOP's are
potentially beneficial as pretreatment steps that complement other treatment processes. For example, advanced
oxidation processes can be used to enhance the biodegradation of highly toxic pollutants.
The rates of advanced oxidation processes are greatly enhanced compared to those of oxidation with
conventional oxidants because of the high reactivity of the radical species, primarily hydroxyl radicals ("OH).
The reaction rates of hydroxyl radicals are typically 106 to 109 times faster than the corresponding reaction
rates of strong oxidants such as ozone, as can be seen from Table 1.1 (Yue, 1992). The rate constants assume
second order kinetics.

1-2
TABLE 1.1 : Second order reaction rates of ozone and hydroxyl radicals ivith various categories of
organic compounds (Yuc, 1992)
Categories of organic compounds
Olefins
S-containing organics
Phenols
N-containing organics
Aromatics
Acetylenes
Aldehydes
Ketones
Alcohols
Alkanes
Carboxylic acids
Rate constant (mol/£s)
O3
1 to 450 x 103
10 to 1,6 x 10³
103
10 to 10'
1 to 10-
50,00
10,00
1,00
10-= to 1
io-:
10J to 10":
•OH
10* to 10"
10* to 10'°
10'
10' to 10'°
10s to 10'°
10! to 10"
10'
10'to 10'°
10' to 10*
106 to 10'
107t0 10'
The hydroxyl radicals must be generated in excess for AOP's to be efficient for water purification purposes.
One way in which to achieve this is the irradiation of hydrogen peroxide (H,O,) with ultraviolet (UV) light
which induces the decomposition of hydrogen peroxide to form two hydroxyl radicals. Advanced oxidation
technologies include processes involving hydrogen peroxide, ozone, ultrasound and UV radiation, or
combinations of these. The broad objective of this project was to evaluate different methods for the production
of free radicals for the oxidation of organic compounds in industrial effluents and potable waters. This was to
be achieved by:
D The investigation of the oxidation rate and daughter products of various advanced oxidation processes, or
combinations thereof, on a sequence of model organic compounds.
• The investigation of the disinfection properties of various advanced oxidation processes on model
microbiological indicators,
D The investigation of the effectiveness of these processes on a selected number of process streams such as
coloured textile effluent and toxic organic chemical steams.
Watergroup (USA) has developed an advanced oxidation technology (CAV-OX® process) that employs UV
radiation, hydrogen peroxide and hydrodynamic cavitation to degrade organic compounds present in water at
mg/£ concentrations to nondetectable levels by photolysis and oxidation (EPA, 1993). Ideally, the end products

1-3
of the process are water, carbon dioxide, halides and, in some cases, organic acids. The CAV-OX® system has
been used to treat groundwaler contaminated with volatile organic compounds such as trichloroethylene,
benzene, toluene and xylene {EPA, 1993). A similar oxidative process combining hydrogen peroxide,
hydrodynamic cavitation and ultraviolet radiation has resulted in up to 98 % decreases in the organic
concentrations of various wastes, e.g. beverage-making effluent, tannery waste, activated sludge and raw
sewerage (Lipowicz, 1981; Petersen and Zaleiko, 1981). The major components of a CAV-OX® system are
the cavitation chamber, UV reactor and control panel. Figure 1.1 shows the configuration of the CAV-OX©
system.
WaterInput
I
Low EnergyUV Reactor
Equalisation Tank
HydrogenPeroxideAddition
Recycle
LCavitation Chamber
Influent Holding Tank
WaterOutput
High EnergyUV Reactor
FIGURE 1.1 : Schematic diagram of the CAV-OX® system (EPA, 1993)
In addition to the production of hydroxyl radicals by the UV photolysis of hydrogen peroxide in the UV
reactor, it is claimed that hydrodynamic cavitation, induced in a venturi nozzle in the cavitation chamber,
generates hydroxyl radicals and hydrogen atoms which recombine to form hydrogen peroxide and hydrogen
gas (EPA, 1993). Hydrodynamic cavitation is the reduction of pressure in a liquid stream by increasing the
velocity of the liquid by constricting the fluid flow, e.g. in a valve, orifice, etc., and subsequent collapse of the
resulting bubbles.
Preliminary evaluation of a CAV-OX® system in 1990 by the Pollution Research Group on the behalf of
Diarec Diamonds indicated that hydrodynamic cavitation enhanced the effect of hydrogen peroxide and UV
radiation on the decolourisation of dye effluent thus supporting the claims that hydrodynamic cavitation
generates hydroxyl radicals (Neytzell-de Wilde and Chetry, 1990). It was also proposed that hydrodynamic
cavitation alone may have the potential to inactivate pathogenic bacteria since UV radiation and hydrogen
peroxide, the other constituents of the CAV-OX® system, are known to successfully inactivate bacteria.

1-4
Hydrodynamic cavilation could therefore provide a less capital intensive technique to the present use of
chlorine as a disinfectant for raw water treatment since cavitation venturi nozzles could be installed in water
systems to exploit the existing pressure/velocity head. It could therefore Find application in the production of
potable water in rural areas. Therefore, the emphasis of this research project was the investigation of
hydrodynamic cavitation for the production of free radicals for the treatment of potable water and industrial
effluents with particular reference to the CAV-OX® system. Ultrasonic cavilation was also investigated
during this research project, mainly as a comparative technique since the cavilation effects of sonic waves has
been well documented. Consequently, this project investigated the following areas:
D The microbiological assessment of hydrodynamic cavitation for the treatment of raw water.
• The evaluation of hydrodjiiamic cavitation in the CAV-OX® system.
D The effect of ultrasonic cavitiition on organic pollutants in industrial effluents.
• The computational fluid dynamics of hydrodynamic cavitation in a venturi..
The potential for the use of hydrodynamic cavitation as a raw water treatment process was assessed by
determining the effect of hydrodynamic cavitation on the inactivation of viable bacteria in raw water. The
original intention was to use a model, single bacteria species, e.g. Escherichia colt, as an indicator of the
effectiveness of hydrodynamic cavitalion for bacterial inactivation. However, as naturally-occuring bacteria
are believed to be more resilient to treatment than laboratory-cultured species, raw water containing a variety
of bacteria, was initially used as the indicator since it provided a realistic representation of the bactericidal
efficiency of hydrodynamic cavitation. Once the efficiency of a process has been established, the
microbiological quality of the water can be evaluated by using selected species of bacteria as indicators.
The CAV-OX® system supplied to the Pollution Research Group by Diarec Diamonds was investigated
primarily to determine the concentration of hydrogen peroxide produced by hydrodynamic cavitation in the
cavitation chamber. Prior to this, the efficiency of hydrodynamic cavitation produced by the venturi nozzle of
the cavitation chamber was determined. Factors affecting the rate of peroxide formation during cavitation
were also investigated.
The effect of ultrasonic cavitation on organic pollutants in industrial effluents was investigated as part of an
allied Sasol research project in which the viability of ultrasound to degrade hydantoin compounds to more
biodegradable products was considered. Hydantoin compounds are formed during the coal gasification process
by combination of cyanide, ammonia, carbon dioxide and a ketone, and accumulate in the effluent stream from
the coal gasification plant at SasoL Ultrasound was used as a degradation technique instead of hydrodynamic
cavitation since it is widely reported that ultrasound produces cavitation from which hydroxyl radicals are
formed. It was postulated that the hydroxyl radicals formed during sonication would oxidise the hydantoin
compounds and the degradation products could then be identified and assessed for their biodegradability.

1-5
The investigation of computational fluid dynamics as a method to determine the experimental conditions
which could lead to cavitation in a venturi was undertaken by the Department of Mechanical Engineering at
Potchefstroom University for Christian Higher Education. The STAR-CD program was used to determine
numerical results for experimental flow conditions in a venturi. Good agreement of the experimentally
determined and numerically simulated results for the same flow conditions was used to validate the numerical
results.
This report combines the results from these different investigations by highlighting the aspects of the work
achieved, the results obtained and the conclusions reached. This report is divided into three parts.
Chapter 2 consists of a discussion of cavitation and summary of its characteristics as reported in literature.
Also included are the experimental setups of the equipment used in the project.
Chapter 3 summarises the experiments performed and discusses the results obtained from the projects. This
chapter is organised in terms of the theoretical, physical, chemical and biological effects caused by cavitation.
The section on theoretical aspects considers the work undertaken on the computational fluid dynamics of
cavitation. The physical characteristics observed in the CAV-OX® system, hydrodynamic cavitation rig and
ultrasonic cleaning bath are described in the section on the physical effects of cavitalion. Similarly, the
chemical effects produced in the CAV-OX® system, hydrodynamic cavitalion rig and ultrasonic cleaning bath
are reported in their own section. The section on the biological effects of cavitation contains the work
undertaken to evaluate the microbiological effectiveness of hydrodynamic cavitation produced in the
hydrodynamic cavitation rig.
The conclusions from this project are presented in Chapter -I and recommendations for future work are
discussed in Chapter 5 of the report. Chapter 6 details the list of publications and technology transfer actions
taken during this project. The data resulting from the project is available in the Anncxurcs to this report.

Chapter 2
Cavitation
Cavitation is defined as the formation, expansion and implosion of bubbles in a liquid (Perry, 1973; Suslick.
1988; Young, 1989; Riesz, et aL, 1990). Bubbles are formed due to the reduction of local pressure in a liquid
to the vapour pressure of the liquid at a specific temperature. Theoretical calculations indicate that a minimum
pressure (known as the cavitation threshold) of 1 013 MPa is required to form bubbles (Shutilov, 1988).
However, experimental observations indicate that the cavitation threshold varies from 101 to 2 532 kPa,
although a cavitalion threshold of 20 260 kPa has also been reported (Chetty, 1994). The bubbles, which
contain gas, vapour or a mixture of both, expand as a result of the reduction in pressure at constant
temperature (cavitation) or by an increase in temperature (boiling). The vapour bubbles formed by cavitation
consist mainly of gases which have come out of solution. The formation of these cavities is also dependent on
the presence of nuclei which can either be submicroscopic gas bubbles or solid particles.
The cavities collapse when the local pressure is greater than the vapour pressure of the liquid. Collapse of
these bubbles leads to the release of considerable energy which is claimed to generate sufficient localised
temperatures and pressures to form hydro.wl radicals and hydrogen atoms from the thermal dissociation of
water molecules (Chang, et al., 1981). Localised temperatures of up to 2 273 K and pressures up to
20 260 MPa have been reported (Petersen and Zaleiko, 19S1). However, instantaneous localised temperatures
have been predicted to be 5 000 K with pressures ranging from 101 MPa (Suslick, 1988;. Mason, 1990a) to
101 300 MPa (Noltingk and Neppiras, 1950 in Hughes and Nyborg, 1962) upon collapse of the bubbles.
Noise, vibration and extensive pitting of boundary materials is caused in the regions of bubble collapse (Perry,
1973).
Cavitation can be produced in a liquid by four different methods :
• Bydrodynamic cavitation is produced as a result of pressure variations in a flowing liquid due to the
geometry of the system.
• Acoustic cavitation is produced by sound waves in a liquid which cause pressure variations.
• Optic cavitation is produced by photons of high intensity light (i.e. laser) that rupture a liquid.
• Particle cavitation is a result of any type of elementary particles, e.g. protons, rupturing a liquid.
The formation of free radicals due to the dissociation of water molecules into hydroxyl radicals and hydrogen
atoms has been reported under the conditions of acoustic cavitation (Makino, et al., 1982) and hydrodynamic
cavitation has been claimed to result in the production of hydroxyl radicals (Pelersen and Zaleiko, 1981). Free

2-2
radicals are defined as an atom or group of atoms that possess an unpaired electron {Morrison and
Boyd, 19S7).
Hydrodynamic cavitation was investigated for its potential to produce hydroxyl radicals and its ability to
inactivate bacteria in raw water since this is the form of cavitation utilised in the CAV-OX® system. Since
there is much information available in literature on ultrasonic cavitation, this was used as a comparative
technique for the inactivation of raw water bacteria. Ultrasonic cavitation was selected as the process for the
degradation of hydantoin compounds in industrial effluent.
2.1 ULTRASONIC CAVITATION
In a stationary liquid, the ambient pressure can be varied by the transmission of sound waves through the
medium. Ultrasonic cavitation occurs if the pressure amplitude of the applied sound is greater than a certain
minimum pressure called the cavitation threshold (Webster, 1963). Two types of cavitation result: transient
cavitation and stable cavitation. Transient cavitation involves a relatively violent activity in which spots of
high temperatures and pressures occur in very short bursts at localised points in the sonicated medium. These
implosions may be accompanied by localised shock waves and/or the generation of free radicals. Stable
cavitation is a much less violent phenomenon associated with vibrating gaseous cavities. Due to oscillations of
the bubbles, the adjacent liquid flows. This effect can be increased by the collapse of cavities which results in
shock waves that enhance the flow of liquid. This is termed as microstreaming.
Inactivation of bacteria by ultrasound has been proposed to result from the microstreaming effect of ultrasonic
cavitation (Scherba. et al., 1991). However, ultrasonic cavitation also gives rise to various effects such
as mechanical forces due to surface resonances of the bacterial cell wall, pressure gradients resulting from the
collapse of cavities near the cell wall or the radial resonances of bubbles, velocity effects of the direct sound
beam and free radical formation (Neppiras and Hughes, 1964). In addition, shearing stresses can result from
shock waves (Thacker, 1973). Although doubt exists as to the exact cause of bacterial inactivation by
ultrasonic cavitation, it seems unlikely that free radical attack of the bacterial cell wall is responsible since cell
rupture and free radical formation occur independently of one another (Hughes and Rogers, 1959 in Neppiras
and Hughes, 1964). A possible explanation for this is that the peroxide radicals that are formed during
cavitation are scavenged by the suspending medium (Thacker, 1973), It is, however, suggested that bacterial
cell rupture occurs as a result of the mechanical stresses that occur during ultrasonic cavitation (Hughes and
Nyborg, 1962; Thacker, 1973).
2-3
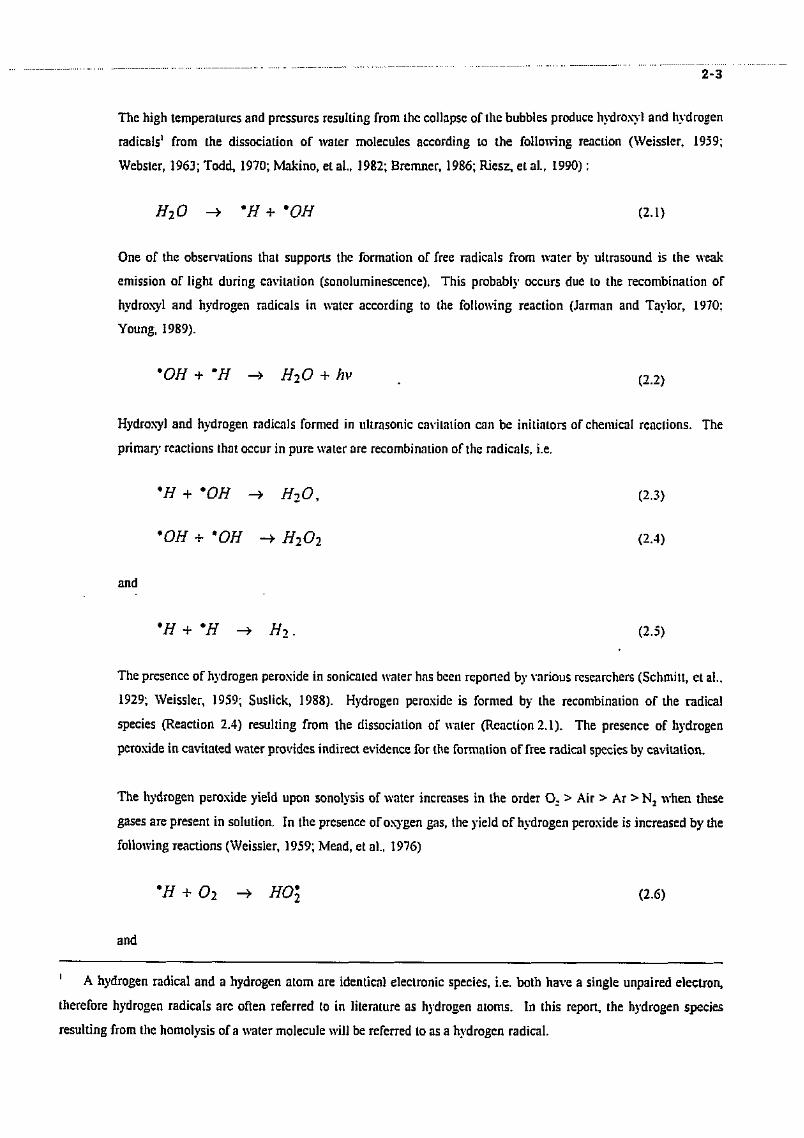
The high temperatures and pressures resulting from the collapse of the bubbles produce hydroxyl and hydrogen
radicals1 from the dissociation of water molecules according to the following reaction (Weissler, 1959;
Webster, 1963; Todd, 1970; Makino, et al., 1982; Bremner, 1986; Riesz, et al.r 1990):
H2O -» 'H + 'Off (2.1)
One of the observations that supports the formation of free radicals from water by ultrasound is the weak
emission of light during cavitation (sonoluminescence). This probably occurs due to the recombination of
hydroxyl and hydrogen radicals in water according to the following reaction (Jarman and Taylor, 1970;
Young, 1989).
•OH + *H -> H2O + hv , (2.2)
Hydroxyl and hydrogen radicals formed in ultrasonic cavitation can be initiators of chemical reactions. The
primary reactions that occur in pure water are recombination of the radicals, i.e.
•H + 'OH -> H2O, (2.3)
•OH + 'OH -» H2O2 (2.4)
and
*H + mH - » H2. (2.5)
The presence of hydrogen peroxide in sonicated water has been reported by various researchers (Schmitt, et al..
1929; Weissler, 1959; Suslick, 1988). Hydrogen peroxide is formed by the recombination of the radical
species (Reaction 2.4) resulting from the dissociation of water (Reaction 2.1). The presence of hydrogen
peroxide in cavitated water provides indirect evidence for the formation of free radical species by cavitation.
The hydrogen peroxide yield upon sonolysis of water increases in the order O, > Air > Ar > N2 when these
gases are present in solution. In the presence of oxygen gas, the yield of hydrogen peroxide is increased by the
following reactions (Weissler, 1959; Mead, et al., 1976)
•H + O2 -> HOI (2.6)
and
1 A hydrogen radical and a hydrogen atom are identical electronic species, i.e. both have a single unpaired electron,
therefore hydrogen radicals are often referred to in literature as hydrogen atoms. In this report, the hydrogen species
resulting from the homolysis of a water molecule will be referred to as a hydrogen radical.

2-4
HQ\ + H0\ -> H2O2 + 02 • (2.7)
The addition of hydrogen gas to oxygenated water can further enhance the yield of hydrogen peroxide by
increasing the yield of hydrogen radicals from the dissociation of hydrogen gas. These hydrogen radicals
subsequently react with the oxygen present (Reaction 2.6) thus increasing the yield of hydrogen peroxide as a
result of Reaction 2.7. However, enhancement of the hydrogen peroxide yield only occurs for a maximum
concentration of hydrogen of 20 %. Above this concentration, the yield of hydrogen peroxide decreases due to
the reaction of hydroxyl radicals with hydrogen gas according to Reaction 2.8 :
*OH + H2 - » H2O + * H (2.8)
Various other radical reactions occur which lead can lead to complex chemical reactions {Mead, et al., 1976;
Weissler, 1979). Schwikkard (1994) discusses these reactions in detail. The hydroxyl radicals generated in
ultrasonic cavitation can react with organic compounds present in solution resulting in the oxidation of these
compounds.
Laboratory-scale sonochemical experiments can either be performed using an ultrasonic bath or probe.
Ultrasonic reactors are available for lnrge-scale industrial uses of sonochemistry. Generally, the use of
different equipment makes comparison of published results for sonochemical experiments in literature difficult
since factors such as the frequency and power output of the bath, size of the bath, the type of the reaction vessel
and its position in the bath {Mason, 1991). Consequently, each ultrasonic bath and probe will give an unique
result. Indirect comparison of the intensity of cavitation induced by sonic waves can be made by the
quantitation of the hydrogen peroxide produced by the recombination of hydroxyl radicals formed during
ultrasonic cavitation. This was carried out during the investigation of hydantoin degradation by ultrasonic
cavitation (Schwikkard, 1994).
A KERRY Pulsatron cleaning bath was used for the experiments involving ultrasonic cavitation. This bath has
a capacity of 8 £ and operates at a frequency of 38 kHz (220/240 V; 50/60 Hz phase). A temperature control
system was installed by Schwikkard (1992). Figure 2.1 illustrates the setup of the ultrasonic bath used in the
experiments.

2-5
TemperatureProbe
!
"T1 1Ullrasonic Balh
1 1
Ice Finger
1 <
Constant TemperatureBath
'. TemperatureRegulator
FIGURE 2.1 : Schematic diagram of the ultrasonic bath and temperature control system
(Schivikkard, 1992)
2.2 HYDRODYNAMIC CAVITATION
Hydrodynamic cavitation occurs when the pressure of a fluid liquid stream can be decreased by increasing the
velocity of the liquid. This causes a decrease in the local pressure to less than the vapour pressure of the liquid
resulting in the formation of vapour-filled cavities in the liquid (Young, 1989).
There are three cases of flow cavitation :
• Travelling citvitntion occurs when bubbles form within a liquid which, as they travel with the liquid,
expand and subsequently collapse.
• Fixed cavitation occurs when a bubble forms that is attached to an immersed body, or to the surface of the
flow channel, and remains fixed in position in an unsteady state.
• Vortex cavitation occurs in the cores of vortices that form in regions of high shear.
Travelling cavitation occurs in the cavitation nozzle of the CAV-OX® system. It is possible that free radical
formation can be produced by hydrodynamic cavitalion in a nozzle due to the high temperatures generated on
collapse of the bubbles. This appears to be confirmed by reports that luminescence has been observed in
venturi nozzles (Jarman and Taylor, 1964, 1965; Peterson and Anderson, 1967). The formation of hydroxyl
radicals in the CAV-OX® system as a result of hydrodynamic cavitation was therefore im'estigated (Chetty,
1994). Prior to experimentation, the CAV-OX® system was modified by disconnecting the cavitation chamber
from the ultraviolet reactors and the system connected so that water could be recirculated through the
cavitation chamber that contained the nozzle. A transparent tube was connected after the outlet to the
cavitation chamber to observe if cavitation persisted in the liquid after the cavitation chamber. A gas inlet was
added to the system before the feed pump to the cavitation chamber so as to facilitate mixing of the two
phases. Valves were added between the feed pump and the cavitation chamber to control the flow rate. Figure
2.2 illustrates the modified CAV-OX® system.
2-6
'SS/*-y-'SfW.*r'A S'\ :
feed tank
feedpressure
(
cavitattonpressure
Flow meter
dischargepressure
flow controlvalves
Cavilalion chamber
feed pump
gas line
FIGURE 2.2 : Modified CAV-OX® system used for experiments (Chctty, 1994)
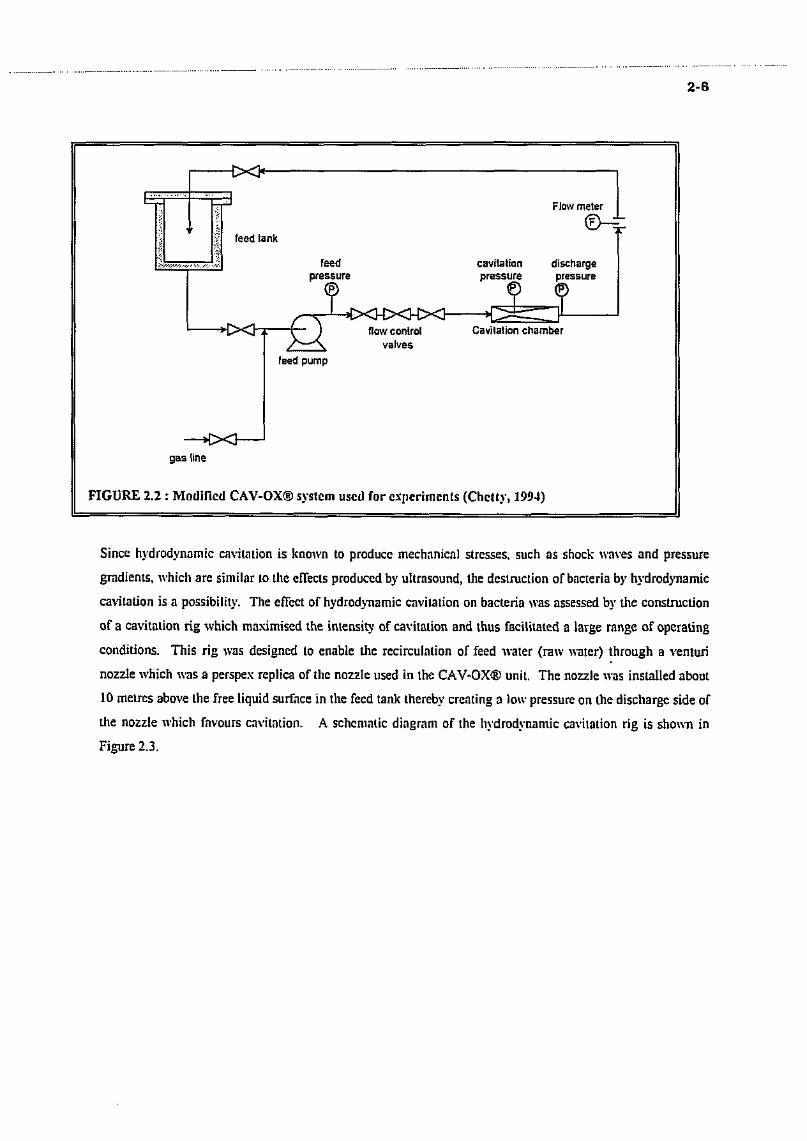
Since hydrodynamic cavitation is known to produce mechanical stresses, such as shock waves and pressure
gradients, which are similar to the effects produced by ultrasound, the destruction of bacteria by hydrodynamic
cavilation is a possibility. The effect of hydrodynamic cavitation on bacteria was assessed by the construction
of a cavitation rig which maximised the intensity of cavitation and thus facilitated a large range of operating
conditions. This rig was designed to enable the recirculation of feed water (raw water) through a venturi
nozzle which was a perspex replica of the nozzle used in the CAV-OX® unit. The nozzle was installed about
10 metres above the free liquid surface in the feed tank thereby creating a low pressure on the discharge side of
the nozzle which favours cavitation. A schematic diagram of the hydrodynamic cavitation rig is shown in
Figure 2.3.

2-7
(Ft) Pressure transducer
QV) Inlet pressure gauge
(J_) Throat pressure gauge
Q|) Ouliet pressure gauge
QQ Flowmeier
10m
v3
FIGURE 2.3 : Process instrumentation diagram of the hydrodynamic cavitation rig (Botha, 1993)
Both pieces of equipment, i.e. the CAV-OX® system and the hydrodynamic caviialion rig, were evaluated for
their ability to produce cavitation by characterising the nozzle hydraulics in terms of flow rate, sonic pressure
levels, energy input and cavitation number. The results are summarised in Chapter 3 of this report.
A venturi was used in the numerical simulation of the flow conditions leading to hydrodynamic cavitation
using computational fluid dynamics (Meyer, 1993a). The dimensions of the venturi used in this investigation
were identical to those of the venturi used in the experimental investigation of the damage caused by cavitating
flow in a venturi on metal inserts to ascertain the cavitalion damage that occurs on bladed profiles such as
propeller blades (Hamit, et al.,1965). The venturi which consists of a nozzle, throat and diffuser, is illustrated
in Figure 2.4.

2-8
(a)
20,10
V
Nozzle Throat Diffuser & InsertI I A-»i
m•—V
• 76,50-
' 136,17 —
™ 146.63"
B-+
211.17
2D.B1
i
(b)
•«-45'
Inser Insert
FIGURE 2.4 : Geometry and dimensions of the venturi used in the simulation of hydrocJynamic
cavitation from a transverse view (a) and a cross-scctiona! view (b). Unless specified, all the
measurements are in mm (from Meyer, 1993a)
The nozzle is the convergent section of the venturi, i.e. the area of the venturi through which the flow
decreases, and has a length of 76,0 mm and an included angle of 6 °. The throat section of the venturi has a
constant radius of 6,477 mm and is 59,67 mm in length. The convergent section of the venturi is the diffuser
which has a length of 64,54 mm and an included angle of 6 °. The total length of the venturi is 211,17 mm.
Two bladed-profile inserts were placed in the diffuser of the venturi, 143,46 mm from the inlet of the throat
(Figure 3.3(a)). As illustrated in Figure 3.3(b), these inserts were placed at right angles to each other.
Chapter 3 summarises the results obtained from the investigations of ultrasonic and hydrodynamic cavitation
using the equipment reported in this chapter.
Chapter 3
Effects of Cavitation
This chapter consolidates the results obtained from the four areas of research that comprised this project,
namely,
• The computational fluid dynamics of hydrodynamic cavitation in a venturi.
• The microbiological assessment of hydrodynamic cavitation for the treatment of raw water.
D The evaluation of hydrodynamic cavilation in the cavitation chamber of the CAV-OX® system.
• The effect of ultrasonic cavitation on organic pollutants in industrial effluents.
The results from the various areas are organised and discussed in terms of the theoretical, physical, chemical
and biological effects of cavitation since each of the above research topics could encompass more than one of
these aspects.
3.1 THEORETICAL EFFECTS OF CAVITATION
This section reviews the results obtained using computational fluid dynamics (CFD) to investigate the flow
conditions that initiate hydrodynamic cavitation. In order to verify the numerical simulation, the results from
the computer simulation of the flow in a venturi were compared with the experimental results available in the
literature (Hamit, 1963; Hamit, et al., 1965; Ivany, et al., 1966).
3.1.1 Numerical Method
The flow through a venturi under cavitating conditions was simulated using an academic version of the
STAR-CD program run on a convex parallel-processing minicomputer. This program can successfully
simulate three-dimensional flow with heat transfer in complex geometries (STAR-CD manual, 1993).
3.1.1.1 Assumpt ions
• As mentioned in the previous chapter, hydrodynamic cavitation involves the formation of vapour-filled
cavities (bubbles) in a fluid, i.e. two-phase flow occurs during hydrodynamic cavitation. However, since
the STAR-CD program used in this study could not simulate two-phase flow, it was assumed that the
bubbles are a minor component of the flow when evaluated from the whole perspective and therefore only
the fluid phase (single-phase flow) was simulated.
• The flow was assumed to be incompressible due to the fact that the gaseous phase, which causes extreme
pressures in a cavitating fluid, was not simulated.

3-2
• The flow through the venturi nozzle was assumed to be steady due to the absence of the gaseous phase
(bubbles).
• To enable comparison of the numerical results with the experimental results (Hamit, 1963; Hamit, et al.,
1965; Ivany, et al., 1966), turbulent flow through a venturi was simulated.
• As the gaseous component of cavitation was not considered in the simulation and heat is only generated
upon gaseous bubble collapse (Mason, 1990a; Suslick, 1989 in Mason, 1991), the flow was assumed to be
isothermal.
3.1.1.2 Modifications of the Numerical Method
The above assumptions enable the simplification of the Navier-Stokes equations which describe flow
conditions such that the numerical method is less involved (Anderson, et al,, 1984; STAR-CD manual, 1993).
However, the Navier-Stokes equations cannot numerically simulate the macroscopic effects of turbulent flow
since the time and distance increments used in the numerical simulation have to be extremely small.
Consequently, the simulation is time-consuming as a number of equations are required to be solved for every
grid point, in addition, only a small part of the flow can be simulated in this way. This problem can be
overcome by solving the effect of turbulence, and not the details of turbulent flow, with the k-e turbulence
model {Anderson, et al., 1984).
As pressure is not a primary variable in the equations that describe flow, the SIMPLE-algorithm, which
calculates a pressure field from the continuity equation and then solves for the velocities in the momentum
equations (Patankar, 1980), was used in the STAR-CD program. The conjugant-gradient method is used to
solve the algebraic equations (STAR-CD manual, 1993).
3.1.2 Verification of the Numerical Method
Evaluation of the STAR-CD program for the simulation of various flow problems and benchmarks1 has
resulted in good correlation with experimental results. However, in order to use this program to numerically
simulate the flow conditions required for the development of cavitation in a venturi, it was necessary to
determine the inlet flow conditions for a venturi. Therefore, fully-developed, turbulent flow through a pipe
was simulated using the STAR-CD program and the numerical results verified by comparison with the
published experimental results in Martinuzzi &. Pollard (1989) and Pollard & Martinuzzi (1989). The
turbulent flow in this simulation had a Reynolds number of 380 000 in order to conform with the experimental
flow conditions.
1 A benchmark is a standardised experiment carried out to evaluate numerical results to verify a numerical method,
simulation or algorithm. The conditions of the experiment are very controlled (all the necessary boundary conditions are
known) hence the results should be extremely accurate (Meyer, 1993b).

3-3
A fully turbulent flow profile in a pipe is only established after 50 to 80 pipe diameters. Thus, to model
turbulent flow in a pipe with a radius of 6,477 mm, simulation of more than 640 mm of pipe before the venturi
is required. The simulation of this pipe section could be avoided by specifying a velocity profile at the inlet to
the venturi which would numerically simplify the simulation by reducing its size. The Blasius = Law
(Daugherry, et al., 19S9) was used to specify the velocity profile at the inlet of a hydraulic smooth pipe :
_u_ _ (R - R)'"max ~ R ( j l )
where:
u = the axial velocity for a pipe of radius, r
umiI = the maximum velocity in the pipe
R = the radius of the pipe wall
The grid used in the pipe had 50 x 17 x 9 (7 650) points in the axial, radial and angular directions respectively.
The first point was chosen close enough to the wall to enable the use of the wall-functions to simulate the effect
of the rigid wall on the flow as described by Launder and Spalding (1973) and the STAR-CD manual (1993).
Prior to simulation with the STAR-CD program, the velocity was normalised by using the mean velocity in the
pipe (um n j and the radial position [normalised with the pipe radius (R) of 6,477 mm. The normalised,
numerically simulated velocity profile for fully-developed turbulent flow in a pipe (Reynolds number of
380 000) was compared with the experimental results of Nikuradse (Martinuzzi & Pollard, 1989; Pollard &
Martinuzzi, 1989) and the numerically simulated results using Launder's method (Launder and Spalding,
1973). The results are illustrated in Figure 3.1.

3-4
1,6
1.4
1.C
Jf 0,6
0,6
0,4
0,2
0,0
-•- Experimental
— STAR-CD
TIE- Launder & Spalding
0,0 0,1 0,2 0,3 0,4 0,5r/R
0,6 0,7 0,8 0,9 1,0
FIGURE 3.1 : Comparison of normalised, numerically simulated velocity profile from STAR-CD
and the numerical rcults obtained using Lnundcr's method (Launder and Spnlding, 1973) with the
experimentally determined velocity profile (Nikaradse in Miirtinuzzi & Pollard, 1989; Pollard &
Martinuzzi, 1989) for fully developed, turbulent flow in a pipe at a Reynolds number of 380 000
From Figure 3.1, it can be seen that, near the symmetry axis (r/R < 0,3), there is a better fit of the
numerically-simulated results from STAR-CD with the experimental results than those from Launder's
method. However, between r/R = 0,3 and r/R = 0,8, Launder's results compare better with the experimental
results , but near the wall of the pipe (r/R > 0,8), the STAR-CD results agree more with the experimental
results. This region is important since prediction of the correct velocities and pressures near the wall of a pipe
is essential for the simulation of cavitation near a rigid wall where cavitation erosion could occur. The
deviations between the simulated and experimental results are probably due to the unknown wall roughness
used in the experiments and the simulations (a hydraulically smooth pipe was used in the STAR-CD program).
It was therefore concluded that the numerically-simulated results from the STAR-CD program satisfactorily
predict the experimental conditions for turbulent flow in a pipe.
The axial pressure drop profile in the pipe was also determined using the STAR-CD program and the results
are illustrated in Figure 3.2.

3-5
FIGURE
having a
using the
kPa)
Pre
ssur
e a
t pi
pe c
entr
a {
3.2 : Num
140
120
100
BO
eo
40
20
0
X- X
-
0 5 10
erically-simulntcd
Reynolds number of 380 000
STAR-CD )rogram
• • l i t .15 20 25
Axial distance
axial pressure
V•
t30
(mm)
drop
v
I f r . i + \35 40 45 SO
profile for turbulent flow conditions
in a hydraulicnlly smooth pipe with a radius of 6,477 mm
Initially, the pressure drop is non-linear as the inlet velocity used in the simulation was estimated by
Equation 3.1. From Figure 3.2, the simulated pressure drop across the pipe was determined to be 2,666 kPa/m.
A pressure drop of 2,895 fcPa/m was calculated from the Moody chart (Daugherty, et al., 1989). Since the wall
roughness is unknown, the correlation between the simulated and experimental results is satisfactory.
3.1.3 Cavitation in a Venturi
The simulation of cavitation in a venturi (refer to Figure 2.4) was performed for flow having a Reynolds
number of 302 000 and under standard cavitation conditions. Standard cavitation refers to the condition in
which termination of cavitation occurs approximately 155 mm from the inlet of the venturi. The numerical
results were then compared with experimental results which were obtained for standard cavitation conditions
in a venturi (Hamit,1963; Hamit, et al., 1965).
For incompressible flow conditions in the numerical simulation, the pressure field is calculated relative to an
arbitary zero pressure at the outlet of the venturi, i.e. only the pressure drop is important as this causes the
flow. However, for standard cavitation conditions, the absolute static pressure is required and can be
determined from the experimental results for a specific point in the venturi. In the numerical simulation, this
point was chosen at the beginning of the divergent part of venturi, 136,17 mm from the inlet and the static
pressure at this point can be calculated from the cavitation number. The captation number, crc, is defined as :

3-6
P - Pv
—pulu
where :
P = local static pressure (kPa)
Pv = saturated vapour pressure at the fluid temperature (kPa)
p = fluid density (kg/m3)
um = mean throat velcity (m/s).
Hammit , et al. (1965) experimentally determined a cavitation number, a , of 0,01 for standard cavitation of
water (density of 998 kg/m-1) in a venturi containing bladed inserts at a Reynolds number of 302 000, i.e. for a
mean throat velocity of 23,36 m/s. A calculated static pressure of 2,45 kPa therefore exists in the fluid at the
point 136,17 mm from the inlet of the venluri for a vapour pressure of 2,339 kPa and the experimental
cavitation conditions of Hamit, et al. (1965). The pressure used in the numerical simulation of cavitation at
this point was adjusted so that it would equal the experimental static pressure at this point in the venturi.
Figure 3.3 compares the experimental results of Hamit, el al. (1965) with the numerically simulated results
obtained for the cavitation numbers at the difierent axial points where pressure was measured in the venturi.
Point (I on the graph is the reference point, 136,17 mm from the inlet of the venturi, where the static pressure
of 2,45 kPa exists.

3-7
ion
num
berc
r
ro
Cav
i
1 2 .
1.0
0,8
0,6
0,4
0.2
0,0
-
- X
i i
I i
i i
I t
^ \ '- \
\
i . , , i i i i i i, i , 11 , ,
-25 0 25 50 75
-+- Experimental results
— Numerical results
i
M^rr*&L J,,
100 125 150 175 200 225
Axial distance (mm)
FIGURE 3,3 : Comparison of cavitation
experimentally determined results (Hamit,
number of 302 000)
in a
et a l ,
venturi for numerically simulated results and
1965) under the same flow conditions (Reynolds
The numerically simulated cavitation number profile was calculated using a series of axial program points on
the wall of the venturi and shows reasonable agreement with the experimental values. The numerically
calculated cavitation number is lower than the experimental results at the inlet of the venturi due to the lower
pressure loss resulting from the simplified inlet geometry used in the program. In addition, the pressure
defined at the inlet in the simulation and experiments is different which would also affect the results. The
unspecified wall roughness and local effects caused at the pressure taps from which the pressure measurements
were made in the experiment could also result in discrepancies in the experimental and numerical results. The
slight 'bump' in the numerical cavitation number profile that occurs on the graph after point d is caused by the
presence of the bladed inserts and is observed due to the ability of computational fluid dynamics to determine
the cavitation number at every point in the venturi throat.
The numerical results indicate that the increase in velocity and drop in the static pressure in the nozzle
decreases the cavitation number. The cavitation number decreases in the throat of the venturi due to a pressure
drop caused by frictional losses. However, in the diffuser, there is recovery of static pressure therefore the
velocity decreases which causes an increase in cavitation number.
3.1.4 Cavitation Number
The cavitation number indicates the intensity of cavitation at various points in a fluid : in principle, the lower
the cavitation number, the greater the intensity of cavitation. The cavitation number as defined in

3-8
Equation 3.2 is an average cavitation number for a fluid at a certain point in a pipe of specific geometry as it
only takes into account the average throat velocity in the fluid. However, since CFD solves for the entire flow
field, local velocities can be determined for specific points in a venturi (Meyer, 1993a). Hence, a local
cavitation number (Equation 3.3) was defined to calculate the cavitation intensity at specific points in the flow
field.
]
2 J
The subscript / denotes the local value available from the numerical results.
The average of the mean throat velocity and the local velocity was used in the calculation of the local
cavitation number in order to obtain a characteristic velocity for a specific point and geometry. However, this
local cavitation number has to be verified by comparison of the numerically simulated results with
experimentally determined results.
3.2 PHYSICAL EFFECTS OF CAVITATIQN
Various characteristics of cavitation, both hydrodynamic and ultrasonic, were investigated in the project and
this section reviews these results.
3.2.1 Hvdrodvnamic Cavitation
The occurrence of hydrodynamic cavitation in two sets of equipment was investigated. These were the
CAV-OX® system that was donated by Diarec Diamonds and modified as described in the previous section,
and the hydrodynamic cavitation rig which was constructed in the Department of Chemical Engineering at the
University of Natal, Durban. Both the systems were illustrated in Figures 2.2 and 2.3.
3.2.1.1 Operating Conditions of the CAV-OX© System
The operating conditions of the CAV-OX® chamber listed in Table 3.1 were used to determine the cavitation
characteristics of the CAV-OX® system. The flow rate was varied with the three gate valves connected in
series upstream of the cavitation nozzle and measured using a magnetic induction flowmeter. The discharge
pressure was varied using the valve in the exit li.ie.

3-9
TABLE 3.1 : Gauge pressures and
system during operation
Flow rate (£/min)
25
25
35
35
48
48
Discharge
flow rates measured in
pressure (kPa)
0
70
10
70
IS
70
Feed
the cavitation
pressure (kPa)
620,2
620,2
613,3
613,3
599,5
599,5
chamber of the CAV-OXS
Throat pressure (kPa)
- 12.0
-94,0
-94,5
-94,5
-95,0
-95,0
The data in Table 3.1 was used to calculate theoretical velocities and pressures for the venturi nozzle in the
cavitation chamber of the CAV-OX® system (Chelty, 1994). Figure 3.4 illustrates the theoretical velocity and
pressure distributions for the CAV-OX® venturi.
10
a
0
i! 1
• -IBWn |
^ | hwirii *2&L*nn |
a ™
• / l"~_
|nt-
mm*
" • • 1
Aiial distance |mrn) Aiial distance (mm)
FIGURE 3.4 : Theoretical velocity and pressure distributions in the CAV-OX® chamber (graphs
(a) and (b) respectively)
The formation of cavities in a hydrodynamic system occur in regions of high velocities and low pressures.
Figure 3.4 indicates that the maximum velocity and minimum pressure region for the CAV-OX® chamber is
at the venturi throat.
From Figure 3.4(b), it would appear that the pressure in the CAV-OX® chamber is greater than the ambient
pressure of 101 kPa therefore no tensile pressures are created in the liquid (in order for cavitation to occur, the
local pressure has to be reduced to the vapour pressure of the liquid). Consequently, the theoretical pressures
indicate that cavitation does not occur in the CAV-OX® chamber. However, according to Table 3.1, the

3-10
experimental throat pressures measured in the CAV-OX® chamber indicate that cavitation docs occur in the
CAV-OX® unit.
3.2.1.2 O p e r a t i n g Conditions of the Hvdrodvnnmic Cavitntion Rig
The various characteristics of the hydrodynamic cavitation rig that were experimentally investigated included
the hydraulic characteristics of the nozzle, energy dissipation and the intensity of cavitation generated in the
cavitalion rig. The hydraulic characteristics of the nozzle in the cavitation rig were determined by
investigating the relationship between the inlet and outlet pressures difference and flow rate. Figure 3.5 shows
the graphical relationship between this pressure difference and flow rate. In this figure, each line represents
different inlet pressure conditions (as absolute pressures).
500
FIGURE 3.5 : Experimental hydraulic characteristics of the nozzle in the hydrodynamic
cavitation rig for different absolute inlet pressures. AP is equal to the difference in the inlet and
outlet pressures of the nozzle. Points A, B and C on the graph represent operating conditions of
low, medium and high intensities of cavitntion
Cavitation occurs at constant flow rate which is illustrated in Figure 3.5 by the horizontal portion of the lines.
It can also be seen from Figure 3,5 that the intensity of cavitalion decreases, and eventually ceases to occur, as
the pressure drop across the nozzle is reduced. At this point, the flow rate decreases. In these situations, the
throat pressure is increased to above the vapour pressure of the liquid thus preventing bubble formation.
Three operating conditions in the hydrodynamic cavitation rig, which are detailed in Table 3.2, were selected
for further study. These conditions are represented by points A, B and C on the graph is Figure 3.5 and
correspond to low, medium and high intensities of cavitation respectively.

3-11
TABLE 3.2 : Operating conditions in the hjdrodymimic cavitation rig selected for
study where APBOU|( = P l l l t l - PDUllfl (as absolute pressures)
Condition
A
B
C
Flow rate (£/min)
44
78
124
P ^ (Wa)
54
204
487
P..*, (kPa)
32
52
15
APn0ZIIe (kPa)
22
152
472
The hydraulic characteristic data for the hydrodynamic cavitation rig were used to investigate the energy
dissipated by the nozzle at various conditions of cavitation (Botha, 1993). The condition of highest cavitation
intensity (Point C) showed the greatest dissipation of energy because of the large pressure drop across the
nozzle.
3.2.1.3 Cavitation Numbers
Hydrodynamic cavilation can be defined by a dimensionless parameter known as the cavitation number, c c
(this was defined in Equation 3.2) which expresses the state of a fluid near to, or, cavitating (Lehman and
Young, 1964). As the static pressure (P) approaches the vapour pressure of the liquid (PT ), the system
becomes more susceptible to cavitation. The pressure of the system can also be decreased by increasing the
liquid velocity (um). Hence, the lower the cavitation number for a particular condition, the greater the intensity
of cavitation.
(a)CAV-( > system
The data from Table 3.1 was used to determine the velocities and pressures at the throat of the venturi in the
CAV-OX® chamber. These were then used to determine the cavitation numbers at the venturi throat of the
CAV-OX® chamber (see Table 3.3).
TABLE 3.:
chamber
Flow rate
(£/min)
25
25
35
35
48
48
J : Cavitation numbers and flow
Discharge
pressure (kPa)
0
70
10
70
18
70
Upstream fluid
velocity (m/s)
0,82
0,82
1,15
1,15
1,58
1,58
parameters for the venturi throat
Throat fluid
velocity (m/s)
17,5
17,5
24,4
24,4
33,5
33,5
Absolute throat
pressure (Pa)
7 325
89 325
6 825
6 825
6 325
6 325
Df the CAV-OX®
Throat cavitation
number
0,027
0,563
0,012
0,012
0,006
0,006

3-12
It can be observed that the cavitation numbers generally decrease with increasing flow rates. The critical
throat or threshold cavitation number is defined as the maximum cavitation number at which cavitation occurs.
For the venturi in the CAV-OX® chamber which has an internal diameter of 24 mm, the critical throat
cavitation number is predicted to be 0,250 by extrapolation of literature data (Young, 1989 in Chetty, 1994).
This indicates that hydrodynamic cavitation will be produced in the CAV-OX® chamber for all the operating
conditions reported in Table 3.3, except the flow rate of 25 £/min and discharge pressure of 70 kPa. This was
confirmed by the photographic studies undertaken, the results of which will be discussed in the following
section.
(h) Hydrodynamic Cavitation
Cavitation numbers determined for the selected operating conditions in the hydrodynamic cavitation rig,
specified in Table 3.2, are tabulated in Table 3.4. It can be seen that the most intense cavitation conditions in
the hydrodynamic cavitalion rig (C) has the lowest cavitation number.
TABLE 3.4 : Cuvitation numbers for the operating
conditions selected for study in the hydrodynamic
cavitiition rig
Conditions
A
B
C
Cavitation number
0,482
0.258
0.025
Direct comparison of the cavitation numbers for in the CAV-OX® chamber and the cavitalion rig cannot be
made since the cavitation numbers for both systems were determined under different operating conditions.
3.2.1.4 Photographic Studies
The occurence of hydrodynamic cavitation was observed in both the hydrodynamic cavitation rig and the
CAV-OX® chamber by photographing the water passing through the venturi nozzles. Cavitation was
observed in the photographs as a mass of bubbles, the volume of which varied depending on the flow rate and
discharge pressure. Figures 3.6 and 3.7 present some of the results obtained which illustrate that cavitation
occurs in the CAV-OX® chamber and the hydrodyanmic cavitation rig respectively. Bubbles are produced at
the throat of the nozzles except for the operating condition in the CAV-OX® chamber for a flow rate of
25 M/min and discharge pressure of 70 kPa (Figure 3.6(a)) which confirms the results obtained for the
cavitation numbers for the CAV-OX® venturi (Table 3.3). It was concluded from the photographs that
hydrodynamic cavitation does occur in both the hydrodynamic cavitation rig and the cavitation chamber ofthe
CAV-OX® system when the ambient pressure equals, or is greater than, the fluid vapour pressure.

3-13
FIGURE 3.6(0 : Photographs of hydrodynamic cavitation produced in the CAV-OX® chamber for a flow rate
of 25 £/min and discharge pressures of (a) 0 ItPa (a) and (h) 70 kPa

3-14
FIGURE 3.6(ii) : Photographs ofliydrodynamic cavitation produced in the CAV-OX® chamber for a flow rate
of 48 £/min and discharge pressures of (c) 18 kPa and (d) 70 kPa
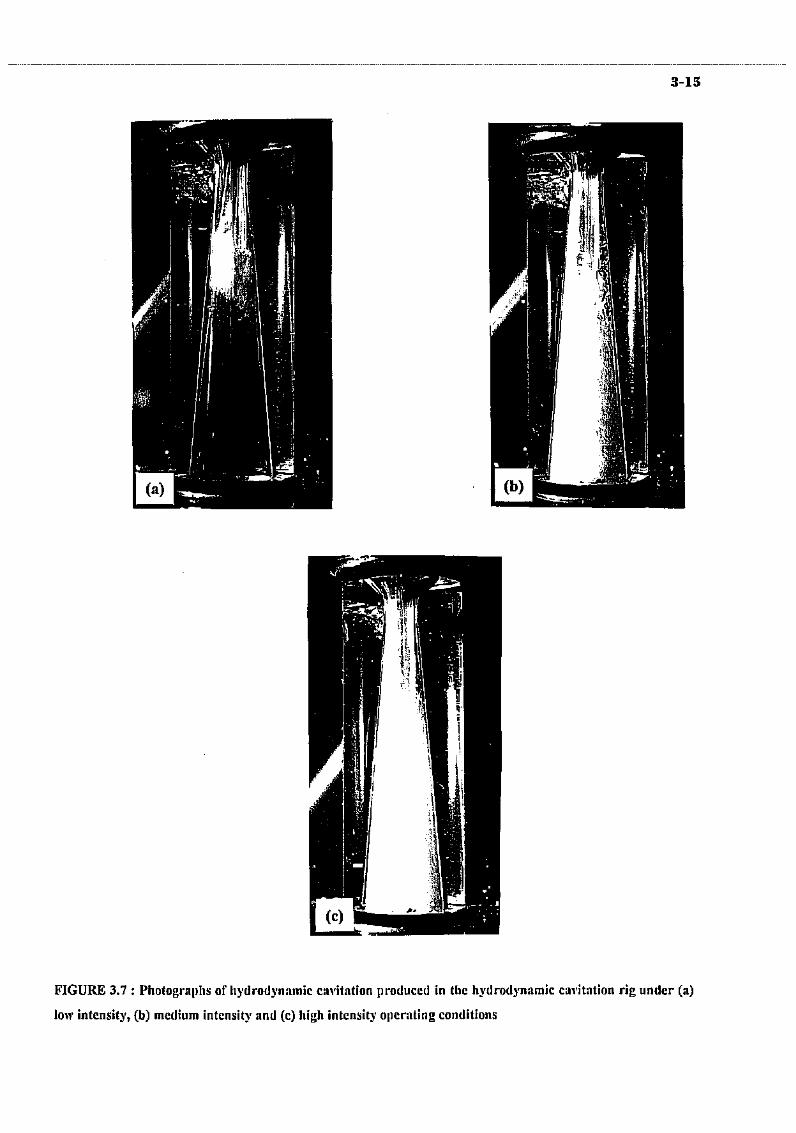
3-15
FIGURE 3.7 : Photographs of hydrodynamic ciivitation produced in the hydrodynamic cavitntion rig under (a)
low intensity, (b) medium intensity and (c) high intensity operating conditions

3-16
From the cavitation numbers presented in Section 3.2.1.2 and the photographic studies undertaken, it can be
concluded that a higher threshold cavitation number is required for the hydrodynamic cavitation rig than for
the CAV-OX® chamber.
3.2.1.5 Sound Emiss ion
Sound output is one of the phenomena associated with hydrodynamic and ultrasonic cavitation. The various
stages of hydrodynamic cavitation have been described in terms of the noise produced (Ball, et al., 1975):
• Incipient cavitntion represents the onset of cavilation where the noise consists of light, intermittant,
popping sounds.
• Critical cavitation is characterised by a light, steady noise which sounds like bacon frying.
• Incipient damage cavitation results from the implosion of vapour cavities and is associated with
objectionable noise that produces vibration and damage.
• Choking cavi tut ion occurs when the pressure at the constriction of the nozzle equals the vapour pressure
of the liquid and there is no further increase in discharge when the pressure downstream of the nozzle is
decreased at a constant upstream pressure.
The sound levels produced by the CAV-OX® system and hydrodynamic cavitation rig were measured using a
sound level meter and an octave filter set as described in Botha (1993) and Chctty (1994). This equipment
measures sound in decibels (dB) over the frequency range 31,5 Hz to 31 500 Hz,
fa) CAV-OX®System
The sound levels in the CAV-OX® chamber were recorded at the audible frequency range, i.e. 16 Hz to
16 kHz. The maximum sound level was produced in the CAV-OX® chamber was recorded in the divergent
section of the nozzle, i.e. the region of bubble collapse. The sound levels emitted in the divergent section of
the nozzle were recorded for the operating conditions specified in Table 3.1 (the blanks were determined by
replacing the cavitalion chamber with a stainless steel pipe) and the results are illustrated in Figure 3.8.

3-17
, 120HP)
e le
vel
g
f
(a)
0 10 20 30 40
• cavilalion noise _C3 blank £ • 1 2 0
flow rale = 25 l/min ^ 1 n n
re le
vel
i ; l | ! i S 60-
I M i M ^40-s : ::• ! i -aI M i M 3 zo--: ' 1 : 0 -
b)
HI r l r l r:i ! ; i
MMM \ \
50 EO 70 80 90 n ; iDischarge pressure (kPa) "" u » m a i a
c120
_ 100
3 J J J JZ 3 * * :•; :•;
8 6 Q i i i I
I 2°1 ! 1 I0-£ - i i _" 10 20 30 40
Discharge
H cavilalion noiseE3 blankflow rats = AO l/min
:i s: s: ?; J | S
50 EO 70 BO 90
— 120-X I
•s loo-
's; BO-
8 60'u
f ••I 20
(d)
• j j j" • J S s
• i l l1 i f i1 1 i i: - l > : :•' '•':
1 0 20 30 40
• cavrtation noise• blankflow rale = 30 l/min
r l r l r l r p
40 50 60 70 80 90
1 cavilalion noiseE3 Wankflow rate = 48 l/min
J J
1 ' \I \ 1 I
|
50 EG 70 80 90pressure (kPa) Discharge pressure (kPa)
FIGURE 3.8 : Sound pressure levels recorded in the CAV-OX® chamber for different flow rates.
The blank was determined by replacing the cavitation chamber with t
recording the sound levels at different flow rates
i stainless steel pipe and
Two features can be observed in these graphs : the sound pressure levels increase with increasing flow rate
since more bubbles collapse at a higher flow rate, and the sound pressure levels are a function of the discharge
pressure. Increasing the discharge pressure can cause the sound pressure levels to either increase or decrease.
An increase in the discharge pressure causes the liquid pressure to increase in the region where bubble collapse
occurs. As a result, the bubbles collapse more rapidly and violently and the sound pressure levels increase
(Figures 3.8(c) and 3.8(d)). The maximum sound emitted in the CAV-OX® chamber was at the maximum
flow rate and discharge pressure {Figure 3.8(d)). Figure 3.8(b) indicates that the sound pressure levels initially
increase with the discharge pressure due to an increase in the liquid pressure in the region of bubble collapse.
However, further increase in the discharge pressure results in the liquid pressure increasing in the region of
bubble growth thus favouring the growth of smaller bubbles which emit lower sound pressure levels upon
collapse. An increase in the discharge pressure can also cause an increase in the throat pressure of the
CAV-OX® chamber which hinders bubble formation. This was observed for the flow rate of 25 £/min. From
Table 3.1, it can be seen that the throat pressure increases from - 94 kPa to -12 kPa as the discharge pressure
increases from 0 kPa to 70 kPa. Consequently, bubble formation is hindered and no sound pressure levels were
recorded for this flow rate (Figure 3.8(a)).

3-18
(h) Hydrodynamlc Cavitation Ri%
Sound pressure levels were recorded for the operating conditions in the hydrodynamic cavitation rig at various
backpressures (P^,) over the frequency range 31,5 Hz to 31 500 Hz. The measurements were recorded at night
when the background noise was at a minimum. Figure 3,9 shows the results obtained.
"5 1CO'
tn
sQ.•o 60in 40
0 **
to 16 Hi
\ I
X <
<: ''•:•...
1
B 32 kPa U d - kPa • 64 kPa
Q Background sound level(a)
Human Ear 16 kHzi
i
TV- : In
}' r
1 ! |
:: '<
• 54 kPa a 64kfti EJ 1D4kPa d 154 kPa
Q Background sound levd
80 16 kHz
31.5 63 125 250 500 1030 2000 4000 B0001 BOOT 31500
Octave Frequency band (Hz)
31.5 63 125 250 5001000 2000«0QBOOQ 1600031500
Octave frequency band (Hz)
,00-
ao
a.13c3
60
40
20
a omT3
4kPa ES H9KPijHi44 kPa 1-1204 kPaO334 kPa D Background sound level (C)
la 16 Hj Human Ear 16 kHz
i l l31.5 63 125 250 500 10D020QO 4D00 60001 SOW31500
Octave frequency band (Hz)
FIGURE 3.9 : Octave frequency band spectra measured in the hycJrodynumic cuvitsition ri« for (a)
low intensity, (b) medium intensity and (c) high intensity cavitation conditions. The backpressure
conditions (outlet absolute pressures) at which the sound levels were recorded for each intensity of
cavitation arc give in the legend of each graph
The sound levels for the hydrodynamic cavitation rig exhibited a similar trend to those recorded in the
CAV-OX® chamber, i.e. the sound levels increase with increasing flow rate. However, it was determined that
the noise produced in the cavitation rig in the frequency range of 4 000 to 16 000 Hz was affected by flow rate.
3.2.2 Ultrasonic Cavitation
The ultrasonic bath with a temperature control system (refer to Figure 2.1) was used in the investigation of the
degradation of hydantoin compounds by ultrasonic cavitation. Prior to investigating the chemical effects of
ultrasonic cavitation on hydantoin degradation, it was necessary' to determine the physical characteristics of the
bath used.

3-19
3.2.2.1 Sound Levels of the Ultrasonic Bath
A sound level meter and octave filler set were used to measure the sound levels at different octave frequency
bands (Botha, 1993). The results obtained for the ultrasonic cleaning bath showed that the maximum sound
output was at a frequency 31,5 kHz {in the ultrasonic frequency range) which is maximum frequency
measurable by the sound meter. The specified frequency of the bath was 38 kHz.
3.2.2.2 Intensity of the Ultrasonic Bath
The intensity of an ultrasonic bath can be estimated by determining the temperature increase of the water
sonicated in the bath. The acoustic energy from the ultrasonic waves is absorbed by the liquid in the bath and
converted into thermal energy which increases the temperature of the water in the ultrasonic bath
(Goswami, et al., 1988). This rate of energy input can be calculated from the initial linear increase in
temperature and indicates the amount of energy available to enhance sonochemical reactions. Figure 3.10
illustrates the temperature increase in the water in the ultrasonic bath which was operated for 360 min.
Tem
pera
ture
(t)
55
50
40
35
30
25
•
i
J
FIGURE 3.10 : Temperature
/
f
profile
• '
i
100
of 5
|
Time (mm)
I of water sonicated
• — • • — * • • « • • •
300
in the ultrasonic
400
bath for 360 min
The temperature profile in Figure 3.10 indicates that the temperature of the water in the ultrasonic bath
increased from 23,9 °C to 52,2 °C within 210 min. After this time, the temperature remained constant. This
indicates that the temperature of the water in the ultrasonic bath has to be controlled during experiments thus a
temperature control system was established to maintain the temperature of the water in the ultrasonic bath at
25 °C (illustrated in Figure 2.1).

3-20
Within 60 min, the temperature of the water in the ultrasonic bath increased from 23,9 °C to 39,7 °C
(Figure 3.10). The heat capacity (Cp) of water at 31.8 °C, the average temperature in this temperature range, is
4 177,8 J/kgK(We!ty, el a!., 1984) therefore the power, Q. required to raise the temperature (by AT degrees) of
a liquid with a mass flow rale, m, can be calculated from Equation 3.4.
0 = mCpAT (3.4)
Substitution of the above values and that for the mass flow rate of the sonicated water (0,0013 kg/s;
Schwikkard, 1994) gives a power output of 91,4 J/s.
The intensity of an ultrasonic bath is defined as the energy emitted at the surface of the ultrasonic device
(Mason, 1991). The ultrasonic bath used in the experiments contains four piezoelectric transducers (each
55 mm in diameter) bonded to its base; the combined surface area is therefore 9 503 mm1. Thus, the intensity
for the operating conditions of the ultrasonic bath can be calculated by dividing the power (91,4 W) of the
ultrasonic bath with the surface area through which the energy was emitted (9 503 mm2). The intensity of the
ultrasonic bath used in the experiments is therefore 9,6 kW/nr.
Stable cavitation (discussed in Section 2.1) only occurs at intensities of 10 to 30 kW/nr whilst transient
cavitation (refer to Section 2.1) occurs if the intensity is greater then lOOkW/nr (Mason. 1990b). It could
therefore be concluded that stable cavitalion that occurs in the ultrasonic bath. Sonochemical effects, e.g. free
radical formation, microstreaming, etc., result from both stable and transient cavitation (Raloarinoro, et al.,
1992) since, although the temperatures and pressures developed in stable cavities are lower then those in
collapsing transient cavities, the lifespan of stable cavities is longer which increases the probability to affect
chemical reactions (Mason, 1990b). Therefore, sonochemical effects could be observed using the ultrasonic
bath as the promulgator of ultrasonic waves.
Although the intensity of the ultrasonic bath was calculated to be 9,6 k\V7nf. a lower intensity is possible
within the reaction vessel. Goodwin (1990a) proposed that, as ultrasonic waves are attenuated at the
glass/water interface, the intensity within the reaction vessel could be reduced to 5 kW/nr. Under these
conditions, ultrasonic cavitation may not occur in the reaction vessel (however, the formation of hydrogen
peroxide in the ultrasonic bath (see Section 3.3) proved that ultrasonic cavitation occurs). Therefore, it is
important to compare the temperature of the water in the reaction vessel is affected through heat conduction
from the water in the ultrasonic bath.
3.2.2.3 Temperature Profile of Water in the Ultrasonic Bath and Reaction Vessel
The temperature of the water in the reaction vessel is affected by heat conduction from the water in the
ultrasonic bath thus the intensity of ultrasonic cavitation within the reaction vessel cannot be estimated by
calorimetry, i.e. as the intensity of water in the ultrasonic bath was determined. However, the temperature of
the water in the reaction vessel can be compared to temperature increase of the water in the ultrasonic bath

3-21
over a period of time when the temperature of the water in the ultrasonic bath is controlled at 25 °C and when
it was not controlled (see Figure 3.11).
i7 0 -
60osf50
3
n.
<u 30
20
10
0
Bath temperature — Reaction vessel temperatureA (uncontrolled) '-' (bath temp uncontrolled)
Reaction vessel temperature{bath temp controlled)
Bath temperature' (controlled)
""--D
60 120 1B0 240
Time (min)300 360 420
FIGURE 3.11 : Temperature profiles of the water in the reaction vessel and ultrasonic bath
sonicated for 360 min when the temperature of the bath was uncontrolled and when the
temperature of the bath was controlled at 25 °C
From this figure, it can be seen that the temperature increase of the water in the reaction vessel is less than that
in the ultrasonic bath for the uncontrolled cases A and B. Since this temperature increase is an indication of
the amount of energy absorbed by the water, it would appear to confirm the observation that the intensity of
cavitation in the reaction vessel would be loAver than the intensity of cavitation in the ultrasonic bath
(Goodwin, 1990a).
Goodwin (1990b) reported that the temperature of the water within the reaction vessel was greater than the
temperature of the water in the ultrasonic bath if this latter temperature was controlled, therefore the
temperature of a sonochemical reaction must be monitored within the reaction vessel. The actual intensity of
cavitation within the reaction vessel could be obtained if the temperature of the water in the reaction vessel
could be measured without any external factors acting on it, i.e. conduction by either warm or cold water. The
true temperature curve of the water in the reaction vessel (without external factors) would thus lie between
graphs B and C in Figure 3.11 as these were influenced by heating through conduction and cooling through
conduction respectively.

3-22
3.3 CHEMICAL EFFECTS OF CAPTATION
3.3.1 Hydro dynamic Cavitation
The major chemical effect believed to result from hydrodynamic cavitation is the generation of hydroxyl
radicals which are proposed to result from the thermal dissociation of water molecules. These hydroxyl
radicals can subsequently undergo reactions with organic compounds in solution resulting in degradation
products. Free radicals can be detected by various methods which require sophisticated and expensive
instrumentation, e.g. magnetic susceptibility, mass spectroscopy and electron spin resonance. However, since
hydroxyl radicals can combine to produce hydrogen peroxide, the presence of hydroxy! radicals can be detected
by determining the hydrogen peroxide concentration in the system.
Various spectrophotometric methods are available for hydrogen peroxide detection and quatitation (Eisenberg,
1943; Sellers, 1980; Baga, et a!., 1988). The first two methods use titanium sulphate and the latter one,
copper(II) sulphate and 2,9-dimethyl-l,10-phenanthroline (DMP). These methods were evaluated during the
course of the project (Chetty, 1994) and it was found that the CuSOj / DMP method (Baga, et al., 1988) was
the most sensitive of the methods evaluated as il can delect hydrogen peroxide in the concentration range of
10s mol/2 (0,034 mg/£) to 1.2 x 10"1 mol/£ (4,03 mg/£). This method was used to determine the hydrogen
peroxide concentration produced in the CAV-OX© chamber, hydrodynamic cavitalion rig and ultrasonic
cleaning bath.
3.3.1.1 Factors affecting Hvdrogen Peroxide Determination in the CAV-OX® system
Prior to the investigation of hydrogen peroxide formation in the CAV-OX® chamber, factors affecting
hydrogen peroxide concentration were assessed. Hydrogen peroxide is an unstable compound that decomposes
naturally to water and oxygen. The rate of decomposition is dependent on exposure to light (particularly UV)
and temperature. Metal ions and organic compounds present in solution can also enhance the decomposition
of hydrogen peroxide. Experiments were undertaken to determine the effect of laboratory light, increased
temperature and the stainless steel surfaces of the equipment on hydrogen peroxide decomposition.
Solutions of known concentrations of hydrogen peroxide (1,5 mg/£ and 0,6 mg/2) were exposed to the various
conditions and the hydrogen peroxide concentration monitored at regular intervals. Figures 3.12 and 3.13
illustrate the results obtained as normalised hydrogen peroxide concentration (C / Co ), i.e. the ratio of
hydrogen peroxide concentration at time t (C) to the initial hydrogen peroxide concentration (Co). Rate
constants were determined by multiplying the gradients of the graphs by the respective initial concentrations,
i.e. Co. Further details are reported in Chelty (1994).

3-23
1.2
O.B
° 0.4
0.2
Q
c
1.0
o.a
o0.4
0.2
2000
: • - .
D 2000
FIGURE 3.12 : ]
temperature of 32
of the equipment.
4COQ 6000Time (s)
•»
4000
m
6000Time (s)
Decomposition
°c,The
(c) in the
(a)
o0.4
0,2
8009 10000
(c)
• •.
1.0
0.S
o0.*
0.2
(b)
3 2000 4000 6000 1000 10 000Time (s)
3000 10000 12000 0 2000 4000 6000 8 000 10000 12000Time (s)
i of hydrogen peroxide solutions (a) exposed to light, (b) at a
feed tank of the CAV-OX® equipment, and (d) in the sample port
initial concentration of the hydrogen peroxide solution was 1,5 mg/£

3-24
1.2
1.0
0,5
— 0,6
o0/
02
"o 5oa
1 0
o.s
o0,4
0,2
0 £00
— • ».
1000Time (s)
1000
Time (s)
FIGURE 3.13 : Dccompositior
temperature of 32 °C,
of the equipment. The
(c) in the
(a)
~ -* _1.0
O.B
O" 0.6
o0.4
0.1
1500 2 000 "0 500
(= )
O.S
u~- 0.6o
0.4
0,2
1500 2 000 "o 500
i of hydrogen peroxide solutions (a)
feed tank of the CAV-OX® equipment
1000Time (s)
fc~.
1000Time (s)
exposed to
, and (d) in
initial concentration of the hydrogen peroxide solution was
(b)
1500 2 000
(d)
« m~
1500 2000
light, (b) at a
the sample port
0,6 mg/£
Comparison of Figures 3.12(a) and 3.13(a) indicate that the decomposition rate of the 1,5 mg/£ hydrogen
peroxide solution is lower than that of the 0,6 mg/£ hydrogen peroxide solution which is expected since
hydrogen peroxide is more stable at higher concentrations (Snell and Ettre, 1971).
For the 1,5 mg/£ hydrogen peroxide solution, there is negligible effect of temperature on the decomposition
rate of hydrogen peroxide (Figure 3,12(b)). However, a temperature of 32 °C enhances the decomposition rate
of the 0,6 mg/£ hydrogen peroxide solution significantly (Figure 3.13(b)). These results indicate that the
temperature achieved during operation of the CAV-OX® chamber (32 °C; Chetry, 1994) could affect
quantitation of the hydrogen peroxide concentrations produced by hydrodynamic cavitation .
Hydrogen peroxide decomposition is enhanced by the stainless steel surfaces of the CAV-OX® equipment as
can be seen in graphs (c) and (d) in Figures 3.12 and 3.13. The decomposition rate of the higher concentration
of hydrogen peroxide is greater than for the lower hydrogen peroxide concentration. Hydrogen peroxide
decomposition is also increased in the sample port than in the feed tank since the surface area in the sample
port is large in comparison to the volume of the solution.

3-25
It was demonstrated that the decomposition rate of the 1,5 mg/£ hydrogen peroxide solution was enhanced
under flow conditions in the CAV-OX® equipment (refer to Figure 3.14). A flow rate of 48 #min was used
since this results in a minimum residence time in the equipment thus minimising the contact time between the
solution and the stainless steel surface of the equipment (excluding the feed tank). The decomposition rate of
the hydrogen peroxide solution could be decreased under flow conditions in the CAV-OXS chamber if the
metal surface of the equipment was passivated with nitric acid prior to operation (Figure 3.14). Chetty (1994)
gives further details of these experiments.
FIGURE 3.14
equipment at a
1,2
1.0
o,a
•
" 0,6O
0,4
0,2
°C
• non-passified case
• passified case
1 000 2 000
: Decomposition of l,5mg/£
flow rate of 48 £/min
3 000 4Q00 5 000 6 000
Time (s)
hydrogen peroxide solution in the CAV-OX®

3-2G
3.3.1.2 Ouantitntion of Hydrogen Peroxide produced bv Hvdrodvnamic Cavitation
(a) CAV-OX®System
From the preliminary investigations outlined in Section 3.3.1.1, it was concluded that the operating conditions
in the CAV-OX® equipment could affect the quantitation of any hydrogen peroxide formed due to
decomposition. In order to minimise the decomposition of any hydrogen peroxide produced, the equipment
was passivated before experiments were performed.
Some of the operating conditions previously investigated (see Table 3.1) were selected for the evaluation of
hydrogen peroxide production in the CAV-OX® chamber and are summarised in Table 3.5.
TABLE 3.5 : Operating conditions
the CAV-OX® chamber
Operating condition
A
B
C
D
selected for the evaluation
Flow rate (£/min)
25
25
48
48
of hydrogen peroxide production in
Discharge pressure (kPa)
0
70
18
70
The above operating conditions were selected on basis of the photographic results (Figure 3.6) and sound levels
obtained for these (Section 3.2.1.3). For condition A, few bubbles were produced (Figure 3.6(a)) which
emitted no sound on collapse therefore no hydroxj'I radicals are expected to be produced for these operating
conditions. Similarly, for condition B (Figure 3.6(b)), no bubbles are produced therefore no hydroxyl radicals
are expected. Thus, for conditions A and B, no hydrogen peroxide is expected to be detected. However,
conditions C and D (Figure 3.6(c) and (d) respectively) produce a large number of bubbles that collapse
violently thus are predicted to favour the formation of hydroxj'I radicals hence hydrogen peroxide should be
detected.
The following experiments were carried out (Chetty, 1994)
• Comparison of the decomposition rates obtained for cavitated and non-cavitated 1,5 mg/£ hydrogen
peroxide solutions at the operating conditions A, B, C and D specified in Table 3.5 (see Figure 3,15).
• Determination of any hydrogen peroxide formed in reverse osmosis (RO) water and oxygenated RO water
cavitated in the CAV-OX® chamber at the operating conditions A, B, C and D.
Figure 3.15 illustrates the decomposition rates for cavitated and non-cavitated hydrogen peroxide solutions.

3-27
1.2C
O.BC
u 0,6C
0.4Co
1,2a
1.GC
O.BC-
O,BC-
0.4C-
0.2C-
2 000 4 000Time (s)
6 000o.otj- 2 000 4 000
Time (s)
6 000 BOOO
o
i,2q
1,01
o,ac
0,6C"
0,2C-
o.oc-
1.2C
1.01
O.BC"
0,6C •
CJ
0,2t"
2 000 4D00Time (s)
6 000
D
2000 4000Time (s)
6000 BOOO
FIGURE 3.15 : Comparison of the decomposition rates for cavitated (indicated by •) and
non-cavitntcd (indicated by — ) hydrogen peroxide solutions for the various operating conditions
A, B, C and D in the CAV-OX® chamber
It can be seen that there is neither formation nor enhanced decomposition of hydrogen peroxide during
cavitation .
Reverse osmosis water was cavitated for 30 min at flow rates of 48 £/min and 25 £/min for varying discharge
pressures, i.e. 0 kPa, 14 kPa and 70 kPa, and the amount of hydrogen peroxide in the samples was determined
using the copper sulphate/ DMP method (Baga, et al., 1988). The absorbance readings ranged between 0,001
and 0,004 (Chetty, 1994) therefore it was concluded that, under the experimental conditions investigated, an
undetectable amount of hydrogen peroxide was formed in the CAV-OX® chamber.
The effect of oxygen enhancement on the formation of hydrogen peroxide by hydrodynamic cavitation was
investigated by cavitating RO water that contained varying concentrations of oxygen at the most intense
cavitation conditions in the CAV-OX® chamber, i.e. a flow rate of 48 £/min and a discharge pressure of
70 kPa. The absorbance readings for the experiments varied bctweeen 0,000 and 0,006 (Chelty, 1994). It was
therefore concluded that, under the experimental conditions investigated, oxygen does not enhance hydrogen
peroxide formation.

3-28
(h) Hydrodynamic Covitation Rig
The formation of hydrogen peroxide by hydrodynamic cavitation in the hydrodynamic captation rig was
investigated by cavitating 80 £of RO water in the rig for a period of 18 h. Samples were withdrawn at time
intervals and the concentration of hydrogen peroxide determined by the copper sulphate / DMP method. It was
concluded that an undetectable concentration of hydrogen peroxide was formed within the 18 h duration of the
experiment.
3.3.2 Ultrasonic Cavitation
Mason (1991) reports that the energy input for an ultrasonic system is dependant on the size of the ultrasonic
bath, type of reaction vessel and the position of the reaction vessel in the ultrasonic bath thus preventing
comparison of experimental results from different ultrasonic systems because of the different equipment
parameters (ultrasonic bath or probe). One way of comparing the intensity' of cavitation in ultrasonic systems
is by determining the concentration of hydrogen peroxide formed as a result of the recombination of hydroxyl
radicals produced during ultrasonic cavitalion (Sehgal, et ah, 19S2).
3.3.2.1 Hydrogen Peroxide Formation in the Ultrasonic Bnth
It has been reported that maximum hydrogen peroxide formation occurs in water saturated with oxygen gas
(Mead, etal., 1975). As these experimental conditions would be optimum for the oxidation of organic
compounds, the concentration of hydrogen peroxide produced by the ultrasonic cavitation of water saturated
with dissolved oxygen over a 24 h period in the ultrasonic bath was determined. The results are shown in
Figure 3.16.

3-29
D
3 3
a.c
?. t
-
iA 1 1
Dissolved Oxygen•
•
Contra!A
t
£ A, I . .8 12 16 20
Time (h)
FIGURE 3.16 : Effect of dissolved oxygen on the formation of hydrogen peroxide in water
ultrasonicilly cavitated in the ultrasonic bath. The control represents hydrogen peroxide
produced in water in the absence of oxygen
In the absence of oxygen, the concentration of hydrogen peroxide was produced in the water was 0,06 mg/£
which is significant since the detection limit for the analytical method is 0,03 mg/L Since hydrogen peroxide
is a product of recombination of hydroxyl radicals formed by the ultrasonic cavitation of water molecules, these
results confirm that ultrasonic cavitation occurs in the ultrasonic bath. It is also evident that the presence of
dissolved oxygen in solution enhances the concentration of hydrogen peroxide formed, as reported by
Mead, et al. (1975). The concentration of hydrogen peroxide increases relatively linearly in the presence of
oxygen over the 24 h period investigated to give a maximum concentration of approximately 3,5 mg/£. It
must be noted that there is a lack of precision in the results from sonochemical work due to variable acoustic
output and other factors (Jennings and Townsend, 1961). This is evident from the large scatter of the
experimental data in Figure 3.16.
3.3.2.2 Dissolved Oxygen in t h e Ul t ra son ic Bnth
As ultrasound has been reported to degas liquids (Mason, 1991), the concentration of dissolved oxygen in
water sparged with oxygen for 15 min prior to sonication for 8 h was investigated. Figure 3.17 presents the
results obtained.

3-30
FIGURE 3.17
the ultrasonic
Ieo
1s5
: Dissolved
bath
35
3C
25
ZD
15
10
•
-
5o
oxygen
• 1
4
concentration
Time (h)
in 10 ml
•
B 12
water ultrasonically cavitatcd over 8 h in
It can be seen that the dissolved oxygen content in the water decreases from approximately 29,7 mg/£ to
9,3 mg/£ over 3 h, and then appears to stabilise around this concentration. A dissolved oxygen concentration
of 9,0 mg/l was measured in water in equilibrium with air. Therefore, in order to ensure that the hydrogen
peroxide concentration increases over time, oxygen gas should be bubbled through the solution being
sonicated.
3.3.2.3 Degradat ion Kinet ics of 1-Methvlhvdnntoin
One of the research areas of this project involved the imestigation of degradation of hydantoin compounds by
ultrasonic cavitation {Schwikkard, 1994) therefore the sonochemical degradation of i-melhylhydantoin was
investigated as a function of time in the absence and presence of hydrogen peroxide and oxygen. The results
are shown in Figure 3.18.

3-31
0 A
BO"
^•70"
a fi(T
2 J
Sonicated Contra! ;
hi ' ' ' '
1(*
°0 4 B 12 16 JOTime(h)
0 A 3 12 16 20 24 28
FIGURE 3.18 : Sonochcmical degradation of 1-methylhycJantoin (1JVIH) solution (50 mg/£) in
(a) the absence of hydrogen peroxide and oxygen, (h) the presence of 1 332 mg/£ hydrogen
peroxide and absence of oxygen, and (c) the presence of 1 332 mg/£ hydrogen peroxide with oxygen
saturation prior to sonication. The control solutions lvcre identical unsonicated solutions
maintained at a constant temperature
From Figure 3.18, it can be observed that no natural degradation of 1-methyl hydantoin occurs, i.e. ultrasonic
captation is required for degradation. Therefore, it can be concluded that 1 -methylhydantoin can be degraded
by ultrasonic cavitation and the rate of degradation is enhanced by the presence of hydrogen peroxide and
oxygen as shown in Figure 3,19.

3-32
X 60
roi±J 40QJ
O 30
20
10
-
-
} 4
FIGURE 3.19 : Comparison
1-methylhydantoin
Sonicated 1MH • —Sonicated 1MH.H2O2Sonicated 1MH, H2O2,02
i i i i i
6 12 16 20 24Time (h)
of the sonochemical degradation
a
^ ^
\ .i
2&
conditions for 50 mg/£
Approximately 25 to 30 % degradation of 1-mcthyIhydantoin was achieved over 24 h in the ultrasonic bath.
Addition of 1 322 mg/£ hydrogen peroxide enhances the sonochemical degradation of 1-methylhydantoin to
approximately 62 % over 24 h as the concentration of hydroxyl radicals, which are the oxidising species, are
increased. The presence of oxygen further increases the concentration of these radicals, as described in
Section 2.1, and hence further sonochemical degradation of 1-methylhydantoin (approximately 68 %) occurs.
A continuous stream of oxygen during sonication would enable the greatest degree of oxidation of
1-methylhydantoin.
3.3.2.4 Identification of Degrndnt ion Produc ts from 1-Metlivlhvdnntoin
This section briefly reports the results obtained for the identification of the products resulting from the
sonochemical and photochemical degradation of 1-methylhydantoin in the presence of hydrogen peroxide.
Schwikkard (1994) gives a more detailed report of the results.
Photochemical degradation of 1-melhylhydanloin in the presence of hydrogen peroxide was selected as the
technique to produce sufficient quantities of degradation products for collection, separation and identification.
As the available ultraviolet (UV) irradiation sources were more powerful then the ultrasonic bath,
photochemical irradiation enabled the degradation of larger volumes of more concentrated 1-methylhydantoin
solutions in shorter time periods. In addition, analysis by high performance liquid chromatography (HPLC)
indicated that similar degradation products were formed for the photochemical and sonochemical degradation
of 1-methylhydantoin in the presence of hydrogen peroxide. This is expected since the degradation mechanism
for both methods involves oxidation of 1-methylhydantoin by hydroxyl radicals.

3-33
A white precipitate was formed during the irradiation of 1-methylhydantoin with a medium pressure mercury
ultraviolet light source (Hanovia lamp). A mass spectrum of the precipitate was obtained which indicated the
presence of a compound with a molecular weight of 128 g/mol, as well as the presence of a contaminant. It
was postulated that the reaction of hydantoin with hydroxyl radicals in the presence of oxygen produces
parabanic acid (Pegel, 1993) thus the identical reaction with 1-methylhydantoin would result in
l-methylparabanic acid. Hence, this compound was suspected to be 1-methylparabanic acid (which has a
molecular weight of 128 g/mol).
The mass spectrum of the precipitate contains all the required fragmentation patterns reported by Corral, et al,
(1979) for 1-methylparabanic acid. Other major peaks on the mass spectrum of the precipitate appear to
correspond with those reported for 1-melhylhydantoin {Corral et al., 1971). Thus, it was tentively concluded
that the precipitate contained 1-methyiparabanic acid and 1-methylhydanloin.
The solubility of the precipitate in various solvents was tested for subsequent purification using an open silica
gel column. No suitable organic solvent or solvent mixture (water, methanol, elhanol, ethyl acetate, hexane,
methylene chloride, propan-2-ol, chloroform, glacial acetic acid and water (1:1), diethyl ether) was found in
which the precipitate dissolved significantly for further purification purposes.
The solution of 1-methylhydantoin irradiated in the presence of hydrogen peroxide with the Hanovia lamp was
rotavapored to dryness so that the products in solution could be separated and purified for identification
purposes. An off-white/slightly yellow, hygroscopic precipitate was obtained. The mass spectrum of this
precipitate indicated that it contained a mixture of compounds (two distinct parent compounds with a
molecular ion of 256 amu and 146 amu were observed but could not be identified). A peak.at 60 amu was also
obtained which could possibly could correspond to the molecular ion of urea; this is one of the products (the
others being 5-hydroxyhvdanloin and glycolic acid) formed in the electroreduclion of parabanic acid which
also produced an off-white, extremely hydroscopic solid (Dryhurst, et al., 1970).
Urea, oxamide and oxalic acid are possible photochemical and sonochemical degradation products of
hydantoin or 1-methylhydantoin which have been identified in literature (Dryhurst. etal., 1970; Ochiai, 1971;
Fahr, et al., 1980; Yu et al., 1980; Ienaga, et al., 1988). The UV spectra of these compounds were compared to
the UV spectra of the degradation products from 1-methylhydantoin for all the experiments carried out. The
urea sample was contaminated therefore could not be used for comparison purposes, and the UV spectrum of
oxalic acid did not correspond with the spectrum of any of the degradation products. However, the UV
spectrum of oxamide was found to be identical to the spectrum obtained for one of the products formed from
the sonochemical degradation of 1-methylhydantoin in the presence of hydrogen peroxide and oxygen. Similar
retention times were also observed for oxamide and this product under the same HPLC operating conditions
thus supporting the identification of this product as oxamide. However, confirmation of the identity of this
product is required.

3-34
3.4 BIOLOGICAL EFFECTS OF CAVITATION
One objective of this project was to investigate the efTeciiveness of hydrodynamic cavitation for the inactivation
of raw water bacteria since the potential existed for hydrodynamic cavitation to be used as a simple water
treatment process (Venturis could be installed in water systems to exploit the existing water head). Ultrasonic
cavitation is known to decrease the number of viable bacteria in water and was therefore used a comparative
technique.
The effect of both types of cavitation on raw water bacteria (present in water obtained from Umgeni Water's
Wiggins Water Treatment Works which was supplied from the Cleremont Pump Station in Durban) was
determined using the heterotrophic plate count method. This method does not evaluate the quality of the water
after treatment but gives an indication of the efficiency of the treatment process. Plate counts of bacteria were
enumerated prior to, and after, cavitation. The results were generally plotted in terms of logarithmic reduction
curves (death curves). It was noticed that the death curves of raw water bacteria were non-linear. This effect
occurs since raw water contains a mixed population of bacteria, the individual species of which have different
death rates. Hence, the initial linear portions of the curves (within 10 min) have been used for comparison
between experiments. The death curves also demonstrate a tailing q/TefTect where the death rate is reduced.
This effect is often evident in work where the surviving colonies are below the 30 colonies per plate limit
recommended in Standard Methods (19S5).
3.4.1 HYDRODYNAMIC CAVITATION
The objective was to determine whether hydrodynamic cavitation alone could reduce the number of colony
forming units of raw water bacteria as quantitated by the helerotrophic plate count (HPC) method.
Experiments were performed at three selected operating conditions which represent states of low (A), medium
(B) and high cavitation (C) intensity for the hydrodynamic cavitation rig. These operating conditions are
described in more detail in Section 3.2 and in Botha (1993).
Figure 3.20 illustrates the concentration of colony forming units in raw water cavitated for 2 h at the various
intensities of cavitation in the hydrodynamic cavitation rig. Samples were withdrawn at various time intervals
during the experiment. The control in each experiment was raw water which was exposed to identical
experimental conditions as the samples except the nozzle was replaced by tubing.

3-35
ID CCO
5 000
3 000
_ 2D0D
E3 1 000
503
300
200
100
Control Experiment]• - 1 - j (a)
20 40 60 BO 100 120
Time (min)140
too-
l Eiperiment (b)
20 40 GO SO 1 0 0 120
Time (min)
5 000
3 000
2 000
1 000
500
300
200
Control Experiment
-
•
-
(c)
* •
0 20 40 GO SO 100 120 140
Time (min)
FIGURE 3.20 : Effect of (a) low intensity, (b) medium intensity, and (c) high intensity
hydrodynamic cavitation generated in the hydrodynamic cavitation rig on colony forming units in
raw water
It is evident from these figures that, whilst there is a slight variation in the bacterial count over the period of
the experiment, there is no significant decrease in the concentration of raw water bacteria exposed to
hydrodynamic cavitation. The trend in the results is either a constant bacterial count or a slight increase in the
counts. This was not considered significant since the increase is less than an order of magnitude. Further
experiments in which the cavitation time was increased to 12 h confirmed that there was no enhanced decrease
in the bacterial counts of raw water exposed to cavitation.
It was concluded that hydrodynamic cavitation was ineffective as a single process for the inactivation of raw
water bacteria since there was no significant effect on the plate counts of raw water bacteria exposed to
hydrodynamic cavitation.
Raw water bacteria generally exist in the natural state as aggregates which can be fixed onto the surface of
mineral or organic matter or incorporated in human, animal or cell debris. Consequently, bacteria can be
protected from inactivation by various disinfecting agents. This has been noted in work with bacterial
inactivation by UV irradiation (Quails, et al., 1983). As hydrodynamic cavitation causes turbulence of the
liquid as it passes through the nozzle, it has potential for the dispersion of bacterial aggregates in raw water.
In order to determine the degree of dispersion of bacterial aggregates, raw water was cavitated for 2 h in the

3-36
hydrodynamic cavitnlion rig. Samples were removed at inter\'als o\'er the two hour period and the turbidity of
the water was measured using nephelometry. In addition, plate counts were performed for each sample in
order to assess the relationship between the turbidity of the cavitaled water and bacteria concentration. Control
experiments were performed using raw water which had been suspended in a bottle inside the feed tank of the
cavitation rig to attain the temperature of the samples. The results obtained are presented in Table 3.6.
TABLE 3.6 : Turbidity measurements and plate counts for raw water cavitated at the highest
cavitation intensity (APOOU|( = 472 kPa) in the hydrodynamic cavitation rig. (-) indicates no
analysis
Cavitation time
(min)
0
5
10
30
120
Turbidity (NTU)
Control
2,3
2,5
2,5
2,6
2,6
Experiment
2,5
3,5
3,6
4,1
4.1
CFU (m£)
Control
1 000
(-)
(-)
700
1000
Experiment
1 100
1400
(-)
1500
2 200
The turbidity of the raw water increases over the period of cavitation as a result of dispersion of the bacterial
aggregates and the plate counts show a corresponding increase. It was established that the water temperature
in the cavitation rig was not responsible for the enhanced plate counts since the plate counts of the control
remained constant. It was surmised that the increase in the plate counts was caused by the dispersion of the
bacteria] aggregates as a result of cavitation since there would be an increase in the number of single or
clumped colonies of bacteria in the cavitated water.
Dispersion of bacterial aggregates was qualitatively investigated by photographing samples of cavitated water
using scanning electron microscopy. Raw water was sampled prior to cavitation and subsequently after
cavitation for 50 h. The samples were treated with standard electron microscopy techniques to prepare stubs
for viewing with the scanning electron microscope (Botha, 1993).
Figure 3.21 shows the scanning electron micrographs of non-cavitated (Micrographs 1, 3 and 4) and cavitated
(Micrograph 2) water samples. Bacteria exist in raw water as aggregates as illustrated in Micrograph 1.
Closer magnification of the bacterial aggregates (Microgrnph 3) reveals that the bacteria could be associated
with algal cells (the large objects in the micrograph) and debris which provide protection for the bacteria.
Micrograph 4 shows the presence of spores (the star-like object and nearby spherical object) which are very
resistant to cavitation as well as elongated rod and spherical bacteria. Cavitation of raw water results in
dispersion of the bacterial aggregates as is demonstrated in Micrograph 2.

3-37
Therefore, it can be concluded that hydrodynamic cavitation generated in the cavitation rig is sufficient to
cause dispersion of bacterial aggregates as indicated by the comparison of the turbidity measurements and
scanning electron microscopy of cavitatcd and non-cavhated raw water samples. As a result of this dispersion
of bacterial aggregates, the plate counts of bacteria enumerated after hydrodynamic cavitation show a slight
increase. However, there is no direct relationship between concentration of colony forming units and the
degree of bacterial aggregate dispersion observed with hydrodj'namic cavitation of raw water.

3-38
FIGURE 3.21 : Scanning electron micrographs of non-cuvitatccJ (Micrographs 1, 3 and 4) and
cnvitatcd (Micrograph 2) samples of raw water

3-39
3.4.2 ULTRASONIC CAWTATION
Ultrasonic cavitation generated in the ultrasonic bath was investigated for its effect on the numbers of colony
forming units of raw water bacteria as quanlitated by the hcterotrophic plate count method. Samples of raw
water were sonicated in the bath at a temperature of 25 °C for 2 h and small volumes were withdrawn from the
sonicated samples at various intervals. The control experiments consisted of unsonicated raw water
maintained at a constant temperature of 25 °C.
In order to compare results from various experiments that have different initial concentrations of viable
bacteria, the results were normalised by dividing by the initial count. It must be emphasised that it is the
initial linear portion of the curve which is important when comparing the effectiveness of the various methods
used for the inactivation of bacteria in raw water.
Figure 3.22 illustrates the results obtained for the concentration of bacteria in sonicated raw water. The initial
results obtained were as colony forming units per m£ (CFU/m£) and are recorded in Botha (1993). However,
for the reasons mentioned in the previous paragraph, the results are interpreted in terms of log (N/No) where N
and No represent the final an initial counts respectively.
Experiment Conlral
20 40 60 60 100 120 110Time (min)
a -1
5-2
Experiment Contrcl j
— ——' A
"
0 20 40 60 80 100 120 140Time (min)
FIGURE 3.22 : Plate counts for raw water sonicated for 2 h in the ultrasonic bath
It can be seen that the cavitation generated by ultrasound results in a decrease in the bacterial count whereas
the unsonicated samples (control) indicate no reduction in colony forming units. After 10 min of sonication,
there was a log reduction in the bacterial count of between 1 and 2,35 units which corresponds to between
0,1 % and 11 % survival of the bacteria. As the intensity and frequency of ultrasound emitted by the bath has
been characterised, it can be concluded that ultrasound of intensity, 9,6kW/nr (Section 3.2.2.1), and
frequency, 38 kHz, has an average bactericidal efficiency of 96,2 % for raw water bacteria determined by the
heterotrophic plate count method using nutrient agar substrate incubated for 48 h at 37 °C.

3-40
Raw water which contained a relatively low initial population of bacteria (1 000 CFU/m£) was sonicated for
2 h. Samples of unsonicalcd and sonicated water were prepared for scanning electron microscopy and
photographed. Figure 3.23 illustrates the micrographs obtained for unsonicated (Micrographs 5 and 6) and
sonicated (Micrographs 7 and 8) water. As was observed in the micrographs of uncavitated water, a variety of
bacteria are present in the unsonicated raw water as aggregates and associated with debris (Micrographs 5
and 6). Dispersion of the bacterial aggregates as well as some disruption of bacterial cells occurs upon
sonication as is demonstrated in Micrographs 7 and 8. Comparison of the degree of dispersion caused by
hydrodynamic cavitation (Figure 3.21, Micrograph 2) and ultrasonic cavitation (Figure 3.23, Micrograph 7
and 8) indicates that hydrodynamic cavitation is a more effective dispersion method. As result of the low
initial bacteria population and thus low turbidity of the sample, the effects of sonication on raw water bacterial
aggregates are less pronounced in scanning electron microscopy than that of hydrodynamic cavitation.
It was concluded that ultrasonic cavilation effectively inactivates bacteria as enumerated by the heterotrophic
plate count metliod with the efficiency of inactivation dependent on the intensity and frequency output of the
ultrasonic bath. It was concluded from scanning electron microscopy that a possible reason for this is the
disruption of bacteria! cells by ultrasonic cavitation in addition to their dispersion.

3-41
FIGURE 3.23 : Scanning electron micrographs for unsonicated (Micrographs 5 and 6) mid
sonicated (Micrographs 7 and 8) samples of nnv water

3-42
3 .4 .3 CAVITATION AND ULTRAVIOLET IRRADIATION
Ultrasonic cavitation results in dispersion of aggregates and the inactivation of bacteria. It is possible that
hydrodynamic cavitation may enhance the inactivation of bacteria by other disinfecting agents since
hydrodynamic cavitation disperses bacterial aggregates thus enabling a greater exposure of bacteria to the
disinfecting agent. The disinfecting agent chosen in this study was ultraviolet irradiation as it is extremely
effective and non-chemical. Both hydrodynamic and ultrasonic cavitation prior to ultraviolet (UV) irradiation
were investigated for their effectiveness to enhance the biological effects of UV radiation.
A high pressure mercury lamp with a 254 nm filter was used as the light source. The intensity of the lamp was
determined by chemical actinometry to be 0,2 mW/cnr. Raw water was obtained from Wiggins Water
Treatment Plant and cavitated either in the hydrodynamic cavitation rig or in the ultrasonic bath for various
periods of time. After cavitation the samples were irradiated with UV light for various time periods before
plating and enumeration of viable bacteria. The control for each experiment consisted of uncavitated water
that was irradiated with the UV light.
The results obtained for the UV inactivation of the sonicated raw water samples are illustrated in Figures 3.24
and 3.25. It can be seen the figures that ultrasonic cavitation followed by irradiation only appears to have a
significant effect on the death rate of bacteria after a sonication time of 10 min (Figure 3.25) which can be
attributed to the fact that sonicalion alone is sufficient to cause inactivation.
-3.03 4
Time (min)3 4
Time (min)
FIGURE 3.24 : Plate counts for raw water sonicated for 1 min prior to UV irradiation

3-43
o
LogN
FIGURE 3.25 : Plate
-O.b
-1,0
-?n
-2,5
-3,0
-
_
-
count
\
* ^
2
for raw
4
Expenmeni Control j•*- ••«- I
^
6Time (min)
water sonicated for 10
*
A.
3 10
min prior to
12
UV irradiation
Comparison of the control and experimental death curves in Figures 3.24{a) and 3.24(b) demonstrate littk
enhancement in the inactivation of bacteria by UV in sonicated raw water. Since UV radiation is a potent
inactivator of bacteria {refer to Figure 3.26), any effect of sonication on the death rate of the bacteria is
insignificant.
-0,5
o -1,0
-2,0
-2,5
-30
•
FIGURE 3.26 : Death cunc for
\
2
Experiment
A 6 BTime (min)
raw wntcr bacteriii irradiated
10
with UV light of 254 nm
The effect of the enhancement of UV irradiation on bacterial inactivation was determined by cavitating raw
water in the hydrodynamic cavitation rig at the highest intensity of cavitation for 3 minutes prior to irradiation
with UV. Uncavitated raw water was irradiated under identical experimental conditions as the controls. Plate
counts were performed before and after cavitation on the irradiated raw water. The results obtained are
depicted in Figure 3.27.

3-44
Experiment Control (a)
2 3
Time (min)
0 .
o -1.0
2
•2.S
-3.0
Experiment Contfol
i .
(b)
2 3Time (min)
FIGURE 3.27 : Plate counts for raw water cnvitatcd for 3 min prior to UV irradiation
It is evident from Figures 3.27(a) and 3.27(b) that there is negligible enhancement on the inactivation of raw
water bacteria when hydrodynamic cavitation is used in conjunction with UV. After 2 min of irradiation, there
is a log reduction of 2 and 1,7 for Figures 3.27(a) and 3.27(b) respectively. These reductions correspond to an
average inactivation of 98,2 % for raw water bacteria exposed to a UV dose of 25,2 mWs/cml These results
are consistent with those obtained from low intensity cavilation of raw water followed by UV irradiation.
From the experiments performed it was concluded that there was no significant enhancement by ultrasonic or
hydrodynamic cavitation in .the inactivation of raw water bacteria by ultraviolet radiation. This could be
attributed to the fact that the UV source used in the experiments is very intense and is therefore extremely
effective alone for the inactivation of bacteria in raw water (97,5 % inactivation of bacteria is obsen'ed for a
UV dose of 25,2 mWs/cnr). Any contribution to the enhancement of the death rate of bacteria by cavitation is
therefore observed to be negligible in comparison to the effectiveness of inactivation by UV light. This could
be confirmed by using a less intense UV source and repeating the experiments performed using the
combination of cavitation, both ultrasonic and hydrodynamic. and ultraviolet light.

Chapter 4
Conclusions
This chapter presents the conclusions obtained from the four areas of research investigated in this project,
namely,
• The microbiological assessment of hydrodynamic cavitation for the treatment of raw water
• The evaluation of hydrodynamic cavitation in the cavitation chamber of the CAV-OX® system
D The effect of ultrasonic cavitation on organic pollutants in industrial effluents
D The computational fluid dynamics of hydrodynamic cavitation in a venturi
In order to be consistent with the style of this report, the conclusions are discussed in terms of the various
effects of cavitation.
4.1 THEORETICAL EFFECTS OF CAVITATION
It was concluded from this investigation that the numerical method using the STAR-CD program is capable of
simulating flow conditions up to cavitation, i.e. to indicate the potential of cavitation in a fluid. In addition,
using computational fluid dynamics, it is possible to estimate the local velocities at any point within a venturi
thus enabling the determination of local cavitation conditions (as defined by a cavitation number) at any point
in a fluid.
4.2 PHYSICAL EFFECTS OF CAVITATION
The characteristics of ultrasonic cavitation produced in an ultrasonic cleaning bath and hydrodynamic
cavitation produced in the cavitation chamber of a modified CAV-OX® system and a specially-constructed
hydrodynamic cavitation rig were investigated.
The physical characteristics of the hydrodynamic cavitation produced in the CAV-OX® chamber and the
hydrodynamic cavitation rig were investigated in terms of appearance of bubbles (a phenomenon of cavitation),
nozzle flow characteristics, cavitation number (this indicates the intensity of cavitation; the lower the
cavitation number, the greater the intensity of cavitation produced) and sound emission. The presence of
bubbles, which formed in the throat and collapsed in the divergent section of the chamber, indicated that
hydrodynamic cavitation occurred in both systems. The mass of bubbles increased with increasing flow rate,
increasing throat pressure and decreasing discharge pressure. From this, it was concluded that the degree
(intensity) of hydrodynamic cavitation increases with increasing flow rate and as the pressure drop across the
nozzle is increased (this was also observed in the investigation of computational fluid dynamics of

4-2
hydrodynamic cavitation). This was confirmed by the results for the cavitaiion numbers for the CAV-OX®
chamber and hydrodynamic cavitation rig. Throat cavitation numbers in the CAV-OX® chamber ranged from
0,006 to 0,563 and hydrodynamic cavitation. as indicated by the presence of bubbles, was only observed in the
CAV-OX® chamber when the throat cavitation number was less than the threshold caviiation number (which
was predicted from extrapolation of literature results to be 0,250 for the CAV-OX® chamber). Cavitation
numbers in the hydrodynamic cavitation rig ranged from 0,025 to 0,482; the greatest flow rate and pressure
drop across the nozzle resulted in the lowest cavitation number thus confirming that these flow conditions
produced the greatest degree of cavitation. Since the collapse of bubbles emit sound, the sound pressure levels
determined in the CAV-OX® chamber and hydrodynamic cavitation rig increased with increasing flow rate
and pressure drop across the nozzle. The sound pressure levels emitted by the hydrodynamic cavitation rig
reached at maximum of 82 dB at 4 000 Hz for the most intense condition of cavitation.
The ultrasonic cavitation produced in a ultrasonic cleaning bath was also characterised in terms of its physical
effects. It was proposed that stable ultrasonic cavitation occurs with an intensity of 9,6 kW/nr in the
ultrasonic cleaning bath. However, this intensity is reduced in the reaction vessel.
4.3 CHEMICAL EFFECTS OF CAPTATION
The chemical characteristics of hydrodynamic cavitation were determined by evaluating the concentration of
hydrogen peroxide produced in the CAV-OX® chamber and hydrodynamic cavitation rig. No detectable
amount of hydrogen peroxide was produced by the hydrodynamic cavitation of water in the CAV-OX®
chamber, even in the presence of oxygen (which enhances hydrogen peroxide production). Similarly, no
detectable amount of hydrogen peroxide was produced by the hydrodynamic cavitation (using the most intense
cavitation conditions) of water in the hydrodynamic cavitation rig. The minimum detection limit of hydrogen
peroxide for these experiments was 0,034 mg/£ using the spectrophotometrie analytical method of Baga, et aJ.
(19SS).
The concentration of hydrogen peroxide produced by the ultrasonic cavitation of water in the ultrasonic
cleaning bath was determined to be approximately 0,06 n\g/t. This result supports the reports that hydroxyl
radicals (which combine to form hydrogen peroxide) are formed during ultrasonic cavitation. Saturation of
water with oxygen prior to ultrasonic cavitation (sparged for 15 min prior to sonication) significantly enhanced
the concentration of hydrogen peroxide formed from 0,06 mg/t to 3,5 mg/t. It was concluded that continuous
sparging with oxygen was necessary in order to maintain the enhancement of the radical reactions in the
presence of oxygen.
The degradation of l-methy!hydantoin by ultrasonic cavitaiion was investigated and it was demonstrated that
partial degradation (approximately 25 to 30 %) occurs, possibly due to oxidation by the radical species
(especially hydroxyl radicals) that are formed during ultrasonic cavitation. Degradation of 1-methylhydantoin
is enhanced by the addition of 1 332 mg/l hydrogen peroxide (approximately 62 % degradation), and further

4-3
degradation (approximately 68 %) occurs with the addition of hydrogen peroxide and oxygen saturation prior
to sonication.
Investigation into the identification of the sonochemicai and photochemical degradation products of
1-methylhydantoin in the presence of hydrogen peroxide indicated that similar products were formed. One of
the products formed in the photochemical and sonochemicai degradation of 1-melhylhydantoin in the presence
of hydrogen peroxide was tentatively identified as 1-methylparabanic acid. Oxamide was a suspected product
in the sonochemicai degradation of 1-methylhydantoin in the presence of hydrogen peroxide and oxygen
4.4 BIOLOGICAL EFFECTS OF CAVITATION
As there was no detectable decrease in the colony forming units of raw water bacteria as enumerated by the
heterotrophic plate count technique, it was concluded that hydrodynamic cavitntion does not inactivate raw
water bacteria. However, it was observed from scanning electron micrographs that hydrodynamic cavitation of
raw water caused increased dispersal of bacterial aggregates which caused a increase in the turbidity
measurements. Consequently, the combination of hydrodynamic cavitation and ultraviolet irradiation was
assessed to determine if the dispersal of bacterial aggregates by hydrodynamic cavitation prior to ultraviolet
irradiation would enhance bacterial inactivation by ultraviolet light. No significant enhancement in bacterial
inactivation was observed when compared with only ultraviolet irradiation. Significant inactivation of raw
water bacteria (1,6 to 2 log reduction units) occurred upon ultrasonic cavitation of the water in the ultrasonic
cleaning bath.
4.5 SUMMARY OF CONCLUSIONS
The potential of hydrodynamic cavitation for the treatment of raw water without the addition of chemicals has
been disproved since hydrodynamic cavitation is not an effective method for the inactivation of bacteria in raw
water. Similarly, the application of hydrodynamic cavitation as a single advanced oxidation process is not
recommended as the concentration of hydrogen peroxide produced by the hydrodynamic cavitation of water
(less than 0,03 mg/£) would be ineffective for the oxidation of organic pollutants in industrial effluents and
potable water. These results also invalidate the manufacturer's claims about role of hydrodynamic cavitation in
the production of hydroxyl and hydrogen radicals in the CAV-OX® system. From the results obtained during
this research project, it was concluded that the function of the hydrodynamic cavitation produced in the
cavitation chamber of the CAV-OX® system is to disperse the effluent prior to oxidation with hydrogen
peroxide and ultraviolet light. The results obtained for the degradation of 1-methylhydantoin (an organic
pollutant in Sasol effluent) by ultrasonic cavitation in the ultrasonic cleaning bath indicate the potential of
sonochemistry as an advanced oxidation process for the treatment of industrial effluents. The sonochemicai
formation of hydroxyl radicals by ultrasonic cavitation can be enhanced for industrial treatment purposes by
the addition of hydrogen peroxide and oxygen. The flow conditions, i.e. fluid velocities and pressure drops,
which initiate hydrodynamic cavitation in a fluid can be simulated using computational fluid dynamics.
However, whilst it has been demonstrated that computational fluid dynamics is a useful tool to indicate the

4-4
potential of a fluid to undergo cavitalion, the numerical simulation of hydrodynamic cavitation which involves
two-phase flow using computational fluid dynamics has not been achieved in this project because the flow
system is too complex.
Thus, the conclusions resulting from this project can be summarised as follows :
• Computational fluid dynamics using the STAR-CD program can be used to determine the flow conditions
in a pipe, venturi, etc., which initiate hydrodynamic cavitation.
D Hydrodynamic cavitation, which has been characterised in terms of its physical effects in two sets of
equipment, does not produce delectable concentrations of hydrogen peroxide thus negating the reports of
hydroxyl radical formation, and subsequent hydrogen peroxide production, by hydrodynamic cavitation in
the CAV-OX® system (EPA, 1993).
D Hydrodynamic cavitation is not effective as a method for the inactivation of bacteria in raw water although
it has been used to disrupt bacterial cells (Harrison and Pandit, 1992a, b). However, hydrodynamic
cavitation could be used as a means of dispersion in combination with processes such as the CAV-OX®
process.
• Ultrasonic cavitalion in an ultrasonic cleaning bath does produce hydrogen peroxide as well as inactivate
raw water bacteria.
D Degradation of 1-methylhydantoin can be achieved by ultrasonic cavitation in the ultrasonic cleaning bath.
The degradation rate is enhanced in the presence of hydrogen peroxide, and in the presence of hydrogen
peroxide combined with oxygen saturation prior to sonication. Similar results are observed for the
photochemical degradation of 1-methylhydantoin.
• Two degradation products of 1-methylhydantoin have been tentatively identified : 1-methylparabanic acid
results from the photochemical and sonochemical degradation of 1-methylhydantoin in the presence of
hydrogen peroxide, and oxamide is a suspected product in the sonochemical degradation of
1-methylhydantoin in the presence of hydrogen peroxide and oxygen.

Chapter 5
Recommendations
From the research carried out in this project, the following recommendations can be made :
D No further investigation into the CAV-OX® process,
D Further investigation into ultrasonic cavitation on a laboratory and pilot-plant scale for the treatment of
industrial effluents.
D Investigation of the combination of ultrasonic cavitalion and ultraviolet treatment using industrial
effluents.
D Investigation of effect of dispersional mixing using hydrodynamic cavitation together with disinfection
with chlorine or ozone on the dose of these disinfectants.
• No further work on the computational fluid dynamics of hydrodynnmic cavitalion since the detailed flow
conditions that occur during cavitation cannot be modelled at present.

Chapter 6
Technology Transfer
6.1 INTERACTION WITH OTHER WRC PROTECTS
Involvement with the University of Polchefstroom for Christian Higher Education and their use of
computational fluid dynamics to describe hydrodynamic cavitation in a venturi has resulted in further
application of computational fluid dynamics in the Water Research Commission Project No. 648 : The
Application of Computational Fluid Dynamics to Improve the Design and Operation of Water and Wastewater
Treatment Works,
6.2 TECHNO LOGY TRANSFER ASPECTS
Interest in advanced oxidation processes has been shown by Sasol, University of Durban-Westville, Eskom,
C G Smith and the Foundation for Water Research :
D A report highlighting the industrial uses of sonochemistry for Saso! was prepared for DrPStegman
(Annexurc A).
Q Assistance has been given to Mr G Lok of Eskom Technology, Research and Investigations who requested
information on the uses of sonochemistry in the food and beverage industry.
D Technical advice has been given to Mr S Baines of the Physics Department at the University of
Durban-Westville.
D Dr K J Zeitsch from CG Smith Chemicals, and Dr G Burger and Mr J Buzzard from Illovo Sugar Ltd
approached the Pollution Research Group for information on ultraviolet radiation for the sugar industry.
• Two representatives (Ms C Stephens and Dr D Newsome) from the Foundation for Water Research (FWR)
in the United Kingdom visited the Pollution Research Group in May 1995. The FWR are involved in
ultrasonic work and were interested in using ultrasonic cavitation for water treatment.
6.3 PUBLICATIONS
6,3.1 Papers Presented at Conferences and Seminars
D S Chetty, F G Neytzell-de Wilde and C A Buckley, Evaluation of Hydrogen Peroxide and Ultraviolet
Radiation of Oxidised Organic Molecules in Industrial Effluents and Potable Water, 2nd Biennial
Conference/Exhibition, Water Institute of Southern Africa, World Trade Centre, Kempton Park,
South Africa, 13 - 16 May 1991 (Anncxure B)

G-2
D G W Schwikkard, Water Purification by means of Free Radicals. Sasol Technology Symposium. Rand
Afrikaans University, Johannesburg. South Africa. 1 July 1992
• C J Botha and C A Buckley, Disinfection of Potable Water - The Role of Hydrodynamic Cavitation,
International Specialised Conference on the Disinfection of Potable Water, Kruger National Park,
South Africa, 13 - IS March 1994
D C Kaiser, G W Schwikkard and S J Winship, The Use afCm'itation as an Advanced Oxidation Process
for Water Treatment, Water Institute of Southern Africa (Natal branch) General Meeting, Pinetown,
South Africa. 26 July 1995
6.3.2 Poster Presentations
D C J Botha and C A Buckley, A Study of Hydrodynamic Cavitation as a Method of Water Disinfection,
Biotech SA "93 : 1st Biotechnology Conference in South Africa - Biotechnology and Development in
South Africa, Rhodes University, Grahamstown, South Africa, 31 January - 3 February 1993
6.3.3 Papers in Journals
D Candace J Botha and Chris A Buckley, A Study of Hydrodynamic Cavitation as a Method of Water
Disinfection, Journal of Water Supply Research and Technology - Aqua, 1995, Vol. 13, No. 2, in print
(Anncxurc C)
6.3.4 Theses
• C J Botha, A Study of Hydrodynamic Cm'itation as a Method of Water Treatment, MScEng thesis.
University of Natal, Durban, South Africa, 1993
D G W Schwikkard, An Investigation of the Sonochamicnl Degradation of Hydantoin Compounds, MScEng
thesis (cum laude). University of Natal. Durban. South Africa. 1994
D S Chetty, The Evaluation of the Cavitation Process to Produce Radical Species capable of Oxidising
Organic Pollutants in Industrial Wastewaters and Potable Water, MScEng thesis, University of Natal,
Durban, South Africa, 1994
6.3.5 Other
• As a spin-off from this project, research is being undertaken on the kinetics of hydrogen peroxide
formation in the ultrasonic bath by a MScEng student, Sanjeev Jewnarain, at the University of Natal.
6.4 ARCHIVING OF DATA
The data from the project is contained in Annexures D to F which are available from the Water Research
Commission on request.
References
Anderson, DA, Tannehill, J C and Pletcher, RH, Computational Fluid Mechanics and Heat Transfer,
1984, McGraw-Hill, New York, p. 599.
Baga, A N, Johnson, G R A, Nazhat, N B and Saadalla-Nazhat, R A, A Simple Spcctrophotometric
Determination of Hydrogen Peroxide at Low Concentrations in Aqueous Solution, Analytica Chimica
Acta, 1988. 204, 349-353.
Ball, J W, Tullis, J P and Stripling, T, Predicting Cavitation in Sudden Enlargements, Journal of the
Hydraulics Division, 1975, HY7 (11442), 857-870.
Botha, C J, A Study of Hydrodynamic Cavitation as a Method of Water Treatment, MScEng Thesis, 1993,
University of Natal, South Africa.
Bremner, D, Chemical Ultrasonics, Chemistry in Britain, 1986, 22 (7), 633-637.
Chang, I L., Zaleiko, N S and Peterson, S A, UV Oxidation and Recovery System for Tannery Unhairing
Waste, American Leather Chemists Association, 77th Annual Meeting, Hilton Head Island, SC,
14-18 June 1981.
Chetty, S, The Evaluation of the Cavitation Process to produce Radical Species capable of Oxidising
Organic Pollutants in Industrial Wastovatcrs and Potable Water, MScEng Thesis, 1994, University of
Natal, South Africa.
Corral, R A, Orazi, O O and Zinczuk, J, Muss Spectra of Hctcrocyclic Compounds IV:
2,4,5-TrioxoimidazoIidincs, Organic Mass Spectroscopy. 1979, J4 (9), 470-473.
Daugherty, RL, Franzini, JB and Finnemore, E J, Fluid Mechanics with Engineering Applications, 1989,
McGraw-Hill, Singapore, p. 596.
Dryhurst, G, Hansen, B H and Harkins, E B, Electrochemical Reduction of Parabanic Acid: Products and
Mechanism, Journal o/Electroanalylical Chemistry and Interfaciai Chemistry, 1970, .19 (10), 829-830.
EPA (United States Environmental Protection Agency), CAV-OX® Ultraviolet Oxidation Process -
Magnum Water Technology, Superfund Innovative Technology Evaluation Demonstration Bulletin, August,
1993.
Eisenberg, G M, Colorimetric Determination of Hydrogen Peroxide, Industrial Engineering Chemistry
(Analytical Edition), 1943, 15, 327-328.
Goodwin, T J, Critical Reports on Applied Chemistry: Chemistry With Ultrasound (Chapters), 1990a,
T J Mason (ed), 28, Elsevier Applied Science, New York.

R-2
Goodwin, T J. Sonochcmistry: The Uses of Ultrasound in Chemistry {Chapter II). 1990b. T J Mason (ed).
Royal Society of Chemistry. Cambridge.
Goswami, S, Ghosh, P N, and Basumaiiick, S, Measurement of Ultrasonic Power in Liquids: A Review,
Journal of the Institute of Engineers (India), Part ET: Electronics and Telecommunications, 1988, 69(1),
12-27.
Fahr, E, Fechre, P, Rogh, G and Wustenfeld, P, UV Irradiation of Nucleic Acids and their Components in
the Presence of Air, Angewandte Chemie International, 1980, 19 (10), 829-830.
Hammit, F G, Observations of Cavitation Scale and Thcrmodvnamic Effects in Stationary and Rotating
Components, Transactions of the American Society of Mechanical Engineers : Journal of Basic Engineering,
1963,85(3), 1-16.
Hammit, F G, Barinka, L L, Robinson, M J, Pchlke, R D and Sicbert, C A, Initial Phases of Damage to Test
Specimens in a Cavitating Vcnturi, Transactions of the American Society of Mechanical Engineers : Journal
of Basic Engineering, 1965, 87 (6), 453-465.
Harrison, S T L and Pandit, A B, The Role of Hydrodynaniic Cavitation in Microbia! Cell Disruption,
Enzyme Microbiology and Technology. 1992a (in submission).
Harrison, S T L and Pandit, A BT The Disruption of Microbial Cells by Hydrodynamic Cavitation,
9th International Symposium (presentation), Washington DC, August 1992b.
Hughes, D E and Nyborg, WL, Cell Disruption by Ultrasound. Science, 1962, L38, p. 108.
Ienaga, K, Nakamura, K, Naka, F and Goto, T, The Metabolism of 1-Methylhydantoin via
5-Hydroxy-l-methylhydantoin in Mammals. Biochim'tca et Biophysica Acta, 1988. 967 (3V 441-443.
Ivany, RD, Hammit, FG and Mitchell, TM, Cavitation Bubble Collapse Observations in a Venturi,
Transactions of the American Society of Mechanical Engineers : Journal of Basic Engineering, 1966, 88 (9),
649-657.
Jarman, P D and Taylor, K J, The Spectrum of Sonoluminesccnce, Australian Journal of Physics, 1970, 23,
319-324.1
Jarman, P D and Taylor, K J, Light Flashes and Shocks from Cavitating Flow, British Journal of Applied
Physics, 1965, 16, 675-682.
Jarman, P D and Taylor, K J, Light Emission from Cavitating Water, British Journal of Applied Physics,
1964,15,321-322.
Launder, B E and Spalding, D B, The Numerical Computation of Turbulent Flows, Computer Methods in
Applied Mechanics and Engineering, 1973, 3 (8), 269-289.
H-3
Lehman, A F and Young, J 0, Experimental Investigations of Incipient and Dcsinent Cavitation,
Transactions of the American Society of Mechanical Engineers: Journal of Basic Engineering. 1964, 86.
275-284.
Lipoivicz, M, Rapid Oxidation Destroys Organics in Wastewatcr, Chemical Engineering. 1981, November,
40-41.
Makino, K, Mossaba, M M and Reisz, P, Chemical Effects of Ultrasound on Aqueous Solutions. Evidence
for OH and H radicals by Spin Trapping, Journal of the American Chemical Society, 1982, 104.
3537-3539.
Martinuzzi, R and Pollard, A, Comparative Study of Turbulence Models in predicting Turbulent Pipe
Flow: Part I - Algebraic Stress and k-E Models, A1AA Journal, 1989, 27 (1), 29-36.
Mason, T J, Sonochemistry : The Uses of Ultrasound in Chemistry, 1990a, T J Mason (ed), The Royal
Society of Chemistry, Cambridge.
Mason, T J, Critical Reports on Applied Chemistry: Chemistry With Ultrasound (Chapter 1), 1990b,
T J Mason (ed), _28, Elsevier Applied Science, New York.
Mason, TJ, Practical Sonochemistry: User's Guide to Applications in Chemistry and Chemical
Engineering, 1991, Ellis Horwood. New York.
Mead, E L, Sutherland, R G and Verrall, R E, The Effect of Ultrasound on Water in the Presence of
Dissolved Gases, Canadian Journal of Chemistry, 1976, 54, 1114-1120.
Meyer, D J, Numcriesc Simulasie van Kavitasic, MScEng Thesis, 1993a, Potchefstroom University for
Christian Higher Education, South Africa (submitted for examination).
Meyer, D J, Department of Mechanical Engineering, Potchefstroom University for Christian Higher Education,
1993b (personal communication).
Morrison, R T and Boyd, R N, Organic Chemistry, 1987, 5th edition, Allyn and Bacon, Boston, p. 47.
Nepparis, E A and Hughes, D E, Some Experiments on the Disintegration of Yeast by High Intensity
Ultrasound, Biotechnology andBioengineering, 1964, 6, 247-270.
Neytzell-de Wilde, F G and Chetty, S, Evaluation of Different Methods to Produce Free Radicals for the
Oxidation of Organic Molecules in Industrial Effluents and Potable Water, Report to Water Research
Commission, Project No. 388, February 1990.
Ochiai, H, Radical Reaction of Food Constituents: Photolysis of Radicals in the Presence of Hydrogen
Peroxide, Agricultural and Biological Chemistry, 1971, 35 (4), 622-624.
Patanfcar, S V, Numerical Heat Transfer and Fluid Flow, 1980, McGraw-Hill, New York, p. 197.

R-4
Pegel, K H, Department of Chemistry and Applied Chemistry, University of Natal. Durban. 1993 (persona!
communication).
Perry, R H, Chemical Engineer's Handbook, 1973, 5th Edition, McGraw Hill, Tokyo.
Peterson, F B and Anderson, T P, Light Emission from Hydrodynamic Cavitation, Physics of Fluids, 1967,
K> (4), 874-879.
Petersen, S A and Zaleiko, N S, Innovative Oxidation Technology for Waste Prctrcatment,
Water /Engineering & Management, 1981, February, 32-36.
Pollard, A and Martinuzzi, R, Comparative Study of Turbulence Models in predicting Turbulent Pipe
Flow: Part II - Algebraic Stress and k-e Models, A1A4 journal, 1989, 27 (12), 1714-1721.
Quails, R G, Flynn, M P and Johnson, J D, The Role of Suspended Particles in Ultraviolet Disinfection,
Journal of the Water Pollution Control Federation, 1983,55(10), 1280-1285.
Ratoarinoro, N, Wilhelm, A M, Berlan, J, and Delmas, H, Effects of Ultrasound Emitter Type and Power
on a Heterogeneous Reaction, Chemical Engineering Journal, 1992, 50 (1), 27-31.
Reisz, P, Kondo, T and Krishna, C M, Sonochcmistry of Volatile and Non-volatile Solutes in Aqueous
Solutions. A Spin Trapping Study. Free Radical Research Communications, 1990,1 (1-2), 27-35.
Scherba, G, Weigel, R M and O'Brien, W D. Quantitative Assessment of the Germicidal Efficacy of
Ultrasonic 'Energy, Applied Environmental Microbiology, 1991, 57 (7), 2079-2084.
Schmitt, F O, Johnson, C H and Olson, R A, Oxidation promoted by Ultrasonic Radiation, Journal of the
American Chemical Society, 1929, 5_L p. 370.
Schwikkard, G W, Internal Report, University of Natal, Durban, 1992.
Schwikkard, G W, An Investigation of the Sonoclicmical Degradation of Hydantoin Compounds, MScEng
Thesis, 1994, University of Natal, South Africa.
Sehgal, C, Sutherland, R G and Verrall, R E, Use of 2,2-Diphcnyl-l-picrylhydrazyl to Investigate the
Chemical Behaviour of Free Radicals Induced by Ultrasonic Cavitation, Journal of Physical
Chemistry, 1982, 86 (15), 2982-2986.
Sellers, R M, Spcctrophotomctric Determination of Hydrogen Peroxide using Potassium TitaniumfTV)
Oxalate, Analyst, 1980, J_05, 950-954.
Shutilov, V A, Fundamental Physics of Ultrasound, 1988. OPA Publishers, Amsterdam.
Snell, F D andEttre, L S, Encyclopaedia of Industrial Chemical Analysis, 1971, J4, Wiley & Sons, London.
Standard Methods for the Examination of Water and Wastewater, 1985, 16th edition,
APHA/AWWA/WPCF, Washington DC.

R-5
STAR-CD manual (version 2.2). 1993. Olympic House. 317 Lalimer Road. London.
Suslick, K S, The Chemical Effects of Ultrasound. Scientific American. 1989. 2. 62-68.
Suslick, K S, Ultrasound - Its Chemical, Physical and Biological Effects. 1988, VCH Publishers, New York.
Thacker, J, An Approach to the Mechanism of Killing of Cells in Suspension by Ultrasound. Biochimica et
BiophysicaActa, 1973, 304, 240-248.
Todd, J H, Measurement of Chemical Activity of Ultrasonic Cavitation in Aqueous Solutions, Ultrasonics,
1970, 8 (4), 234-238.
Webster, E, Cavitation, Ultrasonics, 1963,1 (Jan-March), 39-48.
Weissler, A, Formation of Hydrogen Peroxide by Ultrasonic Waves : Free Radicals, Journal of the
American Chemical Society, 1959, 8_L 1077-1081.
Welt}', JR. Wicks, C E, and Wilson, RE, Fundamentals of Momentum, Heat and Mass Transfer, 1984,
3rd edition, John Wiley and Sons, New York.
Young, F R, Cavitation, 1989, McGraw Hill, London.
Yue, P L, Degradation of Organic Pollutants by Advanced Oxidation, Transactions of the institute of
Chemical Engineers, 1992, 70 (Part B), 145-148.
Yu, T J, Sutherland, R G and Verrall, R E, The Sonolysis of Uracil, Canadian Journal of Chemistry, 1980,
58(18), 1909-1915.

ANNEXURE A
REPORT TO SASOL :THE INDUSTRIAL USES OF SONOCHEMISTRY
by
Gavin Schwikkard
Pollution Research Group
Department of Chemical Engineering
University of Natal, Durban
South Africa
July 1995
Annexure to Report to the Water Research Commission on Project No. 388 entitled :
Evaluation of Different Methods to produce Free Radicals for the Oxidation of Organic Molecules in
Industrial Effluents and Potable Water (with special reference to CA l'-OX®)
Head of Pollution Research Group : Professor C A Buckley
Project Leader : Ms S J Winship
Project Team : Ms C J Kaiser
Mr S Chetty
Mr D J Meyer
Mr G W Schwikkard

Industrial Application of Ultrasound
April 1995
Gavin Schwikkard
Ultrasonic applications with the potential For use at Sasol are discussed in the following
sections :
Chemical Processing
The application of ultrasonic energy in the chemical processing industry can be
classifed into two categories: (a) applications in which ultrasonic methods yield a
product superior to that obtained by conventional means (due to a change in reaction
path) and (b) applications where ultrasonic energy is used to enhance the rates of
conventional unit operations, e.g. solid-liquid extractions (Chendke and Fogler, 1975).
In organic synthesis, the use of ultrasound can reduce reaction time and by-product
formation thus increasing the yield (Henglein, 1987). Suslick and Johnson (1984)
demonstrated that the use of ultrasound reduced temperature and pressure
requirements for formation of transition-metal carbonyl complexes. For the reaction
in Scheme 1, the use of ultrasound enabled the operating temperature and pressure to
be decreased from 160 to 10 °C and from 20,3 to 0,45 MPa respectively, while still
giving a comparable yield of the end product.
VCI3.(THF)3 -» V(CScheme ]
Ultrasound can be applied to both homogeneous and heterogeneous chemical reactions.
With homogeneous chemical reactions, an increase in reactivity with sonolysis occurs
because of the formation of radicals. Sonolysis of water produces hydrogen and
hydroxyl radicals which combine to form hydrogen peroxide (Makino et al., 1982).
Radical formation has also been reported for the sonolysis of organic solvents.
Jennings and Townsend (196H proposed a reaction scheme involving free radicals for
the sonication of carbon tetrachloride and chloroform in water. They reported that the

sonication of carbon tetrachloride and chloroform molecules produced free radicals
since the dissociation energy required for these molecules was less than that required
to split the water molecule (which is known to dissociate during sonication).
For heterogeneous reactions involving mixtures of immiscible liquid phases, sonolysis
causes a fine emulsion of the phases and chemical reactions are enhanced due to the
increase in interfacial contact area between the phases (Mason, 1990).
Davidson et al. (1987) investigated the hydrolysis of wool waxes in sodium hydroxide
and reported that the use of ultrasound decreased the reaction time and temperature.
In heterogeneous solid-liquid reactions, the metal can either take part in the reaction
or act as a catalyst. The enhanced reactivity can be attributed to an increase in
surface area because of the erosion (pitting) of the metal surface which is due either to
microstreaming or shock wave generation during cavity collapse (Mason, 1990).
Ratoarinoro et al. (1992) investigated the physical and chemical effects of ultrasound
on the addition of ethyl malonate to chalcone in toluene using potassium hydroxide as
a solid catalyst. With sonication, the initial reaction rate increased by a factor of 10.
This increase in reaction rate is due to a decrease in the size of catalyst particles
during sonication which corresponds to an increase in surface area thereby increasing
the reaction rate.
The ultrasonic enhancement of heterogeneous reactions is greater than that obtained
for homogeneous reactions, indicating that chemical applications of ultrasound in
industry will be most feasible for heterogeneous solid-liquid reactions, i.e. reactions
incorporating a solid phase or catalyst (Bremner, 1986).
Inter-phase mass transfer, especially solid-liquid extractions, is also enhanced by the
application of ultrasonic waves. Solid-liquid extraction processes which have showed
an increase in extraction rates due to the application of ultrasound are: extraction of
soluble matter from cellular solids (e.g. sugar from sugar beets), solvent extraction (oils
from oil seeds), extraction of alkaloids from herbaceous and plant-like materials and
the leaching of oils (Chendke and Fogler, 1975).

3 _
Environmental Remediation
Ultrasound can be applied in environmental remediation, for the removal of airborne
particles or degradation of low level contaminants (Grinthal and Ondrey, 1992).
Acoustic agglomeration can be used to remove pollutant particles from air which are
too small (less than 5 um in diameter) to be removed by electrostatic precipitators.
Airborne soot in a 15 m chamber were reduced by three orders of magnitude with an
ultrasonic transducer, which operated at 21 kHz, in experiments performed at the
Institute of Transuranium Elements in Germany; experiments were also scaled up to a
170 m3 chamber (Grinthal and Ondrey, 1992).
Projects in the USA funded by the Department of Energy (DOE) and the
Environmental Protection Agency (EPA) are researching the ultrasonic enhanced
decomposition of toxic organics in soil and water (Grinthal and Ondrey, 1992). The
results from one project, have shown that ultrasound reduced the time required to
destroy 3-chlorobiphenyl in waste water by 75 % (Grinthal and Ondrey, 1992). The
reaction was performed at ambient temperature and pressure, and titanium dioxide was
used to catalyze the degradation of water molecules into hydroxyl radicals; the
hydroxyl radicals react with the halogenated organic compounds decomposing them
into carbon dioxide and hydrochloric acid. Ultrasound has been used in research
performed at the University of Akron (Ohio) into the treatment of drinking and waste
water contaminated with low level (mg £~:) volatile organic compounds {Grinthal and
Ondrey, 1992). Ultrasound was shown to destroy seven pollutants, separately and in
mixtures (benzene, carbon tetrachloride, 1,2-dichloroethane, methylene chloride,
1,1,1-trichloroethane, 1,1,2-trichIoroethyIene and toluene). Although the cost of
ultrasonic treatment was more then ozonolysis, ultrasonic treatment was more effective
in the treatment of certain compounds; 1,1,1-trichloroethane, trichloromethane and
carbon tetrachloride (Grinthal and Ondrey, 1992).
The combination of ultrasound and ozone has been used in the treatment of industrial
effluent and municipal sewage. The use of ultrasound causes an emulsion, of the
suspended particles and dispersed microorganisms, to form. In the treatment chamber,
ultrasonic waves prevent the ozone bubbles from coalescing thus ensuring a maximum
surface area available for oxidation (Chendke and Fogler, 1975). In a pilot plant
processing 76 I d a of sewage, 60 s of ultrasonic and ozone treatment proved capable
of destroying 100 % of the microorganisms, 93 % of the phosphates and 72 % of the
compounds containing nitrogen (Chendke and Fogler, 1975).
3 Emulsification
The advantages of ultrasonic emulsification over conventional methods are that an
ultrasonic emulsion has particles in the submicrometre range with an extremely narrow
particle size distribution. In laboratory studies, the mean particles size of an ultrasonic
emulsion was reported to be between 0,18 to 0,37 um {Chendke and Fogler, 1975).
The emulsions are more stable and thus the addition of a surfactant to produce and
stabilize the emulsion is not necessary. The energy needed to produce an emulsion is
also less than that needed in conventional methods (Chendke and Fogler, 1975).
Industrial applications of ultrasonic homogenization are the production of
Worcestershire sauce, cream type soups, peanut butter and emulsion paint (Chendke
and Fogler, 1975).
4 Polymer Chemistry
Prolonged exposure of polymer solutions to ultrasound results in a permanent reduction
in the viscosity of the solution. This degradation is due to cavitation. Ultrasound is
also used for the initiation of polymerization (Lorimer, 1990). Ultrasonic irradiation,
in both batch and continuously stirred reactors, of the suspension polymerization of
styrene was found to be an effective method of preventing agglomeration between
droplets and the sticking of droplets to the reactor wall. Both of these lead to heat
build up and the formation of large masses thus shortening operation times
(Hatate et al., 198i in Lorimer, 1990).
5 Defoaming
Ultrasonic techniques used for breaking foams are mechanical with the advantage that
the addition of chemical defoaming agents are not required. Most liquids with
viscosities up to 500 cp can be ultrasonically defoamed, however, the exact mechanism
of ultrasonic foam disintegation is not entirely understood (Chendke and Fogler, 1975).

Ultrasonic Mixing
Reverbatory ultrasonic mixers introduce a high level of ultrasonic energy into a
flowing stream for a brief period of time. A typical application is the cleaning of
crushed ore which improves the recovery of precious metals from the ore
(Hunicke, 1990). Water slurries of 3 £ s"1 can be treated with a total of 16 k\V of
ultrasonic energy. Vibrating trays are used for coal and ore beneficiation which can
treat slurries with a typical flow rate of 6 kg s"1 (mixed with an equal volume of
water). The power requirement of this equipment (2 kW) is remarkably low
(Hunicke, 1990).
Ultrasonic Cleaning
Ultrasonic cleaning equipment is the most widely used ultrasonic industrial application
and systems of up to 50 000 t are commercially available (Mason, 1991). An ultrasonic
cleaner which contained approximately 7 500 t of heated alkaline-detergent solution
and delivered 40 k\V of ultrasonic energy was used by the US Navy, from 1968
onwards, to facilitate the disassembling of jet engines since heat and corrosion made
the unscrewing.of fastening bolts difficult (Hunicke, 1990). The ultrasonic energy was
supplied by two banks of immersible transducers and the uniformity of the ultrasonic
energy was found to be within 10 % anywhere in the tank.
References
Bremner, D. (1986) Chemical Ultrasonics, Chemistry in Britain, 22(7), 633-638.
Chendke, P.K. and Fogler, H.S. (1975) Macrosonics in Industry. IV. Chemical
Processing, Ultrasonics, 13(1), 31-37.
Davidson, R.S., Safdar, A., Spencer, J.D., and Robinson, B. (1987) Applications of
Ultrasound to Organic Chemistry, Ultrasonics, 25(1), 35-39.
Grinthal, W. and Ondrey, G. (1992) Ultrasound: Seen But Not Heard, Chemical
Engineering, 99(10), 37-41.
Henglein, A. (1987) Sonochemistry: Historical Developments and Modern Aspects,
Ultrasonics. 25(1), 6-16.
Hunicke, R.L. (1990) Industrial Applications of High Power Ultrasound for Chemical
Reactions, Ultrasonics, 28(5), 291-294.

Jennings, B.H. and Townsend, S.N. (1961) The Sonochemical Reactions of Carbon
Tetrachloride and Chloroform in Aqueous Suspension in an Inert Atmosphere,
Journal of Physical Chemistry. 65(9), 1574-1579.
Lorimer, J.P. (1990) Chapter 9: Ultrasound in Polymer Chemistry. In Sonochemistry:
The Uses of Ultrasound in Chemistry, ed. T J . Mason, Royal Society of
Chemistry, Cambridge, ISBN 0-S5186-293-4.
Makino, K., Mossoba, M.M., and Riesz, P. (1982) Chemical Effects of Ultrasound on
Aqueous Solutions. Evidence for OH* and H* by Spin Trapping, Journal of the
American Chemical Society, 104(12), 3537-3539.
Mason, T.J. (1990) Chapter 1: Introduction. In Critical Reports on Applied Chemistry:
Chemistry With Ultrasound, ed. T.J. Mason, 28, Elsevier Applied Science, New
York, ISBN 1-85166-422-X.
Mason, T J . (1991) Practical Sonochemisiry: User's Guide to Applications in Chemistry
and Chemical Engineering, Ellis Horwood, New York, ISBN 0-13-682642-3.
Ratoarinoro, N., Wilhelm, A.M., Berlan, J., and Delmas, H. (1992) Effects of
Ultrasound Emitter Type and Power on a Heterogeneous Reaction, Chemical
Engineering Journal, 50(1), 27-31.
s u 5 l i c k , K , , a n d
ANNEXURE B
EVALUATION OF HYDROGEN PEROXIDE AND ULTRAVIOLETRADIATION OF OXIDISED ORGANIC MOLECULES IN
INDUSTRIAL EFFLUENTS
Paper presented by
S Chetty, F G Neytzell-de Wilde and C A Buckley
2nd Biennial Conference/Exhibition, Water Institute of Southern Africa, Kempton Park,
South Africa, 13 - 16 May 1991
Anncxurc lo Report lo the Walcr Research Commission on Project No. 388 entitled :
Evaluation of Different Methods to produce Free Radicals for the Oxidation of Organic Molecules in
Industrial Effluents and Potable Water (with special reference to CA V-OX®)
Head of Pollution Research Group : Professor C A Buckley
Project Leader : Ms S J Winship
Project Team : Ms C J Kaiser
Mr S Chetty
Mr D J Meyer
Mr G W Schwikkard

EVALUATION OF HYDROGEN PEROXIDE AND ULTRAVIOLET RADIATION TOOXIDISE ORGANIC MOLECULES IN INDUSTRIAL EFFLUENTS AND POTABLE
WATER
S. Chettv. F.G. Neytzell-de Wilde and C.A. BuckleyPollution Research Group, Department of Chemical Engineering, University of Natal,
Durban, 4001, Republic of South Africa.
f-
ABSTRACT
The protection of the environment has become an important issue which has implications onindustrial operations, specifically the oxidation of organic pollutants in wastewaters. Presentmethods employ processes to produce a free radical which initiates free radical chain reactions.The use of photolysis for this application has been studied but industrial applications arelimited. This preliminary study evaluates the literature of the photacatalytic processes withemphasis on ultraviolet radiation. Current work is concentrated on the production of thehydroxyl radical a: an initiator which can be achieved by the photocatalytic decompositionof hydrogen peroxide. It has been reported that cavitation also produces the hydroxyl radicalfrom a water molecule. Effluents containing reactive dyes were treated with UV radiationand hydrogen peroxide. The decolourisation of these effluents was maximised at the UVexposure time of 56 seconds for peroxide concentrations greater than 20 mg/£. Cyanideeffluent was also treated and the concentration was reduced from 5 mg/Z to under 2 mg/Zwith 7 mg/£ of hydrogen peroxide.
EKSERP
Die beskerming van die omgewing het nou 'n belangrike saak geword en net verwikkelingeop nywerheidse bewerkings gekry. Een van die gebiede wat bepaar daardeur beinvloed is,is die verwydering van organiese besoedelmiddels van nywerheidse gemorste water endrankbare water. Hedendaagse metode maak gebruik van ontwikkelinge wat 'n vrye radikaaloplewer wat 'n vrye radikaal ketting reaksie veroorsaak. Die gebruik van fotolitiese reaksiesvir hierdie applikasie is omvattend bestudeer maar nywerheidse applikasies is beperk. Hierdieinleidende studie bereken die letterkunde van die fotokatalitiese ontwikkeling met klem opultraviolet uitstraaling. Die hoof kenmerk van hedendaagse werk is die oplewering van diehidroxyl radikaal as 'n aanvanger. Dit kan deur die fotokatalitiese ontbinding van diewaterstof perokside verrig word. Dit was gerapporteer dat die kavitasie ook die hidroxylradikaal van 'n water molekule oplewer. Uitstromendes wat reaktiwe kleurstowwe bewathet was met UV uitstraaling en waterstof perokside behandel. Die ontkleuring van hierdieuitstromendes was hoogste fay die UV blootstellinge tyd van 56 sekonde vir waterstof peroksidekonsentrasie groter as 20 mg/£. Cyanide uitstomendes was ook behandel en die konsentrasiewas van 5 mg/Z tot onder 3 mg/£ verminder met 7 mg/Z van waterstof perokside.
KEYWORDS
Ultraviolet radiation, hydrogen peroxide, decolourisation, oxidation, hydroxyl radical.

INTRODUCTION
The oxidation of organic compounds in industrial effluents and potable water is becomingincreasingly important. Processes that are typically used in industry involves the generationof a free radical which initiates free radical chain reactions resulting in the oxidation of theorganic species. These processes use chemical initiators such as hydrogen peroxide, ozone,chlorine and chloride dioxide and/or high energy radiation such as ultraviolet (UV), x-ray,gamma ray and electron beam radiation to produce the free radical initiator .
''"The use of chlorine to generate free radicals for the treatment of drinking water alters thesmell and taste characteristics of the treated water (Mone, 1973). Ozone oxidises the organicsby the generation of an oxygen free radical, the predominant products being saturated alcoholsand carboxylic acids which build-up after a certain extent of ozonation (Marooka et o/., 1988).This can be eliminated by using a stronger oxidising agent. The hydroxyl radical is secondonly to the fluorine radical in oxidising strength.
Advanced oxidation processes usually refers to the combination of ozone with ultravioletradiation or hydrogen peroxide or a combination of all three processes to produce the hydroxylradical. Other processes that also produce the hydroxyl radical are a combination of UVradiation and hydrogen peroxide, a combination of ferrous ion with hydrogen peroxide(Fenton's reagent), the heterogeneous photocatalytic decomposition of water and electronbeam radiation. The use of cavitation has been employed in a process to produce the hydroxylradical by splitting a water molecule.
FREE RADICALS FROM THERMOLYSIS, PHOTOLYSIS OR ELECTRON TRANSFER
A free radical is an atom, a molecule or a complex which contains one or more unpairedelectron. Free radicals can exist in the gaseous and liquid phases and the principles aresimilar in both cases (Codagan, 1973 and Barrow, 1966).
Radicals may be formed by homolytic scission (equal splitting) of co-valent bonds
A : B -* A * + B*
where * represents an unpaired electron.
The principle types of reactions are :-
abstraction: *CH2 + CH2CHzCH2CHj -> CH< + CH3*CHCH2CH3
addition : Br* + CH2-CH-R -> BrCH2-*CH-R
and combination : 2(*C//a) -» CzHt
The first two reactions are steps that do not eliminate the free radical centre and do notdirectly give the final products but constitute only steps in that direction. The abstractionstep can lead to chain reactions, as in the system of H2 and Cl2 :
tf* + Cl2 -» HCl + Cl*
Cl* + H2 -> HCl + Hx

H* + Cl2 -» etc.
The addition step can lead to polymerisation reactions as in the formation of polythene
CHI~CH2
R -CH2~C!l2~CH1-'Cn2
•""Production of Free Radicals
The simplest way tn produce radicals is by direct homolysis of co-valent bonds either bythermolysis or photolysis :
A - B -* A* + B*or ttQ hi
Another method is to introduce the odd electron from another species in the form of electrontransfer via a redox reaction for example Fenton's reaction :
Fs2' + K 2 O , -» fe 3 " + ' HO' + *OH
Photolysis involving radiation in and below UV range have been employed in bond breaking(Cha and Smith, 1972 and Anon, 1990a).
Radical Chain Processes Involved in the Oxidation of Organic Compounds
The liquid-phase oxidation of organic substances occurs by chain-forming and branchingreactions but not by combustion. Chain reactions increase the number of free radicals andaccelerates the rate of oxidation. Peroxides and hydroperoxides initiate chain reactions bythe homoiytic rupture of the comparatively weak 0 - 0 bond (Emanual ei a/., 1984). Reactionsfrom bond scission lead to larger molecules or smaller molecules (Semenov, 1958).
Radical Formation by Homoiytic Bond Scission Due to Light Absorption
In ordinary chemical reactions, activation energy is supplied by the chance collection in amolecule or pair of molecules, of a large amount of thermal energy. Activation energy canalso be acquired through the absorption of a quanta of visible or ultraviolet radiation resultingin photo-chemical reactions. Energy absorption per mole of reaction substance is shown inTable 1 for different wavelengths (Glasstone, 1948).

Wavelengthnm
200300400500
600700
800
Colour region
ultravioletultravioletvioletblue greenyellow orangered
near infrared
TABLE 1 : ENERGY ABSORPTION FOR DIFFERENT WAVELENGTHS
EnergykJ/mol
599399299239200171150
The relationship between wavelength and energy is given by :
' - r <"where
E = energy (J)
h= Planck's constant (6.626*I0-34 J.s)c = speed of light (m/s)\ = wave length (m)
Only light which is absorbed can produce a photochemical change. This is quantified bythe absorbance spectrum of the substance. The absorbed radiation affects rotational,vibrationa! or the electronic energy levels of a molecule. The first two transitions areinsufficient to provide activation energy for chemical reaction (above 167 kJ/mol) or fordirect bond breaking (209 to 418 kJ/mol). Only electronic transitions are sufficient to breakbonds. The absorption of radiation is, however, not necessarily accompanied by chemicalreaction.
The electronic spectrum of colourless substances absorbs in the ultraviolet region (less than400 nm), the energy absorbed will be greater than 299 kJ/mol (Table 1). Such' radiationsare likely to produce a chemical change. The electronic spectrum of coloured substances liein the visible region (400 to 800 nm) with corresponding energies of 293 to 146 kJ/mol, whichis often sufficient to bring about photo-chemical reactions.
The above comments refer to dissociation as the primary stage. A number of secondaryprocesses can follow the primary stage such as, for example, recombination of the products,removal of energy from the light absorbing substance before it has time to react, and chainreactions.
Where the active radiation falls within the banded (discontinuous) spectral region of theabsorbing molecule, the primary process is not dissociation, but formation of excited oractivated molecules possessing energy in excess of the normal due to an increase in the

electronic energy. The excited molecule may then react when it collides with anothermolecule, or it may lose its energy if it does not react or combine within a short time (IO~7
to I0"B s). There is also the possibility of dissociation occurring if there is sufficient energy.
In some cases the reacting substance is unable to absorb radiation directly but a suitable atomor molecule (sensitizer) can absorb the radiation and pass it on to the reacting molecule. Suchreactions are called photosensitized reactions.
Bond dissociation energies are given in Table 2 for various common bonds (Johnston, 1968).Any energy acquired by the molecule {by radiation, from electron transfer or by mechanicaldegradation) can readily be distributed amongst the various modes of molecular excitation,and reaction occurs when the bond to be broken accumulates the necessary amount of energy.
TABLE 2 : DISSOCIATION ENERGY FOR COMMON CHEMICALBONDS
Bond Value(kJ/mol)
Compound
(s)
0=0H-H0-H0 - 0C-C
C-HC-NC-0C=0C=0C=0C-0C-FC-ClC-Br
498436464142347611837413305358736749803077490326272
H2OH2O,OrganicOrganicOrganicOrganicOrganicOrganicAldehydes
KLetones
CO2
CO
CF4
ecuCBr4
Generation of the Hydroxyl Radical Using Hydrogen Peroxide
Effect of ultraviolet light
Hydrogen peroxide is excited by the absorbtion of UV light and dissociates into two hydroxylradicals (OH*), The wavelength of 254 nm is preferred.
Secondary reactions also occur but yields are low and not considered important (Datnton,1966). The liquid phase reaction involving the decomposition of hydrogen peroxide has beenthoroughly investigated.

Photo sensitizers
Organic molecules containing carbonyl groups such as benzophenone (CGH5CO-Ccns) and
anthraquinone (C6H7(CO)2C6H7) are easily excited by the absorption of UV light. They in
turn transfer the energy to the potentially reactive molecules. This technique catalytically
produces hydroxyl radicals from peroxide.
The Use of Water for Generation of Hydroxyl Radicals
^UV irradiation of water can produce hydroxyl radicals if the wavelength is less than 184 nm.
Because of the very short wavelength it is better to use ionizing radiation (Ashmore et at.,
1967).
It is alleged that the hydroxyl radical can be produced by controlled cavitation (Chang et al.,1981). Cavitation is caused either by hydrodynamic pressure reduction of a body of liquidor by sonolysis. These processes produce a vapour filled cavity, the violent collapse of whichproduces instantaneous temperatures up to 2 000 °C and pressures over 100 MPa (Knapp etal., 1970). The high temperatures may cause partial dissociation of some molecules to formreactive hydroxyl radicals. Luminescence due to the photochemical release of energy hasbeen observed. The literature on acoustic cavitation covers a considerable amount ofinformation on chemical effects including the formation of free radicals (Young, 1989). Verylittle information has appeared in the literature on the use of hydrodynamic cavitation.
Peterson and Zaleiko (1981) have reported on the oxidation of a number of chemicals by
hydrodynamic cavitation alone. Oxidation times ranged from 30 minutes to 180 minutes.
The use of hydrodynamic cavitation for destruction of microbial cell material in wastewater
sludge has also been discussed (Peterson and Zaleiko, 1981).
Should the water molecule dissociate in the absence of scavengers the following could beexpected :-
H* + *OH -» H^O
2H* -» Hz
2*0/ / -» H2O2
H* * H20 -» *OH + fl2
TOH + Hz -* H* + HZO
Chang el al.. (1981) claims the dissociation of water, which has a bond energy of 502kJ/mol.,
by cavitation does occur. It can be expected that molecules with lower bond energies will
also form radicals.
Reactions of the Hydroxyl Radical
Hydroxyl radicals oxidise by abstraction of a hydrogen atom from an organic molecule resultingin an organic radical (R*) :-
RH + OH* - > / ? * + HOH

In the presence of oxygen, the organic radical (R*) combines readily with an oxygen moleculeto form a peroxy radical ROO*, These organic peroxy radicals are very reactive.
Many addition reactions with hydroxyl radicals have been investigated. With vinyl compoundsit forms substituted hydroxy ethyl radicals which are the initiating species for additionpolymerisation. Similar reactions occur with aromatic molecules to produce more complexmolecules for example the formation of m-cresol from toluene (Semenov, 1958 andBryce-Smith, 1968-1986).
^Clearly then, from the above it is necessary to investigate carefully the end products beforethe techniques used in a process can be recommended for effluent purification,
Merz and Waters have indicated that the following compounds are not readily attacked bythe hydroxyl radical :-
Carboxylic acids, such as acetic, malonic, maleic and fumaric.Ketones such as acetone, methyl ethyl ketone.Amides such as urea, acetamide.
They also list a number of compounds with the products that have been identified (Table 3).
TABLE 3 : PRODUCTS OF OXIDATIONS WITH THE HYDROXYL RADICAL
Substrate type
Primary and secondaryalcohols
Ethers
Amino acids
Tertiary alcohols
Glycols
Esters
Carboxylic acids
Amines
Substrate oxidised
Methyl alcoholEthyl alcohol
Diethyl etherDioxan
GlycineAlanine
/erf-Butyl alcohol/er/-Amyl alcohol
Ethylene glycol
Methyl acetateEthyl acetate
Propionic acid
DiethylamineTriethylamine
Products identified
CH2OCH3-CHO
CH3-CHOCH2O, H-CO3H, oxalic acid
CH2OCH3-CHO
CH3-CO-CH3l CH2OCH3-CO-CH3, CH3-CHOC2HS-CO-CH3, CH2O
CH,(OH)-CHO, CH2O
CH,0CH3-CHO
CH3-CHO
CH3-CHOCH3-CHO

CHEMICAL TESTS CONDUCTED TO EXAMINE THE CHARACTERISTICS OFHYDROGEN PEROXIDE AND ULTRAVIOLET RADIATION
Introduction
Tests using UV radiation and hydrogen peroxide were conducted on effluents containingRemazol red and R.srr:azol blue reactive dyes and a sodium cyanide effluent.
Cyanide is a relatively easy inorganic molecule to oxidise. Ritcey (19S9) discusses the variousprocesses used to treat cyanide effluent. Although ozone treatment is one of the moresuccessful methods in destroying cyanide effluent it cannot however remove iron cyanidecomplexes without ultraviolet or ultrasound treatment.
Experimental
The apparatus consisted of three photoreactors connected in series, fitted with low pressuremercury vapour lamps. Each lamp is physically isolated from the fluid in the reactor by aquartz tube which allows 70 to 90 % of short UV rays (predominantly 254 nm) to pass (Mone,1970). A dosing pump was used to inject hydrogen peroxide into the effluent. The apparatusis depicted schematically in Fig. I.
D
Figure 1. Schematic representation of experimental apparatus
The decolourisation of dyes was determined by ADMI analysis (Allen el a/., 1972). Theextent to which cyanide concentration decreased was determined with MINTEK cyanidedetector sticks. These sticks indicated cyanide concentration in the ranges greater than 2mg/l, 0,5 to 2 mg/£ and less than 0,5 mg/£.
Results and Discussion
Tables 4a and 4b tabulates the results of the tests with Remazol red dye effluent and Remazolblue dye effluents respectively. The effect of hydrogen peroxide concentration and exposuretime to UV radiation is shown in Figs. 2 and 3. In all cases complete decolourisation of theeffluent could be achieved with less than 100 mg/£ of hydrogen peroxide. In both cases thereduction of the ADMI units was greatest at the intermediate retention time of 56 seconds.The reaction products have not been determined. Dyes treated with only hydrogen peroxideshowed no reduction in the ADMI value.

TABLE 4a : EFFECT OF H,O2 CONC. AND UV RADIATIONEXPOSURE TIME ON DECOLOURISATION OF REMAZOL RED DYE
EFFLUENT
Flow rate Retentiontime
• econdi
H2O2cone.mg/£
ADMIvalue
Reductionin ADMI
22
32
SI,6
56,3
45
5255075
100
05,9
11,717,623,4SB,646,982
D6,3
12,521,931,255570
130
22385
1004435
228144
807968672620
147106
525466657376
38,47G,572,487,9Q0,3
4263,479,679,982,7S393,494,9
59,570,8SS.785,181,B82,179,979,1
Initial dye concentration 5 mg/£
TABLE 4b : EFFECT OF H,O2 CONC. AND UV RADIATION
EXPOSURE TIME ON DECOLOURISATION OF REMAZOL BLUE
DYE EFFLUENT
Flow rate
£/min
22
32
40
Retentiontime
seconds
81,8
56,3
45
H1O2cane.mg/£
05,6
11,418,915,945,563,6
02,9
11,717,620,546,9G5,603,8
06,3
12,515,6254070
100
ADMIvalue
128100
8680848084
138114
866384904341
144114108
B61031067068
Reductionin ADMI
% age
24,741,249,452,950,652,950,6
19,333,349,760,250,947,474,976,0
19,13G,039,3S1.742,140,560,761,8
Initial dye concentration 5 mg/ i

10
I
0 20 40 SO BO 1D0 120HYDROCIH PEBOBDE CDMCENIJUTUM m, / l
St-Sl.Bl BT.5S.il RT-4SJ
20 *0 dO SO 100 COHttMOCtH POtOiOE CCK. " i / '
HT-HI.Bl RT-56.3« RT-JSi
Figure 2. Effect of H2O2 cone, onreactive dyes - Remazol Red (F38)
Figure 3. Effect of H2O2 cone, onreactive dyes - Remazol Blue (R Special)
The strong oxidation characteristics of the hydroxyi radical is further illustrated by thetreatment of the cyanide effluent. The concentration of the effluent is reduced from 5 mg/£to below 2 mg/7 by the use of 7 mg/£ of hydrogen peroxide. The results of these tests aregiven in Table 5.
TABLE 5 : RESULTS OF TESTS WITH CYANIDE EFFLUENTS
Condition]
No treatmentUV onlyH2O2 onlyUV and H2O2
UV + H2O2
UV
Flow rate
£/min
3.7S3,753.7S3,753,753,75
H2O2
mz/l
3,8
4,9
3,0
7,0
Fmal cyanideconcentration
me/I (CN)
>2
>2
>2
>2
>2
<2
Initial concentration of cyanide ai CN = 5
CONCLUSIONS
High energy radiation and strong oxidising agents are being used to achieve complete oxidationof organic pollutants. One such oxidising agent is the hydroxyl radical which can be producedby irradiation of hydrogen peroxide. The hydroxyl radical can also be produced by thesplitting of the water molecule. The cavitation process uses this method. Molecules suchas glucose have been shown to undergo complete oxidation when treated with the hydroxylradical. If complete oxidation is not achieved then products need to be identified since toxiccompound may be formed. An example is the oxidation of toluene which can producem-cresol.

11
Tests conducted with reactive dye effluents indicated that complete decolourisat'ion of theeffluent could be achieved with less than 100 mg/£ of hydrogen peroxide. Furthermore atconcentrations above 20 mg/£ of peroxide the decolonisation of the effluent is maximisedat the retention time of 56 seconds. Cyanide effluent was also treated with UV radiationand hydrogen peroxide. The cyanide concentration was reduced from 5 mg/i to under 2mg/7 with 7 mg/Z af hydrogen peroxide.
^ACKNOWLEDGEMENTS
This work was undertaken in terms of a Water Research Commission Project No. 388 entitled'Evaluation of Different Methods to Produce Free Radicals for the Oxidation of OrganicMolecules in Industrial Effluents and Potable Water.' The initial work was sponsored byWatergroup Africa (Pty) Ltd. who also supplied some of the equipment.
REFERENCES
Allen, \V. et at., (1972). Determination of Color of Water and Wastewater By Means of ADMIColor Values, Proceedings of the 28th Industrial Waste Conference, Purdue University.
Anon (1990a). Electron Beam Wastewater Treatment Removes Organics, Futuretech No. 102.
Anon (1990b). Treatment of Industrial Effluents, Effluent and Water Treatment Journal, 19,15-19.
Ashmore, D.G.ef a/., (1967). Photochemistry and Reaction Kinetics, Cambridge UniversityPress.
Barrow, G.M. (1966). Physical Chemistry, 2nd Ed., McGraw-Hill Book Co.
A Specialist Periodical Report: Photochemistry, (1968-1986), D. Bryce-Smith, The ChemicalSociety, London, 1-18.
Cha, C.Y. and Smith, I.M. (1972). Wavelength Effects in Photochemical Oxidation of OrganicPollutants in Waste Water, hid. Eng. Chem. Proc. Des. Dev., 11,(3).
Chang, I.L., Zaleiko, N.S. and Peterson, S.A. (1981). UV Oxidation and Recovery System forTannery Unhairing Waste, American Leather Chemists Association, 77th Annual Meeting,Hilton Head Island, S.C, June 14-18.
Codagan, J.I.G. (1973). Monograph for Teachers No. 24, Principles of Free Radical Chemistry,The Chemical Society, London.
Dainton, F.S. (1966). The Simplest Free Radicals, International Symposium on 'Free Radicalsin Solution1, Butterworths Inc., London.
Emanual, N.M., Zaikoo, G.E. and Maizus, Z.K. (1984), Oxidation of Organic Compounds,Pergammon Press.
Glasstone, S. (1948). The Elements of Physical Chemistry, D. van Nostrand Company, Inc.
Johnson, D.A. (1968). Some Thermodynamic Aspects of Inorganic Chemistry, CambridgeUniversity Press.

_.._ J.2
Knapp, R.T., Daily, J.W. and Hammit, F.G. (1970). Cavitation, McGraw-Hill Book Co.
Merz, J.H. and Waters, W.A. (1949). Some Oxidations Involving Free Hydroxyl Radical, J.Chem. Sac, Supplement Issue (1) SI5-25.
Mone, J.G. (1973). Ultraviolet Water Purification. Pollution Engineering Magazine, 5_, (12).
Morooka, S. et aL, (1988). Decomposition and Utilisation of Ozone in Water TreatmentReactor with Ultraviolet Radiation, Ind. Eng. Chem. Res., 22, 2372-2377.
Peterson, S.A. and Zaleiko, N.S. (1981). Innovative Oxidation Technology for WastePretreatment, Water Engineering and Management, 32-36.
Ritcey, G.M., (1989). Tailings Management. Problems and Solutions in the Mining Industry,Elsevier, New York.
Semenov, N.N. (1958). Some Problems of Chemical Kinetics and Reactivity, 1. PergammonPress.
Young, F.R. (1989). Cavitation, McGraw-Hill Book Company.

ANNEXURE C
A STUDY OF HYDRODYNAMIC CAVITATION AS A METHOD OFWATER DISINFECTION
by
Candace J Botha and Chris A Buckley
Journal of Water Supply Research and Technology - Aqua, 1995, 13(2), in print
Anncxure to Report to the Water Research Commission on Project No. 388 entitled :
Evaluation of Different Methods to produce Free Radicals for the Oxidation of Organic Molecules in
Industrial Effluents and Potable Water (with special reference lo CA V-OX®)
Head of Pollution Research Group :
Project Leader :
Project Team :
Professor C A Buckley
Ms S J Winship
Ms C J Kaiser
Mr S Chetty
Mr D J Meyer
Mr G W Schwikkard
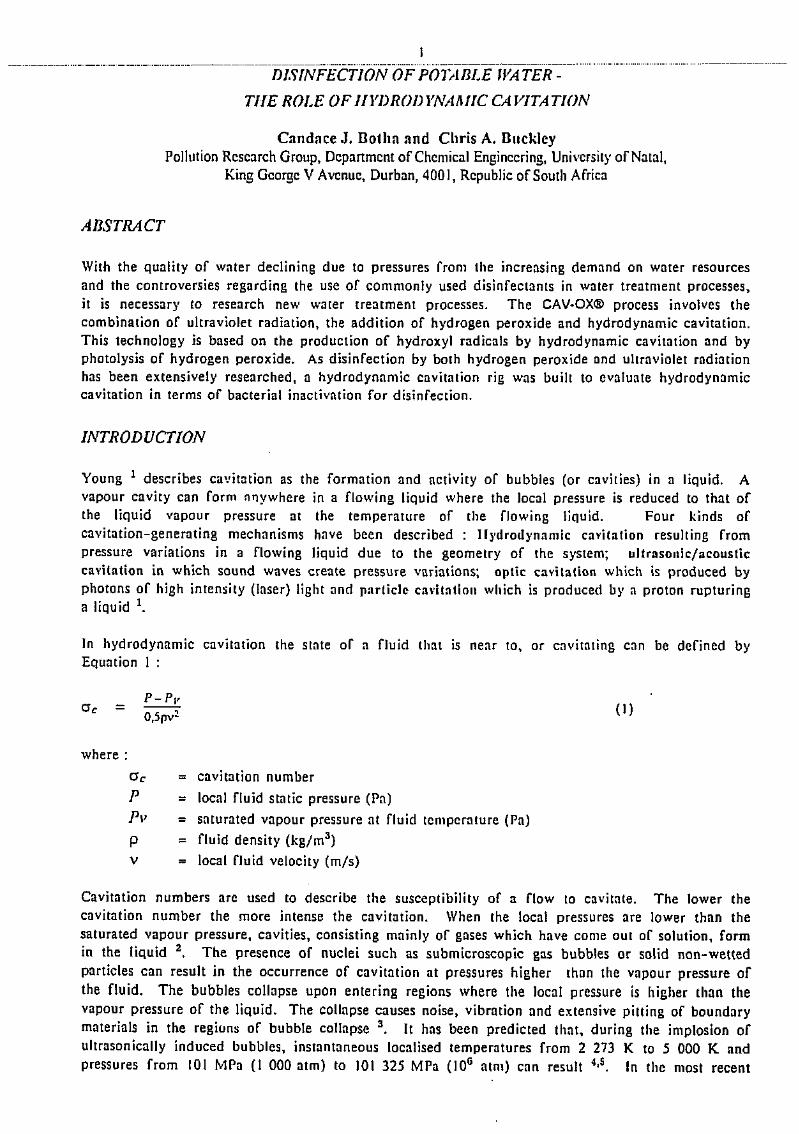
1_ _ _ _ _ _ _ _ _ _ _ _ _
THE ROLE OFIIYDRODYNAMIC CA VITA TION
Candnce J. Botha and Chris A. BuckleyPollution Research Group, Department of Chemical Engineering, University of Natal,
King George V Avenue, Durban, 4001, Republic of South Africa
ABSTRACT
With the quality of water declining due to pressures from the increasing demand on water resourcesand the controversies regarding the use of commonly used disinfectants in water treatment processes,it is necessary to research new water treatment processes. The CAV-OX® process involves thecombination of ultraviolet radiation, the addition of hydrogen peroxide and hydrodynamic cavitation.This technology is based on the production of hydroxyl radicals by hydrodynamic cavitation and byphotolysis of hydrogen peroxide. As disinfection by both hydrogen peroxide and ultraviolet radiationhas been extensively researched, a hydrodynamic cavitation rig was built to evaluate hydrodynamiccavitation in terms of bacterial inactivation for disinfection.
INTRODUCTION
Young : describes cavitation as the formation and activity of bubbles (or cavities) in a liquid. Avapour cavity can form tinywhere in a flowing liquid where the local pressure is reduced to that ofthe liquid vapour pressure at the temperature of the flowing liquid. Four kinds ofcavitation-generating mechanisms have been described : Hydrodynamic cavitation resulting frompressure variations in a flowing liquid due to the geometry of the system; ultrasonic/acousticcavitation in which sound waves create pressure variations; optic cavitation which is produced byphotons of high intensity (laser) light and particle cavitatioii which is produced by n proton rupturinga liquid x.
In hydrodynamic cavitation the state of a fluid that is near to, or cavitating can be defined byEquation 1 :
P-Py
where :
Oc = cavitation number
P = local fluid static pressure (Pa)
Pv = saturated vapour pressure at fluid temperature (Pa)
p = fluid density (kg/m3)
v = local fluid velocity (m/s)
Cavitation numbers are used to describe the susceptibility of a flow to cavitate. The lower thecavitation number the more intense the cavitation. When the local pressures are lower than thesaturated vapour pressure, cavities, consisting mainly of gases which have come out of solution, formin the liquid z. The presence of nuclei such as submicroscopic gas bubbles or solid non-wettedparticles can result in the occurrence of cavitation at pressures higher than the vapour pressure ofthe fluid. The bubbles collapse upon entering regions where the local pressure is higher than thevapour pressure of the liquid. The collapse causes noise, vibration and extensive pitting of boundarymaterials in the regions of bubble collapse 3. It has been predicted that, during the implosion ofultrasonically induced bubbles, instantaneous localised temperatures from 2 273 K to 5 000 K. andpressures from 101 MPa (I 000 atm) to 101 325 MPa (10B atm) can result 4fi. In the most recent

work predictions of temperatures above 50 273 K have been made 6. The intense temperatures andpressures exhibited by bubble collapse are proposed to result in the thermal dissociation of water intoshort-lived, highly reactive hydrogen and hydroxyl radicals 7. Peterson and Zaleiko 4 maintain thathydrodynamic cavitation alone is effective in producing these radicals from water. Ultrasoniccavitation, which produces noise, chemical reactions and luminescence, has been widely researched.Webster 8 notes that ultrasonic cavitation accelerates chemical reactions e.g. the hydrolysis of estersand initiates reactions e.g. the decomposition of water :
H2O - > / / * + 'OH
The products of the above reaction are then responsible for secondary reactions involving dissolvedsubstances. The predominant secondary reactions are :
'OH + 'OH -> H2OjH* + H9 -> H2
Hydrogen peroxide has been detected in a sonicated solution of potassium iodide 9.
Light emission has been observed during ultrasonic and hydrodynamic cavitation. This phenomenonis believed to occur during bubble collapse. Jarman and Taylor 10 found that the intensity ofluminescence from hydrodynamic cavitation was two orders of magnitude less than that recorded inultrasonic cavitation.
Ultrasound is used extensively in biology to destroy or rupture cells, to homogenise solutions and toclean instruments. Possible mechanisms for cell disruption are shear stresses resulting from turbulentflow and high velocity gradients 5 | U , and cavitation forces involving mechanical stresses combinedwith free radical reactions n . The local effects of cavity collapse producing cavitation forces includelocal heating, electrical discharges, sonoluminescence and free radical formation 5 . Apart from thesephysical factors, cell size 12, cell shape n , stage of cell development u , species of cell 13 and bondstrengths between bacterium and media 13 are considerations which have been proposed to affect theefficiency of disruption and inactivation of microorganisms. Ultrasound has also been used to disruptcells for the extraction of intracellular constituents, for the dispersion of bacterial aggregates H andto inactivate bacteria in water and effluent 15.
The application of hydrodynamic cavitation for bacterial inactivation and disruption has not beenstudied extensively. Peterson and Zaleiko 4 claim that hydrodynamic cavitation generated in a nozzleruptures the cell wall, releasing the internal material that may be subsequently oxidised by freeradicals. Hydrodynamic cavitation has been used by Harrison iG and Harrison and Pandit 17'1B todisrupt yeast and bacterial cells in order to obtain intracellular material. The extent of disruption wasmonitored by soluble protein release. Hydrodynamic cavitation is known to produce forces such aspressure fluctuations, shock waves, stresses and extreme temperatures. Based on this, the potential forcell destruction akin to that achieved by ultrasonic cavitation exists.
Peterson and Zaleiko 4 devised a treatment process which combines hydrogen peroxide, hydrodynamiccavitation and ultraviolet radiation. The basis of the technology is the production of hydroxylradicals by hydrodynamic cavitation of water and by the photolysis of hydrogen peroxide. Littleexperimentation has been undertaken to determine the effect of the cavitation nozzle alone, withoutthe effects of hydrogen peroxide and ultraviolet radiation except on sucrose, phenol, activated sludgeand raw sewage. The effect was monitored in terms of reduction in chemical oxygen demand 4.
The CAV-OX® process (Magnum Water Technology, USA) employs ultraviolet radiation, hydrogenperoxide and hydrodynamic cavitation to photolyse and oxidise organic compounds present tn water atmg/£ concentrations to nondetectable levels 19.

The system is being investigated for the treatment of volatile organic compounds primarilytrichloroethene, benzene, toluene, ethylbenzene and xylenes 19. Hydrogen peroxide is added to thecontaminated groundwater which is then pumped through a cavitation nozzle, followed by ultravioletradiation (Figure 1). The removal efficiencies of contaminants are reported to range from 20 % to 99%. No analysis was undertaken using the nozzle alone. Hydrodynamic cavitation produced in a nozzleis used to generate hydroxyl radicals and hydrogen atoms which combine to form hydrogen peroxideand molecular hydrogen 19 .
Gmundwater
Low energy UVreactor
Hydrogen peroxidoaddition
Recycle
— C X I -
Cavilationchamber
Influent holding tank
To effluentstorage tank
High energy UVreactor
Figure 1 : CAV-OX®system 19 used in the oxidation of volatile organic contaminants
The University of Natal was approached to evaluate the CAV-OX® system for use in water treatment.As the bactericidal effects of hydrogen peroxide and ultraviolet radiation are. well known, it wasdecided to assess the efficiency of hydrodynamic cavitation alone. It was recognised that the potentialenergy in distribution pipes could be harnessed to generate cavitation with the installation of a nozzle.This would then allow water to be treated at source, perhaps several times along the distributionsystem and possibly at the tap, making potable water readily available.
The experimental programe involved the evaluation of :
• the bactericidal efficiency of hydrodynamic cavitation alone using heterotrophic plate count (HPC)analysis, and
• the analysis of hydrogen peroxide as an indication of free radical formation.
MA TERIALS AND METHODS
The Hydrodynamic Cavitation Rig
A hydrodynamic cavitation rig (Figure 2) was constructed in order to both intensify cavitation and tofacilitate a large range of operating conditions. The cavitation nozzle was installed 10 m above thefree liquid surface in the feed tank. This provided a reduced pressure at the outlet to the nozzle.

4
(pn pjeisufe Irar-sducor
\^J Inlet pressufe gauge
faj Throat pressure gauge
(V) OuDal pressure gauge
Cavttatisn nozzle
fl-XJ-
©-:
•tx-Vi
10 m
Figure 2 : Process instrumentation diagram of hyiirodynamic cavitation rig
Figure 3 shows the dimensions of the Perspex replica of the nozzle originally supplied with theCAV-OX® unit.
85,5- = 32 -
27 . 3S.J
V BSP
Figure 3 : Dimensions of cavitalion nozzle (mm)
Hydrogen Peroxide Analysis
The concentration of hydrogen peroxide produced in the hydrodynamic cavitalion rig was determinedby a method based on the reduction of copper (II) ions by hydrogen peroxide in the presence ofexcess of 2,9-dimethyl-l,IO~phenanthroline (DMP) to form the copper (J)-DMP complex 20 . Thismethod can detect hydrogen peroxide concentrations from 0,034 mg/£ to 4,08 mg/£. Theconcentration of copper (I)-DMP complex is determined directly by spectrophotometric measurementat 454 nm, and is related to the concentration of hydrogen peroxide. A volume of 80 t of reverseosmosis permeate was poured into the feed tank and cavitated at the highest intensity achieved by therig. Samples were withdrawn from the sample port at various intervals over an 18 h period. Thesample was added to a 10 ml volumetric flask containing DMP and copper sulphate solution and theabsorbance measured. The concentration of hydrogen peroxide was determined from the calibrationcurve. The blank consisted of reverse osmosis permeate containing no hydrogen peroxide.

Heierotroph'tc Plate Count Analysis
Raw water (80 I) was obtained from Wiggins Water Treatment Plant in Durban and poured into thefeed tank of the cavitation rig. An initial sample was taken from the feed tank in a sterile samplebottle. Cavitation was initiated at the selected operating conditions and samples were collected fromthe sample port over 2 h. The samples were then appropriately diluted 21, plated using nutrient agarand incubated at 37 °C for 48 h. As a control raw water was pumped through the system with thecavitation nozzle replaced by an open tube. Raw water from a river or dam was selected for use inHPC analysis as it contains a wide variety of naturally occurring species of bacteria. The HPC ofwater prior to and after cavitation enable the assessment of the efficiency of the cavitation rig. Thistest^does not provide an indication of the quality of the water but, rather it constitutes the initial testin the assessment of the efficiency of the process.
RESULTS
Hydrodynamic Cavitation
The feed tank was filled with water and all valves were open and the pumps engaged. The inletpressure was 487 kPa, the flow rate was 124 t/m'in and the outlet pressure was 15 kPa. Valve 2(Figure 2) was then incrementally closed and at various stages the inlet, outlet, throat pressure andflow rate were recorded. Where the lines are horizontal, cavitation occurs at a constant flow rate.This procedure was followed for various inlet pressures which were set using valve 1 (Figure 2). Thedifference between the inlet and the outlet pressure was calculated and plotted against the measuredflow rate (Figure 4). As the pressure drop across the nozzle is reduced, the intensity of cavitation isdecreased until cavitation ceases to occur. This occurs when the flow rate is reduced by increasingthe back pressure (outlet pressure). These conditions cause the throat pressure to be raised above thevapour pressure of the liquid and bubble formation ceases.
- • — • — • — • • •487 kPa abs:
204 kPa abs
B
54 kPa abs A
too 200 300 400 500
R, -PM (kPaabs)
Figure 4 : Selected operating conditions showing inlet pressures of 54; 204; and487 kPa corresponding to pressure drops across (he nozzle of 22; 152; and472 kPa respectively
In Figure 4 it is evident that the lower the inlet pressure, the smaller the pressure drop across thenozzle and the lower the intensity of cavitation. Conditions A, B and C show increasing intensities ofcavitation. The cavitation numbers (Equation 1) were calculated for each of these conditions. Thecavitation number at condition A was 0,482, condition B was 0,258, and condition C was 0,025, Thelower the cavitation number the more intense the cavitation.

A Perspex box, filled with water, was fitted to the nozzle for photography of condition C and thecondition of no cavitation. Figure 5 (a) shows the condition of no cavitation where no bubbles areevident. As cavitation begins the bubbles appear at the throat of the nozzle and gradually extend tofill the entire divergent portion of the nozzle. Figure 5 (b) cavitation of the highest intensityachieved by the cavitation rig where bubbles appear as a white mass in the divergent portion of thenozzle.
Figure 5 : Photographs showing no cavitation (a), and intense hyclrotlyiiamic cavitation generatedin a nozzle (b)
Production of Hydrogen Peroxide
Hydrogen peroxide was not detected in hydrodynamtcally cavitated reverse osmosis permeate as therewas no significant difference between the absorbance measurement of the blank and the cavitatedwater. It was concluded that any hydrogen peroxide produced was below the detection limit of0,034 mg/£ using the method by Daga et al. 20 and was assumed to be negligible.
As a comparison, the hydrogen peroxide produced by an 8 £ KERRY Pulsatron (38 kHz) ultrasoniccleaning bath was monitored using the method by Baga et al.2D. Based on the calibration curve it wasfound that sonication (I h) of reverse osmosis permeate produced approximately 0,1 mgft of hydrogenperoxide.

Cavitation of Raw Water Bacteria
Figures 6 (a), (b), and (c) show the results of hydrodynamic cavitation (at three intensities) whileFigure 6 (d) shows the results of a 12 h period of cavitation.
10D00
3 000
3 /• 1 OOQ
u
300
100
Experiment Control
20 40 60 BO 100 12D 140
Time (min)
10 000
3 00Q
E5 1 00.0
300
100 t
Experiment Control
_. • — •
20 40 6D 80 100 120 140
Time (mln)
Figure 6 (a) : Raw water exposed to low intensity Figure 6 (b) : Raw water exposed lo mediumcavitation intensity cavitntion
10 000
3 000
3 1 OOQ ' •Li.
o
300
100
f • _p^-
1 1
Experiment Control
10 000 — •
3 000
20 40 60 B0 100 120 140
Time (mln)
E3 i ooou
300
100
Sample 1 Sample 2
-.1 .. .
.1 6 B
Time (h)10
.. i _
12
Figure 6 (c) : Raw water exposed (o highintensity cavitation
Figure 6 (d) : Raw water exposed to 12 h of thehigh intensity cavitation
Figures 6 (a), (b), and (c) show that there is no significant reduction in the concentration of colonyforming units over the 2 h period for cavitation conditions A, B or C. Figure 6 (d) shows that noreduction in CFU/m£ occurred after 12 h of hydrodynamic cavitation. The data from the cavitatedsamples in the above figures show general trends either indicating a slight increase in CFU/m/ overtime or a maintenance in CFU/m£. The increases do not constitute an order of magnitude differenceand therefore are not considered significant. Any increase in count could be due to the dispersion ofaggregates of bacteria as shown in studies of turbidity and scanning electron microscopy 22.Hydrodynamic cavitation in isolation is therefore not effective in the inactivation of heterotrophicbacteria.
As a comparison the effect of ultrasound on raw water bacteria was undertaken by sonication of25 m£ of raw water and HPC analysis at various intervals. Treatment with ultrasound resulted in adecrease in CFU/m£ whereas the non-sonicated control indicated no reduction in CFU/m£ (Figure 7).Based on the experiments it can be concluded that ultrasound at an intensity of 18,3 mW/cm2

(183 W/m2 ) and a frequency of 38 kHz has a bactericidal efficiency of on average 96,2 % forheterotrophic plate count bacteria in raw water.
0 20 40 60 60 100 120 1 «
Time {min}
Figure 7 : Inactivation of raw water bacteria by ultrasound
DISCUSSION
The objective of this project was to evaluate the potential of hydrodynamic cavitation for watertreatment with the inactivation of raw water bacteria as the primary aim. Ultrasound was used as acomparison. Several points emerged from the experiments undertaken.
Raw Water and Heterotrophic Plate Count Analysis
The choice of raw water for experimentation as opposed to the conventional procedure of theinoculation using a selected indicator microorganism e.g. Esclwrichia coli proved successful. Variousauthors I3 '23 note the greater resistance in susceptibility of naturally occurring bacteria to disinfectionthan laboratory cultured species. Dactcria which occur in rivers and streams often exist in a resistant,stationary state, as spores or protected by association with debris. Consequently, these bacteriarequire a greater dose of disinfectant than laboratory cultured bacteria. In addition, the use ofmodel indicator species to determine the water quality after a disinfection process can lead to theconclusion that the process produces water safe for human consumption. However, the pathogens thatoccur in contaminated and polluted water are often resistant to the disinfection doses applied toeliminate indicator species. Watkins 24 notes that often a false sense of security is obtained whenindicator species are used for the assessment of the efficiency of a disinfection process. For thesereasons it is advantageous to initially determine the efficiency of a process using a general populationof bacteria thus the HPC was selected to determine the efficiency of bacterial inactivation byhydrodynamic cavitation. In this application, the changes in bacterial counts are more importantthan the absolute numbers of bacteria. The application of HPC using raw water is favourable as it isa simple and inexpensive form of pilot-plant evaluation which can save time and materials should thepilot-plant prove unsuccessful.
Hydro dynamic Cavitation
Cavitation numbers are used to describe the susceptibility of a flow to cavitate. The lower thecavitation number the greater the intensity of cavitation. The cavitation numbers produced by thecavitation rig ranged from 0,5 to 0,03. Harrison and Pandit 17 report cavitation numbers rangingfrom 2,79 to 0,99 (using Equation I), and note that cavitation occurrs at numbers less than 1,0 to 2,5.Based on cavitation numbers the hydrodynamic cavitation produced in this cavitation rig issubstantial.

Hydrogen Peroxide Production
A concentration of 0,! mg/£ of hydrogen peroxide was produced from the sonicaiion (1 h) of reverseosmosis permeate in the ultrasonic bath, supporting the theory that cavitation results in the formationof hydroxy! radicals which subsequently combine to produce hydrogen peroxide. In contrast, nohydrogen peroxide was detected during hydrodynamic cavitation of reverse osmosis permeate.
Inactivation of Raw Water Bacteria
t-
Heterotrophic plate counts were used to monitor changes in the concentration of viable colonyforming units in cavitated and non-cavitated raw water. At least an order of magnitude decrease isrequired before the inactivation method is considered to be effective. Exposure of raw water bacteriato ultrasound resulted in a 2 decade reduction in CFU/m£.
The hydrodynamic cavitation produced in this cavitation rig is substantial and it can be concludedthat cavitation alone does not inactivate bacteria in raw water and therefore does not have potential tobe used as a single process in water treatment.
Comparison of Ultrasonic and Hydrodynamic Cavitation
Cavitation is the common phenomenon exhibited by both the ultrasonic bath and the hydrodynamiccavitation rig. The results of the two forms of cavitation; i.e. hydrogen peroxide production andefficiency of bacterial inactivation, differed. Apparent differences between the processes include :
a) Scale : Smaller volumes (40 ml) were exposed to ultrasound than to hydrodynamic cavitation (80 £).Direct comparison of the results of the two forms of cavitation is therefore not possible.
b) Residence time : The ultrasonic bath provides continuous treatment of small volumes of waterwhereas the cavitation rig limits the effective treatment period to the time (milliseconds) in whichthe water passes through the cavitation nozzle. This factor is one of the majordifferences betweenthe two cavitation processes.
c) Initiation of cavitation : Ultrasonic cavitation is initiated by alternating compression andrarefaction of the liquid in response to ultrasonic waves. Hydrodynamic cavitation is initiated bythe pressure drop across the nozzle.
d) Bubble size : Bubble sizes (radii) resulting from ultrasonic cavitation at intensities of 1 MHz and50 kHz have been reported to be 4um and 8Qu.m respectively 2S. The bubbles generated duringhydrodynamic cavitation are visible and can be described as a cloud of vaporous cavities whereasno bubbles or clouds of bubbles were observed during ultrasonic cavitation.
e) Hydrogen peroxide : A concentration of 0,1 mg/£ of hydrogen peroxide was detected fromsonication of reverse osmosis permeate indicating the formation of hydroxyl radicals andsubsequent reaction to form hydrogen peroxide. Hydrogen peroxide was not detected by using theCu (II) - DMP method during hydrodynamic cavitation of reverse osmosis permeate. It can beconcluded from this that the concentration of hydrogen peroxide generated during bubble collapsewas less than the lower detection limit of the analysis (0,034 mg/£). As a result of the scale andthe residence time, a relatively small volume of permeate is exposed to hydrodynamic cavitationfor milliseconds and any hydrogen peroxide which formed in the nozzle would have been dilutedin the reverse osmosis permeate (80 I). An unreasonable number of passes through the systemwould be required, during which time any hydrogen peroxide would either decompose or react.
f) Bacterial inactivation : Ultrasonic cavitation inactivated bacteria whereas hydrodynamic cavitationwas unsuccessful in inactivating bacteria. The ultrasound and hydrodynamic results are notdirectly comparable because of differences in residence time, equipment scale and possibly theform of cavitation.
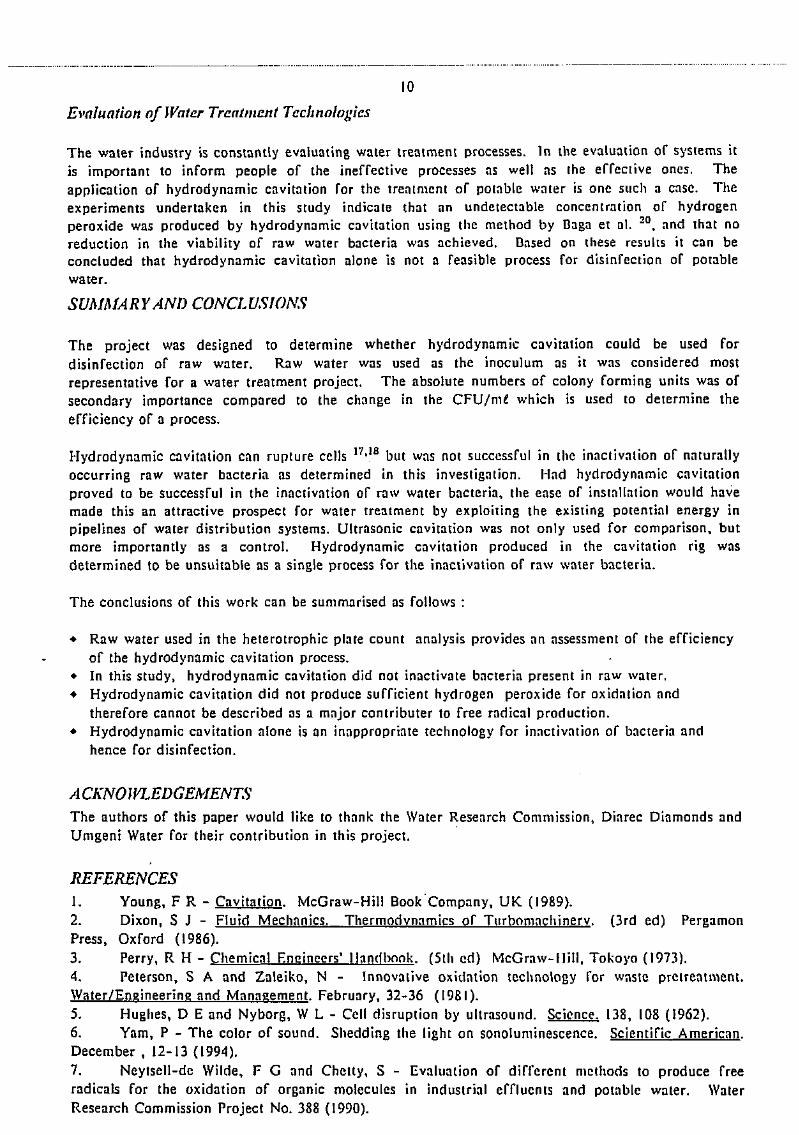
10
Evaluation of Water Treatment Technologies
The water industry is constantly evaluating water treatment processes. In the evaluation of systems itis important to inform people of the ineffective processes as well as the effective ones. Theapplication of hydrodynamic cavitation for the treatment of potable water is one such a case. Theexperiments undertaken in this study indicate that an undetectable concentration of hydrogenperoxide was produced by hydrodynamic cavitation using the method by Daga et al. 20, and that noreduction in the viability of raw water bacteria was achieved. Based on these results it can beconcluded that hydrodynamic cavitation alone is not a feasible process for disinfection of potablewater.
SUMMARY AND CONCLUSIONS
The project was designed to determine whether hydrodynamic cavitation could be used fordisinfection of raw water. Raw water was used as the inoculum as it was considered mostrepresentative for a water treatment project. The absolute numbers of colony forming units was ofsecondary importance compared to the change in the CFU/m£ which is used to determine theefficiency of a process.
Hydrodynamic cavitation can rupture cells 17<IB but was not successful in the inactivation of naturallyoccurring raw water bacteria as determined in this investigation. Had hydrodynamic cavitationproved to be successful in the inactivation of raw water bacteria, the ease of installation would havemade this an attractive prospect for water treatment by exploiting the existing potential energy inpipelines of water distribution systems. Ultrasonic cavitation was not only used for comparison, butmore importantly as a control. Hydrodynamic cavitation produced in the cavitation rig wasdetermined to be unsuitable as a single process for the inactivation of raw water bacteria.
The conclusions of this work can be summarised as follows :
• Raw water used in the heterotrophic plate count analysis provides an assessment of the efficiencyof the hydrodynamic cavitation process.
• In this study, hydrodynamic cavitation did not inactivate bacteria present in raw water.• Hydrodynamic cavitation did not produce sufficient hydrogen peroxide for oxidation and
therefore cannot be described as a major contributer to free radical production.• Hydrodynamic cavitation alone is an inappropriate technology for inactivation of bacteria and
hence for disinfection.
A CKNOIVLEDGEMENTSThe authors of this paper would like to thank the Water Research Commission, Dinrec Diamonds andUmgeni Water for their contribution in this project.
REFERENCES1. Young. F R - Cavitation. McGraw-Hill Book Company, UK (1989).2. Dixon, S J - Fluid Mechanics. Thermodynamics of Ttirbomnchinerv. (3rd ed) PergamonPress, Oxford (1986).3. Perry, R H - Chemical Engineers' Handbook. (5th ed) McGraw-Hill, Tokoyo (1973).4. Peterson, S A and Zaleiko, N - Innovative oxidation technology for waste presentment.Water/Engineering and Management. February, 32-36 (1981).5. Hughes, D E and Nyborg, W L - Cell disruption by ultrasound. Science. 138, 108 (1962).6. Yam, P - The color of sound. Shedding the light on sonoluminescence. Scientific American.December , 12-13 (1994).7. Neytsell-de Wilde, F G and Chetty, S - Evaluation of different methods to produce freeradicals for the oxidation of organic molecules in industrial effluents and potable water. WaterResearch Commission Project No. 388 (1990).

11
8. Webster, E - Cavitation. Ultrasonics, Jan-March, 39-48 (1963).9. Weissler, A, H W Cooper and S Snydcr - Chemical effect of ultrasonic waves on oxidation ofpotassium iodide solution by carbon tetrachloride. J. Am. Chem. Snc. 72, 169 (1950).10. Jarmen, P D and Taylor, K J - Light flashes and shocks from a cav'uating flow. Brit. J. Appl.Phvs. 16, 675-682 (1965).11. Thacker, J - An approach to the mechanism of killing of cells in suspension by ultrasound.Biochimtca et Biophvsica Acta. 304, 240-248 (1973).12. Nesaratnam, S T, D A J Wase and N Blakebrough - The susceptibility to ultrasonicdisintegration of Klebsiella pneumoniae NCTC 418. Eur. J. Appl. Microbiol. Biotechnol. 15, 56-58(19S2).13. Turai, L L, C M Parkinson, S G Horner, and M J Mitchell - Effect of ultrasound on thebiological activity of bacteria used in wastewater treatment. Tappi. 63 (7), 81-85 (1980).14. Shropshire, R F - Bacterial dispersion by sonic energy. J. of Bacteriology. 54, 325-331(1947).15. Scherba, G, R M Weige! and W D O'Brien - Quantitative assessment of the germicidal efficacyof ultrasonic energy. Appl. Envir. Microbiol. 57 (7), 2079-2084 (1991).16. Harrison, S T L - Bacterial cell disruption: a key unit operation in the recovery ofintracellular products, niotech. Adv. 9, 217-240 (1991).17. Harrison, S T L and Pandit, A B (a) - The role of hydrodynamic cavitation in microbial celldisruption. Submitted to Enzyme Microb. Technol. (1992).18. Harrison, S T L and Pandit, A B (b) - The disruption of microbial cells by hydrodynamiccavitation. Presented at the 9th International Symposium, Washington DC, August (1992).19. United States Environmental Protection Agency - Superfund Innovative Technolgy TechnologyEvaluation Demonstration Bulletin. CAV-OX® Ultraviolet Oxidation Process - Magnum WaterTechnology. August 1993.20. Baga, A N, G R A Johnson, N B Nazhat and R A Saadalla-Nazhat - A simplespectrophotometric d^:crrnination of hydrogen peroxide at low concentrations in aqueous solution.Analvtica Chimicn Acta. 204, 349-353 (1988).21. American Public Health Association (16th ed). Standard Methods for the Examination ofWater and Wastewater. APHA, Washington (1985).22. Botha, C J - A Study of Hvdrodvnamic Cavilalion as a Method of Water Treatment. MScEngThesis. Department of Chemical Engineering, University'of Natal, Durban (1993).23. Wolfe, R L, M H Stewart, S Laing and M J McGuire - Disinfection of model indicatororganisms in a drinking water pilot plant using PEROXONE. Applied and EnvironmentalMicrobiology. 55 (9), 2230-2241 (1989).24. Watkins, J and Cameron, S A - Recently recognised concerns in drinking water microbiology.J. IWEM. 5, 624-630 (1991).25. Riesz, P, K Kondo and C Murali Krishna - Free radical formation by ultrasound in aqueoussolutions. A spin trapping study. Free Rad. Res. Comms. I (1-2), 27-35 (1990).