Embed Size (px)
Citation preview

EVALUATION OF DIGITAL PEN IN
DATA CAPTURING FOR LAND
ADMINISTRATION PURPOSES IN
RWANDA
DIDIER MILINDI RUGEMA
February, 2011
SUPERVISORS:
Ir. C.H.J. Lemmen
Drs. J.J. Verplanke

Thesis submitted to the Faculty of Geo-Information Science and Earth
Observation of the University of Twente in partial fulfilment of the
requirements for the degree of Master of Science in Geo-information Science
and Earth Observation.
Specialization: Land Administration
SUPERVISORS:
Ir. C.H.J. Lemmen
Drs. J.J. Verplanke
THESIS ASSESSMENT BOARD:
Prof. Dr. J.A. Zevenbergen (Chair)
Ir. M.A. Engels MBA (External Examiner, Vicrea)
Ir. C.H.J. Lemmen (First supervisor)
Drs. J.J. Verplanke (Second supervisor)
Ir. M.C. Bronsveld (Observer)
EVALUATION OF DIGITAL PEN IN
DATA CAPTURING FOR LAND
ADMINISTRATION PURPOSES IN
RWANDA
DIDIER MILINDI RUGEMA
Enschede, The Netherlands, February, 2011

DISCLAIMER
This document describes work undertaken as part of a programme of study at the Faculty of Geo-Information Science and
Earth Observation of the University of Twente. All views and opinions expressed therein remain the sole responsibility of the
author, and do not necessarily represent those of the Faculty.

i
ABSTRACT
The implementation of land administration is being taken in Rwanda. This includes spatial data
(boundaries of parcels) and related legal administrative data. There are approximately 8 million parcels.
Efficient data acquisition methods are needed. Existing land rights are determined in an adjudication
process supported by a participatory mapping (P-mapping) process. Digital orthophotos are available.
For spatial data acquisition in the field the orthophotos are first plotted, then the boundaries of parcels are
drawn and the parcels IDs written on field sheets with pencil on site. Post-processing has to be performed
in the office. This concerns redrawing and rewriting over the pencil marks by using normal pen on field
sheets, the scanning and geo-referencing of the field sheets, and the vectorisation of parcels boundaries.
This process implicates different sources of errors because of many process steps. It is double work in
terms of time. It requires a lot space for archiving. This implies a complex information management.
The focus of this research is on spatial data acquisition by using a digital pen. It compares the existing
method and the digital pen method by qualitative and quantitative methods on the basis of four criteria:
quality of data, time used, P-mapping, and process.
It is concluded that a digital pen can be used to draw lines on map as normal, but the plotted map has
patterns printed on it. This allows for storage of spatial data directly into georeferenced digital format into
the pen. This addresses the sources of errors which are in the existing method, saving of time, saving the
space for archiving, and keeping the promotion of P-mapping. The digital pen method would be more
practical by improving some related functionalities. Proposals are made for that.

ii
ACKNOWLEDGEMENTS
My gratitude is addressed to the following:
The Government of Rwanda, particularly the National Land Centre for the support during these studies.
The Netherland Fellowship Programme for providing the fellowship for these studies.
My supervisors in this research, Ir. Christiaan Lemmen and Drs. Jeroen Verplanke, for the guidance, the
comments/remarks, and the advices during the research until the completion.
My lecturers in different modules during these studies.
Land administration Course staff, and other staff of ITC who contributed in the progress of these studies.
The staff of Kadaster who contributed in the progress of this research.
The staff of Vicrea for the meetings we had in regard of this research.
The students who we worked together for different tasks during these studies.
My family for the all support in different aspects.
iii
TABLE OF CONTENTS
Abstract ....................................................................................................................................................................................... i Acknowledgements .................................................................................................................................................................. ii
List of figures ......................................................................................................................................................... v
List of tables ......................................................................................................................................................... vi
List of abbreviations ...........................................................................................................................................vii
1. Introduction ........................................................................................................................................................... 1
1.1. Background of the study ............................................................................................................................................1 1.2. Research problem ........................................................................................................................................................2 1.3. Research objectives .....................................................................................................................................................2
1.3.1. Specific objectives ..................................................................................................................................... 2
1.4. Research questions ......................................................................................................................................................3
1.4.1. Main question ............................................................................................................................................ 3
1.4.2. Sub-questions ............................................................................................................................................. 3
1.5. Research methodology ...............................................................................................................................................3 1.6. Thesis outline ...............................................................................................................................................................4
2. Land administration and participatory mapping .............................................................................................. 5
2.1. Land administration ....................................................................................................................................................5 2.2. Participatory mapping .................................................................................................................................................6
2.2.1. Participatory mapping techniques .......................................................................................................... 6
2.2.2. Participatory mapping in the context of land tenure........................................................................... 6
2.2.3. Ethics and participatory mapping .......................................................................................................... 7
2.3. Concluding remarks ....................................................................................................................................................7
3. Cadastral survey process and data acquisition techniques in Rwanda ......................................................... 9
3.1. Process of cadastre ......................................................................................................................................................9 3.2. Techniques of cadastral survey .................................................................................................................................9 3.3. Human resources in surveying ............................................................................................................................... 10 3.4. Technological bottlenecks in carrying out the survey ........................................................................................ 10 3.5. Participatory mapping in data acquisition for land tenure regularisation ....................................................... 10
3.5.1. Main activities of land tenure regularisation in Rwanda .................................................................. 10
3.5.2. Orthophoto based in applying participatory mapping ..................................................................... 12
3.5.3. Production of field sheets ..................................................................................................................... 13
3.5.4. Field work for parcels boundaries demarcation and registration ................................................... 13
3.5.5. Spatial analysis of cadastral information ............................................................................................ 15
3.5.6. Status of parcels boundaries demarcation and post-processing digitisation ................................ 16
3.6. Concluding remarks ................................................................................................................................................. 18
4. Data collection methods ................................................................................................................................... 19
4.1. Pre-field work ............................................................................................................................................................ 19 4.2. Field work .................................................................................................................................................................. 19 4.3. Further tests for para-surveyors in the use of the digital pen method ............................................................ 20 4.4. The selected sites for data collection .................................................................................................................... 20 4.5. Further tests for other approaches in the use of the digital pen method ....................................................... 21 4.6. Materials used in data collection ............................................................................................................................ 21
5. Comparison of the existing method with the digital pen method ............................................................. 23
5.1. The use of digital pen and digital paper in parcels boundaries demarcation ................................................. 23
5.1.1. Spatial unit based on polygon feature ................................................................................................. 23
5.1.2. Spatial unit based on line feature ......................................................................................................... 25

iv
5.1.3. Functionality of digital pen in parcels boundaries demarcation ...................................................... 25
5.1.4. Test in the office ..................................................................................................................................... 26
5.2. Tests of the digital pen method in participatory mapping ................................................................................ 26
5.2.1. Field test of the digital pen method in participatory mapping/first period .................................. 26
5.2.2. Time needed in the digital pen method compared to the existing method .................................. 27
5.2.3. Acceptability of the digital pen method .............................................................................................. 27
5.2.4. Skills required for the use of the digital pen method ........................................................................ 27
5.2.5. Visibility of the digital paper compared to the normal print ........................................................... 28
5.2.6. Tests for para-surveyors in the use of the digital pen method/second period............................. 28
5.3. Further usability testing ........................................................................................................................................... 29
5.3.1. Reliability in the use of the digital pen method ................................................................................. 29
5.3.2. Technical matters .................................................................................................................................... 30
5.4. Approaches for line feature based for spatial data capturing ........................................................................... 30
5.4.1. Line feature based/approach 1 ............................................................................................................. 30
5.4.2. Line feature based/approach 2 ............................................................................................................. 32
5.4.3. Comparison of line feature based approaches (approach 1 and 2) ................................................ 33
5.5. Point feature based approach for spatial data capturing .................................................................................. 34 5.6. Comparison of the digital pen method/line feature based and point feature based................................... 35 5.7. Comparison of the existing method and the digital pen method .................................................................... 36 5.8. Concluding remarks ................................................................................................................................................. 40
6. Discussion on the digital pen method for cadastral survey ......................................................................... 41
6.1. Parcels boundaries demarcation in participatory mapping ............................................................................... 41
6.1.1. Practicability in participatory mapping ................................................................................................ 41
6.1.2. Observation for participatory mapping............................................................................................... 43
6.2. Quality of spatial data (parcels boundaries) ......................................................................................................... 43
6.2.1. Sources of errors in the existing method ............................................................................................ 43
6.2.2. Data acquisition in the digital pen method ......................................................................................... 45
6.3. Time used for spatial data capturing ..................................................................................................................... 45 6.4. Process used to get vectorised data ....................................................................................................................... 46 6.5. Concluding remarks ................................................................................................................................................. 46
7. Conclusions and recommendations................................................................................................................. 47
7.1. Conclusions ............................................................................................................................................................... 47 7.2. Recommendations .................................................................................................................................................... 48
List of references ................................................................................................................................................ 49
Appendix 1. Plotting digital map, data collection and correction of mapping mistakes ......................... 51
Appendix 2. Tests for digital pen functionalities ........................................................................................... 53
Appendix 3. Outputs of further tests for para-surveyors ............................................................................ 58

v
LIST OF FIGURES
Figure 1. Main activities in LTR ............................................................................................................................... 11
Figure 2. Parcel sketches in former Itabire District .............................................................................................. 12
Figure 3. Procedures applied in parcels boundaries demarcation and registration in the field ...................... 14
Figure 4. Steps followed in data collection ............................................................................................................. 19
Figure 5. Location of the selected sites for data collection .................................................................................. 21
Figure 6. Polygon feature based/parcel boundaries drawn by lifting digital pen ............................................. 23
Figure 7. Polygon feature based/the ending point not close (left) and close (right) to the starting point ... 24
Figure 8. Polygon feature based/representations of boundaries between neighbouring parcels .................. 25
Figure 9. Comparison of visibility of map prints: normal print (left) and digital paper (right) ...................... 28
Figure 10. Parcels boundaries demarcation in the field/further test .................................................................. 29
Figure 11. Line feature based/approach 1 (mistakes based on gaps and overlaps between lines) ................ 31
Figure 12. Line feature based/approach 2 (polygons converted from overlapping lines) .............................. 32
Figure 13. Line feature based/approach 2 (Extra polygons/mistakes in overlapping lines).......................... 33
Figure 14. Point feature based approach (polygons digitised by snapping to the collected points) ............. 35
Figure 15. Comparison of the existing method (left) and the digital pen method (right) ............................... 38
Figure 16. Collected data (left) and uploaded data from digital pen (right)/the digital pen method ............ 39
Figure 17. Comparison of the outputs in the existing method ........................................................................... 40
Figure 18. Pencil based (left) and digital pen based (right) for orthophoto based land adjudication ........... 41
Figure 19. Highlighting on map disagreement on parcel boundary between neighbouring parcels ............. 42
Figure 20. Scanned georeferenced field sheet (left) and the same area of the original orthophoto (right) .. 44

vi
LIST OF TABLES
Table 1. Progress of field work and post-processing digitisation ........................................................................ 16
Table 2. Human resources evolution for digitisation ............................................................................................ 16
Table 3. Average of parcels digitised per day .......................................................................................................... 17
Table 4. Comparison of line feature based/approach 1 and 2 ............................................................................ 34
Table 5. Comparison of line feature based approach and point feature based approach ............................... 35
Table 6. Comparison of the existing method and the digital pen method......................................................... 37

vii
LIST OF ABBREVIATIONS
AC: Adjudication Committee
DEM: Digital Elevation Model
DTM: Digital Terrain Model DGPS: Differential GPS
EDM: Electronic Distance Meter
ESRI: Environmental Systems Research Institute
GCP: Ground Control Point GIS: Geographic Information System
GPS: Global Positioning System
ITRF: International Terrestrial Reference Frame
LIS: Land Information System
LSK: Local Spatial Knowledge
LTR: Land Tenure Regularisation
LUP: Land Use Plan
NLC: National Land Centre
OLL: Organic Land Law
P-mapping: Participatory mapping
PGIS: Participatory GIS


EVALUATION OF DIGITAL PEN IN DATA CAPTURING FOR LAND ADMINISTRATION PURPOSES IN RWANDA
1
1. INTRODUCTION
This research presents the use of digital pen in land adjudication1 process for land administration purposes
in Rwanda. The focus of this research is on spatial data acquisition and mapping cadastral information.
The use of the digital pen method is assessed by using the digital pen for orthophoto based boundaries
demarcation. In the existing method, data collected from the field are in analogue format, and post-
processing has to be performed in the office. This research assesses the use of the digital pen method
compared to the existing method.
1.1. Background of the study
Access to reliable information on the ownership, value, and use of land helps to further social and political
objectives. The most common form of a land information system is the cadastre through land registration
(McLaughlin, 1999).
Land registration in Rwanda is being undertaken under the systematic land registration, and this will
provide a nation wide parcels boundaries index map for each location. With the 2005 organic land law
(OLL) determining the use and management of land in Rwanda, all land must be formally registered
(Official Gazette of the Republic of Rwanda, 2005). There are approximately 8 million parcels
(MINIRENA, 2009). Compared to the colonial period, the situation has not changed much after
independence. As a matter of fact, 90% of the country’s arable land was still governed by customary law.
The written land law was still applied to a small number of persons and religious congregations. It was
applying more often in urban areas and business communities (Official Gazette of the Republic of
Rwanda, 2007).
At the moment, the process of land registration is taken under land tenure regularisation for all land in the
country using orthophoto based land adjudication. Land Tenure Regularisation (LTR) is a set of
administrative procedures undertaken for the purpose of recognising and securing existing rights that
people and organisations other than the State have to, in or over land, including individual land, State
private land, private district land, and City of Kigali land. It is designed to clarify the rights of the existing
owners and occupants of land and, where necessary and desirable, to convert those rights into a legally
recognised form that will allow people to legally transact their interests in land, and use their titles for
mortgaging and credit purposes (National Land Centre, 2009). The goal of this process is land tenure
security which leads to avoidance of land disputes, economic development, investments in different
aspects, etc. According to (Dale, 1993), land registration and cadastral systems are part of the
infrastructure that is needed to minimise the waste and to maximize the effectiveness of land development
programmes.
In a land administration system, various technologies are used for cadastral data acquisition. Spatial data
and related non spatial data (legal administrative attributes) are required as a basis for land registration and
for the establishment of a sustainable land administration system. Before the innovative system of
orthophoto based land adjudication, the techniques for spatial data acquisition were to use theodolite,
GPS and total station for fixed boundaries survey. This was done on a demand led basis (sporadic land
registration), in rural and mainly in urban areas. At the moment, the aim is to register systematically all
land (parcels). In this process, Quickbird satellite imagery (0.60m resolution) has been used for LTR trials
in 2007, and at the moment aerial photographs (0.25m resolution) are used for the on-going process at
national level. The government facilitates local people to do the work by themselves. Participatory
1 Land adjudication is the initial data collection for cadastre, it concerns the identification of existing rights.

EVALUATION OF DIGITAL PEN IN DATA CAPTURING FOR LAND ADMINISTRATION PURPOSES IN RWANDA
2
mapping (P-mapping) is adopted for field data collection using plotted orthophotos for parcels boundaries
demarcation, and register books for recording related legal administrative attributes. The analogue
collected data from the field are post-processed in the office for digitisation.
Politics and policy can happen only in communities. Public policy is about communities trying to achieve
something as communities (Stone, 2002). In land administration, a participatory approach is useful to get
information related to people’s lands; the starting point is local people.
1.2. Research problem
With the implementation of land administration in Rwanda, the aim is to have nation wide coverage as
soon as possible. Efficient data acquisition methods are needed. In the existing orthophoto based land
adjudication, the pencil is used on plotted maps for demarcating parcels boundaries and writing parcels
IDs for data collection in the field. After field work, the post-processing is to redraw and rewrite the
pencil marks on field sheets by using normal pen to make boundaries and parcels IDs more visible on the
field sheets. Then scanning field sheets, georeferencing them, and digitising (vectorising) parcels
boundaries is by redrawing them. This process implicates different sources of errors because of many
process steps. It is double work in terms of time, but also it implicates a lot space for archiving.
The existing method has as advantage to facilitate P-mapping; this doesn’t require a high educational level;
it requires anyone who is able to interpret the image, and is able to read and write. The tools are familiar
and easy to use, suitable for field conditions and facilitate collaboration in the field. Printed field sheets are
on large or small scale, they are lightweight, portable, reliable, and other advantages for field work.
Despite these advantages, there is a need to investigate data acquisition techniques to use in order to
prevent the sources of errors which are in the existing method and improve efficiency.
The digital pen captures what is drawn and written on digital paper2, and it stores the drawn and written
data to its internal memory and the operator can transfer the collected data to the computer by connecting
the pen via USB3 adapter.
1.3. Research objectives
The research assesses whether the use of digital pen can improve the efficiency for spatial data acquisition
for general boundaries survey in Rwanda.
1.3.1. Specific objectives
To compare the existing method of spatial cadastral data acquisition (general boundaries) and the digital
pen method by:
Assessing sources of errors in the existing method that can be addressed by the digital pen method
Identifying the time that the existing method takes compared to the time that the digital pen method
would take for spatial data capturing
Assessing the process used for each method, the existing method and the digital pen method, in terms
of the space for archiving
Identifying practical field operations in P-mapping when using the digital pen method compared to
the existing method.
2 Digital paper is patterned paper used in conjunction with a digital pen to create the records digital. The digital paper is an
ordinary paper. During the process the application software converts the paper to a digital paper by printing patterns of tiny black
dots, and these dots are printed in a carbon black ink that reflects infrared light, and so the camera in the pen records the dots.
Digital pen records the position (XY geographic coordinates) of the pen as it moves across the paper. The digital records stored
into the pen can be uploaded to a computer. 3 USB stands for Universal Serial Bus which is one of the most prevalent connection ports on today’s computers and peripheral
devices.

EVALUATION OF DIGITAL PEN IN DATA CAPTURING FOR LAND ADMINISTRATION PURPOSES IN RWANDA
3
1.4. Research questions
To meet the research objectives, the research responds to the following questions:
1.4.1. Main question
Compared to the existing method of spatial cadastral data acquisition (general boundaries survey), what
degree of efficiency is the digital pen method?
1.4.2. Sub-questions
Which sources of errors in the existing method can be addressed by the digital pen method?
What time does it take for data collection in the field and the office workload when using the digital
pen method compared to the existing method?
What the digital pen method can change in the process used in terms of the space for archiving
compared to the existing method?
What is the level of practicability of the digital pen method for field operations in P-mapping
compared to the existing method?
1.5. Research methodology
To meet the research objectives and to answer to the research questions, the methods were:
Literature review. This concerns land administration and participatory mapping and a brief
analysis focusing on the goals of this research. The review is presented in chapter 2.
Direct observation. This concerns an overview of the existing method for data collection during
the field adjudication using orthophotos in the field, and in the office workload for mapping the
collected data. This overview is needed for comparison of an alternative method for data
acquisition using digital pen. The overview of the existing method is presented in chapter 3.
Data collection. The organisation of the field work and other work done in this research for data
collection is presented in chapter 4.
Experiments in relation to the use of the digital pen are presented in chapter 5. This includes
assessments for efficient data collection when using the digital pen. Further the qualitative and
quantitative comparison of the existing pencil based data acquisition with the alternative digital
pen based data acquisition is presented here.
According to (Corne´ P. J. M. van Elzakker, 2008), “the combination of quantitative and qualitative research is a
common characteristic of the user centred design process, whereby qualitative research is implemented to test the first prototype
designs and more quantitative research to evaluate the final designs. To help understand this, we first of all require more
qualitative user research. But, on the other hand, we also want to have quantitative measures telling us, for instance, how long
it takes for a subject to execute a particular use task.”
For quantitative method, there was to assess how long the use of the digital pen method takes to
accomplish a certain task compared to the existing method. This was quantified in terms of number of
parcels demarcated in certain range of time until getting the final digital outputs, and number of people to
accomplish the task.
For qualitative method, after uploading data from digital pen to the computer, in ArcGIS, there was to
assess the quality of parcels boundaries visualised by assessing whether they are true to the original parcels
boundaries drawn on printed map (digital paper). This was assessed by overlaying uploaded data to the
original orthophoto and check if the visualised boundaries reflect the ones drawn on digital paper. The
quality of data in the existing method was assessed compared to the digital pen method. For quality
assessment of outputs, there was to assess the degree of keeping original collected data in each of both
methods in minimising sources of errors. There was also to assess the practicability of the process used for
each method in terms of archiving, and the level of practicability of each method in P-mapping.
The research compares the existing method and the digital pen method in order to assess whether the
digital pen method can improve the efficiency of spatial data acquisition. In the context of this research,

EVALUATION OF DIGITAL PEN IN DATA CAPTURING FOR LAND ADMINISTRATION PURPOSES IN RWANDA
4
the state or quality of being efficient is the competency in performance, ability to accomplish a task with a
minimum expenditure of time and effort, and with a good quality of outputs.
1.6. Thesis outline
Chapter 1. Introduction
This chapter consists of the background of the study, the research problem, the research objectives, the
research questions, the research methodology, and the thesis outline.
Chapter 2. Land administration and participatory mapping
This chapter analyses the key concepts, land administration and P-mapping, related to this research for
understanding how they are related each other. This analysis concerns commenting and linking existing
knowledge on P-mapping and land administration. This existing knowledge has been collected based on a
literature review.
Chapter 3. Cadastral survey process and data acquisition techniques in
Rwanda
This chapter describes in short the existing data acquisition techniques in Rwanda, and the focus on
orthophoto based land adjudication in P-mapping in general boundaries survey. This description is needed
to compare the existing method of data acquisition with the digital pen based method in chapter 5.
Chapter 4. Data collection methods
This chapter presents the pre-field work activities, it gives an overview of the field work, further tests for
para-surveyors in the use of the digital pen method, the selected sites for data collection, further tests for
other approaches in the use of the digital pen method, and materials used in data collection.
Chapter 5. Comparison of the existing method with the digital pen method
This chapter presents the results of different tests done for the use of digital pen in spatial data capturing,
and it compares the existing method used in Rwanda for general boundaries survey and the digital pen
method. The comparison is done by qualitative and quantitative methods.
Chapter 6. Discussion on the digital pen method for cadastral survey
This chapter discusses the results presented in chapter 5. The discussion is based on the four criteria used
in this research (P-mapping, quality, time, and process). The research questions are focus of attention in
this discussion.
Chapter 7. Conclusions and recommendations
This chapter presents the conclusions of this research. It also presents the recommendations related to
this work and suggestion for further research.

EVALUATION OF DIGITAL PEN IN DATA CAPTURING FOR LAND ADMINISTRATION PURPOSES IN RWANDA
5
2. LAND ADMINISTRATION AND PARTICIPATORY MAPPING
This chapter analyses the key concepts, land administration and P-mapping, related to this research for
understanding how they are related each other. This analysis concerns commenting and linking existing
knowledge on P-mapping and land administration. This existing knowledge has been collected based on a
literature review.
2.1. Land administration
Land information system is the basis of facilitating land administration. “A land information system is defined
as a GIS which utilizes land parcels as the link to the non-graphic database attribute”(Bishop, et al., 2000). According
to these authors, land information, in urban area, is buildings and the name of the owners of land parcels.
According to (Heo, Kim, & Kang, 2006) “Land Information System (LIS) is a subset of GIS with a focus on data
concerning land records”.
In the context of this research, land information is the information for all land parcels, in urban and rural
areas. According to (Lemmen & Oosterom, 2002) “A cadastral system covers both land registration (the
administrative/legal component) and the cadastral map (the spatial component). The combined process is called land
administration and a cadastral system is the environment in which this process takes place”. According to (UN/ECE,
1996) “Land administration is the processes of recording and disseminating information about the ownership, value and use
of land and its associated resources”. According to (M.-P. Törhönen, 2004) “land administration is one, if not the
main land policy instrument. Land policy is a governmental instrument that states the strategy and objectives for the social,
economic and environmental use of the land and natural resources of a country. It includes the regulations and measures of the
rights to land (land tenure), the use of land and the valuation of land”.
In land administration system there is relation between people and land, it is important to keep updating
information, for both spatial data and related legal administrative data. According to (Deininger, Ali,
Holden, & Zevenbergen, 2008) lack of updating could quickly undermine the reliability of the system,
especially in areas with higher transaction frequencies, thus undermining its overall reliability and
trustworthiness. According to (Heo, et al., 2006) spatial data changes in a parcel-based LIS mean changes
of parcel boundaries. Legal and administrative actions on parcels result in changes of the attributes in a
cadastre. According to (Williamson & Ting, 2001) “Cadastre is normally a parcel based and up-to-date land
information system containing a record of interests in land (e.g. rights, restrictions and responsibilities). It usually includes a
geometric description of land parcels linked to other records describing the nature of the interests, and ownership or control of
those interests, and often the value of the parcel and its improvements.” Land tenure system or a land register is
sustainable if it manages to administer land effectively and to reflect the actual relationships between
people and land (M.-P. Törhönen, 2004).
The way to get land information is through land registration, and one of the ways of registering land is the
involvement of local people in the process of land registration through P-mapping. This research studies
land registration with application of surveying general boundaries in P-mapping. According to (Bogaerts &
Zevenbergen, 2001), under general boundaries, the emphasis is on the visible features on the ground. In
general, these features are supposed to coincide with the approximate position of the boundaries. These
features can be mapped relatively easily; creating a cadastral index map, with a graphical representation of
the boundaries. However, these boundaries although clearly visible in the terrain (walls, hedges, ditches,
etc.) do not indicate the exact location of the legal boundaries, but they are very easy to measure with land
surveying or with aerial photogrammetry.

EVALUATION OF DIGITAL PEN IN DATA CAPTURING FOR LAND ADMINISTRATION PURPOSES IN RWANDA
6
2.2. Participatory mapping
In the context of this research, the use of the terminology of participatory geographic information system
(PGIS) for land administration activities is under participatory mapping (P-mapping). This means that in
P-mapping it doesn’t mean to take necessary a GIS to the field or in another way, it is the use of local
spatial knowledge for mapping spatial information, whatever techniques used.
2.2.1. Participatory mapping techniques
In participatory method people intimate knowledge of their own space in collectively interpreting aerial-
photographs and satellite images. The development of GIS helps to develop local knowledge processes
(e.g. constructing knowledge, discovering relationships in space, learning from each other, and building a
common view) (Gonzalez, 2002).
Participatory mapping based on orthophoto is a precise, cost-effective and participatory tool for land use
planning, resource assessment, impact monitoring, and conflict mediation. Participants in mapping
exercises typically show high level of participation and engagement, most likely due to the authentic nature
of the data. In addition, data input into a GIS program enables post-processing, permits enhanced
cadastral activities, better land use statistics and computer-based monitoring of land use changes (Müller,
Wode, & Wehr, 2003).
Participatory mapping can also be done in mobile GIS4. This is done for example by uploading
orthophotos into the mobile devices, such as PDA5, to take in the field for data collection. According to
(Verplanke, 2004) “local communities can learn without much difficulty to use mobile GIS to make inventories of their
natural resources.” But on the other hand, this author argues challenges in the use of mobile GIS for
ordinary community. According to this author, it is challenge in the use of mobile GIS to explain the basic
functions and features of a computer to people that are unfamiliar to the concept of computers. A lot of
button pressing is necessary to get to the starting point of the GPS exercise, which is difficult to achieve
for someone unfamiliar with the equipment.
2.2.2. Participatory mapping in the context of land tenure
The community involvement in land tenure regularization activities is seen as an instrument for
engendering social capital and a strategy for resource mobilization towards securing tenure (Magigi &
Majani, 2006). In South Africa, in the Mpumalanga Province, local people traced their views on paper
maps by using pencils and colored markers on how land reform would be done in their area(Weiner &
Harris, 1999). The value of participation in land registration is the information agreed upon by local
people. For this reason, the first phase is the public information. In Cambodia, registering land
systematically by using orthophotos printed maps, the participation of local people is to provide
information over their parcels, and the adjudication officer and the demarcation officer literally go
together to the parcel in question on the agreed date. During land adjudication, the existing rights in
parcels are ascertained, not altering the existing rights or creating new ones. In demarcation of parcels,
boundaries are delineated and agreed upon with the adjoining owners or other interest parties (Törhönen,
2001).
“PGIS is the relationship between the use of geo-information and governance to foster accountability, transparency, legitimacy
and other dimensions of governance, to facilitate systematically identifying and representing the spatial rights of people to their
land and land resources, in terms of ownership, access, use and management” (McCall, 2003). This author argues the
expectation of P-mapping to be implemented in a participative manner and make use of local information
within which local spatial knowledge (LSK) is a special category. Untrained people, with LSK, can work
effectively, easily and happily interpreting aerial photos.
4 Mobile GIS is the combination of GIS software, GPS, and mobile computing device. Mobile GIS fundamentally changes the
way information is collected. A mobile GIS allows to visualize information in a digital map. 5 PDA stands for a personal digital assistant. It is an electronic handheld information device.

EVALUATION OF DIGITAL PEN IN DATA CAPTURING FOR LAND ADMINISTRATION PURPOSES IN RWANDA
7
During land registration process local people should be involved in land adjudication and demarcation
process using understandable mapping tools in applying LSK. According to(Lemmen and Zevenbergen,
2010), in Ethiopia, in 2008, a team conducted a simple field test using Quickbird satellite imagery in the
programme of rural land certification. The results showed that high resolution imagery based in land
adjudication is useful in P-mapping. The data collection in the field was done with the help of land rights
holders and local officials. The image quality of the plots at a scale of 1:2000 was sufficiently high to allow
the parties to easily understand the images and contribute input, making the process very participatory.
2.2.3. Ethics and participatory mapping
The ethics in participatory mapping is necessary in the whole process of land registration. It would be in
preparation of field work, during the field activities, and after data collection. This motivates local people
to participate by using their LSK. Before starting land registration in a certain area, local people should be
well informed about which purpose and whose purpose. The facilitators/planners should make clear the
objectives of the activity and why the involvement of local people. “If carefully considered, the „Who?‟/‟whose?‟
questions may induce appropriate attitudes and behaviours in the broader context of good practice” (Rambaldi, Chambers,
McCall, & Fox, 2006). These authors describe guiding principles which should be taken into consideration
for PGIS, such as to be considerate in taking people’s time, to be careful in avoid causing tensions or
violence in a community, put local values, needs and concerns first, to make participation be informed
consent, not to raise expectations to the community, etc. According to (Wang, Yu, Cinderby, & Forrester,
2008), the design of PGIS process is mainly based on participants abilities and needs, for example, lower
education of villagers and high aspirations amongst local communities for expressing their perspectives in
planning process. PGIS attempts to mobilize the inherent intelligence of local people, involving them in
actions rather than providing training in how to drive a GIS.
During P-mapping the planner/facilitator should not rush the process. The community needs to learn
how to use the equipments and how to proceed the work. Regarding this, the planner should choose
spatial information technology appropriate to the activity but also which local people would understand
without difficulties.
The transparency is important in P-mapping to protect rights of all parties. According to (Weiner, Harris,
& Craig, 2002) “Community-based GIS projects simultaneously promote the empowerment and marginalization of socially
differentiated communities. As a result, the nature of the participatory process itself is critical for understanding who benefits
from access to GIS and why.” According to (Törhönen, 2001) “Special attention has to be paid to the weak groups.
Women are often potentially weaker than men, in terms of securing their land rights. Other vulnerable groups might be the
poor, disabled, illiterate, etc. In the worst case, an ignorant registration procedure could enable the powerful people to take
advantage of the weak and formalise land grabbing. Prevention comes in the form of publicity, leaving little space for
corruption and other violations”.
2.3. Concluding remarks
It has been shown from a literature review on a related analysis that P-mapping, land administration and
ethics are related to each other. In land registration process land owners show their parcels boundaries
agreed upon by their neighbours who are also present in the field to show their respective parcels
boundaries. P-mapping is useful in land registration to involve local people in this process for better land
administration. The ethics in P-mapping are also necessary to make the participation useful.
The next chapter presents data acquisition techniques existing in Rwanda, and the focus on orthophoto
based land adjudication in P-mapping.

EVALUATION OF DIGITAL PEN IN DATA CAPTURING FOR LAND ADMINISTRATION PURPOSES IN RWANDA
9
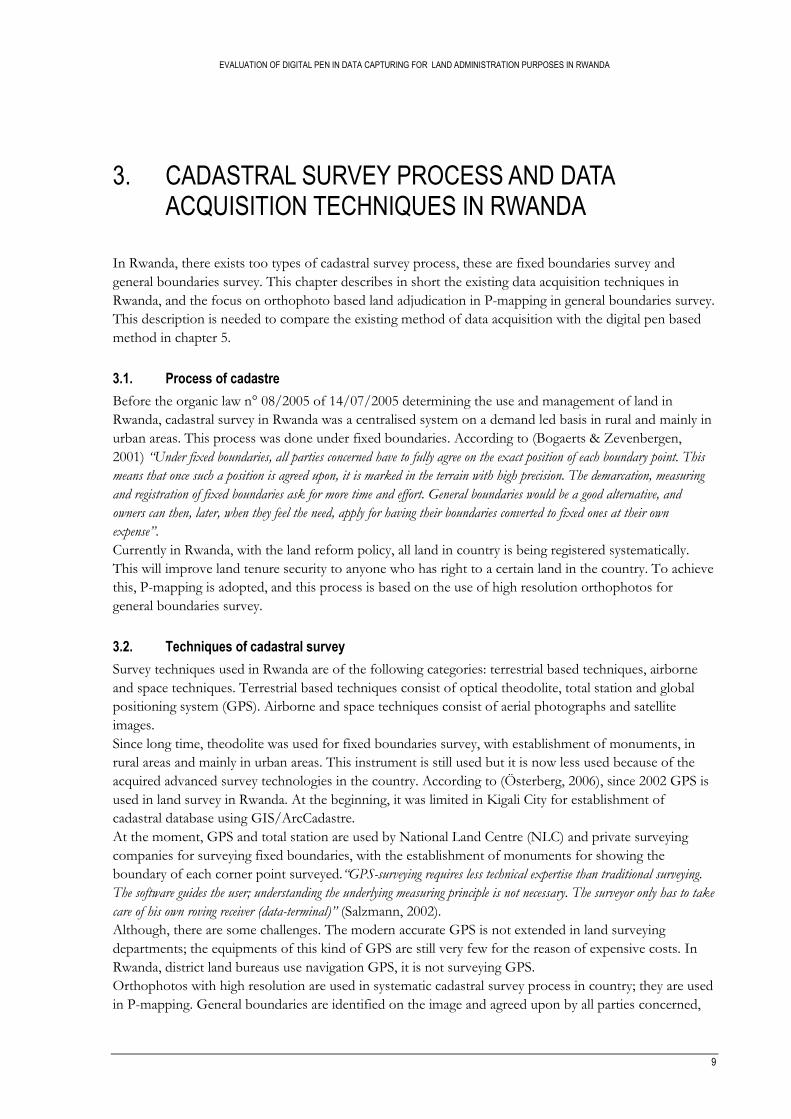
3. CADASTRAL SURVEY PROCESS AND DATA ACQUISITION TECHNIQUES IN RWANDA
In Rwanda, there exists too types of cadastral survey process, these are fixed boundaries survey and
general boundaries survey. This chapter describes in short the existing data acquisition techniques in
Rwanda, and the focus on orthophoto based land adjudication in P-mapping in general boundaries survey.
This description is needed to compare the existing method of data acquisition with the digital pen based
method in chapter 5.
3.1. Process of cadastre
Before the organic law n° 08/2005 of 14/07/2005 determining the use and management of land in
Rwanda, cadastral survey in Rwanda was a centralised system on a demand led basis in rural and mainly in
urban areas. This process was done under fixed boundaries. According to (Bogaerts & Zevenbergen,
2001) “Under fixed boundaries, all parties concerned have to fully agree on the exact position of each boundary point. This
means that once such a position is agreed upon, it is marked in the terrain with high precision. The demarcation, measuring
and registration of fixed boundaries ask for more time and effort. General boundaries would be a good alternative, and
owners can then, later, when they feel the need, apply for having their boundaries converted to fixed ones at their own
expense”.
Currently in Rwanda, with the land reform policy, all land in country is being registered systematically.
This will improve land tenure security to anyone who has right to a certain land in the country. To achieve
this, P-mapping is adopted, and this process is based on the use of high resolution orthophotos for
general boundaries survey.
3.2. Techniques of cadastral survey
Survey techniques used in Rwanda are of the following categories: terrestrial based techniques, airborne
and space techniques. Terrestrial based techniques consist of optical theodolite, total station and global
positioning system (GPS). Airborne and space techniques consist of aerial photographs and satellite
images.
Since long time, theodolite was used for fixed boundaries survey, with establishment of monuments, in
rural areas and mainly in urban areas. This instrument is still used but it is now less used because of the
acquired advanced survey technologies in the country. According to (Österberg, 2006), since 2002 GPS is
used in land survey in Rwanda. At the beginning, it was limited in Kigali City for establishment of
cadastral database using GIS/ArcCadastre.
At the moment, GPS and total station are used by National Land Centre (NLC) and private surveying
companies for surveying fixed boundaries, with the establishment of monuments for showing the
boundary of each corner point surveyed.“GPS-surveying requires less technical expertise than traditional surveying.
The software guides the user; understanding the underlying measuring principle is not necessary. The surveyor only has to take
care of his own roving receiver (data-terminal)” (Salzmann, 2002).
Although, there are some challenges. The modern accurate GPS is not extended in land surveying
departments; the equipments of this kind of GPS are still very few for the reason of expensive costs. In
Rwanda, district land bureaus use navigation GPS, it is not surveying GPS.
Orthophotos with high resolution are used in systematic cadastral survey process in country; they are used
in P-mapping. General boundaries are identified on the image and agreed upon by all parties concerned,

EVALUATION OF DIGITAL PEN IN DATA CAPTURING FOR LAND ADMINISTRATION PURPOSES IN RWANDA
10
then marked, no establishment of monuments. After field work, the parcels boundaries are digitised using
GIS software packages.
3.3. Human resources in surveying
Every district land bureau has a surveyor. The human resources working in land surveying in district land
bureaus have their background in domains which provide some training in surveying such as geography,
and civil engineering.
In parcels boundaries demarcation using orthophotos, the human resources required are local people in
their respective areas; they are trained as para-surveyors on how to use the orthophoto map. The training
is undertaken when doing the parcels boundaries demarcation work in the field, and after three to four
weeks they get familiar with the work, and they can work by themselves. After they finish covering their
area, they train also other para-surveyors in other areas as the systematic land registration is progressing,
thus they become also the trainers of others.
3.4. Technological bottlenecks in carrying out the survey
Among the bottlenecks in carrying out the survey, there is a lack of surveying law in the country
determining for example the accuracy tolerance, etc. The lack of this legal framework affects techniques of
data acquisition. Beside this, one of the bottlenecks in carrying out the survey is the lack of the appropriate
surveying equipments.
3.5. Participatory mapping in data acquisition for land tenure regularisation
LTR formalises land tenure by establishing how people came by their land, they make a claim, they show
what evidence/documents they have to support their claim, they define their parcels boundaries, and this
brings to legal first registration of their lands legal titles.
3.5.1. Main activities of land tenure regularisation in Rwanda
The main activities and actors in LTR from preparatory work to field work, and titling are:
Notification of LTR area
Local information campaign to sensitise local people to participate in land adjudication process
Land adjudication and demarcation of parcels boundaries
Objections and corrections
Disagreement resolution (in case of disagreement)
Final registration and titling
Regarding the period for objections and corrections, this is done after the digitisation of parcels
boundaries and data entry of related legal administrative data (attributes). After this, the digitised data
(boundaries of parcels and related attributes) are printed and taken back with the original field sheets to
the concerned administrative cell for the feedback of local people. The following figure presents the main
activities in LTR and actors.

EVALUATION OF DIGITAL PEN IN DATA CAPTURING FOR LAND ADMINISTRATION PURPOSES IN RWANDA
11
Figure 1. Main activities in LTR
According to (de Vries, 2004) one of the key common elements of progressive titling is gradual upgrade of
land rights formalisation, in order to improve the level of tenure security, and to provide additional means
of land management.
One district curried out systematic land registration in 2003. This was in former Itabire District, and the
main objective was to reduce land disputes (MINITERE, 2007).
act Main activ ities in LTR
NLC NLC and local authority Local people NLC, local authority and local people
Local information
campaign
Land adjudication and
demarcation of parcels
boundaries
Objections and
corrections
Disagreement resolution
Notification of LTR area
Final registration and
titling
Claims with no objectionClaims with objection

EVALUATION OF DIGITAL PEN IN DATA CAPTURING FOR LAND ADMINISTRATION PURPOSES IN RWANDA
12
Figure 2. Parcel sketches in former Itabire District
Source: MINITERE6, 2007
As shown in the figure 2, the land registration was done by using the traditional measurements, this was
done by tape measure.
3.5.2. Orthophoto based in applying participatory mapping
During LTR trials, in 2007, the high resolution (0.60m resolution) Quickbird satellite imagery which date
of 2006 was used. The image resolution describes the detail an image holds; resolution quantifies how
close lines can be to each other and still to be visibly resolved. Higher resolution means more image detail.
Quickbird satellite imagery used in LTR trials provided an easily understandable basis for the identification
and demarcation of land parcels as part of the LTR. Four districts were selected for LTR trials (Karongi,
Musanze, Gasabo and Kirehe districts). In each district, the LTR process was done in one cell
administrative boundary.
The Quickbird satellite imagery used in LTR trials was orthorectified. Orthorectification is the process of
geometrically adjusting a perspective image to an orthogonal image by transforming coordinates from the
image space to the ground space and removing tilt and relief displacement. A perspective image, camera or
sensor calibration information, ground control points7 and a digital elevation model8 are the main inputs
6 MINITERE is former Ministry of Lands, Environment, Forest, Water and Mines. Later it changed to MINIRENA (Ministry of
Natural Resources). At the moment the land sector and environmental sector are in MINELA (Ministry of Environment and
lands). 7 Ground control point (GCP) is a point on the surface of the earth of known location, fixed within an established co-ordinate
system, which is used to geo-reference image data sources, such as remotely sensed images or scanned maps. 8 Digital elevation model (DEM) is a digital representation of ground surface topography or terrain. It is also widely known as a
digital terrain model (DTM).
EVALUATION OF DIGITAL PEN IN DATA CAPTURING FOR LAND ADMINISTRATION PURPOSES IN RWANDA
13
for orthorectification processing. The absolute accuracy of orthoimages is largely dependent on the quality
and the distribution of the ground control points used to orient the image to the ground space. The role
of the DEM is to eliminate the effects of terrain relief displacement (Liu, Zhang, Peterson, & Chandra,
2007).
After LTR trials, land registration process is extended to other areas using high resolution orthophotos
produced from aerial photographs. Quickbird satellite imagery used in LTR trials and aerial photographs
used for now are both orthorectified, they can be used to measure distances because they are an accurate
representation of the Earth's surface.
The orthophotos produced from aerial photographs were produced for Project Rwanda National Land
Use and Development Master Plan; they date of 2008 and 2009. These orthophotos have 0.25m image
pixel resolution, and they are geo-referenced and projected in Rwanda geodetic system; the spatial
referenced system is ITRF 2005 (Swedesurvey, 2010). These orthophotos are now also used in land
registration process.
3.5.3. Production of field sheets
Different map scales are used for preparing field sheets, and this is related to the size of parcels and land
management in different areas. 1:500 scale is used in Kigali City, part of spontaneous areas where the plots
are dense and without any planning, and 1:1000 scale in other areas in Kigali City and other urban areas of
the country. 1:1500 scale is used in North, West and South parts of the country, and 1:2000 scale is used in
East part and in rural part of Kigali City. For every scale used in a certain area, there is an overlap between
2 consecutive field sheets, thus they have same features between their overlap, so this allows demarcating
a parcel which has boundaries on more than 1 field sheet. The field sheets are printed on A2 size. After
the preparatory work, parcels boundaries demarcation and land registration start.
3.5.4. Field work for parcels boundaries demarcation and registration
In one cell9, four teams process/do the work. Each team is composed by adjudication committee (two
members of cell land committee and three members of umudugudu10 committee) and two para-surveyors.
In field, the following materials are used:
For parcels boundaries demarcation, the materials are:
- Orthophoto maps/field sheets printed on A2 size.
- Clip board, pencil, rubber, pencil sharpener, ruler, form with official stamp, and tape measure. A tape
measure is used when it is difficult to find features on map like in forest; it helps by using the
measurements of tape measure on the ground, and then based on these measurements demarcation of
parcel boundaries on map is done by using the scale.
For land registration the materials are claim receipts and objection receipts, registers books, pens, tampon
and its liquid.
The following figure presents the procedures applied in parcels boundaries demarcation and registration in
the field:
9 A cell is administrative boundary which is land registration base unit. It is composed by more than 1 umudugudu.
10 Umudugudu is the last smallest administrative boundary.

EVALUATION OF DIGITAL PEN IN DATA CAPTURING FOR LAND ADMINISTRATION PURPOSES IN RWANDA
14
Figure 3. Procedures applied in parcels boundaries demarcation and registration in the field
As shown in the figure 3, the following steps are done in the field when doing LTR:
1. The adjudication committee, accompanied by a para-surveyor, requests the land owner to point out the
existing physical boundaries of his/her parcel in the presence of land owners of neighbouring parcels.
2. The para-surveyor identifies parcel boundaries on the orthophoto map and marks the boundaries
features shown on actual ground as they appear on the orthophoto.
3. On completion of the whole accepted perimeter of the parcel as it exists, the para-surveyor then issues a
unique consecutive number for that parcel.
4. The unique number is then marked on the orthophoto map. The para-surveyor marks the parcel ID
inside the parcel to the map, or besides by using the arrow if the parcel is too small. S(H)e writes also, on
the form which has the official stamp, the parcel ID, the land claimant names, parcels IDs of
neighbouring parcels, whether there is servitude on that parcel or whether not, the existing land use,
remark, names of para-surveyor and his/her signature, administrative location of that parcel (sector, cell,
and umudugudu), and date of parcel boundaries demarcation. The land holder takes this form to the
adjudication committee (AC), and the AC fills the detailed information in a register book.
The information filled in lands claims register book is the administrative location of the parcel (province,
district, sector, cell and umudugudu), identification of the parcel (date of registration, parcel number),
identification of provisional landowners (names of land claimants, their personal IDs), relationship of land
act Parcels boundaries demarcation and registration in the field
Adjudication committee Land owner Para-surveyor
Shows the boundaries of
his/her parcel in presence
of neighbours
Demarcates on map
parcel boundaries
Marks the parcel number
on map
Issues the parcel number
to the land owner
Giv es additional information
for registration
Records all required
infomation in register
Issues the prov isional
claim receipt
Asks the land owner to
show his/her parcel
boundaries
Gets the prov isional claim
receipt

EVALUATION OF DIGITAL PEN IN DATA CAPTURING FOR LAND ADMINISTRATION PURPOSES IN RWANDA
15
claimants, whether there is case of orphans or widow, names of persons representing orphans under 18
years old, their relationship with those orphans, personal IDs of those orphans’ representatives, names of
other persons who have interests/right on that parcel, their personal IDs, and the relationship they have
with landowners. The administrative location of landowner’s residence is also recorded in register. Other
information is land acquisition type, existing documents proving the ownership on that land, what land is
supposed to be used for, existing land use, whether servitude on that land, and whether disagreement on
the parcel. After the AC to fill the detailed information in the lands claims register, the AC gives land
claim receipt to the land claimant.
Regarding the disagreement on parcel, in that case the parcel is recorded both in lands claims register
book, and there is another register book filled with information on disagreement (lands disagreements
register). The information11 filled is almost similar to the one filled in lands claims register book, and with
additional information on disagreement. After the AC to fill the detailed information in the register of
lands disagreements, the person(s) who disagree the information provided on that parcel gets land
disagreement receipt.
There are 4 teams working in 1 cell, and in order to avoid that 1 parcel is demarcated and registered by
more than 1 team, thus to be demarcated and registered twice or more, the 4 teams are deployed in a way
that every team has a delimitation of the area to demarcate within a cell administrative boundaries, they are
divided referring to the common references such as roads, rivers, and other natural or physical features.
During parcels boundaries demarcation, for a parcel which has boundaries in more than 1 cell
administrative boundaries area, every piece of land is demarcated and registered in a cell that it is located.
But for a piece of land which is less than 5m of distance from cell boundary, this piece of land is
demarcated and registered in a cell that has the biggest part of that parcel. This case happens on parcels
which are in line of division between 2 neighbouring cells, and that line of division is neither natural nor
physical feature, for example neither river nor road such as in forests, farms, even in some marshlands.
Demarcation of land is completed at the same time as adjudication and recording of administrative
information. In case of disagreement of the information provided on parcel in the field, the AC resolves.
And if it is not resolved, the parcel is registered as the parcel with disagreement, and the disagreement is
taken to mediation committee (Abunzi) before final registration and titling.
The orthophoto based method for parcels boundaries demarcation is suitable for the progress of cadastral
surveying in the country, all parcels are demarcated and registered by local people, they understand
orthophoto map; this requires simple field work training.
3.5.5. Spatial analysis of cadastral information
After field work, the paper based data is taken to NLC office for digitisation (data entry of legal
administrative information and digitisation of parcels boundaries). After digitization of spatial data and
non-spatial data, these data are linked by using parcels IDs for spatial analysis, land ownership analysis,
land disagreement analysis and other analysis can be done spatially.
11 The information filled in the lands disagreements register is administrative location of that parcel (province, district, sector, cell
and umudugudu), identification of the parcel (date of registration, parcel number), identification of persons who disagree the
information provided on that parcel (their names, their personal IDs, their relationship, names of persons representing orphans
under 18 years old, their relationship with those orphans, personal IDs of those orphans’ representatives, names of other persons
who have interests/right on that parcel, their personal IDs, and relationship they have with persons who disagree the information
provided on that parcel, relationship that persons who disagree the information provided on that parcel have with land claimants).
The administrative location of residence of the person(s) who disagree the information provided on that parcel is also recorded.
Other information recorded is the type of disagreement, and existing documents proving the ownership on that land.

EVALUATION OF DIGITAL PEN IN DATA CAPTURING FOR LAND ADMINISTRATION PURPOSES IN RWANDA
16
3.5.6. Status of parcels boundaries demarcation and post-processing digitisation
The speed of parcels boundaries demarcation in the field and post-processing digitisation in the office
depends on the land management, land cover, shapes and sizes of parcels.
In residential areas like in urban areas and agglomerations in rural areas, the number of parcels boundaries
demarcated in the field is high because of buildings on small sized parcels. It’s easy to identify a building
plot on the image compared to a parcel in the forest. This is the same when doing post-processing
digitisation in the office.
In Eastern zone, parcels boundaries demarcation and post-processing digitisation is fast, parcels
boundaries are clear because of land management in this zone. The parcels have regular shape
(rectangular), they have been subdivided and allocated by the State, agricultural land is separated from
residential land. In this area, the demarcation of parcel boundaries takes time because parcels are big from
farms, and it takes time to cover the entire perimeter but the total area covered is big. This is the same for
post-processing digitisation in the office, it is relatively fast.
In West, North and South zones, parcels boundaries demarcation and post-processing digitisation is less
fast compared to the other mentioned areas. Parcels in these areas are in most cases inherited land, and/or
purchased lands, they are scattered with irregular shapes; but also agriculture land is mixed with residential
land.
Rwanda has 2148 administrative cells. As mentioned in introduction, systematic land registration started in
2007, and 4 cells for LTR trials were covered in this year (2007) and before extending the programme at
national level all parcels boundaries of these 4 cells were digitised. Since June 2009 LTR programme is
extended to national level, and at the end of august 2010, other 399 cells were adjudicated and demarcated.
Among these cells, 55 cells were digitised at the end of August 2010. The following table shows the
progress between end June 2009 to end August 2010.
Adjudicated and
demarcated parcels
(cells covered)
Adjudicated and
demarcated parcels
(cells in progress)
Digitised parcels (cells
covered)
Digitised parcels (cells
in progress)
399 164 55 17 Table 1. Progress of field work and post-processing digitisation
At the beginning of October 2010, LTR was taking place in different zones in country at the same time
(Kigali City: 15 cells, North Zone: 22 cells, West Zone: 22 cells, East Zone: 20 cells and South Zone: 12
cells).
As long as the number of adjudicated and demarcated parcels in the field increases, the number of staff to
post-digitise these parcels is also required to recover the gap between the work done in the field and the
workload in the office.
Period June to
September
2009
September to
November
2009
November
2009 to April
2010
May to July
2010
August to
September
2010
Number of
human
resources
1 2 2 7 17
Table 2. Human resources evolution for digitisation
At the end of August 2010, apart from 17 human resources who were working in post-processing
digitisation, the total number of human resources who were working in GIS Unit was 19; there is 1
working for mapping and printing field sheets and 1 coordinating activities and working on other tasks in

EVALUATION OF DIGITAL PEN IN DATA CAPTURING FOR LAND ADMINISTRATION PURPOSES IN RWANDA
17
relation with GIS for LTR, and other services in relation with national spatial information. In addition to
this staff, there are other more 30 staff who started since October 2010 for post-processing digitisation
work.
Post-processing digitisation of parcels boundaries is done by using ArcGIS software. The polygon feature
class is created in the geodatabase. After digitising 1 complete parcel boundary, the entire parcel perimeter
is a polygon, and the neighbouring parcels boundaries are digitised by using auto-complete polygon
option, and other editing options. Post-processing digitisation of parcels boundaries is done at 1:500 scale.
After polygonising parcel boundaries, the consecutive parcel ID is recorded in attribute table. As
mentioned, the speed of post-processing digitisation depends on different aspects in the area digitised.
Area (Location) Residential area
(urban area and
agglomeration): small
parcels
Agriculture land
mixed with residences
(parcels of medium
size)
Grazing land (parcels
of big size)
Average of number of
parcels digitised by 1
person per
day/9hours
250 180 60
Table 3. Average of parcels digitised per day
When digitising parcels boundaries and recording parcels IDs, errors are corrected. During post-
processing digitisation, overlaps12 and gaps13, happen when digitisation is not done properly and carefully.
These errors are checked automatically by using ArcGIS topology error inspector, and then errors are
corrected manually. For attributes, the errors happen during recording parcels IDs, and these errors
concern duplications of parcels numbers and missing parcels numbers. These errors are also checked
automatically and they are corrected manually by rechecking on field sheets used during post-processing
digitisation, and then recording them correctly.
For the case of errors which the source is from the field, are corrected by field work rechecking. When
doing post-processing digitisation in the office, GIS staff finds parcels IDs which are duplicated on field
sheets, parcels IDs not assigned to any parcel, demarcated parcels but without IDs, parcels with unclear
boundaries, issues between parcels bordering 2 neighbouring cells such as overlaps between parcels
boundaries, and parcels not demarcated. The correction of these errors is to go to the location in the field
and work with para-surveyors for field checking and correction.
In the pilot phase of LTR, the post-processing digitisation was done in Kenya/Nairobi from traced maps
sent from Rwanda. These traced maps were drawn manually by para-surveyors by looking at field sheets
they used in the field for parcels boundaries demarcation, and redraw the same parcels boundaries and
rewrite the parcels IDs on transparent paper or tracing paper overlaid on A0 imagery maps. These traced
maps were the ones sent to Nairobi, and then they were scanned and georeferenced for post-processing
vectorisation of parcels boundaries.
After the pilot phase, the post-processing of demarcated parcels boundaries is done in Rwanda, at NLC
office. For a while, post-processing digitisation was to vectorise parcels boundaries directly to the original
orthophotos, and this method was the one which was used since June 2009 until end October 2010. At
the beginning, the post-processing digitisation was done by referring to the pencil marks on field sheets as
collected from the field, thus the concentration to the field sheet, then to the computer screen, and so on.
But because of the way the pencil marks were not easily visible/readable for GIS operators during post-
12
Overlap is when 2 neighbouring parcels have double boundary between them, thus their interiors intersect, and the interior of
the one intersects with exterior of the other, both ways. 13
Gap is when 2 neighbouring parcels are disjoint, thus their interiors do not intersect, their boundaries do not intersect, and
interior of one doesn’t intersect with boundary of the other, both ways.

EVALUATION OF DIGITAL PEN IN DATA CAPTURING FOR LAND ADMINISTRATION PURPOSES IN RWANDA
18
processing digitisation, this approach changed, and in the post-processing, the first step was to redraw
parcels boundaries and rewrite parcels IDs over the pencil marks to make pencil marks more visible on
field sheets. This was done by the para-surveyors by using normal pen after land adjudication process of
the administrative cell they covered, and it was done in that cell before sending the field sheets at NLC
office. The vectorisation process was the same as the previous one, to look at parcels boundaries as they
appear on field sheets and to redraw the same parcels boundaries on the original image/orthophoto in
ArcGIS, thus the concentration to the field sheet, then to the computer screen, and so on, the same for
recording parcels IDs in the related attributes table.
Since November 2010, the post-processing work for para-surveyors is still to redraw parcels boundaries
and rewrite parcels IDs over the pencil marks to make pencil marks more visible on field sheets, and this
is done by using normal pen after land adjudication process of the administrative cell they covered, and it
is done in that cell before sending the field sheets at NLC office. The post-processing for GIS staff at
NLC office is to scan the field sheets, georeference those field sheets, and digitise (vectorise) parcels
boundaries by redrawing them following the ones which are on those scanned georeferenced field sheets,
and to record parcels IDs in the related attributes table. The field sheets are kept, and also the scans of
those field sheets.
3.6. Concluding remarks
The orthophoto based method by using the pencil for drawing parcels boundaries on the plotted map is
useful for general boundaries survey in Rwanda, and it promotes P-mapping. This method has advantages
of making the progress of land registration, and it provides also land information. On the other hand, this
method of analogue data from the field and many process steps for post-processing implicates the risks of
different sources of errors, it is time consuming, and it implicates a lot space for archiving. Digital pen is
the alternative method which can be assessed for orthophoto based land adjudication for spatial data
capturing. The overview of the existing method as presented in this chapter is the basis for comparison
between this existing method (pencil based P-mapping) and the alternative method (digital pen based P-
mapping). The next chapter presents the methods used in this research to compare the existing method
and the digital pen method.

EVALUATION OF DIGITAL PEN IN DATA CAPTURING FOR LAND ADMINISTRATION PURPOSES IN RWANDA
19
4. DATA COLLECTION METHODS
This chapter presents the pre-field work activities, it gives an overview of the field work, further tests for
para-surveyors in the use of the digital pen method, the selected sites for data collection, further tests for
other approaches in the use of the digital pen method, and materials used in data collection. The figure 4
presents the steps used in this research for data collection.
Figure 4. Steps followed in data collection
4.1. Pre-field work
Before field work, there was to do the tests to identify which approach to use for data collection, the
polygon feature based was compared to the line feature based. These tests were done by the researcher.
The results of these tests showed that line feature based is the one practical for parcels boundaries
demarcation, and this approach was the one adopted for data collection in the field. For production of
field sheets, the parcel boundary layer for legend was line feature class created in geodatabase.
4.2. Field work
During field work, there was to test the use of digital pen in P-mapping for land adjudication process. This
was to work together with local people in the field where LTR was taking place, and test the practicability
of digital pen for data capturing in P-mapping. There was direct observations on how this technique can
be used in P-mapping by looking at the time it can take to train local people on how to use it and get
familiar with it. But also during the exercise there was to ask the operators (local people) how they feel this
method easier or difficult for them compared to the existing method (their acceptability). According to
(Corne´ P. J. M. van Elzakker, 2008) observation in the field is the promising methodology to be used for
the evaluation of the first mobile geo-application prototype. The observer would have to stay very close to
the user during testing.
In P-mapping, a part from the users of digital pen (para-surveyors), there was also to see the attitude of
local people (land holders) towards digital pen, thus their reactions when the pen is introduced to the site.
In addition to this, there was also to assess the usability of the digital pen method in terms of reliability for
field work operations. This was to identify how long the battery can last in the field before recharging it.
Another test was to check what happens to data stored in digital pen when the battery is discharged, thus
to check whether digital pen can still keep data which were collected before the battery getting discharged.
There was also to assess reliability of the digital pen method for climate conditions. There was also to
assess any issue which can occur in the field for technical matters for this electronic tool (digital pen).
act Steps followed in data collection
Researcher Researcher, para-surveyors and NLC GIS staff Para-surveyors Researcher
Field work for direct observ ation in
P-mapping and office workload
Further tests for
para-surv eyors in the use of
the digital pen method
Further tests for other
approaches in the use of
the digital pen methodPre-field work

EVALUATION OF DIGITAL PEN IN DATA CAPTURING FOR LAND ADMINISTRATION PURPOSES IN RWANDA
20
In terms of time, there was to identify the speed in the use of the digital pen method compared to the
existing method, both in P-mapping in the field and the office workload. There was also to check the
outputs in terms of quality of data for the both methods. Beside this, there was also direct observations of
the process done in the existing method, both in the field and in the office.
4.3. Further tests for para-surveyors in the use of the digital pen method
Other tests were done in the field work location area (Rwanda) to assess whether local people who were
trained to collect spatial data by using the digital pen method during the field work in September 2010
could still remember how to operate in this method without anyone to show them again. These further
tests were done in December 2010 by sending the equipments to Rwanda. The parcels boundaries
reconstruction was done by the para-surveyors, and this was done at the NLC office. The task for these
para-surveyors was to redraw the same parcels boundaries demarcated during the field work of September
2010, and rewrite the parcels IDs on digital paper. This reconstruction was done because of the technical
issues which happened during the field work of September 2010 (see appendix 2). A part from the
reconstruction of parcels boundaries, another field work for para-surveyors was also done in another new
area where LTR was taking place, and these para-surveyors did parcels boundaries demarcation in P-
mapping using the digital pen method.
For both cases of P-mapping in the field, the one of September 2010 and the one of December 2010, it
was where LTR was taking place, the spatial units (parcels boundaries) collected in the existing method
were also collected in the digital pen method, thus the spatial units were the same. With the 4 teams
working in 1 administrative cell for LTR field work, they were rotating on the use of the digital pen
method. This means that there were 2 teams working in parallel, 1 team continuing the daily work as usual
using the existing method and another team using the digital pen method.
4.4. The selected sites for data collection
The field work of September 2010 was in one cell within Kigali City with urban and peri-urban
characteristics. Normally, before field work, the plan was to work in 2 cells in Kigali City. One cell in peri-
urban area with rural characteristics and one cell in urban area with urban characteristics. The purpose was
to work together with para-surveyors of those 2 different areas. For urban area the reason was also that
parcels are most of time small in Kigali City, part of urban area, but also big number of plots to demarcate
and digitise compared to rural areas. This is in relation of errors which can happen when the parcels to
work on are many and small.
In the period of field work (September 2010), LTR in Kigali City was taking place only in areas which are
urban, and the choice for research field work was Musezero Cell, in Gisozi Sector, Gasabo District. With
4 teams which were working in this cell, a part from para-surveyors of Musezero Cell, their trainers, who
are also para-surveyors, were from urban and most from peri-urban areas (1 from Gasabo Cell in Rutunga
Sector, 1 from Nyagasozi Cell in Bumbogo Sector, 1 from Ngara Cell in Bumbogo Sector, and 1 from
Gasharu Cell in Kinyinya Sector). After finishing LTR in their areas, these para-surveyors trainers went to
Musezero Cell to train new para-surveyors of this cell.
Regarding further tests for these para-surveyors in December 2010, parcels boundaries reconstruction was
done at NLC office, and the area of parcels boundaries reconstructed was Musezero cell. Another field
work for para-surveyors was done in another new area where land adjudication process was taking place,
this was in Kibenga Cell, in Ndera Sector, Gasabo District, in Kigali City, and this area has rural
characteristics, with parcels of quite big size.

EVALUATION OF DIGITAL PEN IN DATA CAPTURING FOR LAND ADMINISTRATION PURPOSES IN RWANDA
21
Figure 5. Location of the selected sites for data collection
4.5. Further tests for other approaches in the use of the digital pen method
After field work and further tests for para-surveyors, there were other further tests, and this was to look
for the approach to use in order to improve the quality of outputs and to save time when using the digital
pen method for spatial data capturing. This was desk work done by the researcher. One of the other
approaches tested was the use of point feature based compared to the line feature based. But also another
approach for line feature based was also tested compared to the one used in the field work, and this was to
assess the use of line feature based by overlapping the lines when doing parcels boundaries demarcation in
order to avoid the gaps, and so to facilitate the post-processing editing after uploading data from digital
pen to the computer. For both tests of other approaches, point feature based and line feature based, the
tests were done by redrawing the same parcels boundaries demarcated during the field work of September
2010, and rewriting the related parcels IDs.
4.6. Materials used in data collection
The following materials are the ones used during this research:
Computer with installation of ArcGIS and Capturx for ArcGIS softwares for producing and
printing maps from ArcGIS as digital paper
Quick bird satellite imagery (0.60m resolution). This was used in pre-field work test. This image is
the one covering Nyamugali Cell, in Gatsata Sector/Kigali City, which is one of the LTR trial
areas. The plotted maps for this pre-field work test were printed at A3 paper size, and the map
scale was 1:1000
Orthorectified aerial photos/orthophotos (0.25m resolution). These orthophotos are the ones
used in the existing method for the land adjudication process at national level. These orthophotos
were used for the rest of the research (research field work, further tests for para-surveyors, and
further tests done by the researcher)

EVALUATION OF DIGITAL PEN IN DATA CAPTURING FOR LAND ADMINISTRATION PURPOSES IN RWANDA
22
Plotted orthophotos printed at A3 paper size. The maps scales were 1:1000 and 1:1500,
respectively for Musezero Cell and Kibenga Cell where the research work took place. These scales
were the same as the ones which were used for field sheets of the existing method for LTR in
these 2 areas
Clip board to put the maps on in the field (plastic protection)
Digital pen for drawing parcels boundaries and record their attributes (parcels IDs) on map
USB adapter to transfer data from digital pen to the computer into ArcGIS, and also for charging
the battery of digital pen to the computer.
The research assessed the digital pen method only for spatial data capturing because of the limitations of
application software (Capturx for ArcGIS). With the discussions and demonstrations with Vicrea14, by
their application software (GOLDliner), it can be possible to use digital pen in data capturing for both
spatial data and related administrative data. But this was not assessed during this research because of the
limitation of time.
14 Vicrea is Dutch company which has developed application software for the use of digital pen in data capturing for both spatial
and administrative data.

EVALUATION OF DIGITAL PEN IN DATA CAPTURING FOR LAND ADMINISTRATION PURPOSES IN RWANDA
23
5. COMPARISON OF THE EXISTING METHOD WITH THE DIGITAL PEN METHOD
This chapter presents the results of different tests done for the use of the digital pen in spatial data
capturing, and it compares the existing method used in Rwanda for general boundaries survey with the
digital pen method. The comparison is done by qualitative and quantitative methods.
5.1. The use of digital pen and digital paper in parcels boundaries demarcation
The tests were done to know which approach to apply for the use of the digital pen method in parcels
boundaries demarcation in the field. For the map legend, two tests were done, spatial unit based on
polygon feature, and spatial unit based on line feature.
5.1.1. Spatial unit based on polygon feature
If boundaries are drawn in polygon mode, each lift of the pen implicates the start of inserting a new
polygon. This creates a series of polygons as can be seen in the figure 6. The lines in red are as drawn on
digital paper. In yellow are series of polygons calculated by the application software; this includes polygons
because of lifting the pen.
Figure 6. Polygon feature based/parcel boundaries drawn by lifting digital pen
If a polygon drawn on digital paper (map) is not closed (the ending point not at least close to the starting
point), then the closing of the polygon by the application software is done in an unpredictable way. See
line in red as drawn on printed map and calculated polygon in yellow, to the left side of the figure 7. For

EVALUATION OF DIGITAL PEN IN DATA CAPTURING FOR LAND ADMINISTRATION PURPOSES IN RWANDA
24
this reason, when drawing parcel boundaries, the operator has to close the polygon (the ending point at
least close to the starting point), see to the right side of the same figure (figure 7).
Figure 7. Polygon feature based/the ending point not close (left) and close (right) to the starting point
Another case is when drawing boundaries between neighbours. The figure 8 presents 2 cases. For case 1,
to the left side of the figure, two polygons are drawn as complete closed polygons. This results in gaps
and/or overlaps. For case 2, to the right side of the figure, the polygon presented to the right has been
inserted in connection to the polygon to the left. The result is in this case that the polygon which is drawn
incomplete (but in connection to the existing polygon) is closed in an incorrect way. This is because the
application software (Capturx for ArcGIS) for digital pen doesn’t have auto-complete polygon option.

EVALUATION OF DIGITAL PEN IN DATA CAPTURING FOR LAND ADMINISTRATION PURPOSES IN RWANDA
25
Figure 8. Polygon feature based/representations of boundaries between neighbouring parcels
But even if the application software for the digital pen would have the option of auto-complete polygon,
the operator in the field would have the problem on drawing parcel boundaries in different segments, thus
demarcating parcel boundaries from 1 boundary to another as he/she is going around the parcel perimeter
until closing the complete perimeter. The issue here would be the one mentioned in figure 6. The
approach of using polygon feature based requires to collect objects in complete polygons. This would not
allow the operator in the field to collect objects as boundaries. With this regard, spatial unit based on line
was the one adopted in this research for data collection.
5.1.2. Spatial unit based on line feature
The parcels boundaries demarcation in the field requires drawing boundaries, one by one, observe the
boundary in the field, draw it on map as a representation of how it appears on the ground, the same to
other boundaries until closing the entire parcel perimeter, then the para-surveyor issues a unique
consecutive number of a parcel. To do this with digital pen, it requires choosing the line feature as map
legend, and so after drawing one boundary, it is possible to move the pen from the map, check the
following boundary on the ground, draw it, and continue drawing parcel boundaries on map until the
completion of parcel perimeter. The approach of line feature based is to collect boundaries.
5.1.3. Functionality of digital pen in parcels boundaries demarcation
The main steps to plot a map as digital paper, to collect data and to correct the mapping mistakes after
uploading data from digital pen to the computer, in ArcGIS, are described in appendix 1.
The use of the digital pen for drawing parcel boundaries, the operator selects the feature type in the map
legend by crosschecking it with digital pen, and then draw parcel boundaries on the map as a
representation of how the boundaries appear on the ground. If the digital pen is moved from the map
when drawing parcel boundaries, the operator has to crosscheck again the feature in the legend before
continuing drawing the following parcel boundaries.

EVALUATION OF DIGITAL PEN IN DATA CAPTURING FOR LAND ADMINISTRATION PURPOSES IN RWANDA
26
Regarding the use of markup layer for annotations on the map, the operator can write as much as needed
when he/she is still using the same annotation type before changing to another legend type. The
annotation on map is used in the field to mark the parcels IDs, mistakes and remarks, and this is visualised
on map after uploading data from digital pen to the computer. According to the application software
(Capturx for ArcGIS), these annotations are stored in the pen not as digital attributes to display for
example in excel spread sheet, they are digital parcels IDs only to display on map, in ArcGIS, they are
figures. This means that to record parcels IDs in attribute table it’s done by typing manually in ArcGIS by
referring to the ones displayed as annotations inside every parcel.
Continuation of crosschecking digital pen into the legend on map (either for line feature or/and Capturx
markup layer (annotation)) doesn’t matter. To crosscheck many times in the previous location is possible,
but the operator has to pay attention for not tearing the paper.
The digital pen uses ink and as a matter of fact everything drawn and written on the map stays on it; it
cannot be erased on field sheet as it can be done when using pencil in the existing method where any
mistake done on map is erased by using the eraser/rubber, the available option for the digital pen method
is the one of marking mistakes(with a class “mistake” in the legend).
5.1.4. Test in the office
After plotting 1 field sheet, it’s better to make a test before printing other maps. This means drawing few
imaginary parcels boundaries and write imaginary parcels IDs on the digital paper and upload data in
ArcGIS to check if the pen stores correctly features drawn and related records written on the printed map.
It can happen that the teams go to the field and pass all the day working, and when back in the office data
are not displayed in ArcGIS because the pen didn’t store everything or anything for the reason that the
preparation and printing of maps was not done properly for the use of the digital pen. The ArcGIS
operator should pay attention to this before deploying the teams to the field.
5.2. Tests of the digital pen method in participatory mapping
The tests for the digital pen method in P-mapping were done in 2 different periods. In the first period,
September 2010, the researcher was in the field to perform direct observation, to train local people on the
use of the digital pen method, to assess the time it takes for para-surveyors to get familiar with the digital
pen method and to assess the skills required for the use of the digital pen method, to assess the
acceptability of the operators/para-surveyors on use of the digital pen method in P-mapping, but also the
attitude of local people (land holders) towards digital pen. In the second period, December 2010, for
further test, the para-surveyors were working without the presence of the researcher, and they used the
knowledge that they have got in the previous test. This was tested in P-mapping in combination with desk
work.
5.2.1. Field test of the digital pen method in participatory mapping/first period
As mentioned in chapter 3.5.4., when doing LTR in a certain administrative cell, there are 4 teams working
in the land adjudication process in the field. The field test of the digital pen method was done for the para-
surveyors of the 4 teams which were working in Musezero Cell during research field work of September
2010.
On the first day of field testing the digital pen method in P-mapping, 2 teams of para-surveyors were
working in parallel for each parcel, one team using the existing method, and another team using the digital
pen method. The first para-surveyor using the digital pen method got the training by the researcher, and
after 1 hour, this para-surveyor was familiar with the method, and he continued using it for more 2 hours
and 30 minutes. Later the 2 teams exchanged the maps, and so the para-surveyor who was using the
existing method did also practice on how to operate in the digital pen method. This second para-surveyor
got the first training from his colleague para-surveyor who was using the digital pen method, and for the
rest the researcher was supervising and facilitating the second para-surveyor. This second para-surveyor

EVALUATION OF DIGITAL PEN IN DATA CAPTURING FOR LAND ADMINISTRATION PURPOSES IN RWANDA
27
got also familiar with the digital pen method after 1 hour and he continued using it for more 2 hours and
30 minutes.
On the second day, the other 2 teams did also practice on how to use digital pen. This was done as the
previous day, 2 teams working in parallel on the same parcels, one para-surveyor using the existing
method and another para-surveyor using the digital pen method, and later the 2 teams exchanged the
maps. The third para-surveyor got the first training from his colleague para-surveyor of the second team,
and for the rest the researcher was supervising and facilitating the third para-surveyor. After 3 hours and
30 minutes, the third para-surveyor exchanged the maps with the fourth para-surveyor who was using the
existing method. The third para-surveyor gave the first training to the fourth para-surveyor on how to use
digital pen, and for the rest the researcher was supervising and facilitating the fourth para-surveyor. For
these other 2 teams, third team and fourth team, each para-surveyor got also familiar with the digital pen
method in 1 hour, and for the rest of time it was for more practice. To get familiar with the digital pen
method for those 4 para-surveyors, it took 1 hour for each para-surveyor and the rest of time was for
them to continue practicing.
The point of view of those para-surveyors is that what is important is how to interpret the image as it is in
the existing method, and the rest is to use digital pen as they do in existing method using pencil, and to
remember first to crosscheck digital pen in the legend before using it for drawing parcels boundaries and
to mark annotations. The para-surveyors understand the role of the legend for the digital pen method;
they understand that the legend is there for allowing the operator to give command to the pen according
to what the operator wants to record on map (parcel boundaries, mistake, parcel number and remark).
5.2.2. Time needed in the digital pen method compared to the existing method
During the test of the digital pen method for parcels boundaries demarcation in P-mapping, in the 2 days
of working in the field with 4 different teams, for each day, the number of parcels demarcated in the field
was the same for both methods, and the spatial units were the same. The use of the digital pen was not a
constraint for para-surveyors; they used it at the same speed as they do in the existing method using
pencil.. The total number of parcels demarcated during field work, in Musezero Cell, was 123 parcels,
from parcel number 1200 to parcel number 1322.
5.2.3. Acceptability of the digital pen method
During the exercise of the digital pen method in parcels boundaries demarcation, local people got
explanations of the purpose of testing the digital pen method. The operators (local people para-surveyors)
of digital pen understand the purpose of this method, and they also understand the purpose of doing first
a test of this method to assess whether it would be applicable. Their point of view is that the digital pen
method is easy for data collection in the field, they find it almost similar to the existing method, they can
use it without difficulties.
Regarding the attitude of local people (land holders) towards digital pen, they didn’t mention that there is a
new tool application on site, this is because of similarities between the existing method and the digital pen
method.
5.2.4. Skills required for the use of the digital pen method
Most of the para-surveyors working in surveying of general boundaries in Rwanda are with secondary
school level. This is not because it is a criterion for recruitment, anyone who has at least skills to read and
write (thus with at least primary school education level) and who is motivated is allowed to pass the exam.
The test to be recruited as a para-surveyor is to be able to identify a certain location on image/orthophoto
where the interviewee is standing, and be able to read and write. For the digital pen method it is also to
remember to crosscheck the digital pen in the legend before drawing parcels boundaries and record
parcels IDs, and/or mark additional information on map. Someone with primary school level would also
gets familiar with the digital pen method without difficulties if he/she is be able to get familiar with the
existing method.

EVALUATION OF DIGITAL PEN IN DATA CAPTURING FOR LAND ADMINISTRATION PURPOSES IN RWANDA
28
5.2.5. Visibility of the digital paper compared to the normal print
Even if it’s possible to identify features on a digital paper, but compared to the existing method with
normal print, the patterns on digital paper reduce the visibility of the image, this changes the true colour
of the image. (see figure 9).
Figure 9. Comparison of visibility of map prints: normal print (left) and digital paper (right)
The figure 9 shows the contrast between the map printed for the existing method, to the left side, and the
map printed with patterns (digital paper) through Capturx for ArcGIS for the digital pen method, to the
right side. Even though the visibility of the digital paper (with patterns for the use of digital pen) is less
compared to the map printed in the ordinary way (without patterns in the existing method), this was not a
constraint for para-surveyors to see the objects on map during parcels boundaries demarcation. But in
reality objects are more visible on map printed without patterns than objects on map printed with
patterns.
5.2.6. Tests for para-surveyors in the use of the digital pen method/second period
In order to assess whether the para-surveyors who were trained on the use of digital pen during research
field work of September 2010 could still remember how to use it after a certain time without using it,
further tests were done. In this regard, the equipments for the digital pen method were sent to Rwanda, in
December 2010, and the para-surveyors used again the digital pen method. This was assessed in two ways,
parcels boundaries reconstruction for the area done during research field work of September 2010, and
another P-mapping in another area. During these further tests, the para-surveyors did the work by
themselves using the digital pen method without anyone to show them again how to use it.
For parcels boundaries reconstruction with their related parcels IDs, these para-surveyors did it by
referring to the parcels boundaries drawn and parcels IDs written on maps used in the existing method.
They have reconstructed the 123 parcels done during research field work in Musezero Cell. For another P-
mapping in another area, Kibenga Cell, the para-surveyors did it by rotating for the use of digital pen as
they did it in the previous P-mapping. Thus 2 teams were working in parallel for each parcel, one para-

EVALUATION OF DIGITAL PEN IN DATA CAPTURING FOR LAND ADMINISTRATION PURPOSES IN RWANDA
29
surveyor using the existing method, and another para-surveyor using the digital pen method. For the
outputs of further tests, see appendix 3.
Figure 10. Parcels boundaries demarcation in the field/further test
Source: Courtesy by NLC GIS staff/Biraro Mireille, 2010
In the figure 10, to the left side, is parcels boundaries demarcation in the existing method, and to the right
side, is parcels boundaries demarcation in the digital pen method, and this was during further test for para-
surveyors in P-mapping in Kibenga Cell. During this further test, 73 parcels were demarcated within 2
days, from parcel number 2706 to parcel number 2749, and from parcel number 2971 to parcel number
2999. During these 2 days it was raining, and in this working condition the number of parcels demarcated
was limited. Regarding the rain conditions, it’s the same for the existing method.
The results of both further tests, parcels boundaries reconstruction and field work in P-mapping, showed
that the para-surveyors could remember how to operate in the digital pen method, they could remember
the use of the map legend (crosschecking digital pen before drawing parcels boundaries and mark parcels
ID, and/or other information on map).
5.3. Further usability testing
In this research, there was to assess the usability of digital pen in data capturing in terms of data storage,
and how long the battery of the pen can last in the field being used before getting recharged, the security
of data stored in the pen when the battery is discharged. Other tests were done to assess the reliability of
the digital pen method for climate conditions, but also there was to assess any other technical matter
which can occur.
5.3.1. Reliability in the use of the digital pen method
Digital pen has a lithium-ion rechargeable battery which can last for long time. During field work, at the
beginning of a day, when the battery was full, it was used 7 hours for parcels boundaries demarcation
during a day, and the battery was still charged of 87 % at the end of the day. The para-surveyors were
trained to keep digital pen closed by its cover when they were not using it, and to open it only when using
it on the map, and so to save the battery.
After recharging the battery; data are still stored in the memory of the pen and are uploaded to the
computer, in ArcGIS. This test was done by drawing a certain number of parcels boundaries (imaginary
parcels boundaries) and writing imaginary parcels IDs on map, and then leave the pen open, thus not to
put its cover, and so to make the battery be empty, and it was totally discharged after 19 hours 21 minutes.
The purpose of this test was to check if data stored in the pen before the battery getting discharged were

EVALUATION OF DIGITAL PEN IN DATA CAPTURING FOR LAND ADMINISTRATION PURPOSES IN RWANDA
30
still stored in the pen. The result of this test was that all data were still stored in digital pen and they were
uploaded from digital pen to the computer, in ArcGIS and visualised.
Regarding climate conditions, the digital pen method is reliable. Digital pen can capture the information
recorded on digital paper under dust conditions. And if the rain falls on digital paper, and before drawing
parcels boundaries and writing parcels IDs, the paper has to be first dried, then the digital pen can also
capture the information recorded on the paper. The tests related are explained in appendix 2.
5.3.2. Technical matters
There are technical matters related to digital paper related to the printer used. Technical issues which
happened during field work, and the details of the tests which were done are explained and demonstrated
in the appendix 2. The equipments used for pre-field work test, during field work and after field work
were the same. All the tests done during this research were done by using the same equipment, and so it
was possible to do the comparisons under different circumstances.
5.4. Approaches for line feature based for spatial data capturing
During research field work and further tests for para-surveyors, the approach for line feature based was to
draw parcels boundaries by connecting lines and try to avoid as much as possible the gaps and overlaps
between lines. With this approach, there were many errors (gaps, but also some overlaps creating extra
polygons), and these errors are visible after uploading data from digital pen to the computer, in ArcGIS.
In the automatic correction of these errors, the ones which are not covered by the topology tolerance
defined (preferably small tolerance), the manual editing workload for correcting the remaining errors is
time consuming. After the results of this approach 1, the line feature based (approach 2) was tested, and
this was to draw parcels boundaries by overlapping intentionally the lines in their connections in order to
avoid the gaps but paying attention of not overlapping the lines in way that they create extra polygons
when converted to polygons.
5.4.1. Line feature based/approach 1
When demarcating parcels boundaries by using digital pen, the pen stores everything recorded on the map
even if there is no ink, and the operator is able to check only what is really drawn. After uploading data
from the pen to the computer, in ArcGIS, it can be checked what has been recorded in the memory of the
pen. There are errors to be corrected according to how lines are drawn on digital paper. These errors are
especially gaps between the connections of lines, but also overlaps. During the research field work, and
later in further tests for para-surveyors, the approach for line feature based was to draw parcels boundaries
by connecting lines in ordinary way, thus without putting gaps or overlaps intentionally. In this approach,
the gaps and overlaps which happened were not done by the intention of the operator, it was related to
the manual drawing. With this approach, there are many errors happening, and this has a big impact when
converting line feature to polygon feature. For gaps, 2 parcels or more are merged in 1 parcel according to
how many gaps are between lines connecting parcels. For overlaps, according to how lines are
overlapping, there are overlaps which create new polygons which don’t represent any parcel existing on
the ground. The figure 11 shows those kind of errors.

EVALUATION OF DIGITAL PEN IN DATA CAPTURING FOR LAND ADMINISTRATION PURPOSES IN RWANDA
31
Figure 11. Line feature based/approach 1 (mistakes based on gaps and overlaps between lines)
The errors shown in the figure 11 are visible after uploading data from digital pen to the computer, into
ArcGIS. These errors are more visible by visualising at higher scale to the one used for data collection.
The parcels boundaries shown in this figure were drawn by para-surveyors during parcels boundaries
reconstruction at the map scale of 1:000 which was the same scale as the one used in data collection in the
field. This figure 11 shows the connection of 4 parcels existing on the ground (parcels numbers 1221,
1235, 1317 and 1318). By converting line feature to polygon feature, line features were converted to
polygon features only for 1 parcel (parcel number 1235), and for the other 3 parcels it was not possible
because of gaps between the connections of their lines. But also there are other 4 new created polygons in
the connection of those 4 parcels. The new created polygons are not the real parcels existing on the
ground, there are converted to polygons because of the way the line features are overlapping. This requires
too much editing workload for correcting these errors before converting line feature to polygon feature,
especially for gaps.
According to the application software (Capturx for ArcGIS), the digitisation for the line feature based
approach is done in streaming mode when drawing parcels boundaries on digital paper, and this implicates
redundancy of vertices (coordinates) for parcels boundaries (vertex representing field distances of around
0.1 meter and 0.2m, even a field distance of 0.01m between some vertices). Because of the errors
happening in the connections of lines, there are involuntary/unintentionally extra lines created as the pen
moves across the map, this implicates many errors to occur, and the automatic correction of these errors
can create wrong boundaries because parcels boundaries are mixed (wrong boundaries and the true
boundaries). The manual correction is also time consuming and difficult.
Before the correction of errors, in order to reduce the redundancy of vertices, and so to facilitate the
manual correction of errors, the simplification of line feature class was tested at 1 m maximum allowable
offset for simplification tolerance. Although a small tolerance was tested, the simplification removes
vertices in some curves (corners) of parcels boundaries. After geo-processing of simplifying line feature,
the correction of errors was first tested automatic by using the topology tolerance of 0.25m. The reason of
simplifying the feature class of parcels boundaries at the stage of editing line features, is that if it is done

EVALUATION OF DIGITAL PEN IN DATA CAPTURING FOR LAND ADMINISTRATION PURPOSES IN RWANDA
32
later (after converting line features to polygon features), it causes gaps and overlaps between polygons.
This is because the vertices which were connected for line feature class are not still the same, they are
changed by the automatic simplification of polygon feature. To correct these errors for polygon features
would require to do other corrections by using topology creation with automatic correction, and manual
correction for errors not covered by automatic correction. The issue here is that doing automatic
correction twice would increase the loss of originality of the collected data.
The correction of errors for line feature class was also to do the manual correction for errors not covered
by automatic correction, and after manual correction of errors, the line feature was converted to polygon
feature. After these corrections, the attributes (parcels IDs) were entered in attribute table. During the
entry of attributes, the errors of parcels boundaries which were still found they were corrected manually by
connecting concerned vertices.
According to the errors happening in this approach 1, and the time it takes to correct these errors, another
approach was tested to assess the way digital pen can capture cadastral data in a line feature based
approach.
5.4.2. Line feature based/approach 2
After the results of field work and further tests for para-surveyors in regard of errors found for line
feature based/approach 1 and time used for editing, another approach was tested to identify how data
collected by using the digital pen method with line feature based would not cause too much editing
workload after uploading data from the digital pen. This test was done by the researcher by redrawing the
123 parcels done during research field work, with their parcels IDs.
When demarcating parcels boundaries by using line feature based, an overlap for lines is helpful in order
to connect the lines without gaps. It’s not necessary to have snapping option with this approach if the
intended final outputs are the polygons in order to get the areas (surfaces) of parcels. The following figure
shows the way overlapping lines are converted to polygons without missing parcels because there are no
gaps between lines.
Figure 12. Line feature based/approach 2 (polygons converted from overlapping lines)

EVALUATION OF DIGITAL PEN IN DATA CAPTURING FOR LAND ADMINISTRATION PURPOSES IN RWANDA
33
The attention has to be paid not to overlap the lines in way that when they are converted to polygons;
those overlaps create extra polygons which don’t represent real parcels on the ground. The following
figure shows those kind of extra polygons.
Figure 13. Line feature based/approach 2 (Extra polygons/mistakes in overlapping lines)
After converting line feature to polygon feature, the checking and correction of extra polygons was done
after the entry of parcels IDs. The polygons with “Null” for parcels IDs were the ones to be corrected,
thus the extra polygons, and the post-processing was to merge each extra polygon with one of its
intersecting polygons, the most showing to be the extent of the extra polygon. These extra polygons are
very small, they are visible when parcels boundaries are visualised at higher scale to the one used in data
collection. These kind of extra polygons happen by mistake when digital pen touches on digital paper
unintentionally by the operator on unwanted location. When drawing in streaming mode (streaming mode
digitisation) without the option of point mode digitisation, the precision becomes less for the operator
drawing parcels boundaries on digital paper, thus the control on coordinates becomes less.
5.4.3. Comparison of line feature based approaches (approach 1 and 2)
After testing the 2 approaches of line feature based, the comparison was done. To do the comparison of
both approaches, another reconstruction of parcels boundaries was done by the researcher using the
approach 1, and so to be able to compare the editing workload based on the same parcels reconstructed
by the same operator. Regarding the time used for parcels boundaries reconstruction was the same for
both methods. The following table shows the time for editing workload.

EVALUATION OF DIGITAL PEN IN DATA CAPTURING FOR LAND ADMINISTRATION PURPOSES IN RWANDA
34
Digital pen method/line
feature based/approach 1
Digital pen method/ line
feature based/approach 2
Human resources 1 person 1 person
Work done (parcels
boundaries reconstruction)
123 parcels 123 parcels
Time used for post-processing
workload
114 minutes 79 minutes
Table 4. Comparison of line feature based/approach 1 and 2
The table 4 shows that the time used for post-processing workload for line feature based/approach 2 is
less compared to the time used for post-processing workload for line feature based/approach 1. But this
depends on the situation in the field and the number of errors.
But in terms of quality, compared to line feature based/approach 1, the outputs of line feature
based/approach 2 reflect more the original collected data because there is no automatic correction of errors, in
this approach errors are corrected manually and easily. The two approaches what they have similar is the
streaming mode digitisation in data collection, and this is related to the application software (Capturx for
ArcGIS) which doesn’t have point mode digitisation for line feature. In this regard, another approach was
tested for point mode digitisation, and this was done by using point feature based.
5.5. Point feature based approach for spatial data capturing
With point mode digitisation, parcels boundaries demarcation can be done with control on how the digital
pen moves over the map, thus with better control of resulting coordinates (vertices). For a parcel which
has boundaries on more than 1 map sheet, the coordinates were also controlled in the overlap of the 2
maps. Another reconstruction of parcels boundaries was done by the researcher using the point feature
based approach. This test was done on the basis of the 123 parcels done during research field work in
Musezero Cell. During this test, the point feature was marked where there is a curved parcel boundaries.
For each parcel boundaries, the lines were drawn on the map to connect the points thus composing the
complete perimeter, in order to know which point belongs to which parcel boundary. Those lines were
drawn by using one of the annotations in the legend. This means that in the map legend, one of the
annotations was used for connecting point features. After uploading data from digital pen to the
computer, in ArcGIS, the digitisation of parcels boundaries was done by using polygon feature class, and
snapping to the collected points uploaded from digital pen. In this vectorisation of boundaries, also other
editing options were used for polygon feature such as auto-complete polygon, and where necessary cut
polygon. The complete perimeter for each parcel boundaries was done by referring to the annotation lines
also uploaded from digital pen. The outputs of this approach are shown in the following figure.

EVALUATION OF DIGITAL PEN IN DATA CAPTURING FOR LAND ADMINISTRATION PURPOSES IN RWANDA
35
Figure 14. Point feature based approach (polygons digitised by snapping to the collected points)
The figure 14 shows the post-processing digitisation of parcels boundaries by snapping on the collected
points uploaded from digital pen. The approach of point feature based is to collect objects in different
composing points. This approach was compared to the line feature based/approach 2 for both parcels
boundaries demarcation and editing workload, in terms of time and quality of outputs.
5.6. Comparison of the digital pen method/line feature based and point feature based
The comparison of approaches for the digital pen method were assessed between the line feature
based/approach 2 and point feature based. The reason of the choice of line feature based/approach 2 is
that the results of this approach showed that it the more practical for editing compared to the line feature
based/approach 1.
Digital pen method/line
feature based/approach 2
Digital pen method/point
feature based
Human resources 1 person 1 person
Work done (parcels
boundaries reconstruction)
123 parcels 123 parcels
Time used for parcels
boundaries reconstruction
161 minutes 173 minutes
Time used for post-processing
workload
79 minutes 58 minutes
Total time 240 minutes 231 minutes
Table 5. Comparison of line feature based approach and point feature based approach
The table 5 shows that the time used for line feature based is almost the same as the time used for point
feature based. Regarding the time for editing outputs of line feature based, this would depend on how
many mistakes created in data collection when overlapping the lines which create extra polygons when

EVALUATION OF DIGITAL PEN IN DATA CAPTURING FOR LAND ADMINISTRATION PURPOSES IN RWANDA
36
converting lines to polygons. The time used for editing workload could be more less or more high
according to how the operator would overlap the lines in data collection.
In terms of the quality of outputs, in the point feature based the data are collected in point mode
digitisation, it is more controlled compared to the line feature based when drawing parcels boundaries
points on digital paper. On the other hand after uploading data from digital pen to the computer, into
ArcGIS, the point feature based approach requires manual post-processing digitisation of parcels
boundaries to close the complete perimeters, and if not snapping well to the collected points, this would
cause errors in changing the original collected information.
Regarding line feature based, data are collected in streaming mode, and the control on coordinates is less
compared to point feature based. To reduce the redundancy of vertices as a result from streaming mode in
line feature based, the simplification of line feature class can be done after uploading data from digital pen
to the computer, in ArcGIS, but the simplification removes vertices in some curves (corners) of parcels
boundaries, it would be better not using the simplification option of feature class for parcels boundaries.
On the other hand, line feature based approach doesn’t require manual post-processing digitisation for
parcels boundaries, the boundaries are directly collected in lines, and so line features can be directly
converted to polygon features for calculating areas of the collected parcels. But the errors found have first
to be corrected, such as extra polygons mentioned in 5.4.2.
5.7. Comparison of the existing method and the digital pen method
The comparison of the existing method and the digital pen method resulted in a preference for line feature
based/approach 2 on the side of the digital pen method. The choice of line feature based/approach 2 is
that compared to other tested approaches for the digital pen method, this approach is practical , and it
would be even more practical if the application software is improved.
Regarding the time for drawing parcels boundaries and writing parcels IDs and/or any other information
on digital paper, as mentioned in 5.2.2., the para-surveyors can work at the same speed when using the
digital pen method as they do in the existing method. The time shown in the following table is the one for
post-processing the collected data. The time for post-processing vectorisation of boundaries in the
existing method is the one used by the researcher because he was also the one for post-processing data
uploaded from digital pen in the digital pen method.

EVALUATION OF DIGITAL PEN IN DATA CAPTURING FOR LAND ADMINISTRATION PURPOSES IN RWANDA
37
Post-processing in the existing method Post-processing
in the digital
pen method
Tasks and
human
resources
Redrawing
and
rewriting
over the
pencil
marks by
using the
normal
pen
Scanning
field
sheets
Georeferencing
field sheets
Post-
processing
vectorisation
of the
collected data
Total Editing the
collected data
1 operator 1operator 1 operator 1 operator 1 operator
Number of
parcels post-
processed
123 123 123
Time used
for post-
processing
workload
59
minutes
9
minutes
45 minutes 78 minutes
191 79 minutes
Table 6. Comparison of the existing method and the digital pen method
The table 6 shows that the time used for post-processing editing of the collected data in the digital pen
method is less than the time used for post-processing in the existing method.
For the post-processing vectorisation in the existing method, the parcels were vectorised by the researcher
by using the same scanned georeferenced field sheets as used at NLC. The vectorisation was for the 123
parcels done during research field work (from parcel number 1200 to parcel number 1322 of Musezero
Cell). The parcels boundaries of Musezero Cell were also vectorised by NLC GIS staff as normal daily
work, and the time used for vectorising the 123 parcels was calculated, it was done in 90 minutes. The
time used by the researcher was not the same with the one used by NLC GIS staff, but it’s almost the
same. In the existing method, in addition to the time used for post-processing vectorisation of the 123
parcels, there is time used first for scanning and georeferencing the field sheets. In daily work of scanning
and georeferencing the field sheets, the time for scanning 1 field sheet is between 4 and 5 minutes (average
of 4 minutes and 30 seconds), and the time for georeferencing 1 field sheet is between 20 and 25 minutes
(average of 22 minutes and 30 seconds). Regarding the 123 parcels, they were on 2 field sheets, and so the
time shown in the table 6 is for scanning and georeferencing the 2 field sheets.
In addition to this, for post-processing workload in the existing method, as mentioned in chapter 3.5.6.
there is preliminary work of redrawing and rewriting over the pencil marks on field sheets by using the
normal pen to make the pencil marks more visible before scanning field sheets. The time shown in the
table 6 is the one used by the researcher in redrawing over the boundaries of the 123 parcels and rewriting
over their parcels IDs by using normal pen by referring to the 2 scanned georeferenced field sheets
covering these parcels. These scanned georeferenced sheets were printed at 1:1000 scale which was the
scale used for land adjudication process in Musezero Cell.
In terms of quality, the digital pen method is more precise in preventing to decrease original accuracy and
the originality in general (evidence from the field). The figure 15 shows the post-processed digitised
parcels boundaries in the existing method and the same parcels boundaries reconstructed in the digital pen
method.

EVALUATION OF DIGITAL PEN IN DATA CAPTURING FOR LAND ADMINISTRATION PURPOSES IN RWANDA
38
Figure 15. Comparison of the existing method (left) and the digital pen method (right)
Refer to the figure 15, in the existing method, to the left side, the vectorised boundaries are overlaid to the
scanned georeferenced field sheet used in the post-processing vectorisation. In the digital pen method, to
the right side, data are collected digitally and georeferenced, they are directly vectorised on site. There are
no intermediate steps of redrawing and rewriting over the collected data, no scanning of the sheets used in
data collection, no georeferencing of those sheets, and no post-processing vectorisation to get vectorised
parcels boundaries for the collected data, they are directly visualised and overlaid to the original
orthophoto for editing where necessary.

EVALUATION OF DIGITAL PEN IN DATA CAPTURING FOR LAND ADMINISTRATION PURPOSES IN RWANDA
39
Figure 16. Collected data (left) and uploaded data from digital pen (right)/the digital pen method
The figure 16 shows, to the left side, the digital paper with parcels boundaries drawn and parcels IDs
written by using digital pen on digital paper. The original scale of printed map was at 1:1000 in data
collection. To the right side, there are the same parcels boundaries and parcels IDs stored after recording
by the digital pen, and uploading to the computer, in ArcGIS, directly visualised, and overlaid to the
original orthophoto. This prevents the errors which can happen in each of the intermediate process used
in the existing method. The parcels boundaries visualised in ArcGIS are true to the original parcels
boundaries drawn on digital paper.
Regarding the outputs when vectorising parcels boundaries on scanned georeferenced field sheets, it is
relative to different factors, and among them, the operator vectorising, it can change from 1 operator to
another. The following figure shows the same vectorised parcels boundaries post-processed vectorised by
2 operators.

EVALUATION OF DIGITAL PEN IN DATA CAPTURING FOR LAND ADMINISTRATION PURPOSES IN RWANDA
40
Figure 17. Comparison of the outputs in the existing method
The figure 17 shows the personal relativity of the outputs of parcels vectorised on scanned georeferenced
field sheet according to the operator vectorising. To the left side are parcels boundaries vectorised by the
researcher, and to the right side are the same parcels boundaries vectorised by NLC GIS staff. The input
was the same (scanned georeferenced field sheet post-processed at NLC), and scale for post-processing
vectorisation was also the same (1:500 scale). In this figure, the vectorised outputs are visualised at 1:100
scale.
5.8. Concluding remarks
The digital pen method is almost similar to the existing method in P-mapping, local people can get
familiar of this method as they do in the existing method, the essential is the ability of image interpretation
for parcels boundaries demarcation. The digital pen method is also practical in P-mapping in terms of
reliability for field operations. Compared to the existing method, in the digital pen method data are collected digitally and georeferenced,
they are directly vectorised on site. After data collection, these data are uploaded from digital pen to the
computer, in ArcGIS, and directly visualised. The uploaded data from digital pen are true to the collected
data. The editing process is done where necessary. The time used in the digital pen method to get the final
digital outputs is also less compared to the existing method.
In the current status of the digital pen method/line feature based, data collection is in streaming mode
digitisation because of the limitation of the application software. The parcels IDs are also collected as
figures to display on map, they are not real digital IDs for attribute table.

EVALUATION OF DIGITAL PEN IN DATA CAPTURING FOR LAND ADMINISTRATION PURPOSES IN RWANDA
41
6. DISCUSSION ON THE DIGITAL PEN METHOD FOR CADASTRAL SURVEY
This chapter discusses the results presented in chapter 5. The discussion is based on the four criteria used
in this research (P-mapping, quality, time, and process). The research questions are focus of attention in
this discussion.
6.1. Parcels boundaries demarcation in participatory mapping
The results of this research showed that the digital pen method can be used in P-mapping, this method is
not difficult for local people to use it in spatial data capturing. The digital pen method is also reliable for
field operations. During this research, there were also observations on how P-mapping is processed.
6.1.1. Practicability in participatory mapping
The digital pen method is practical in terms of reliability for field operations. The battery of digital pen can
last for long time in the field before getting recharged, but also the collected data are still stored in the pen
when the battery is discharged. The digital pen method is also reliable for climate conditions. If the digital
paper is covered by dust, it doesn’t stop digital pen to capture the information recorded on the digital
paper. And if the rain falls on digital paper, and before drawing parcels boundaries and writing parcels
IDs, the paper to be first dried, digital pen can still capture the information recorded on the paper
provided that the patterns are still on the paper.
Local people can get familiar with the digital pen method without difficulties, this method is almost similar
to the existing method.
Figure 18. Pencil based (left) and digital pen based (right) for orthophoto based land adjudication

EVALUATION OF DIGITAL PEN IN DATA CAPTURING FOR LAND ADMINISTRATION PURPOSES IN RWANDA
42
The figure 18 shows, to the left side, the existing method using pencil for drawing parcels boundaries and
marking parcels IDs, and eraser to correct the mistakes done on map. To the right side, the figure shows
the digital pen method using digital pen for also drawing parcels boundaries and marking parcels IDs. The
mistakes done on digital paper are marked by using the pen based on the map legend. Digital pen is also a
pen and which has an advantage of collecting data directly into georeferenced digital format when used on
digital paper.
To measure how GIS is a tool for better governance (McCall, 2003) formulates the following questions:
“Can the goals of good governance be met in applications of geo-information (GI) with the governance criteria of
accountability, legitimacy, respect for rights, equity, and competence?‟‟ To answer this, he adds the sub-question:
“What degrees of participation‟ are found in participatory mapping (P-mapping)?” The digital pen method can keep
the participation in P-mapping as in the existing method, and in addition to this it can promote more the
participation. The legend used in the digital pen method can be practical to highlight on map the
disagreement on parcel boundary between neighbouring parcels when doing parcels boundaries
demarcation in adjudication process. The data can be projected to the board and presented to the local
people directly in the field at the end of each working day for their feedback. This means that in the map
legend, there can be a layer for disagreement on parcel boundary. After uploading data from digital pen to
the computer, in ArcGIS, what was recorded on site can be directly visualised. The following figure shows
the example.
Figure 19. Highlighting on map disagreement on parcel boundary between neighbouring parcels
The outputs of the figure 19 are imaginary drawn and written by the researcher on digital paper to show
the way the information needed can be recorded and be visualised directly after uploading data from
digital pen to the computer, in ArcGIS. The digital pen method can be useful in highlighting other
information according to the purpose. The collected data (vectorised boundaries) for each daily work can
be presented (vectorised boundaries overlaid to the original orthophoto) to the local people directly on
site. This would lead to win the time for the checking and the correction of errors compared to the

EVALUATION OF DIGITAL PEN IN DATA CAPTURING FOR LAND ADMINISTRATION PURPOSES IN RWANDA
43
existing method where there is time of field work for data collection in analogue format and again the time
to go back to the field for the checking and the correction of errors after post-processing digitisation.
The attention to be paid in the digital pen method is that when using digital pen, it happens that the ink of
the pen doesn’t appear on the map on some places, as it can also happen to another kind of pen. In case
this happens to digital pen, even if the ink is not visible on the map, the records are already stored in the
memory of the pen when it is moving on digital paper. In that case, if for example the operator of digital
pen redraws a certain parcel boundary to make it appearing on the field sheet and/or when trying to refine
the boundaries on the digital paper, in the memory of digital pen, it is recorded again, and so the
boundaries become superimposed according to how many times the same boundary is redrawn on the
map. After drawing a certain parcel boundary on map, and the ink of digital pen not appearing on map,
that parcel boundary can be redrawn by using ordinary pen, because the first boundary drawn by using
digital pen is already stored in the memory of digital pen even if the ink doesn’t appear on map, and this is
the same for writing parcels IDs or other remarks on digital paper.
The attention has also to be paid on how to operate in the digital pen method for parcels which have
boundaries on more than 1 map/field sheet. In the overlap of 2 consecutive field sheets, the continuous
parcel boundaries have to be drawn once in order to avoid duplicated boundaries to be stored in the
memory of digital pen, this means that the boundary has to be drawn only on 1 field sheet. This can be
difficult to organise, but the problem is the same in the existing approach.
6.1.2. Observation for participatory mapping
The attention to pay in P-mapping is on the way the teams work in the field, and so to prevent the
overlaps and/or gaps between parcels boundaries done by different teams. Even if the teams are deployed
in a way that every team has a limit of the area to demarcate within a cell administrative boundaries area,
but some errors happen between the delimitations of those teams in case every team demarcates parcels
boundaries located in the line of division of their delimitations. This can happen where the line of division
between the 2 teams is not natural or physical feature, for example when there is neither river nor road,
such as in some forests, some farms, and in some marshlands. For every line of division between 2 teams,
parcels boundaries located in that line of division should be drawn once by 1 team, and the teams have
always to exchange the field sheets on which there are the lines of divisions. This situation is not different
in principle from the existing pencil based approach.
Attention to this has to be paid not only within a cell area, but also between 2 neighbouring cells, and this
is also where the line of division between those cells is neither natural nor physical features. By paying
attention to this, it would help to overcome the issues mentioned in chapter 3.5.6., thus the issues found
by NLC GIS staff on field sheets when doing post-processing digitisation such as overlaps between
parcels boundaries demarcated, parcels not demarcated, and any other issue related.
6.2. Quality of spatial data (parcels boundaries)
The digital pen method can overcome the sources of errors happening in the existing method.
6.2.1. Sources of errors in the existing method
In the former approach which was used in the existing method for post-processing digitisation directly on
original orthophoto, by looking at redrawn parcels boundaries and rewritten parcels IDs which are on
field sheets, and then look at computer screen to redraw those boundaries and rewrite those parcels IDs
digitally, there were much more risks of errors compared to the approach used currently by vectorising the
redrawn parcels boundaries and recording parcels IDs which are on scanned georeferenced field sheets
(see chapter 3.5.6.). Despite these changes, the method of pencil based for parcels boundaries demarcation
in the field (analogue data), post-processing by redrawing and rewriting over the pencil marks using
normal pen to make the parcels boundaries and parcels IDs more visible on field sheets (duplication of
analogue data), scanning the field sheets, georeferencing them, and post-processing vectorisation of the

EVALUATION OF DIGITAL PEN IN DATA CAPTURING FOR LAND ADMINISTRATION PURPOSES IN RWANDA
44
collected parcels boundaries is very complex. It implicates many steps to be performed to get the final
digital outputs. The complex process is where errors happen for each step by changing the originality of
the collected data from the field. The intermediate step of redrawing and rewriting pencil marks is helpful
to make boundaries and parcels IDs more visible on field sheets, but in terms of the quality of data, this
implicates the change of the original collected data because of double manual drawing, and at this level
data are still analogue. A part from this, the quality of the scanned field sheet compared to the original
orthophoto depends on different factors, and amongst them: the paper used for printing the map, the
printer resolution used for printing map/field sheet, the scanner resolution used for scanning field sheet,
etc . When georeferencing the scanned field sheets using map grids, the field sheets don’t match exactly
with the original orthophoto. This depends on resolution of scanned field sheets, on the way the original
orthophoto used to plot field sheet was taken (visibility according to the time during a day the image was
taken, covered by clouds or not, and other factors), on the optical quality of human eye of the operator
georeferencing, etc. The printed map by itself doesn’t have the original resolution of the image which is
used to produce the orthophoto field sheet, it has a little less resolution compared to the original
orthophoto. Then after scanning the printed map/field sheet, the resolution becomes a bit less again. The
following figure shows the difference of resolution between scanned field sheet and original orthophoto.
It shows also the point marked on the scanned georeferenced field sheet and the same point visualised to
the original orthophoto.
Figure 20. Scanned georeferenced field sheet (left) and the same area of the original orthophoto (right)
Referring to the figure 20, to the left side is the scanned georeferenced field sheet, and to the right side is
the original orthophoto. The 2 images don’t have the same resolution. The position of the point marked
on the object on the scanned georeferenced field sheet doesn’t match the same position on the original
orthophoto.
Regarding the digitisation (vectorisation) of parcels boundaries by referring to/following the ones on the
scanned georeferenced field sheets, it should be remembered that snapping is not possible, the scanned
boundaries are not digital features to snap to. A part from being relative to the operator vectorising, even

EVALUATION OF DIGITAL PEN IN DATA CAPTURING FOR LAND ADMINISTRATION PURPOSES IN RWANDA
45
if 1 operator would vectorise parcels boundaries, and again revectorise the same parcels boundaries, the
outputs would not come again the same as previously because of vectorising on scanned parcels
boundaries, it is not snapping on those parcels boundaries.
6.2.2. Data acquisition in the digital pen method
The intended purpose of using digital pen is for general boundaries survey in P-mapping. “From a more legal
perspective, the general boundaries rule allows for leaving the exact position of the boundary within the feature undetermined.
The idea is that in this way the main body of the property is reasonably defined, and that it can be identified beyond doubt”
(Bogaerts & Zevenbergen, 2001). The digital pen method can improve the existing data acquisition for
general boundaries, data are collected digitally and georeferenced, they are directly vectorised on site. After
data collection, these data are uploaded from digital pen to the computer, in ArcGIS, and directly
visualised without intermediate steps done in the existing method to get the vectorised data. This means
that in the digital pen method, there are no intermediate steps of redrawing and rewriting over the
collected data, no scanning of the sheets used in data collection, no georeferencing of those sheets, and no
post-processing vectorisation. The uploaded data from digital pen are true to the collected data.
The digital pen method/line feature based, data collection is in streaming mode digitisation because of the
application software (Capturx for ArcGIS). Data collection in streaming mode digitisation implies many
vertices, the operator has less control on coordinates. In the current status of the digital pen method,
point feature based approach gives more control on coordinates compared to line feature based and
polygon feature based approaches.
But when demarcating parcels boundaries, line feature based would be the practical approach to apply and
so to collect objects as boundaries by going around each parcel boundaries, from 1 boundary to another
until the completion of the entire perimeter without duplications in boundaries. The overlap for
connecting lines is helpful in order to connect the lines without gaps, and after uploading the collected
data from digital pen to the computer, in ArcGIS, the lines can be directly converted to polygons, and the
corrections can be done where necessary.
In case of snapping option only without the approach of overlapping lines, the operator would not be able
to control if the lines are well snapped or not, what the operator can see in data collection are the records
on the printed map. The snapping option would require to be able to visualise digitally the records during
the action on site, and this is not possible for the digital pen method when collecting data. Only data can
be visualised after the upload from digital pen to the computer, in ArcGIS. But even when digitising
(vectorising) the lines in ArcGIS, by using the snapping option, it happens that the operator doesn’t snap
well some lines in their connections, and this causes the gaps between those lines. But if the intended
purpose is to convert lines to polygons, the approach of overlapping lines is practical to prevent the gaps
to happen between the connections of lines, but also by paying attention in overlapping lines in the
connection of more than 2 lines in order that it would not create extra polygons when converting lines to
polygons.
Compared to the line feature based/approach 1 (the approach of not overlapping lines in data collection),
the line feature based/approach 2 (the approach of overlapping lines in data collection) is only for easy
post-processing, but it would not have a legal meaning of representing the boundaries as existing on the
ground before line features are converted to polygon features.
Regarding the record of attributes in data collection, in the current status of the digital pen method,
parcels IDs are collected as figures to display on the map, they are not real digital IDs for attribute table.
This is because of the limitation of the application software (Capturx for ArcGIS).
6.3. Time used for spatial data capturing
Digital pen is practical for parcels boundaries demarcation in the field in P-mapping, the local people can
use it at the same speed as they do in the existing method, it’s used as normal for drawing boundaries. For
post-processing, the digital pen method can also help in saving of time compared to the existing method.

EVALUATION OF DIGITAL PEN IN DATA CAPTURING FOR LAND ADMINISTRATION PURPOSES IN RWANDA
46
But in the current status of the digital pen method, the correction of errors takes more time compared to
the one expected to be according to the way data are directly collected digitally and georeferenced. Most of
these errors are the ones related to the limitations of the application software (Capturx for ArcGIS), and
this limits the operator for some operations in data collection, such as to be limited on streaming mode
digitisation because there is no option of point mode digitisation, and this implies less control on
coordinates.
6.4. Process used to get vectorised data
In the existing method, because of a number of steps used to achieve the final digital (vectorised) outputs,
a number of additional archives is maintained for cadastral information which are in addition to the
original data (orthophotos). These additional archives are field sheets used for parcels boundaries
demarcation, and the scans of those field sheets. With the option of spatial data acquisition directly into
georeferenced digital format, the number of steps can be reduced. This would implicate in reduction of
the number of archives. After uploading data from digital pen into ArcGIS, the evidence from the field
would be directly the vectorised parcels boundaries overlaid on the original orthophoto, this would not
require the big space for archiving compared to the existing method.
6.5. Concluding remarks
Digital pen captures spatial data directly into georeferenced digital format (directly vectorised) and the
collected data are directly visualised in ArcGIS and overlaid to the original orthophoto without
intermediate steps used in the existing method to get vectorised data. In addition to this, the uploaded data
from digital pen are true to the collected data. This can have an impact in preventing sources of errors
which are in intermediate steps used in the existing method to get vectorised data, but also this can have
an impact in saving the space for archiving. This method can also implicate saving of time. The digital pen
method is also practical in P-mapping, local people can use it without difficulties, and at the same speed as
the existing method. The digital pen method is also practical in terms of reliability for field operations, and
it can promote more P-mapping.
The digital pen method/line feature based would be the practical approach to apply for parcels boundaries
demarcation. But there are some limitations for the operator in data collection. Because of the application
software, data collection is done in streaming mode digitisation, no available option for point mode
digitisation, and the operator has less control on coordinates. The parcels IDs are also collected as figures
to display on map, they are not real digital IDs for attribute table.

EVALUATION OF DIGITAL PEN IN DATA CAPTURING FOR LAND ADMINISTRATION PURPOSES IN RWANDA
47
7. CONCLUSIONS AND RECOMMENDATIONS
This chapter presents the conclusions of this research. It also presents the recommendations related to
this work and suggestion for further research.
7.1. Conclusions
Spatial data acquisition from orthophoto through P-mapping has advantages of making progress in the
land adjudication process for land administration purposes in Rwanda. In the existing method for LTR a
normal pencil is used in data collection to draw boundaries of parcels on plotted orthophotos. In this
existing method, post-processing has to be performed to get vectorised boundaries. This implies different
sources of errors, it is time consuming, and it uses a lot space for archiving.
Orthophoto based land adjudication could be improved in efficiency by collecting data directly into
georeferenced digital format in the field in order to prevent the sources of errors happening in the existing
method. This research did a comparative study between the existing method and the alternative method of
using digital pen. The criteria of assessment were quality of data, time used, P-mapping, and process used
in terms of archiving.
The main objective was to assess whether the use of digital pen can improve the efficiency for spatial data
acquisition for general boundaries survey. The specific objectives were to assess the sources of errors in
the existing method that can be addressed by the digital pen method, to identify the time that the existing
method takes compared to the time that the digital pen method would take for spatial data capturing, to
assess the process used for the existing method and the digital pen method in terms of the space for
archiving, and to identify practical field operations in P-mapping when using the digital pen method for
spatial data capturing compared to the existing method.
The digital pen method is efficient for spatial data acquisition for general boundaries survey in Rwanda. In
terms of quality of data, the digital pen method can address the sources of errors happening in the existing
method. The digital pen method can overcome sources of errors of data collection in analogue format and
the intermediate steps for post-processing to get the vectorised outputs. In the digital pen method there is
no post-processing of redrawing and rewriting over the collected data to make them visible on field sheets
for the purpose of post-processing digitisation. In the digital pen method, there is no scanning of field
sheets needed (printed maps used in data collection), no georeferencing of field sheets, no post-processing
vectorisation of parcels boundaries. In the digital pen method data are collected directly into a
georeferenced digital format, and they are directly uploaded from digital pen to the computer, and overlaid
to the original orthophoto, and these uploaded data are true to the original collected data in the field. This
would also lead to win the time for post-processing.
By collecting data directly into georeferenced digital format, the digital pen method would improve the
process in terms of saving the space for archiving, there are no intermediate steps used in the existing
method to get the final digital outputs from the analogue collected data.
If the intended purpose is to convert lines to polygons, the approach of overlapping lines in data
collection to prevent the gaps to happen between the connections of lines is practical for easy post-
processing. After uploading the collected data from digital pen to the computer, in ArcGIS, the lines can
be directly converted to polygons, and the corrections can be done where necessary.
In the current status of the digital pen method/line feature based, data collection is in streaming mode
digitisation because of the application software (Capturx for ArcGIS). Data collection in streaming mode
digitisation implies many vertices, the operator has less control on coordinates. There is no available
option of point mode digitisation for line feature based.

EVALUATION OF DIGITAL PEN IN DATA CAPTURING FOR LAND ADMINISTRATION PURPOSES IN RWANDA
48
The digital pen method is practical for field operations in P-mapping. The local people can get familiar
with this method without difficulties, and they can continue working at the same speed as with the existing
method. The digital pen method is reliable for field operations. The battery of digital pen is rechargeable
after long time used, but the digital pen also secures the collected data, there is no loss of data when the
battery is discharged. The digital pen method is also reliable for climate conditions in terms of dust and
rain conditions for the readability of the pattern on the digital paper by the digital pen.
In addition to this, the digital pen method can be useful in highlighting the disagreement on parcel
boundary between 2 neighbouring parcels, but it can also be useful in highlighting other information. The
digital pen method would promote P-mapping by presenting the daily work to the local people at the end of each day for their
feedback. The collected data (vectorised boundaries) for each daily work can be presented (vectorised boundaries overlaid to the
original orthophoto) to the local people directly on site. This would lead to win the time for the checking and the correction of
errors compared to the existing method where there is time of field work for data correction in analogue format and again the
time to go back to the field for the checking and the correction of errors after post-processing digitisation.
7.2. Recommendations
Some improvements are proposed to be developed for functionalities related to the digital pen method to
make it more practical. The application software is proposed to be improved by an option for point mode
digitisation for lines.
The application software is proposed to be improved with option for data collection of parcels IDs as
digital attributes.
Further it is recommended to test the promotion of P-mapping by presenting the daily work to the local
people at the end of each day for their feedback using projector.
Further research on the use of digital pen in cadastral data capturing for both spatial data and
administrative data and the link between them is proposed.

EVALUATION OF DIGITAL PEN IN DATA CAPTURING FOR LAND ADMINISTRATION PURPOSES IN RWANDA
49
LIST OF REFERENCES
Bishop, I. D., Escobar, F. J., Karuppannan, S., Williamson, I. P., Yates, P. M., Suwarnarat, K., et al. (2000). Spatial data infrastructures for cities in developing countries - Lessons from the Bangkok experience. Cities, 17(2), 85-96.
Bogaerts, T., & Zevenbergen, J. (2001). Cadastral systems -- alternatives. [doi: DOI: 10.1016/S0198-9715(00)00051-X]. Computers, Environment and Urban Systems, 25(4-5), 325-337.
Corne´ P. J. M. van Elzakker, I. D. a. P. J. M. v. O. (2008). Field-Based Usability Evaluation Methodology for Mobile Geo-Applications. 45, 139–149.
Dale, P. (1993). Land registration and cadastral systems -- Tools for Land Information and Management: Gerhard Larsson, Longman Scientific and Technical, 175 pp., $39.95 (hard cover), ISBN 0-47021-798-7. [doi: DOI: 10.1016/0924-2716(93)90006-9]. ISPRS Journal of Photogrammetry and Remote Sensing, 48(1), 34-34.
de Vries, W. T. (2004). How progressive land titling could foster new surveying practices and land information systems--based on case studies in Namibia. [doi: DOI: 10.1016/j.compenvurbsys.2003.11.006]. Computers, Environment and Urban Systems, 28(5), 531-544.
Deininger, K., Ali, D. A., Holden, S., & Zevenbergen, J. (2008). Rural Land Certification in Ethiopia: Process, Initial Impact, and Implications for Other African Countries. [doi: DOI: 10.1016/j.worlddev.2007.09.012]. World Development, 36(10), 1786-1812.
Gonzalez, R. M. (2002). Joint learning with GIS: multi-actor resource management. [Proceedings Paper]. Agricultural Systems, 73(1), 99-111.
Heo, J., Kim, J. H., & Kang, S. (2006). Temporal land information system (TLIS) for dynamically changing cadastral data.
Lemmen and Zevenbergen. (2010). First experiences with high - resolution imagery - based adjudication approach in Ethiopia.
Lemmen, C., & Oosterom, P. v. (2002). Cadastral Systems II. [doi: DOI: 10.1016/S0198-9715(02)00008-X]. Computers, Environment and Urban Systems, 26(5), 355-360.
Liu, X., Zhang, Z., Peterson, J., & Chandra, S. (2007). LiDAR-Derived High Quality Ground Control Information and DEM for Image Orthorectification. GeoInformatica, 11(1), 37-53.
Magigi, W., & Majani, B. B. K. (2006). Community involvement in land regularization for informal settlements in Tanzania: A strategy for enhancing security of tenure in residential neighborhoods. [doi: DOI: 10.1016/j.habitatint.2005.12.002]. Habitat International, 30(4), 1066-1081.
McCall, M. K. (2003). Seeking good governance in participatory-GIS: a review of processes and governance dimensions in applying GIS to participatory spatial planning. [doi: DOI: 10.1016/S0197-3975(03)00005-5]. Habitat International, 27(4), 549-573.
McLaughlin, P. D. a. J. (1999). Land Administration (Oxford University Press ed.). Oxford New York. MINIRENA. (2009). Establishing a Land Administration System for Rwanda: Technical and Economic Analysis,
Washington. MINITERE. (2007). The Need for Reform, Kigali. Müller, D., Wode, B., & Wehr, C. (2003). Manual on Participatory Village Mapping Using Photomaps. Trainer
Guide. Song Da, Vietnam: SFDP - Social Forestry Development Project. National Land Centre. (2009). OPERATIONS MANUAL FOR THE SYSTEMATIC
REGULARISATION OF LAND TENURE IN RWANDA. Kigali. Official Gazette of the Republic of Rwanda. (2005). Organic Law determining the use and management of
land in Rwanda. Official Gazette of the Republic of Rwanda. (2007). National Land Policy. Österberg, M. K. a. K. S. (2006). Rwanda – Kigali City Council (KCC) Cadastral Information System. Rambaldi, G., Chambers, R., McCall, M. K., & Fox, J. (2006). Practical ethics for PGIS practitioners,
facilitators, technology intermediaries, and researchers. Participatory Learning and Action, 54(106-113).
Salzmann, D. M. A. (2002). Do-it-yourself Determination of Cadastral Boundaries: Will GPS make it happen?
Stone, D. (2002). Policy Paradox: The Art of Political Decision Making (W. W. NORTON & COMPANY . NEW YORK . LONDON ed.).
Swedesurvey. (2010). Report for production of orthophoto in Rwanda. Kigali. Törhönen. (2001). Developing land administration in Cambodia. [doi: DOI: 10.1016/S0198-
9715(00)00049-1]. Computers, Environment and Urban Systems, 25(4-5), 407-428.

EVALUATION OF DIGITAL PEN IN DATA CAPTURING FOR LAND ADMINISTRATION PURPOSES IN RWANDA
50
Törhönen, M.-P. (2004). Sustainable land tenure and land registration in developing countries, including a historical comparison with an industrialised country. [doi: DOI: 10.1016/j.compenvurbsys.2003.11.007]. Computers, Environment and Urban Systems, 28(5), 545-586.
UN/ECE. (1996). Land Administration Guidelines. New York and Geneva. Verplanke, J. J. (2004). Combining Mobile GIS and Indigenous Knowledge in Community Managed Forests. Paper
presented at the URISA 3rd Annual Public Participation GIS Conference. Wang, X., Yu, Z., Cinderby, S., & Forrester, J. (2008). Enhancing participation: Experiences of
participatory geographic information systems in Shanxi province, China. [doi: DOI: 10.1016/j.apgeog.2007.07.007]. Applied Geography, 28(2), 96-109.
Weiner, D., & Harris, T. M. (1999). Community-integrated GIS for land reform in South Africa (No. 9907). Morgantown, WV: West Virginia University, Regional Research Institute.
Weiner, D., Harris, T. M., & Craig, W. J. (2002). Community participation and geographic information systems. In W. J. Craig, T. M. Harris & D. Weiner (Eds.), Community Participation and Geographic Information Systems (pp. 3-16). London: Taylor & Francis.
Williamson, I., & Ting, L. (2001). Land administration and cadastral trends -- a framework for re-engineering. [doi: DOI: 10.1016/S0198-9715(00)00053-3]. Computers, Environment and Urban Systems, 25(4-5), 339-366.
EVALUATION OF DIGITAL PEN IN DATA CAPTURING FOR LAND ADMINISTRATION PURPOSES IN RWANDA
51
APPENDIX 1. PLOTTING DIGITAL MAP, DATA COLLECTION AND CORRECTION OF MAPPING MISTAKES
The following are the main steps to plot a map as digital paper, to collect data and to correct the mapping
mistakes after uploading data from digital pen to the computer:
Creating a new line feature class in geodatabase for parcel boundary
Producing a map containing orthophoto to use for collecting data
Adding the legend to the map (line feature for parcel boundary and Capturx markup layer for
annotation)
Printing of a map using Capturx for ArcGIS to get a map as digital paper
Using the legend icon and digital pen to draw feature (parcel boundary) and to write annotation
(parcel ID, or/and mistake done, or other remark) on the map during data collection
After data collection, connecting the pen via USB port to a computer to upload data in ArcGIS,
in the map document (mxd file15)which was used to print the map.
With the digital pen method, there are errors happening in data collection according to the way of using
the map legend during parcels boundaries demarcation. The following are cases of those kind of errors:
Case 1: The use of digital pen in data capturing is done by crosschecking the pen into the legend for both
feature class, and markup layer for annotations, see chapter 5.1.3. It can happen that the operator of digital
pen forgets to check the appropriate feature class item in the legend before drawing some parcels
boundaries. For this case, if the legend has a markup layer, those parcels boundaries are stored in digital
pen as annotations, and they are displayed as such in ArcGIS after uploading data from digital pen to the
computer. In this case the parcels boundaries are not recorded as features. The ArcGIS operator can then
post-digitise the missing parcels boundaries according to the annotations lines. For this case, in the
ArcGIS layers view list, the parcel boundary layer has to be on top of Capturx markup layer. The operator
is then be able to identify easily what are the missing parcels boundaries, and digitise them by following
the annotations lines.
Case 2: As in case 1, the ArcGIS operator can digitise the missing parcels boundaries according to the
annotations lines. In this case, during data collection, recording parcels IDs on map which doesn’t have
Capturx markup layer in legend, it can be done by writing parcels IDs without any checking of the pen in
the legend, digital pen stores automatically the records as annotations. But it would be a constraint when
marking other records such as mistakes and remarks. And when uploading data from digital pen into
ArcGIS, Capturx for ArcGIS desktop will ask to add first Capturx redline/markup layer. After adding
Capturx markup layer, all annotations records are displayed in ArcGIS in the same colour (red colour by
default), so it’s a constraint to make difference between those records.
Case 3: If a map is printed without any legend but as digital paper, and during data collection use digital
pen directly on digital paper (map), thus doing parcels boundaries demarcation without working under any
legend, digital pen stores everything drawn (parcels boundaries) and written (parcels IDs, and other
records such as marking mistakes and/or remarks) as annotations. And when uploading data from digital
pen into ArcGIS, Capturx for ArcGIS desktop will ask to add first Capturx redline/markup layer. After
adding Capturx markup layer, all records are displayed in ArcGIS as annotations, and all in the same
colour (red colour by default). This case combines 2 constraints. The first one is the same as the one
mentioned in the case 2. The second constraint is that to get parcels boundaries as features, this would
require to do post-processing digitisation (vectorisation) for all parcels boundaries demarcated in data
collection. This can be done by following the lines recorded by digital pen as annotations. This would be
time consuming but also it would reduce the accuracy because each parcel boundary redrawn on computer
is not original as it was drawn in the field. Particularly, snapping cannot work with those annotations, as
they are not spatial features that can be snapped to in ArcGIS. When printing digital paper without any
legend, Capturx for ArcGIS Desktop remarks that there seems to be no legend in the layout view, and it
15
mxd file is map file format used by ESRI mapping software, such as ArcMap that is the central application used in ArcGIS.

EVALUATION OF DIGITAL PEN IN DATA CAPTURING FOR LAND ADMINISTRATION PURPOSES IN RWANDA
52
asks the operator to insert a legend from the main menu. But it also asks whether to continue printing
anyhow. When the operator decides to continue printing without any map legend the consequences are as
explained.
The approach to overcome these issues is to produce a map which has both a line feature layer and
annotation layer in the legend, and so even if the operator of digital pen forgets first to crosscheck the pen
into parcel boundary layer in the legend before demarcation of some parcels boundaries, the pen stores
automatically those parcels boundaries as annotations. After uploading data from digital pen to the
computer, the ArcGIS operator can digitise the missing parcels boundaries by following the annotations
lines. This would only happen in case the operator forgets to give a command to digital pen according to
what he/she wants to record, either parcel boundary, or parcel ID, mistake, or remark. This would happen
as human error, but not for all parcels.

EVALUATION OF DIGITAL PEN IN DATA CAPTURING FOR LAND ADMINISTRATION PURPOSES IN RWANDA
53
APPENDIX 2. TESTS FOR DIGITAL PEN FUNCTIONALITIES
Pre-field work test
Before going to field work, different tests were done to test the functionalities of digital pen, to identify
the approach to use in the field for data acquisition, and to check whether the equipments for field work
were in good conditions. The maps were produced and printed as digital paper for use with the digital pen.
These maps were printed on Xerox-WC7435 printer which has print resolution of 1200 * 2400 dpi print
resolution, and which is a post-script capable.
The input data during these tests was Quick bird image (0.60m resolution) of Nyamugali Cell, in Gatsata
Sector/Kigali City, which is one of the LTR trial areas. In these tests, boundaries of imaginary parcels
were drawn on a digital paper and were attributed imaginary parcels IDs. After this, the recorded data
were uploaded from the digital pen to the computer, and displayed in ArcGIS.
After getting familiar with functionalities of the digital pen, and defining which approach to use in the
field, the other boundaries of 32 imaginary parcels were drawn and attributed imaginary parcels IDs. The
digital pen was working properly to record the spatial data and mark the annotations/parcels IDs. These
data were all displayed into ArcGIS and visualised, showing that no record was missing.
Appendix figure 1. Lines drawn and attributed IDs for pre-field work test
Office test during field work
During field work, it was not possible to print orthophoto maps as digital paper on the different printers
available at the field work location/NLC office. The available printers (HP Design Jet 110 plus, HP Office
jet 6300 All-in-one, HP Office jet K 7100) did not comply with Capturx requirements. Even though these
printers have the required print and colour resolution they don’t print the pattern required for digital
paper. Most likely the post-scripts capability is the limiting factor of these printing.

EVALUATION OF DIGITAL PEN IN DATA CAPTURING FOR LAND ADMINISTRATION PURPOSES IN RWANDA
54
The print of map as digital paper was only possible for Xerox Phaser 7500N PS printer which has print
resolution up to 1200 * 1200 dpi print resolution, and which is a post-script capable. During the test done
in the office before taking the maps to the field, other technical issues were raised. The digital pen did not
recognise the pattern on the digital paper. As a consequence the pen was giving signals (vibrations) which
indicate that something is wrong when drawing on the paper. For each vibration signal, it means features
and/or annotations are not stored in the memory of the pen, and therefore cannot be displayed in ArcGIS
after uploading data from the digital pen to the computer.
During this office test, boundaries of imaginary 15 parcels were drawn on digital paper and attributed
imaginary parcels IDs, but after uploading data from the digital pen to the computer, in ArcGIS, almost all
parcels were without boundaries but also without parcels IDs.
Appendix figure 2. Incomplete records related to technical issue of printing digital paper/office test
Despite these technical issues which were occurring, the assessment of practicability of the digital pen
method in P-mapping could be done and it was assessed whether local people can be able to use this geo-
application tool (digital pen) for demarcating parcels boundaries. It was assessed how local people can get
familiar with the process for data acquisition.
Test of the digital pen method in participatory mapping
During field work, in Musezero Cell, 123 parcels were demarcated in the field by para-suveryors, from
parcel number 1200 to parcel number 1322. For the first day, parcels demarcated were from parcel
number 1200 to parcel number 1260, thus 61 parcels, and for the second day, from parcel number 1261 to
parcel number 1322, thus 62 parcels. Among these 123 parcels demarcated in the field by para-suveryors,
digital pen was still giving signals (vibrations) that something was going wrong. Many of the demarcated
parcels boundaries were incomplete, missing segments, and some were missing parcels IDs. The reason
was that the digital pen didn’t store these records even if they were drawn and written on the digital paper.
This was the same issue as during the office test at NLC.

EVALUATION OF DIGITAL PEN IN DATA CAPTURING FOR LAND ADMINISTRATION PURPOSES IN RWANDA
55
Appendix figure 3. Incomplete records related to technical issue of printing digital paper/field work test
It was important to know whether these problems were caused by printing, or for instance by dust, as in
Rwanda different places are not paved, creating dusty roads and in the period of field work it was dry
season. The dust is especially outside, but also it gets in the office through opened windows and doors,
and office materials (printers and papers) are covered by some dust. The assumption here was that the
dust which was in field work area was covering the patterns on printed maps and would reduce the
readability of the pattern on the digital paper by the digital pen.
Another assumption was that the digital pen would have technical problems inside of it, as can happen to
any electronic device, and this would cause vibrations when using digital pen on the digital paper. A test of
all these assumptions was done after field work back in the Netherlands.
Test after field work
After getting back to the Netherlands, new maps were printed by using Capturx compliant printers
(Xerox-WC7435). During this test, the 123 parcels demarcated by para-surveyors in the field were redrawn
and their attributes/parcel IDs were also marked on the maps. This was done by the researcher by
referring to the printed maps used in research field work. The result of this test showed that with maps
printed by using the printer Xerox-WC7435, digital pen was again working well without giving signals
(vibrations). The issues which occurred during field work were therefore not caused by digital pen itself.
In this test, all records (parcels boundaries and parcels numbers) were stored in the memory of the pen,
and were uploaded from digital pen to the computer and be visualised in ArcGIS, no record was missing.

EVALUATION OF DIGITAL PEN IN DATA CAPTURING FOR LAND ADMINISTRATION PURPOSES IN RWANDA
56
Appendix figure 4. Parcels drawn after field work
Another test was to check whether technical issues which occurred during the field work in Rwanda were
caused by dust. So, this test was done by putting dust on maps printed by using the Xerox-WC7435
printer. The dust spread on maps was from three soil types: yellow soil from Spain, löss soil from
Limburg/ the Netherlands, and red soil from Rwanda.
With each dust test the result was the same. The digital pen was working properly without giving signals
(vibrations) that something might be wrong, even if the pen was struggling to go through much dust
which was put on the map (digital paper). The entire map was covered by ample dust, even the legend.
During these tests, boundaries of 33 imaginary parcels were drawn on digital paper for each test, and were
attributed imaginary parcels IDs. All these records were stored in the memory of digital pen, and were
uploaded from digital pen and visualised in ArcGIS, no record was missing, for both parcels boundaries
and their parcels IDs. After all these tests, the results showed that technical problems which happened
during field work were caused by printing issues.
A part from technical issues which happened during field work, a further test was done to check the
usability of digital pen in rainy circumstances. The purpose of this test was to check whether digital pen
can still work on digital paper after being exposed to the rain. This was checked by putting the map (digital
paper) outside in the rain for 10 days. During this time it was raining on the map, and the paper would dry
again when there was sun shine.
Before drawing parcels boundaries and writing parcels IDs, the paper map was first dried under a heater.
On the dry map, boundaries of imaginary 47 parcels were drawn and were attributed imaginary parcels
IDs, and the result was that digital pen was still working well and was storing what was drawn and written
on map. For some few places on the map however, the digital pen was giving signals (vibrations) that
something was wrong. This was related to the places on map where the pattern was damaged by the
exposure to the rain. After uploading data from digital pen to the computer and displaying them in
ArcGIS, almost all parcels boundaries were visualised with their attributes/parcels IDs. Only 4 parcels had

EVALUATION OF DIGITAL PEN IN DATA CAPTURING FOR LAND ADMINISTRATION PURPOSES IN RWANDA
57
a small gap in their line segments, and 5 other parcels IDs were not complete. The missing records
occurred in the places where the digital pen was giving signals (vibrations).

EVALUATION OF DIGITAL PEN IN DATA CAPTURING FOR LAND ADMINISTRATION PURPOSES IN RWANDA
58
APPENDIX 3. OUTPUTS OF FURTHER TESTS FOR PARA-SURVEYORS
As mentioned in chapter 5.2.5. in December 2010 further tests were done for para-surveyors to assess
whether the para-surveyors who were trained on the use of the digital pen method during research field
work of September 2010 could still remember how to use it after a certain time without using it, and
without anyone to show them again how to operate it.
These further tests were parcels boundaries reconstruction of the 123 parcels done during research field
work in Musezero Cell, and another P-mapping in another area, in Kibenga Cell. The following figures
show the outputs of the further tests, respectively the outputs of parcels boundaries reconstruction and
the outputs of parcels boundaries demarcation in P-mapping.
Appendix figure 5. Further test/outputs of parcels boundaries reconstruction

EVALUATION OF DIGITAL PEN IN DATA CAPTURING FOR LAND ADMINISTRATION PURPOSES IN RWANDA
59
Appendix figure 6. Further test/outputs of parcels boundaries demarcation in P-mapping