Embed Size (px)
Citation preview
Evaluation of Energy Saving Measures in Ice Rinks
Master of Science Thesis
KTH School of Industrial Engineering and Management
Energy Technology EGI-2012-xxx
Division of xxx
SE-100 44 STOCKHOLM
Evaluation of Energy Saving
Measures in Ice Rinks
Zhongyuan Zhang
Evaluation of Energy Saving Measures in Ice Rinks
-2-
Master of Science Thesis EGI 2012:xxx
Evaluation of Energy Saving Measures in Ice
Rinks
Zhongyuan Zhang
Approved
2012.8.23
Examiner
Björn Palm
Supervisor at EGI
Samer Sawalha
Supervisor at industry
Jörgen Rogstam
Commissioner
Contact person

Evaluation of Energy Saving Measures in Ice Rinks
-3-
ABSTRACT
Ice rinks are among the biggest energy consuming buildings, which also mean that there is a big potential
to save energy in ice rinks. So far several energy saving measurements have been applied. According to the
heat load share in ice rinks, radiation heat accounts for a major part. One of most practical way to reduced
radiation heat on ice surface is to install a low emissivity factor ceiling to stop the radiation. Many
references (W.Blades, 1992; Laurier Nichols, 2009; Ontario Hydro Technologies, 1999; Jack Vivian, 2008;
Energie Innovation INC, 1992; Manitoba Hydro, 1999; ORFA, 2008) indicated that this kind of ceiling
could reduce the radiation load by 80 to 90%, lights level could be improved by 20% to 50%. But few of
the references have indicated how much energy can be saved in reality usage of low-e ceiling. In this
thesis, low-e ceiling which has been installed in Älta ice rink has been studied and evaluated from two
aspects: how much radiation has been reduced and how much light level has been improved under both
cold and warm periods.
The installation of low-e ceiling has also been analyzed by applying different scenarios according to
different ways to install it and the material has been used as low-e ceiling. In order to analyze the energy
consumption and energy saving measures in Älta ice rink, temperatures has been measured in different
locations by thermal couples and IR sensors. The result calculated from the measurements shows the
radiation to the ice surface calculated in cold and warm periods is reduced by no more than 32% which is
not as much as the reference (Laurier Nichols, 2009)has stated. 10% reduction of total heat load on ice
surface is estimated. The light level is improved by 24% in average. It also shows that it is better to install
low e-ceiling directly attached to the original inner ceiling to avoid increasing ceiling temperature in the
cold period.
The two types of dehumidifiers are studied in this thesis, too. The energy consumption of sorption type
dehumidifier in Älta ice rink and refrigerant type dehumidifier in Norrtälje are calculated and compared.
The energy consumption of Älta ice rink in 2011 is about 150 MWh. The result shows that sorption type
dehumidifier has higher average daily energy consumption in two ice rinks in the studied period. But it
depends on how much air has been treated and other factors; therefore, this thesis gives a general idea
about the energy consumption of dehumidifiers. Controlling of dehumidifier and relationship between the
outdoor air water content and energy consumption in Älta ice rink are discussed. And as a result it is
better to control dehumidifier by water content or dew point of air.
Evaluation of Energy Saving Measures in Ice Rinks
-4-
ACKNOWLEDGMENT
First, I would like to express my deep appreciation and respect to Jörgen Rogstam. Thanks to his support,
the thesis is finished. He is always patient and open to my questions and ideas.
Then I would say thank you to my supervisor in KTH Samer Sawalha who give me so many important
and helpful comments on the thesis.
Special thanks to Professor Eric Granryd, who always helpful when we ran into some difficult problem.
He is wise and always points me a right way to the solution.
The last thanks to my family and friends for their life lasting support!
Evaluation of Energy Saving Measures in Ice Rinks
-5-
Contents
ABSTRACT ................................................................................................................................................................... 3
ACKNOWLEDGMENT ............................................................................................................................................ 4
List of figures ................................................................................................................................................................. 6
List of tables ................................................................................................................................................................... 7
1 Introduction .......................................................................................................................................................... 8
1.1 Objective ...................................................................................................................................................... 8
1.2 Methodology ................................................................................................................................................ 9
1.3 Scope and limitations .................................................................................................................................. 9
2 Background .........................................................................................................................................................10
2.1 Energy system in ice rinks .......................................................................................................................10
2.2 Energy saving measures in ice rinks .......................................................................................................11
3 Evaluation of low-e ceiling ...............................................................................................................................13
3.1 Introduction ...............................................................................................................................................13
3.2 Radiation .....................................................................................................................................................14
3.2.1 Assumptions .....................................................................................................................................15
3.2.2 Calculation model ............................................................................................................................15
3.3 Measurements ............................................................................................................................................17
3.4 Scenarios .....................................................................................................................................................19
3.5 Results and discussion ..............................................................................................................................25
3.6 Light effect .................................................................................................................................................28
3.6.1 Light levels ........................................................................................................................................28
3.6.2 Lighting improvement by low e-ceiling ........................................................................................29
4 Dehumidification ................................................................................................................................................32
4.1 Introduction ...............................................................................................................................................32
4.2 Technologies ..............................................................................................................................................32
4.3 Study cases..................................................................................................................................................33
4.3.1 Älta ice rink-sorption type dehumidification ...............................................................................33
4.3.2 Norrtälje ice rink-refrigeration type dehumidification ...............................................................39
4.4 Discussion ..................................................................................................................................................40
5 Conclusion ...........................................................................................................................................................41
6 Future work .........................................................................................................................................................42
7 Bibliography ........................................................................................................................................................43
8 Appendix .............................................................................................................................................................45

Evaluation of Energy Saving Measures in Ice Rinks
-6-
List of figures
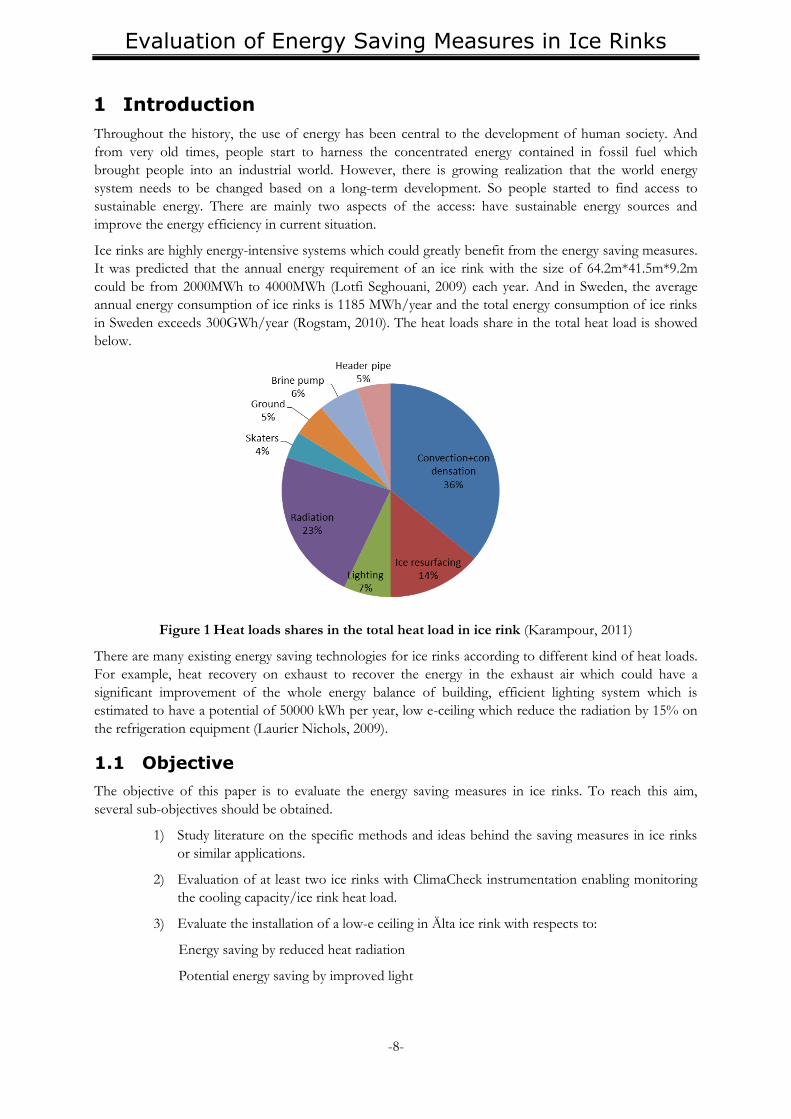
Figure 1 Heat loads shares in the total heat load in ice rink (Karampour, 2011)................................................ 8
Figure 2 Refrigeration plant in ice rink, indirect cooling system (IIHF, 2011) .................................................10
Figure 3 Indirect (left) and direct (right) refrigeration system .............................................................................10
Figure 4 Breakdown of end-use energy consumption in ice rink (Laurier Nichols, 2009) .............................11
Figure 5 Radiation on a grey body surface (D.Manca & M.Rovaglio, 2002) .....................................................13
Figure 6 Älta ice rink with low e-ceiling .................................................................................................................14
Figure 7 Sketch of ice rink .........................................................................................................................................15
Figure 8 Surface resistance to radiation ..................................................................................................................15
Figure 9 Exchange radiation in a two surfaces enclosure .....................................................................................16
Figure 10 Represented network of radiation between three surfaces .................................................................16
Figure 11 Climacheck Basic Instrumentation Configuration ...............................................................................18
Figure 12 Location of temperature measurement equipment ..............................................................................18
Figure 13 Scenarios under different situations .......................................................................................................19
Figure 14 Heat balance over roof .............................................................................................................................20
Figure 15 Mostly used roofing structure in ice rink ...............................................................................................20
Figure 16 Calculated (heat balance over roof) and measured ceiling temperatures for a period between 16th
and 17th June .................................................................................................................................................................22
Figure 17 Ice rink stretch with low e-ceiling installed with gap (Scenario 1 & 2) .............................................22
Figure 18 (Left) connected pipe to support the logger and (right) logger used to measure the air
temperature in gap between original inner ceiling and low e-ceiling ..................................................................23
Figure 19 Calculated (from IR model) and measured ceiling temperature for the period between 24th April
and 1st May ....................................................................................................................................................................24
Figure 20 Ice rink stretch with low e-ceiling installed without gap (Scenario 3 & 4) .......................................24
Figure 21 Radiation load on ice surface in warm period (August) for different scenarios ..............................26
Figure 22 Radiation load on ice surface in cold period (December) for different scenarios ..........................27
Figure 23 Temperature and emissivity factor in different cases ..........................................................................28
Figure 24 Location of measured points in Älta ice rink ........................................................................................30
Figure 25 Light level before installation of low-e ceiling in Älta ice rink ...........................................................30
Figure 26 Light level after installation of low-e ceiling in Älta ice rink ..............................................................30
Figure 27 Principle of desiccant dehumidifier (AXIOM Solution, 2008) ..........................................................32
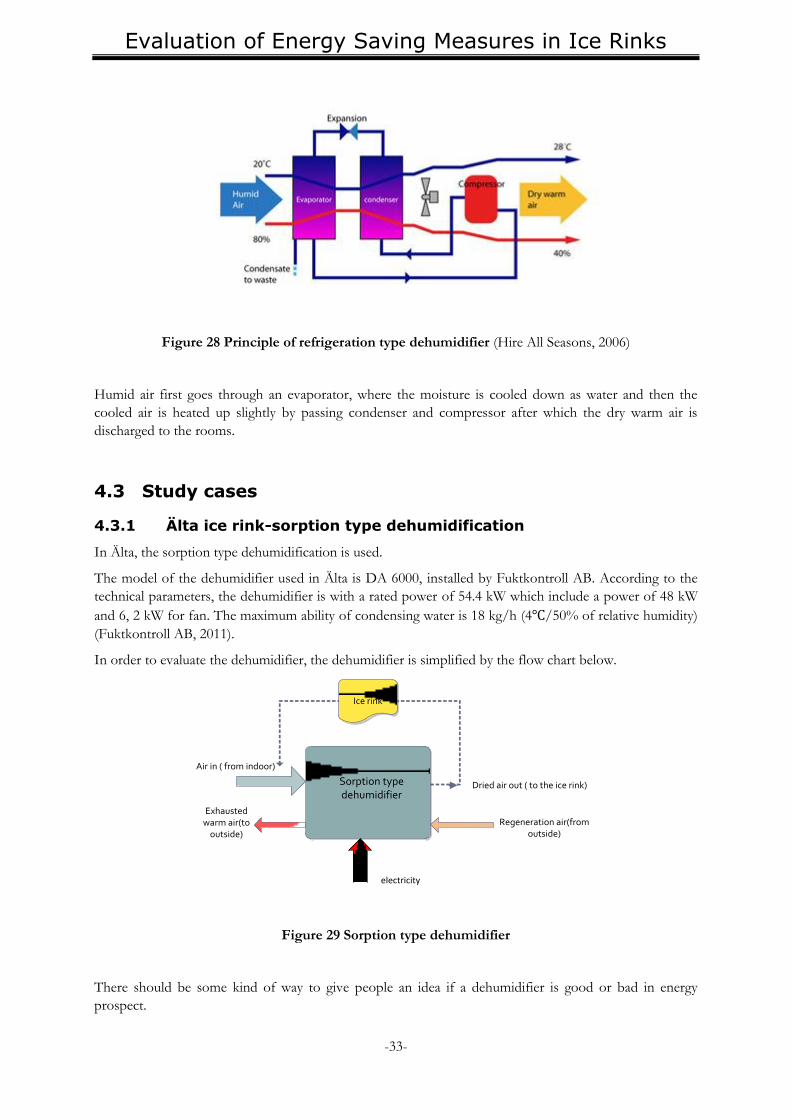
Figure 28 Principle of refrigeration type dehumidifier (Hire All Seasons, 2006) ..............................................33
Figure 29 Sorption type dehumidifier ......................................................................................................................33
Figure 30 Monthly energy consumption of dehumidifier in Älta ice rink..........................................................34
Figure 31 Moisture load from indoor and outdoor in ice rink ............................................................................35
Figure 32 Energy consumption of dehumidifier for different outdoor water content in the period from 1st
October to 31st January ..............................................................................................................................................36
Figure 33 Water content of indoor air in Älta ice rink for the period from 1st to 31st October ..................36
Figure 34 Water content of indoor air in Älta ice rink for the period from 1st to 31st January ....................37
Figure 35 Energy consumption of dehumidifier when indoor air has the same water content as outdoor air
........................................................................................................................................................................................38
Figure 36 Refrigeration type dehumidifier in Norrtälje.........................................................................................39
Figure 37 Daily energy consumption of sorption type and refrigeration type dehumidifiers ........................40
Evaluation of Energy Saving Measures in Ice Rinks
-7-
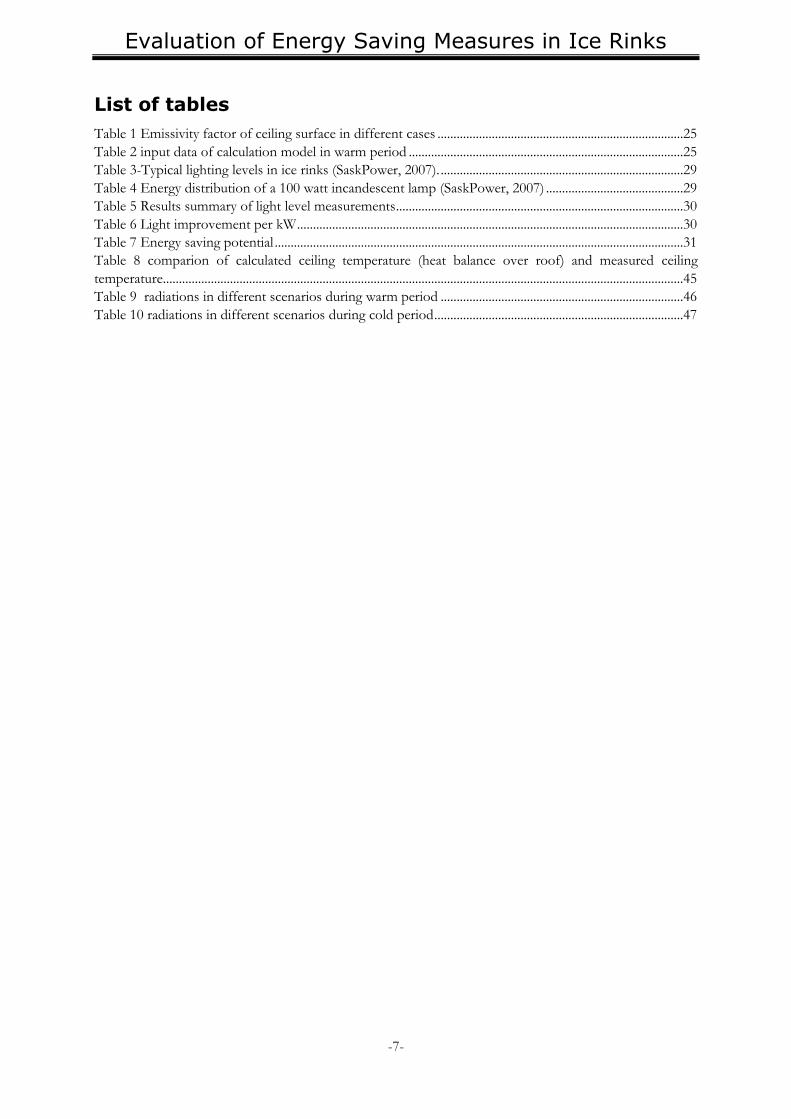
List of tables
Table 1 Emissivity factor of ceiling surface in different cases .............................................................................25
Table 2 input data of calculation model in warm period ......................................................................................25
Table 3-Typical lighting levels in ice rinks (SaskPower, 2007). ............................................................................29
Table 4 Energy distribution of a 100 watt incandescent lamp (SaskPower, 2007) ...........................................29
Table 5 Results summary of light level measurements ..........................................................................................30
Table 6 Light improvement per kW .........................................................................................................................30
Table 7 Energy saving potential ................................................................................................................................31
Table 8 comparion of calculated ceiling temperature (heat balance over roof) and measured ceiling
temperature ...................................................................................................................................................................45
Table 9 radiations in different scenarios during warm period ............................................................................46
Table 10 radiations in different scenarios during cold period ..............................................................................47
Evaluation of Energy Saving Measures in Ice Rinks
-8-
1 Introduction
Throughout the history, the use of energy has been central to the development of human society. And
from very old times, people start to harness the concentrated energy contained in fossil fuel which
brought people into an industrial world. However, there is growing realization that the world energy
system needs to be changed based on a long-term development. So people started to find access to
sustainable energy. There are mainly two aspects of the access: have sustainable energy sources and
improve the energy efficiency in current situation.
Ice rinks are highly energy-intensive systems which could greatly benefit from the energy saving measures.
It was predicted that the annual energy requirement of an ice rink with the size of 64.2m*41.5m*9.2m
could be from 2000MWh to 4000MWh (Lotfi Seghouani, 2009) each year. And in Sweden, the average
annual energy consumption of ice rinks is 1185 MWh/year and the total energy consumption of ice rinks
in Sweden exceeds 300GWh/year (Rogstam, 2010). The heat loads share in the total heat load is showed
below.
Figure 1 Heat loads shares in the total heat load in ice rink (Karampour, 2011)
There are many existing energy saving technologies for ice rinks according to different kind of heat loads.
For example, heat recovery on exhaust to recover the energy in the exhaust air which could have a
significant improvement of the whole energy balance of building, efficient lighting system which is
estimated to have a potential of 50000 kWh per year, low e-ceiling which reduce the radiation by 15% on
the refrigeration equipment (Laurier Nichols, 2009).
1.1 Objective
The objective of this paper is to evaluate the energy saving measures in ice rinks. To reach this aim,
several sub-objectives should be obtained.
1) Study literature on the specific methods and ideas behind the saving measures in ice rinks
or similar applications.
2) Evaluation of at least two ice rinks with ClimaCheck instrumentation enabling monitoring
the cooling capacity/ice rink heat load.
3) Evaluate the installation of a low-e ceiling in Älta ice rink with respects to:
Energy saving by reduced heat radiation
Potential energy saving by improved light

Evaluation of Energy Saving Measures in Ice Rinks
-9-
4) Experimentally evaluate dehumidification methods in ice rinks: Sorption type &
Refrigeration type, and develop a quick method to do an onsite status check of a
dehumidifier
1.2 Methodology
The methodology has been divided into several steps according to the objectives. The thesis work will
start with the literature review of ice rink design technologies and existing saving technologies used in this
area. The obtained theoretical information will be complemented with the Swedish ice rinks’ inventory
results, obtained during the realization of “StoppSladd” project.
All the acquired information will be analyzed using qualitative methods. The analysis results will be
supplemented with the experimental studies in order to define most promising energy saving methods.
Finally both the experimental data and analysis results will be used to identify the energy saving actions
and potential.
1.3 Scope and limitations
In this paper, the ice rink is studied from the energy aspect and the main interest lies in the refrigeration
system. Two main parts are discussed: low emissivity ceiling (low-e ceiling) installed in Älta ice rink and
dehumidification in both Älta and Norrtälje ice rink. Because the measurement before installation of low-
e ceiling is only available in June 2011 so there is no exactly parallel data to compare. So the data is
compared with the later month August 2011. For the dehumidification part the measurement of air goes
in and out of the dehumidifier is lack. So the technical parameters are used for calculation. The
measurements for the condensed water flow are not reliable because of certain technical problem related
to piping, so only the daily energy consumption is used to compare the two different types of
dehumidifier.
Evaluation of Energy Saving Measures in Ice Rinks
-10-
2 Background
2.1 Energy system in ice rinks
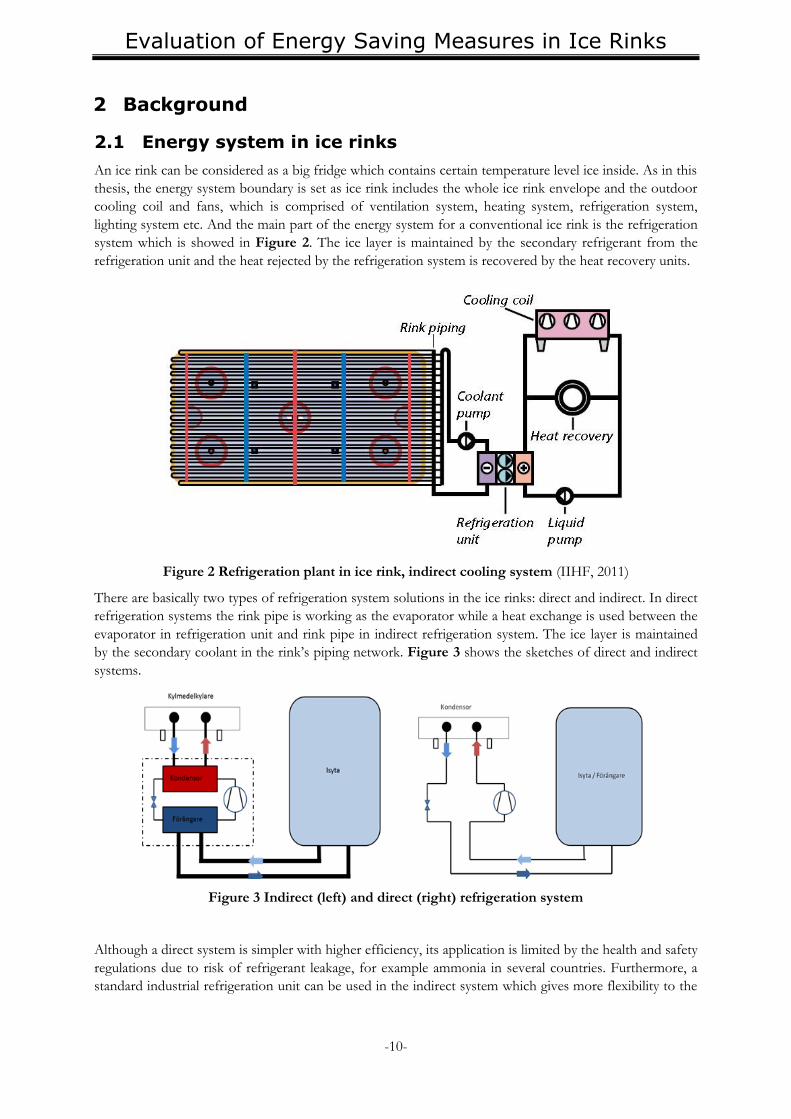
An ice rink can be considered as a big fridge which contains certain temperature level ice inside. As in this
thesis, the energy system boundary is set as ice rink includes the whole ice rink envelope and the outdoor
cooling coil and fans, which is comprised of ventilation system, heating system, refrigeration system,
lighting system etc. And the main part of the energy system for a conventional ice rink is the refrigeration
system which is showed in Figure 2. The ice layer is maintained by the secondary refrigerant from the
refrigeration unit and the heat rejected by the refrigeration system is recovered by the heat recovery units.
Figure 2 Refrigeration plant in ice rink, indirect cooling system (IIHF, 2011)
There are basically two types of refrigeration system solutions in the ice rinks: direct and indirect. In direct
refrigeration systems the rink pipe is working as the evaporator while a heat exchange is used between the
evaporator in refrigeration unit and rink pipe in indirect refrigeration system. The ice layer is maintained
by the secondary coolant in the rink’s piping network. Figure 3 shows the sketches of direct and indirect
systems.
Figure 3 Indirect (left) and direct (right) refrigeration system
Although a direct system is simpler with higher efficiency, its application is limited by the health and safety
regulations due to risk of refrigerant leakage, for example ammonia in several countries. Furthermore, a
standard industrial refrigeration unit can be used in the indirect system which gives more flexibility to the

Evaluation of Energy Saving Measures in Ice Rinks
-11-
choice of refrigerants (IIHF, 2011). Ice rinks nowadays are built with an indirect refrigeration system
mostly.
2.2 Energy saving measures in ice rinks
Considering that ice rinks are usually intensive energy consumers, the potential for energy saving might be
considerable. According to (Laurier Nichols, 2009) in ASHRAE, a general survey showed that the
standard energy consumption in Quebec, Canada is 1500000 kWh/year. And the most efficient arenas are
consuming 8000000 kWh/year while the less efficient ones consuming 2 times energy as the efficient
ones. Different kinds of energy saving measures can be carried out according to different sections of the
break down energy consumption. A breakdown of the end-use energy consumption is showed in the
Figure 4 (Laurier Nichols, 2009).
Figure 4 Breakdown of end-use energy consumption in ice rink (Laurier Nichols, 2009)
a) Heating
Heating which represents one of the biggest single energy consumption is also the biggest potential of
energy saving.
Adjusting air temperature
The air temperature inside ice rink varies a lot from areas to areas. In the auditorium area, the air should
be warm for people watching games there, but in the ice arena the air temperature should not be so high
which will add heat load for refrigeration system. So it is very important to have a suitable air temperature
to avoid having high load both in heating and refrigeration systems.
Heat recovery
As an average, more than 2000 kWh of heat is generated by the ice plant each day. This amount of energy
is more than enough for the daily heating requirements (E Source, 2010). If all this exhaust heat is
gathered and re-used, there will be a significant reduction of energy consumption in heating. In addition of
space heating, the recovered heat can also be used for the subfloor heating, hot water for re-surfacing and
dehumidification.
b) Refrigeration system

Evaluation of Energy Saving Measures in Ice Rinks
-12-
Ice plant, which comprise of refrigeration system and piping system, is the second largest energy
consumption. And it is the main consumption for electricity in ice rinks.
Ice thickness
The ice should be thick enough to support the skaters. But if it is too thick, the refrigeration system will
be working more than necessary and energy will be wasted. So it is necessary to optimize the thickness of
ice.
Add variable-frequency drives (VFDs)
The motor output will be matched to the real rime load, which could reduce the energy consumption of
brine pump and condenser by reducing the pump speed when possible.
Improving the water quality
Less pure of water used for making ice, lower temperature is required to freeze. Salts in water will lower
the natural freezing temperature of water, which requires lower brine temperature, using more energy.
The purity of water is critical to the ice quality, too. The ice made of impure water breaks up more easily.
Low emissivity ceilings
Radiation from ceiling to ice rink is a major heat load on refrigeration system (nearly 30%), which give a
large potential for reducing heat load. By installing ceiling with low emissivity factor, the load from ceiling
can be reduced significantly as well as the improvement of lighting inside ice rink.
c) Lighting system
Improving lighting system is an easy and inexpensive way to reduce the energy consumption.
Change light intensive
Change the light intensive with the activities taking place. Some professional hockey games may require
high intensive of light but not for the normal ice skating. So adopting the lights to the activities could
reduce the energy consumption of lighting system as well as reducing the load on ice pad.
Upgrade lamps
Use better fluorescent lamps such as high-performance T8 lamp system which can improve the lighting by
70-80% compared to T12 system.
Evaluation of Energy Saving Measures in Ice Rinks
-13-
3 Evaluation of low-e ceiling
3.1 Introduction
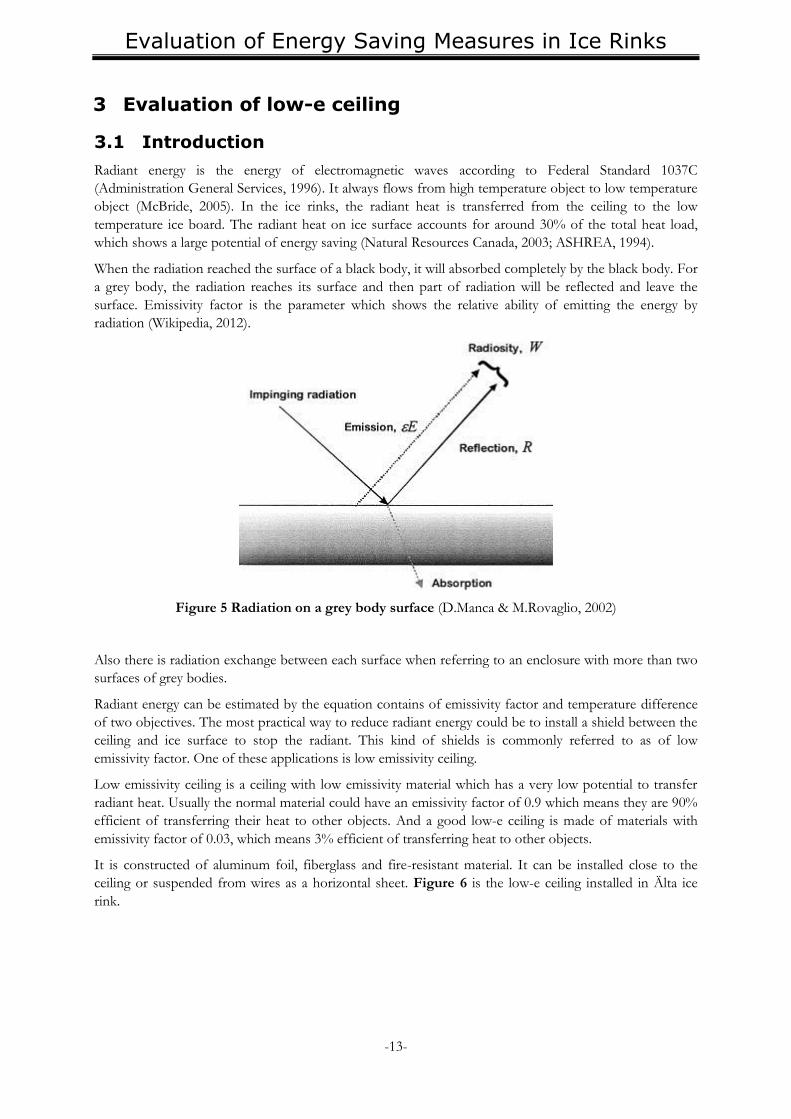
Radiant energy is the energy of electromagnetic waves according to Federal Standard 1037C
(Administration General Services, 1996). It always flows from high temperature object to low temperature
object (McBride, 2005). In the ice rinks, the radiant heat is transferred from the ceiling to the low
temperature ice board. The radiant heat on ice surface accounts for around 30% of the total heat load,
which shows a large potential of energy saving (Natural Resources Canada, 2003; ASHREA, 1994).
When the radiation reached the surface of a black body, it will absorbed completely by the black body. For
a grey body, the radiation reaches its surface and then part of radiation will be reflected and leave the
surface. Emissivity factor is the parameter which shows the relative ability of emitting the energy by
radiation (Wikipedia, 2012).
Figure 5 Radiation on a grey body surface (D.Manca & M.Rovaglio, 2002)
Also there is radiation exchange between each surface when referring to an enclosure with more than two
surfaces of grey bodies.
Radiant energy can be estimated by the equation contains of emissivity factor and temperature difference
of two objectives. The most practical way to reduce radiant energy could be to install a shield between the
ceiling and ice surface to stop the radiant. This kind of shields is commonly referred to as of low
emissivity factor. One of these applications is low emissivity ceiling.
Low emissivity ceiling is a ceiling with low emissivity material which has a very low potential to transfer
radiant heat. Usually the normal material could have an emissivity factor of 0.9 which means they are 90%
efficient of transferring their heat to other objects. And a good low-e ceiling is made of materials with
emissivity factor of 0.03, which means 3% efficient of transferring heat to other objects.
It is constructed of aluminum foil, fiberglass and fire-resistant material. It can be installed close to the
ceiling or suspended from wires as a horizontal sheet. Figure 6 is the low-e ceiling installed in Älta ice
rink.

Evaluation of Energy Saving Measures in Ice Rinks
-14-
Figure 6 Älta ice rink with low e-ceiling
Several related references have announced that low emissivity ceiling has significant effect on reducing
radiant heat load on ice surface. It shows 15% to 30% of energy saving on refrigerant equipment and 80%
to 90% of the original radiant heat load (W.Blades, 1992; Laurier Nichols, 2009; Ontario Hydro
Technologies, 1999; Jack Vivian, 2008; Energie Innovation INC, 1992; Manitoba Hydro, 1999; ORFA,
2008). It is also said that the light levels in the ice rink could be improved by 20% to 50% after the
installation of low-e ceiling (ICECO, 2009; W.Blades, 1992).
But few of the references have referred to the details of how much energy could be saved by the low-e
ceiling in practical use. In this report, the practical energy saved by low-e ceiling will be evaluated in two
aspects: reduction in radiation and improvement of illumination. This could illustrate the practical effects
of low-e ceiling in ice rinks and give a more specific understanding of low-e ceiling.
3.2 Radiation
The main contribution of low e-ceiling is to reduce the thermal radiation from ceiling to ice surface. In
order to calculate the radiation from ceiling, a calculation model is built. Ice rink is considered as an
enclosure with three surfaces (Figure 7).

Evaluation of Energy Saving Measures in Ice Rinks
-15-
Ceiling(2)
Wall(3)
Ice board(1)
Figure 7 Sketch of ice rink
As a multiple surfaces case, there are radiation exchanges between each surface. The radiation heat
transferred to the ice board is from both ceiling and walls.
3.2.1 Assumptions
In order to simplify the problem, the walls are considered as one piece black body (surface 3), and the
curved ceiling (surface 2) is hanging above the ice board (surface 1).
3.2.2 Calculation model
For a three surfaces enclosure, the radiation exchange between surfaces is complicated. The net radiation
exchange at a surface is the rate at which the energy is transferred to the surface to maintain it at a
constant temperature. The net radiation can be expressed by the following equation:
Net radiation on a grey body surface
(P.Incropera & Witt, 1990)
Radiation resistance:
Where, is the emissive power, is the radiosity over the surface which is the term accounts all the
energy leave the surface, is the emissivity factor, is the area of the surface.
This could be represented by the network element of Figure 8.
Figure 8 Surface resistance to radiation

Evaluation of Energy Saving Measures in Ice Rinks
-16-
Considering two surfaces in an enclosure the exchange radiation between them can be expressed by the
following equation and can be represented by the net elements also.
Where, is the area of surface, is the view factor between two surfaces.
Figure 9 Exchange radiation in a two surfaces enclosure
And the exchange radiation of the surface should be equal to the net radiation which gives following
expression.
∑
As in the ice rink case, there are three surfaces which could be represented by the network below.
Figure 10 Represented network of radiation between three surfaces
And referring to the rule of radiation exchange between surfaces, for surface 1

Evaluation of Energy Saving Measures in Ice Rinks
-17-
Where,
is the area of ice rink
is the view factor between walls and ice board which could be calculated by the internal function in
EES.
Radiation exchange between surfaces, for surface 2
Where
And by using equation (2) and (3), and can be solved. Put into equation (1), the radiation
transferred from the other surfaces can be calculated.
The exchange radiation between ceiling and ice surface can be calculated by the following equation
The radiation from ceiling is
And the radian from walls is
3.3 Measurements
In order to evaluate the whole energy system in ice rink, extensive measurements have been carried out.
First emissivity factor of low-e-material is measured. It was laboratory tested (Svedung, 2011) and the
results showed the low-e-material has an emissivity factor of 0.26.
Referring to the temperature measurements, the temperature of ice surface and ceiling are measured by
two IR sensors bonded together located on the bar 7.5 m above the ice surface. There is also a
temperature sensor underneath the ice. The data of the rest parameters needed are read from ClimaCheck
which is based on an information system integrated with different measurements in ice rink.. It is used to
inspect the performance of refrigeration system. For a simple refrigeration system (Figure 11), the
performance of system is determined by the data from seven temperature sensors, two pressure sensors
and one electrical meter.

Evaluation of Energy Saving Measures in Ice Rinks
-18-
Figure 11 Climacheck Basic Instrumentation Configuration
The section view of the ice rink is showed below. The location of temperature measurements are marked
with red boxes in Figure 12.
Figure 12 Location of temperature measurement equipment
The IR sensor used is Exergen IRT/C.01-K-80F/27C which is a pre-calibrated sensor normally used for
the temperature range of 0-30℃ with a field of view of 1:1. The measured ceiling temperature is between
2 to 20℃ and that of ice surface is roughly between -3 to -1℃ which means it is not in the usual
temperature range of sensor. So correction of temperature is required. And the emissivity factor of the IR
sensor used are pre-set as 0.9.

Evaluation of Energy Saving Measures in Ice Rinks
-19-
3.4 Scenarios
In order to study the effect of low e-ceiling for the whole year, both warm and cold periods in Stockholm
are studied. The data from August is used to represent the warm period and December for cold period.
The data from June is the only data available before the installation of low e-ceiling so it is also analyzed as
a reference.
Even if you have a very good product, you will not get any benefits from it unless you use it properly. It is
the same with low-e ceiling, how it is going to be installed is very important.
Where to install the low-e material after buying will make some differences when it comes to the energy
aspect. Usually there are two situations: install the low-e ceiling with gap between the ice rink original
ceiling and the low-e ceiling or installed it directly attached to original ceiling. Also there are differences
among ice rinks, some are with good insulation and others are not. In order to find out the best way to
install the low-e ceiling in ice rinks, several scenarios are discussed in the following figure (see the scenario
tree below). All of scenarios will be discussed in the report.
Figure 13 Scenarios under different situations
In base case, the ice rink is the one before installation of low-e ceiling. Base case is used as a reference.
The original inner ceiling has an emissivity of 0.9. According to calculation model, the ceiling temperature
is required but the data of directly measured ceiling temperature in this case is only available in June. The
period chosen is August and December. So the ceiling temperatures in base case are calculated by the heat
balance over ceiling (Figure 14) in both warm period (August) and cold period (December). The heat
balance includes radiation between ceiling and ice, transmission between ceiling and outdoor air and
convection between ceiling and indoor air.

Evaluation of Energy Saving Measures in Ice Rinks
-20-
Figure 14 Heat balance over roof
It is worth mentioning that transmission in Figure 14 could be in the opposite direction depends on the
temperature of outdoor air. It is showed by the sign of its value in calculation equation.
Most used roofing structures consist of the following layers (IIHF, 2011):
• Profiled, load bearing steels sheets
• Vapor barrier
• Thermal insulation (10 cm to 15 cm rock wool)
• Water insulation
Figure 15 Mostly used roofing structure in ice rink
The elements of heat balance across the roof are calculated in the following text:
Radiation
[(
)
(
)
]
is the black body radiation factor,5.67 (
)
is the ceiling radiation factor ,
Evaluation of Energy Saving Measures in Ice Rinks
-21-
(Base case)
(Case 3)
(Case 4)
is the ceiling radiation factor , ,
Transmission
∑
Where, is thickness of the insulation of roof: estimated as 0.18 m
,thermal conductivity (rock wool): 0.045 W/m.K (The Engineering Toolbox, 2012).
, Outside Heat transfer coefficient of roof with unit of , this value is the heat transfer
coefficient between outside surface of ceiling and air velocity according to (ASHERA, 2010)
The outdoor temperature is read from ClimaCheck.
Convection
The indoor temperature is the air temperature in IR position, which is closest measurement of air
temperature to inner ceiling,
Inner ceiling temperature calculation:
As combining all the above equations together, the inner ceiling temperature can be obtained.
4 4
'* *1 100 100
1
ceilingout iceinner inner
j
j out
ceilingj
inner
j out
Tt Tt C
s
ts
(Wilhelm Wienrich, 2012)
In order to verify the model, the ceiling temperature calculated by this equation is compared to the data in
June, which is measured directly. The results are showed in Figure 16. From the results, one can say the
model fits well with measurements. So this will be used to calculate the temperature of low e-ceiling in
case 3 and 4 in Figure 13.

Evaluation of Energy Saving Measures in Ice Rinks
-22-
Figure 16 Calculated (heat balance over roof) and measured ceiling temperatures for a period
between 16th and 17th June
In case 1 and 2, low e-ceiling is installed with gap between the original inner ceiling of ice rink and low
e-ceiling (Figure 17), which is the really situation in Älta now. The material of low-e ceiling in use now has
an emissivity factor of 0.26 in case 1 and an alternative material available with emissivity factor of 0.04 is
also studied here in case 2. The ceiling temperature is measured by the IR sensor which needs to be
corrected because of the mismatch of emissivity factor between IR sensor and low e-ceiling.
Walls(3)
Ice board(1)
Low e-ceiling(2)
Original ceiling
Figure 17 Ice rink stretch with low e-ceiling installed with gap (Scenario 1 & 2)
In order to correct the temperature from the data read from the IR sensor, a model named IR model is
built.

Evaluation of Energy Saving Measures in Ice Rinks
-23-
There are two ways to calculate radiation: by use the physical temperature or readings from IR sensor. But
the radiation calculated by both ways should be the same, so the following equations are obtained.
4 4
4 4
( ) ( ) ( ( ) ( ))
( )
( )
radiation ceiling ci ceiling ice
radiation ceiling ci ceiling ice
radiation radiation
Q IR A f IR T IR T IR
Q A f T T
Q IR Q
Where is the radiant temperature measured by IR sensor
is the physical temperature of ceiling
is estimated 1 degree higher than the ice temperature measured by ClimaCheck. Several pots on the
ice surface were measured and the result shows that the average ice surface temperature is 1°C higher than
that measured by ClimaCheck.
is the gray body configuration factor obtained when the emissivity factor of ceiling and ice are
both set as 1
is the gray body configuration factor obtained when use the real emissivity factor of ceiling and ice
surface(0.95)
In order to make sure that these theoretical estimations is all working in reality, the air temperature in the
gap between the low-e ceiling and really ceiling was measured by inserting a logger into the gap for a
period. And position of the logger was very close to the ceiling, so the air temperature measured there
could be considered as the same as that of the low-e ceiling in a stable situation. Figure 18 shows some
equipment to get access to the gap.
Figure 18 (Left) connected pipe to support the logger and (right) logger used to measure the air
temperature in gap between original inner ceiling and low e-ceiling
The calculated low-e ceiling surface temperature was compared with the measured temperature and the
result is showed in Figure 19. The result comes out that the calculated ceiling temperature is almost the
same as the air gap temperature, which means that assumptions are correct in this situation.

Evaluation of Energy Saving Measures in Ice Rinks
-24-
Figure 19 Calculated (from IR model) and measured ceiling temperature for the period between
24th April and 1st May
In case 3 and 4, low e-ceiling is directly attached to the inner ceiling of ice rink (Figure 20). There two
cases are studied to know what the effect of the gap between original ceiling and low-e ceiling is. In these
two cases, the ceiling temperature is calculated from the heat balance over ice rink roof.
Walls(3)
Ice board(1)
Low e-ceiling(2)
Original ceiling
Figure 20 Ice rink stretch with low e-ceiling installed without gap (Scenario 3 & 4)
Evaluation of Energy Saving Measures in Ice Rinks
-25-
The table below shows the summary list of sources for the input parameters. The ice surface temperatures
are all the same in all cases which is 1℃ plus the ice temperature reading from ClimaCheck. The air
temperature measured by the logger sitting 7.5m above ice surface is applied as the wall temperature in all
cases. The emissivity factor of ice surface is 0.95.
Table 1 Emissivity factor of ceiling surface in different cases
SCENARIOS Ceiling surface temperature Emissivity factor of ceiling surface
Base case Calculated from heat balance over ceiling 0.9
1 Calculated from IR model 0.26
2 Calculated from IR model 0.04
3 Calculated from heat balance over ceiling 0.26
4 Calculated from heat balance over ceiling 0.04
All these scenarios will be applied by using data in June (before installation of low e-ceiling), August
(warm outdoor condition), December (cold outdoor condition) to find the effects under different
conditions.
3.5 Results and discussion
By using the calculation model, the radiation load on ice surface was obtained in different scenarios under
different period. The radiation reached the ice surface comes from ceiling and walls, so the radiation from
ceiling and walls was also calculated.
A. Warm period (August)
In this period, the measured data from 10th August to 19th August 2011 were used. The temperature data
from different sensors are with different intervals. In order to unify that, an hourly average data is used to
calculate the results.Figure 21 Radiation load on ice surface in warm period (August)
The input data are listed in the table below:
Table 2 input data of calculation model in warm period
Input data
Outdoor temperature Wall temperature
Ice surface temperature Temperature reading from IR sensors
Ice rink indoor temperature Ice surface, low e-ceiling emissivity factors
Figure 21 shows the results of the average radiation load on ice surface of each hour in that period.

Evaluation of Energy Saving Measures in Ice Rinks
-26-
Figure 21 Radiation load on ice surface in warm period (August) for different scenarios
The result shows that the total radiation load on ice surface was reduced in all the cases referring base case
as a reference. In August (base case) the radiation load is slightly higher than in June which is due to the
higher outdoor temperature in August.
According to the results of case 1 and 2, when the emissivity factor is reduced from 0.9 to 0.26, the total
radiation load is reduced by 17% and by 32% with 0.04, which is not as significant as expected. And the
results of case 3 and case 4 are more or less the same as that of case 1 and case2, which means that the gap
between the low-e ceiling and original inner ceiling is not that effective to the whole situation when it is
warm outside.
As it can be observed from Figure 21, it is reduced significantly. In case 1 and 2, when the emissivity
factor is reduced from 0.9 to 0.26, the radiation of ceiling is reduced by 48%. And if emissivity factor is
reduced further to 0.04 in case 4, the radiation of ceiling is reduced by 92% which means there is almost
no net radiation of ceiling. But the total radiation load is not reduced that much. So it is worth mentioning
that the radiation of walls is playing a very important role here.
When to look at the radiation of walls in base case, case 1 and case 2 in Figure 21, the portion of radiation
of walls are increased drastically while the emissivity factor of ceiling is reducing. And it shows the same
pattern when comparing the base case and case 3, 4. More than 90% of the radiation load comes from
walls when the emissivity factor of ceiling is 0.04.
B. Cold period(December)
The cold period results are calculated from the data from 1st to 31st of December. The input data is
processed in the same way as in the warm period. The input parameters are also the same as warm period.
Figure 22 shows the radiation load on ice surface in cold period (December).

Evaluation of Energy Saving Measures in Ice Rinks
-27-
Figure 22 Radiation load on ice surface in cold period (December) for different scenarios
The result in cold period in Figure 22 shows that there is not much reduction while the emissivity factor
reduces. When the low-e ceiling is installed with a gap between it and original inner ceiling, the radiation
load on ice surface is actually increased as well as the net radiation of ceiling surface in case 1. Even in case
2 that the emissivity factor of ceiling is reduced to 0.04, the total radiation load is only reduced by 11%.
The result is probably due to very low outdoor temperature.
The total radiation load is reduced slightly by installing low-e ceiling attached directly to the original inner
ceiling but the reduction is only 4% with ceiling emissivity factor of 0.26 in case 3 and 14% with 0.04 in
case 4.
All these can be explained by the calculation model has been used. There are two main factors affecting
the radiation: the temperature difference between two surfaces which can be considered as the driving
force for transferring the radiation heat and the emissivity factor of surfaces which could be considered as
the ability of radiation heat transferring.
In the base case, the ceiling surface temperature is calculated according to the heat balance over roof, so
when the outdoor temperature is very low, the inner ceiling surface temperature is very low too. But in
case 1, there is an air gap between original inner ceiling and low-e ceiling; this could form a layer of
insulation for low-e ceiling which makes the surface temperature of low-e ceiling not affected much by the
outdoor climate, so it is higher in case 1 than in base case. On other side, the radiation transferring
capacity of ceiling surface (the emissivity factor) is reduced. But the reduction of radiation transferring
capacity cannot cover the increase of drive force (temperature difference between two surfaces), so the
total radiation load is increased (Figure 23).
Evaluation of Energy Saving Measures in Ice Rinks
-28-
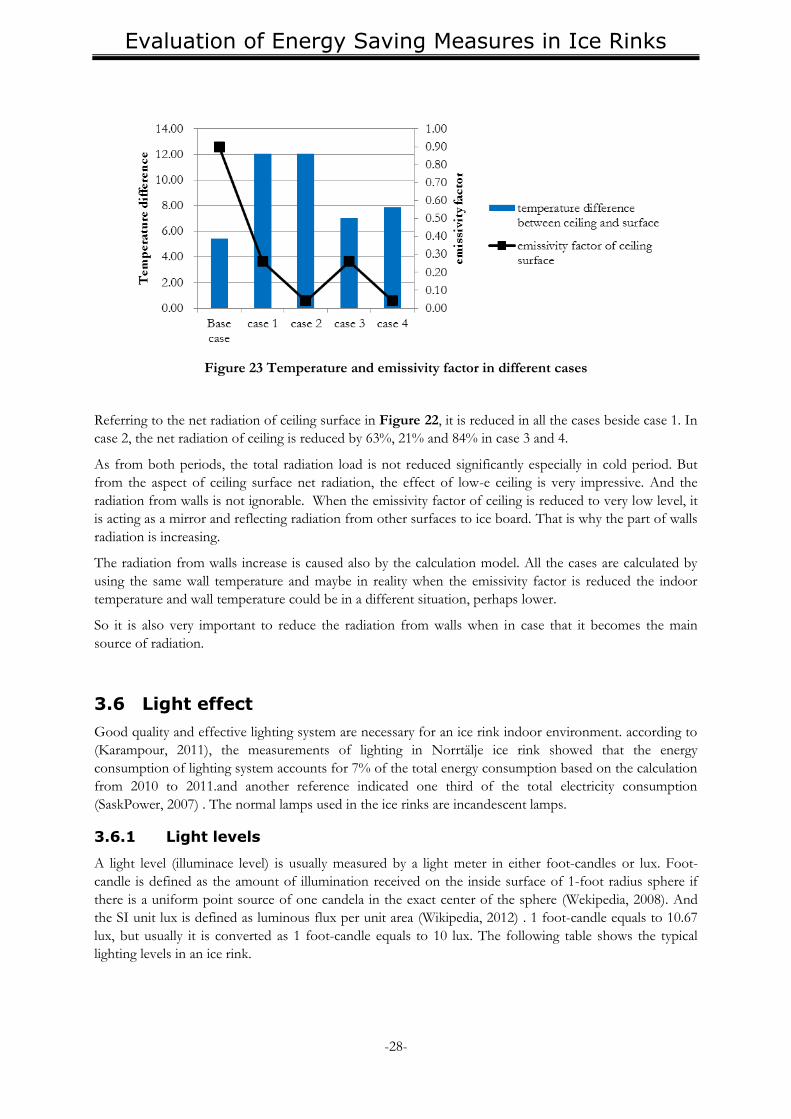
Figure 23 Temperature and emissivity factor in different cases
Referring to the net radiation of ceiling surface in Figure 22, it is reduced in all the cases beside case 1. In
case 2, the net radiation of ceiling is reduced by 63%, 21% and 84% in case 3 and 4.
As from both periods, the total radiation load is not reduced significantly especially in cold period. But
from the aspect of ceiling surface net radiation, the effect of low-e ceiling is very impressive. And the
radiation from walls is not ignorable. When the emissivity factor of ceiling is reduced to very low level, it
is acting as a mirror and reflecting radiation from other surfaces to ice board. That is why the part of walls
radiation is increasing.
The radiation from walls increase is caused also by the calculation model. All the cases are calculated by
using the same wall temperature and maybe in reality when the emissivity factor is reduced the indoor
temperature and wall temperature could be in a different situation, perhaps lower.
So it is also very important to reduce the radiation from walls when in case that it becomes the main
source of radiation.
3.6 Light effect
Good quality and effective lighting system are necessary for an ice rink indoor environment. according to
(Karampour, 2011), the measurements of lighting in Norrtälje ice rink showed that the energy
consumption of lighting system accounts for 7% of the total energy consumption based on the calculation
from 2010 to 2011.and another reference indicated one third of the total electricity consumption
(SaskPower, 2007) . The normal lamps used in the ice rinks are incandescent lamps.
3.6.1 Light levels
A light level (illuminace level) is usually measured by a light meter in either foot-candles or lux. Foot-
candle is defined as the amount of illumination received on the inside surface of 1-foot radius sphere if
there is a uniform point source of one candela in the exact center of the sphere (Wekipedia, 2008). And
the SI unit lux is defined as luminous flux per unit area (Wikipedia, 2012) . 1 foot-candle equals to 10.67
lux, but usually it is converted as 1 foot-candle equals to 10 lux. The following table shows the typical
lighting levels in an ice rink.
Evaluation of Energy Saving Measures in Ice Rinks
-29-
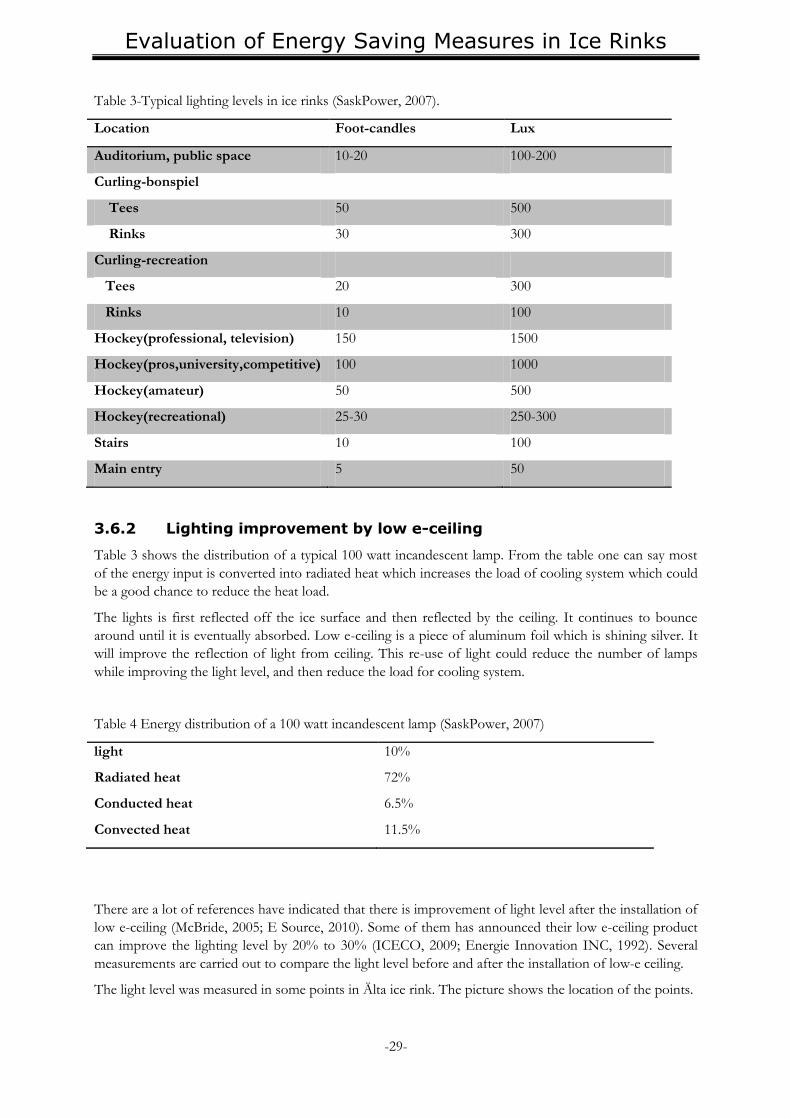
Table 3-Typical lighting levels in ice rinks (SaskPower, 2007).
Location Foot-candles Lux
Auditorium, public space 10-20 100-200
Curling-bonspiel
Tees 50 500
Rinks 30 300
Curling-recreation
Tees 20 300
Rinks 10 100
Hockey(professional, television) 150 1500
Hockey(pros,university,competitive) 100 1000
Hockey(amateur) 50 500
Hockey(recreational) 25-30 250-300
Stairs 10 100
Main entry 5 50
3.6.2 Lighting improvement by low e-ceiling
Table 3 shows the distribution of a typical 100 watt incandescent lamp. From the table one can say most
of the energy input is converted into radiated heat which increases the load of cooling system which could
be a good chance to reduce the heat load.
The lights is first reflected off the ice surface and then reflected by the ceiling. It continues to bounce
around until it is eventually absorbed. Low e-ceiling is a piece of aluminum foil which is shining silver. It
will improve the reflection of light from ceiling. This re-use of light could reduce the number of lamps
while improving the light level, and then reduce the load for cooling system.
Table 4 Energy distribution of a 100 watt incandescent lamp (SaskPower, 2007)
light 10%
Radiated heat 72%
Conducted heat 6.5%
Convected heat 11.5%
There are a lot of references have indicated that there is improvement of light level after the installation of
low e-ceiling (McBride, 2005; E Source, 2010). Some of them has announced their low e-ceiling product
can improve the lighting level by 20% to 30% (ICECO, 2009; Energie Innovation INC, 1992). Several
measurements are carried out to compare the light level before and after the installation of low-e ceiling.
The light level was measured in some points in Älta ice rink. The picture shows the location of the points.

Evaluation of Energy Saving Measures in Ice Rinks
-30-
Figure 24 Location of measured points in Älta ice rink
The light level was measured on 16th June, 2011 before the installation of low-e ceiling and 11th October,
2011 after installation of low-e ceiling. All the results are showed with the unit Lux.
Results on 16th June before the installation of low-e ceiling are showed in Figure 25
Figure 25 Light level before installation of low-e ceiling in Älta ice rink
And the result on 11th October after the installation of low-e ceiling is showed in Figure 26.
Figure 26 Light level after installation of low-e ceiling in Älta ice rink
Fel! Hittar inte referenskälla. shows that the average light level has been improved by 17%.
Table 5 Results summary of light level measurements
date points average absolte increse
percentage
16-Jun 11 599 - -
11-Oct 11 701 102 17%
As the capacity of light system is 20.9 kW, how much light level can we have per kW (lux/kW) can be
obtained (Table 6).
Table 6 Light improvement per kW
Installed capacity of lighting system 20.9 kW
Lux/kW (without low-e ceiling) 28.7 Lux/kW
Lux/kW (with low-ceiling) 33.5 Lux/kW
Improved light level 4.9 Lux/kW
2 4 7 9
1 6 11
3 5 8 10
570 590 575 610
680 565 670
550 590 570 580
739 712 646 668
803 627 770
712 629 667 700

Evaluation of Energy Saving Measures in Ice Rinks
-31-
Percentage improved 17%
Conversely, the energy consumption of lighting system can be reduced if the light level maintains the same
with a low-e ceiling. The table shows the potential of energy saving for lighting system (Table 7).
Table 7 Energy saving potential
Average light level without low-e 599 Lux
Average light level with low-e 701 Lux
Improved in light level 102 Lux
Lux/kW(with low-e) 34 Lux/kW
Power saving potential 3 kW
And if the lighting is turned on 6 months a year, 8 hours a day, that means the energy saving potential can
be
/year
Which is not a high number compare to the total energy use of ice rink, but for longer time the lighting
system is on the more energy can be saved.

Evaluation of Energy Saving Measures in Ice Rinks
-32-
4 Dehumidification
4.1 Introduction
In the ice rink, humidity is not tolerated. The moisture in the air follows the physical law of nature that
migrating through the air from a higher concentration to lower concentration due to a different vapor
pressure. When the moisture air is cooled, it is unable to hold as much moisture as before, so the moisture
will be condensed on the colder surfaces which have lower temperature than the dew point temperature.
The moisture will be condensed in the form of water drops, resulting in dripping and fogging above the
ice surface which could bring annoying effect to the users, for example it is very dangerous in the hockey
game if the players do not have a clear vision while they are skating at a very high speed.
Therefore; it is important to have the dried air in the ice rinks to avoid dripping or fogging. Normally the
energy consumption of dehumidification of an ice rink could account for 6% of the total energy
consumption of cooling system (Rogstam, 2010). And mainly there are two types of dehumidification
technologies commonly used in ice rinks: sorption type and refrigeration type. Considering the high
energy consumption of refrigeration system, there is potential for energy saving if the right technology is
chosen. So the energy consumption of two types of dehumidification are analyzed and compared.
As a study case, two ice rinks with different type of the dehumidification technologies are studied: Älta ice
rink with sorption type dehumidification and Norrtälje ice rink with refrigeration type dehumidification.
4.2 Technologies
A. Sorption type:
A sorption type dehumidifier is mainly based on the chemical sorbent. The principle of sorption type
dehumidifier is that desiccant in the wheel is exposed to the moisture air, from where the moisture is
absorbed and held. The saturated desiccant is then heated up to drive the collected moisture off to the
exhaust air to be regenerated (NACE, 2011) , which are showed in the figure below.
Figure 27 Principle of desiccant dehumidifier (AXIOM Solution, 2008)
B. Refrigeration type:
Another type commonly employed is to condense the moisture in air by reducing the temperature to be
lower than the dew point. From saturation curve on the psychometric chart, the moisture contained in the
air is reduced significantly when the temperature of the air is lowered. The principle of operation of
refrigeration type dehumidifier is showed in the figure below.
Evaluation of Energy Saving Measures in Ice Rinks
-33-
Figure 28 Principle of refrigeration type dehumidifier (Hire All Seasons, 2006)
Humid air first goes through an evaporator, where the moisture is cooled down as water and then the
cooled air is heated up slightly by passing condenser and compressor after which the dry warm air is
discharged to the rooms.
4.3 Study cases
4.3.1 Älta ice rink-sorption type dehumidification
In Älta, the sorption type dehumidification is used.
The model of the dehumidifier used in Älta is DA 6000, installed by Fuktkontroll AB. According to the
technical parameters, the dehumidifier is with a rated power of 54.4 kW which include a power of 48 kW
and 6, 2 kW for fan. The maximum ability of condensing water is 18 kg/h (4℃/50% of relative humidity)
(Fuktkontroll AB, 2011).
In order to evaluate the dehumidifier, the dehumidifier is simplified by the flow chart below.
Air in ( from indoor)
Dried air out ( to the ice rink)Sorption type dehumidifier
Ice rink
Regeneration air(from outside)
Exhausted warm air(to
outside)
electricity
Figure 29 Sorption type dehumidifier
There should be some kind of way to give people an idea if a dehumidifier is good or bad in energy
prospect.

Evaluation of Energy Saving Measures in Ice Rinks
-34-
The energy consumption of each month from 2011-07 to 2012-06 is showed in the figure below.
Figure 30 Monthly energy consumption of dehumidifier in Älta ice rink
The ice rink started to run in the middle of July 2011, so the energy consumption in July is low .there is
also some electricity failure happened from the end of February to the end of March when the
dehumidifier was shut down. Further the Älta ice rink has been shut down since May 2012.
The total energy consumption for entire year is 149909 kWh which is quite high number. It could be a big
potential for energy saving.
First of all, the main function of a dehumidifier is to reduce the moisture in the air. So it is essential to
know where dose the moisture come from.
There are two source of moisture: external and internal. The external moisture source is from the leakage
of outdoor air to the ice rink (there is no code ventilation in Älta ice rink; code ventilation is the
ventilation due to introduction of a standard volume of outdoor air to ice rink according to ASHRAE 62
(Desert Aire, 2012)) and the internal moisture source is from the resurfacing and people who have
activities inside the ice rink (figure below).

Evaluation of Energy Saving Measures in Ice Rinks
-35-
Moisture from outdoor air
leakage
Moisture from indoor activities and resurfacing
Air to dehumidifier
Ice rink
Figure 31 Moisture load from indoor and outdoor in ice rink
Compared to the internal moisture source, the outdoor leakage air is easier to measure. Internal moisture
source can be simplified as a constant source. So the moisture load is change with the outdoor condition
or the water content of outdoor air.
August is the month with highest energy consumption and the machine was running fully all the time so it
cannot be used to extract the relationship between energy consumption and outdoor water content. So the
month with dehumidifier part-load running is chosen: October and January.
The indoor climate data is read from ClimaCheck. There is a hygrometer , thermocouples and energy
meters integrated in ClimaCheck installed in Älta ice rink to measure indoor and outdoor humidity,
temperature and energy consumption of dehumidifier.
Water content can be obtained by the relative humidity and temperature using the following equations:
(for ℃)
(for ℃)
, the saturation pressure of water [bar]
t, air temperature[℃]
relative humidity
, partial pressure of water vapor in air[bar]
water content[ kg water per kg air]
, total pressure of humid air which is set as 1 bar in this case
The figure below shows the energy consumption of different water content of outdoor air in October and
January.

Evaluation of Energy Saving Measures in Ice Rinks
-36-
Figure 32 Energy consumption of dehumidifier for different outdoor water content in the period
from 1st October to 31st January
And the water content of indoor air in October and January is showed in the picture below.
Figure 33 Water content of indoor air in Älta ice rink for the period from 1st to 31st October
Evaluation of Energy Saving Measures in Ice Rinks
-37-
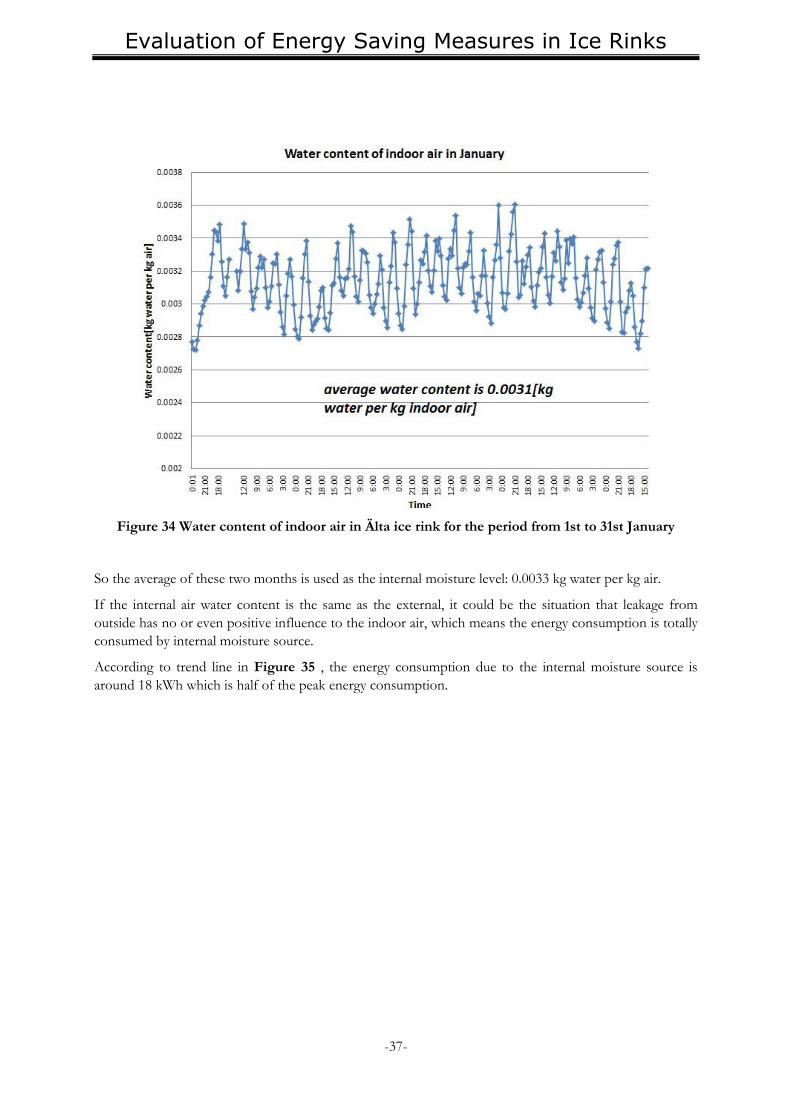
Figure 34 Water content of indoor air in Älta ice rink for the period from 1st to 31st January
So the average of these two months is used as the internal moisture level: 0.0033 kg water per kg air.
If the internal air water content is the same as the external, it could be the situation that leakage from
outside has no or even positive influence to the indoor air, which means the energy consumption is totally
consumed by internal moisture source.
According to trend line in Figure 35 , the energy consumption due to the internal moisture source is
around 18 kWh which is half of the peak energy consumption.

Evaluation of Energy Saving Measures in Ice Rinks
-38-
Figure 35 Energy consumption of dehumidifier when indoor air has the same water content as
outdoor air
This result could be used to evaluate the insolation of the ice rink by checking the ratio between internal
and external moisture source. For instance in Älta ice rink, the energy used to dry internal moisture source
is 18 kWh. If the total energy consumption of dehumidifier is 50 kWh which means that 32 kWh energy is
used to dry outdoor air moisture, it indicates that much more energy consumption is due to external
moisture source and bad sealing up of ice rink could be the main problem.
However, now the dehumidifier in Älta is controlled by the relative humidity. But the water content of air
changes with its temperature while they have the same relative humidity. If two air flows are measured and
they have the same relative humidity, then the higher temperature the higher water content of air. The
dehumidifier in Älta is controlled that when the relative humid of incoming air exceeds 50% the machine
will be shut down. For instance, if the air (total pressure 1 bar) is 5℃ with 50% relative humid, the dew
point is -4 ℃ and if the air is 10℃, then the dew point is 4.7℃. That means when the air is very humid
actually at 10℃, but the dehumidifier stop working which will lead to condensation and fogging. So it is
better to control the dehumidifier according the air water content or dew point (can be easily obtained
from water content).
And we are lack of data of air going in and out from dehumidifier, so it is not a good idea to build a heat
balance over dehumidifier to calculate the energy consumption per kg condensed water. The daily energy
consumption is used to compare the two different type dehumidifiers.
As for both ice rinks, the data is available in September, so the average of common period in September is
used, which is from 4th Sep to 11th Sep, 2011.
There is an energy meter integrated in ClimaCheck system which could measure the energy consumption
of dehumidifier every minute in Älta ice rink. The reading from ClimaCheck shows the total energy
consumption during the period from 4th to 11th September is 5823.7 kWh. Therefore, the average daily
energy usage of sorption type dehumidifier in Älta ice rink is

Evaluation of Energy Saving Measures in Ice Rinks
-39-
4.3.2 Norrtälje ice rink-refrigeration type dehumidification
Refrigeration type dehumidification is used in Norrtälje ice rink. There are difference ways to integrate the
dehumidification into refrigeration system. The one used in Norrtälje is introduce a pipe for brine from
the main brine piping system to dehumidify the air (showed in the figure below).
Figure 36 Refrigeration type dehumidifier in Norrtälje
The temperatures of both incoming brine and output brine, mass flow of brine are measured.
In order to calculate the cooling capacity of each measured period, the following equation is used.
[
] [
] ( ) [
]
So,
From cooling capacity of brine to the energy consumption, the following equation can be applied.
Calcium chloride ( ) is used as refrigerant in Norrtälje ice rink.
As temperatures of brine in and out is all around 0℃ so the specific heat capacity of Calcium chloride
times density can be considered as a the fix number 3609 (Melinder, 2010).
The mass flow of brine is constant during the measuring time, 6.3 .
And the daily energy consumption in the period of 4th Sep to 11th Sep, 2011 is 460 kWh.
Warm air in Cold dry air out Warm dry air
Brine in
Brine out
Condensed water

Evaluation of Energy Saving Measures in Ice Rinks
-40-
4.4 Discussion
Daily energy consumption in the period from 4th to 11th September in Älta ice rink (sorption type) and
Norrtälje ice rink (refrigeration type) are showed below.
Figure 37 Daily energy consumption of sorption type and refrigeration type dehumidifiers
As can be seen in the figure, the energy consumption of sorption type is higher than refrigeration type.
But it is hard to say which one is better than the other since the situations in the two ice rinks are different
and the analysis did not include all the influencing parameters; such as the air amount they have treated,
the condition of air.
But no more data is available now, so just the general idea about how are the energy situations of
dehumidifiers in these two ice rinks is obtained in this thesis.
Evaluation of Energy Saving Measures in Ice Rinks
-41-
5 Conclusion
The total radiation can be reduced by 31% maximum when it is in warm period with emissivity factor of
0.04 and 17% in the situation in Älta ice rink, which is much less compared to reference (80%-90%). As
radiation generally accounts for 1/3 of the total heat load to refrigeration system, so 10% of energy is
saved from refrigeration in reality. The lower emissivity factor of the material will have less emissivity of
radiation from ceiling. It suggests using lower emissivity factor material to manufacture low-e ceiling
But the reduction of radiation from ceiling is significant with maximum 92%. The radiation from walls is
increasing while reducing the emissivity factor of ceiling. When the emissivity factor of low-e ceiling is
reduced to 0.04, the radiation from walls becomes the main source of radiation load on ice surface.
According to the results, the low-e material should be applied for walls too. But there is also a possibility
that these could be caused by applying same wall temperature to all cases in the calculations, the
temperature of walls should be measured to get radiation effect of walls in reality.
There is not much difference if low-e ceiling is installed with or without gap in warm period. But in the
cold period, installation with gap may increase the radiation. So it is recommended that the low-e ceiling
should be installed directly attached to the inner original ceiling to have the best performance.
The lighting is improved by low-e ceiling by 24% and has 7680 kWh potential of saving energy each year.
And the longer the lights are needed to be on, the more energy can be saved.
The total energy consumption of dehumidifier in Älta ice rink during the running period in 2011 is 149909
kWh and August is the peak and the energy consumption can reduced. This can be done by better control
of dehumidifier. There is a potential of condensation or fogging if the dehumidifier is controlled by
relative humid and it is better to control it by water content or dew point of air.
Also the relationship between the water content of outdoor air and the energy consumption has been
studied in Älta ice rink. By comparing the water content of indoor air and outdoor air, the internal source
of moisture would consume 18 kWh which is half of peak energy consumption.
The daily average energy consumption of two different types dehumidifiers is calculated, dehumidifier in
Älta ice rink consume 728 kWh daily while 460 kWh for Norrtälje. But they are not comparable as the
data is obtained by measuring two types of dehumidifiers running in different environmental. The energy
consumption of dehumidifier depends on the air amount and air condition which has been treated.
Evaluation of Energy Saving Measures in Ice Rinks
-42-
6 Future work
Consider the low-e material should be applied to the walls too. Since the effect of walls in radiation aspect
is not ignorable, more work should be carried out to measure the temperatures of walls to check the
reality.
Generally it is better to install low-e ceiling without air gap.
The results of dehumidifier shows the energy consumption per day, but more work can be done to see
how much energy per kg condensed water to compare these two types.
Evaluation of Energy Saving Measures in Ice Rinks
-43-
7 Bibliography
Administration General Services, 1996. Telecommunications: Glossary of Telecommunication Terms.
[Online]
Available at: http://www.its.bldrdoc.gov/fs-1037/dir-029/_4341.htm
[Accessed 13 12 2012].
ASHERA, 2010. ASHREA handbook-Refrigeration(SI)-Chapter 44. s.l.:AHREA.
ASHREA, 1994. Ice Rink Rferigeration Handbook,Chapter 33. s.l.:ASHREA.
AXIOM Solution, 2008. Professional air conditioning system solutions. [Online]
Available at: http://www.axiom.com.hk/axiom_en/rotor_en.htm
[Accessed 21 July 2012].
D.Manca & M.Rovaglio, 2002. Infrared Thermographic Image Processing for the Operation and
Control of Heterogeneous Combustion Chambers. Combustion and Flame, 130(4), p. 277–297.
Desert Aire, 2012. Indoor ice rink dehumidification. [Online]
Available at: http://www.desert-
aire.com/index.php?option=com_docman&task=cat_view&gid=131&Itemid=176&mosmsg=Y
ou+are+trying+to+access+from+a+non-authorized+domain.+%28www.google.se%29
[Accessed 19 12 2012].
E Source, 2010. Managing Energy Costs in Ice Rinks, Colorado: E Source Companies LLC.
Energie Innovation INC, 1992. "Astro-Rink"-Reflective Instulating Materil( Owner's Manual). [Online]
Available at: http://www.energie-innovation.com/astro_rink.html
[Accessed 23 July 2012].
Fuktkontroll AB, 2011. Sorptionsavfuktare. [Online]
Available at: http://www.fuktkontroll.com/sorption/sorption.htm
[Accessed 20 July 2012].
Hire All Seasons, 2006. How Does A Dehumidifier Work?. [Online]
Available at: http://www.allseasonshire.eu/dryers/principle-of-operation.php
[Accessed 21 July 2012].
ICECO, 2009. ICECO Advanced Arena Products. [Online]
Available at: http://www.icecoadvanced.com/lowe.htm
[Accessed 20 February 2012].
IIHF, 2011. Technical Guidelines of An Ice Rink, Zurich: International Ice Hockey Federation.
Jack Vivian, 2008. Winter Sports Facilities, Michigan: JRV & INC.
Karampour, M., 2011. Measurement and Modelling of Ice Rinks Heat Loads, Stockholm: KTH.
Laurier Nichols, P., 2009. Improving Energy Efficiency in Ice Hockey Arena. ASHRAE, p. 5.
Lotfi Seghouani, A. D. N. G., 2009. Prediction of Yearly Energy Requirements of Indoor Ice
Rinks. Energy and Buildings, Issue 41, p. 500.
Manitoba Hydro, 1999. Energy Efficiency Guide for Ice Arenas and Curling Rinks, s.l.: Manitoba Hydro.
McBride, R., 2005. Low-E Ceilings: Benefits, Costs and Tips, Plano: Ice Skating Institution.
Melinder, Å., 2010. Properties of Secondary Working Fluids for Indirect Systems. Pairs: International
Institute of Refrigeration(IIR).

Evaluation of Energy Saving Measures in Ice Rinks
-44-
NACE, 2011. NACE resource center. [Online]
Available at: http://events.nace.org/library/corrosion/Dehumidification/techniques.asp
[Accessed 21 July 2012].
Natural Resources Canada, 2003. Influence of the Type of Ice Rink Ceiling. [Online]
Available at:
http://canmetenergy.nrcan.gc.ca/sites/canmetenergy.nrcan.gc.ca/files/files/pubs/2003-066-
1e.pdf
[Accessed 23 July 2012].
Ontario Hydro Technologies, 1999. Energy Measurements at Ice Rinks, Sttiard: CADDET energy
efficiency.
ORFA, 2008. Energy Efficient Arenas: It's in our Power, s.l.: Ontario Recreation Facilities Association
Inc..
P.Incropera, F. & Witt, D. P., 1990. Fundamentals of Heat and Mass Transfer. 3rd ed. Singapore: John
Wiley & Sons, Inc.
Rogstam, J., 2010. Energy Usage Statstiics and Saving Potential in Ice Rink. IIR Sustainable
Refrigeration and Heat Pump Technology.
SaskPower, S. P. R. A. O. o. E. C., 2007. The Energy Management Manual for Arena and Rink
Operators, Saskatchewan: SaskPower.
Svedung, H., 2011. Tempraturmätningar i Ishallar i Luleå, Borlänge: SSAB.
The Engineering Toolbox, 2012. Thermal Conductivity of some common Materials and Gases. [Online]
Available at: http://www.engineeringtoolbox.com/thermal-conductivity-d_429.html
[Accessed 23 July 2012].
W.Blades, R., 1992. Energy Modernizing and Retrofitting Ice Skating Rinks-Advanced
Technology Can Improve Ice Rink Quality While Reducing Design, Energy and Operating Cost.
ASHRAE, 34(4).
Wekipedia, 2008. Foot Candle. [Online]
Available at: http://en.wikipedia.org/wiki/Foot-candle
[Accessed 23 July 2012].
Wikipedia, 2012. Emissivity. [Online]
Available at: http://en.wikipedia.org/wiki/Emissivity
[Accessed 23 July 2012].
Wikipedia, 2012. LUX. [Online]
Available at: http://en.wikipedia.org/wiki/Lux
[Accessed 23 July 2012].
Wilhelm Wienrich, M. A., 2012. Schnelles Eis-
Untersuchungen Zur Beeinflussung Von Qualität Und Energieaufwand Beim Sporties, s.l.: Bundesinstitut
für Sportwissenschaft.
Evaluation of Energy Saving Measures in Ice Rinks
-45-
8 Appendix
Table 8 Comparison of calculated ceiling temperature (heat balance over roof) and measured ceiling
temperature
date time t_ceiling(IR) t_tink(IR)
s_j=0.18
r_j=0.045
alpha_out=25
alpha_i=4
10:00-11:00 6.66 8.21 7.81
11:00-12:00 7.04 8.38 8.41
12:00-13:00 7.45 8.78 8.24
13:00-14:00 7.63 8.99 8.30
14:00-15:00 7.73 9.12 8.51
15:00-16:00 7.95 9.41 8.54
16:00-17:00 8.11 9.65 8.42
17:00-18:00 7.88 9.59 8.38
18:00-19:00 7.75 9.43 8.24
19:00-20:00 7.47 9.13 7.95
20:00-21:00 7.27 9.00 7.57
21:00-22:00 7.02 8.82 6.74
22:00-23:00 6.49 8.25 5.99
23:00-24:00 6.27 8.00 5.44
0:00-1:00 5.90 7.57 5.18
1:00-2:00 5.70 7.35 4.88
2:00-3:00 5.50 7.17 4.59
3:00-4:00 5.29 6.99 4.39
4:00-5:00 5.17 6.84 4.50
5:00-6:00 5.08 6.74 4.94
6:00-7:00 5.17 6.73 5.75
7:00-8:00 5.62 7.37 6.36
8:00-9:00 5.99 7.87 6.24
9:00-10:00 6.18 7.83 6.00
10:00-11:00 6.22 7.99 5.78
11:00-12:00 6.41 8.00 5.76
12:00-13:00 6.43 8.02 5.70
13:00-14:00 6.47 8.06 5.66
14:00-15:00 6.53 8.09 5.61
15:00-16:00 6.46 8.19 5.65
16:00-17:00 6.64 8.35 5.73
17:00-18:00 6.64 8.42 5.83
18:00-19:00 6.68 8.32 6.06
19:00-20:00 6.60 8.41 6.02
average 6.57 6.41 6.45
16 june
17 june
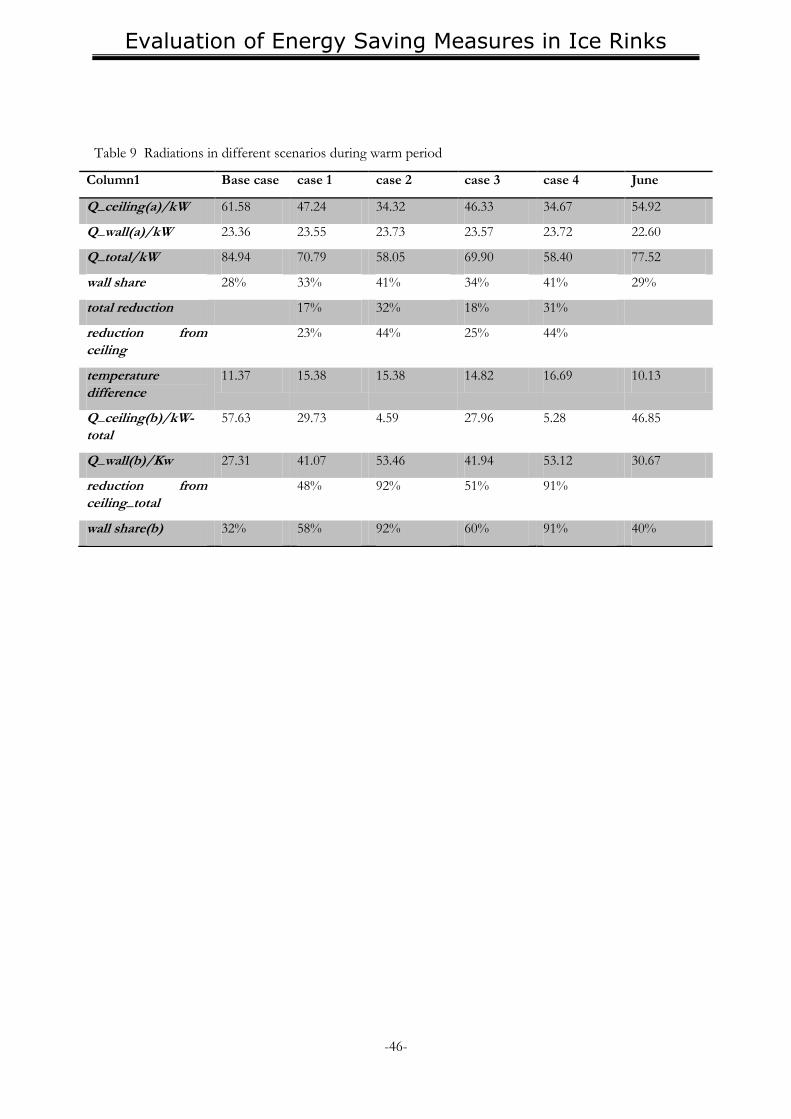
Evaluation of Energy Saving Measures in Ice Rinks
-46-
Table 9 Radiations in different scenarios during warm period
Column1 Base case case 1 case 2 case 3 case 4 June
Q_ceiling(a)/kW 61.58 47.24 34.32 46.33 34.67 54.92
Q_wall(a)/kW 23.36 23.55 23.73 23.57 23.72 22.60
Q_total/kW 84.94 70.79 58.05 69.90 58.40 77.52
wall share 28% 33% 41% 34% 41% 29%
total reduction 17% 32% 18% 31%
reduction from
ceiling
23% 44% 25% 44%
temperature
difference
11.37 15.38 15.38 14.82 16.69 10.13
Q_ceiling(b)/kW-
total
57.63 29.73 4.59 27.96 5.28 46.85
Q_wall(b)/Kw 27.31 41.07 53.46 41.94 53.12 30.67
reduction from
ceiling_total
48% 92% 51% 91%
wall share(b) 32% 58% 92% 60% 91% 40%

Evaluation of Energy Saving Measures in Ice Rinks
-47-
Table 10 Radiations in different scenarios during cold period
Column1 Base
case
case 1 case 2 case 3 case 4
Q_total/W 47.13 54.03 44.05 46.12 43.03
Q_ceiling(a)/kW 29.19 36.18 26.07 28.16 25.04
Q_wall(a)/W 17.94 17.85 17.98 17.95 18.00
wall share 38% 33% 41% 39% 42%
total reduction -15% 7% 2% 9%
reduction from ceiling -24% 11% 4% 14%
temperature difference
between ceiling and
surface
5.41 12.06 12.06 7.03 7.88
Q_ceiling(b)/kW 9.67 23.27 3.59 7.66 1.58
Q_wall(b)/KW 37.46 30.76 40.46 38.46 41.45
reduction of ceiling -141% 63% 21% 84%
wall share(b) 56.93% 91.84% 83.39% 96.32%
emissivity factor of
ceiling surface
0.90 0.26 0.04 0.26 0.04