Embed Size (px)
Citation preview
3
4
5
6
30 40 50 60
LWR
(3
s) [
nm
]
EUV dose [mJ cm-2]
50 nm FP
40 nm FP
40
nm
FP
50
nm
FP
EUVEUVEUVEUV &&&& 30303030----keVkeVkeVkeV HeHeHeHe++++ interactioninteractioninteractioninteraction inininin CARCARCARCAR resistresistresistresist
There are remarkable similarities in the
response of resists to He+ ions and EUV
photons: both create low-energy Secondary
Electrons that activate the resist4-7 (see Fig.
1).
The main difference is that each He+ ion has
multiple inelastic collisions with the resist
atoms, generating hundreds of SEs along its
trajectory in the resist8, see Fig. 2.
The weak backscattering of the He+ ions,
(Fig. 2), results in ultra-low proximity effects.
This enables the exposure of dense and
detailed patterns by a focused He+ ion beam
without the need for proximity correction.
Also EUVL capitalizes on low proximity, being
it from a different origin.
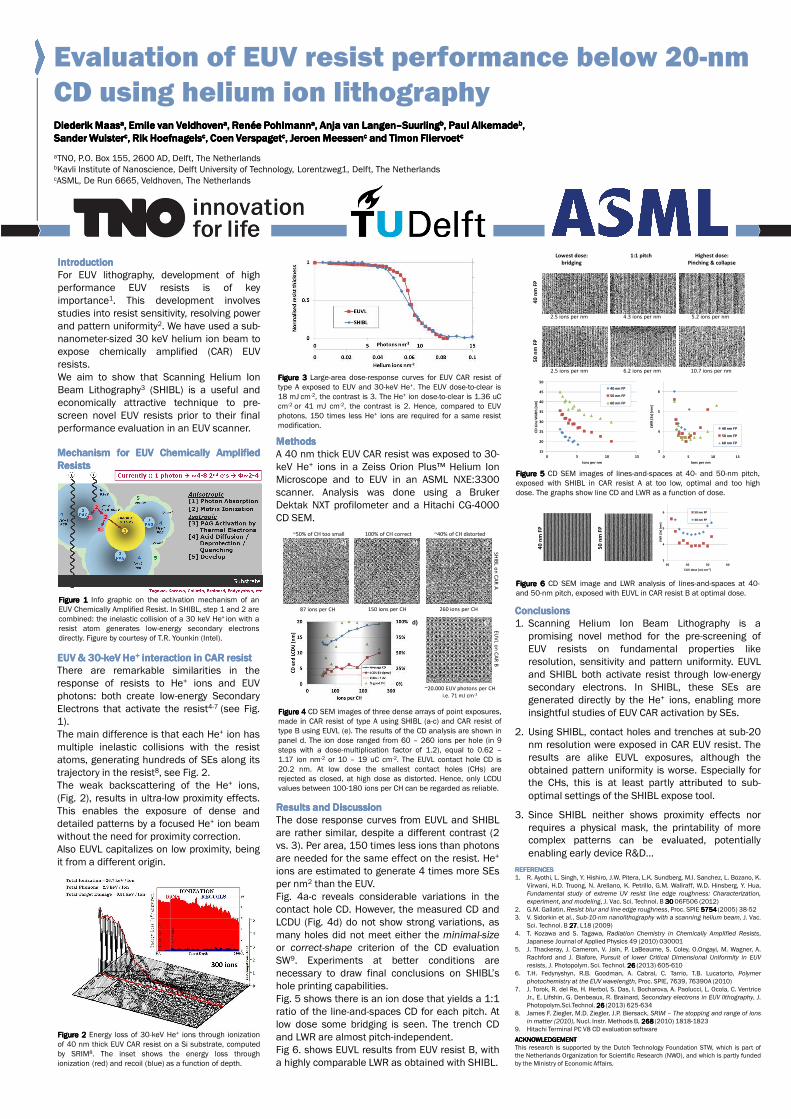
Evaluation of EUV resist performance below 20-nm
CD using helium ion lithographyDiederik Diederik Diederik Diederik MaasMaasMaasMaasaaaa, Emile van , Emile van , Emile van , Emile van VeldhovenVeldhovenVeldhovenVeldhovenaaaa, Renée , Renée , Renée , Renée PohlmannPohlmannPohlmannPohlmannaaaa, , , , AnjaAnjaAnjaAnja van van van van LangenLangenLangenLangen––––SuurlingSuurlingSuurlingSuurlingbbbb, , , , Paul Paul Paul Paul AlkemadeAlkemadeAlkemadeAlkemadebbbb, , , ,
Sander Sander Sander Sander WuisterWuisterWuisterWuistercccc, , , , RikRikRikRik HoefnagelsHoefnagelsHoefnagelsHoefnagelscccc, , , , CoenCoenCoenCoen VerspagetVerspagetVerspagetVerspagetcccc, Jeroen , Jeroen , Jeroen , Jeroen MeessenMeessenMeessenMeessencccc and Timon and Timon and Timon and Timon FliervoetFliervoetFliervoetFliervoetcccc
aTNO, P.O. Box 155, 2600 AD, Delft, The NetherlandsbKavli Institute of Nanoscience, Delft University of Technology, Lorentzweg1, Delft, The NetherlandscASML, De Run 6665, Veldhoven, The Netherlands
REFERENCESREFERENCESREFERENCESREFERENCES
1. R. Ayothi, L. Singh, Y. Hishiro, J.W. Pitera, L.K. Sundberg, M.I. Sanchez, L. Bozano, K.
Virwani, H.D. Truong, N. Arellano, K. Petrillo, G.M. Wallraff, W.D. Hinsberg, Y. Hua,
Fundamental study of extreme UV resist line edge roughness: Characterization,
experiment, and modeling, J. Vac. Sci. Technol. B 30303030 06F506 (2012)
2. G.M. Gallatin, Resist blur and line edge roughness, Proc. SPIE 5754575457545754 (2005) 38-52
3. V. Sidorkin et al., Sub-10-nm nanolithography with a scanning helium beam, J. Vac.
Sci. Technol. B 27272727, L18 (2009)
4. T. Kozawa and S. Tagawa, Radiation Chemistry in Chemically Amplified Resists,
Japanese Journal of Applied Physics 49 (2010) 030001
5. J. Thackeray, J. Cameron, V. Jain, P. LaBeaume, S. Coley, O.Ongayi, M. Wagner, A.
Rachford and J. Biafore, Pursuit of lower Critical Dimensional Uniformity in EUV
resists, J. Photopolym. Sci. Technol. 26262626 (2013) 605-610
6. T.H. Fedynyshyn, R.B. Goodman, A. Cabral, C. Tarrio, T.B. Lucatorto, Polymer
photochemistry at the EUV wavelength, Proc. SPIE, 7639, 76390A (2010)
7. J. Torok, R. del Re, H. Herbol, S. Das, I. Bocharova, A. Paolucci, L. Ocola, C. Ventrice
Jr., E. Lifshin, G. Denbeaux, R. Brainard, Secondary electrons in EUV lithography, J.
Photopolym.Sci.Technol. 26262626 (2013) 625-634
8. James F. Ziegler, M.D. Ziegler, J.P. Biersack, SRIM – The stopping and range of ions
in matter (2010), Nucl. Instr. Methods B, 268268268268 (2010) 1818-1823
9. Hitachi Terminal PC V8 CD evaluation software
ACKNOWLEDGEMENTACKNOWLEDGEMENTACKNOWLEDGEMENTACKNOWLEDGEMENT
This research is supported by the Dutch Technology Foundation STW, which is part of
the Netherlands Organization for Scientific Research (NWO), and which is partly funded
by the Ministry of Economic Affairs.
IntroductionIntroductionIntroductionIntroduction
For EUV lithography, development of high
performance EUV resists is of key
importance1. This development involves
studies into resist sensitivity, resolving power
and pattern uniformity2. We have used a sub-
nanometer-sized 30 keV helium ion beam to
expose chemically amplified (CAR) EUV
resists.
We aim to show that Scanning Helium Ion
Beam Lithography3 (SHIBL) is a useful and
economically attractive technique to pre-
screen novel EUV resists prior to their final
performance evaluation in an EUV scanner.
FigureFigureFigureFigure 1111 Info graphic on the activation mechanism of an
EUV Chemically Amplified Resist. In SHIBL, step 1 and 2 are
combined: the inelastic collision of a 30 keV He+ ion with a
resist atom generates low-energy secondary electrons
directly. Figure by courtesy of T.R. Younkin (Intel).
FigureFigureFigureFigure 3333 Large-area dose-response curves for EUV CAR resist of
type A exposed to EUV and 30-keV He+. The EUV dose-to-clear is
18 mJ cm-2, the contrast is 3. The He+ ion dose-to-clear is 1.36 uC
cm-2 or 41 mJ cm-2, the contrast is 2. Hence, compared to EUV
photons, 150 times less He+ ions are required for a same resist
modification.
ConclusionsConclusionsConclusionsConclusions
1. Scanning Helium Ion Beam Lithography is a
promising novel method for the pre-screening of
EUV resists on fundamental properties like
resolution, sensitivity and pattern uniformity. EUVL
and SHIBL both activate resist through low-energy
secondary electrons. In SHIBL, these SEs are
generated directly by the He+ ions, enabling more
insightful studies of EUV CAR activation by SEs.
2. Using SHIBL, contact holes and trenches at sub-20
nm resolution were exposed in CAR EUV resist. The
results are alike EUVL exposures, although the
obtained pattern uniformity is worse. Especially forthe CHs, this is at least partly attributed to sub-
optimal settings of the SHIBL expose tool.
3. Since SHIBL neither shows proximity effects nor
requires a physical mask, the printability of morecomplex patterns can be evaluated, potentially
enabling early device R&D…
FigureFigureFigureFigure 2222 Energy loss of 30-keV He+ ions through ionization
of 40 nm thick EUV CAR resist on a Si substrate, computed
by SRIM8. The inset shows the energy loss through
ionization (red) and recoil (blue) as a function of depth.
ResultsResultsResultsResults andandandand DiscussionDiscussionDiscussionDiscussion
The dose response curves from EUVL and SHIBL
are rather similar, despite a different contrast (2
vs. 3). Per area, 150 times less ions than photons
are needed for the same effect on the resist. He+
ions are estimated to generate 4 times more SEs
per nm2 than the EUV.
Fig. 4a-c reveals considerable variations in the
contact hole CD. However, the measured CD and
LCDU (Fig. 4d) do not show strong variations, as
many holes did not meet either the minimal-size
or correct-shape criterion of the CD evaluation
SW9. Experiments at better conditions are
necessary to draw final conclusions on SHIBL’s
hole printing capabilities.
Fig. 5 shows there is an ion dose that yields a 1:1
ratio of the line-and-spaces CD for each pitch. At
low dose some bridging is seen. The trench CD
and LWR are almost pitch-independent.
Fig 6. shows EUVL results from EUV resist B, with
a highly comparable LWR as obtained with SHIBL.
FigureFigureFigureFigure 4444 CD SEM images of three dense arrays of point exposures,
made in CAR resist of type A using SHIBL (a-c) and CAR resist of
type B using EUVL (e). The results of the CD analysis are shown in
panel d. The ion dose ranged from 60 – 260 ions per hole (in 9
steps with a dose-multiplication factor of 1.2), equal to 0.62 –
1.17 ion nm-2 or 10 – 19 uC cm-2. The EUVL contact hole CD is
20.2 nm. At low dose the smallest contact holes (CHs) are
rejected as closed, at high dose as distorted. Hence, only LCDU
values between 100-180 ions per CH can be regarded as reliable.
MethodsMethodsMethodsMethods
A 40 nm thick EUV CAR resist was exposed to 30-
keV He+ ions in a Zeiss Orion Plus™ Helium Ion
Microscope and to EUV in an ASML NXE:3300
scanner. Analysis was done using a Bruker
Dektak NXT profilometer and a Hitachi CG-4000
CD SEM.
87 ions per CH 150 ions per CH 260 ions per CH
~20.000 EUV photons per CH
i.e. 71 mJ cm-2
SH
IBL o
n C
AR
A
~50% of CH too small 100% of CH correct ~40% of CH distorted
EU
VL o
n C
AR
B
d)
b) c)a)
e)
FigureFigureFigureFigure 5555 CD SEM images of lines-and-spaces at 40- and 50-nm pitch,
exposed with SHIBL in CAR resist A at too low, optimal and too high
dose. The graphs show line CD and LWR as a function of dose.
50
nm
FP
1:1 pitch
5.2 ions per nm
Lowest dose:
bridging
2.5 ions per nm 4.3 ions per nm
Highest dose:
Pinching & collapse
40
nm
FP
6.2 ions per nm2.5 ions per nm 10.7 ions per nm
15
20
25
30
35
40
45
50
0 5 10 15
CD
Lin
e W
idth
[n
m]
Ions per nm
40 nm FP
50 nm FP
60 nm FP
3
4
5
6
0 5 10 15
LWR
(3
s) [
nm
]
Ions per nm
40 nm FP
50 nm FP
60 nm FP
FigureFigureFigureFigure 6666 CD SEM image and LWR analysis of lines-and-spaces at 40-
and 50-nm pitch, exposed with EUVL in CAR resist B at optimal dose.
MechanismMechanismMechanismMechanism forforforfor EUVEUVEUVEUV ChemicallyChemicallyChemicallyChemically AmplifiedAmplifiedAmplifiedAmplified
ResistsResistsResistsResists