Embed Size (px)
Citation preview

Zhong Wu, Ph.D., P.E.
2013 Louisiana Transportation Conference Feb 20, 2013
Evaluation of Friction Characteristics of Wearing Course
Mixtures in Louisiana
Background
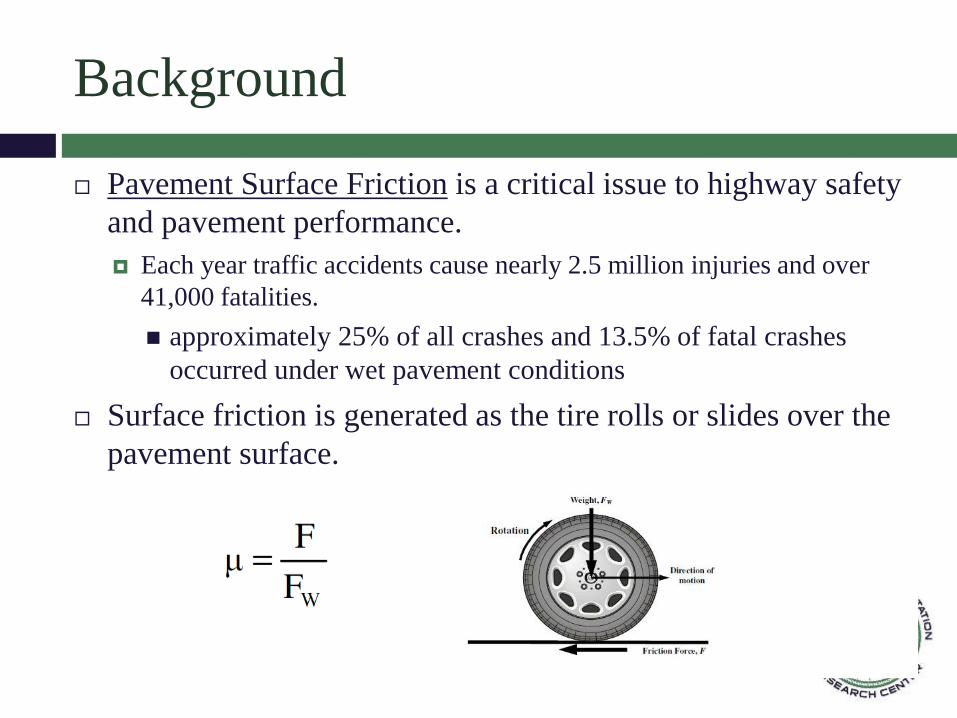
Pavement Surface Friction is a critical issue to highway safety
and pavement performance.
Each year traffic accidents cause nearly 2.5 million injuries and over
41,000 fatalities.
approximately 25% of all crashes and 13.5% of fatal crashes
occurred under wet pavement conditions
Surface friction is generated as the tire rolls or slides over the
pavement surface.

Background (contd..)
The friction coefficient can be affected by
Vehicle and driver characteristics
e.g., speed, braking system, tire condition, driver controls
Pavement surface characteristics
Material properties, e.g. aggregates, binder, gradations, etc.
Surface Textures (Micro-/Macro-texture, Mega-
texture/unevenness)
Other conditions (e.g. temperature, wet or dry, clean or dirty)
Microtexture and Macrotexture are extremely important
pavement in the development of surface friction
Primary Effects: Micro-texture/Macro-texture
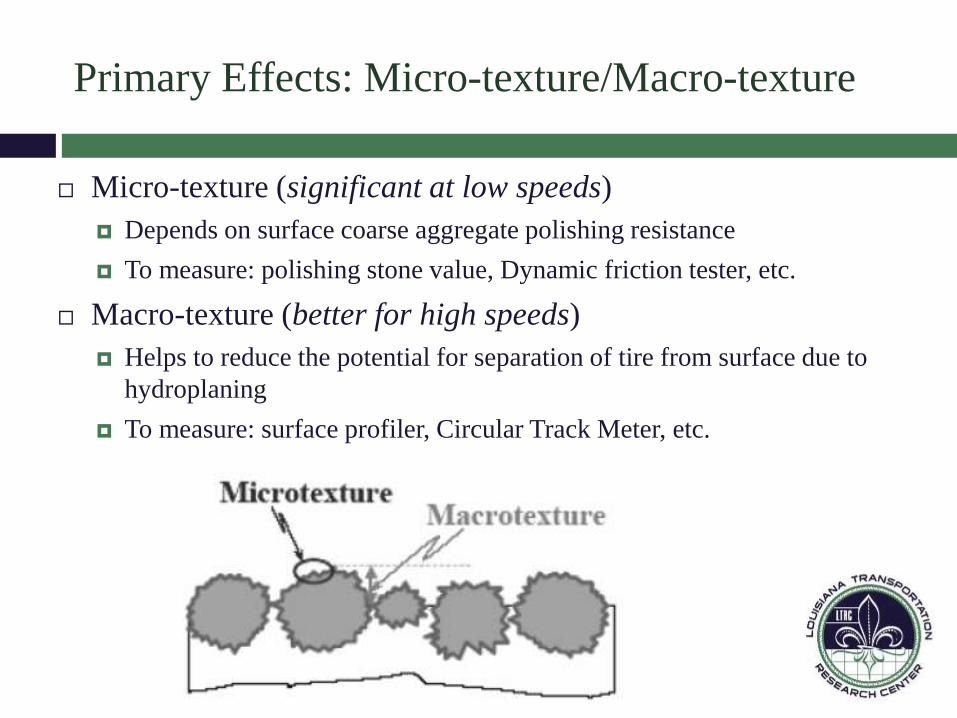
Micro-texture (significant at low speeds)
Depends on surface coarse aggregate polishing resistance
To measure: polishing stone value, Dynamic friction tester, etc.
Macro-texture (better for high speeds)
Helps to reduce the potential for separation of tire from surface due to
hydroplaning
To measure: surface profiler, Circular Track Meter, etc.
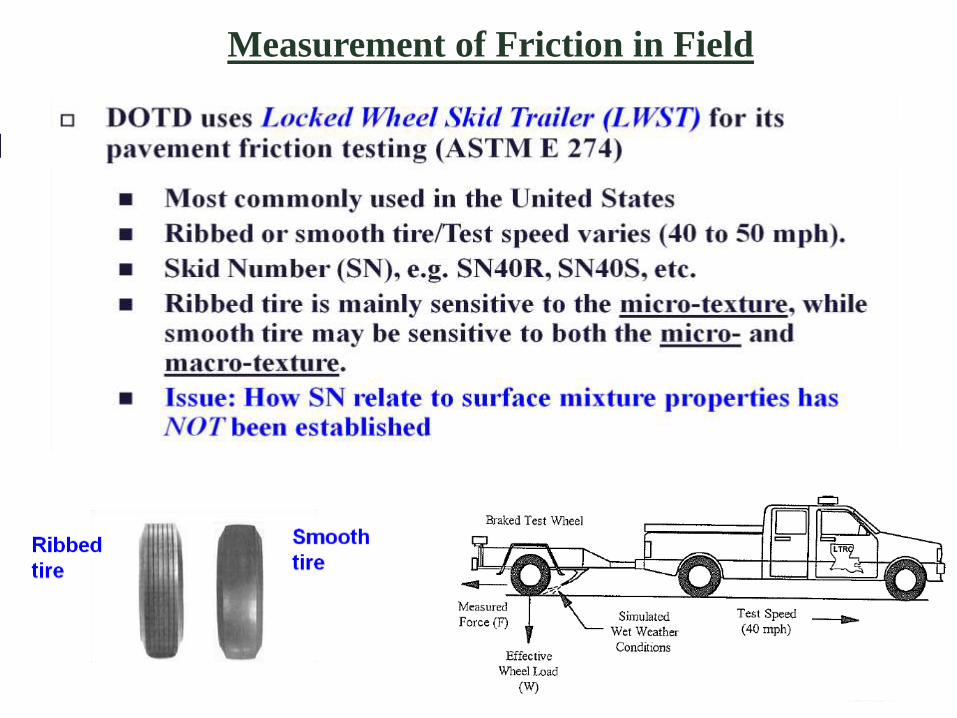
Measurement of Friction in Field

Measurement of Friction in Laboratory
--- Based solely upon Polish stone value (PSV) of coarse
aggregates – Micro-texture
- British Pendulum Tester
(BPT)
- Wessex Accelerated
Polishing Device
-Result: Polish Stone Value
(PSV)
-- BPT number on
polished aggregate surface
--Aggregate’s micro-
texture property
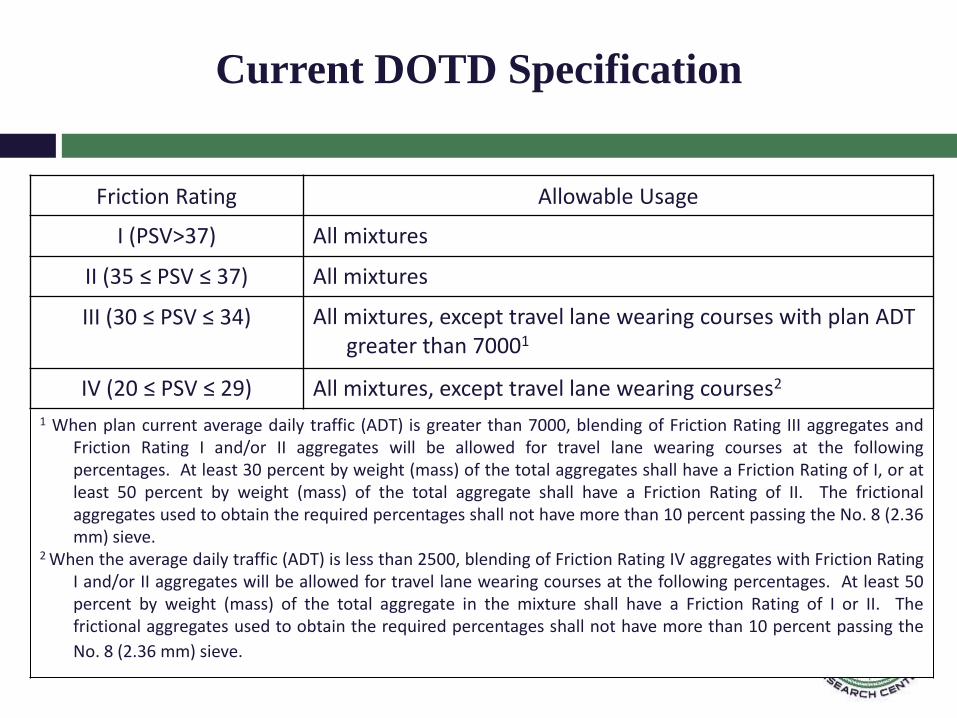
Current DOTD Specification
Friction Rating Allowable Usage
I (PSV>37) All mixtures
II (35 ≤ PSV ≤ 37) All mixtures
III (30 ≤ PSV ≤ 34) All mixtures, except travel lane wearing courses with plan ADT greater than 70001
IV (20 ≤ PSV ≤ 29) All mixtures, except travel lane wearing courses2
1 When plan current average daily traffic (ADT) is greater than 7000, blending of Friction Rating III aggregates and Friction Rating I and/or II aggregates will be allowed for travel lane wearing courses at the following percentages. At least 30 percent by weight (mass) of the total aggregates shall have a Friction Rating of I, or at least 50 percent by weight (mass) of the total aggregate shall have a Friction Rating of II. The frictional aggregates used to obtain the required percentages shall not have more than 10 percent passing the No. 8 (2.36 mm) sieve.
2 When the average daily traffic (ADT) is less than 2500, blending of Friction Rating IV aggregates with Friction Rating I and/or II aggregates will be allowed for travel lane wearing courses at the following percentages. At least 50 percent by weight (mass) of the total aggregate in the mixture shall have a Friction Rating of I or II. The frictional aggregates used to obtain the required percentages shall not have more than 10 percent passing the
No. 8 (2.36 mm) sieve.
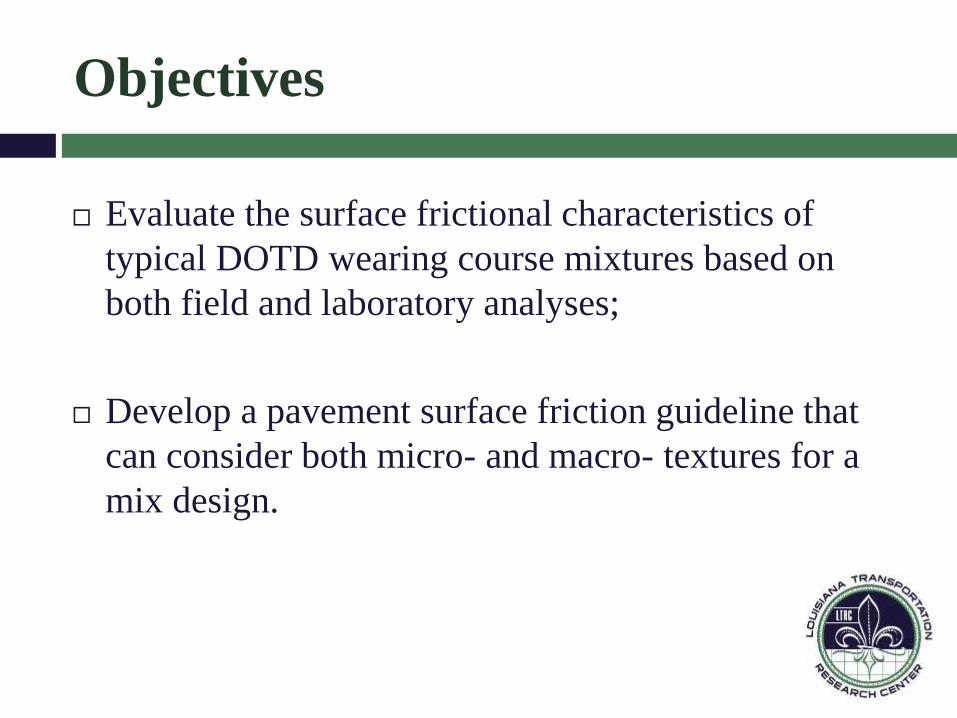
Objectives
Evaluate the surface frictional characteristics of
typical DOTD wearing course mixtures based on
both field and laboratory analyses;
Develop a pavement surface friction guideline that
can consider both micro- and macro- textures for a
mix design.
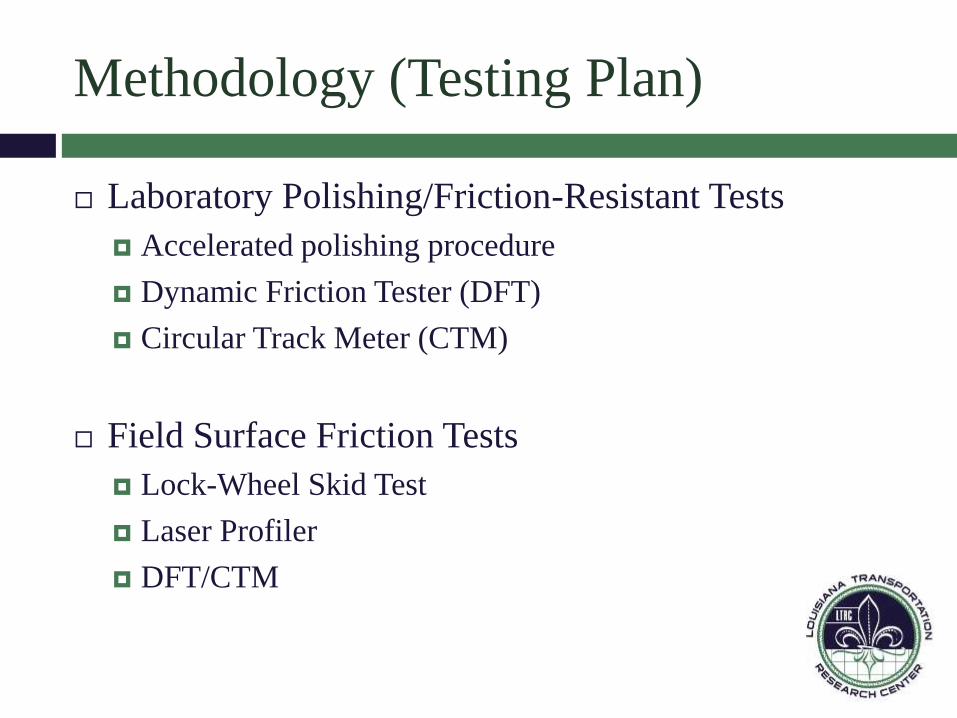
Methodology (Testing Plan)
Laboratory Polishing/Friction-Resistant Tests
Accelerated polishing procedure
Dynamic Friction Tester (DFT)
Circular Track Meter (CTM)
Field Surface Friction Tests
Lock-Wheel Skid Test
Laser Profiler
DFT/CTM

Accelerated Polishing Device
• Three-Wheel accelerated polishing device at the National Center of
Asphalt Technology (NCAT)
• Simulate the traffic-polishing effects on surface friction of slabs
• Normal load - 105 lb., pressure of pneumatic tires - 50 psi
Preparation of Testing Slab
(20”x20”x3”)
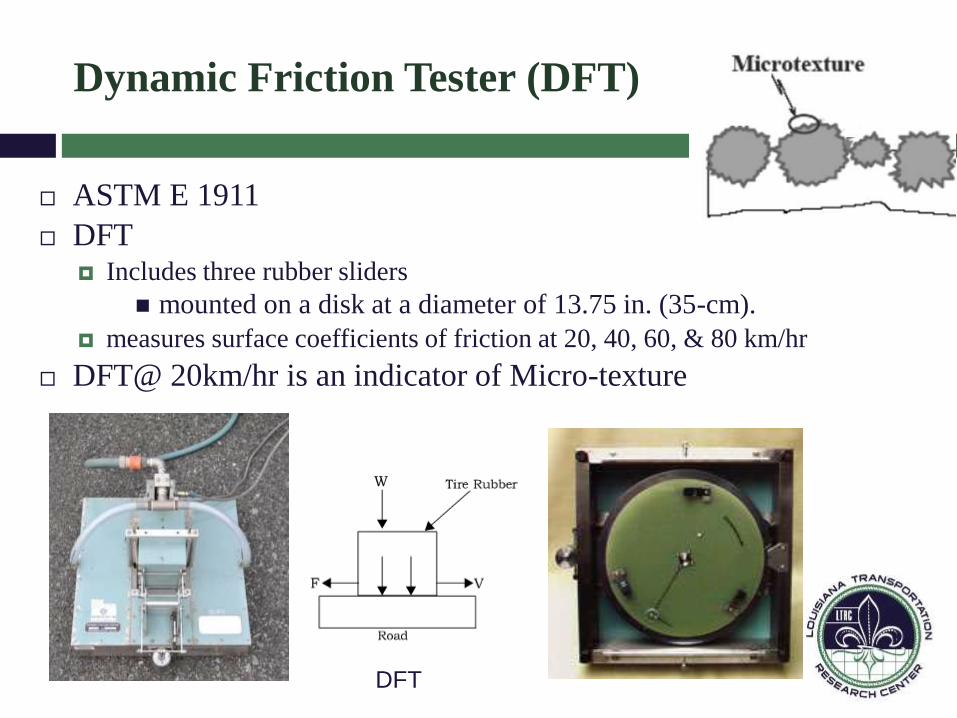
Dynamic Friction Tester (DFT)
ASTM E 1911
DFT Includes three rubber sliders
mounted on a disk at a diameter of 13.75 in. (35-cm).
measures surface coefficients of friction at 20, 40, 60, & 80 km/hr
DFT@ 20km/hr is an indicator of Micro-texture
DFT
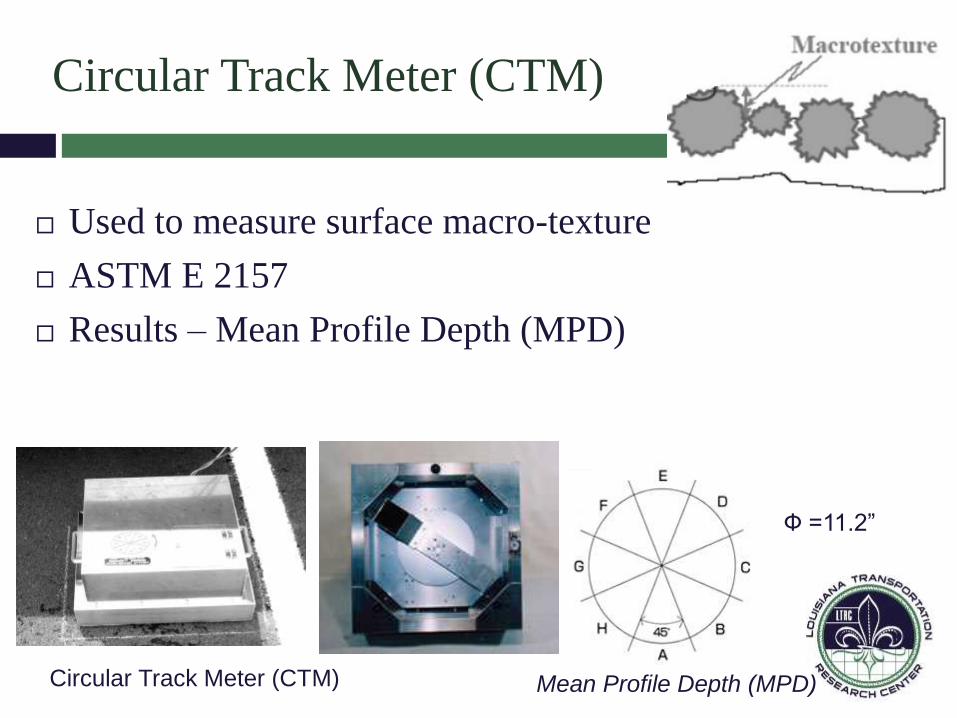
Circular Track Meter (CTM)
Used to measure surface macro-texture
ASTM E 2157
Results – Mean Profile Depth (MPD)
Circular Track Meter (CTM)
Ф =11.2”
Mean Profile Depth (MPD)
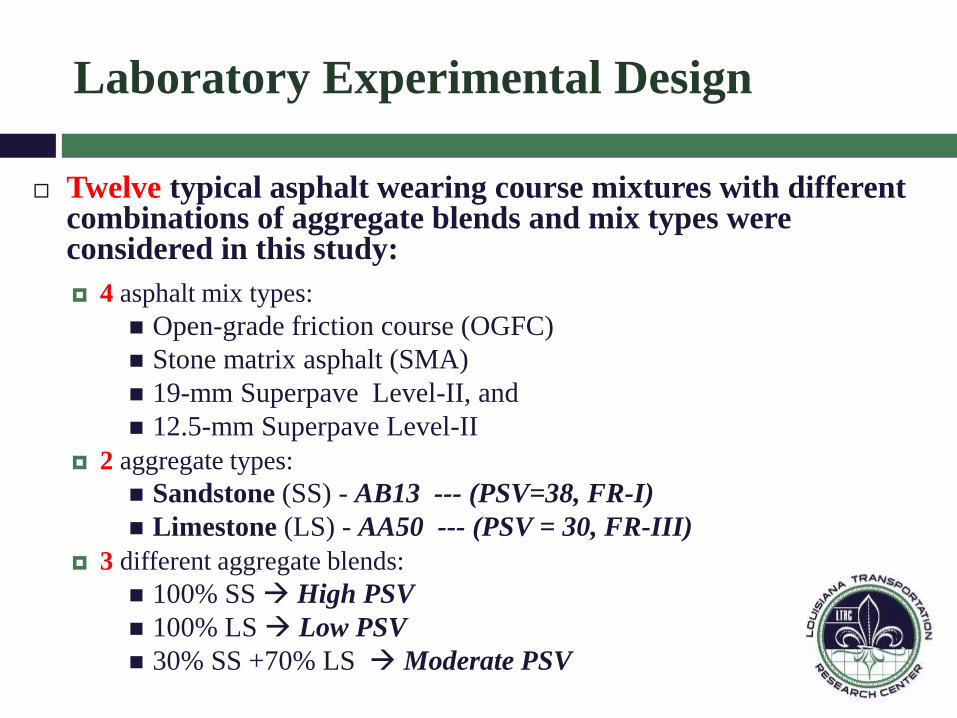
Laboratory Experimental Design
Twelve typical asphalt wearing course mixtures with different combinations of aggregate blends and mix types were considered in this study:
4 asphalt mix types:
Open-grade friction course (OGFC)
Stone matrix asphalt (SMA)
19-mm Superpave Level-II, and
12.5-mm Superpave Level-II
2 aggregate types:
Sandstone (SS) - AB13 --- (PSV=38, FR-I)
Limestone (LS) - AA50 --- (PSV = 30, FR-III)
3 different aggregate blends:
100% SS High PSV
100% LS Low PSV
30% SS +70% LS Moderate PSV
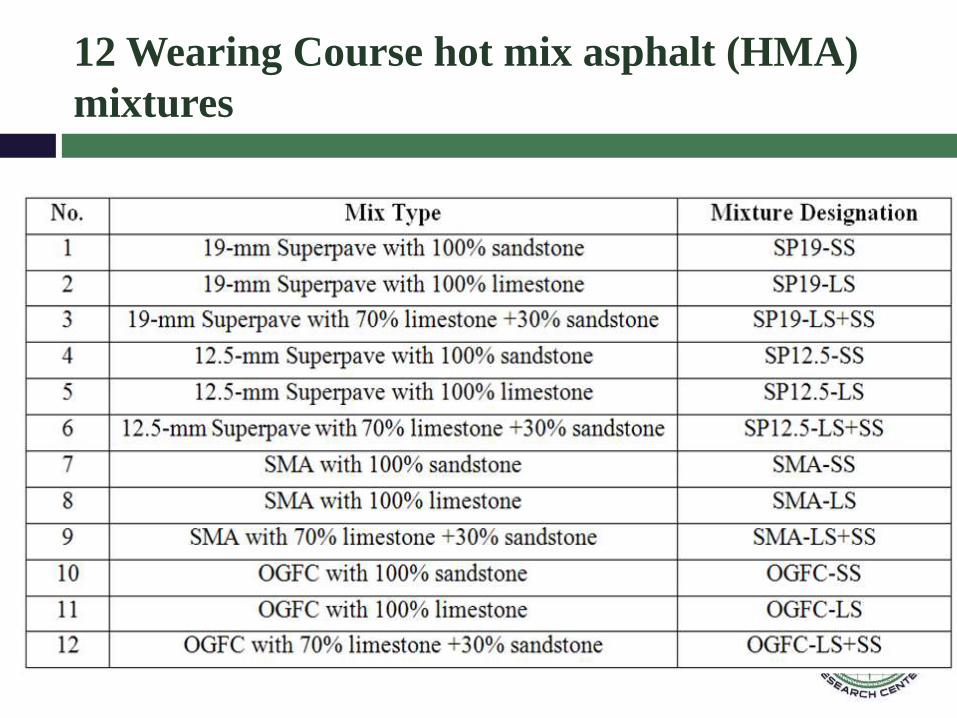
12 Wearing Course hot mix asphalt (HMA)
mixtures
Measurements on Polished Slabs
Totally 36 slabs prepared (12 mixtures x 3
replicates)
Each slab was polished up to 100,000 polishing
cycles
At the cycle periods of 0, 2, 5, 10, 30, 50, and
100 thousand cycles, the surface texture
properties were measured using
Dynamic Friction Tester (DFT)
Circular Tracker meter (CTM)

Discussion of Results

DFT Results

DFT Results (contd..)
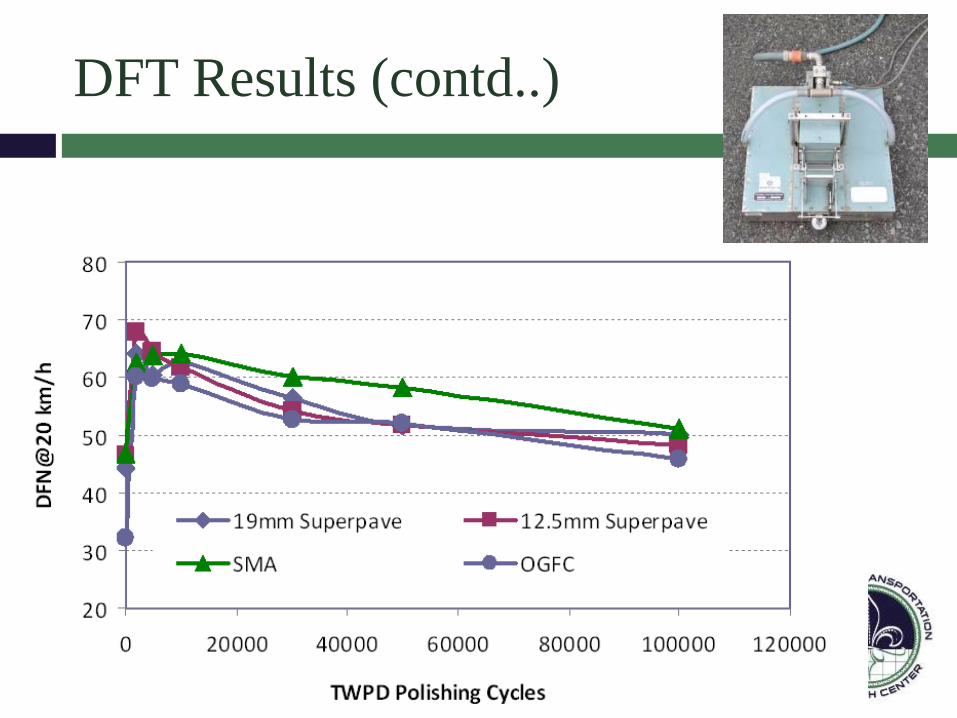
DFT Results (contd..)
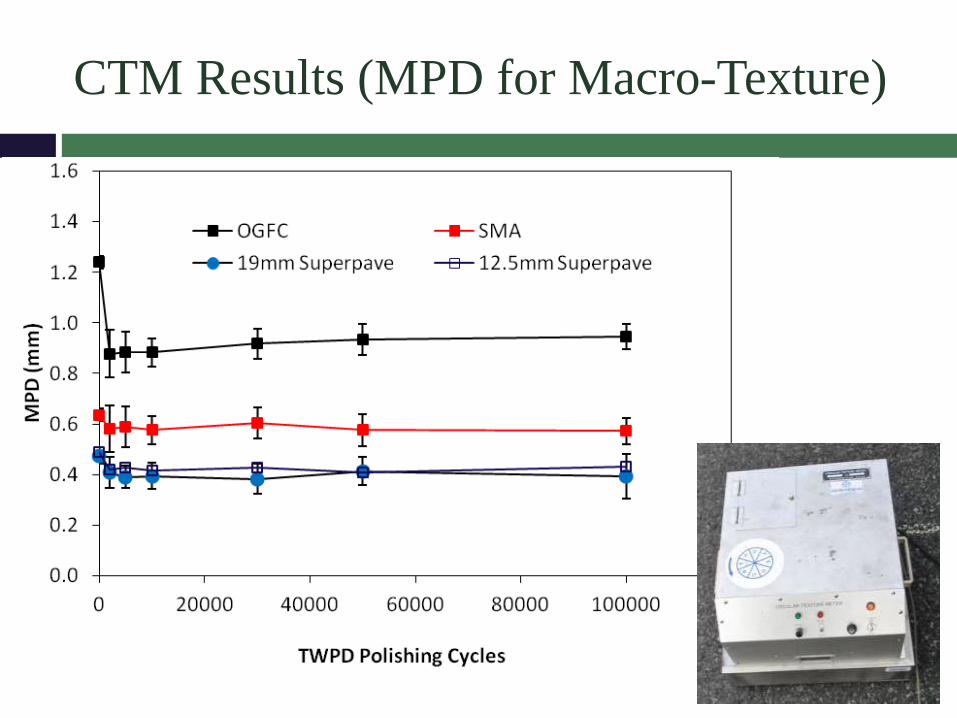
CTM Results (MPD for Macro-Texture)

F(60): a friction index combined both micro-
and macro- textures
International Friction Index (IFI)
Developed at the World Road Association-PIARC in France
Used to standardize the dependency of friction measurement by
different devices and tire sliding speeds.
Reported as IFI(F(60), Sp),
F(60) - Friction number at a slip speed of 60 km/hr,
Sp - Speed number

F(60) Results
10
20
30
40
0 10000 20000 30000 40000 50000 60000 70000 80000 90000 100000
F60
CYCLE 100% LIMESTONE, OGFC 100% Sandstone, OGFC 70/30 LS+SS, OGFC
100% LIMESTONE, 19 mm superpave 100% Sandstone, 19 mm superpave 70/30 LS+SS, 19 mm superpave
100% LIMESTONE, 12.5 m superpave 100% Sandstone, 12.5 mm superpave 70/30 LS+SS, 12.5 mm superpave
100% LIMESTONE, SMA 100% Sandstone, SMA 70/30 LS+SS, SMA
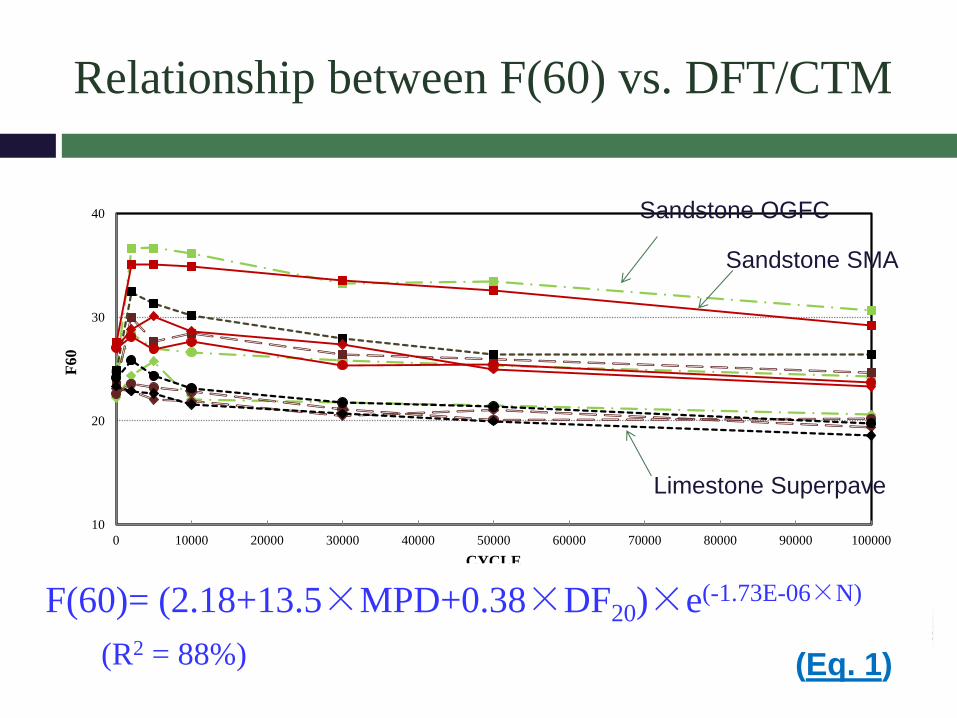
Sandstone OGFC
Sandstone SMA
Limestone Superpave

Effect of Micro- and Macro- Texture on Surface
Friction at different speeds
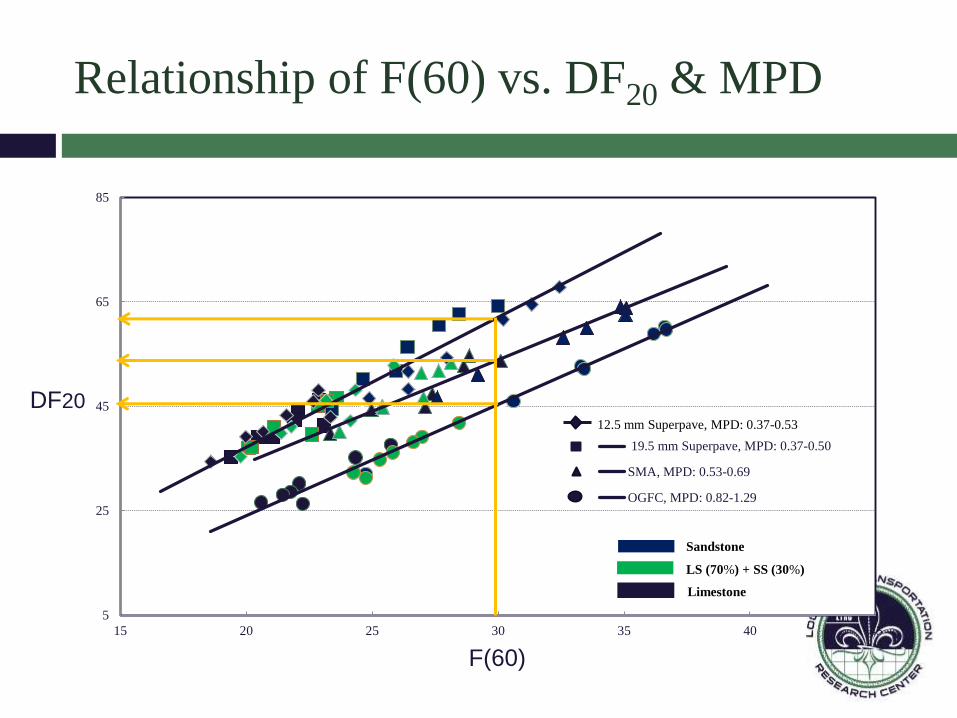
Relationship of F(60) vs. DF20 & MPD
5
25
45
65
85
15 20 25 30 35 40 45
DF
20
F(60)
19.5 mm Superpave, MPD: 0.37-0.50
SMA, MPD: 0.53-0.69
OGFC, MPD: 0.82-1.29
Limestone
12.5 mm Superpave, MPD: 0.37-0.53
Sandstone
LS (70%) + SS (30%)
F(60)
DF20
10
20
30
40
0 10000 20000 30000 40000 50000 60000 70000 80000 90000 100000
F60
CYCLE 100% LIMESTONE, OGFC 100% Sandstone, OGFC 70/30 LS+SS, OGFC
100% LIMESTONE, 19 mm superpave 100% Sandstone, 19 mm superpave 70/30 LS+SS, 19 mm superpave
100% LIMESTONE, 12.5 m superpave 100% Sandstone, 12.5 mm superpave 70/30 LS+SS, 12.5 mm superpave
100% LIMESTONE, SMA 100% Sandstone, SMA 70/30 LS+SS, SMA
Relationship between F(60) vs. DFT/CTM
Sandstone OGFC
Sandstone SMA
Limestone Superpave
F(60)= (2.18+13.5×MPD+0.38×DF20)×e(-1.73E-06×N)
(R2 = 88%)
(Eq. 1)
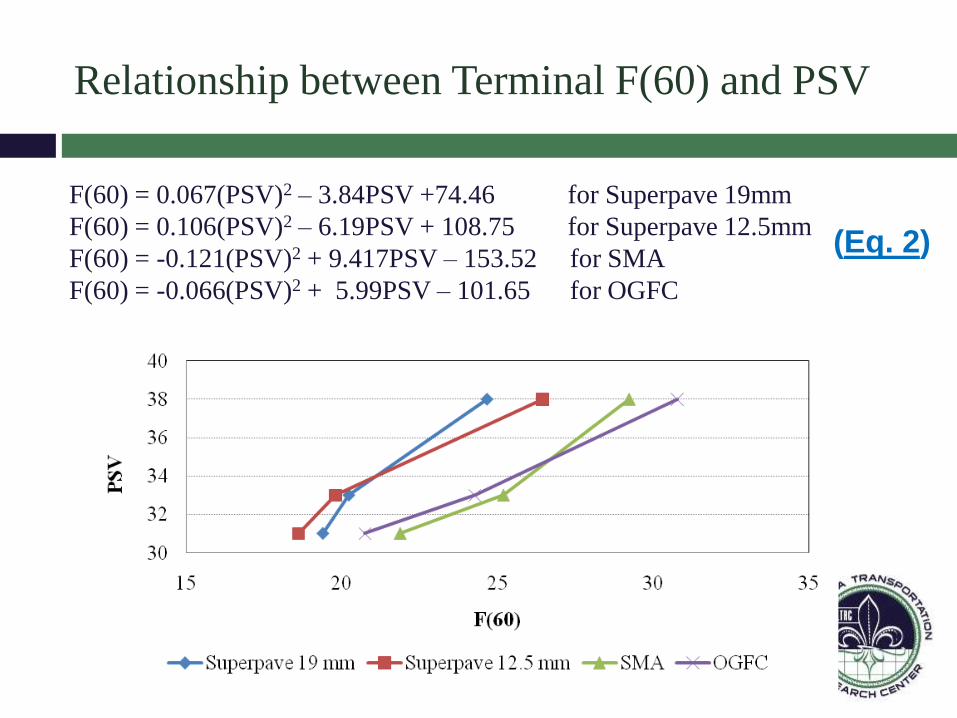
Relationship between Terminal F(60) and PSV
F(60) = 0.067(PSV)2 – 3.84PSV +74.46 for Superpave 19mm
F(60) = 0.106(PSV)2 – 6.19PSV + 108.75 for Superpave 12.5mm
F(60) = -0.121(PSV)2 + 9.417PSV – 153.52 for SMA
F(60) = -0.066(PSV)2 + 5.99PSV – 101.65 for OGFC
(Eq. 2)

Relationship between F(60) and SN
F(60) = 0.649 SN(50R) + 0.0572
• SN data obtained from a 19-mm Superpave mixture
(Eq. 3)
where
SN(50R) – skid number at 50 mile/hr with a ribbed tire.
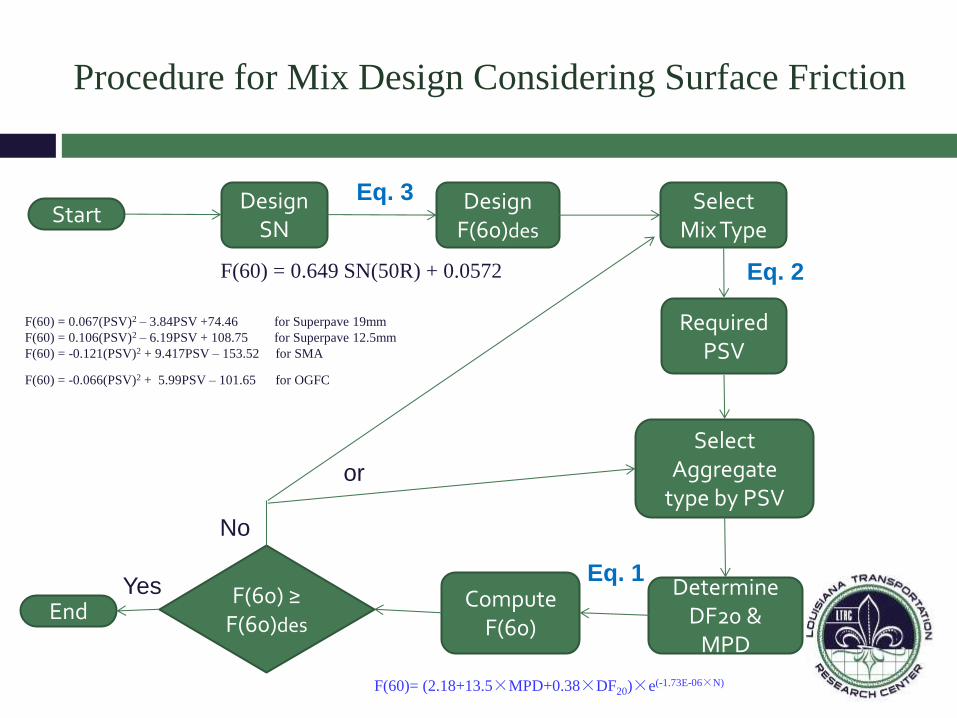
Procedure for Mix Design Considering Surface Friction
Design SN
Design F(60)des
Select Mix Type
Determine DF20 &
MPD
Select Aggregate
type by PSV
Required PSV
Compute F(60)
F(60) ≥ F(60)des
End
Start Eq. 3
Eq. 1
Eq. 2
or
Yes
No
F(60) = 0.649 SN(50R) + 0.0572
F(60) = 0.067(PSV)2 – 3.84PSV +74.46 for Superpave 19mm
F(60) = 0.106(PSV)2 – 6.19PSV + 108.75 for Superpave 12.5mm
F(60) = -0.121(PSV)2 + 9.417PSV – 153.52 for SMA
F(60) = -0.066(PSV)2 + 5.99PSV – 101.65 for OGFC
F(60)= (2.18+13.5×MPD+0.38×DF20)×e(-1.73E-06×N)

On-Going Field Test Results
Currently, we have tested 20 field projects, among them included:
12 Superpave
4 OGFC
3 SMA
1 warm mix
Each selected project was 1000-ft long, following tests were conducted
LWST rib/smooth (40 or 50 mph)
Laser profile
DFT
CTM

On-Going Field Test Results (contd..)
Based on the limited data, the following
harmonization correlations were determined:
SN(R) = f (DFT20, MPD)
SN(S) = f (DFT20, MPD)
T.I = N1.76/exp(15.14)
Our ultimate goal is to determine DFT/MPD
requirements for a lab-prepared slab
By specifying the levels of DFT and MPD, a certain level
of field SN will be achieved
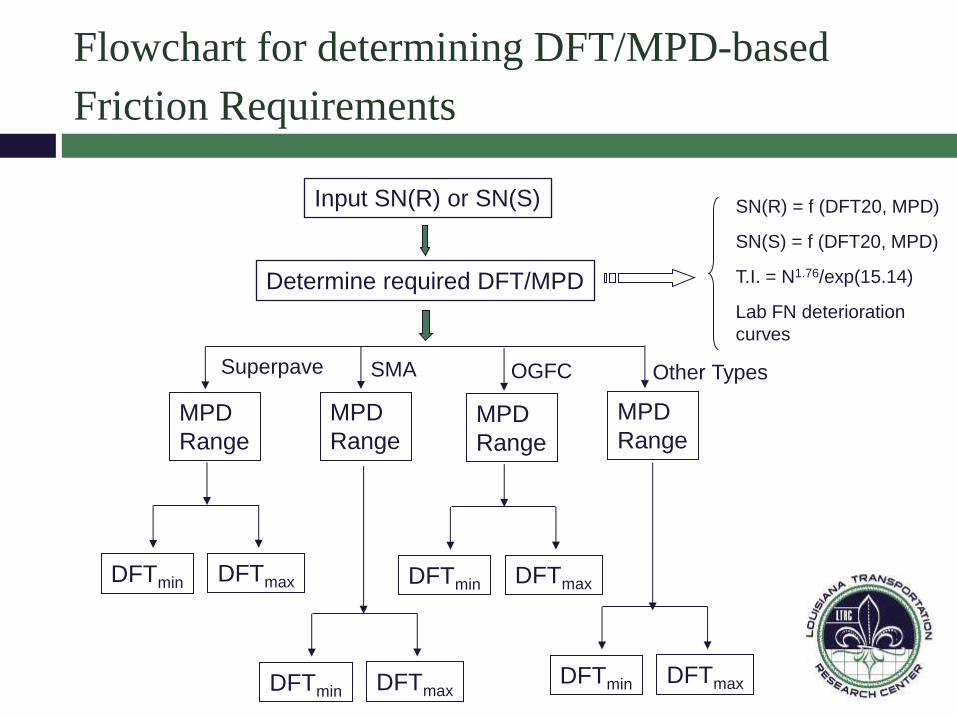
Flowchart for determining DFT/MPD-based
Friction Requirements
Determine required DFT/MPD
Input SN(R) or SN(S)
Superpave SMA OGFC Other Types
MPD
Range
MPD
Range MPD
Range
MPD
Range
DFTmin DFTmax DFTmin DFTmax
DFTmin DFTmax DFTmin DFTmax
SN(R) = f (DFT20, MPD)
SN(S) = f (DFT20, MPD)
T.I. = N1.76/exp(15.14)
Lab FN deterioration
curves
Conclusions
DFT/CTM tests are sensitive to asphalt mixture type and aggregate type
Polishing-resistant aggregates have higher DFT number
In terms of macro-texture (MPD):
OGFC > SMA > Superpave
Laboratory mix design can consider both micro- and macro- textures to produce a cost-effective, friction resistant mixes.
The procedure can also assist in the use of lower skid-resistant, locally-available aggregates in a wearing course mix design,

Questions?