Embed Size (px)
Citation preview
Evaluation of Gas Chromatography/Matrix Isolation-Infrared Spectroscopy for the Quantitative Analysis of Environmental Samples
JOHN F. SCHNEIDER,* KEN R. SCHNEIDER, STEPHANIE E. SPIRO, DOUGLAS R. BIERMA, and LOUIS F. SYTSMA Analytical Chemistry Laboratory, Chemical Technology Division, Argonne National Laboratory, 9700 South Cass Avenue, Argonne, Illinois 60439
Gas chromatography/matrix isolation-infrared spectrometry (GC/MI- IR) is being applied to many analyses previously done only by gas chro- matography/mass spectrometry (GC/MS). Qualitatively, the infrared spectra of matrix-isolated compounds contain much information about their structure. The information obtained from the infrared spectrum is complementary to the information obtained from mass spectrometry. The technique of GC/MI-IR should also be useful as a quantitative detector. In this study, semivolatile priority pollutant mixtures were analyzed quantitatively by GC/MI-IR. Results were compared with re- sults obtained by GC/MS. Calibration curves were obtained on the GC/
Received 27 October 1990; revision received 10 December 1990. * Author to whom correspondence should be sent.
MI-IR for several semivolatile priority pollutants to measure the pre- cision and linearity of this technique. The results indicated that GC/ MI-IR, in its current form, is only suitable for semiquantitative work. Index Headings: Infrared; Instrumentation; GC/MI-IR; Analytical methods.
INTRODUCTION
Gas c h r o m a t o g r a p h y / m a t r i x i s o l a t i o n - i n f r a r e d spec- t roscopy ( G C / M I - I R ) was deve loped a t A r g o n n e N a t i o n - al L a b o r a t o r y (ANL) by R e e d y a n d co-workers T M a n d has b e e n shown to be a very usefu l q u a l i t a t i v e a n a l y t i c a l
A b S
0
P
b a
rl
C
e
0.045 __
0.040
0 . 0 3 5 ~
0.030
0.025
0.020
0.0:15
O.OiO __
0.005
0 . 0 0 0 _
ARGONNE
5.5 6.0 6.5 7.0
[ ] 1 I ~---. L 2 - D I O L ~ 7 . E t 4 E
NATIONAL LAB 6C/MI-IR H:1cPons
8 . 0 9 . 0 :10.0 :t2
I I I I i4
' l ' ' ' I l , I ' ' ' J '
:1800 :1600 i400 :1200
Wavenumber Fro. 1.
1 I ' J ' I
i000 800
Inf ra red spec t rum of ~80 ng mat r ix - i so la ted 1,2-dichlorobenzene.
566 V o l u m e 45, N u m b e r 4, 1991 0003-7028/91/4504-056652.00/0 A P P L I E D S P E C T R O S C O P Y © 1991 Society for Applied Spectroscopy
0.040 __
0.035 __
0.030 _ _
0.025 _ _
0.020 _ _
0.0t5 _ _
0.010 _ _
0.005 _ _
0 . 0 0 0 - -
-0.005 _
' I | ' 1 ]800 t600
5.5 6.0
I [ -- L 3-OICHLOROSENZE~E
ARGONNE NATIONAL LAB Microns
6.5 7.0 8.0
I I I
GC/MI-IR
9.0 t0.0
t 1
A
b
S
0
r
b a
n
c
e
I , | I [ 1400 ,1200
FIG. 2.
l
iO00 600
Wavenumber Infrared spectrum of ~80 ng matrix-isolated 1,3-dichlorobenzene.
12 ~4
I
+1 techniqueP -23 The components eluting off the GC column are trapped in a narrow (~0.3 mm) strip of frozen argon. Trapping the sample in a small area and focusing the IR beam on the spot with parabolic mirrors give GC/MI-IR detection limits of 0.1 to 5 ng, which is in the same range as quadrupole gas chromatography/mass spectroscopy (GC/MS). Thus, GC/MI-IR is an attractive candidate for quantitative determination of semivolatile priority pollutants in environmental samples.
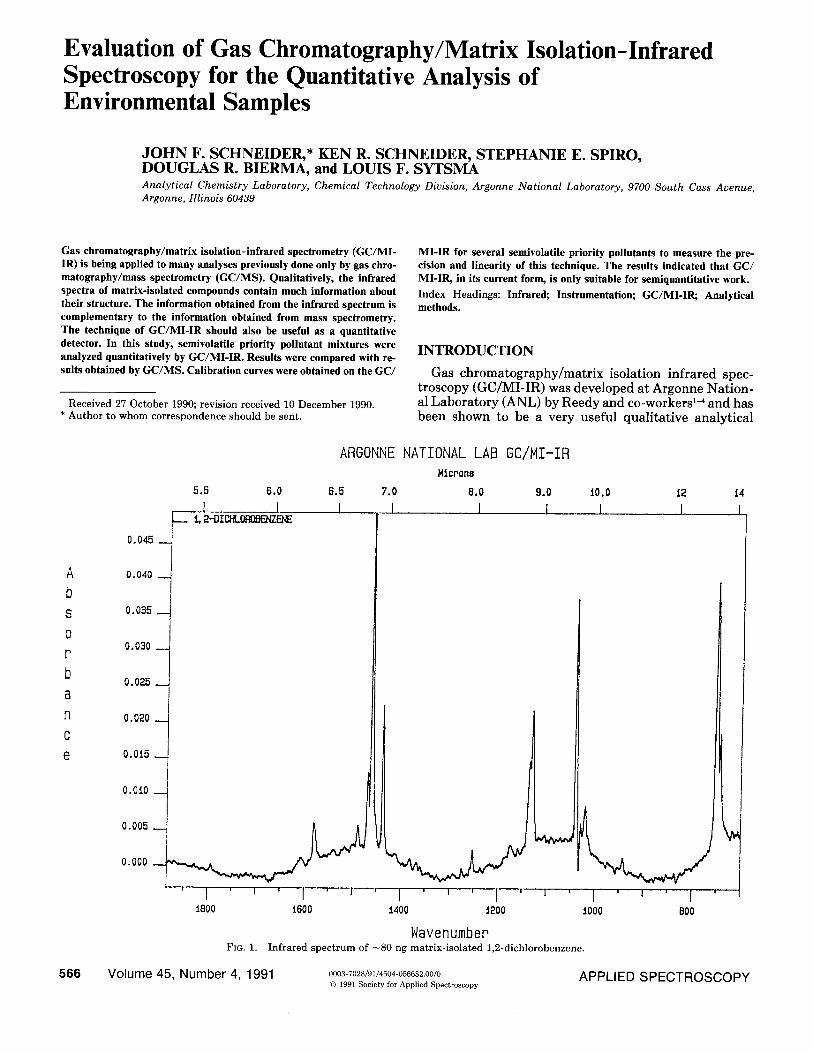
The IR spectra of matrix-isolated compounds contain very sharp absorption peaks. Because of the high-quality spectra, the MI-IR technique is well suited for the iden- tification of targeted compounds with known matrix- isolated IR spectra; even when other compounds coelute, identifications can usually be made. The information ob- tained from the IR spectrum complements the infor- mation obtained from GC/MS. The combination is a very powerful tool for elucidating the structure of unknown compounds, especially isomers and other compounds that yield similar mass spectra. 23 Figures 1-3 illustrate the utility of GC/MI-IR for distinguishing among isomers. The sharp absorption peaks are well suited to comput- erized library searching.
The GC/light pipe-IR technique has poorer limits of detection 24-27 but also produces high-quality spectra. The
GC/cryogenic trapping-IR technique, 2s recently intro- duced commercially, has very good sensitivity but yields condensed-phase spectra which lack the sharp absorp- tion peaks characteristic of vapor-phase and matrix-iso- lated spectra. The broad-banded spectra produced by this technique may make positive identification of com- pounds more difficult, particularly when coeluting com- pounds complicate the spectrum. Hence, GC/MI-IR ap- pears to be the best GC/IR technique for the low-level detection and positive identification of pollutants in en- vironmental samples, especially for isomers or coeluting compounds. The utility of GC/MI-IR for determining dioxins at picogram levels has been demonstrated, z3-1s
Our GC/MI-IR system has been interfaced with a mass spectrometer. The resulting system is very useful in the qualitative analysis of unknown compounds. The ability to obtain quantitative information from GC/MI-IR would be useful in confirming quantitative results obtained by GC/MS. The ability of GC/MI-IR to produce reliable quantitative data is examined in this paper. We sought to evaluate our GC/MI-IR instrument for quantitative analysis of two samples spiked with semivolatile priority pollutants. To this end, we compared the results obtained by GC/MI-IR with those from GC/MS and obtained cal- ibration curves with the GC/MI-IR.
APPLIED SPECTROSCOPY 567
A
b S
0
P
b a
n
c
e
0.060 _ _
0.050 _ _
0.040 __
0.030 _ _
0.020 _ _
0.010 __
0.000 __
ARGONNE NATIONAL LAB GC/MI-IR Microns
5.5 6.0 6.5 7.0 8.0 9.0 10.0 12
I I 1 I I I I - - L 4-DIC~_{~O~]ENZENE
i4
m , i l ~ i i i i i i
l 1 ' 1 l , I 18oo t6oo t4oo t2oo tooo eoo
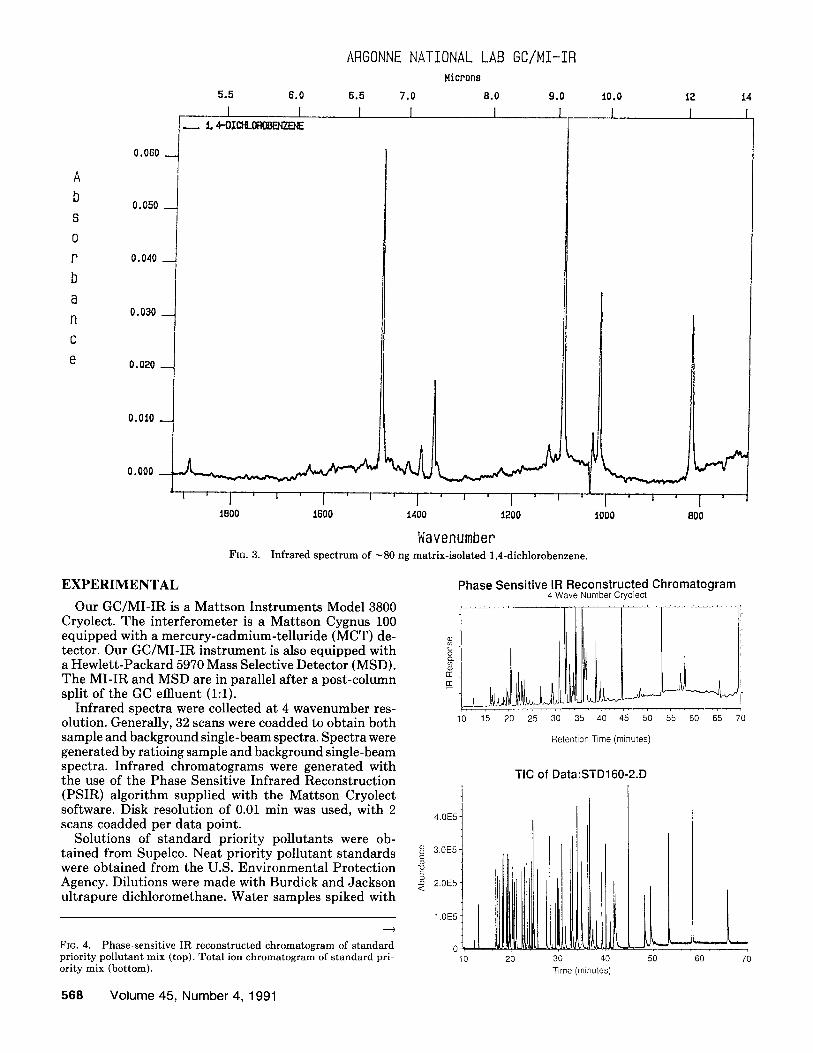
Wavenumber FIG. 3. Infrared spectrum of ~80 ng matrix-isolated 1,4-dichlorobenzene.
EXPERIMENTAL
Our GC/MI-IR is a Mattson Instruments Model 3800 Cryolect. The interferometer is a Mattson Cygnus 100 equipped with a mercury-cadmium-telluride (MCT) de- tector. Our GC/MI-IR instrument is also equipped with a Hewlett-Packard 5970 Mass Selective Detector (MSD). The MI-IR and MSD are in parallel after a post-column split of the GC effluent (1:1).
Infrared spectra were collected at 4 wavenumber res- olution. Generally, 32 scans were coadded to obtain both sample and background single-beam spectra. Spectra were generated by ratioing sample and background single-beam spectra. Infrared chromatograms were generated with the use of the Phase Sensitive Infrared Reconstruction (PSIR) algorithm supplied with the Mattson Cryolect software. Disk resolution of 0.01 min was used, with 2 scans coadded per data point.
Solutions of standard priority pollutants were ob- tained from Supelco. Neat priority pollutant standards were obtained from the U.S. Environmental Protection Agency. Dilutions were made with Burdick and Jackson ultrapure dichloromethane. Water samples spiked with
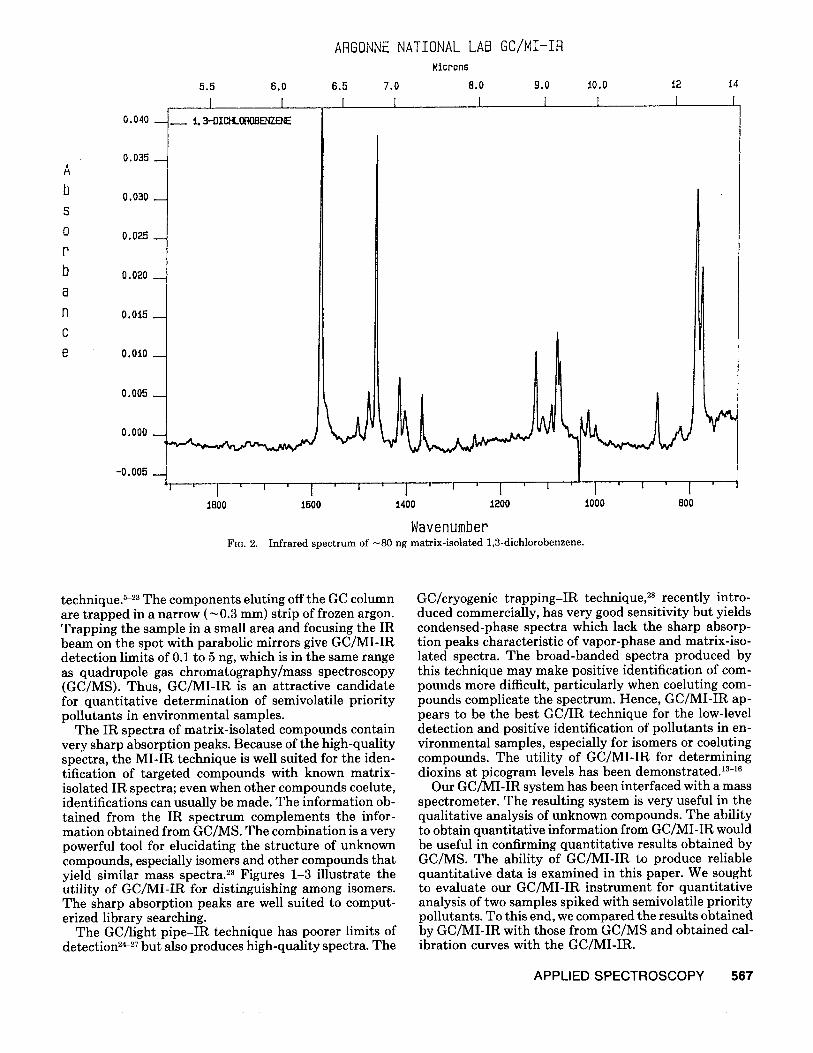
FIG. 4. Phase-sensitive IR reconstructed chromatogram of standard priority pollutant mix (top). Total ion chromatogram of standard pri- ority mix (bottom).
Phase Sensitive IR Reconstructed Chromatogram 4 Wave Number Cr iolect
10 15 20 25 30 35 40 45 50 55 60 65 70
Retention Time (minutes)
4.0E5
3.0E5 c
-.~ 2.0E5 <
1.0E5
TIC of Data:STD160-2.D
10 20 30 40 50 60 70 Time (minutes)
568 Volume 45, Number 4, 1991
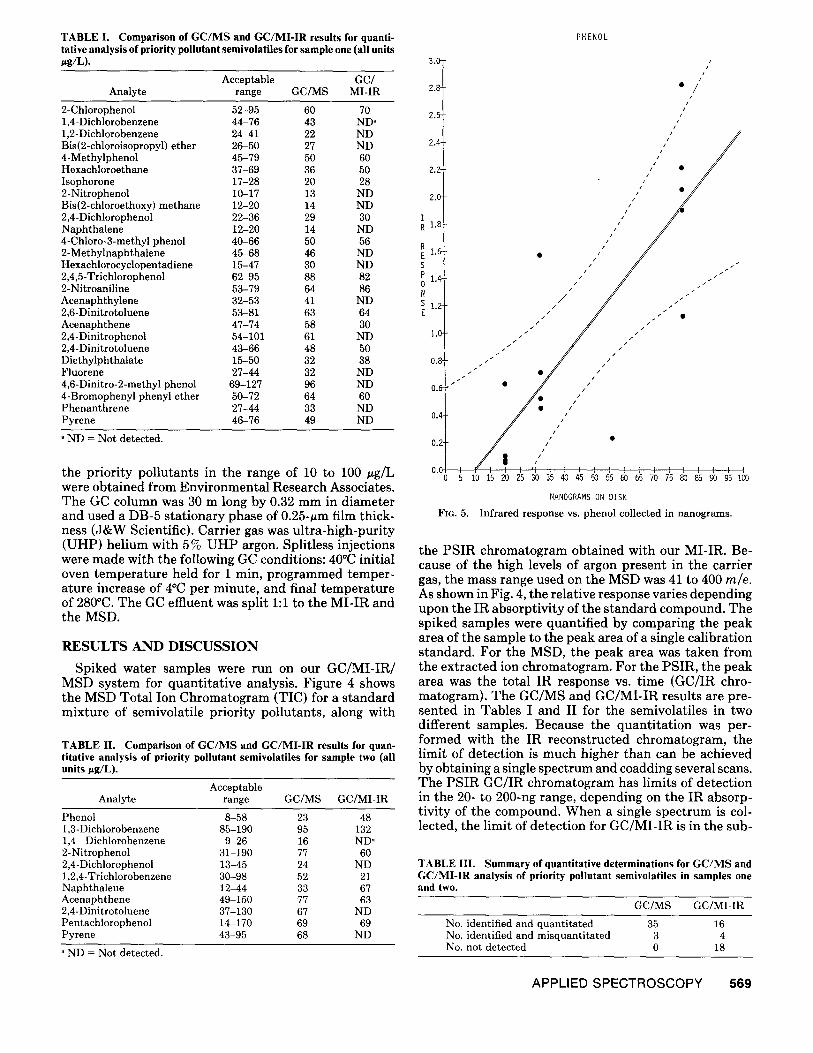
TABLE I. Comparison of G C / M S and GC/MI-IR results for quanti- tative analysis of priority pollutant semivolatiles for sample one (all units ~g/L).
Acceptable GC/ Analyte range GC/MS MI-IR
2-Chlorophenol 52-95 60 70 1,4-Dichlorobenzene 44-76 43 ND a 1,2-Dichlorobenzene 24-41 22 ND Bis(2-chloroisopropyl) ether 26-50 27 ND 4 -Methylphenol 45-79 50 60 Hexachloroethane 37-69 36 50 Isophorone 17-28 20 28 2-Nitrophenol 10-17 13 ND Bis(2-chloroethoxy) methane 12-20 14 ND 2,4-Dichlorophenol 22-36 29 30 Naphthalene 12-20 14 ND 4-Chloro-3-methyl phenol 40-66 50 56 2-Methylnaphthalene 45-68 46 ND Hexachlorocyclopentadiene 15-47 30 ND 2,4,5-Trichlorophenol 62-95 88 82 2-Nitroaniline 53-79 64 86 Acenaphthylene 32-53 41 ND 2,6-Dinitrotoluene 53-81 63 64 Acenaphthene 47-74 58 30 2,4-Dinitrophenol 54-101 61 ND 2,4-Dinitrotoluene 43-66 48 50 Diethylphthalate 15-50 32 38 Fluorene 27-44 32 ND 4,6-Dinitro-2-methyl phenol 69-127 96 ND 4-Bromophenyl phenyl ether 50-72 64 60 Phenanthrene 27-44 33 ND Pyrene 46-76 49 ND
ND = Not detected.
the priority pollutants in the range of 10 to 100 ttg/L were obtained from Environmental Research Associates. The GC column was 30 m long by 0.32 mm in diameter and used a DB-5 stationary phase of 0.25-ttm film thick- ness (J&W Scientific). Carrier gas was ultra-high-purity (UHP) helium with 5% UHP argon. Splitless injections were made with the following GC conditions: 40°C initial oven temperature held for 1 min, programmed temper- ature increase of 4°C per minute, and final temperature of 280°C. The GC effluent was split 1:1 to the MI-IR and the MSD.
RESULTS AND DISCUSSION
Spiked water samples were run on our GC/MI-IR/ MSD system for quantitative analysis. Figure 4 shows the MSD Total Ion Chromatogram (TIC) for a standard mixture of semivolatile priority pollutants, along with
TABLE II. Comparison of G C / M S and GC/MI-IR results for quan- titative analysis of priority pollutant semivolatiles for sample two (all units ug/L).
Acceptable Analyte range GC/MS GC/MI-IR
Phenol 8-58 23 48 1,3-Dichlorobenzene 85-190 95 132 1,4 Dichlorobenzene 9-26 16 ND" 2-Nitrophenol 31-190 77 60 2,4-Dichlorophenol 13-45 24 ND 1,2,4-Trichlorobenzene 30-98 52 21 Naphthalene 12-44 33 67 Acenaphthene 49-150 77 63 2,4-Dinitrotoluene 37-130 67 ND Pentachlorophenol 14-170 69 69 Pyrene 43-95 68 ND
ND = Not detected.
3.0-
2.8-
2.6-
2.4-
2.2-
2.0-
I R 1.8
R E 1.6- S P 1.4 0 NN S 1.2 E
1.0-
0.8-
0.6
0.4-
PHENOL
/ s J
/J
• / J /
""1 *
0.2-
0.0 I 0 5 I0 15 20 25 30 35 40 45 50 55 50 55 70 75 80 85 90 95 100
NANOGRAMS ON DISK
FIG. 5. Infrared response vs. phenol collected in nanograms.
the PSIR chromatogram obtained with our MI-IR. Be- cause of the high levels of argon present in the carrier gas, the mass range used on the MSD was 41 to 400 m/e. As shown in Fig. 4, the relative response varies depending upon the IR absorptivity of the standard compound. The spiked samples were quantified by comparing the peak area of the sample to the peak area of a single calibration standard. For the MSD, the peak area was taken from the extracted ion chromatogram. For the PSIR, the peak area was the total IR response vs. time (GC/IR chro- matogram). The GC/MS and GC/MI-IR results are pre- sented in Tables I and II for the semivolatiles in two different samples. Because the quantitation was per- formed with the IR reconstructed chromatogram, the limit of detection is much higher than can be achieved by obtaining a single spectrum and coadding several scans. The PSIR GC/IR chromatogram has limits of detection in the 20- to 200-ng range, depending on the IR absorp- tivity of the compound. When a single spectrum is col- lected, the limit of detection for GC/MI-IR is in the sub-
TABLE III. Summary of quantitative determinations for G C / M S and GC/MI-IR analysis of priority pollutant semivolatiles in samples one and two.
GC/MS GC/MI-IR
No. identified and quantitated 35 16 No. identified and misquantitated 3 4 No. not detected 0 18
APPLIED SPECTROSCOPY 569
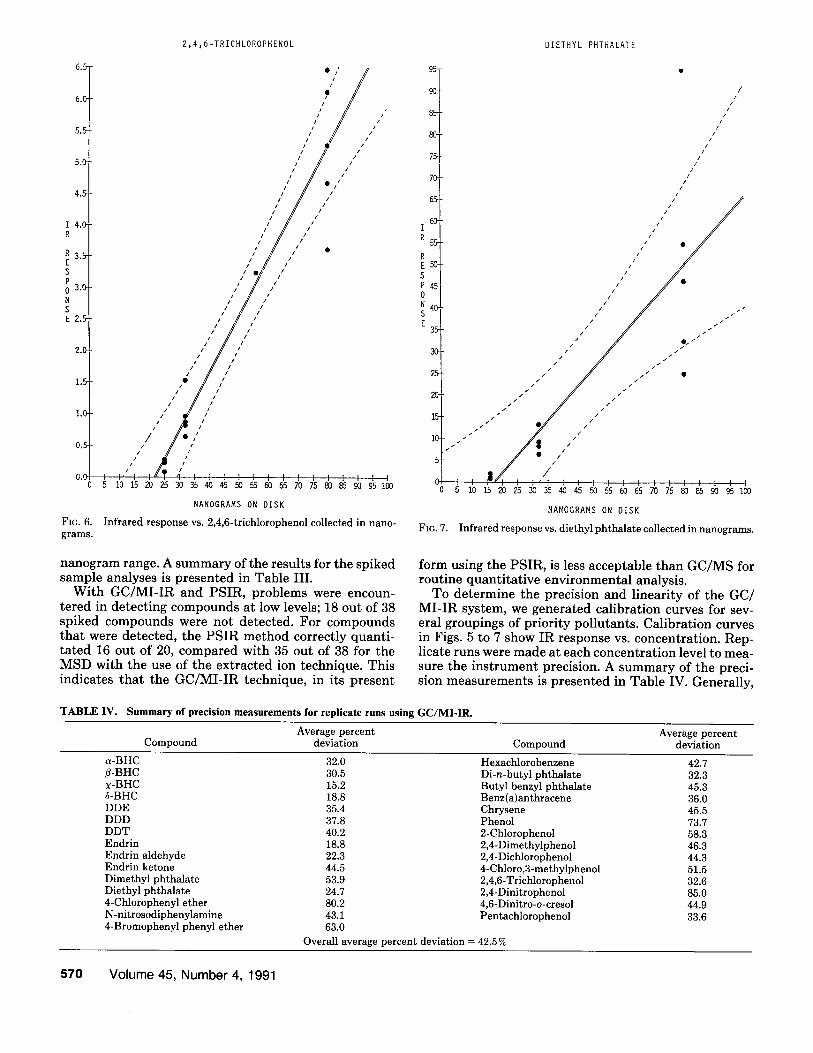
2,4,6-TRICHLOROPHENOL DIETHYL PHTHALATE
6.5
6.0
5.5
5.0
4.5
1 4.0 R
R 3.5 E S P O 3.0 N S E 2.5
2.0
1.5
1.0
0.5-
0.0
FIG. 6. grams.
I I
~ ] / / , ]/ "
/ / I /
// i ]
i / •
///
/ / g
J //
J ,/" /~' //// ~ /
I I' I ] '~ I ] I I F 1 I I I I I 5 10 15 20 25 30 35 40 45 .50 55 60 65 70 75 80 85 90 95 100
NANOGRAMS ON DISK
I n f r a r e d response vs. 2 , 4 , 6 - t r i c h l o r o p h e n o l co l lec ted i n nano -
I
/ / /
/ / , . .
/ f
/ /
/
f f
/
Q// I / i ]
/ /
" | /
0 5 10 15 20 255 30 35 40 45 50 55 50 65 70 75 80 85 90 95 100
NANOGRAMS ON DISK
FIG. 7. Infrared response vs. diethyl phthalate collected in nanograms.
nanogram range. A summary of the results for the spiked sample analyses is presented in Table III.
With GC/MI-IR and PSIR, problems were encoun- tered in detecting compounds at low levels; 18 out of 38 spiked compounds were not detected. For compounds that were detected, the PSIR method correctly quanti- tated 16 out of 20, compared with 35 out of 38 for the MSD with the use of the extracted ion technique. This indicates that the GC/MI-IR technique, in its present
form using the PSIR, is less acceptable than GC/MS for routine quantitative environmental analysis.
To determine the precision and linearity of the GC/ MI-IR system, we generated calibration curves for sev- eral groupings of priority pollutants. Calibration curves in Figs. 5 to 7 show IR response vs. concentration. Rep- licate runs were made at each concentration level to mea- sure the instrument precision. A summary of the preci- sion measurements is presented in Table IV. Generally,
T A B L E I V . S u m m a r y o f p r e c i s i o n m e a s u r e m e n t s f o r r e p l i c a t e r u n s u s i n g G C / M I - I R .
Average percent Average percent Compound deviation Compound deviation
a-BHC 32.0 Hexachlorobenzene 42.7 ~-BHC 30.5 Di-n-butyl phthalate 32.3 ×-BHC 15.2 Butyl benzyl phthalate 45.3 6-BHC 18.8 Benz(a)anthracene 36.0 DDE 35.4 Chrysene 45.5 DDD 37.8 Phenol 73.7 DDT 40.2 2-Chlorophenol 58.3 Endrin 18.8 2,4-Dimethylphenol 46.3 Endrin aldehyde 22.3 2,4-Dichlorophenol 44.3 Endrin ketone 44.5 4-Chloro,3-methylphenol 51.5 Dimethyl phthalate 53.9 2,4,6 -Trichlorophenol 32.6 Diethyl phthalate 24.7 2,4-Dinitrophenol 85.0 4-Chlorophenyl ether 80.2 4,6-Dinitro-o-cresol 44.9 N-nitrosodiphenylamine 43.1 Pentachlorophenol 33.6 4-Bromophenyl phenyl ether 63.0
Overall average percent deviation = 42.5%
570 Volume 45, Number 4, 1991
reproducibility ranged from 20 to 50 % relative standard deviation. Reproducibility was measured by using (1) the area of the infrared reconstructed chromatogram and (2) the absorbance value of selected wavenumbers for each compound. Both methods gave similar results. The pre- cision is poorer than one would expect for a quantitative technique and is in the range usually labeled "semi- quantitative."
The reproducibility reported here is based upon ex- ternal standard calibration and general techniques for quantitating a large number of compounds. Improved precision can be obtained by using an internal standard and more specific techniques for quantitating a single targeted compound. TM
CONCLUSION
The MI-IR technique can produce quantitative data, TM
as can GC. Therefore, the combined technique GC/MI- IR should be capable of producing quantitative data. However, the GC/MI-IR system used in this study pro- duced results with reproducibility in a range that is only suitable for semiquantitative work. Similar results have been obtained in other laboratories. No likely Single source of error was identified; however, the lengthy transfer line and the positioning of the deposition tip are two possible sources.
The GC/MI-IR technique is very useful for qualitative analysis of compounds at trace levels. This technique produces excellent spectroscopic information and is best suited for nonroutine analysis where positive identifi- cation of compounds is required.
ACKNOWLEDGMENTS
Although the research described in this article has been funded whol- ly or in part by the United States Environmental Protection Agency through Contract 68-D2-0002 to the Illinois Institute of Technology Research Institute, it has not been subjected to Agency review and therefore does not necessarily reflect the views of the Agency, and no official endorsement should be inferred. The authors wish to thank N. Wilson and J. Childers for valuable discussions and for reviewing this article.
1. G. T. Reedy, S. Bourne, and P. T. Cunningham, Anal. Chem. 51, 1535 (1979).
2. S. Bourne, G. T. Reedy, and P. T. Cunningham, J. Chromatogr. Sci. 17, 460 (1979).
3. G. T. Reedy, D. G. Ettinger, J. F. Schneider, and S. Bourne, Anal. Chem. 57, 1602 (1985).
4. S. Bourne, G. T. Reedy, P. J. Coffey, and D. Mattson, Am. Lab. 16, 90 (1984).
5. J. F. Schneider, G. T. Reedy, and D. G. Ettinger, J. Chromatogr. Sci. 23, 49 (1985).
6. C. J. Wurrey, R. D. Kleopfer, and S. Bourne, Anal. Chem. 58, 482 (1986).
7. W. M. Coleman III and B. M. Gordon, Appl. Spectrosc. 43, 298 (1989).
8. W. M. Coleman III and B. M. Gordon, Appl. Spectrosc. 43, 305 (1989).
9. W. M. Coleman III and B. M. Gordon, Appl. Spectrosc. 43, 998 (1989).
10. W. M. Coleman III and B. M. Gordon, Appl. Spectrosc. 43, 1004 (1989).
11. W. M. Coleman III and B. M. Gordon, Appl. Spectrosc. 43, 1008 (1989).
12. W. M. Coleman III and B. M. Gordon, Appl. Spectrosc. 43, 1424 (1989).
13. T. T. Holloway, B. J. Fairless, C. E. Freidline, H. E. Kimball, R. D. Kloepfer, C. J. Wurrey, L. A. Jonooby, and H. G. Palmer, Appl. Spectrosc. 42, 359 (1988).
14. M. M. Mossoba, J. T. Chert, W. C. Brumley, and S. W. Page, Anal. Chem. 60, 945 (1988).
15. M. M. Mossoba, G. J. Shaw, D. Andrezejewski, J. A. Sphon, and S. W. Page, J. Agric. Food Chem. 37, 367 (1989).
16. M. M. Mossoba, R. A. Niemann, and J. T. Chen, Anal. Chem. 61, 1678 (1989).
17. M. M. Mossoba, R. E. McDonald, J. T. Chen, D. J. Armstrong, and S. W. Page, J. Agric. Food Chem. 38, 86 (1990).
18. J. W. Childers, N. K. Wilson, and R. K. Barbour, Appl. Spectrosc. 43, 1344 (1989).
19. N.K. Wilson and J. W. Childers, Appl. Spectrosc. Rev. 25,1 (1989). 20. C. J. Wurrey, B. J. Fairless, and H. E. Kimball, Spectroscopy 4,
39 (1989). 21. C. J. Wurrey, B. J. Fairless, and H. E. Kimball, Appl. Spectrosc.
43, 1317 (1989). 22. J. F. Schneider, J. C. Demirgian, and J. C. Stickler, J. Chromatogr.
Sci. 24, 330 (1986). 23. J. F. Schneider, L. A. Raphaelian, A. S. Boparai, M. C. Hansen,
and M. D. Erickson, J. Chromatogr. Sci. 27, 592 (1989). 24. R. L. White, Appl. Spectrosc. Rev. 23, 165 (1987). 25. P. R. Griffiths and J. A. de Haseth, Fourier Transform Infrared
Spectrometry (Wiley, New York, 1986). 26. D. F. Gurka, I. Farnham, B. B. Potter, S. Pyle, R. Titus, and W.
Duncan, Anal. Chem. 61, 1584 (1989). 27. D. F. Gurka, Appl. Spectrosc. 39, 827 (1985). 28. A. M. Haefner, K. L. Norton, P. R. Griffiths, S. Bourne, and R.
Curbelo, Anal. Chem. 60, 2441 (1988).
APPLIED SPECTROSCOPY 571