Embed Size (px)
Citation preview
EVALUATION OF HAND LAY-UP AND RESIN TRANSFER MOLDING IN
COMPOSITE WIND TURBINE BLADE MANUFACTURING
by
Jon Dana Skramstad
A thesis submitted in partial fulfillmentof the requirements for the degree
of
Master of Science
in
Mechanical Engineering
MONTANA STATE UNIVERSITY-BOZEMANBozeman, Montana
August, 1999

ii
APPROVAL
of a thesis submitted by
Jon Dana Skramstad
This thesis has been read by each member of the thesis committee and has beenfound to be satisfactory regarding content, English usage, format, citations, bibliographicstyle, and consistency, and is ready for submission to the College of Graduate Studies.
Dr. Douglas Cairns ______________________________________________________ Chairman, Graduate Committee Date
Approved for the Department of Mechanical and Industrial Engineering
Dr. Vic Cundy ______________________________________________________ Department Head Date
Approved for the College of Graduate Studies
Dr. Bruce McLeod ______________________________________________________ Graduate Dean Date

iii
STATEMENT OF PERMISSION TO USE
In presenting this thesis in partial fulfillment of the requirements for a master's
degree at Montana State University-Bozeman, I agree that the Library shall make it
available to borrowers under rules of the Library.
If I have indicated my intention to copyright this thesis by including a copyright
notice page, copying is allowable only for scholarly purposes, consistent with "fair use"
as prescribed in the U.S. Copyright Law. Requests for permission for extended quotation
from or reproduction of this thesis in whole or in parts may be granted only by the
copyright holder.
Signature ______________________________
Date __________________________________
iv
ACKNOWLEDGMENTS
The author would like to acknowledge the support of Dr. Doug Cairns and Dr.
John Mandell for their guidance and direction during the course of this project. Daniel
Samborsky requires special mention for his assistance in all aspects of my thesis work.
Mike Edens’ experience was very instrumental throughout the porosity study and he is
deserving of my gratitude. Will Ritter and Charile Evertz were helpful in the
manufacturing and prepping of the composite specimens. I would also like to recognize
the entire Composites Technology Team at MSU; discovering their friendship has been
my most rewarding experience during the completion of this thesis.
My thanks must also be extended to Tom Ashwill and Sandia National
Laboratories for sponsoring this project under Sandia Subcontract #AN0412.

v
TABLE OF CONTENTS
Page
LIST OF TABLES .......................................................................................................... viii
LIST OF FIGURES............................................................................................................ x
ABSTRACT......................................................................................................................xv
1. INTRODUCTION..........................................................................................................1Hand Lay-up in Turbine Blade Fabrication ............................................................1
Drawbacks Inherent to Hand Lay-up ..........................................................4The Potential of Resin Transfer Molding................................................................5
Concerns Associated with RTM .................................................................6The Advantages of RTM.............................................................................7
Research Evaluation Objectives..............................................................................7
2. BACKGROUND..........................................................................................................10Resin Transfer Molding Technology ....................................................................10
Flow Modeling ..........................................................................................10MSU RTM Flow Model................................................................11University of Surrey RTM Flow Model........................................14
Flow Rate and Porosity ............................................................................. 15Fabric Reinforcements in RTM................................................................. 16Optimal Processing Temperatures ............................................................ 18Convergent Flow Fronts and Mechanical Properties ................................ 20
3. EXPERIMENTAL METHODS................................................................................... 24Materials and Manufacturing ................................................................................ 24
Resin and Fabric Systems ......................................................................... 24Hand Lay-up and RTM Equipment........................................................... 27Hand Lay-up and RTM Tooling................................................................ 33
510 x 810mm Flat Plate Tooling................................................... 35Thin Flanged T-Stiffener Molds ................................................... 37Thick Flanged T-Stiffener Tooling ............................................... 40Composite I-Beam Molds ............................................................. 42Root Specimen Tooling................................................................. 44
Safety Issues.............................................................................................. 48Fiberglass Recycling ................................................................................. 48
Physical and Mechanical Property Test Matrices ................................................. 50Flat Plate Experiments .............................................................................. 50Thin Flanged T-Stiffener Investigations ................................................... 56Thick Flanged T-Stiffener Tests ............................................................... 58
vi
TABLE OF CONTENTS - Continued
Page
I-Beam Evaluations................................................................................... 59Root Specimen Studies ............................................................................. 60
Testing Equipment and Procedures....................................................................... 63Flat Plate Testing....................................................................................... 64T-Stiffener Testing .................................................................................... 65I-beam Testing........................................................................................... 66Root Specimen Testing ............................................................................. 68
Statistical Comparison Methods ........................................................................... 69
4. EXPERIMENTAL RESULTS AND DISCUSSION.................................................. 71RTM and Hand Lay-up Physical Property Comparisons...................................... 71
Thickness, Fiber Content, and Weight ...................................................... 71Flat Plates ...................................................................................... 72Substructures ................................................................................. 79
Fabrication Cycle Times ........................................................................... 89Computed Tomography (CT) Porosity Scans ........................................... 96RTM Tooling and Gasket Comparisons.................................................. 107
Flat Plate Mechanical Testing............................................................................. 110Transverse Tension ................................................................................. 110Compression ........................................................................................... 121Three-Point Bending ............................................................................... 124Longitudinal Tension .............................................................................. 133Fatigue..................................................................................................... 141
RTM Flat Plate Washout Observations............................................................... 144Thin Flanged T-Stiffener Mechanical Testing.................................................... 146Thick Flanged T-Stiffener Mechanical Testing .................................................. 157
I-beam Mechanical Testing..................................................................... 157Root Specimen Mechanical Testing.................................................................... 158
5. CONCLUSIONS AND FUTURE WORK ............................................................... 174Physical Property Study Results ......................................................................... 174
Flat Plate Thickness and Fiber Volume .................................................. 174Substructure Thickness and Fiber Volume ............................................. 175Fabrication Times.................................................................................... 175CT Scan Results ...................................................................................... 176RTM Mold Review ................................................................................. 176

vii
TABLE OF CONTENTS – Continued
Page
Flat Plate Testing................................................................................................. 177Transverse Tension ................................................................................. 177Compression............................................................................................ 178Three-Point Bending ............................................................................... 178Longitudinal Tension .............................................................................. 179Fatigue..................................................................................................... 179
RTM Flat Plate Washout..................................................................................... 180Thin Flanged T-Stiffener Mechanical Testing.................................................... 181Thick Flanged T-Stiffener and I-beam Testing................................................... 181Root Specimen Mechanical Testing.................................................................... 181Future Work ........................................................................................................ 183
Flat Plates ................................................................................................ 183Substructures ........................................................................................... 184Full-Scale Turbine Blades....................................................................... 184
REFERENCES CITED................................................................................................... 186
APPENDICES................................................................................................................. 191Appendix A – Flat Plate Experimental Data and Results ................................... 192Appendix B – T-Stiffener Experimental Data and Results ................................. 207Appendix C – I-Beam and Root Specimen Experimental Data and Results ...... 212Appendix D – Statistical Comparison Results .................................................... 214Appendix E – Fiber Volume and Fabrication Time Records.............................. 219

viii
LIST OF TABLES
Table Page
1. RTM flow rate versus percent porosity results by Hedley..........................................16
2. Summary of results on fabric investigation by Pearce, et al. ...................................... 18
3. Suggested RTM cycle temperature ranges by Yu and Young .................................... 20
4. Optimal RTM cycle temperatures under Yu and Young ............................................ 20
5. E-glass fabric reinforcement summary ....................................................................... 25
6. Tooling materials and cure times ................................................................................ 35
7. MSDS summary of safety concerns and protective equipment .................................. 49
8. Flat plate mechanical testing matrix............................................................................ 53
9. Thin-flanged stiffener testing matrix........................................................................... 57
10. Thick flanged stiffener mechanical testing matrix...................................................... 59
11. I-beam fatigue testing matrix. ..................................................................................... 60
12. Root testing matrix. ..................................................................................................... 61
13. Flat plate mechanical testing specifications ................................................................64
14. Thickness results for flat plate laminates ....................................................................73
15. Fiber content results for flat plate laminates ...............................................................73
16. Hand lay-up and RTM thin flanged T-stiffener fabrication times ..............................90
17. Hand lay-up and RTM specimen fabrication time summary ......................................92
18. Microscope specimen results ....................................................................................101
19. CT scan specimen data..............................................................................................106
20. Resin transfer molding tool comparisons..................................................................108

ix
21. Transverse tensile test results....................................................................................113
22. Transverse tension results statistical differences ......................................................117
23. Transverse tensile failure strains for D155/DB120 [0/+45/0]s laminates.................121
24. Three-point bending test comparisons ......................................................................129
25. Longitudinal tensile testing results............................................................................136
26. Fatigue data summary ...............................................................................................143
27. RTM flat plate washout results .................................................................................146
28. Test results for thin flanged T-stiffeners ...................................................................148
29. Root specimen manufacturing and testing data.........................................................161
30. Root grip stresses comparisons .................................................................................167
31. Summary of flat plate mechanical property comparisons in average valuesbetween VARTM and hand lay-up .....................................................................180

x
LIST OF FIGURES
Figure Page
1. MSU composite blade design for AOC 15/50 turbine ..................................................3
2. Composite T-stiffener, I-beam, and root critical structures ..........................................8
3. Composite cross-section..............................................................................................11
4. MSU RTM flow model global and local coordinate orientations...............................13
5. Satin, Twill and Injectex carbon fabric weaves .......................................................18
6. Stitched, woven, and adhered E-glass fabric architectures .........................................25
7. Hand lay-up brushes, rollers and squeegees................................................................28
8. Spartan industrial grade RTM injection device........................................................... 30
9. Spartan RTM injection pressure history...................................................................... 30
10. Radius 2100cc RTM injector with data acquisition.................................................... 31
11. Alcatel rotary vane vacuum pump used in VARTM................................................... 31
12. Radius RTM injection pressure profile ....................................................................... 34
13. Radius RTM injection flow rate behavior................................................................... 34
14. 510 x 810 mm aluminum flat plate RTM tool ............................................................ 36
15. Thin flanged T-stiffener RTM mold (end, side, and top views) ................................. 38
16. Thin flanged T-stiffener geometry .............................................................................. 39
17. Thick flanged T-stiffener RTM tool (end, side, and top views) ................................. 41
18. Thick flanged T-stiffener geometry ............................................................................ 42
19. Composite I-beam RTM mold .................................................................................... 43
20. End view of I-beam RTM tool cavity ......................................................................... 43

xi
21. I-beam specimen cross-section.................................................................................... 44
22. Root specimen RTM mold from Headwaters Composites Inc. ................................. 46
23. Seal, injection, and vent locations for root specimen tool halves ............................... 46
24. Root specimen geometry............................................................................................. 47
25. Skin (plate) surfaces in blade cross-section ................................................................ 51
26. T-stiffener and skin interface in blade cross-section................................................... 51
27. I-beam load carrier in blade cross-section................................................................... 51
28. Example of root insert lay-up with dry fabric preform ............................................... 62
29. Flat specimen testing with extensometer .................................................................... 65
30. Thin flanged stiffener pull-off test with jig................................................................. 66
31. Composite I-beam testing apparatus ........................................................................... 67
32. I-beam test geometry and stiffener locations .............................................................. 67
33. Root static tensile testing on Baldwin 890 kN testing machine.................................. 69
34. Average flat plate thicknesses with maximum and minimum values ......................... 76
35. Average flat plate fiber volumes with maximum and minimum values ..................... 76
36. Flat plate fiber volume versus thickness with process ranges..................................... 78
37. Flat plate fiber volume versus thickness with equations............................................. 78
38. Fiber volume data set for MSU fatigue database laminates........................................ 80
39. Hand lay-up thin flanged T-stiffener cross-section..................................................... 82
40. RTM thin flanged T-stiffener cross-section ................................................................ 82
41. Hand lay-up thick flanged T-stiffener cross-section ................................................... 84
42. RTM thick flanged T-stiffener cross-section .............................................................. 84

xii
43. Hand lay-up I-beam cross-section............................................................................... 86
44. RTM I-beam cross-section .......................................................................................... 86
45. Microscopic view of porous hand lay-up specimen.................................................... 99
46. Microscopic view of an RTM specimen near resin vent............................................. 99
47. Microscopic view of an RTM specimen near injection port..................................... 100
48. Computed Tomography scan of an RTM T-stiffener................................................ 103
49. Computed Tomography scan of an RTM I-beam specimen ..................................... 103
50. Computed Tomography scan of a flat plate hand lay-up specimen .......................... 104
51. Sequence of digital images between CT scan and porosity measurement................ 104
52. Transverse tensile test example data ......................................................................... 112
53. Transverse tension test specimens............................................................................. 112
54. Average ultimate transverse tensile strengths with max. and min. values................ 116
55. Normalized ultimate transverse tensile strengths (Vf = 30 %).................................. 116
56. Transverse tensile moduli results with maximum and minimum values .................. 119
57. Transverse tensile strain to first fracture ................................................................... 119
58. Compression test specimens...................................................................................... 122
59. Average ultimate compressive strengths................................................................... 122
60. Normalized average ultimate compressive strengths (Vf = 30%)............................. 124
61. Example data from three-point bend testing of [0/+45/0]s laminates....................... 126
62. Example data from three-point bend testing of [0/0/+45/0]s laminates.................... 126
63. Bending test specimens – compression surface ........................................................ 127
64. Bending test specimens – tension surface................................................................. 127

xiii
65. Calculated maximum bending stress comparisons.................................................... 131
66. Average three-point bending stiffness....................................................................... 131
67. Three-point bending moduli results .......................................................................... 133
68. Tensile test data example .......................................................................................... 135
69. Tensile test specimens............................................................................................... 135
70. Average ultimate tensile strength with maximum and minimum values.................. 138
71. Normalized average ultimate tensile strengths.......................................................... 138
72. Tensile modulus results............................................................................................. 140
73. Tensile initial damage strain results .......................................................................... 140
74. Fatigue test specimens............................................................................................... 141
75. Example curve of T-stiffener pull-off test data......................................................... 147
76. Thin flanged T-stiffener initial damage loads ........................................................... 147
77. Thin flanged T-stiffener maximum pull-off loads .................................................... 151
78. Thin flanged T-stiffener pull-off stiffnesses ............................................................. 151
79. Thin flanged T-stiffener skin stress at flange tip....................................................... 153
80. Stiffener pull-off failure mode .................................................................................. 155
81. Stiffener tensile pull-out failure mode ...................................................................... 155
82. Stiffener skin compression failure mode................................................................... 156
83. Poor wet-out of root specimen R101 with A130 / DB120 fabrics ............................ 162
84. Root specimen R101 and dry steel insert after tensile testing................................... 162
85. Static tensile test damage through root specimen width ........................................... 165
86. Cross-section of root specimen R201 and resin rich region near insert.................... 165

xiv
87. Cross-section of root specimen R104 with higher fiber content at insert ................. 165
88. Root tensile test grip failure of specimen R301 ........................................................ 169
89. Insert and laminate interaction of specimen R201.................................................... 169
90. Fatigue specimen, R112 cross-section with steel insert............................................ 172
xv
ABSTRACT
Currently, the majority of the turbine blade industry uses the low budget, handlay-up manufacturing technique to process composite blades. The benefits of hand lay-upinclude the ability to fabricate large, complex parts with a quick initial start-up. Yet, thedrawbacks of the hand lay-up technique suggest that other methods of compositesmanufacturing may be more desirable in industrial-scale, wind turbine blade fabrication.
Resin transfer molding (RTM) was identified as a processing alternative andshows promise in addressing the shortcomings of hand lay-up in turbine blademanufacturing. The current study compares and evaluates both processes according tofundamental criteria and mechanical performance for a variety of fabric reinforcements,lay-up schedules and turbine blade critical structures. The geometries investigated wereflat plates, thin flanged T-stiffeners with skin intersections, thick flanged T-stiffeners, I-beam load carriers, and sample root connection joints. The variables that were exploredand compared according to process included laminate thickness, fiber volume, cycle time,and porosity. Flat plates were tested under five typical loading conditions: transversetension, compression, three-point bending, axial tension, and fatigue. The variety ofthree-dimensional substructures were also tested mechanically to determine what effectsprocessing might have on structural performance.
In this study it was found that process played an important role in laminatethickness, fiber volume, and weight for the geometries investigated. RTM was found toreduce thicknesses and improve weights for all substructures. In addition, RTMprocessing resulted in tighter material transition radii and eliminated the need for mostsecondary bonding operations. These observations were found to significantly reduceweight for complex structures. Hand lay-up was consistently slower in fabrication timeswhen compared to RTM for the manufacturing of the specimens tested in this study.Computed Tomography (CT) technology was introduced as a means to measure porosityfor specimens of different processing. However, the current efforts in characterizingporosity via CT suggest further refinement.
Analysis of the mechanical testing results for flat plate specimens demonstratedthat vacuum-assisted RTM specimens performed notably better than their hand lay-upcounterparts for a variety of properties. Yet, thickness played a critical role in comparingthe mechanical test results of flat plate specimens. Variations in thickness had thetendency to bias the structural performance results according to process and as a result,fiber volume normalizing techniques were introduced. Specimen normalization wasfound to reduce the measurable differences between flat plate test results for specimensmanufactured by the different processes. It was also noted that in most casesreinforcement played a more instrumental role in mechanical performance than process.Substructure tests demonstrated that differences in processing methods affected specimenmass and moment of inertia. These properties were greater for the hand lay-upspecimens and resulted in improvements in ultimate strength and initial damage whencompared to RTM substructures. The current root specimen design does not showsignificant differences according to process and exceeds all static and fatiguerequirements.

1
CHAPTER 1
INTRODUCTION
Low cost composites are gaining wider acceptance as a structural material. One
form, commonly referred to as “fiberglass”, consists of glass fabric reinforcement and a
thermosetting or thermoplastic polymer matrix. The aerospace and automotive industries
have proven that composites have superior strength-to-weight ratios and excellent fatigue
resistance when compared to many traditional materials [1]. Another advantage of
composites is their ability to be tailored for different properties using various
reinforcement configurations, matrix materials, and manufacturing processes. In
addition, fiberglass is relatively inexpensive when compared with other composites, such
as carbon-fiber/epoxy, used in aerospace and sporting goods applications [2]. Fiberglass
composites, which where once reserved for boat hulls, surfboards and other stiffness
dominated applications, are now being driven towards more complicated geometries and
critical structures.
Hand Lay-up in Turbine Blade Fabrication
One industry advancing the structural implementation of fiberglass composites is
the wind turbine blade industry. The standard method of blade manufacturing employs
inexpensive E-glass fabric reinforcement and polyester resin to fabricate complex

2
composite wind turbine blades for electrical power generation. A typical composite wind
turbine blade and its components are illustrated in Figure 1. This blade is the current,
MSU blade design for the Atlantic Orient Company AOC 15/50 turbine [3]. From this
figure it can be observed that the composite blade is composed of skin surface, spar cap,
spar web, spar flange and root components. Each substructure provides a well-defined
function to the wind turbine blade structure. The leading and trailing edge skin surfaces
give the turbine blade its airfoil shape. The spar structures support the large wind induced
bending moments on the blade. And the root section transmits the structural loads of the
turbine blade to the rotating turbine hub. These turbine blade components vary in
thickness and lay-up over the blade’s length, as allowances must be made for the blade’s
tapered, twisted geometry. In Figure 1, Table (b) the lay-ups and thicknesses for the
current design can be found for the different blade components at a variety of blade
locations.
The majority of the turbine blade industry uses the low budget, hand lay-up
manufacturing technique to combine resin and fabric components. In the hand lay-up
process, fiber reinforcement is manually inserted into a single-sided mold, where resin is
then forced through the thickness of the fiber mats using hand rollers. After the fabric is
saturated, excess resin is removed with squeegees. The part is allowed to cure and is
finally extracted from the mold. A primary advantage to the hand lay-up technique is its
ability to fabricate very large, complex parts with a quick initial start-up. Additional
benefits to the process are simple equipment and tooling that are relatively less expensive

3
Figure 1. MSU composite blade design for AOC 15/50 turbine [3].
4
than required by other manufacturing options. Yet, the drawbacks of hand lay-up suggest
that other methods of composites manufacturing may be more desirable in industrial-scale,
wind turbine blade fabrication.
Drawbacks Inherent to Hand Lay-up
Hand lay-up’s first disadvantage is that the process is labor intensive, which can
result in high cycle times and a low volume output of parts. The nature of the hand lay-up
process may also result in parts with inconsistent fiber orientations. In other words, the
more the reinforcement is handled, the more likely strands will separate or distort from the
preform and compromise the mechanical strength of the composite. For the wind turbine
blade example, the open molding feature of the hand lay-up process requires one skin to
be molded at a time and in the final step, skins, spars, and core are bonded together. Such
a sequential process increases the amount of labor required, increases variability between
blades, and slows the rate of production. In addition, the method generates a textured
finish on the inner surface of the blade skin, which provides a poor condition for bonding
between parts. Tight dimensional accuracy and smooth surfaces at the bonding interface
are more desirable.
Another drawback inherent to hand lay-up is its yielding of laminates of variable
thickness. This raises concerns with bond line thicknesses, uniformity of composites, and
blade weights. To allow for the larger deviations in thickness found in hand lay-up
geometries, looser tolerances must be allowed at the bond lines where the blade
substructures are joined together. This allowance substitutes bonding materials for
structural composite and increases blade weight. Variations in laminate thickness also

5
determine the range of fiber volumes in a given composite. This presents a problem in
hand lay-up because its dimensional tolerances often yield composites of non-uniform
fiber volume and mechanical strength. Maintaining fiber volumes higher than those found
for hand lay-up significantly decreases blade mass. For example, a mass savings of
approximately 6.3 kg or 10% would result in the current composite blade design for the
AOC 15/50 turbine, if a single skin laminate thickness could be compressed by one
millimeter over the length of the blade. Lastly, this technique raises environmental and
safety concerns with the amount of hazardous volatiles it releases. Hand lay-up is a
proven process for constructing composite turbine blades and other structures, but the
method’s limiting volume output and part inconsistencies motivates research into other
manufacturing techniques.
The Potential of Resin Transfer Molding
There exists a wide variety of alternative techniques available for the
manufacturing of composites. Compression molding, prepreging, vacuum molding,
pultruding, filament winding, and resin transfer molding are just a few of the current
options [4]. Candidates of interest to utility-grade wind turbine blade fabrication need to
improve fiber volume, lower the blade weight, increase structural reliability, and decrease
the overall cost of blade fabrication. Through previous work conducted by the
Composites Technology Team at Montana State University and Sandia National
Laboratories, resin transfer molding or RTM was identified as a viable process in blade
fabrication [5]. Resin transfer molding is a relatively new process that has received a
significant amount of attention due to its potential in low budget applications. This

6
process begins with the placement of the reinforcement mat, or preform, into a two-sided
closed mold. The resin is then forced through the length and width of the mold by
applying pressure, drawing a vacuum, or a combination of the two. After the resin is
applied, the part is cured and finally removed from the mold. Resin transfer molding is a
very versatile process and can be performed with or without the influences of post-
molding heat and pressure [6]. The method has had limited exposure to manufacturing
turbine blades, but RTM has many advantages over the hand lay-up technique, even after
consideration of RTM’s limiting factors.
Concerns Associated with RTM
RTM’s first limitation is initial cost. In comparison to hand lay-up, the equipment
necessary for RTM is more expensive. In hand lay-up, the minimal equipment required
is a one-sided mold, the resin applying rollers and the resin removing squeegees, while
RTM requires a two-part closed mold, along with the resin injection equipment. Another
challenge facing RTM is that resin flow can be difficult to predict, due to the nature of
the closed mold process. Resin flow around corners and through joints is not easily
predicted because locally high fiber volumes in these regions can drastically change mold
fill behavior. Currently, RTM operators cannot accurately anticipate these effects, nor
can they visually verify whether the part has reached full saturation before the injection
process is shut down. If the part is not entirely “wetted out”, dry spots or voids are
introduced, which may require rework or part rejection. Flaws in resin transfer moldings
can also be introduced if the operator uses resin injection pressures or flow rates that are
7
too high. In this instance, fibers can be distorted or possibly “washed out” resulting in a
part of questionable mechanical strength.
The Advantages of RTM
Despite its limitations, RTM does have many advantages over other methods of
turbine blade construction. First, large and complex parts can be fabricated. When
compared with present blade manufacturing methods, RTM has much lower cycle times
and higher volume outputs. Resin transfer molding also produces parts with a higher
degree of repeatability. The structural properties of a hand laid-up blade depend upon the
pressure and speed at which the operator physically applies the resin, while in RTM,
speeds and pressures remain constant and blades are removed from molds identical to one
another [7]. Of all the methods analyzed, RTM is unique in its potential for molding an
entire blade in one step. In addition, RTM produces smooth-surfaced parts on both inner
and outer mold surfaces. Both methods generate an acceptable airfoil surface but only
RTM’d skins have a good surface finish on the interior, which is ideal for secondary
bonding. Lastly, RTM’s closed mold feature is a more environmentally friendly process
because fewer volatiles are released.
Research Evaluation Objectives
Worldwide, wind turbine designs have improved substantially due to composite
technology [5]. As composite usage becomes more commonplace, manufacturing efforts
will continue to focus on minimizing the time required to fabricate blades while
increasing dimensional tolerances, repeatability, fiber content, and affordability. These
8
efforts include advancing current techniques, while exploring other available
manufacturing options. The current evaluation between hand lay-up and RTM takes a
twofold approach in answering how each process addresses potential improvements in
blade fabrication.
First, the physical variables of composite samples were investigated and
compared. Laminate thickness, fiber volume, cycle time, and porosity measurement,
along with their variability, were measured for five geometries representative of turbine
blade structures. These properties are important to a manufacturing comparison because
they define the strength to weight ratios, manufacturing speeds, repeatability, and defect
levels of composite materials. The geometries investigated were: flat plates (skin
sections), thin flanged T-stiffeners with skin intersections, thick flanged T-stiffeners, I-
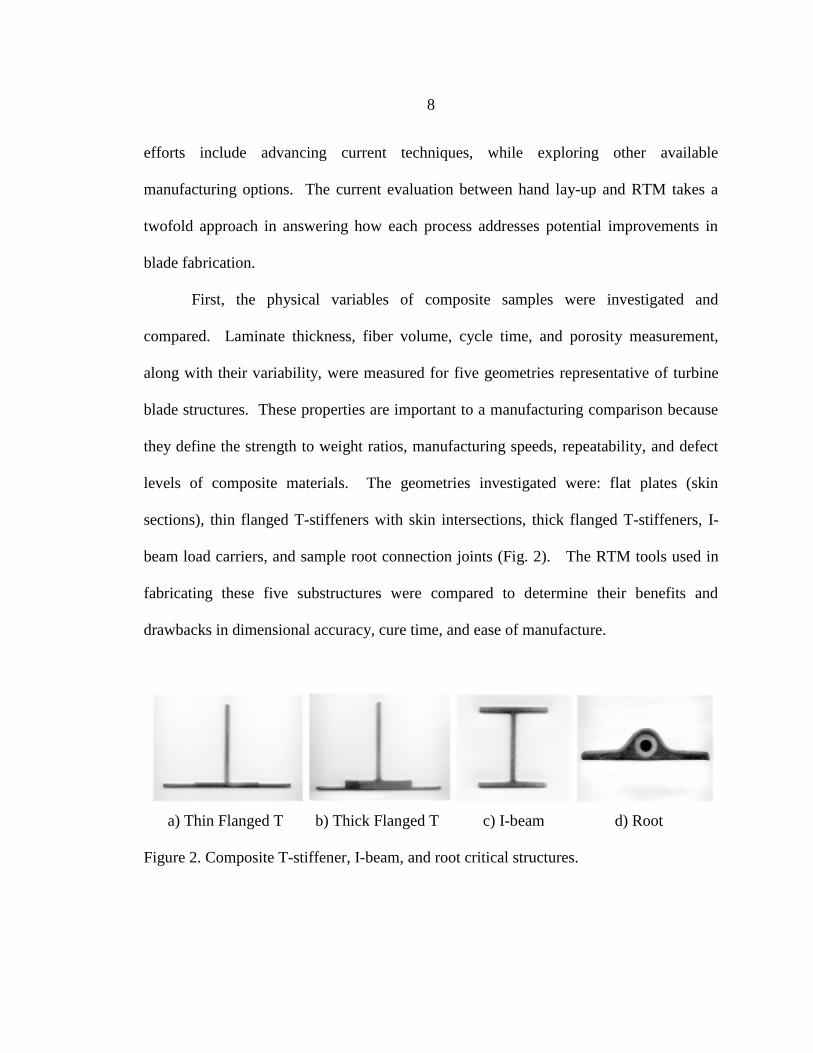
beam load carriers, and sample root connection joints (Fig. 2). The RTM tools used in
fabricating these five substructures were compared to determine their benefits and
drawbacks in dimensional accuracy, cure time, and ease of manufacture.
a) Thin Flanged T b) Thick Flanged T c) I-beam d) Root
Figure 2. Composite T-stiffener, I-beam, and root critical structures.

9
Secondly, the mechanical performances of the five composite substructures were
compared for each method of manufacturing. This component of the manufacturing
evaluation helped to determine any differences between the strength to weight ratios and
fatigue cycle lifetimes of hand laid-up and RTM’d structures. Flat plates were tested
under five common loadings: transverse tension, compression, three-point bending,
tension, and fatigue. Thick and thin flanged T-stiffeners were tested in a stiffener pull-off
configuration, while I-beams were loaded under four-point bending in fatigue. The final
mechanical tests involved the root specimen in tensile and fatigue loading to gauge
differences in the structural performances of hand lay-up and RTM in a thick,
complicated geometry.

10
CHAPTER 2
BACKGROUND
Resin Transfer Molding Technology
Resin transfer molding applications and the technologies being developed to
enhance the process are on the rise. As new industries adopt RTM, unique innovations
are introduced that drive the method toward manufacturing stronger, more economical
parts. These interests in RTM have required a closer look at the mechanics of the
molding process and molded parts. This has motivated studies on RTM processing [8-
16], methods of defect introduction [17-26], and resultant structural performance [27-30]
in an attempt to enhance the understanding of RTM science. RTM models, porosity
observations at different flow rates, strengths of various fabric reinforcements,
temperature effects on cycle times, convergent flow fronts, and the impact of porosity on
mechanical properties are topics that have been investigated and will be mentioned in
prelude to the experimental investigations performed in this work.
Flow Modeling
An area that has been the focus of significant RTM research is the modeling of
resin flow for the resin transfer molding process. Modeling is a critical topic in the
advancement of RTM because it addresses a primary drawback – the insufficient

11
knowledge of closed mold resin flow. In parts with simple geometries and relatively
short dimensions, proper mold fill is easily attained because resin flow paths are short
and unimpeded by three-dimensional complexities. If the part is not wetted out, it is
discarded and changes are made to the injection geometry until all dry spots are
eliminated. Applying this trial and error methodology to the RTMing of a utility grade
turbine blade, from 8 up to 25 meters in length, is inefficient and expensive. However,
through the successful modeling of RTM flow, it is possible to predict the flow properties
in a complex structure and eliminate the trial and error approach. Currently, there exists
a wide variety of commercially and non-commercially available options for RTM flow
modeling software [8, 9, 31, 32].
MSU RTM Flow Model. Under the MSU RTM studies, a basic model has been
developed that is based on Darcy’s law in fibrous bundle regions and channel flow
equations between bundles [8]. The model incorporates a micro- and macro-approach to
account for local architecture and structural geometry. The micro model is important to
capture local inhomogeneities as
shown in Figure 3. In Figure 3, the
edges of the fiber bundle tows with a
resin-rich channel between them can
be clearly seen. The analytical model
predicts the wetting out of this cross-
section using Equations 1 and 2:
Figure 3. Composite cross-section.
12
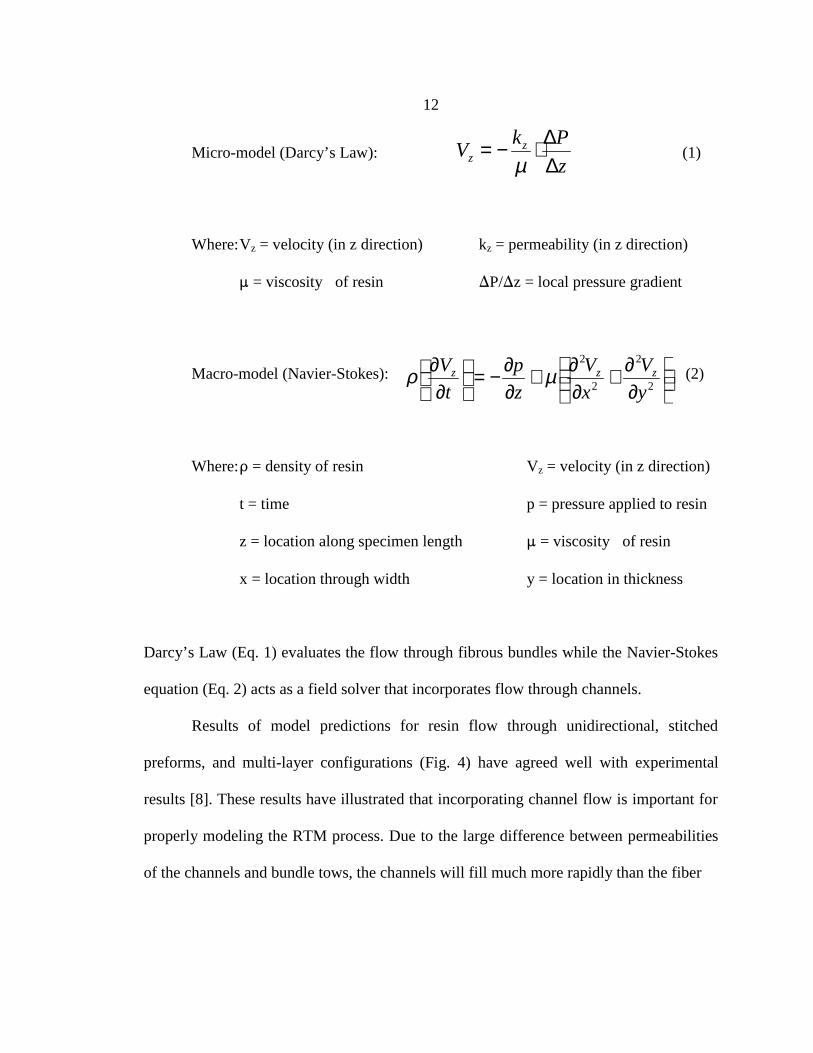
Micro-model (Darcy’s Law): (1)
Where:Vz = velocity (in z direction) kz = permeability (in z direction)
� = viscosity of resin �P/�z = local pressure gradient
Macro-model (Navier-Stokes): (2)
Where:' = density of resin Vz = velocity (in z direction)
t = time p = pressure applied to resin
z = location along specimen length � = viscosity of resin
x = location through width y = location in thickness
Darcy’s Law (Eq. 1) evaluates the flow through fibrous bundles while the Navier-Stokes
equation (Eq. 2) acts as a field solver that incorporates flow through channels.
Results of model predictions for resin flow through unidirectional, stitched
preforms, and multi-layer configurations (Fig. 4) have agreed well with experimental
results [8]. These results have illustrated that incorporating channel flow is important for
properly modeling the RTM process. Due to the large difference between permeabilities
of the channels and bundle tows, the channels will fill much more rapidly than the fiber
z
PkV z
z ∆∆⋅−=
µ
∂∂+
∂∂+
∂∂−=
∂∂
2
2
2
2
y
V
x
V
z
p
t
V zzz µρ

13
bundles (channels are the gaps illustrated in Figure 4). Pressure profiles, resin velocities,
and resin flow fronts are predicted accurately and these topics continue to be explored at
MSU. It should also be noted here that the model results were compared to experimental
stitched preform injections. It was found that although the shapes for resin flow are
similar between experimental and analytical results, the stitching affects the permeability
such that unidirectional ply data does not accurately capture the times for resin flow [8].
The fabric stitching was found to complicate the modeling of flow through glass
reinforcement. At the location of the stitching, the fiber bundle is greatly constricted
which impedes resin permeability and opens up a larger channel for flow between
bundles. Consequently, the current MSU RTM model predicts a flow rate in this local
region that is notably slower than found experimentally.
Figure 4. MSU RTM flow model global and local coordinate orientations [8].

14
University of Surrey RTM Flow Model. Lekakou and Badger have also
developed a mathematical model which will predict flow fronts using the micro- and
macro-approach discussed in the MSU RTM model [9]. The experimental verifications
these two authors performed varied resin viscosity, fiber volume and tow radius to
compare against predicted and measured infiltration times. A noteworthy aspect of this
model is its ability to accurately capture micro-infiltration times. In accordance with
Darcy’s law (Eq. 1), as the resin moves away from the injection port, local mechanical
pressures will decrease and micro-infiltration times will increase. This behavior,
predicted analytically, was also observed in the experimental procedures. Additional
tests imposing viscosity changes were performed that verified proportional changes in
macro- and micro-infiltration times with Darcy’s Law. Fabrics of varying tow diameters
were also included in this study. The results demonstrated the relationship of fiber tow
diameter to macro-pore diameter, macro-permeability and macro-capillary pressure in
resin transfer moldings. The last parameter Lekakou and Bader addressed was fiber
volume. In their study, fiber volumes were varied between 30 and 58% which resulted in
the macro-porosity changing from 0.48 to 0.034%, respectively, while micro-porosity
was assumed constant. Their work was also able to repeat previous experiments where
higher pressures and flow rates used in the RTM process determined a mold fill behavior
that was macro-flow dominate. In addition, Lekakou and Bader found that higher fiber
volumes lead to a decrease in macro-permeability. For experiments at a 58% fiber
volume, the authors reported that micro- and macro-infiltration flow fronts were identical

15
to one another and at this level of fiber content changes in pressure had no effect on
changes in permeability.
Flow Rate and Porosity
The ideal composite would be free of porosity. Unfortunately, voids in composite
materials are a real problem that stems from the mechanical combining of resin and fiber
reinforcement. Pores inside a composite do not transfer stresses, act as stress
concentrators, and degrade mechanical properties. They are introduced by a number of
means in both hand lay-up and RTM: through air bubbles entrapped in the resin mixture,
through the release of volatiles and dissolved air during cure, or through the application
of resin. Hinrichs suggests that voids will raise concern only if they reach a level beyond
1% of a sample’s volume [30]. Both hand lay-up and RTM may produce parts exceeding
this allowable level of porosity and require further investigation to determine whether it
is possible to consistently maintain void content under 1%.
Hand lay-up has not received a significant amount of attention with respect to
porosity content. This is due to the inherent variability of the hand lay-up process and the
many ways voids can be introduced. RTM on the other hand, is being studied
extensively, and a particular area of investigation includes determining the factors of pore
formation. One such study was performed by Hedley concerning flow rate versus
resultant porosity [33]. His work looked at varying flow rates for the RTMing of a
polyester/random mat system and then recording pore diameter, void content, entrapped
air location and differences between macro- and micro-flow levels. The four flow rate
tests performed illustrated that as volumetric flow rate was increased, percent porosity

16
and the average pore diameter increased as well (Table 1). It is often observed in
experiments and predicted by Darcy’s Law that porosity has the tendency to increase as
the distance from the injection port increases (the pressure gradient becomes insufficient
to drive entrapped air out of the mold). For the small plates Hedley molded, the distance
from the injection port most likely did not play a significant role. However, for the larger
specimens being fabricated in the current study, it will be important to note porosity
contents with relation to
Table 1. RTM flow rate versus percent porosity results by Hedley [33].
Flow Rate Volumetric Flow Porosity Average Pore
Test Rate (mL/min) (%) Diameter (mm)
1 3 0.22 0.015
2 6 0.27 0.022
3 24 0.39 0.026
4 54 0.53 0.028
injection location. Lastly, the current evaluation employs industrial grade RTM
machines with much higher volumetric flow rates than those listed in Table 1. The
correlation between these higher flow rates and porosity levels will also be determined.
Fabric Reinforcements in RTM
Another RTM investigation was performed by Pearce, et al. on the effects of
fabric architecture in composite processing and properties [34]. For RTM applications,
industry maintains a wide range of fabrics, many of which cluster individual fiber strands

17
into bundles to ease reinforcement manufacturing, to secure fiber orientation and to
enhance resin permeability. However, reinforcement fabrics using fiber bundles generate
a composite of non-uniform construction on the micro-scale. Referring back to Figure 3
will demonstrate this more clearly. The fiber bundle halves shown contain the individual
strands of glass that provide mechanical strength to the composite. At the circumference
of these bundles, a large discontinuity exists where stresses are transmitted to the
significantly weaker polymer matrix material. For mechanical performance, fibers that
are distributed evenly over the entire cross-section (for example, prepregs) would yield
little discontinuity and stronger materials. However, since channel flow and
reinforcement integrity remain necessities of the RTM process, RTM’d parts continue to
suffer from decreased mechanical performance due to the use of clustered tows [35].
The study conducted by Pearce, et al. compared degradations in strength to fabric
weave type. Their work examined three widely used carbon fiber fabrics and rated them
according to the resultant composite’s mechanical properties so that observations could
be made on which fabrics minimize the loss of strength in composites using fabrics with
bundled reinforcement. The three fabrics examined were satin, twill and Injectex
weave reinforcement (Fig. 5 a-c). They were studied according to porosity content, resin
permeability and inter-laminar shear strength (ILSS), the results of which are summarized
in Table 2. In the permeability study, it was found that channel size had an important
correlation to resin infiltration, void formation, and void volume fraction. Larger
channels (in the twill and Injectex fabrics) were found to increase macro-flow and
consequently, propagate a quicker transverse micro-flow that filled the bundle tows. The

18
study hypothesized that larger channels will determine the lead and lag time between
capillary and channel flow, in addition to increased air entrapment and larger diameter
voids. The noteworthy aspect of this work was that Pearce, et al. confirmed that more
permeable fabrics yield more porous composites, which in turn, lead to a degradation of
ILSS and other mechanical properties.
Table 2. Summary of results on fabric investigation by Pearce, et al. [34].
Fabric Permeability Porosity ILSS
Satin lowest lowest greatest
Injectex average average average
Twill greatest greatest lowest
Optimal Processing Temperatures
In any industrial application, minimizing manufacturing time is important to
increase output while decreasing cost. Of all the processing parameters in the RTM
a) Satin b) Twill c) Injectex
Figure 5. Satin, Twill, and Injectex carbon fabric weaves.

19
process, processing temperature is the single most important when cycle times are
concerned. Temperature is the easiest way to control resin viscosity, a first-order
variable in Darcy’s Law (Equation 1). With RTM at ambient temperatures, injections
can take only a few of minutes, while the curing procedure can consume an entire
workday. Elevated injection and cure temperatures are the only variables that can greatly
decrease the molding cure time for a given laminate.
The polyester resins used in typical, low-budget applications initiate cure through
a natural, exothermic reaction. When catalyst and resin systems are combined, the
catalyst will initiate cross-linking, then gelling, and finally, curing of the thermosetting
resin. During curing, the matrix will generate a significant amount of heat as the
composite reaches the final stages of the RTM process. A study performed by Yu and
Young investigated the influences elevated temperatures had on reducing the time
required for the RTM cycle [36]. Their work examined two resins, unsaturated polyester
and epoxy, and found optimal conditions in which to elevate injection line temperature,
mold temperature and cure temperature in order to minimize the time required for RTM’d
parts to cure. Yu and Young recognized that minimizing mold filling time and cure time
would reduce energy consumption over the complete RTM cycle. The challenge they
faced was to develop an algorithm which found processing temperatures that would allow
complete mold fill just short of gel conversion times while also not exceeding the resin’s
degradation temperature. The degradation temperature is a property that, when exceeded,
will break down the structural integrity of the resin system. The work performed by Yu
and Young also found that in an RTM mold during process cycling, the part being
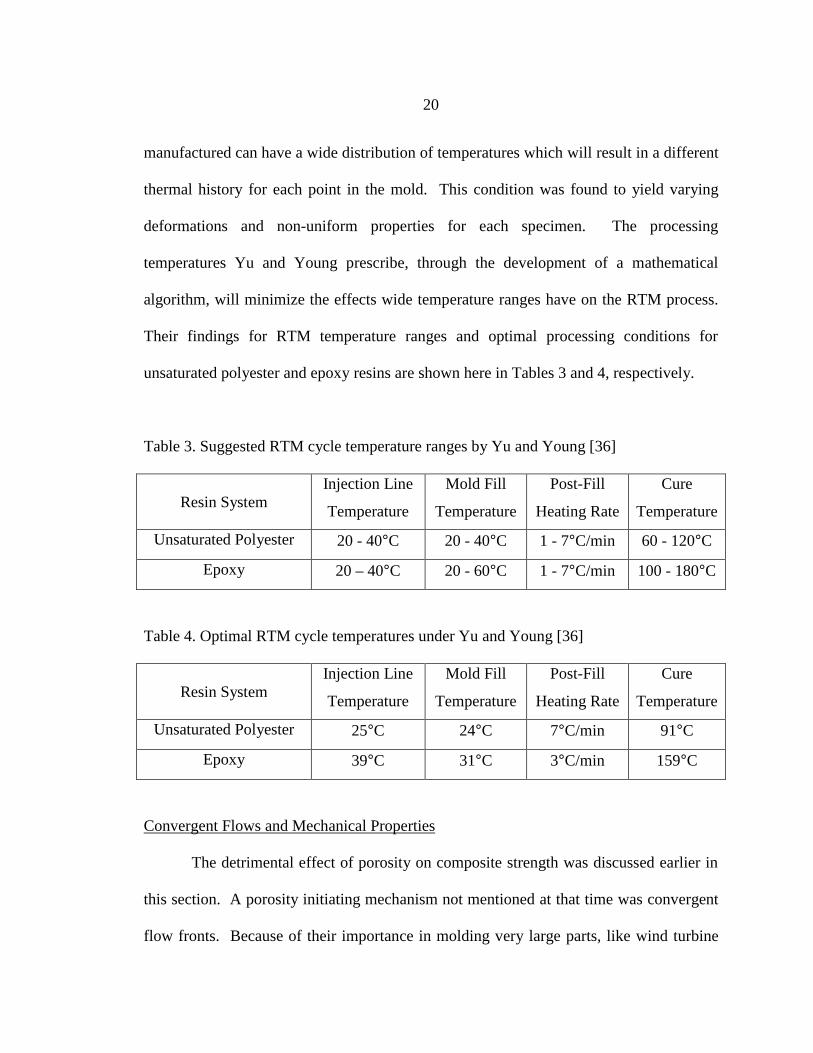
20
manufactured can have a wide distribution of temperatures which will result in a different
thermal history for each point in the mold. This condition was found to yield varying
deformations and non-uniform properties for each specimen. The processing
temperatures Yu and Young prescribe, through the development of a mathematical
algorithm, will minimize the effects wide temperature ranges have on the RTM process.
Their findings for RTM temperature ranges and optimal processing conditions for
unsaturated polyester and epoxy resins are shown here in Tables 3 and 4, respectively.
Table 3. Suggested RTM cycle temperature ranges by Yu and Young [36]
Resin SystemInjection Line
Temperature
Mold Fill
Temperature
Post-Fill
Heating Rate
Cure
Temperature
Unsaturated Polyester 20 - 40°C 20 - 40°C 1 - 7°C/min 60 - 120°C
Epoxy 20 – 40°C 20 - 60°C 1 - 7°C/min 100 - 180°C
Table 4. Optimal RTM cycle temperatures under Yu and Young [36]
Resin SystemInjection Line
Temperature
Mold Fill
Temperature
Post-Fill
Heating Rate
Cure
Temperature
Unsaturated Polyester 25°C 24°C 7°C/min 91°C
Epoxy 39°C 31°C 3°C/min 159°C
Convergent Flows and Mechanical Properties
The detrimental effect of porosity on composite strength was discussed earlier in
this section. A porosity initiating mechanism not mentioned at that time was convergent
flow fronts. Because of their importance in molding very large parts, like wind turbine

21
blade components, convergent flow fronts, and their resultant mechanical properties,
deserve special attention.
Hand lay-up, like many other composites manufacturing techniques, permeates
resin through the reinforcement fabric over very short distances. Resin is applied and
forced through individual layers that are commonly less than 1 mm thick. RTM is faced
with a very different challenge – the pressures being applied may have to drive resin over
very large distances. For example, in the RTMing of a composite turbine blade skin,
thicknesses may range between 2 – 20 mm, while lengths can exceed 9 meters. If such a
part were to be injected with a single end port, areas of low pressure gradients would
exist over the entire 9 meter span. The hypothetical injection would require an extremely
large amount of time since resin infiltration is dependent upon localized pressure and
flow rate. What is commonly suggested to alleviate this dilemma is an injection
manifold. A manifold will inject resin, either simultaneously or at staged intervals, at
multiple points in the mold. This procedure reduces filling times by greatly increasing
local resin pressures and reducing the lengths in which resin must travel. The only
concern multiple injection points raise is the porosity introduced by convergent flow
fronts. On a micro-level, RTM’d parts can acquire porosity from the macro-flow racing
ahead and then permeating the fiber bundles radially. As the microscopic flow fronts
converge, air can become entrapped between individual fibers as flow front pressures
cancel one another. On a macro-level, convergent flow fronts are also formed with the
use of multiple injection ports. When two flow fronts confront one another, the pressure
will equalize, resin flow will cease, and any air trapped in the fingers of the flow fronts
22
will remain in this localized region. The level of void content found here can be quite
high and was studied extensively by Pearce, et al. [37].
Vacuum applied to RTM molds is an excellent solution to void formation under
convergent flow fronts [18, 19]. With vacuum drawn on the mold, voids will have
insufficient internal pressure to support themselves and will eventually collapse [20].
Also, the pressure gradient provided by vacuum results in resin that can flow into areas of
the mold without having to displace air or other gases during flow. Molds that are not
vacuum tight, however, are a problem. Any leaks in the molding apparatus will draw air
in and actually increase the porosity content [21]. Vacuum effects have also been known
to cause detrimental effects in some vinylester and unsaturated polyester systems when
used in heated molds. Lundstrom noted that pure styrene boils at 40°C with a 90%
vacuum and at 140°C under atmospheric pressure [38]. However effective vacuum may
be for certain RTM applications, there exists molding schemes where vacuum cannot
feasibly be applied. Whether temperatures, geometries, or costs intervene, the majority
of RTM applications remain unassisted by vacuum effects. For this reason, studies on
convergent flow fronts and porosity entrapment are still an important development.
The study conducted by Pearce, et al. used an RTM flat plate mold, three carbon
fiber reinforcement fabrics and a series of injection schemes to capture the outline of high
porosity as flow fronts converge [37]. Their work also included a summary of porosity’s
effects on a range of mechanical properties. Reviewing these findings gives a clearer
picture of porosity’s role in mechanical performance:

23
• Voids reduce interlaminar shear strength (ILSS) [39], flexural modulus,longitudinal and transverse tensile strength and modulus, compressive strengthand modulus, fatigue resistance and high temperature resistance [40].
• The first 1% of voids can decrease bending strength by 30%, tensile strength by3%, torsional shear by 9% and impact performance by 8% [40].
• Regardless of resin type, fiber type and surface treatment, the ILSS of acomposite will be reduced by 7% for each 1% of voids up to a total percentporosity of 4% [40].
• For carbon fiber/epoxy specimens each 1% of voids up to a sum of 5% reducedflexural modulus by 5%, flexural strength by 10% and ILSS by 10% [41].
• In carbon fiber reinforced plastics (CFRPs) with void percentages less than 1.5%,pores tend to be spherical with diameters ranging between 5 – 20 µm. At higherporosity contents, pores appear more cylindrical with lengths up to an order ofmagnitude greater than their diameters [42].
• Porosity profiles are important because areas with locally high porosities willhave a greater probability of failure [42].
• Voids increase moisture absorption, which weakens the fiber/matrix interface[43].
• Voids can improve some properties such as tensile strain to failure [44].
These previous research topics in RTM were used for developing the
experimental molding and testing procedures of this study.

24
CHAPTER 3
EXPERIMENTAL METHODS
Materials and Manufacturing
The materials, equipment, and manufacturing techniques employed in the current
research were carefully chosen to represent, as realistically as possible, the practices of
modern wind turbine blade manufacturers. Through each step of processing with hand
lay-up and RTM, an effort was put forth to minimize cost, time, and difficulty of
manufacture. This methodology assured that results made in the laboratory would be
repeatable on an industrial scale.
Resin and Fabric Systems
As mentioned earlier, the primary components of the fiberglass composites or
fiber reinforced plastics (FRPs) used in the wind turbine blade industry are polyester
resin and E-glass fabric reinforcement. The unsaturated polyester resin processed in the
current research was an Interplastic Corporation product, CoRezyn 63-AX-051. This
resin, when combined with Lupersol DDM-9 methyl ethyl ketone peroxide (MEKP) at
2% by volume, yields a matrix material that is representative of the strength and cost
characteristics of typcial resins used in blade fabrication.

25
The fabrics used in fabricating test specimens were also the same products
utilized in industry, or close counterparts. Four different fabrics, supplied by two
different manufacturers were used in the current work. The architecture of the four
reinforcements are summarized in Table 5 and illustrated in Figure 6.
Table 5. E-glass fabric reinforcement summary.
Material
Supplier
Fabric
Designation
Ply
Angle(s)
Fabric
Architecture
Roll/Bundle
Orientation
Mass/Area
(g/m2)
D155 0° stitched weft 526
A130 0° woven warp 440Owens-Corning/
KnytexDB120 +45° stitched double bias 407
CollinsCraft UC1018/V 0° veil/bonded warp 640
The first fabric noted is the Owens-Corning/Knytex D155, which is a
unidirectional, zero degree fabric (Fig 6a). D155 was chosen for this study because it
represents one of the best mechanically performing unidirectional E-glass fabrics
currently available [5]. This reinforcement architecture contains bundles of individual
a) b) c) d)
Figure 6. Stitched, woven, and adhered E-glass fabric architectures.

26
glass strands, stitched together with a thermoplastic polyester thread. The orientation of
the zero degree bundles or tows is also in the weft direction, or more simply put, the
length of the glass bundles run perpendicular to the length of the fabric roll. D155 fabric
has excellent resin wet-out and compressive strength properties, but because the zero
degree tows are only as long as the width of a fabric roll, currently 1.27 meters, the
reinforcement cannot be used continuously in the blade length direction. Consequently,
alternative zero degree fabrics are being investigated in an effort to borrow the
advantages of D155 for a reinforcement that supports utility-grade blade length parts.
The second glass fiber reinforcement mentioned in Table 5 is the Knytex A130
illustrated in Figure 6b. This fabric is representative of the zero degree reinforcements
currently being used by turbine blade manufacturers. The architecture of this fabric is
comprised of zero degree glass bundles that are woven and adhered to one another with a
perpendicular tow of glass fibers coated in thermoplastic polyester. The fabric weave
compromises the ultimate compressive strength (the glass tows are initially wavy), but
currently, the A130 fabric is the best option available for blade manufacturers requiring a
weft, zero directional reinforcement [5].
UC1018/V is a CollinsCraft, glass fabric reinforcement was selected for its
potential in addressing the concerns of woven, warp zero directional fabrics (Fig 6c).
The fabric architecture of this reinforcing material is notably different than those
previously discussed. UC1018/V contains bundles of zero degree glass fibers, but unlike
the other stitched or woven fabrics, the CollinsCraft product adheres its bundles to a light,
random oriented, glass fiber veil. Potential advantages of this fabric are that the

27
unidirectional bundles of glass fibers are not woven through the thickness of the fabric
nor are they stitched into confined bundles. These two factors may allow the load
carrying fibers of a composite made from this material to perform better than the
industrial standard A130 weaves. This fabric was studied for manufacturability in flat
plates samples and strength performance in the I-beam geometry during the hand lay-up
and RTM evaluation.
DB120 was the single +45° double-bias fabric employed in this study and is
shown in Figure 6d. This fabric contains both +45° and –45° (relative to the length of the
fabric roll) layers stitched on top of one another with the same materials used in the D155
fabric. DB120 is a double bias fabric with glass bundles running perpendicular to one
another, but it has been observed that the reinforcement has poor fiber orientation
tolerances. The +45° and –45° individual plies tend to vary by +5° due to variations in
roll construction, material handling, and composite processing [5].
Hand Lay-up and RTM Equipment
Hand lay-up fabrications utilized very simple equipment and in most cases, the
same tooling or molds as the RTM specimens. The hand lay-up methodology involved
applying catalyzed resin to the tooling surface, placing an individual layer of fabric to the
mold, permeating the resin through the fabric thickness with hand rollers and brushes
(Fig. 7), and then repeating this procedure for the build-up of the remaining laminate. In
the final step, excess resin is removed with a wet lay-up squeegee. The rollers used were
typical of composite fabrication, were 25.4 mm in diameter and 89 mm in width, and are

28
readily available from most composite materials suppliers. The bristle brushes and
thermoplastic squeegees were inexpensive items found at a local hardware store.
The resin transfer molding equipment used was more expensive and involved than
that of the hand lay-up process. Before discussing the operation of the two RTM
injectors, it should be mentioned that a Speedaire air compressor pneumatically powered
both. The 75.7 liters of air that it supplies was regulated at a pressure of approximately
827 kPa and a flow rate of 283 liters per minute. This compressor was found to
adequately meet the air requirements of both injection systems.
The first RTM machine used in manufacturing was a Glas-Craft Spartan VR3
injector (Fig. 8). This system operates a series of reciprocating pneumatic cylinders that
force resin and catalyst through a static mixer and then into a given tooling. Injection
pressures and flow rates are fully adjustable, but for the mechanical test samples, the
supply line pressures and injector regulator pressures were held constant at 827 kPa and
Figure 7. Hand lay-up brushes, rollers, and squeegees.
29
97 kPa, respectively. The Spartan is a highly automated machine that will recirculate
materials to prime the system prior to injection, count the number of strokes per injection,
dispense a given number of strokes for an injection, and force acetone solvent and air
through the static mixer to clean the machine upon completion of the RTM process. An
additional feature of the Glas-Craft system is vacuum assist. This option allows the
Spartan RTM machine to be compatible with vacuum assisted resin transfer molding
(VARTM) with a vacuum of up to 85 kPa. This injector lends well to the RTM of large
parts, like turbine blade components, because it draws from a 208 liter source and
delivers resin in large volumes (293 mL/stroke). For research applications however, the
Spartan has its limitations. It does not come equipped with a data acquisition system that
can record injection pressures, resin flow rates, and molding cycle times. To record this
information for the current work, a pressure transducer and Hewlett-Packard data
acquisition system were used. An example plot of the injection pressure data recorded
with this equipment is shown in Figure 9. The varying injection pressures of the Spartan
RTM machine are demonstrated in this figure. The up and down-strokes produce
distinctly different pressures in the RTM tool during the course of an injection. Resin
flow rates were calculated from Figure 9 by noting the number of strokes and then
multiplying by the specified 293 mL per stroke.
The second resin transfer molding device used in research was the Radius 2100cc
injector (Figs. 10 - 11). The Radius operates similarly to a large pneumatic syringe. The
lower half of the injector is a long pneumatic cylinder that actuates a slave piston in the

Static mixer
RTM tool
Catalyst
Solvent
Resin
Figure 8. Spartan industrial grade RTM injection device
Figure 9. Spartan RTM injection pressure history.
0
50
100
150
200
250
300
350
0 20 40 60 80 100 120
RTM Cycle Time (seconds)
Spa
rtan
RT
M In
ject
ion
Man
ifold
Pre
ssur
e (k
Pa)
Injector down-stroke
Cylinder up-stroke
Tool venting
30

Figure 10. Radius 2100cc RTM injector with data acquisition.
Figure 11. Alcatel rotary vane vacuum pump used in VARTM.
Pneumatic cylinder
Resin reservoirData acquisition
RTM Tool
Vacuum pump
HDPE resin trap
Vacuum gauge
Oil mist eliminator
Aluminum resin trap
31

32
upper half, or resin reservoir side, of the Radius. Toggle controls manipulate the
extension, retraction and location of the slave piston. This system is capable of a wide
range of pressures and flow rates. The current work employed injection pressures
between 414 and 827 kPa with flow rates set by the adjustment screw turned out four
turns on the toggle control box.
The Radius 2100cc injector’s advantages do not lie with large moldings or
automated processes. The injector can only move 2100cc’s of resin in one stroke and
then must be refilled for further injecting (it must be noted however, that this is the
smallest injector manufactured by Radius Engineering). This process can be quite
cumbersome when compared with the Spartan’s method of operation. In addition, the
Radius does not have the automation features of the other RTM machine. Resin mixing,
injection control, and clean up must be performed manually. However, the Radius
system excels in its ability to perform advanced RTM injections, and to record the RTM
process with a complete data acquisition system. Advanced features available with the
Radius are resin position sensing, resin reservoir heating, and injection line temperature
elevation. These options allowed for the monitoring of convergent flow fronts and the
use of elevated temperatures for optimal RTM processing as outlined in the Background.
The data acquisition outfitted with the Radius 2100cc injector records all of the previous
information in six second intervals, in addition to the basic RTM parameters of injection
pressure, resin flow rate, tool pressure, and tool temperature. Though the Radius was
limited in initial injection volume, a data acquisition system was found to be necessary in
properly quantifying the RTM process. Examples of the injection pressure and flow rate

33
profiles recorded by the Radius data acquisition are shown in Figures 12 and 13,
respectively. From these figures the constant pressure operation and varying flow rates
of the Radius RTM system can be observed.
Radius Engineering Inc. highly recommended experimenting with vacuum
assisted injections using the 2100cc injector. In the interest of quantifying the benefits of
Vacuum-Assisted RTM or VARTM, an Alcatel 2005 SD, rotary vane vacuum pump (Fig.
11) was used in conjunction with the Radius injector. This pump worked to remove air
molecules from the resin, fiber preforms, and tooling for flat plate moldings with a
vacuum of 12-15 kPa. Additional components necessary for using the Alcatel pump in a
VARTM setting were a 4 liter, Nalgene heavy duty polyethylene (HDPE) bottle resin
trap, 0-100 kPa vacuum gauge, mechanical vacuum adjustment valve, and exhaust oil
mist eliminator.
Hand Lay-up and RTM Tooling
The above fabrics, resins, and processes were put to work on five different molds
during the course of this thesis. Flat plate, T-stiffener, I-beam, and Root mold materials
as well as their cure times are summarized in Table 6. These geometries were chosen for
their similarities to the leading edge, spar web, spar cap, and hub connection regions of a
composite wind turbine blade (Fig. 1). The T-stiffener and I-beam molds were existing
tools while the flat plate and root specimen molds were constructed during the course of
this study. The tools and their seals were manufactured from a variety of materials and
were selected because each has its own strengths and weaknesses. By employing a

0
100
200
300
400
500
600
700
800
0 1 2 3 4 5 6 7
RTM Cycle Time (minutes)
Rad
ius
RT
M In
ject
ion
Flo
w R
ate
(mL/
min
)
Maximum flow rate as injectorpressurizes line and inlet port
Variable flow rate behavior
Average injected resin flow rate
Figure 13. Radius RTM injection flow rate behavior.
0
50
100
150
200
250
300
350
400
0 1 2 3 4 5 6 7
RTM Cycle Time (minutes)
Rad
ius
RT
M In
ject
ion
Por
t Pre
ssur
e (k
Pa)
Ramping of injection pressureas resin initially permeates tool
Approximate constant pressure profile
Figure 12. Radius RTM injection pressure profile.
34
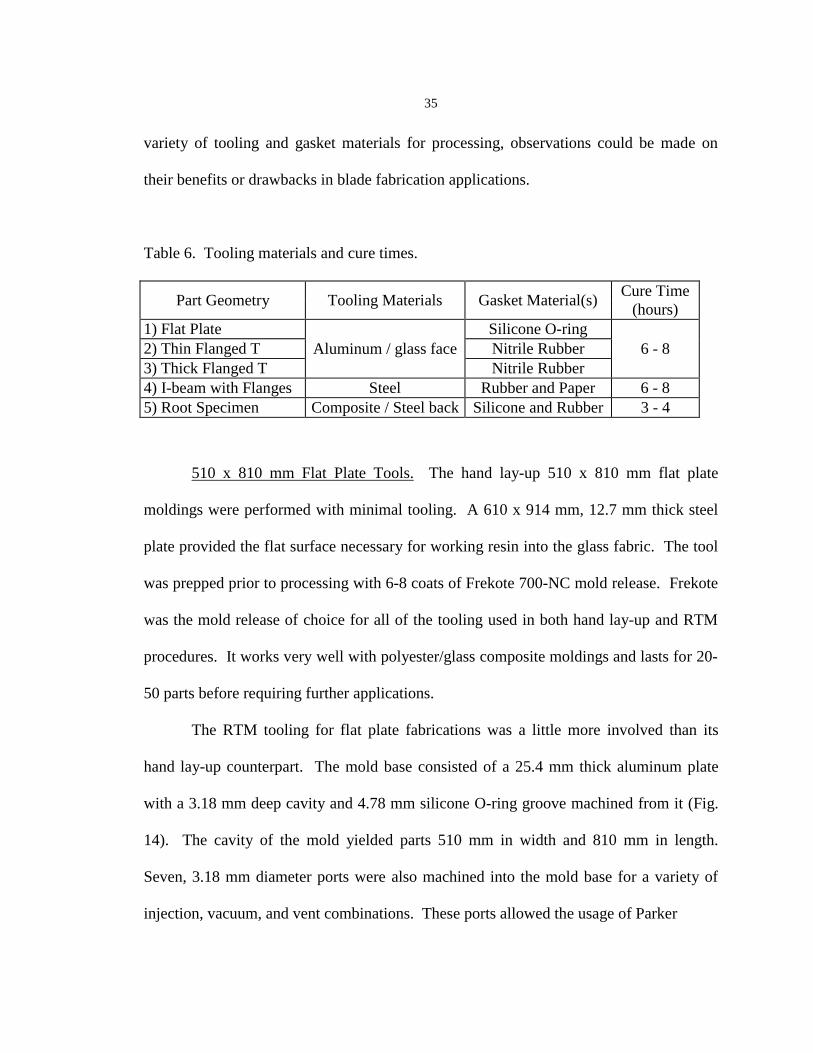
35
variety of tooling and gasket materials for processing, observations could be made on
their benefits or drawbacks in blade fabrication applications.
Table 6. Tooling materials and cure times.
Cure TimePart Geometry Tooling Materials Gasket Material(s)
(hours)1) Flat Plate Silicone O-ring2) Thin Flanged T Nitrile Rubber3) Thick Flanged T
Aluminum / glass faceNitrile Rubber
6 - 8
4) I-beam with Flanges Steel Rubber and Paper 6 - 85) Root Specimen Composite / Steel back Silicone and Rubber 3 - 4
510 x 810 mm Flat Plate Tools. The hand lay-up 510 x 810 mm flat plate
moldings were performed with minimal tooling. A 610 x 914 mm, 12.7 mm thick steel
plate provided the flat surface necessary for working resin into the glass fabric. The tool
was prepped prior to processing with 6-8 coats of Frekote 700-NC mold release. Frekote
was the mold release of choice for all of the tooling used in both hand lay-up and RTM
procedures. It works very well with polyester/glass composite moldings and lasts for 20-
50 parts before requiring further applications.
The RTM tooling for flat plate fabrications was a little more involved than its
hand lay-up counterpart. The mold base consisted of a 25.4 mm thick aluminum plate
with a 3.18 mm deep cavity and 4.78 mm silicone O-ring groove machined from it (Fig.
14). The cavity of the mold yielded parts 510 mm in width and 810 mm in length.
Seven, 3.18 mm diameter ports were also machined into the mold base for a variety of
injection, vacuum, and vent combinations. These ports allowed the usage of Parker

36
Presto-Lok fittings that accepted 6.4 mm polyethylene tubes. Parker fittings and
polyethylene tubes were used in all resin transfer moldings for their ease in clean-up and
removal. The flat plate mold was topped by two 12.7 mm thick, tempered glass plates
and a 4.78 mm thick sheet of Plexiglas for protection in the event excessive resin
pressures shattered the glass. The top glass plates were secured to the mold base and
compressed the silicone O-ring using 16, 152 mm C-clamps. The forces of the individual
C-clamps were distributed to the mold face via five rectangular tubes (51 x 51 mm in
cross section) which alleviated any stress concentrations that might fracture the glass
plates. For the flat plate wash-out study, to be discussed subsequently, a 19.1 mm thick
aluminum plate was substituted for the tempered glass faces because the injection
pressures were significantly higher than in the standard moldings.
C-clampSquare tubing
25.4 mm Aluminum base Tempered glass plates
Silicone O-ring
100 mm
Figure 14. 510 x 810 mm aluminum flat plate RTM tool.

37
Thin Flanged T-Stiffener Molds. The RTM thin flanged T-stiffener mold consists
of two 19.1 mm thick aluminum, L-shaped halves and a 12.7 mm tempered glass top
(Fig. 15). Both faces of the aluminum L-halves are machined out for mold cavities and
the upper surface of the tool has a milled groove to allow for a square, 6.4 x 6.4 mm,
nitrile rubber gasket/spacer. Unlike the flat plate mold where the tempered glass mated
immediately to the aluminum tool, the T-section molds were manufactured with a
combination gasket and spacer that allows more flexibility in the skin thickness. This can
cause some concerns, which will be addressed later in the Experimental Results chapter.
Between the web halves of the T-mold was another gasket/spacer made of nitrile rubber.
This gasket was fabricated from a sheet of 3.18 mm thick rubber and was punched to
allow 6.4 mm diameter bolts to secure the two L-shaped halves together. Mold filling
was accomplished through two skin ports located at one end of the mold with venting
allowed at the other. Two types of RTM T-stiffeners were molded from this tool. The
first allowed the web, flange and skin to co-cure in one complete geometry, while the
other included a piece of ReleaseEase®, a porous Teflon release film, between the flange
and skin. The Airtech release film product allowed for the secondary bonding of the
RTM’d part and the inclusion of this as a variable in investigating manufacturing
techniques. Unfortunately, due to the complex sealing structure of this tool’s geometry,
and that of the remaining tools, vacuum assistance was not feasible. A series of attempts
were made on the thin T-mold to seal it well enough to maintain a 15 kPa vacuum. All
the experiments performed to meet this end were unsuccessful. Additional tests were
performed on the thick flanged T and root molds, but these endeavors failed as

Figure 15. Thin flanged T-stiffener RTM mold (end, side, and top views).
Steel stock
Mold part line Injection ports
Rubber gasket
80 mm
120 mm
38

39
well. Thus, flat plate moldings allowed for experimentation with VARTM, while the
more complex composite structures were limited to RTM and hand lay-up comparisons.
Similarities with the flat plate mold included the usage of 4.78 mm thick acrylic sheet, C-
clamps and steel stock to secure the glass
face and to protect the RTM operators. The
dimensions of the resultant thin flanged T-
stiffener geometry (Fig. 16) were as
follows: skin and web thickness - 4.5 mm,
length - 432 mm , width - 152 mm, and
depth - 114 mm.
Hand laid-up thin flanged T-stiffeners were manufactured three different ways.
The first two processes were modified hand lay-up techniques. They involved wetting
the reinforcement out in a hand lay-up fashion, but then securing all three components
together in the RTM mold. This is not a common hand lay-up practice, but was chosen in
an attempt to preserve the amount of porosity introduced by the hand lay-up process
while maintaining the tight dimensional tolerances of RTM. Differences between the two
modified hand lay-up techniques involved the flange bond surface. In one instance, skin
and both web/flange pieces were allowed to cure in a single molding step, while in the
other, the skin was cured separately from the web and flanges to facilitate secondary
bonding of the surface later. The final hand lay-up technique remained true to the actual
process; two web and flange halves in addition to a single skin, was hand wet-out,
allowed to cure and then secondary bonded into the full T-stiffener geometry. Forming
Web
FlangeSkin
Figure 16. Thin flanged T-stiffener geometry.
40 mm

40
the fabric lay-up of the web/flange halves proved to be very difficult with the very sharp
radii (r = 1.8 mm) of the RTM mold. The reinforcement had the tendency to pull away
from this radius and adopt a greater transition between the web and flange surfaces. This
motivated the introduction of the modified hand lay-up technique already discussed.
Thick Flanged T-Stiffener Tooling. The RTM thick flanged T-stiffener mold
parallels very closely with the thin flange T-stiffener tool (Fig. 17). However, differences
between the two molds include flange lay-up, tool thickness, and injection/vent location.
For thick flanged T-stiffener fabrications, a build-up of additional fabric was used
between the flange and skin. These plies were added to simulate the spar cap scenario in
actual turbine blades, and the inclusion of this fabric introduced some changes in mold
design. One modification was thicker, 25.4 mm aluminum plates used in the L-halves to
allow for more material at the flange/skin interface. Differences between the thin and
thick flanged T-molds also included part length and injection geometry. Longer molds
produce more specimens per injection, which is desirable for many manufacturing cases.
However, longer tools yield slow mold fill times when injected from an end as a result of
low pressure gradients away from the injection ports. To counter this problem, injection
locations were chosen at the center of the mold and into both flange caps. This location
also allowed resin to enter immediately into a high volume area and facilitate better wet-
out of the part. Vents were located at both ends and performed well in letting displaced
air and mixed air/resin to escape. Teflon release film was also employed for some
specimens between the flange cap and skin to explore secondary bonding effects.

Figure 17. Thick flanged T-stiffener RTM tool (end, side, and top views).
50 mm
Injection portWeb gasket
120 mm
120 mm
41
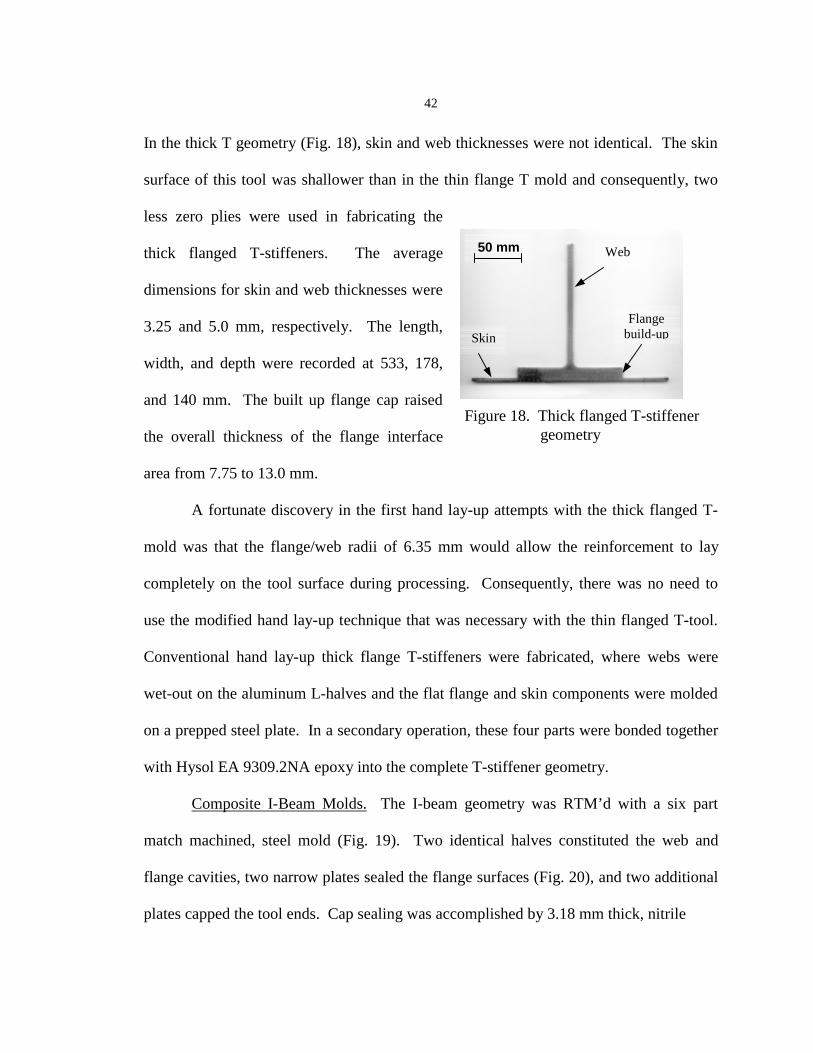
42
In the thick T geometry (Fig. 18), skin and web thicknesses were not identical. The skin
surface of this tool was shallower than in the thin flange T mold and consequently, two
less zero plies were used in fabricating the
thick flanged T-stiffeners. The average
dimensions for skin and web thicknesses were
3.25 and 5.0 mm, respectively. The length,
width, and depth were recorded at 533, 178,
and 140 mm. The built up flange cap raised
the overall thickness of the flange interface
area from 7.75 to 13.0 mm.
A fortunate discovery in the first hand lay-up attempts with the thick flanged T-
mold was that the flange/web radii of 6.35 mm would allow the reinforcement to lay
completely on the tool surface during processing. Consequently, there was no need to
use the modified hand lay-up technique that was necessary with the thin flanged T-tool.
Conventional hand lay-up thick flange T-stiffeners were fabricated, where webs were
wet-out on the aluminum L-halves and the flat flange and skin components were molded
on a prepped steel plate. In a secondary operation, these four parts were bonded together
with Hysol EA 9309.2NA epoxy into the complete T-stiffener geometry.
Composite I-Beam Molds. The I-beam geometry was RTM’d with a six part
match machined, steel mold (Fig. 19). Two identical halves constituted the web and
flange cavities, two narrow plates sealed the flange surfaces (Fig. 20), and two additional
plates capped the tool ends. Cap sealing was accomplished by 3.18 mm thick, nitrile
Flangebuild-up
Web
Skin
Figure 18. Thick flanged T-stiffener geometry
50 mm

Figure 19. Composite I-beam RTM mold.
Figure 20. End view of I-beam RTM tool cavity.
VentsRubber gasket
Injection ports
Tool end cap
C-clamp
50 mm
30 mm
43
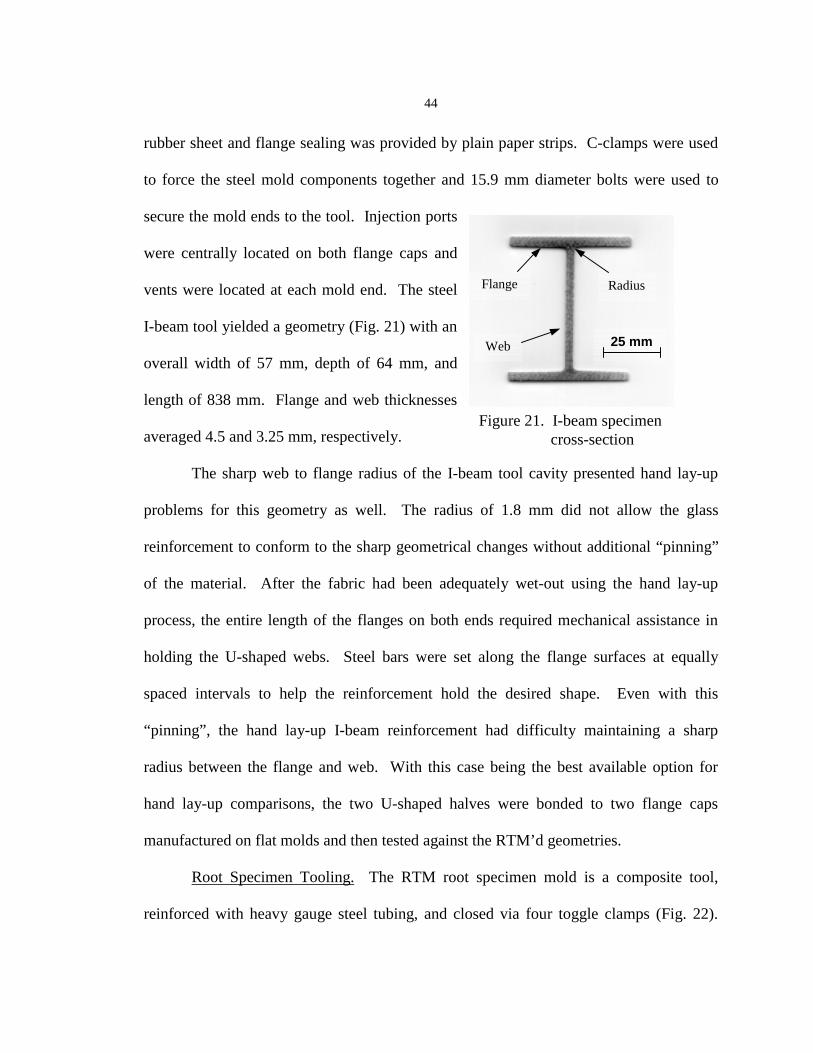
44
rubber sheet and flange sealing was provided by plain paper strips. C-clamps were used
to force the steel mold components together and 15.9 mm diameter bolts were used to
secure the mold ends to the tool. Injection ports
were centrally located on both flange caps and
vents were located at each mold end. The steel
I-beam tool yielded a geometry (Fig. 21) with an
overall width of 57 mm, depth of 64 mm, and
length of 838 mm. Flange and web thicknesses
averaged 4.5 and 3.25 mm, respectively.
The sharp web to flange radius of the I-beam tool cavity presented hand lay-up
problems for this geometry as well. The radius of 1.8 mm did not allow the glass
reinforcement to conform to the sharp geometrical changes without additional “pinning”
of the material. After the fabric had been adequately wet-out using the hand lay-up
process, the entire length of the flanges on both ends required mechanical assistance in
holding the U-shaped webs. Steel bars were set along the flange surfaces at equally
spaced intervals to help the reinforcement hold the desired shape. Even with this
“pinning”, the hand lay-up I-beam reinforcement had difficulty maintaining a sharp
radius between the flange and web. With this case being the best available option for
hand lay-up comparisons, the two U-shaped halves were bonded to two flange caps
manufactured on flat molds and then tested against the RTM’d geometries.
Root Specimen Tooling. The RTM root specimen mold is a composite tool,
reinforced with heavy gauge steel tubing, and closed via four toggle clamps (Fig. 22).
Web
Flange
25 mm
Figure 21. I-beam specimen cross-section
Radius

45
Headwaters Composites Inc. of Three Forks, MT. supplied this tool under MSU’s DOE
EPSCoR Program. Hedley molded the fiberglass composite tool from a hand laid-up
template and used two seals, silicone and rubber, to contain resin flow within the cavity
during injections (Fig. 23). Gel coat was applied prior to lamination, to form a smooth,
protective surface on the mold that would allow for easy removal of the finished parts.
Injection was achieved through a centrally located port in the skin side of the tool and
vents were located at three of the tool’s corners. Composite tooling is unique when
compared to the other materials used in molding the previous four geometries. Greater
care must be exercised because the metal equipment and acetone used to prep metal
tooling can be detrimental to composite molds. A strong advantage to using this “softer”
material is cure time, however. The root specimen is a relatively thick laminate and
generates a large amount of heat during polymer crosslinking. The fiberglass composite
tooling acts to insulate this reaction and it was found that the root specimens could be
processed in half the time of the other geometries. It should be noted here that while
some insulation assists in speeding along the curing process, a mold that does not
dissipate the exothermic reaction could reach degradation and combustion temperatures.
A final innovation worthy of mention concerning the RTM root molding is the combined
RTM’ing with a steel insert. The root geometry has been an important investigation
because of its unique role in transmitting large loads from the composite blade to the
rotating turbine hub. The root specimen currently being researched is a single sample
from an entire root section comprised of an oval geometry and ten inserts. It has been an
innovation in composites research to explore the use of blade mounting steel inserts in

Figure 22. Root specimen RTM mold from Headwaters Composites Inc.
Figure 23. Seal, injection, and vent locations for root specimen tool halves.
Toggle clamp
Composite tooling
Steel reinforcement
Air vent Injection port
200 mm
46

47
RTM processing. The root specimen uses a tapered and ribbed cylindrical insert from a
previous wooden turbine blade design for the AOC 15/50 turbine. These inserts were
incorporated for the first time between two composite laminates in this study. The root
RTM tool supports this insert during molding and is sealed with a rubber O-ring
compressed by a 19.1 mm diameter insert-locating bolt.
The final width and length of an RTM root specimen was 203 and 635 mm,
respectively (Fig 24). The laminate thickness, including the steel insert at the hub end, is
50 mm, while composite thickness towards the end of the laminate is 10 mm.
Hand lay-up root specimens were molded off of the 12.7 mm thick flat plate used
for components of the previous four geometries. A jig was fabricated from 3.18 mm
thick angle iron to support the steel insert during fabrication and a 19.1 mm bolt was
again used to locate the insert. The root specimen hand lay-up began with the wetting out
of the skin laminate. Tapered insert pieces and strips were then placed and wet out in
their appropriate locations. Next, the insert and darts were located and generous amounts
Blade innersurface
Skin surfaceSteel insert
50 mm
100 mm
Figure 24. Root specimen geometry.

48
of resin were added in this difficult to wet-out area. Finally, the inner surface laminate
was applied ply by ply and any excess resin was removed.
Safety Issues
There are inherent concerns when dealing with the materials that make up
composite structures. Persons working with the molding and finishing of composites
need to be well apprised on how to protect themselves from any potential safety
concerns. For the fiber reinforced plastics (FRPs) manufactured in the current evaluation,
serious risks were present if recommended safety equipment were not strictly used. Prior
to processing in the laboratories, it was very important to review the Materials Safety and
Data Sheets (MSDSs) for the chemicals and materials to be employed. A summary of the
safety concerns and protective equipment available to guard against fiberglass processing
dangers is presented in Table 7. These guidelines were rigidly followed for the present
research and it is highly recommended that others involved with composites
manufacturing remain well informed of the health risks and protective measures available
for the materials they process.
Fiberglass Recycling
A fiberglass recycling program was initiated under this project in an effort to
remain true to environmentally friendly, renewable wind energy developments. A
composite recycler was located nearby in Sultan, WA. and they agreed to reuse the scrap
product produced under this project. Amour Fiber Core Inc. accepted the mixed
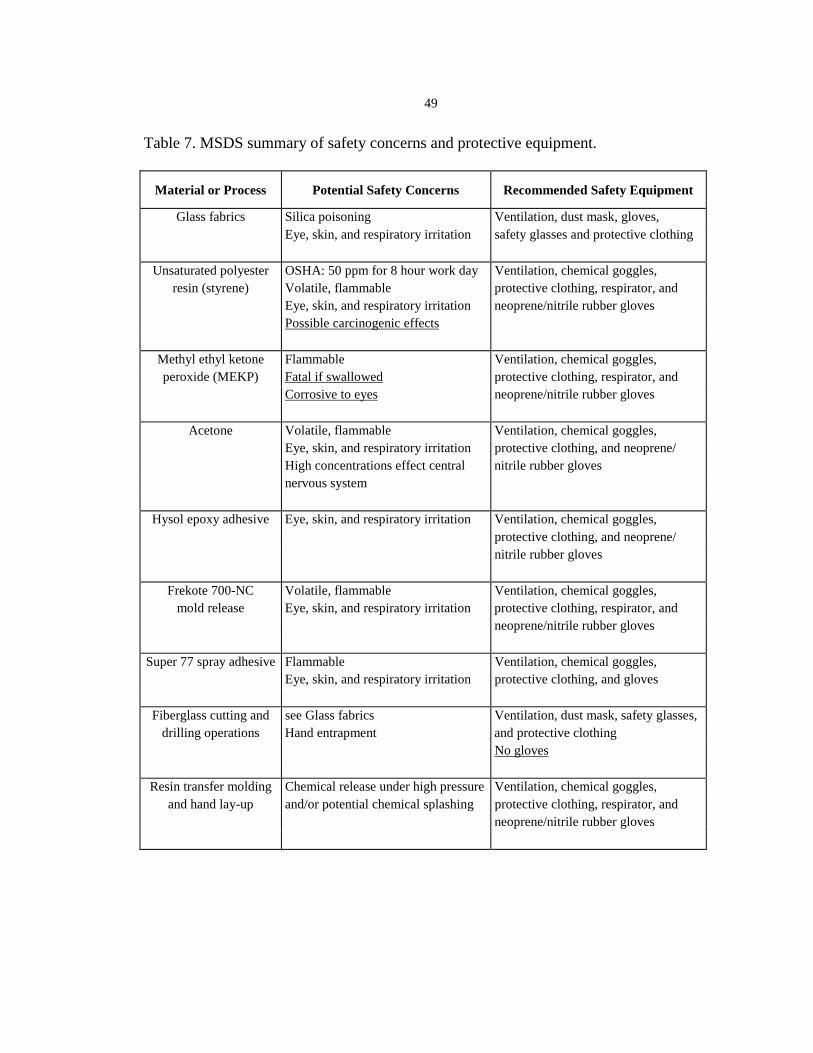
49
Table 7. MSDS summary of safety concerns and protective equipment.
Material or Process Potential Safety Concerns Recommended Safety Equipment
Glass fabrics Silica poisoning Ventilation, dust mask, gloves,Eye, skin, and respiratory irritation safety glasses and protective clothing
Unsaturated polyester OSHA: 50 ppm for 8 hour work day Ventilation, chemical goggles,resin (styrene) Volatile, flammable protective clothing, respirator, and
Eye, skin, and respiratory irritation neoprene/nitrile rubber glovesPossible carcinogenic effects
Methyl ethyl ketone Flammable Ventilation, chemical goggles,peroxide (MEKP) Fatal if swallowed protective clothing, respirator, and
Corrosive to eyes neoprene/nitrile rubber gloves
Acetone Volatile, flammable Ventilation, chemical goggles,Eye, skin, and respiratory irritation protective clothing, and neoprene/High concentrations effect central nitrile rubber glovesnervous system
Hysol epoxy adhesive Eye, skin, and respiratory irritation Ventilation, chemical goggles,protective clothing, and neoprene/nitrile rubber gloves
Frekote 700-NC Volatile, flammable Ventilation, chemical goggles,mold release Eye, skin, and respiratory irritation protective clothing, respirator, and
neoprene/nitrile rubber gloves
Super 77 spray adhesive Flammable Ventilation, chemical goggles,Eye, skin, and respiratory irritation protective clothing, and gloves
Fiberglass cutting and see Glass fabrics Ventilation, dust mask, safety glasses,drilling operations Hand entrapment and protective clothing
No gloves
Resin transfer molding Chemical release under high pressure Ventilation, chemical goggles,and hand lay-up and/or potential chemical splashing protective clothing, respirator, and
neoprene/nitrile rubber gloves

50
fiberglass scrap, cured polyester resin, and excess fabric to be used in their proprietary
process of making recycled products. The Amour Fiber Core corporation assists in
salvaging a small portion of the millions of tons of composite excess discarded every year
to manufacture innovative planks, pilings, tables, benches, and roofing tiles from
reclaimed materials. The assistance of Amour Fiber Core Inc. allowed for responsible
action during fiberglass structure manufacturing, while providing a valuable material for
further fabrications.
Physical and Mechanical Property Test Matrices
The experimental processes, lay-ups, fabrics, sample lots, and test types used in
the composites manufacturing evaluation are shown in Tables 8 - 12. A variety of
motives, rationale, and tests were considered in developing these experiments for the
geometries under investigation. The objectives with all of the physical and mechanical
investigations were to quantify any measurable differences between the hand lay-up and
RTM processes.
Flat Plate Experiments
The flat plate geometry was chosen for evaluating hand lay-up and resin transfer
molding because of its resemblance to the leading edge of the blade cross section
illustrated in Figure 25. The T-stiffener and I-beam geometries were also critical
components of the turbine blade cross-section (Figs. 26 - 27). Flat specimens were
examined for physical qualities and mechanical properties to lay the groundwork for

Figure 25. Skin (plate) surfaces in blade cross-section.
Figure 26. T-stiffener and skin interface in blade cross-section.
Figure 27. I-beam load carrier in blade cross-section.
51

52
investigating the more complicated geometries. Mechanical tests were necessary to
define the moduli, ultimate strengths, damage initiations, and final failures for a variety
of testing configurations. These properties helped to define the performance of more
complicated composite substructures. Physical investigations with flat plate specimens
provided the thickness, fiber volume fraction, weight, and cycle time data that were
necessary in comparing the hand lay-up and RTM processes.
Transverse tensile, compressive, three-point bending, axial tensile, and fatigue
testing configurations were chosen because they define the primary mechanical properties
for composite materials (Table 8). These tests were also chosen because they have been
conducted in previous research on carbon fiber reinforced plastics [40-44]. Though the
materials and architectures are drastically different in the fiberglass composites studied
herein, it was useful to define the mechanical performance for glass fiber reinforced
plastics as they relate to different manufacturing processes. The background literature
suggests that the transverse tension, compression, and bending tests will yield results that
are heavily dependent on pore size and quantity [37]. These tests are anticipated to have
significant differences between hand lay-up and RTM, and may be useful in
distinguishing between processes on a mechanical performance basis. The strengths of
composites in the uniaxial direction are largely dependent on the quantity of zero degree
fibers, and are little influenced by matrix strength or void content [1]. Consequently,
small deviations were expected for zero degree tensile results, but were performed
because of the property’s importance in composite analysis. Fatigue tests were

53
Table 8. Flat plate mechanical testing matrix.
Mechanical Process Lay-up Zero No. of MotivationTest Schedule Fabric Samples
[0/+45/0]s D155 5 Pearce suggests a 30% reductionHL A130 5 in bending strength for first 1% of
[0/0/+45/0]s D155 5 porosity [37]. Will similar resultsA130 5 be found for these glass-fiber
[0/+45/0]s D155 5 composites and RTM equipment?VARTM A130 5
Bending [0/0/+45/0]s D155 5A130 5
[0/+45/0]s D155 5A130 5
RTM [0/0/+45/0]s D155 5A130 5
60 total[0/+45/0]s D155 5 Test that is heavily dependent on
HL A130 5 matrix strength and its reduction[0/0/+45/0]s D155 5 due to porosity.
A130 5[0/+45/0]s D155 5
Transverse VARTM A130 5tension [0/0/+45/0]s D155 5
A130 5[0/+45/0]s D155 5
A130 5RTM [0/0/+45/0]s D155 5
A130 560 total
[0/+45/0]s D155 5 Porosity effects should show upHL A130 5 significantly with this test. Have
[0/0/+45/0]s D155 5 compression test results beenA130 5 published before?
[0/+45/0]s D155 5VARTM A130 5
Compression [0/0/+45/0]s D155 5A130 5
[0/+45/0]s D155 5A130 5
RTM [0/0/+45/0]s D155 5A130 5
60 total
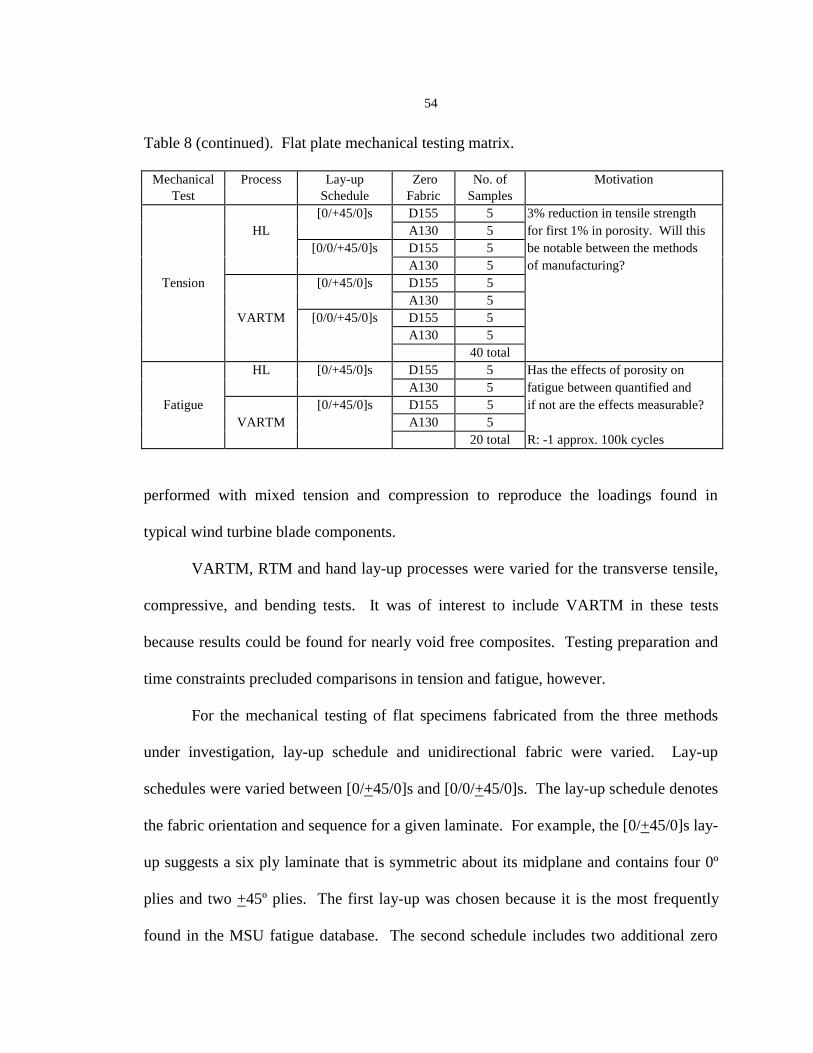
54
Table 8 (continued). Flat plate mechanical testing matrix.
Mechanical Process Lay-up Zero No. of MotivationTest Schedule Fabric Samples
[0/+45/0]s D155 5 3% reduction in tensile strengthHL A130 5 for first 1% in porosity. Will this
[0/0/+45/0]s D155 5 be notable between the methodsA130 5 of manufacturing?
Tension [0/+45/0]s D155 5A130 5
VARTM [0/0/+45/0]s D155 5A130 5
40 totalHL [0/+45/0]s D155 5 Has the effects of porosity on
A130 5 fatigue between quantified andFatigue [0/+45/0]s D155 5 if not are the effects measurable?
VARTM A130 520 total R: -1 approx. 100k cycles
performed with mixed tension and compression to reproduce the loadings found in
typical wind turbine blade components.
VARTM, RTM and hand lay-up processes were varied for the transverse tensile,
compressive, and bending tests. It was of interest to include VARTM in these tests
because results could be found for nearly void free composites. Testing preparation and
time constraints precluded comparisons in tension and fatigue, however.
For the mechanical testing of flat specimens fabricated from the three methods
under investigation, lay-up schedule and unidirectional fabric were varied. Lay-up
schedules were varied between [0/+45/0]s and [0/0/+45/0]s. The lay-up schedule denotes
the fabric orientation and sequence for a given laminate. For example, the [0/+45/0]s lay-
up suggests a six ply laminate that is symmetric about its midplane and contains four 0º
plies and two +45º plies. The first lay-up was chosen because it is the most frequently
found in the MSU fatigue database. The second schedule includes two additional zero
55
degree plies and allowed for comparisons in fiber volume between RTM’d laminates of
identical thickness and varying lay-up. This second schedule was also chosen because it
is representative of turbine blade designs where a high percent of unidirectional fabrics
are typically used (to resist large bending moments). Zero degree fabrics used in the
preceding lay-ups were the A130 and D155 reinforcements. A130 was selected because
it is the current fabric used in the MSU composite blade design. D155 was chosen
because of its better unidirectional properties. UC1018/V was not used in the mechanical
testing of flat plate specimens because of its difficulty in manufacturing and limited
availability.
Lastly, statistical sample size requires mentioning. At a minimum, five samples
of each configuration were tested for the different processes being studied. This sample
size yielded reasonable confidence in the average resultant values found, and in many
cases much larger groups were investigated. Actual sample lot sizes are presented along
with their paired results in the Experimental Results chapter.
The physical property studies for flat plate specimens included thickness
deviations, cycle times, porosity profiles, and wash-out thresholds. In preparing all of the
aforementioned mechanical testing specimens, thicknesses were recorded and later
compared according to fabric, lay-up, and process. This analysis provided evaluations
between laminate thickness tolerances and fiber volume fraction variations. These two
parameters are directly related to bond line tolerances, composite uniformities, blade
weights, and strength. Cycle times were another parameter compared between hand lay-
up and RTM in this study. This investigation assisted in quantifying the time required to

56
manufacture flat plate specimens using both processes. This information could then be
reduced to find approximate daily volume outputs and costs of parts. Thickness
variations and cycle times were measured for all of the composite substructures, and are
presented in the Experimental Results chapter under the Physical Property Comparisons
section. The final topic under investigation with flat plate specimens was wash-out
threshold for RTM injections. Fabric washout is undesirable distortion or movement of
the glass fabric preform initiated by excessive pressure gradients in the RTM process.
This condition compromises the mechanical strength of RTM’d substructures, and it is
worthwhile to determine when washout occurs. Defining the general trends in washout
behavior could also be beneficial to current research into RTM flow modeling [45]. Lay-
up schedule, fabric type, and injection location were varied in the current plate washout
study. The [0/+45/0]s and [0/0/+45/0]s lay-up schedules were used along with the A130,
D155, and UC1018/V fabric reinforcement types, to gather a broad sampling of washout
results. Injection location was another variable studied, because it was suspected that it
also plays a role in fiber washout behavior.
Thin Flanged T-Stiffener Investigations
The thin flanged T-stiffener geometry was chosen for the current study to
represent the spar web to blade skin joint of composite wind turbine blades (Fig. 26). A
critical mechanical test for this geometry is the stiffener pull-off test. This testing
configuration demonstrates the behavior of spar flange and skin layer delamination,
geometry stiffness, initial damage, and ultimate load capabilities of this structural detail
[46]. The T-stiffener pull-off test is important to wind turbine blade substructures

57
because it quantifies a common failure mode in composite blades. It is also useful to
study skin/stiffener delamination because this damage is difficult to detect for blades in
service.
Comparisons between hand lay-up and RTM for this geometry investigated
whether manufacturing process would have any effects on skin stiffness and
consequently, the pull-off behavior of the thin flanged stiffener geometry. The pull off
lay-up, fabric type, and bond interfaces were varied to investigate this concern (Table 9).
The evaluation of hand lay-up and RTM for this geometry was made with only one fabric
lay-up schedule. A [+45/02/+45]s lay-up was chosen since it performed well in previous
research [46]. The A130 and D155 fabrics were used based on the same rationale
developed for flat plate testing. The last variable considered in the T-stiffener designs
was bond interface. This variable was explored because it was unknown how the bonds
between textured surfaces of hand lay-up laminates would compare to the adhesion of
Table 9. Thin-flanged stiffener testing matrix.
Mechanical Process Zero Part No. of MotivationTest Fabric Adhesion Samples
D155 co-cured 5 What effects might porosity andsecondary (2) 5 skin stiffness reduction have on
HL secondary (3) 5 the interface?A130 co-cured 5
Stiffener pull-off secondary (2) 5D155 co-cured 5 Is surface finish directly related to
secondary (2) 5 the bond strength at the stiffener?RTM A130 co-cured 5
secondary (2) 545 total
Secondary (2) - Secondarily bonded in two componentsSecondary (3) - Secondarily bonded from three components

58
smooth or co-cured RTM surfaces. To accommodate hand lay-ups for this geometry, the
three different hand lay-up techniques were employed as described in the earlier T-
tooling section. Five samples of each test listed in Table 9 were fabricated to produce a
minimum sampling size for statistical comparisons.
Thick Flanged T-Stiffener Tests
The thick flanged T-stiffener geometry represents the spar web to blade skin
intersections where a built-up spar cap is used (Fig. 26). The T-stiffener pull off test was
used to quantify the mechanical behavior of this substructure. However, the results were
anticipated to be quite different than those found with the thin flanged geometry. Haugen
demonstrated that increased bending stiffness at the skin/stiffener interface would result
in laminate failures initiating at the flange tip as opposed to the center of the flange
halves in the thin flanged T-stiffener scenario [46]. Further details of these findings are
presented later.
As in the case of the thin flanged T-stiffener tests, lay-up was not varied (Table
10). Web lay-ups were set at [+45/02/+45]s, skin lay-ups at [+45/0/+45]s, and flange cap
lay-ups at [+45/02/+45/02/+45]s. As in previously mentioned tests, the A130 and D155
fabrics were used for comparisons. The sufficient radii of the thick flanged stiffener
mold allowed for the wet lay-up of webs and flanges without additional support. Skin
and spar cap laminates were also manufactured and in the final step all four components
were secondary bonded to complete the T-stiffener geometry. Haugen’s results showed
that bond thicknesses of 0.15 mm or less did not play a role in the mechanical
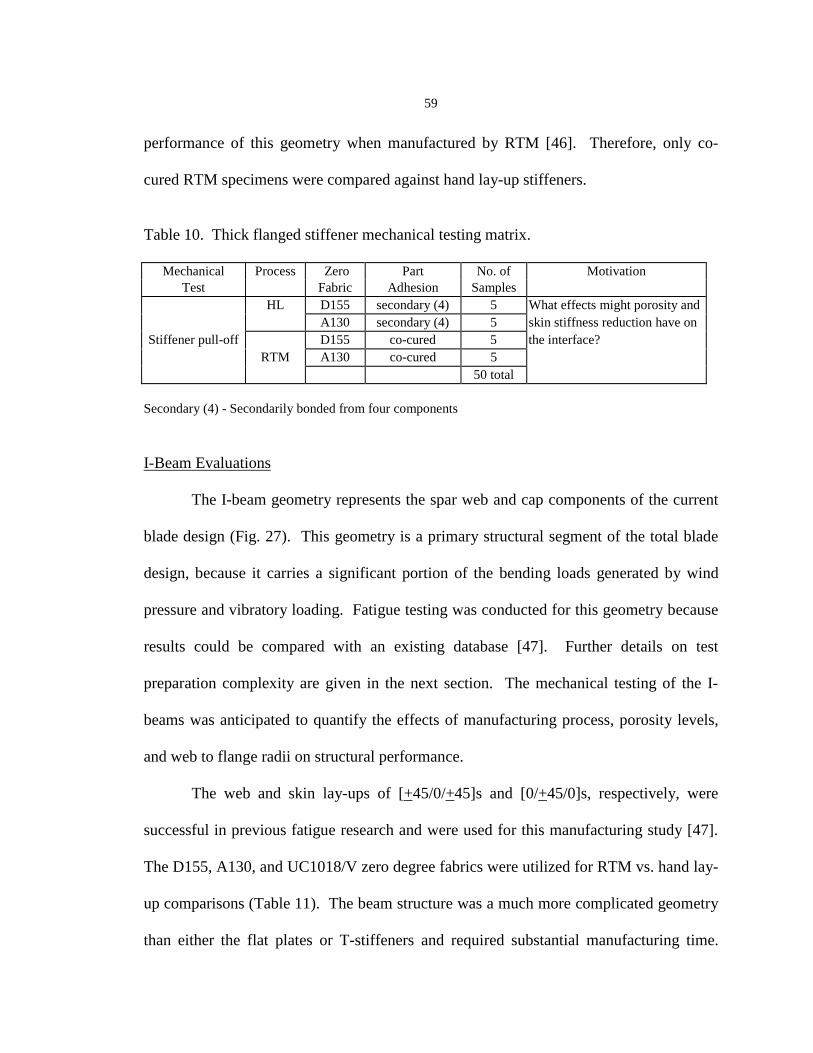
59
performance of this geometry when manufactured by RTM [46]. Therefore, only co-
cured RTM specimens were compared against hand lay-up stiffeners.
Table 10. Thick flanged stiffener mechanical testing matrix.
Mechanical Process Zero Part No. of MotivationTest Fabric Adhesion Samples
HL D155 secondary (4) 5 What effects might porosity andA130 secondary (4) 5 skin stiffness reduction have on
Stiffener pull-off D155 co-cured 5 the interface?RTM A130 co-cured 5
50 total
Secondary (4) - Secondarily bonded from four components
I-Beam Evaluations
The I-beam geometry represents the spar web and cap components of the current
blade design (Fig. 27). This geometry is a primary structural segment of the total blade
design, because it carries a significant portion of the bending loads generated by wind
pressure and vibratory loading. Fatigue testing was conducted for this geometry because
results could be compared with an existing database [47]. Further details on test
preparation complexity are given in the next section. The mechanical testing of the I-
beams was anticipated to quantify the effects of manufacturing process, porosity levels,
and web to flange radii on structural performance.
The web and skin lay-ups of [+45/0/+45]s and [0/+45/0]s, respectively, were
successful in previous fatigue research and were used for this manufacturing study [47].
The D155, A130, and UC1018/V zero degree fabrics were utilized for RTM vs. hand lay-
up comparisons (Table 11). The beam structure was a much more complicated geometry
than either the flat plates or T-stiffeners and required substantial manufacturing time.

60
Consequently, only three of each of the RTM specimens and two of the hand lay-up
beams were manufactured for this substructural comparison.
Table 11. I-beam fatigue testing matrix.
Mechanical Process Zero No. of MotivationTest Fabric Samples
HL D155 2 What effects might porosity andD155 3 sharp radii have on the strength
Fatigue RTM A130 3 of this complex geometry?UC1018 3
11 total
Root Specimen Studies
The root specimen developed herein represents a single insert of a completed root
to hub joint. This research laid the foundation for future studies into developing the
completed oval root substructure. Hand lay-up and RTM specimens were tested in static
tension and fatigue (Table 12). The comparison between processes determined whether
wet-out technique played a critical roll in the adhesion of the steel insert to the composite
laminates. Tensile tests measured the ultimate load of root specimens and how they fared
against the design limit load of 89 kN per insert, prescribed by McKittrick’s Finite
Element Analysis results [3]. Fatigue tests determined the lifetimes and failure modes of
root specimens under repeated loading.
The root specimen was unlike the previous substructures in that previous work
had not been conducted and adequate material combinations had not been developed
prior to this study. Consequently, much of the work concerning the root involved finding
fabric and lay-up combinations that would fill the RTM mold with an adequate fiber
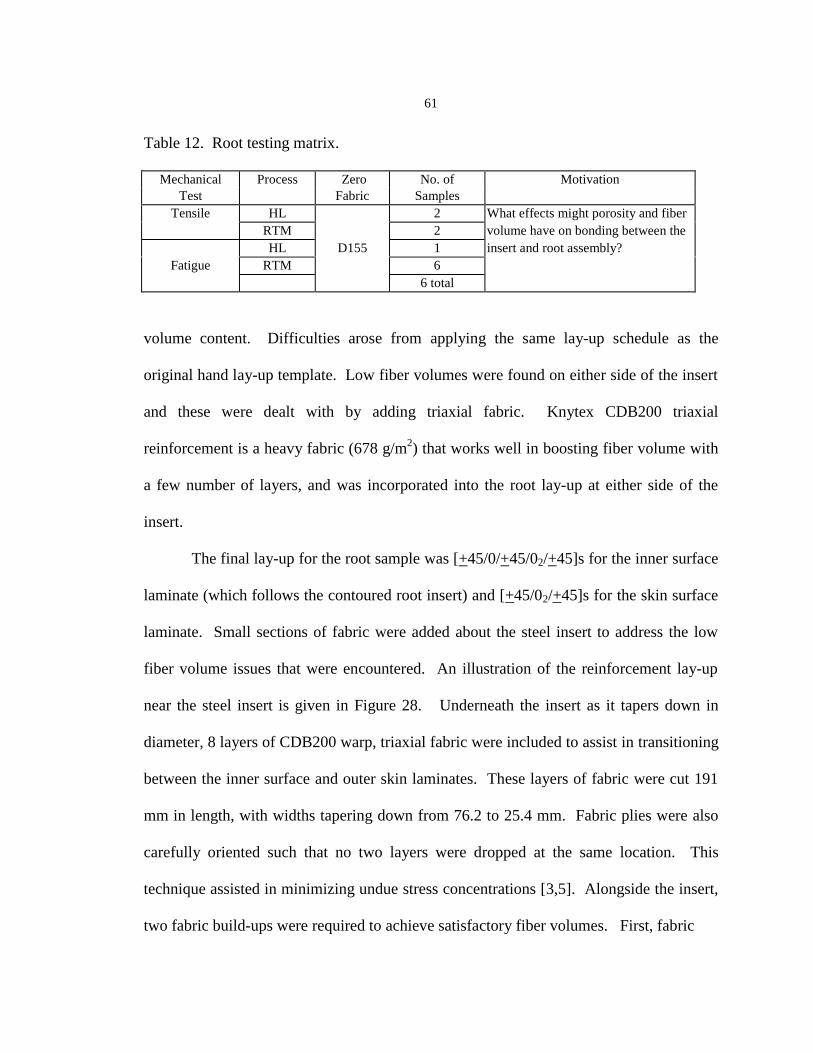
61
Table 12. Root testing matrix.
Mechanical Process Zero No. of MotivationTest Fabric Samples
Tensile HL 2 What effects might porosity and fiberRTM 2 volume have on bonding between theHL D155 1 insert and root assembly?
Fatigue RTM 66 total
volume content. Difficulties arose from applying the same lay-up schedule as the
original hand lay-up template. Low fiber volumes were found on either side of the insert
and these were dealt with by adding triaxial fabric. Knytex CDB200 triaxial
reinforcement is a heavy fabric (678 g/m2) that works well in boosting fiber volume with
a few number of layers, and was incorporated into the root lay-up at either side of the
insert.
The final lay-up for the root sample was [+45/0/+45/02/+45]s for the inner surface
laminate (which follows the contoured root insert) and [+45/02/+45]s for the skin surface
laminate. Small sections of fabric were added about the steel insert to address the low
fiber volume issues that were encountered. An illustration of the reinforcement lay-up
near the steel insert is given in Figure 28. Underneath the insert as it tapers down in
diameter, 8 layers of CDB200 warp, triaxial fabric were included to assist in transitioning
between the inner surface and outer skin laminates. These layers of fabric were cut 191
mm in length, with widths tapering down from 76.2 to 25.4 mm. Fabric plies were also
carefully oriented such that no two layers were dropped at the same location. This
technique assisted in minimizing undue stress concentrations [3,5]. Alongside the insert,
two fabric build-ups were required to achieve satisfactory fiber volumes. First, fabric

62
“darts” were inserted that had been used in the original hand lay-up template. The darts
were fabricated from 356 mm wide sections of D155 fabric that were 305 mm long.
These pieces were then cut at a 45° angle and rolled up to form a dart shaped
reinforcement. Darts were included on both sides of the steel insert to assist in laminate
transitioning. Through the iterative process of testing fiber volumes for the root
specimens, it was found that fabric darts were not adequate for filling these areas with
acceptable fiber volume fractions. Consequently, four additional strips of triaxial
reinforcement were laid underneath the D155 darts (between the dart and skin surface) on
either side of the steel insert. These narrow strips were 51 mm in width and tapered in
length from 229 to 305 mm.
The addition of darts, strips, and small fabric pieces allowed for better uniformity
in fiber volume over the total root geometry. But in the event similar geometries are
Triaxial build-up
Steel insert
D155 darts
Polyester insert tip
RTM vent
RTM gaskets
Figure 28. Example of root insert lay-up with dry fabric preform.

63
manufactured in the future, minimizing the number of these intricate pieces would be
desirable. Fabric placement was cumbersome at times, variability was greatly increased,
and time associated in fabric lay-up was magnified. For the current root mold, changes in
fabric lay-up for a moderate number of specimens required less effort than changing
mold geometry. However, from a manufacturing standpoint, it was observed that
complicated lay-ups were more likely to introduce inconsistencies, and simplifying fabric
lay-ups drastically reduced molding cycle times. The complicated lay-up also determined
that the number of specimens for this geometry would be less than those manufactured
for the flat plate and T-stiffener geometries. This observation underscores the need for
preform research in RTM manufacturing.
Testing Equipment and Procedures
The wide variety of geometries evaluated for hand lay-up and RTM
manufacturing necessitated a breadth of testing equipment and procedures. All of the flat
plate, T-stiffener, I-beam, and root matrix burn-off experiments followed ASTM standard
D2584 for fiber volume fraction calculations. Trimming and preparation of all samples
was done with a 203 mm diameter, diamond blade circular saw. This table saw was
equipped with a water system that provided cooling, flushed material away from the
blade circumference, and minimized the number of particles released into the air. In
addition, specimens less than 559 mm in length were cured in an oven at 60° C for two
hours; samples longer than 559 mm were allowed to cure at ambient temperatures for at
least seven days prior to testing.

64
Flat Plate Testing
The variety of mechanical tests performed on the flat plate specimens as well as
the variables explored for each experiment was shown in Table 8. Specimen dimensions
and testing specifications for these experiments are outlined in Table 13. All of the
information contained in this table followed ASTM standards and Samborsky’s
recommendations [48]. For the mechanical tests, Instron 8562 servo-electric and 8501
servo-hydraulic universal testing machines were employed. The Instron 8562 was used
for static testing, while the 8501 machine was used for fatigue testing. Instron
extensometers 2620-524, 2620-525, and 2620-26 were used to measure strain during
testing of axial and transverse tensile specimens (Fig. 29). Testing gage lengths for all of
the above extensometers was 12.7 mm. For the bending tests, a Lebow model 3132,
Table 13. Flat plate mechanical testing specifications.
Specimen Specifications Testing Specifications
Length Width Gauge Length Testing Rate Sampling RateTest Type
(cm) (cm) (cm) (cm/min) (Hz)
Transverse Tension 20.3 12.7 0.3 5
Bending 15.2 12.7 1.3 4
Compression 10.2 1.3 76 --
Tension 8.3 12.7 0.3 10
Tensile Fatigue 8.3
2.8
1.3 -- 6
2.2 kN load cell was run in series with the Instron 8562 load cell for greater precision. It
should also be noted that fatigue samples were tested in reversed tension and
compression loading (R value of –1, where R = maximum load/minimum load). This
testing strategy was chosen because it represents the worst case, fully reversed wind
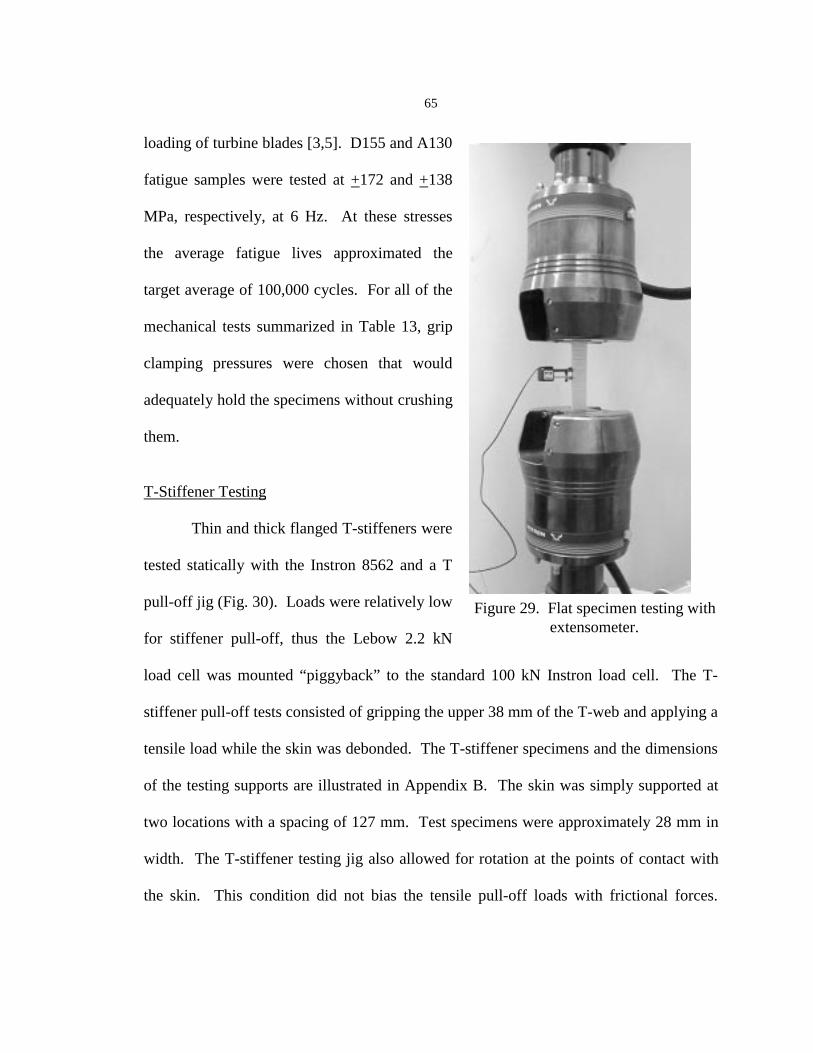
65
loading of turbine blades [3,5]. D155 and A130
fatigue samples were tested at +172 and +138
MPa, respectively, at 6 Hz. At these stresses
the average fatigue lives approximated the
target average of 100,000 cycles. For all of the
mechanical tests summarized in Table 13, grip
clamping pressures were chosen that would
adequately hold the specimens without crushing
them.
T-Stiffener Testing
Thin and thick flanged T-stiffeners were
tested statically with the Instron 8562 and a T
pull-off jig (Fig. 30). Loads were relatively low
for stiffener pull-off, thus the Lebow 2.2 kN
load cell was mounted “piggyback” to the standard 100 kN Instron load cell. The T-
stiffener pull-off tests consisted of gripping the upper 38 mm of the T-web and applying a
tensile load while the skin was debonded. The T-stiffener specimens and the dimensions
of the testing supports are illustrated in Appendix B. The skin was simply supported at
two locations with a spacing of 127 mm. Test specimens were approximately 28 mm in
width. The T-stiffener testing jig also allowed for rotation at the points of contact with
the skin. This condition did not bias the tensile pull-off loads with frictional forces.
Figure 29. Flat specimen testing with extensometer.
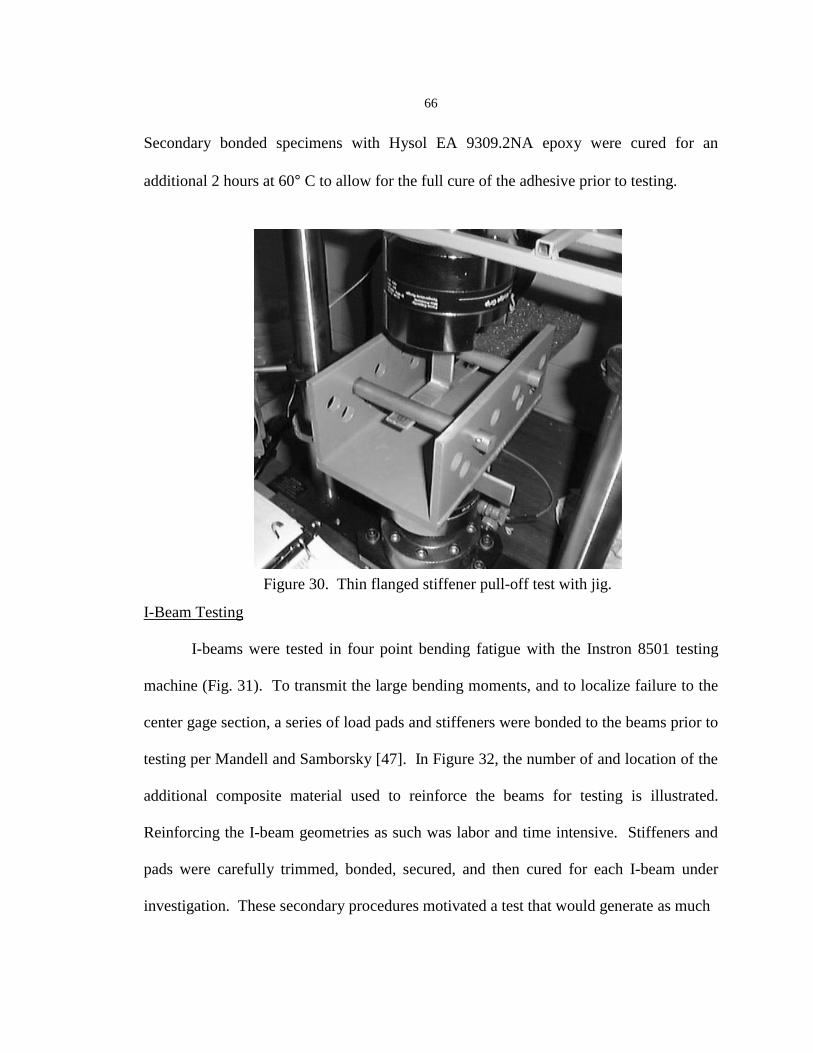
66
Secondary bonded specimens with Hysol EA 9309.2NA epoxy were cured for an
additional 2 hours at 60° C to allow for the full cure of the adhesive prior to testing.
I-Beam Testing
I-beams were tested in four point bending fatigue with the Instron 8501 testing
machine (Fig. 31). To transmit the large bending moments, and to localize failure to the
center gage section, a series of load pads and stiffeners were bonded to the beams prior to
testing per Mandell and Samborsky [47]. In Figure 32, the number of and location of the
additional composite material used to reinforce the beams for testing is illustrated.
Reinforcing the I-beam geometries as such was labor and time intensive. Stiffeners and
pads were carefully trimmed, bonded, secured, and then cured for each I-beam under
investigation. These secondary procedures motivated a test that would generate as much
Figure 30. Thin flanged stiffener pull-off test with jig.

Figure 31. Composite I-beam testing apparatus.
Figure 32. I-beam test geometry and stiffener locations.
67

68
useful data as possible. Hence, fatigue testing was chosen. Fatigue tests with an R value
of 0.1 performed at 5 Hz allowed for observation of delamination initiation as well as
fatigue cycle lifetime. The Instron 8501 required the retrofit of a four point bending jig
to allow for the I-beam testing [47]. With the hydraulic grips removed, a W150x18 I-
beam with 51 mm diameter roller bearing supports was mounted to the top half of the
testing machine, while a 127 x 127 x 6.35 mm rectangular, hollow, structural section with
roller bearings was located in the lower half. This jig allowed for four point bending
fatigue with a support span of 610 mm on the upper I-beam and 381 mm on the lower
rectangular section. End constraints of square tubing were also used to eliminate lateral
translation of the I-beam while being fatigued in the fixture.
Root Specimen Testing
The root specimen geometry was mechanically tested in static tension and fatigue.
Tensile tests were performed on a Baldwin 890 kN, hydraulic universal testing machine
(Fig. 33). Specimens were necked down away from the insert to a width of 89 mm for
gripping purposes. The insert end of the sample used a 19.1 mm diameter, grade 8 bolt to
transmit tensile loads. The gage length of these specimens was 533 mm. Root specimens
were loaded to failure and the ultimate loads were monitored with an internal pressure
transducer. Root fatigue specimens were tested on an MTS 880, 245 kN, servo-hydraulic
testing machine. Instron 8800 electronics were used to monitor load and fatigue life.
Fatigue samples were secured with 203 mm wide grips at the end opposing the insert and
did not require necking. Insert ends for the hand lay-up and RTM root specimens were

69
secured with 19.1 mm diameter bolts and gage lengths were 552 mm. Samples were
tested at an R value of 0.1 and stressed to a maximum of 89 kN during fatigue cycling.
Statistical Comparison Methods
The variety of geometries and tests in the current study generated a substantial
amount of mechanical property data with which to compare hand lay-up and RTM.
Consequently, a standardized method of determining significant differences in structural
performance according to process was necessary. Modern statistical evaluation
techniques were used to accomplish this task. A total of four statistical tests were used to
compare pairs or larger sets of property data for significant differences. Statistical
Figure 33. Root static tensile testing with Baldwin 890 kN testing machine.

70
methods allowed for the documentation of significant differences between hand lay-up
and RTM for each set of testing, fabric, and lay-up combinations. The terminology used
to describe the statistical results found in the next chapter are [49]:
• Normality: likelihood that a sample follows a normal, bell-shaped, Gaussiandistribution.
• P Value: probability of being wrong when asserting that a difference exists.Small P values (<0.05) suggest a difference, while P values approaching 1suggest no difference.
• Equal Variance: hypothesis that samples were drawn from populations withsimilar variability and deviation.
• T-Test: parametrical test used to determine if there is a difference betweentwo groups that is greater than what can be attributed to random samplingvariation.
• Mann-Whitney Rank Sum Test: nonparametric test to find whether twosamples are not drawn from populations with different medians whennormality or equal variance are not present in samples.
• One-Way ANOVA: used to explore whether two or more differentexperimental groups are from similar populations when the samples arenormally distributed and of equal variability.
• Kruskal-Wallis ANOVA on Ranks: nonparametric test to compare severalexperimental samples for population similarity when normality and equalvariance are not present.
With the experimental methods summarized, the results for physical property and
mechanical behavior can be reviewed for the hand lay-up and resin transfer molding
manufacturing processes.

71
CHAPTER 4
EXPERIMENTAL RESULTS AND DISCUSSION
RTM and Hand Lay-up Physical Property Comparisons
Evaluation of variations in laminate thickness, fiber content, cycle time, and
porosity for hand lay-up and RTM composites were the focus of the physical property
comparisons. These experiments were performed for all the geometries under
investigation to determine what effects processing would have on strength to weight
ratio, manufacturing time, repeatability, and defect quantity. This section concludes with
a study of the RTM molds used in the manufacture of the five geometries. The
advantages and limitations of each mold are summarized and discussed at length.
Thickness, Fiber Content, and Weight
Thickness and fiber volume content are parameters that significantly contribute to
the strength to weight ratios of composites [1,4,6,7]. The strength to weight ratio of
individual components and the thickness of the bondlines used to join them will
determine the overall structural performance of a given blade versus its weight. This is
important to wind turbine blade manufacturing, as well as to other composites
fabrications. In turbine blade applications, increased weight results in higher system
costs. Thus, a process’s ability to reduce thickness and improve fiber volume content in
72
flat plates and substructures will improve a turbine’s performance and reduce its cost. In
addition, minimizing or eliminating the number of bondlines for turbine components can
increase performance while reducing unnecessary weight and labor. Fewer bonds will
also reduce the number of expensive bonding jigs that need to be constructed and
maintained. These variables were studied for flat plate and more complex geometries.
Flat Plates. In Tables 14 – 15, the thicknesses and fiber volumes for the laminates
used in mechanical testing are summarized. The data shown in these tables were
gathered from approximately 33 specimens taken from at least two plates for each lay-up,
fabric, and process combination. A complete listing of the flat plate, mechanical test
specimen thicknesses can be found in Appendix A. All VARTM laminates were
manufactured from the same mold and therefore have almost identical thicknesses. Hand
lay-up did not have this advantage and in an effort to determine thickness variability for
hand lay-up fabrications, two operators processed each of the plate types. This practice
attempted to remove any bias the individual operator’s experience might have on the
thickness of hand lay-up laminates.
The results of Table 14 show the average thickness, range, and standard deviation
for the flat plates studied. Both hand lay-up and VARTM plate thicknesses were
gathered and tabulated. Reviewing this table shows that reductions in average thickness
and range were improved for all VARTM laminates over the hand lay-up baseline. The
[0/+45/0]s lay-ups experienced some thickness decrease (0.01 mm for laminates with
D155 fabric and 0.25 mm for A130), while thickness reductions were more substantial in
the thicker [0/0/+45/0]s laminates (1.5 mm for D155 and 1.2 mm for A130).

Table 14. Thickness results for flat plate laminates.
Mean No. ofThickness max. min. Samples(S.D.) mm mm mm mm
VARTM 3.25 (0.09) 3.43 3.07 0.36 33HL 3.26 (0.17) 3.68 3.07 0.61 32
VARTM* 3.74 (0.21) 4.04 3.25 0.79 32
VARTM 3.09 (0.08) 3.23 2.95 0.28 33HL 3.34 (0.14) 3.58 3.08 0.50 32
VARTM 3.27 (0.10) 3.48 3.02 0.46 33HL 4.84 (0.23) 5.34 4.39 0.95 33
VARTM 3.34 (0.12) 3.57 3.15 0.42 33HL 4.11 (0.32) 5.21 3.62 1.59 33
VARTM - Vacuum-Assisted Resin Transfer MoldingHL - Hand Lay-upS.D. - Standard Deviation* Cure without injection port ventilation, see text.
Table 15. Fiber content results for flat plate laminates.
Mean No. ofFiber Volume min. max. Samples
(S.D.) % % % %VARTM 34.4 (1.6) 32.7 36.1 3.3 33
HL 34.3 (3.2) 30.4 36.1 5.6 32VARTM* 29.9 (4.0) 27.1 34.4 7.3 32
VARTM 32.2 (1.1) 31.2 33.2 2.0 33HL 30.5 (2.1) 28.7 32.3 3.6 32
VARTM 48.9 (2.6) 46.3 52.3 6.0 33HL 33.0 (3.4) 29.8 36.7 6.9 33
VARTM 40.6 (2.6) 38.3 42.7 4.3 33HL 33.5 (5.3) 26.2 37.8 11.6 33
ProcessThickness
RangeLay-up Fabric
[0/0/+45/0]s A130 / DB120
D155 / DB120
[0/+45/0]s A130 / DB120
[0/0/+45/0]s D155 / DB120
[0/+45/0]s
Range
D155 / DB120
[0/+45/0]s D155 / DB120
Lay-up Fabric ProcessFiber Volume
[0/0/+45/0]s A130 / DB120
[0/+45/0]s A130 / DB120
[0/0/+45/0]s

74
These average thickness findings for hand lay-up and RTM result in notable
strength to weight ratio differences in the current MSU composite blade design for the
AOC 15/50 turbine. Increases in blade skin weight were predicted for the configuration
with the largest difference, the D155 / DB120 fabric, [0/0/+45/0]s lay-up. In both hand
lay-up and RTM composites, the glass reinforcement provides the majority of the
material’s strength. Thus, for the same amount of reinforcement material, thickness
remains the primary deciding factor for this laminate’s strength to weight ratio. For the
[0/0/+45/0]s composite, hand lay-up yielded an averaged 1.5 mm or 15% thicker
composite when compared with VARTM. If this lay-up was used in the MSU blade skin
design, a difference of 9.5 kg or 15.5% would exist between the hand lay-up and RTM
manufactured parts. These results were for a single blade skin and even greater
reductions in blade weight would be observed as all the blade components were joined.
This prediction demonstrates that seemingly small variations in thickness can have a
substantial effect on turbine blade weight due to its notable length and girth.
During the fabrication of the VARTM components, an interesting side result was
discovered. In the first round of VARTM moldings, the mold fill port was plugged off to
prevent excessive resin from escaping from the mold at the completion of every injection.
Later injections where the mold was allowed to drain revealed that the glass surfaces
actually deflected a notable amount due to resin pressure. Allowing the mold to drain
was found to significantly reduce laminate thickness and thickness variability. These
results are shown for [0/+45/0]s laminates with D155 and DB120 fabrics in Table 14.
Note that average thickness was increased by 0.5 mm and standard deviations doubled for
75
VARTM flat plates where glass was used as a molding material and the mold was not
allowed to vent during cure. This behavior was first noted by Hedley, continues to be a
problem when interested in monitoring flow fronts, and should be avoided if possible in
future VARTM and RTM moldings [33].
The results of Table 14 were correlated to fiber volume and presented in Table 15.
Since the fiber volume results are directly related to the thickness data of Table 15, the
trends of both groups were similar. Average fiber volumes and their variations were
improved for all VARTM laminates when compared to hand lay-up, with the more
noteworthy differences being found for [0/0/+45/0]s flat plates.
Graphical representations of Tables 14 and 15 are found in Figures 34 and 35. In
each figure, the average thicknesses and fiber volumes are shown along with their
respective maximum and minimum values. The average values of Figures 34 and 35
present a clear contrast of the thickness and fiber volume differences between laminates
manufactured by hand lay-up and RTM. It can also be noted that the range of measured
thicknesses and fiber contents for all RTM laminates were significantly less than those
recorded for the same composites manufactured by the hand lay-up process. Statistical
analysis techniques were used to compare the sets of data. This comparative technique
substantiated the trend that can be observed in Figures 34 and 35. No significant
difference was detected for [0/+45/0]s plates with D155 fabric, while all the other
laminates showed statistical differences between hand lay-up and VARTM. A complete
summary of the statistical comparisons is found in Appendix D.

76
Figure 34. Average flat plate thicknesses with maximum and minimum values.
Figure 35. Average flat plate fiber volumes with maximum and minimum values.
0.0
1.0
2.0
3.0
4.0
5.0
6.0
D155 [0/45/0]s A130 [0/45/0]s D155 [0/0/45/0]s A130 [0/0/45/0]s
Lam
inat
e T
hick
ness
(m
m)
Hand Lay-up VARTM
0
10
20
30
40
50
60
D155 [0/45/0]s A130 [0/45/0]s D155 [0/0/45/0]s A130 [0/0/45/0]s
Fib
er V
olum
e (%
)
Hand Lay-up VARTM

77
In addition to comparing thickness and fiber volume individually, it was useful to
present their combined results graphically. Figures 36 and 37 are examples of such
correlations. In Figure 36, the ranges of thicknesses and fiber volumes for hand lay-up
and VARTM are presented. The data points used in finding the individual curves of this
figure were found from composite matrix burn-off tests following ASTM Standard
D2584. The fiber volume content data collected can be found in Appendix E. Overall
curves were then made and the ranges of thickness and fiber volume were illustrated for
each process. It can be seen from Figure 36 that VARTM averages nearly the same
thickness for all fabric and lay-up combinations as was first presented in Table 14. The
range between maximum and minimum values is similar for all VARTM laminate types
and it is notably smaller than the ranges found for hand lay-up plates. Another
noteworthy finding in Figure 36 is the hand lay-up fiber volume threshold (Labeled “HL
Vf Threshold” in Fig. 36). Maximum fiber volumes between the four laminates appear to
vary between 33 and 37%. The information from this figure suggests that there exists a
natural attainable fiber volume from this method of hand lay-up and that this value is
approximately 35%.
The fiber volume and thickness data are presented again in Figure 37, along with
calculated fiber volume vs. thickness equations for the four flat plate laminates. Linear
equations were found best suited for the results of the [0/+45/0]s laminates, while
[0/0/+45/0]s laminates required quadratic correlations to best fit their broader range of
data. These equations were necessary in this study to find the fiber volumes for laminates

76
Figure 36. Flat plate fiber volume versus thickness with process ranges.
Figure 37. Flat plate fiber volume versus thickness with equations.
20
25
30
35
40
45
50
55
2.5 3.0 3.5 4.0 4.5 5.0 5.5 6.0
Laminate Thickness (mm)
Fib
er V
olum
e (%
)
D155/DB120 [0/45/0]s A130/DB120 [0/45/0]s
D155/DB120 [0/0/45/0]s A130/DB120 [0/0/45/0]s
VARTM
HL
HL Vf Threshold
1) y = -9.0534x + 63.825
2) y = -7.1418x + 54.322
3) y = 1.839x2 - 24.965x + 110.82
4) y = 1.4483x2 - 20.053x + 91.561
20
25
30
35
40
45
50
55
2.5 3.0 3.5 4.0 4.5 5.0 5.5 6.0
Laminate Thickness (mm)
Fib
er V
olum
e (%
)
1) D155/DB120 [0/45/0]s 2) A130/DB120 [0/45/0]s
3) D155/DB120 [0/0/45/0]s 4) A130/DB120 [0/0/45/0]s

79
of thickness not tested by the matrix burn-off method. They are presented here for future
work with these fabrics and lay-ups, and for further research beyond the laminate
thicknesses studied in this work. Having access to these equations prior to manufacture
could allow designers to prepare RTM molds that accurately yield laminates of a desired
fiber volume. This information would eliminate the need to follow an iterative process of
making laminates and then revamping tools to adjust the desired fiber volume. However,
the equations of Figure 37 are valid only for laminates of identical fabric types and fabric
proportions. Fabric architecture and lay-up schedule have different effects upon
consolidation of a laminate’s reinforcement. Consequently, a database of fiber volumes
for a variety of laminates and their thicknesses, is needed to assist composites designers.
The matrix burn-off of hand lay-up samples provided additional information for the MSU
fatigue database fiber volume equations. Hand lay-up samples of [0/+45/0]s lay-up and
D155/DB120 fabric were thicker than had been previously tested for the database, and
were added to original data collected by Samborsky [50]. The complete fiber volume
versus thickness data set for D155/DB120 [0/+45/0]s laminates are found in Figure 38.
Substructures. Thin flanged T-stiffeners, thick flanged T-stiffeners, I-beams, and root
specimens were analyzed for the effects of laminate thickness, bondline thickness, and
reinforcement transition radii on substructure weight. In Appendix C, laminate
thicknesses, fiber volumes, and equations relating the two are given for these complex
substructures. The number of samples fabricated for these cases was significantly less
than the number of specimens available for flat plate mechanical testing. Consequently,
the amount of matrix burn-off specimens and observed fiber volume deviations were
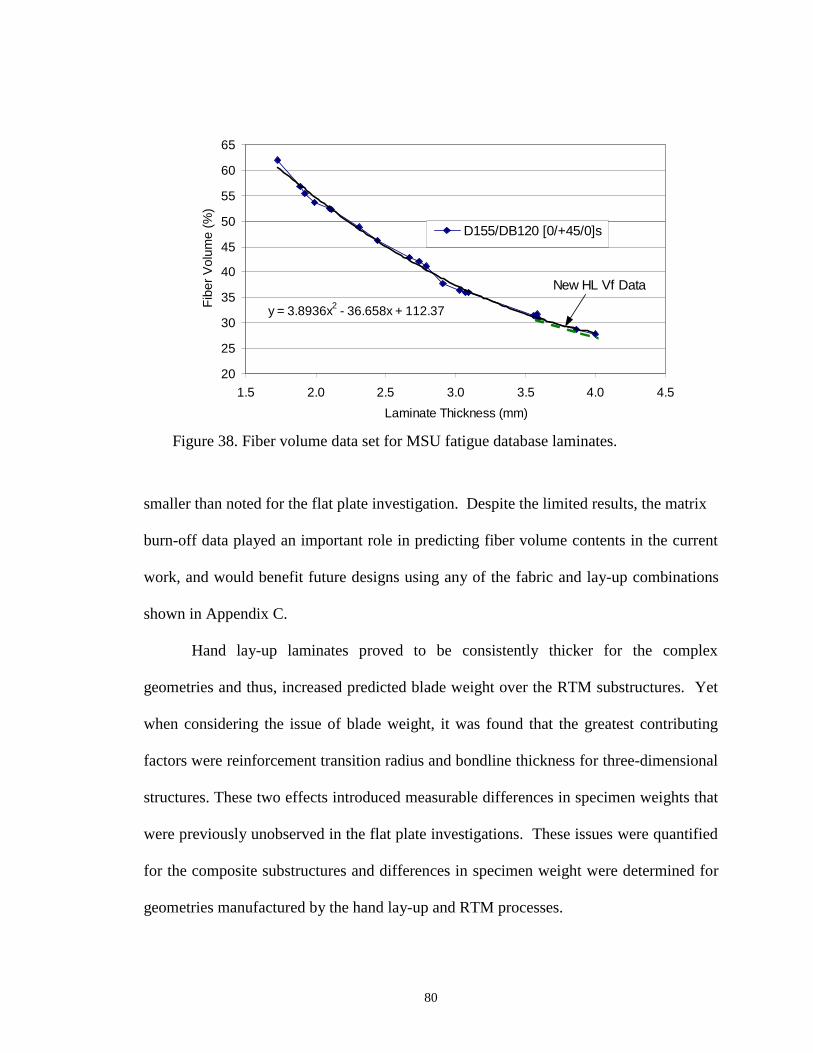
80
smaller than noted for the flat plate investigation. Despite the limited results, the matrix
burn-off data played an important role in predicting fiber volume contents in the current
work, and would benefit future designs using any of the fabric and lay-up combinations
shown in Appendix C.
Hand lay-up laminates proved to be consistently thicker for the complex
geometries and thus, increased predicted blade weight over the RTM substructures. Yet
when considering the issue of blade weight, it was found that the greatest contributing
factors were reinforcement transition radius and bondline thickness for three-dimensional
structures. These two effects introduced measurable differences in specimen weights that
were previously unobserved in the flat plate investigations. These issues were quantified
for the composite substructures and differences in specimen weight were determined for
geometries manufactured by the hand lay-up and RTM processes.
y = 3.8936x2 - 36.658x + 112.37
20
25
30
35
40
45
50
55
60
65
1.5 2.0 2.5 3.0 3.5 4.0 4.5
Laminate Thickness (mm)
Fib
er V
olum
e (%
)
D155/DB120 [0/+45/0]s
New HL Vf Data
Figure 38. Fiber volume data set for MSU fatigue database laminates.

81
In Figures 39 and 40 the cross sections of hand lay-up and RTM thin flanged T-
stiffeners are illustrated. From these cross sectional specimens bondline thicknesses, web
to flange radii and sample areas were found. The hand lay-up T-stiffener shown in
Figure 39 resulted in bond thicknesses ranging between 0.3 – 2.3 mm and a transition
radius of 6 mm for hand lay-ups of this geometry. It can be seen from this figure the
reinforcement’s inability to conform to the mold’s 1.8 mm transition radius. At the web
to flange transition, the fabric lay-up pulled away from the mold, as discussed earlier in
the RTM tool section, resulting in the 6 mm average transition radius. This effect
observed for the stiffener reinforcement contributed to the irregularity of the cross section
which increased bondline thicknesses and ultimately, the sample’s weight.
Examining Figure 40 demonstrates that bondline and transition radius tolerances
were much tighter for the RTM thin flanged T-stiffeners. The RTM specimens were
manufactured and co-cured in a single step as opposed to the secondary operations
necessary for the hand lay-up samples. This advantage could minimize the amount of
secondary bonding required in full-scale turbine blades. The use of a closed mold for
RTM’d T-stiffeners resulted in a geometry with a tighter and more consistent transition
radius (1.8 mm) than observed for hand laid-up samples. Minimizing web to flange radii
and eliminating secondary bonds resulted in a reduction of the cross sectional area and
the weight for RTM T-stiffeners when compared to the same samples manufactured by
hand lay-up.

82
Figure 39. Hand lay-up thin-flanged T-stiffener cross-section.
Figure 40. RTM thin-flanged T-stiffener cross-section.
Total Area: 1592 mm2
Bond Area: 214 mm2
Mass: 2.5 kg/m
Transition Radius: 6 mm
Max. Bond Thickness: 2.3 mm
38 mm
Transition Radius: 1.8 mm
Total Area: 1206 mm2
Mass: 1.9 kg/m
38 mm

83
Standard digital image analysis techniques were used to calculate the cross
sectional areas of the RTM and hand lay-up samples. The average cross sectional area of
the hand lay-up geometry was found to be 1592 mm2 as compared to the RTM specimen
area of 1206 mm2. The area contributed by secondary bonding materials was also found
for the hand lay-up sample. Bond material comprised 214 mm2 of the hand lay-up
sample’s area or approximately 13% of the cross section. The difference between total
hand lay-up T-stiffener cross section and RTM stiffener area was 386 mm2 or 24%.
The differences in cross sectional area yielded a significant distinction between
hand lay-up and RTM full-scale, thin flanged T-stiffener weights. First, specimen mass
per unit length was calculated for the stiffeners according to process. Assuming a
composite of 30% fiber volume and thus a density of 1.57 g/cm3, the masses per meter of
hand lay-up and RTM T-stiffeners were found to be 2.5 and 1.9 kg/m, respectively.
Multiplying these values by the MSU composite blade stiffener length of 6 meters (Table
b, Figure 1) resulted in full-length stiffener weights of 14.9 kg with hand lay-up and 11.3
kg by RTM. This reduction in mass of 3.6 kg (24%) would be observed twice in a
hypothetical RTM composite turbine blade of constant cross-section, as this geometry
configuration appears at both airfoil surfaces.
Illustrated in Figures 41 and 42 are the cross-sections of hand lay-up and RTM
thick flanged T-stiffeners. For this geometry, hand lay-up bondlines were found to vary
between 0.2 and 2.2 mm in thickness. Transition radii conformed well to the 6 mm mold
radius for both processes investigated.

84
Figure 41. Hand lay-up thick flanged T-stiffener cross-section.
Figure 42. RTM thick flanged T-stiffener cross-section.
Total Area: 2567 mm2
Bond Area: 264 mm2
Mass: 4.0 kg/m
Transition Radius: 6 mm
Max. Bond Thickness: 2.2 mm
20 mm
Total Area: 2168 mm2
Mass: 3.4 kg/m
Transition Radius: 6 mm
20 mm

85
The cross-sectional areas of the thick flanged T-stiffeners were 2567 mm2 for
hand lay-up and 2168 mm2 for RTM specimens. In the hand lay-up geometry, bond
material was 139 mm2 or 10% of the total cross-sectional area. This percentage of bond
material is significantly reduced when compared to the thin flanged case and can be
attributed to the mold’s 6 mm transition radius that better suits hand lay-up. Differences
in area between processes were still significant and measured to be 399 mm2 or 16%.
The areas of these stiffener specimens resulted in masses of 3.4 and 4.0 kg/m for
laminates of 30% fiber content manufactured by RTM or hand lay-up, respectively. If
the thick flanged T-stiffeners are extrapolated to the 6 meter spar length, differences in
mass between components would be 3.8 kg or 16 %, according to process. While a
greater transition radius was successful in reducing the amount of secondary bonding
material required to join irregular geometries, RTM exceeded hand lay-up in minimizing
substructure area and weight.
Shown in Figures 43 and 44 are the I-beam cross-sections for hand lay-up and
RTM specimens. As was previously observed for the thin flanged T-stiffener geometry,
hand lay-up did not conform to the tool’s 1.8 mm. Again, it was observed that the
reinforcement adopted the greater 6 mm radius. This resulted in bondline thicknesses
ranging between 0.4 and 2.6 mm for the hand lay-up I-beam specimen. RTM specimens
were co-cured and found to have transition radii matching the mold at 1.8 mm.
For the I-beam geometry, hand lay-up generated a cross-sectional area of 1020
mm2 while RTM yielded an area of 595 mm2. The hand lay-up area contained 139 mm2
of bond material or 14% of the overall cross-section. Differences observed between

86
Figure 43. Hand lay-up I-beam cross-section.
Figure 44. RTM I-beam cross-section.
Total Area: 1020 mm2
Bond Area: 139 mm2
Mass: 1.6 kg/m
Transition Radii: 6 mm
Max. Bond Thickness: 2.6 mm
10 mm
Total Area: 595 mm2
Mass: 0.9 kg/m
Transition Radii: 1.8
10

87
I-beam specimen areas according to process were 425 mm2 or 42%, the greatest
difference observed for the goemetries under investigation. The unit masses for I-beams
manufactured by hand lay-up and by RTM were calculated and these values were found
to be 1.6 and 0.9 kg/m, respectively. When extending this geometry over the 6 meter
spar span of the current blade design, a 4.0 kg or 41% mass difference was observed.
These findings illustrate the importance manufacturing process selection has on
dimensional control and subsequent substructure weight differences.
Root specimens were investigated for fiber volume versus thickness relations and
component weight for estimating the properties of a complete hub to blade joint.
Differences in weight for the substructures already discussed were noteworthy because
their centers of mass were located at distances of at least 4 meters from the rotating
turbine hub. Reducing mass for full-scale T-stiffeners and I-beams could lower the polar
or rotating inertia of a wind turbine, increase its efficiency, and decrease turbine support
structure weights. However, the centroidal mass of a root connection is only a fraction of
a meter away from the turbine’s rotating hub. Variations in mass at this short distance
from a blade’s center of rotation would have less of an effect on the inertia and efficiency
of a turbine compared to structures along the blade span. Hence, investigating the weight
behavior of the other three-dimensional geometries was of greater importance and
exploring the benefits processing might have on the complete root to hub joint weight is
left for future research.

88
The weights of individual root specimens were used in projecting the
approximate weight of the complete root assembly. This information was anticipated to
be useful in making predictions of full-scale composite turbine blade weight. Single root
specimens were weighed and that information was extrapolated for the entire joint.
Single specimens had a mass of 3.85 kg with 0.85 kg being contributed by the steel
insert. The MSU composite blade design for the AOC 15/50 turbine consists of 10 such
inserts, and the total mass of the current root joint design was estimated at 38.5 kg.
Significant differences were not found between hand lay-up and RTM root weights nor
were they explored in depth by the rationale previously discussed.
Suggesting the actual weight savings that can be accomplished with RTM for the
MSU composite turbine blade is difficult. The substructure mass analyses presented a
straightforward method for comparing the hand lay-up and RTM processes while making
reasonable approximations on the weight savings for actual turbine blade components. It
should be noted that the geometries of this evaluation were primarily of uniform cross-
section and that they simplify the weight savings calculations for full-scale blades. The
turbine blade design has a twisted, tapered geometry that is more complicated than the
constant cross-sections studied herein. As a result, the weight differences between hand
lay-up and RTM substructures in the MSU composite blade design might differ slightly
from the current findings. The focus of this study was to identify and quantify the
variables that affect blade component strength and weight. Thickness, fiber volume,
transition radius, and bondline thickness were found to be the greatest contributors and
their effects on blade component weight have already been discussed. The RTM process
89
was found to outperform hand lay-up for all these parameters that contribute to
substructure weight. And when process effects are extrapolated for full-scale blade
substructures, it is observed that RTM reduces weight, labor, and cost while improving
turbine performance when compared to hand lay-up.
Fabrication Cycle Times
Process cycle times are important to turbine blade fabrications because they help
to establish the cost and volume output of the parts manufactured. Methods that have a
higher degree of automation will yield parts of greater consistency while reducing the
cost of labor involved. In addition, automation can reduce the total time in
manufacturing and increase the number of blades fabricated in a workday. As a result, it
was important in this work to review and evaluate cycle times for the hand lay-up and
RTM of the five substructures under investigation.
In Table 16, examples of the steps taken in hand lay-up and RTM fabrications are
given. For each geometry studied, comparative tables were compiled and are presented
in Appendix D. For each task in the hand lay-up or RTM operations, times were
recorded from three different substructure fabrications and averaged. Overall fabrication
times could then be summarized and compared between geometry and process. The
individual hand lay-up and RTM processing steps of Table 16 include:
• Fabric Cutting: time required to extract reinforcement lay-ups from fabric rolls.
• Hand Lay-ups: the wet process of manually permeating resin into fabricreinforcements using rollers and brushes on an open mold.
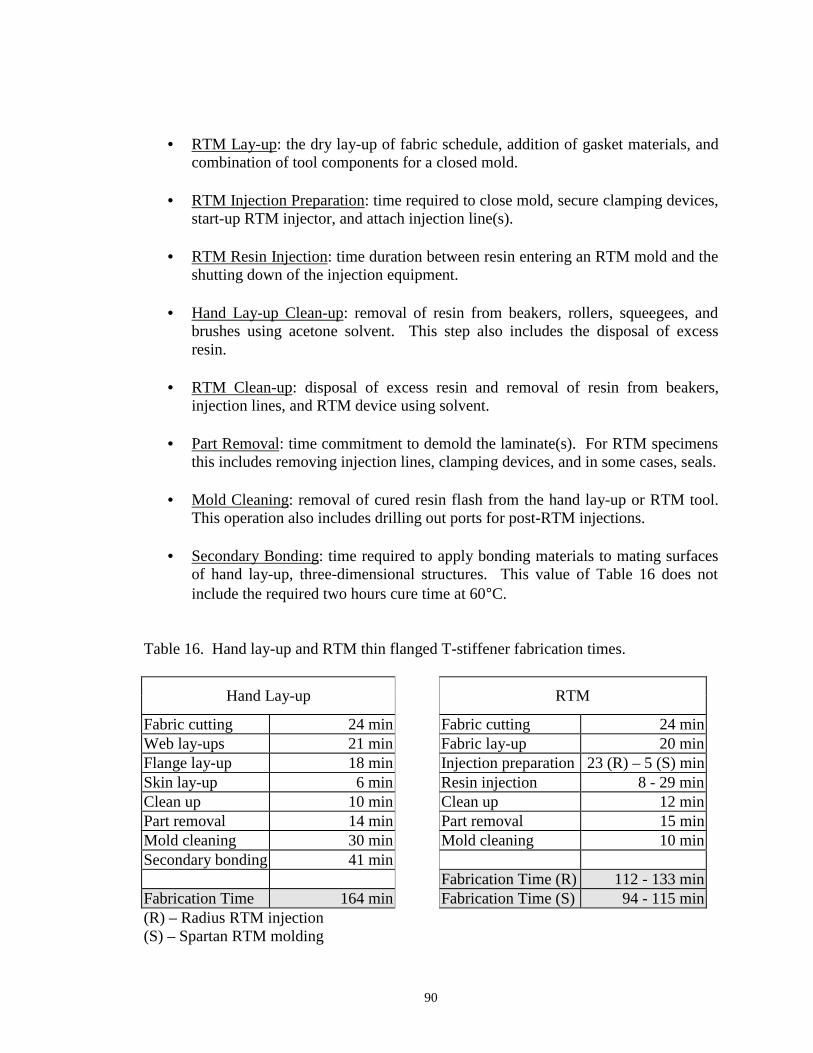
90
• RTM Lay-up: the dry lay-up of fabric schedule, addition of gasket materials, andcombination of tool components for a closed mold.
• RTM Injection Preparation: time required to close mold, secure clamping devices,start-up RTM injector, and attach injection line(s).
• RTM Resin Injection: time duration between resin entering an RTM mold and theshutting down of the injection equipment.
• Hand Lay-up Clean-up: removal of resin from beakers, rollers, squeegees, andbrushes using acetone solvent. This step also includes the disposal of excessresin.
• RTM Clean-up: disposal of excess resin and removal of resin from beakers,injection lines, and RTM device using solvent.
• Part Removal: time commitment to demold the laminate(s). For RTM specimensthis includes removing injection lines, clamping devices, and in some cases, seals.
• Mold Cleaning: removal of cured resin flash from the hand lay-up or RTM tool.This operation also includes drilling out ports for post-RTM injections.
• Secondary Bonding: time required to apply bonding materials to mating surfacesof hand lay-up, three-dimensional structures. This value of Table 16 does notinclude the required two hours cure time at 60°C.
Table 16. Hand lay-up and RTM thin flanged T-stiffener fabrication times.
Hand Lay-up RTM
Fabric cutting 24 min Fabric cutting 24 minWeb lay-ups 21 min Fabric lay-up 20 minFlange lay-up 18 min Injection preparation 23 (R) – 5 (S) minSkin lay-up 6 min Resin injection 8 - 29 minClean up 10 min Clean up 12 minPart removal 14 min Part removal 15 minMold cleaning 30 min Mold cleaning 10 minSecondary bonding 41 min
Fabrication Time (R) 112 - 133 minFabrication Time 164 min Fabrication Time (S) 94 - 115 min(R) – Radius RTM injection(S) – Spartan RTM molding

91
The individual fabrication steps found in Table 16 for hand lay-up and RTM did
not include the start up and shut-down time associated with each individual task of the
operations. For example, when recording the time required to cut fabric for a flat plate
laminate used in this study, the time involved in rolling out the fabric, locating cutting
utensils, returning cutting supplies, and reeling fabric back onto the roll was not included.
This method allowed for the best approximation of the efficient operations found in an
industrial setting. It should also be noted that populations were not large enough to
justify presenting their standard deviations and therefore, only the average values for the
individual time steps and the resultant cycle times were calculated. A summary of the
resultant fabrication times for all of the substructures manufactured in this study is
presented in Table 17.
The fabrication times and time savings between hand lay-up, RTM with the
Radius injector, and RTM using the Spartan equipment are shown in Table 17. Both
RTM cycle times were recorded due to a significant difference found in injection
preparation time. For example, in Table 16, injection preparation times differed between
RTM machines by as much as 17 minutes. This distinction in injection preparation speed
was inherent to the type of injection device used. As previously mentioned in the
Experimental Methods Chapter, the design of each RTM injector had different strengths
and weaknesses. While the Radius RTM injector was one of the best available options
for a constant pressure device outfitted with data acquisition, one drawback was that it
was labor intensive in injection preparation and clean-up. On the other hand, the Spartan
RTM machine was simpler to start-up and shut-down and thus is more likely to be found

92
Table 17. Hand lay-up and RTM specimen fabrication time summary.
Fabrication Time Saved Time SavedGeometry Process Time with RTM (S) with RTM (S)
min min %HL 83 10 14
[0/+45/0]s Flat plate RTM (R) 90 17 23RTM (S) 73 -- --
HL 99 28 39[0/0/+45/0]s Flat plate RTM (R) 88 17 24
RTM (S) 71 -- --HL 116 45 63
Thin Flanged T-stiffener RTM (R) 87 16 23RTM (S) 71 -- --
HL 164 59 56Thick Flanged T-stiffener RTM (R) 123 18 17
RTM (S) 105 -- --HL 175 61 54
I-beam RTM (R) 132 18 16RTM (S) 114 -- --
HL 133 14 12Root specimen RTM (R) 135 16 13
RTM (S) 119 -- --
HL - Hand Lay-upRTM (R) - Resin transfer molding with Radius injector.RTM (S) - Resin transfer molding with Spartan equipment.
on a factory floor. This difference in processing time for the geometries studied was duly
noted and summarized in Table 17.
It should be noted that for the cycle times of Table 17, each geometry RTM’d
with the Spartan equipment was considerably quicker in fabrication time when compared
to hand lay-up. It may also be observed from this table that the differences in fabrication
times between hand lay-up and RTM increased with the increasing complexity of the part
being manufactured. For example, [0/+45/0]s flat plates were completed 10 minutes or
93
14% faster when the RTM process was employed, whereas the difference in fabrication
times was 59 minutes or 56% for thick flanged T-stiffeners between processes.
The only case where a complex geometry did not benefit greatly from the
automation of RTM was for the root specimen scenario. This affect can be attributed to
the steel insert, the complicated preform, and the complex mold configuration used to
manufacture this laminate. Both hand lay-up and RTM productions of this geometry
included a support system for the insert. These jigs maintained the insert in relation to
the rest of the laminate, such that the root products would have the steel inserts in the
identical location even when process was varied. As a result, the RTM tool for the root
specimen was significantly more complicated and difficult to prepare than the other
substructure molds. A locating bushing, steel bolt, and O-ring seal were required to mate
with the ribbed insert and combining all of these components prior to molding resulted in
a notable increase in fabrication time. The benefit in processing time with RTM was
significant for the root specimen, but the time savings was just a fraction of what was
found for other three-dimensional substructures, due to the extensive mold preparation.
With the exception of the root specimen, it is demonstrated in Table 17 that
geometries manufactured by RTM will result in a reduction in fabrication time over hand
lay-up with increasing part complexity and size. Benefits in fabrication times for turbine
components in the industrial setting could be even greater than those listed in Table 17.
The results of this table illustrate the advantages of laying up dry preforms and then using
RTM injection equipment to automate the composites manufacturing process, as opposed
to the wet lay-up of individual layers of reinforcement. The current results also

94
demonstrate that RTM manufacturing technique advantages would be greater for
specimens of increased size and complexity. While the lay-ups and thicknesses mimic
the actual MSU composite turbine blade components (Figure 1b), the sample sections of
this study were only a small fraction of the total 8 meter length of this blade. Thus, as the
complications of wet lay-up are compounded with increasing length and complexity, it
can be assumed that industrial manufacturers would observe even greater benefits in
cycle time than those of Table 17.
The final topic investigated under the fabrication time study was cure time. There
were two cure times measured for the geometries and processes of this study. These were
the cure times of the composite laminate, and the cure times of the epoxy adhesive used
in secondary bonding operations. Neither of these values were included in the fabrication
times of Table 17 as they might strongly bias the results and not allow for comparison of
the individual steps taken for each process. The cure times for each geometry with its
tool at ambient temperatures were provided in the Experimental Methods chapter.
However, when discussing the optimization of the hand lay-up and RTM processes, it is
beneficial to refer to the results of Yu and Young [36]. As the authors suggest, cure
times for the RTM process can be largely improved at elevated temperatures. These
benefits were not explored in the current work due to the large cost and difficulty
introduced with heating all of the tools used.
In a production setting, turbine blade fabricators would take advantage of elevated
temperatures with closed, RTM molds to maximize part output. For example, if a
manufacturer produced the thick flanged T-stiffeners of Table 17 using hand lay-up,
95
cycle times would be 164 minutes in addition to the 4-8 hours cure time. Unlike RTM, it
is inefficient and difficult to heat an open mold and consequently, requires a lengthy cure
time. Thus, only one part per day can be fabricated for each given tool using hand lay-
up. RTM with elevated temperatures and pre-manufactured preforms on the other hand,
could have cycle times on the order of minutes, with curing being done immediately after
initial gelling in the mold. Adopting this modern RTM methodology would result in
many more parts per mold per workday than the amount possible with the hand lay-up
manufacturing technique.
Secondary bonding operations resulted in increased hand lay-up processing times
when compared to their RTM counterparts. For most RTM applications entire
components or large substructures can be injected and co-cured in one step. This is not
the case for most hand lay-up assemblies, however. Because open molds are required,
only flat or simple components can be wet laid-up. As a result, larger structures are built
up from simpler pieces, and bonded together in a secondary operation. This was
observed for the T-stiffener and I-beam geometries in this work. The results of Table 17
show the times required to manufacture the individual components and apply adhesive
material to join the substructure together. However, the time contributions from
secondary bond material cure are not included in these results. Two hours at 60°C was
required for the cure of the Hysol epoxy and this was performed for each bonding
operation. It also requires mention that for the T-stiffener and I-beam geometries,
secondary bonding was completed in two steps. This methodology was necessary to
attain proper alignment between components. For example, I-beam webs were mated,

96
aligned, and cured in the first step. Next, flange caps were bonded and cured to complete
the substructure geometry. Thus, these geometries had significantly greater fabrication
times due to the time required to secondary bond components and to cure the adhesive
material. RTM eliminates the need for these secondary bonding steps in many cases and
would not suffer from the potential for misalignment and the four hours of cure time
required for adhesive bonding.
Computed Tomography (CT) Porosity Scans
Current methods for finding porosity include taking microscopic images of a
composite and its pores or burning off the matrix and trying to determine porosity
according to weight differences [52]. In the first process, a laminate is polished and
prepared for the microscope. A micrograph approximately 1 x 1 mm is then captured and
analyzed using digital image analysis techniques. To determine a representative fiber
volume for the entire composite, many such images are gathered, the porosity contents
are found, and then the image data are averaged. This process is tedious and is subject to
error if insufficient data are collected.
The second method for measuring porosity content involves using the matrix
burn-off method. The process begins with the measurement of the mass and volume of a
laminate of known density and fiber volume. The specimen is then introduced into an
oven where the matrix material is removed. Next, knowing the density of the
reinforcement and matrix materials, the discrepancy between weights can be accounted
for by pores in the laminate. Finally, the number of pores is calculated and a percent
porosity by laminate volume can be found. This process is not as labor intensive as the
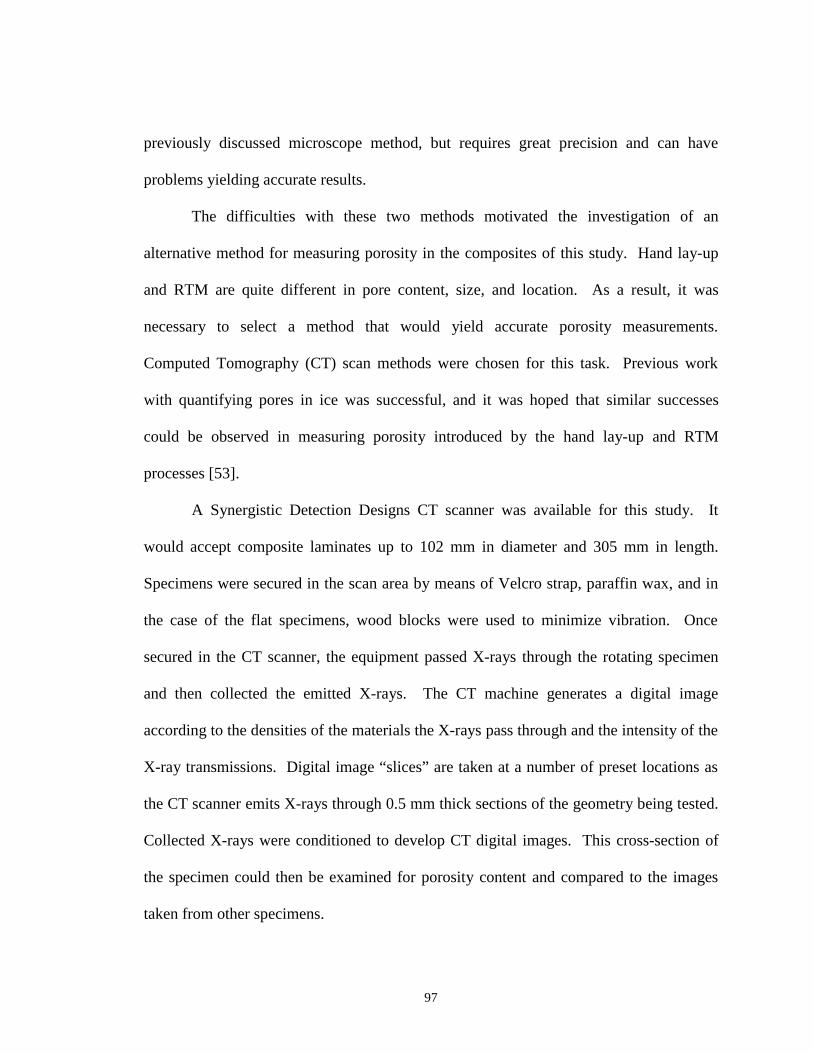
97
previously discussed microscope method, but requires great precision and can have
problems yielding accurate results.
The difficulties with these two methods motivated the investigation of an
alternative method for measuring porosity in the composites of this study. Hand lay-up
and RTM are quite different in pore content, size, and location. As a result, it was
necessary to select a method that would yield accurate porosity measurements.
Computed Tomography (CT) scan methods were chosen for this task. Previous work
with quantifying pores in ice was successful, and it was hoped that similar successes
could be observed in measuring porosity introduced by the hand lay-up and RTM
processes [53].
A Synergistic Detection Designs CT scanner was available for this study. It
would accept composite laminates up to 102 mm in diameter and 305 mm in length.
Specimens were secured in the scan area by means of Velcro strap, paraffin wax, and in
the case of the flat specimens, wood blocks were used to minimize vibration. Once
secured in the CT scanner, the equipment passed X-rays through the rotating specimen
and then collected the emitted X-rays. The CT machine generates a digital image
according to the densities of the materials the X-rays pass through and the intensity of the
X-ray transmissions. Digital image “slices” are taken at a number of preset locations as
the CT scanner emits X-rays through 0.5 mm thick sections of the geometry being tested.
Collected X-rays were conditioned to develop CT digital images. This cross-section of
the specimen could then be examined for porosity content and compared to the images
taken from other specimens.

98
Five specimen types were selected in an attempt to determine porosity for a range
of pore contents. Samples were taken from a hand lay-up plate, an RTM plate taken from
near the outlet vent, an RTM plate taken near the inlet port, an RTM thin flanged T-
stiffener, and an RTM I-beam. In the first attempts to present the validity of CT methods
in determining composite porosity, it was found another method would be required to
calibrate the procedure. CT image comparisons seemed to be a satisfactory method for
differentiating between the pore contents of various specimens. However, porosity levels
could be easily manipulated according to the steps taken during reduction of the digital
image. As a result, the microscope method was employed as a calibration tool and
microscope images were gathered for the hand lay-up and RTM plate specimens. The
hand lay-up and RTM-vent specimens had significant levels of porosity observable with
the unaided eye and were suspected to provide a good starting point for measuring
porosity. The RTM specimen taken from near the laminate’s injection port had minimal
observable porosity and was used to gauge the accurateness of the predictive CT
technique.
Micrographs of the hand lay-up and RTM plates are shown in Figures 45 - 47. In
these figures the D155 and DB120 tows, the resin matrix, the individual fiber strands, and
the pores are clearly illustrated. A minimum of five images like Figures 45 - 47 were
captured and examined for each specimen. From these images, average pore diameter
and average porosity were recorded. The pore diameter and porosity findings for the

99
Figure 45. Microscopic view of porous hand lay-up specimen.
Figure 46. Microscopic view of an RTM specimen near resin vent.
Air Pore
D155 Fiber Tow
Matrixporosity
Micro-pore betweenglass fibers
0.25 mm
0.25 mm
Air Pore
D155 Tow
MatrixporosityMicro-pore
DB120 Tow

100
hand lay-up and RTM-vent specimens are presented in Table 18. Demonstrated in this
table is the average pore diameter of 0.092 mm for hand lay-up and 0.064 for RTM near a
vent. Sample porosities also revealed that hand lay-up averaged 2.4% porosity while
RTM was approximately 3.3% near its outlet vent. This larger value for RTM was not
alarming, since the majority of the RTM plate that the sample was taken from had
significantly less observable porosity.
Micrograph analysis also included specimens taken from an RTM plate near its
injection port and a VARTM flat plate used in mechanical testing. The RTM-inlet
porosity results were used to evaluate the predictive capabilities of the CT porosity
measurement approach. The VARTM specimens were included in the microscopic study
Figure 47. Microscopic view of an RTM specimen near injection port.
0.25 mm
D155 TowMicro-pore
DB120 Tow
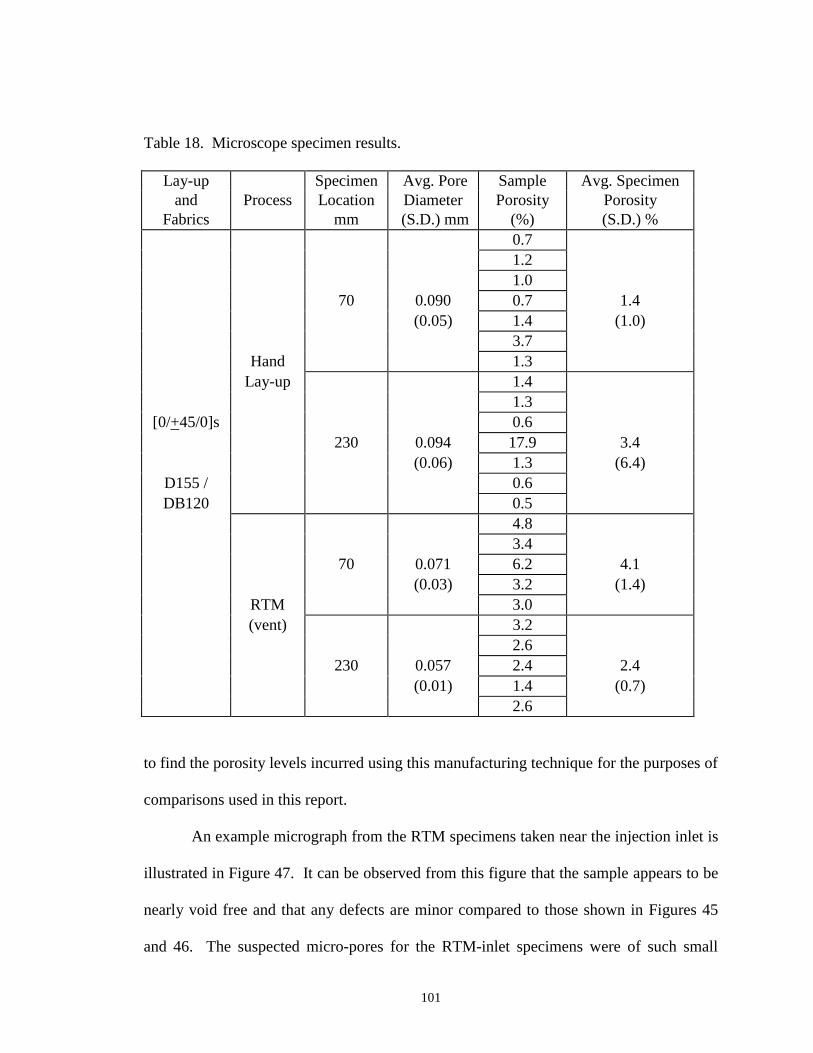
101
Table 18. Microscope specimen results.
Lay-up Specimen Avg. Pore Sample Avg. Specimenand Process Location Diameter Porosity Porosity
Fabrics mm (S.D.) mm (%) (S.D.) %0.71.21.0
70 0.090 0.7 1.4(0.05) 1.4 (1.0)
3.7Hand 1.3
Lay-up 1.41.3
[0/+45/0]s 0.6230 0.094 17.9 3.4
(0.06) 1.3 (6.4)D155 / 0.6DB120 0.5
4.83.4
70 0.071 6.2 4.1(0.03) 3.2 (1.4)
RTM 3.0(vent) 3.2
2.6230 0.057 2.4 2.4
(0.01) 1.4 (0.7)2.6
to find the porosity levels incurred using this manufacturing technique for the purposes of
comparisons used in this report.
An example micrograph from the RTM specimens taken near the injection inlet is
illustrated in Figure 47. It can be observed from this figure that the sample appears to be
nearly void free and that any defects are minor compared to those shown in Figures 45
and 46. The suspected micro-pores for the RTM-inlet specimens were of such small

102
diameter ( < 0.01 mm) that it was not possible to measure or report them accurately.
Digital image analysis showed that the average percent porosity for the RTM-inlet
microscopic samples was 0.5%. Micrographs of the VARTM specimens were not
significantly different than Figure 47. VARTM samples contained only small amounts of
porosity, and after digital image analysis, it was found the VARTM specimens used in
mechanical testing averaged less than 0.5% porosity.
Once porosity had been calibrated for the hand lay-up and RTM-vent digital
images, the CT scan comparisons could begin. Examples of the digital images generated
by the CT method are illustrated in Figures 48 and 49 for thin flanged T-stiffener and I-
beam geometries. From these figures, the dark colored glass bundles, the gray matrix
material, and the air surrounding the specimen can be observed. A similar CT scan for a
hand lay-up flat plate where wood blocks have been included to provide support and
stability to the specimen is shown in Figure 50. From inspection, it is difficult to
determine the porosity content of these cross-sectional images. Thus, digital image
analysis techniques were required that would determine what regions of the specimens,
on a micro-level, were porous.
An inherent property in CT scanning was the uneveness in intensity of the
resultant image. This effect is illustrated in Figure 51 a). The intensity of the image
varies according to the amount of material the X-rays must pass through in a single shot.
Examining Figure 51 a) demonstrates that either the wood blocks or the width of the flat
specimen adversely effected the scan results such that the image appears to be darker
towards its center when compared to the lighter ends of the specimen. This nonuniform

103
Figure 48. Computed Tomography scan of an RTM T-stiffener.
Black: Glass bundlesρ = 2.56 g/cm3
Grey: Resin Matrixρ = 1.14 g/cm3
White: Air / Poresρ = 0.0013 g/cm3
20 mm
20 mm

104
Figure 49. Computed Tomography scan of an RTM I-beam specimen.
Figure 50. Computed Tomography scan of a flat plate hand lay-up specimen.
Figure 51. Sequence of digital images between CT scan and porosity measurement.
Wood support
Composite specimen
20 mm
a) Original CT scan
b) Radially padded CT image
c) Standard deviation threshold image
Difference in image intensity between glass fibers
Improved uniformity of image intensity
Laminate porosity
25 mm

105
intensity of the image presents a problem because adjusting the image threshold to
measure porosity implies that the center of the sample was the most porous. Visual
inspection of the actual sample showed that this was not so, and that at the current state
the image would not yield an accurate representation of porosity. Consequently, Edens
suggested using a radial padding technique [54]. This procedure adjusts the intensity of
the image in a radial pattern and attempts to improve its uniformity. An example of the
results observed with the radial padding technique is shown in Figure 51 b). It can be
noted from this figure that the image is more uniform in intensity and is more applicable
to standard deviation thresholding. The standard deviation threshold was an arbitrary
value that determined which portions of the image were of low enough density to be
considered porosity. This value was calibrated with the results from the hand lay-up and
RTM-vent microscope specimens previously examined. A graphical demonstration of
the standard deviation threshold technique is presented in Figure 51 c).
A summary of the results for the CT scan investigation can be found in Table 19.
The locations where scans were taken, measured porosity, and pore primary location are
shown in this table. The average result of porosity for all specimens scanned was
approximately 3% porosity. As noted in Table 19, the porosity measurements between
samples did not differ by more than +1% for any of the samples studied. Since this
observation contradicted the micrograph results for the RTM-inlet specimens, further
development of the current CT method is necessary.
Improvements in the CT scanning procedure appear to be required. First,
previous studies compared materials of only two phases (ice and air), while the current

106
Table 19. CT scan specimen data.
Geometry Process Scan Location Suspected Locations(mm) Porosity (%) of lowest density
20 260 3100 3
Flat Plate Hand Lay-up 140 3 Midregion of plate180 2220 3260 330 370 3
Flat Plate RTM-vent 110 3 Midregion of plate150 3190 3230 330 370 3
Flat Plate RTM-inlet 110 3 Midregion of plate150 3190 3230 230 3
T-stiffener RTM 90 3 Midregions150 3 of web and flange210 370 3
I-beam RTM 150 3 Midregion of web230 3
work attempts to extend CT measurement techniques to materials of three components
(glass, matrix, and air). Secondly, the nature of X-ray emission measurement could have
hindered the results. As illustrated earlier, CT images tend to vary in intensity according
to location and the amount of material that the X-rays must pass through. It could be
possible the radial padding does not alleviate the problem completely.

107
A possible remedy for the concerns with the current CT images would be to
utilize smaller specimen sizes and greater scanning resolutions. The specimens of this
study were scanned with a resolution of 110 – 120 microns, which was the limit for
samples 102 mm in diameter. Higher resolutions for smaller diameter samples might
capture the relatively small pores in composite laminates and resolve the current issues
with using CT technology for measuring porosity in composites.
Computed Tomography techniques may have other useful applications in
composite analysis, as well. The image quality at 110 – 120 microns, while difficult to
ascertain porosity from, might be better suited for measuring other properties such as
fiber content and delamination damage. CT methods could prove quite beneficial in its
ability to determine these properties in a non-destructive manner. Future work could
explore these two options extending the usage of CT equipment.
RTM Tooling and Gasket Comparisons
For future research with RTM, it is important to review the advantages and
disadvantages of the many molds used in this study. The tools used to evaluate RTM
against hand lay-up were of a variety of materials, different seal compositions, and
various types of closing devices. The different components of each mold had its own
strengths and weaknesses and these are summarized in Table 20. Each criterion for the
RTM tools is rated between 1 and 5 in this table; 5 denotes a good performance in this
study, while 1 suggests a poor property for RTM moldings. The criteria under review
found in Table 20 are defined as follows:
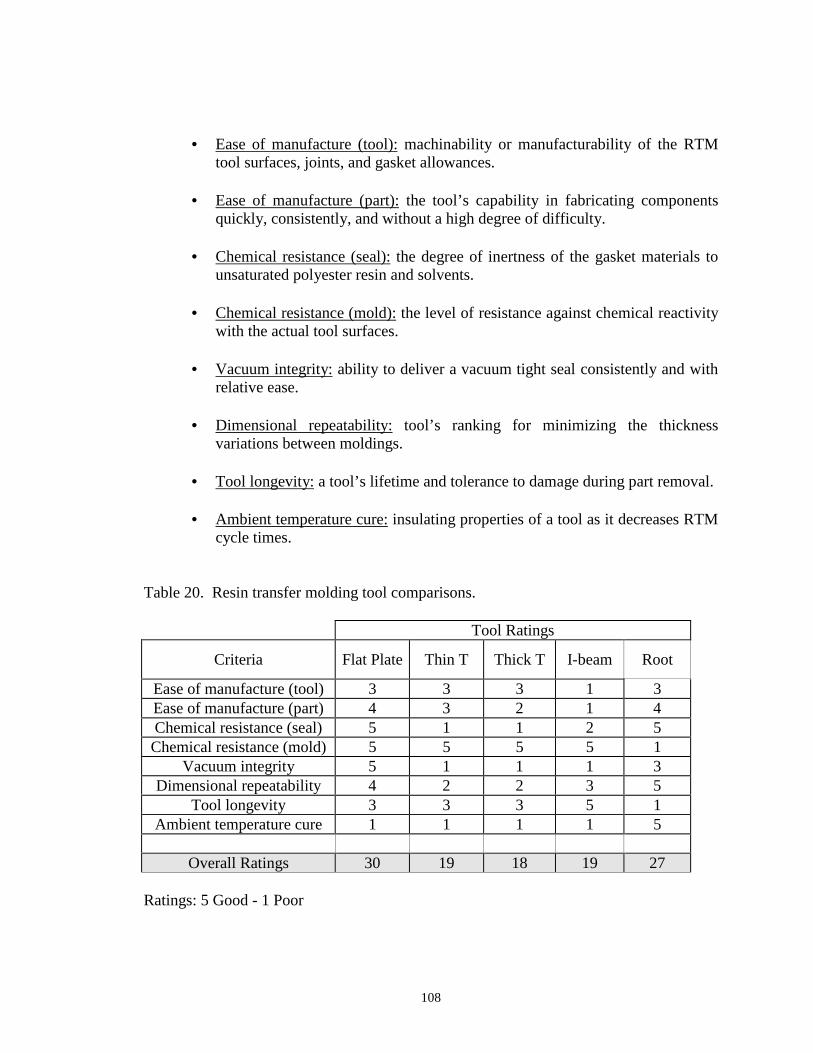
108
• Ease of manufacture (tool): machinability or manufacturability of the RTMtool surfaces, joints, and gasket allowances.
• Ease of manufacture (part): the tool’s capability in fabricating componentsquickly, consistently, and without a high degree of difficulty.
• Chemical resistance (seal): the degree of inertness of the gasket materials tounsaturated polyester resin and solvents.
• Chemical resistance (mold): the level of resistance against chemical reactivitywith the actual tool surfaces.
• Vacuum integrity: ability to deliver a vacuum tight seal consistently and withrelative ease.
• Dimensional repeatability: tool’s ranking for minimizing the thicknessvariations between moldings.
• Tool longevity: a tool’s lifetime and tolerance to damage during part removal.
• Ambient temperature cure: insulating properties of a tool as it decreases RTMcycle times.
Table 20. Resin transfer molding tool comparisons.
Tool Ratings
Criteria Flat Plate Thin T Thick T I-beam Root
Ease of manufacture (tool) 3 3 3 1 3Ease of manufacture (part) 4 3 2 1 4Chemical resistance (seal) 5 1 1 2 5Chemical resistance (mold) 5 5 5 5 1
Vacuum integrity 5 1 1 1 3Dimensional repeatability 4 2 2 3 5
Tool longevity 3 3 3 5 1Ambient temperature cure 1 1 1 1 5
Overall Ratings 30 19 18 19 27
Ratings: 5 Good - 1 Poor

109
Compiling the individual criteria of Table 20 demonstrates that the flat plate and
root specimen tools had unique advantages over the other RTM tools of this study. The
primary benefits of these two tools were vacuum integrity, chemical resistance, and ease
of manufacturing. Consequently, in future RTM molds in would be worthwhile to use
the materials and devices that enhanced these properties. Namely, it would be
advantageous in future RTM tool designs to use toggle type clamps, multiple seals,
matched surface seals, and chemical resistant gaskets to improve cycle time and part
quality.
Cost is another criterion of RTM tools that has yet to be discussed. The cost
criteria were not included in Table 20 due to the fact that, when normalized for part
complexity, the capital investment for aluminum, steel, and composite tools was not
significantly different between the five tool geometries. This similarity in cost was
primarily due to the size and simplicity of the components being fabricated. However, in
utility-grade turbine blade manufacturing applications tool choices would be notably
different. For example, if large, contoured composite blade skins were to be
manufactured from steel or aluminum tools, a computer numerically controlled (CNC)
mill would be required to machine out the tool cavities for both closed mold halves. This
would be an expensive process that would require a large amount of milling time. A
more reasonable alternative might be to manufacture steel reinforced composite tools.
This has been the design path of the MSU composite turbine blade project for a variety of
reasons. First, the process of tool fabrication is significantly less expensive and time
intensive when compared to machining operations on a turbine blade scale. Secondly,

110
the tool material will have the same coefficient of thermal expansion that the part has and
as a result better dimensional tolerances may be achieved. Lastly, the insulating
properties of fiberglass could result in quicker cycle times. Drawbacks to using steel
reinforced fiberglass tooling were recognized during the course of this study, however.
The tooling material is not as damage tolerant or chemically resistant as metal molds. In
spite of these two disadvantages, fiberglass tooling is still recommended for large RTM
fabrications, where varying cross section and part complexity do not lend towards other
composites manufacturing processes.
Flat Plate Mechanical Testing
The flat plate mechanical experiments provided the basic yet essential information
on the structural performance of hand lay-up and fiberglass composites. Transverse
tension, compression, three-point bending, tension, and fatigue tests were chosen because
they define many of the primary structural properties of composites. If manufacturing
practices influence these properties, then it would be useful to document the differences
for the parameters studied in this research.
Transverse Tension
Transverse tension tests are relatively sensitive to matrix strength, when
compared to other composite mechanical tests. Consequently, this test was chosen to
determine the effects that process, fabric and lay-up have on matrix-dominated strength
properties. The data collected for transverse tensile tests in this study included the stress
versus strain history and the ultimate strength values. A graphical representation of the

111
stress versus strain behavior for the transverse tensile experiments is illustrated in Figure
52. From similar curves for each specimen tested, elastic modulus, initial damage,
ultimate strength, and failure strain were documented. The stress vs. strain curve of
Figure 52 correlated well with other observations made in the laboratory. The initial
damage was readily audible as the 90° plies began cracking. At approximately 2% strain,
the 90° layers ceased to produce audible cracks and the 45° plies began to delaminate
[55]. While this delamination was not audible, the unaided eye could observe the 45°
layer damage in the composite. For transverse tensile tests, it was also observed that the
ultimate strength coincided with the failure strain. The ultimate failure occurred as the
45° plies completely delaminated within the gage length. The delaminated 45° layers and
the surrounding damage zones are shown in Figure 53.
The final results for all the transverse tensile data collected are shown in Table 21.
The results are for the lay-up, fabric, and process variations that were developed under
the Testing Matrix section of the Experimental Methods chapter. These lay-up
configurations, fabric architectures, and processing techniques of Table 21 were the
primary variables for the flat plate mechanical tests to be discussed. For the results of
this table, average values and standard deviations are summarized according to
manufacturing parameters. Each result type was reviewed separately to determine the
influence lay-up schedule, fabric architecture, and manufacturing process had on the
transverse tensile properties of flat composite specimens.
The average ultimate transverse tensile strengths and the maximum and minimum
values recorded for the transverse experiments are shown in Figure 54. No definitive

112
Figure 52. Transverse tensile test example data.
Figure 53. Transverse tension test specimens.
0
10
20
30
40
50
60
70
80
0 0.5 1 1.5 2 2.5 3 3.5 4 4.5
Strain (%)
Tra
nsve
rse
Ten
sile
Str
ess
(MP
a)
90 deg. plies begin cracking(Initial damage)
90 deg. plies at characteristic damage state45 deg. plies begin to delaminate
Final composite failure (Ult. strength and strain)
Elastic modulus
A130 / DB120
D155 / DB120 2.54 cm

Table 21. Transverse Tensile Test Results
UTTS TT Strain to Strain to DataLay-up Fabrics Process (S.D.) Modulus 1st Fracture Failure Points
MPa (S.D.) GPa (S.D.) % (S.D.) %HL 67.4 (6.6) 9.38 (0.63) 0.27 (0.01) 2.7 (0.5) 13
D155 / RTM - R 74.6 (2.3) 9.69 (0.60) 0.30 (0.02) 2.7 (0.2) 16[0/+45/0]s DB120 RTM - S 74.2 (1.7) 9.01 (0.37) 0.29 (0.01) 3.3 (0.5) 5
VARTM 77.0 (6.8) 10.04 (0.77) 0.33 (0.03) 3.4 (0.4) 14A130 / HL 65.7 (1.4) 9.51 (0.17) 0.30 (0.02) NA 4DB120 VARTM 85.5 (4.5) 9.74 (0.46) 0.33 (0.03) NA 6
D155 / HL 50.0 (6.0) 9.32 (0.64) 0.21 (0.02) NA[0/0/+45/0]s DB120 VARTM 74.5 (2.2) 13.98 (0.72) 0.21 (0.02) NA 6
A130 / HL 59.5 (9.3) 9.04 (0.25) 0.27 (0.03) NADB120 VARTM 81.6 (2.6) 11.67 (0.35) 0.30 (0.02) NA
UTTS - Ultimate Transverse Tensile StrengthTT - Transverse TensileNA - Not availableNOTE: Sample thicknesses vary between HL and RTM in accordance with Table 14.
11
3

114
trends were observed for transverse tensile strengths according to fabric or lay-up. When
the average values were compared pairwise according to process, the ultimate transverse
tensile strengths were greater with VARTM for all combinations of fabrics and lay-ups.
Spartan and Radius RTM injected plates were also included in the D155/DB120
[0/+45/0]s laminate comparisons. These specimens were included to record any
significant differences between RTM with and without vacuum-assist. Statistical
analyses showed that there were no measurable differences between all three types of
D155/DB120, [0/+45/0]s RTM samples (Table 22). However, when comparing VARTM
and Radius RTM specimens with hand lay-up samples statistical differences were found.
Reductions in ultimate transverse tensile strengths were found for the fabric and lay-up
combinations in Figure 54, as well. The statistical comparisons of these samples are
included in Table 22 and the complete statistical analyses for all mechanical experiments
are found in Appendix D. For the four types of composite specimens tested, average
transverse tensile strengths were reduced for hand lay-up by between 13% and 33% when
compared to VARTM samples.
The effects thickness had on the ultimate transverse tensile strengths were of
concern. For the transverse tensile specimens of this study, it was found that their
strength was primarily determined by the quantity of 45° layers. The 0° layers do not
contribute significantly to transverse strength, and only glass reinforcement at greater
angles will benefit transverse properties [50]. By this reasoning, it could be possible
that the strength provided by the 45° plies would dominate over any matrix defects found
between processes. To investigate this hypothesis, the data from Figure 54 were

115
normalized. This is a fairly frequent procedure performed in composite analyses where
the thicknesses of two laminates of different fiber volumes are assumed identical via rule
of mixtures. Then the results could be compared for specimens of similar cross-sectional
area and structural reinforcement content. In this study, thicknesses were adjusted to
yield fiber volume fractions of 30% for all normalized comparisons.
The normalized results for transverse tensile strength are found in Figure 55.
While this figure does not represent the true transverse strengths of the samples tested, it
does allow for a unique comparison between groups. For example, after normalizing the
transverse strength data, it can be seen that the differences between hand lay-up, RTM,
and VARTM according to transverse strength were reduced for the laminates of this
study. A130/DB120 [0/+45/0]s laminates had a 19% greater average transverse tensile
strength for VARTM versus hand lay-up, while the remaining laminates varied in
strength between processes by less than 5%.
After reviewing the results for normalized transverse strengths, it follows that
matrix differences according to process may have little effect on laminate strength, when
the composite material has 45° plies. Transverse tensile strength results could be notably
different for laminates where less glass reinforcement supports the transverse loads.
Another issue concerning the normalized results, is fiber content selection. For this study
it was necessary to select 30% as it represented the average fiber volume finding of Table
15 for hand lay-up flat plate mechanical testing. However, normalizing practices are
typically utilized for composite samples varying by only as much as 5% in fiber content.
In this study, [0/0/+45/0]s laminates manufactured by VARTM were as high as
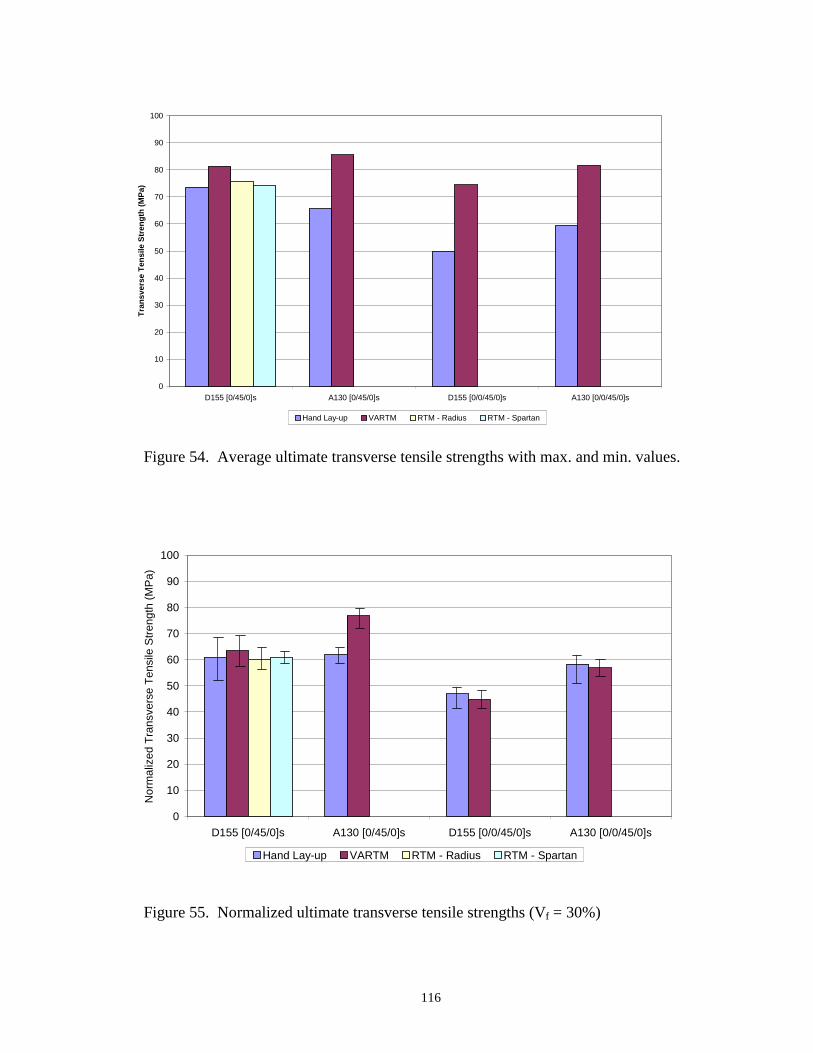
116
Figure 54. Average ultimate transverse tensile strengths with max. and min. values.
Figure 55. Normalized ultimate transverse tensile strengths (Vf = 30%)
0
10
20
30
40
50
60
70
80
90
100
D155 [0/45/0]s A130 [0/45/0]s D155 [0/0/45/0]s A130 [0/0/45/0]s
Nor
mal
ized
Tra
nsve
rse
Ten
sile
Str
engt
h (M
Pa)
Hand Lay-up VARTM RTM - Radius RTM - Spartan
0
10
20
30
40
50
60
70
80
90
100
D155 [0/45/0]s A130 [0/45/0]s D155 [0/0/45/0]s A130 [0/0/45/0]s
Tra
nsve
rse
Ten
sile
Str
engt
h (M
Pa)
Hand Lay-up VARTM RTM - Radius RTM - Spartan

Table 22. Transverse tension results statistical differences.Laminate Zero Normality Equal Statistical Statistical
Mechanical Lay-up Degree Processes Variance Comparison Method DifferenceProperty Fabric (P value) (P value) (P value)
HL / V pass (0.353) fail (0.0003) ANOVA on Ranks (<0.05) YesHL / RR pass (0.353) fail (0.0003) ANOVA on Ranks (<0.05) Yes
Ultimate D155 HL / RS pass (0.353) fail (0.0003) ANOVA on Ranks (<0.05) NoTransverse [0/+45/0]s V / RR pass (0.715) fail (0.0009) t-test (0.467) No
Tensile V / RS pass (0.353) fail (0.0003) ANOVA on Ranks (<0.05) NoStrength RR / RS pass (0.186) pass (0.830) t-test (0.698) No
A130 HL / V pass (0.126) pass (0.163) t-test (<0.0001) Yes[0/0/+45/0]s D155 HL / V pass (0.329) pass (0.252) t-test (<0.0001) Yes
A130 HL / V pass (0.287) pass (0.480) t-test (0.0002) YesHL / V
HL / RRNormalized D155 HL / RS pass (0.881) fail (0.0036) ANOVA on Ranks (0.164) NoTransverse [0/+45/0]s V / RR
Tensile V / RSStrength RR / RS
A130 HL / V pass (0.594) pass (0.721) t-test (<0.0001) Yes[0/0/+45/0]s D155 HL / V pass (0.255) pass (0.365) t-test (0.158) No
A130 HL / V pass (0.235) pass (0.454) t-test (0.401) NoHL / V pass (0.551) pass (0.451) 1-Way ANOVA (0.105) Yes
HL / RR pass (0.559) pass (0.332) t-test (0.185) NoD155 HL / RS pass (0.726) pass (0.270) t-test (0.242) No
Transverse [0/+45/0]s V / RR pass (0.551) pass (0.451) 1-Way ANOVA (0.105) NoTensile V / RS pass (0.551) pass (0.451) 1-Way ANOVA (0.105) Yes
Modulus RR / RS pass (0.551) pass (0.451) 1-Way ANOVA (0.105) NoA130 HL / V pass (0.106) pass (0.293) t-test (0.363) No
[0/0/+45/0]s D155 HL / V pass (0.294) pass (0.543) t-test (<0.0001) YesA130 HL / V pass (0.058) pass (0.302) t-test (<0.0001) Yes
HL-Hand Lay-up V-VARTMRR-Radius RTM RS-Spartan RTM
11
7

118
41% and 49% in fiber volume and varied from their hand lay-up counter parts by as
much as 7 - 16% in fiber content. To address these concerns, normalized comparisons
could be repeated at a higher fiber volume or another normalizing technique could be
developed.
In Figure 56, the moduli for the transverse tensile specimens were compared.
These averages of Table 21 show that significant differences occur for the thicker,
[0/0/+45/0]s laminates. While there were statistical differences between hand lay-up and
RTM for D155/DB120, [0/+45/0]s specimens, these distinctions were small (P > 0.1).
Comparing average transverse tensile moduli between hand lay-up and VARTM
manufactured samples showed 2 – 6 % differences for the 6 layer laminates and 23 –
34% differences for 8 ply composites. It was also of interest to note that the moduli of
Figure 56 were nearly identical for the [0/+45/0]s laminates and all hand lay-up
specimens. The differences in transverse tensile moduli for the 8 ply laminates were
clearly due to the significant differences in fiber volume contents between the two types
of manufactured specimens.
Initial damage is noted in Figure 52 where the experimental data begins to take on
nonlinear behavior. This was also observed in the laboratory as audible and visual cracks
initiated in the transverse specimens. The average strain to first fracture values for all the
transverse tensile specimens tested are presented in Figure 57. From examining this
figure it can be observed that under all cases RTM and VARTM laminates had initial
fractural strain values of equal or greater value than those found for hand lay-up. Actual
distinctions in average strain to initial damage between hand lay-up and VARTM were
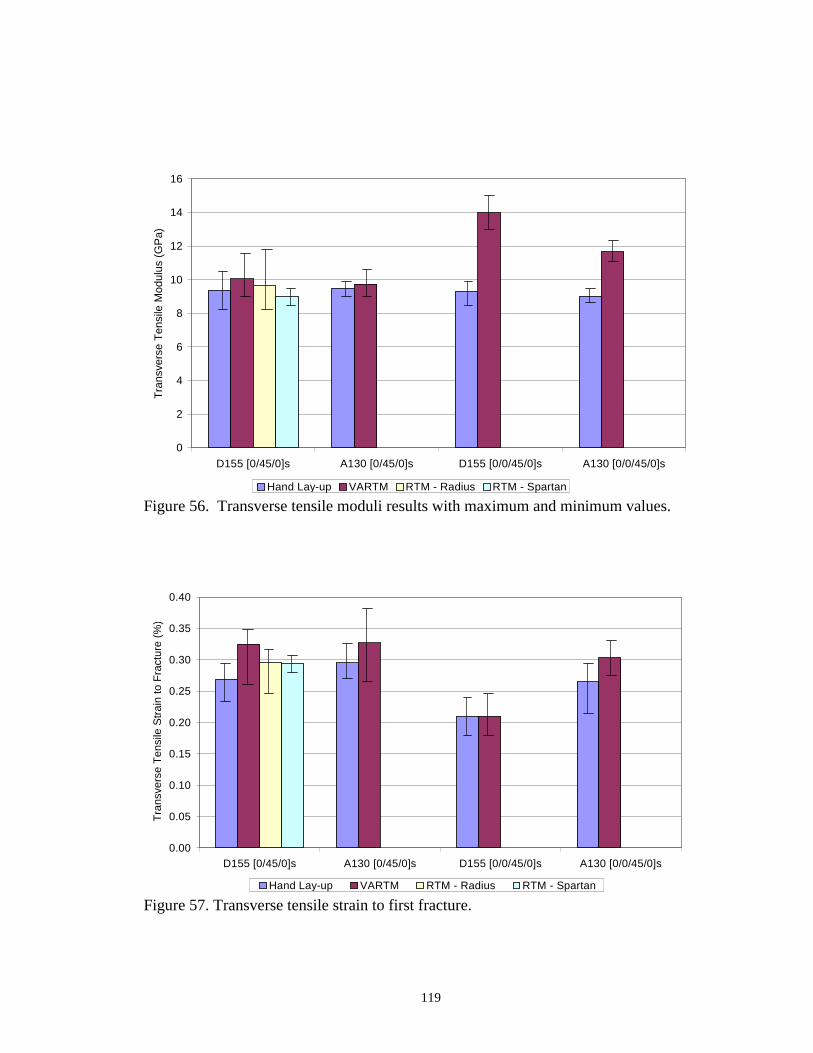
119
Figure 56. Transverse tensile moduli results with maximum and minimum values.
Figure 57. Transverse tensile strain to first fracture.
0
2
4
6
8
10
12
14
16
D155 [0/45/0]s A130 [0/45/0]s D155 [0/0/45/0]s A130 [0/0/45/0]s
Tra
nsve
rse
Ten
sile
Mod
ulus
(G
Pa)
Hand Lay-up VARTM RTM - Radius RTM - Spartan
0.00
0.05
0.10
0.15
0.20
0.25
0.30
0.35
0.40
D155 [0/45/0]s A130 [0/45/0]s D155 [0/0/45/0]s A130 [0/0/45/0]s
Tra
nsve
rse
Ten
sile
Str
ain
to F
ract
ure
(%)
Hand Lay-up VARTM RTM - Radius RTM - Spartan

120
found to be 9 –18% for 6 layer specimens and 0 – 10% for 8 ply samples. Statistical
analyses showed that the only significant differences between VARTM and hand lay-up
were for D155/DB120 [0/+45/0]s and A130/DB120 [0/0/+45/0]s laminates. The initial
fracture is a fairly random occurrence, and may require further investigation for the
transverse specimens [56].
During the first round of transverse testing, damaging the extensometer was a
concern. Loads over 4.4 kN would have enough strain energy stored to potentially
damage the extensometer device at failure. As a result, D155/DB120 [0/+45/0]s
laminates were chosen to determine failure strains, as they consistently failed at loads less
than 4.4 kN. The ultimate failure strains for transverse specimens manufactured by hand
lay-up and RTM are presented in Table 23. The average, maximum, and minimum
values of this table show that a high level of variability was found for this fracture
property, as well. No statistical differences were found between VARTM versus
Spartan-RTM and hand lay-up vs. Radius-RTM. However, no conclusions can be drawn
on what effects process may have on strain to failure due to the variability of this fracture
property.
To conclude the review of transverse tensile performance, the stress and strain
curves of selected fabric and lay-up types were compared. While these curves illustrate
the behavior seen in Figure 52 for the other lay-up and fabric combinations, they did not
present much new information. However, they are available in Appendix A for
completeness.

121
Table 23. Transverse tensile failure strains for D155/DB120 [0/+45/0]s laminates.
Strain at laminate failure (%)Sample No. D155/DB120 [0/+45/0]s
HL RTM - S RTM - R VARTMR31 2.9 3.4 2.3 3.62 2.2 3.9 2.3 2.53 2.5 2.6 2.8 3.34 2.4 3.3 2.8 3.25 2.9 3.3 2.6 3.9
R21 3.6 -- 2.8 3.32 3.2 -- 2.8 3.43 2.1 -- 2.8 3.7
Average 2.7 3.3 2.7 3.4Std. Dev. 0.5 0.5 0.2 0.4
Compression
The compression experiments of hand lay-up and RTM laminates in this study
used short gage lengths to eliminate specimen buckling. As a result, extensometer data
could not be collected because the extensometer device was larger than the specimen test
gage section. Only ultimate compressive strengths were recorded from the Instron digital
equipment. Example specimens of the compression mechanical testing are shown in
Figure 58.
Ultimate compressive strength results are presented in Figure 59. The strong
effects that fabric architecture had on compressive strength are demonstrated in this
figure. For both lay-up schedules, the ultimate strengths of laminates manufactured with
A130 fabric were approximately half of the composites processed with D155 fabric. This
was touched upon earlier in the Manufacturing Materials section of the Experimental
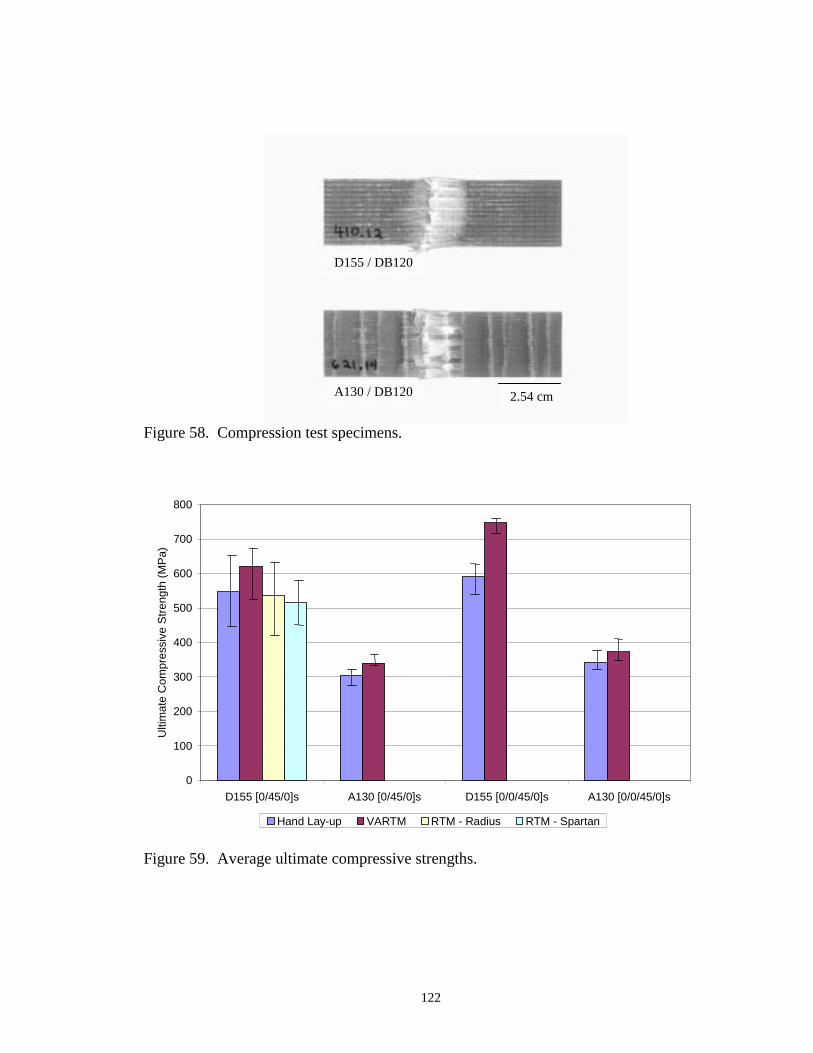
122
Figure 58. Compression test specimens.
Figure 59. Average ultimate compressive strengths.
A130 / DB120
D155 / DB120
2.54 cm
0
100
200
300
400
500
600
700
800
D155 [0/45/0]s A130 [0/45/0]s D155 [0/0/45/0]s A130 [0/0/45/0]s
Ulti
mat
e C
ompr
essi
ve S
tren
gth
(MP
a)
Hand Lay-up VARTM RTM - Radius RTM - Spartan
123
Methods chapter. The A130 fabric has a weave type architecture and the glass fibers are
not as straight as in the D155 reinforcement. This weave architecture does not resist the
bundle buckling condition as well and results in the significant differences in
compressive strength, as seen in Figure 59. An additional contributor to the lower results
for A130 laminates was the fabric’s weight. This fabric was measurably lower in weight
when compared to the D155 reinforcement and consequently has a lesser amount of
unidirectional glass material. This reduction in unidirectional structural reinforcement
also contributes to the differences in compressive strength observed in Figure 59.
The average values of ultimate compressive strength for VARTM laminates
proved greater than those of hand lay-up composites for all fabrics and lay-ups explored.
Differences in average ultimate compressive strength varied between 8 and 21% for the
specimens of this study. Statistical differences were found between VARTM and hand
lay-up laminate strengths for all cases except those of the A130/DB120 [0/0/+45/0]s
laminate configurations. It should be mentioned that, when statistical comparisons were
made between the standard (not vacuum assisted) RTM injected specimens and the hand
lay-up samples, no significant differences were found in average compressive strength.
The results of Figure 59 were also normalized and these findings are shown in
Figure 60. The average value differences and the statistical comparisons of Appendix D
show that the practical differences between [0/+45/0]s laminates manufactured by hand
lay-up and RTM were small. Compressive strengths for these specimens differed by 5%
or less between the two processes. The [0/0/+45/0]s laminates were also reviewed and it
was found that normalizing techniques did not apply well to these specimens. The

124
Figure 60. Normalized average ultimate compressive strengths (Vf = 30 %).
[0/0/+45/0]s laminates had differences in fiber volume as high as 16% and were
normalized to the average hand lay-up fiber content. In following these steps, the
normalized compressive strengths for VARTM samples were lower when compared to
the hand lay-up specimens. This behavior might be explained by the effects thickness
had on resisting buckling or that the normalizing technique does not work well beyond its
typical 5% fiber content range.
Three-Point Bending
In the three-point bending test an extensometer cannot be used. However, the
Lebow load cell used in series with the Instron equipment did allow the collection of load
versus crosshead displacement data. Example bending test results for [0/+45/0]s and
0
100
200
300
400
500
600
D155 [0/45/0]s A130 [0/45/0]s D155 [0/0/45/0]s A130 [0/0/45/0]s
Ulti
mat
e C
ompr
essi
ve S
tren
gth
(MP
a)
Hand Lay-up VARTM RTM - Radius RTM - Spartan

125
[0/0/+45/0]s laminates are found in Figures 61 and 62, respectively. The reduced
bending strengths of A130 composites, due to the reinforcement’s poor resistance to
compression, is illustrated in these figures. The difference in ultimate bending load and
test deflection for [0/+45/0]s laminates of varying fabric types is shown in Figure 61. It
was seen earlier for the compression specimens that ultimate compressive strengths
would be reduced by half in cases where A130 fabrics were used for unidirectional
reinforcement instead of D155 fabrics. Examination of Figure 61 reveals that this
correlates to a 25% reduction in ultimate bending load and a 24% decrease in ultimate
specimen deflection for VARTM laminates where the only difference is the use of D155
or A130 fabrics. Greater differences in ultimate bending load and deflection were found
for the higher percentage 0° fabric, [0/0/+45/0]s composites of Figure 62. The reduction
in ultimate three-point bending load for these VARTM’d specimens was 38%, while the
difference in failure deflection was 40% between samples manufactured with D155 and
A130 fabrics.
The load versus deflection data from the three-point bending tests were useful in
distinguishing samples of different fabrics. The bend test data were also used to
determine the effects that processing might have in this set of experiments. It was
observed that the choice of reinforcement materials had a stronger effect on strength than
the choice between the hand lay-up and RTM processes. Bend test samples of
A130/DB120 and D155/DB120 fabrics are illustrated in Figures 63 and 64. It can clearly
be seen in these figures that the failures of the compression and tension surfaces were
quite different depending on which fabric was used. Shown in Figure 63 are the

126
Figure 61. Example data from three-point bend testing of [0/+45/0]s laminates.
Figure 62. Example data from three-point bend testing of [0/0/+45/0]s laminates.
0
100
200
300
400
500
600
700
800
900
1000
0 0.5 1 1.5 2 2.5 3 3.5 4 4.5 5
Deflection (cm)
Thr
ee P
oint
Ben
ding
Loa
d (N
)
D155 / VARTM / [0/45/0]s A130 / VARTM / [0/45/0]s
Ultimate Failure
Delamination of Compression Surface
Delamination of Tension Surface
0
200
400
600
800
1000
1200
1400
1600
1800
0 0.5 1 1.5 2 2.5 3 3.5 4 4.5
Deflection (cm)
Thr
ee P
oint
Ben
ding
Loa
d (N
)
D155 / VARTM / [0/0/45/0]s A130 / VARTM / [0/0/45/0]s
Ultimate FailureDelamination of
Compression Surface
Delamination of Tension Surface

127
Figure 63. Bending test specimens – compression surface.
Figure 64. Bending test specimens – tension surface.
A130 / DB120
D155 / DB120 2.54 cm
D155 / DB120
A130 / DB120 2.54 cm
A130 / DB120
D155 / DB120 2.54 cm

128
compression surfaces of the bend specimens. Comparing the A130 specimen to the D155
sample demonstrates the notably large delamination zone for bending test laminates of
A130 fabric. The D155 sample of Figure 63 has a fiber reinforcement that is not of a
weave-type architecture and consequently sustains a higher bending load, while also
producing greater delamination resistance. The tension surfaces of the three-point
bending samples are shown in Figure 64. It can be noted from this figure that no
delamination was observed on the tension surface of the A130 specimens. This correlates
to the early failure of the compression side of these samples. Since the A130 laminates
fail at relatively low loads due to the buckling of the compression surface, the tension
side will not see the greater loads required for failure. Composites of A130
reinforcement are notably stronger in tension than compression, and this behavior
explains the mechanical failures of the these laminates observed during the bending tests.
The D155 laminates do not suffer from a reduced compressive strength and as a result,
they experience significantly greater ultimate bending strengths and tension surface
delaminations, as illustrated in Figure 64.
The thickness, stiffness, maximum stress, and flexural modulus data from the
three-point bending tests are shown in Table 24. Thickness was included in this table due
to its significant role in the mechanical strengths of the bending specimens. The
thickness of the laminates had strong effects on moments of inertia and consequently, the
stiffness, maximum strength, and flexural modulus of the composites subject to three-
point bending loads. The specimen stiffness data were included in Table 24 due to the
limited amount of stress data that was feasible to collect. The only stress that was

Table 24. Three-point bending test comparisons.
Average Average Average Flexural DataLay-up Fabrics Process Thickness Stiffness Max. Stress Modulus Points
(S.D.) mm (S.D.) N/cm (S.D.) MPa (S.D.) GPaHL 3.32 (0.21) 484 (47) 675 (22) 25.1 (1.0)
D155 / RTM - R 3.07 (0.08) 425 (16) 698 (18) 27.7 (1.3) 10[0/+45/0]s DB120 RTM - S 3.20 (0.16) 458 (72) 686 (43) 27.1 (1.0)
VARTM 3.15 (0.17) 443 (48) 694 (25) 27.0 (2.7)A130 / HL 3.44 (0.11) 461 (31) 486 (36) 20.7 (1.3) 5DB120 VARTM 3.13 (0.07) 393 (15) 475 (54) 25.0 (2.7)
D155 / HL 4.68 (0.16) 1512 (81) 797 (35) 20.8 (1.5)[0/0/+45/0]s DB120 VARTM 3.24 (0.04) 722 (25) 1042 (33) 40.0 (0.9) 5
A130 / HL 4.07 (0.15) 1001 (125) 615 (28) 27.2 (1.6)DB120 VARTM 3.28 (0.05) 683 (29) 629 (17) 36.1 (1.4)
12
9
130
approximated for the bending test specimens was the average ultimate strength. This was
accomplished with the standard equation used for small displacement tests (σmax = Mc/I).
However, this equation has limited validity as the bending specimen reaches large non-
linear behavior at failure. As a result, the maximum stress equation was employed as a
comparative technique between fabrics, lay-ups, and processes, and was not intended to
be used in finding the actual maximum strength of the three-point bending specimens.
Approximations in maximum bending strength allowed for the comparisons
shown in Figure 65. In this figure the average, maximum, and minimum values of
bending strength are presented for the variety of fabrics, lay-ups, and processes
examined. The average strength values for the D155 laminates were found to be 32%
higher for the [0/+45/0]s lay-ups and 40% higher for the [0/0/+45/0]s schedules when
compared to A130 laminates. Differences between the hand lay-up and VARTM
processes were less than 3% or less for 6 ply laminates and 2 – 24% for composites of 8
layers. When evaluating bending test specimens statistically, differences between the
hand lay-up and VARTM processes were found only for the D155/DB120 [0/0/+45/0]s
composites. All other samples showed no significant differences between average
strengths for specimens of varying manufacturing techniques.
The bending stiffness properties of the hand lay-up and RTM specimens tested in
this study are illustrated in Figure 66. It was found that thickness had a strong influence
on this mechanical property. Statistical analyses showed no significant difference
between D155/DB120 [0/+45/0]s laminates manufactured by hand lay-up and RTM. The
remaining sets of samples were compared, and hand lay-up specimens proved to be stiffer

131
Figure 65. Calculated maximum bending stress comparisons.
Figure 66. Average three-point bending stiffness.
0
200
400
600
800
1000
1200
D155 [0/45/0]s A130 [0/45/0]s D155 [0/0/45/0]s A130 [0/0/45/0]s
Cal
cula
ted
Max
imum
Ben
ding
Str
ess
(MP
a)
Hand Lay-up VARTM RTM - R RTM - S
0
200
400
600
800
1000
1200
1400
1600
D155 [0/45/0]s A130 [0/45/0]s D155 [0/0/45/0]s A130 [0/0/45/0]s
Ave
rage
Ben
ding
Stif
fnes
s (N
/cm
)
Hand Lay-up VARTM RTM - R RTM - S

132
than their VARTM counterparts. It was observed that this was not due to improved
interaction of the matrix and reinforcement with hand lay-up processing. Rather, the
specimens were considerably thicker and consequently, stiffer. For example, the
[0/0/+45/0]s bending specimens manufactured by hand lay-up versus VARTM were
thicker by 0.8 - 1.5 mm, and this resulted in differences in bending specimen stiffness by
up to 52% for the D155 composites and up to 32% for the A130 laminates. These
improvements in bending stiffness for hand lay-up samples over VARTM specimens
were clearly due to increases in the moment of inertia of the test cross-section as opposed
to improvements in the actual material subjected to testing.
Flexural modulus was another property provided by the three-point bending test.
The average values for the flexural modulus results of this study are shown in Figure 67.
The averages in bending modulus were found to be significantly greater for all VARTM
manufactured laminates when compared to hand lay-up. Differences in average flexural
modulus were between 7 – 17% for the [0/+45/0]s laminates and 10 – 48% for the
[0/0/+45/0]s composites. The significant differences in flexural modulus between
samples manufactured by VARTM versus hand lay-up are primarily due to the
improvements in fiber volume content made possible by the RTM process. RTM was
noted to maintain nearly identical specimen thicknesses throughout this study. It was
noted earlier under the Physical Property Comparisons that for all the laminate types used
in this study, hand lay-up yielded specimens that were significantly thicker than the
samples manufactured by VARTM. These measurable differences in thickness and fiber
content contribute to the differences in flexural modulus, shown in Figure 67. It can also

133
be observed that as the difference in fiber content increases, so does the difference in
flexural modulus between hand lay-up and VARTM manufactured specimens.
Longitudinal Tension
Longitudinal tensile specimen data were collected with an extensometer until
slightly past initial damage. The high loads in these tests were sufficient to damage the
extensometer as energy was released at failure. To avoid this hazard, the Instron digital
instrumentation was used to record ultimate failure strengths instead. An example of the
data gathered with the use of the extensometer can be found in Figure 68. The points of
0
5
10
15
20
25
30
35
40
45
D155 [0/45/0]s A130 [0/45/0]s D155 [0/0/45/0]s A130 [0/0/45/0]s
Thr
ee-P
oint
Fle
xura
l Mod
ulus
(G
Pa)
Hand Lay-up VARTM RTM - R RTM - S
Figure 67. Three-point bending moduli results.

134
interest are labeled for the tensile tests. These are initial damage strain, elastic modulus,
and ultimate tensile strength.
Typical tensile specimens tested in this study are illustrated in Figure 69. Shown
in this figure are the dogbone geometries and the additional tab material of these
specimens. Both of these features helped to ensure specimen gage section failures.
The tensile test results found during the course of this study are summarized in
Table 25. This table contains the average and standard deviation values for ultimate
tensile strength, tensile modulus, and initial fracture strain of the specimens tested. It is
worth noting that for the tensile experiments, only VARTM and hand lay-up samples
were fabricated, tested, and then compared. The reason that only these two processes
were tested was due to the labor intensive operations of routering the dogbone shape and
secondary bonding the tab material. The additional time involved in including standard
RTM specimens did not seem justified for a test that was not suspected to have a strong
relation to manufacturing technique. As a result, VARTM (using Radius equipment) and
hand lay-up specimens were used exclusively in this study.
The average ultimate tensile strengths and their maximum and minimum recorded
values are shown in Figure 70. Lay-up schedule affected the laminate tensile strength
according to unidirectional fabric content. The [0/0/+45/0]s specimens contained 75%
unidirectional fabric while [0/+45/0]s samples had only 67% of their volume containing
0° reinforcements. These differences in unidirectional material content resulted in
improved strength for VARTM composites of [0/0/+45/0]s lay-up over [0/+45/0]s by
28% for A130 and 31% for D155. Fabric type also appears to have a significant effect on

135
Figure 68. Tensile test data example.
Figure 69. Tensile test specimens.
0
50
100
150
200
250
300
350
400
450
0 0.5 1 1.5 2 2.5 3 3.5
Strain (%)
Ten
sile
Str
ess
(Mpa
)
Initial damage(matrix cracking)
+45 deg. layersbegin to delaminate
0 deg. fibersbegin cracking
Extensometer slippage
To final failure
(Ult. strength)
Modulus
A130 / DB120
D155 / DB120 3.81 cm

Table 25. Longitudinal tensile testing results.
UTS Tensile Strain to DataLay-up Fabrics Process (S.D.) Modulus 1st Fracture Points
MPa (S.D.) GPa (S.D.) %D155 / HL 639.5 (37.2) 24.9 (1.0) 1.22 (0.17)
[0/+45/0]s DB120 VARTM 646.8 (7.9) 24.1 (0.5) 1.18 (0.48) 5A130 / HL 488.9 (37.0) 20.9 (1.3) 1.60 (0.13)DB120 VARTM 545.1 (5.7) 21.9 (0.8) 1.55 (0.53)
D155 / HL 635.8 (39.1) 24.5 (1.3) 1.01 (0.24)[0/0/+45/0]s DB120 VARTM 932.8 (29.2) 34.4 (1.3) 0.92 (0.13) 5
A130 / HL 610.9 (26.1) 23.9 (0.5) 1.41 (0.23)DB120 VARTM 752.7 (24.3) 28.1 (1.6) 1.42 (0.06)
UTS - Ultimate Tensile StrengthNOTE: Sample thicknesses vary between HL and VARTM in accordance with Table 14.
13
6
137
ultimate tensile strength. Reductions were again found for unidirectional material type.
Reductions in tensile strength between 16% and 19% were observed when comparing
VARTM with D155 unidirectional fabrics versus A130 fabrics. These differences in
strength can be accounted for by a combination of the lower content of unidirectional
material and the inherent lower strength of A130 laminates when compared to similar
specimens with D155 fabric [50]. Moving on to process comparisons, differences in
ultimate tensile strength between hand lay-up and VARTM laminates were 1 – 10% for 6
layer samples and 19 – 32% for 8 layer specimens. Statistical tests showed no
measurable differences between VARTM and hand lay-up for [0/+45/0]s samples, while
significant differences were found for composites of [0/0/+45/0]s lay-up.
Normalizing the data of Figure 70 reduced the differences between process for all
the specimens tested. The normalized tensile strength data are presented in Figure 71.
The differences in average normalized compressive strength were 4% or less for all
laminate types tested. With the exception of the A130/DB120 [0/0/+45/0]s specimens,
all the sample types yielded no statistical differences according to process. Even the
normalized results for A130/DB120 [0/0/+45/0]s laminates were not strong in their
measured differences (statistical P value = 0.03). These normalized investigations show
that the differences in processing between hand lay-up and RTM will not have
measurable differences in ultimate tensile strength.
The results for average tensile moduli are shown in Figure 72. Fabric types and
unidirectional fabric content had the similar effects on moduli as observed for ultimate
tensile strength. The tensile specimen results shown in Figure 72 suggest that moduli are

138
Figure 70. Average ultimate tensile strength with maximum and minimum values.
Figure 71. Normalized average ultimate tensile strengths.
0
100
200
300
400
500
600
700
800
900
1000
D155 [0/45/0]s A130 [0/45/0]s D155 [0/0/45/0]s A130 [0/0/45/0]s
Ulti
mat
e T
ensi
le S
tren
gth
(MP
a)
Hand Lay-up VARTM
0
100
200
300
400
500
600
700
D155 [0/45/0]s A130 [0/45/0]s D155 [0/0/45/0]s A130 [0/0/45/0]s
Ten
sile
Str
engt
h (M
Pa)
Hand Lay-up VARTM

139
reduced for composites with A130 reinforcement, when compared to those with D155
fabric. These reductions in moduli were found to be 9% between [0/+45/0]s laminates
and 18% between [0/0/+45/0]s composites. The percentage of 0° degree reinforcement
also improved tensile moduli as it improved ultimate tensile strength earlier. When
processes were compared, no statistical differences were found for [0/+45/0]s laminates,
while [0/0/+45/0]s composites had measurable distinctions. These eight ply laminates
saw reductions between 14 and 26% in tensile modulus with A130 reinforcement.
Normalization for modulus was not shown here but yields the same conclusions
as with the tensile strength results. That is, process has little effect on normalized
longitudinal tensile modulus. These results underscore the observation that while
processing does not affect normalized laminate strengths and stiffnesses in fiber
dominated directions, hand lay-up will be detrimental in other areas, such as weight and
fiber content.
The strains at initial damage for tensile specimens were also recorded and their
average, maximum, and minimum values are shown in Figure 73. Statistical analyses of
these groups of data showed no differences between any of the fabric and lay-up
combinations. While it was useful to find the average of damage onset, this investigation
implied that the variability associated with initial tensile damage was too great to
distinguish between the hand lay-up and RTM processes.

140
Figure 72. Tensile modulus results.
Figure 73. Tensile initial damage strain results.
0
5
10
15
20
25
30
35
40
D155 [0/45/0]s A130 [0/45/0]s D155 [0/0/45/0]s A130 [0/0/45/0]s
Ten
sile
Mod
ulus
(G
Pa)
Hand Lay-up VARTM
0.0
0.5
1.0
1.5
2.0
2.5
D155 [0/45/0]s A130 [0/45/0]s D155 [0/0/45/0]s A130 [0/0/45/0]s
Ten
sile
Initi
al D
amag
e S
trai
n (%
)
Hand Lay-up VARTM

141
Fatigue
The fatigue tests of this study were performed under reversed tension and
compression loading (R = -1) to represent severe fatigue loading of the turbine blade.
This test required short gage lengths and as a result, extensometer data were not
collected. The information collected were specimen stress and fatigue lifetime from the
Instron digital readout. Tested fatigue specimens are illustrated in Figure 74. Fatigue
specimens were not complicated to prepare, but did require many hours to test. Due to
this time commitment, only the [0/+45/0]s laminates of D155/DB120 and A130/DB120
fabrics were investigated.
Figure 74. Fatigue test specimens.
A summary of the fatigue testing data is given in Table 26. The test stresses
shown in this table were chosen to achieve a target fatigue lifetime of approximately
100,000 cycles. During testing, the Instron machine operated in load control to apply
D155 / DB120
A130 / DB120 2.54 cm

142
+172 MPa stresses to the D155 samples and +138 MPa stresses to the A130 specimens.
The D155/DB120 (R= -1) fatigue specimens were nearly identical in thickness and
showed no statistical difference (P = 0.7). On the other hand, the A130/DB120 samples
had over a 0.6 mm difference in thickness that significantly effected the fatigue results.
The average fatigue lifetime for VARTM A130/DB120 specimens was more than five
times greater than the life found for the hand lay-up samples. This significant drop in
fatigue life for hand lay-up laminates could have been attributed to thickness and loading
criteria. With the notably greater thickness measured for the A130 hand lay-up samples
an equally greater load was required to stress the specimens to the same levels of their
VARTM counterparts. The increased loading scheme for the hand lay-up specimens may
have unfairly biased them against VARTM and required further investigation.
To address this issue, the A130/DB120 specimens were retested under constant
loads. Matrix material should contribute very little to the structural performance of these
specimens and as a result it is fair to apply specimens of identical reinforcement content
to similar loads. The constant load chosen was approximately 10 kN and tests of this
type resulted in fatigue lifetimes of 435k and 280k for hand lay-up and VARTM,
respectively. At first glance the average values suggest a notable difference, yet a
statistical treatment of the complete fatigue data suggests little difference between the
two sample groups (P > 0.1). Therefore, the results of the fatigue specimen study show
that composite applications will not see a difference in fatigue performance for [0/+45/0]s
laminates manufactured by either VARTM or hand lay-up.

143
Table 26. Fatigure data summary.
Lay-up Sample Average Test Fatigue Averageand Process No. Thickness Stress Cycles Fatigue Life
Fabrics (S.D.) mm MPa (S.D.) cycles702.34 62257702.35 364201
HL 702.36 3.11 +172 105255 139,890702.37 (0.10) 70566 (113,397)
[0/+45/0]s 702.38 95787702.39 141276
D155 / 622.34 46707DB120 622.35 88727
VARTM 622.36 3.18 +172 95102 115,740622.37 (0.07) 70028 (68,957)622.38 232841622.39 161036
705.34 47302705.35 48328
HL 705.36 3.69 +138 123583 51,140705.37 (0.27) 48209 (38,453)
[0/+45/0]s 705.38 11396705.39 28021
A130 / 619.34 470659DB120 619.35 255852
VARTM 619.36 3.06 +138 235153 280,132619.37 (0.06) 364006 (115,979)619.38 189096619.39 166027
Lay-up Sample Average Test Fatigue Averageand Process No. Thickness Stress Cycles Fatigue Life
Fabrics (S.D.) mm MPa (S.D.) cycles705.40 612132705.41 553304
HL 705.42 3.50 +121 632739 434,952705.43 (0.26) 318823 (184,254)
[0/+45/0]s 705.44 228950705.45 263763
A130 / 619.34 470659DB120 619.35 255852
VARTM 619.36 3.06 +138 235153 280,132619.37 (0.06) 364006 (115,979)619.38 189096619.39 166027

144
RTM Flat Plate Washout Observations
The flat plates that the mechanical test specimens were collected from were
manufactured with RTM flow rates and injection pressures that yielded reasonable cycle
times. However, a production environment would require that injections be optimized
such that specimens can be injected as quickly as possible without washing-out or
distorting the fabric reinforcement. Washout and distortion are a consequence of the
resin flow displacing the fiber reinforcement during injection. In this study, the general
trends in washout onset were documented for the laminates of the flat plate mechanical
testing matrix. “Onset of washout” is defined for the purposes of this study as the lowest
(averaged) injection pressure where displacement of the fibers is first noticeable to the
unaided eye during RTM. The results of this washout study demonstrate at what ultimate
parameters future flat plate specimens could be manufactured. In addition, this
information compliments RTM flow modeling applications like the work performed by
Rossell [45].
The washout experiments began with selecting all of the fabric and lay-up
combinations used in the mechanical testing study. The Radius RTM equipment and data
acquisition system were used to determine and record the approximate pressures for fiber
washout. An aluminum top was substituted with the glass plates for safety at elevated
pressures. A series of plates were then injected for each fabric and lay-up combination
and pressures were recorded. While the values collected might appear to be strict
pressures for the onset of washout, many factors contribute to fabric distortion. Washout
behavior is notably variable in nature even for identical RTM situations. As a result, the

145
washout investigation results show the average injection pressures that will most likely
washout the glass reinforcements. The influence of pressure gradients (versus absolute
pressure), fabric types, matrix viscosity, etc. would need to be investigated at length for a
more complete study of the fiber washout phenomenon.
The results for the current washout investigation are summarized in Table 27. For
the results of washout injection pressures, average values, a range of values, or the
maximum tested values are presented. Pressures denoted with a plus sign were either the
maximum values tested or the maximum attainable with the current RTM equipment. A
number of trends in flat plate washout behavior is noted in Table 27. Fabric architecture
appears to be an important parameter in washout onset. For all the lay-ups used in the
mechanical testing study, laminates with unidirectional D155 material required
significantly greater injection pressures for washout when compared to the same flat
plates utilizing A130 unidirectional reinforcement. Injections where resin is fed into the
outer end of a flat plate required significantly less pressure for washout than for injections
where resin entered near the center of the mold. This observation held true for all fabric
and lay-up combinations explored. Increased fiber content also increased the resin
pressure required to achieve fabric washout. This behavior seemed intuitive since greater
fiber volumes will have greater frictional forces securing the reinforcement in place.
VARTM was also introduced for [0/+45/0]s A130/DB120 laminates to determine the
influence vacuum assist might have on washout behavior. The results of Table 27 show
that the injection pressure required to initiate washout in VARTM specimens is notably
less than an identical specimen injected by RTM. It requires mention that utilizing
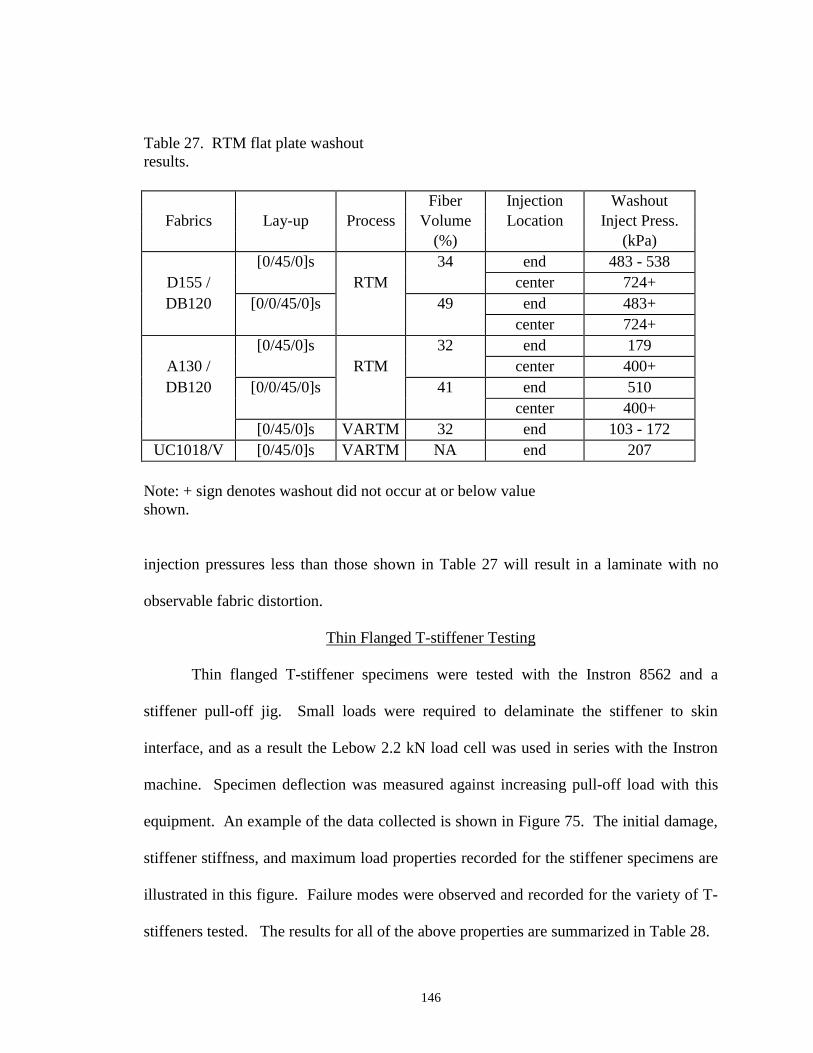
146
Table 27. RTM flat plate washoutresults.
Fiber Injection WashoutFabrics Lay-up Process Volume Location Inject Press.
(%) (kPa)[0/45/0]s 34 end 483 - 538
D155 / RTM center 724+DB120 [0/0/45/0]s 49 end 483+
center 724+[0/45/0]s 32 end 179
A130 / RTM center 400+DB120 [0/0/45/0]s 41 end 510
center 400+[0/45/0]s VARTM 32 end 103 - 172
UC1018/V [0/45/0]s VARTM NA end 207
Note: + sign denotes washout did not occur at or below valueshown.
injection pressures less than those shown in Table 27 will result in a laminate with no
observable fabric distortion.
Thin Flanged T-stiffener Testing
Thin flanged T-stiffener specimens were tested with the Instron 8562 and a
stiffener pull-off jig. Small loads were required to delaminate the stiffener to skin
interface, and as a result the Lebow 2.2 kN load cell was used in series with the Instron
machine. Specimen deflection was measured against increasing pull-off load with this
equipment. An example of the data collected is shown in Figure 75. The initial damage,
stiffener stiffness, and maximum load properties recorded for the stiffener specimens are
illustrated in this figure. Failure modes were observed and recorded for the variety of T-
stiffeners tested. The results for all of the above properties are summarized in Table 28.

147
Figure 75. Example curve of T-stiffener pull-off test data.
Figure 76. Thin flanged T-stiffener initial damage loads.
0
20
40
60
80
100
120
140
0 0.5 1 1.5 2 2.5 3 3.5
Crosshead Displacement (cm)
T-S
tiffe
ner
Pul
l-off
Load
(N
/cm
-wid
th)
Initial Damage
Stiffener Delamination
Ultimate Failure
0
20
40
60
80
100
120
140
160
180
D155 / DB120 A130 / DB120
Initi
al D
amag
e Lo
ad (
N/c
m-w
idth
)
RT
M C
C
RT
M S
B
HL
CC
HL
SB
HL
SB
(3)
RT
M C
C
RT
M S
B
HL
CC
HL
SB
CC - Co-curedSB - Secondary BondedSB(3) - Bonded from three parts
Specimen Stiffness
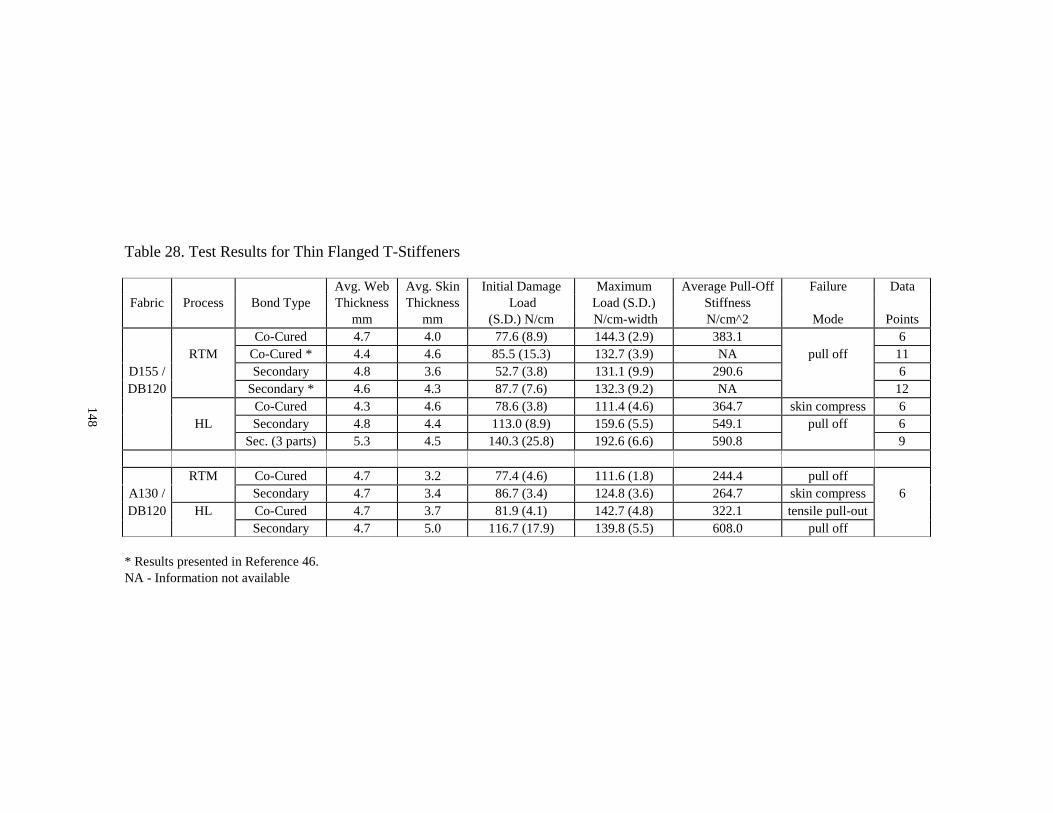
Table 28. Test Results for Thin Flanged T-Stiffeners
Avg. Web Avg. Skin Initial Damage Maximum Average Pull-Off Failure DataFabric Process Bond Type Thickness Thickness Load Load (S.D.) Stiffness
mm mm (S.D.) N/cm N/cm-width N/cm^2 Mode PointsCo-Cured 4.7 4.0 77.6 (8.9) 144.3 (2.9) 383.1 6
RTM Co-Cured * 4.4 4.6 85.5 (15.3) 132.7 (3.9) NA pull off 11D155 / Secondary 4.8 3.6 52.7 (3.8) 131.1 (9.9) 290.6 6DB120 Secondary * 4.6 4.3 87.7 (7.6) 132.3 (9.2) NA 12
Co-Cured 4.3 4.6 78.6 (3.8) 111.4 (4.6) 364.7 skin compress 6HL Secondary 4.8 4.4 113.0 (8.9) 159.6 (5.5) 549.1 pull off 6
Sec. (3 parts) 5.3 4.5 140.3 (25.8) 192.6 (6.6) 590.8 9
RTM Co-Cured 4.7 3.2 77.4 (4.6) 111.6 (1.8) 244.4 pull offA130 / Secondary 4.7 3.4 86.7 (3.4) 124.8 (3.6) 264.7 skin compress 6DB120 HL Co-Cured 4.7 3.7 81.9 (4.1) 142.7 (4.8) 322.1 tensile pull-out
Secondary 4.7 5.0 116.7 (17.9) 139.8 (5.5) 608.0 pull off
* Results presented in Reference 46.NA - Information not available
14
8

149
The initial damage results from Table 28 can be examined independently in
Figure 76. The damage results for the different T-stiffener specimens according to fabric
architecture and interface bond type are shown in this figure. For samples of A130 and
D155 unidirectional reinforcement, initial damage in pull-off test occurred at similar
loads. Statistical comparisons showed that unidirectional reinforcement type does not
appear to influence pull-off strength. Next, it can be noted that when comparing RTM
samples, bond interface does not play a significant role in initial damage load. The pull-
off loads for D155 T-stiffeners tested by Haugen [46] also showed comparable
independence for thin bondlines, and his results were statistically similar to the current
findings.
A discrepancy between the RTM secondary bonded and co-cured T-stiffeners can
be observed in Figure 76 when comparing average initial damage loads. The initial
damage load for the RTM secondary bonded specimens was significantly less than those
found for similar T-stiffeners of alternative processing and bond type. This was found to
be a problem introduced as a result of the RTM mold. In the manufacture of the T-
stiffeners, flexible gasket / spacers were required that allowed skin and web thicknesses
to vary. Originally, it was suspected that the variations in thickness would be minimal,
however, the results for specimen thicknesses at a variety of locations show otherwise
(Appendix B). Comparing laminate thickness and initial damage load implies that
specimen mass and moment of inertia play an instrumental role in mechanical
performance and that tighter manufacturing tolerances should be followed in the future.
150
The first modified hand lay-up technique (where T-stiffeners were forced to fit
into an RTM tool) shows little difference in initial damage loads when compared to
similar RTM specimens. Statistical analysis reinforced this observation for stiffeners of
different fabric types. Process selection and porosity content seemed to have little effect
on initial damage load for thin flanged T-stiffeners, as well. The second modified hand
lay-up and true hand lay-up techniques did show significant differences in initial damage
load when compared to the other RTM and hand lay-up specimens. The processing of
the latter two hand lay-up specimens yielded samples of greater cross-sectional area than
the previous T-stiffeners. The greater cross-section increased mass and moment inertia
of the specimens and resulted in the greater initial damage loads observed in Figure 76.
Parameters affecting initial damage similarly influenced maximum pull-off loads.
The maximum pull-off loads in Figure 77 seem to be independent of unidirectional
reinforcement (either A130 or D155). Ultimate pull-off loads appear to be governed by
cross-sectional area, as a review of Figure 77 and Appendix B will show. Hand lay-up
processing yielded D155/DB120 T-stiffeners of the greatest amount of mass and as a
result had the largest pull-off loads of the specimens tested.
Pull-off stiffnesses were also calculated for the stiffeners of this study. The
stiffness value corresponds to the load required per unit width to deflect the specimen.
The range of values where pull-off stiffness data is collected is illustrated in Figure 75.
Thin flanged T-stiffener pull-off stiffness results are illustrated in Figure 78.
Unidirectional fabric reinforcement had little influence on the stiffness property. Again,
it appears that process and specimen size were the dominate influences in stiffness

151
Figure 77. Thin flanged T-stiffener maximum pull-off loads.
Figure 78. Thin flanged T-stiffener stiffnesses.
0
50
100
150
200
250
D155 / DB120 A130 / DB120
Max
imum
Pul
l-off
Load
(N
/cm
-wid
th)
RT
M C
C
RT
M S
B
HL
CC
HL
SB
HL
SB
(3)
RT
M C
C
RT
M S
B
HL
CC
HL
SB
CC - Co-curedSB - Secondary BondedSB(3) - Bonded from three parts
0.0
100.0
200.0
300.0
400.0
500.0
600.0
700.0
D155 / DB120 A130 / DB120
Pul
l-off
Stif
fnes
s (N
/cm
^2)
RT
M C
C
RT
M S
B
HL
CC
HL
SB
HL
SB
(3)
RT
M C
C
RT
M S
B
HL
CC
HL
SB

152
results. All specimens manufactured with hand lay-up and secondarily bonded together
were significantly greater in specimen pull-off stiffness when compared to the same
samples manufactured by RTM, as a consequence of the greater moment of inertia.
Variability in stiffness between the RTM co-cured, RTM secondary bonded, and hand
lay-up co-cured specimens correlated with variances between specimen web and skin
thicknesses.
Review of the stiffener results showed that relying exclusively on pull-off load
data may not have been the best approach for evaluating the parameters of this
complicated substructure. For the specimens of the flat plate mechanical testing study,
normalization techniques were available that allowed for reliable comparisons between
samples of slight variances. Yet, the normalization techniques used in the flat plate study
are not applicable to more complicated geometries. In an effort to normalize the effects
dimensional differences had in the T-stiffener results, a skin stress analysis was
performed.
Stiffener skin stresses were calculated at a location near the flange tip to compare
specimens in a normalized manner. The location chosen was at the surface of the T-
specimen skin, just before it interfaces with the stiffener. This point was selected because
a simple mechanics of materials approach could be used at this location and more
convoluted methods like FEA could be avoided. Skin stress in this area was calculated
with three-point bending, simply supported equations. The results for these skin stress
calculations are shown in Figure 79.

153
RTM specimens supported greater flange tip stresses at T-stiffener maximum load
when compared to hand lay-up, as shown in Figure 79. For example, the T-stiffeners
manufactured with RTM, D155/DB120 fabrics, and co-cured experienced a 38% increase
in flange tip stress when compared to hand lay-up. The same RTM samples that were
secondary bonded together were 4 – 16% stronger than the same T-stiffeners
manufactured by hand lay-up. It also appears that bond interface and moment of inertia
play a role in skin surface stress. Examination of the D155/DB120 specimen results in
Figure 79 shows that the use of secondary bond material and the increase in moment of
inertia increased the flange tip skin stress in the T-stiffener samples. This behavior was
noted for the A130/DB120 specimens manufactured by RTM, but was not repeated for
0
10
20
30
40
50
60
70
80
90
100
D155 / DB120 A130 / DB120
T-S
tiffe
ner
Max
imum
Fla
nge
Tip
Str
ess
(MP
a)
RT
M C
C
RT
M S
B
HL
CC
HL
SB
HL
SB
(3)
RT
M C
C
RT
M S
B
HL
CC
HL
SB
CC - Co-curedSB - Secondary BondedSB(3) - Bonded from three parts
Figure 79. Thin flanged T-stiffener skin stress at flange tip.

154
the same samples manufactured by hand lay-up. This was due to the large difference in
skin thicknesses ( > 1.5 mm) used to calculate flange tip stress for the co-cured and
secondary bonded hand lay-up samples.
The skin stress analysis near the flange tip demonstrates another method for
comparing composite substructures. Results from the stress calculations show that this
approach normalizes the effects of thickness variation, to a certain extent. In future
analyses of complicated geometries a stress and strain method of comparison may prove
better in determining the effects dimensional tolerance, bondline thickness, and process
have on composite structure mechanical performance.
An interesting discovery made during the course of the stiffener pull-off testing
was failure mode. Failure mode was found to be a property that was influenced by all
three of the process, fabric, and bond parameters. Previous research demonstrated that
RTM T-stiffeners manufactured with polyester resin and glass reinforcement and having
the dimensions illustrated in Appendix B, would fail in skin stiffener pull-off [46]. This
failure mode is illustrated in Figure 80. This type of skin stiffener specimen had initial
damage in the interface near the web. Delamination of the specimen continued until the
entire stiffener was removed from the skin. Nearly 75% of the T-stiffener specimens
tested in this study failed in this manner. For example, all D155/DB120 T-stiffeners
manufactured by RTM and all D155/DB120 T-stiffeners manufactured hand lay-up and
secondary bonded failed in stiffener pull-off.
The observation that was of interest was that two additional failure modes were
found for specimens of different thickness, fabric, and process. The second failure mode

155
Figure 81. Stiffener tensile pull-out failure mode.
Composite delamination
20 mm
Figure 80. Stiffener pull-off failure mode.
Complete delamination ofskin/stiffener interface
Hysol adhesive
20 mm

156
observed was tensile pull-out. The tensile pull-out failure mode is illustrated in Figure
81. In this damage scenario, failure initiates in a similar manner to stiffener pull-off.
However, the stiffener is never entirely removed from the skin. Rather, the skin and
stiffener are pulled past the simple supports and out of the jig all together. T-stiffeners
manufactured by hand lay-up with A130 unidirectional material and co-cured failed in
tensile pull-out.
The third failure mode observed during T-stiffener mechanical testing was skin
compression. This failure mode is shown in Figure 82. The skin compression failure
initiated with damage in the skin interface near the web, yet significant delamination did
not propagate. Instead, the skin failed in compression at this location. Co-cured hand
lay-up stiffeners with D155/DB120 fabrics and secondary bonded RTM stiffeners with
A130/DB120 fabrics demonstrated the skin compression failure mode.
Figure 82. Stiffener skin compression failure mode.
Composite delamination
Skin compressive failure
20 mm

157
These findings demonstrate that thin flanged T-stiffener failure mode can vary
according to manufacturing process and fabric type employed. Current examinations of
failure mode versus cross-sectional area did not yield any correlations between the two,
but cannot be ruled out at this time. It is uncertain what effect processing could have on
stiffener pull-off failure mode, and future work is required to address this interesting
phenomenon.
Thick Flanged T-stiffener Mechanical Testing
The four thick flanged T-stiffeners of the experimental matrix were manufactured
and prepped for testing. However, the thin flanged T-stiffener results and time
limitations precluded the testing of these specimens. The thin flanged stiffener results
showed that fabric and process contributed to the structural performance of the samples
only in their influences on cross-sectional area. Mass and moment of inertia were the
strongest influences on the mechanical performance of the thin flanged T-stiffeners.
Reviewing these results suggests that the same would hold true for mechanical testing of
thick flanged T-stiffeners. These specimens could shed further light on the issue of
failure mode. Future work could include the testing of thick flanged T-stiffeners with
varying reinforcement types and manufacturing processes.
I-beam Specimen Mechanical Testing
The eight I-beams of the experimental matrix were manufactured but not tested
for structural performance. This was due to problems that arose in manufacturing hand

158
lay-up I-beams of the lay-up and the size suggested from previous work [47]. Referring
back to Figures 43 and 44 shows the vast difference in cross-sectional area between the
two specimens. The three-point bending and stiffener pull-off tests demonstrated that
area and mass overwhelmed the effects process might have in mechanical performance.
It was suspected that this would also be the case for I-beam specimens where the largest
differences in cross-sectional area were observed. Secondly, the hand lay-up beams were
not feasible to manufacture under the current conditions. The suggested web lay-up of
[+45/0/+45]s performed well in RTM manufacturing due to its symmetry. However, the
hand lay-up methodology required the web and flanges to be fabricated as individual C-
channels. These C-channels were unsymetrical in their lay-ups and were warped
significantly during post-cure due to the behavior of the 45° reinforcements. This
warpage was measured in each hand lay-up C-channel as an 8° rotation for a 762 mm
specimen length. These manufacturing difficulties underscore the influence of
processing on structural components. The observations on hand lay-up beam fabrication
suggest that another program to study assembly influences needs to be conducted.
Root Specimen Mechanical Testing
The primary focus of the root specimen study was to better understand the
technology of fabricating resin transfer molded structures from composite tooling. While
there is some literature on this type of manufacturing [57], the amount of information is
limited. It would be beneficial for future developments to explore the details of molding
RTM components from a tool cavity made from a hand lay-up template. This research

159
could prove quite useful in the effort to manufacture large turbine blade structures from
this flexible and cost-effective tooling method.
In addition to advancing composite RTM tool molding technology, it was of
interest to compare the mechanical performance of RTM root specimens against the same
samples manufactured by hand lay-up. This portion of the root study explored whether
process effected steel insert to laminate interaction, and will be discussed shortly.
The root specimen was an innovative design that combines a shear loaded,
mounting insert in a composite laminate. This MSU Composites Technology Team
design for a root specimen required investigation to determine the feasibility of
manufacturing a complete turbine blade to hub connection. In addition to the root
research areas just mentioned, there were minimum requirements of the root specimens
that required investigation. These investigations included the following:
• Satisfy a tensile and compressive load of 98 kN. This is the load subjected ona series of specimens during the maximum wind condition of 214 km/h asdetermined by the FEA performed by McKittrick [3].
• Process specimens with good interaction between laminate and steel insert.Poor interactions would result in premature mechanical failure of thespecimen.
• Attain consistent fiber volume throughout the RTM root specimens. Thisrequirement minimizes the likelihood of stress concentrations and matrix richregions that could initiate cracks.
• Sustain a reasonable fatigue lifetime. While this had not been predetermined,specimens were fatigue tested at loads approximating the maximum windcondition and the number of cycles that the root samples could survive wasrecorded.

160
In the first round developments with the composite root specimen, attempts were
made to adequately wet-out the reinforcement in the cavity of the RTM tool. This
composite RTM mold from Headwaters Composites, Inc. was manufactured from a hand
lay-up template. It was unclear how the identical lay-up of the template would perform
in an RTM application, however, this appeared to be a good starting point and was
chosen for the first three RTM root specimen moldings. Complete information
concerning the lay-up schedules, manufacturing notes, and ultimate loads of the
specimens tested in all three rounds of the root specimen research are listed in Table 29.
Specimens R101 and R102 were attempts to manufacture an RTM root sample with the
identical fabrics and lay-up as the original template. It was discovered that in this RTM
application the A130 fabric inhibited complete wet-out of the part, and as a result large
dry regions were observed in these laminates (Fig. 83). The last sample manufactured
under the first round investigation was of D155 and DB120 fabrics and the original
template lay-up. D155 fabric facilitated complete wet-out of the root component and was
thus chosen as the unidirectional fabric to be used in the subsequent root investigations.
Static tensile test loads and failure modes of the first round root specimens are
listed in Table 29. The average for these three tests was found to be 232 kN or 2.3 times
the maximum wind condition load. These values showed promise that the design would
perform well as a means to mate the turbine blade to the hub. It was observed that two of
the root specimens failed as the insert was pulled out of the laminate, while one specimen
failed in the composite near the grip. The specimen that experienced grip failure was

Table 29. Root specimen manufacturing and testing data. Current lay-up: Skin [+45/02/+45]s
Surface [+45/0/+45/02/+45]sStatic Tensile TestsSample No. Process Zero Lay-up Schedule Notes on Manufacturing Ultimate Load Comments
Fabric (kN) 1
R101 A130 [+45/02/+45/02/+45]s Poor wet out 243.8 insert pull-outR102 RTM A130 [+45/02/+45/02/+45]s ply drops Poor wet out 213.6 composite failureR103 D155 Low Vf about insert 241.1 insert pull-outR201 VARTM D155 [+45/0/+45/02/+45]s ply drops Low Vf about insert 230.6 good bonding w/ insertR104 Low Vf / Super 77 / 3"-12" 240.3R106 [+45/0/+45/02/+45]s ply drops 9"-12" strips 198.0R107 RTM D155 Spartan / wash-out / 9"-12" 240.0 composite failureR108 9"-12" strips 177.2R109 Current w/ skin: [+45/03/+45]s Spartan / High Vf at insert 254.1 two tests / bolt failure / yieldR110 Current Spartan 252.4 bolt failure / no insert yieldR301 HL D155 [+45/0/+45/02/+45]s ply drops No insert tip / 9"-12" 213.5 composite failureR303 9"-12" strips 181.3
Fatigue TestsSample No. Process Fabric Lay-up Schedule Notes on Manufacturing Fatigue cycles Comments
(cycles)R105 2 [+45/0/+45/02/+45]s ply drops Low Vf / 3"-12" strips
R111 2
R112 120,317 R: 0.1, 89/9 kN, no damageR113 2 RTM D155 Current
R114 2
R115 2
R116 2
R302 2 HL D155 [+45/0/+45/02/+45]s ply drops 9"-12" strips1 - 98 kN is the root specimen design limit load.2 - Manufactured but not tested.
16
1
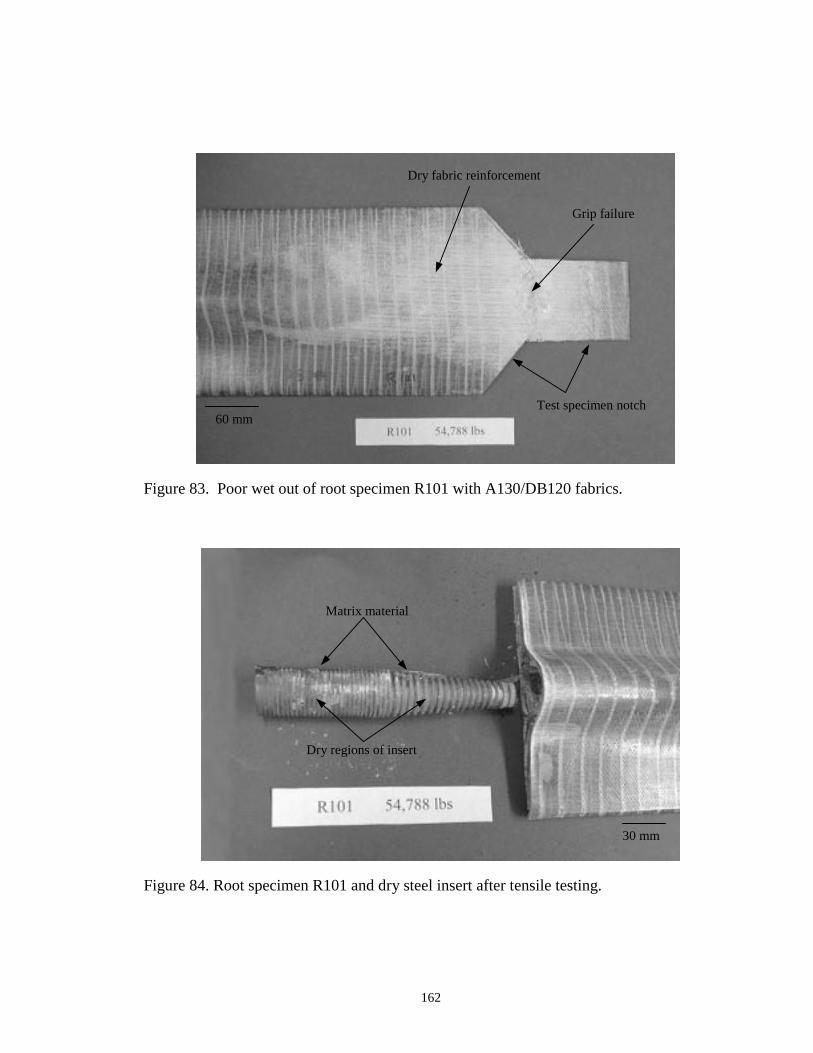
162
Figure 83. Poor wet out of root specimen R101 with A130/DB120 fabrics.
Figure 84. Root specimen R101 and dry steel insert after tensile testing.
60 mm
Dry fabric reinforcement
Test specimen notch
Grip failure
30 mm
Matrix material
Dry regions of insert

163
poorly wet-out with resin, and consequently it was suspected that the predominate failure
mode for root specimens identical to those of round one will be insert pull-out.
The mechanical testing of the round one root specimens demonstrated that the design
would meet the maximum load requirement of this study. However, it was found that
these specimens did not meet the minimum requirements of insert to laminate interaction
and fiber volume distribution. Shown in Figure 84 is root specimen R101 where the
insert has been removed during testing. The damage in this specimen through its width
illustrates the amount of delamination generated and subsequent energy released during
failure (Fig. 85). This failure behavior showed that there was a substantial amount of
resistance in removing the insert. However, reviewing the removed insert illustrates little
composite / steel rib bonding (Fig. 84). The insert for specimen R101 shows little matrix
material and no glass fiber remaining attached to the insert. This demonstrates that
composite / insert surface contact was limited. Additional investigations into the root
specimen might explore how to improve the interface and achieve better interaction with
the polyester matrix and glass reinforcement.
The first round root specimens were also examined for the distribution of fiber
volume. No matrix burn-offs were performed on these specimens, yet they were
sectioned to gather a visual representation of the distribution of fabric and matrix. Shown
in Figure 86 is a sectioned sample of root R103. It was found from these cross-sections
that the hand lay-up template was relatively low in fiber volume about the fabric darts.
As a result when the same lay-up was used in an RTM application, the injection pressures
were sufficient to compress the low volumes of fabric about the sides of the insert. This

164
behavior resulted in the resin rich regions as shown in Figure 86. These matrix rich
regions may have limited the insert interaction with the laminate and could have provided
starter cracks during testing. Both possibilities are undesirable and the second round of
the root specimen experiments attempted to resolve these issues.
The second round objectives of the root specimen study included increasing the
fiber volume about the steel insert and manufacturing hand lay-up samples for process
comparisons. During this portion of the root study six RTM specimens and three hand
lay-up laminates were manufactured. The first RTM specimen was an attempt to apply
vacuum assist on the composite root tool. Composite molds can yield reliable vacuum
seals under most circumstances. However, the complicated root tool geometry, including
a locator for the steel insert, made vacuum sealing rather difficult. The mold had two
seals and required a substantial effort to guarantee consistent vacuum integrity. The inner
silicone seal mated well between the tool surfaces, but lost its ability to sustain a vacuum
whenever glass fibers overlapped the sealing surfaces. The outer neoprene seal was
adjusted on a number of occasions in an attempt to secure a vacuum, but these efforts
were also unsuccessful. As a result, specimen R201, the attempt at a vacuum assisted
RTM injection yielded a part of marginal quality. The vacuum assist effects were noted
to draw in more voids than observed with the standard RTM process. Due to these
difficulties with the VARTM process applied to the root mold, the remainder of the RTM
specimens studied under the root investigation were manufactured without vacuum
assistance.

165
Figure 85. Static tensile test damage through root specimen width.
Figure 86. Cross-section of root specimen R201 and resin rich regions near insert.
Figure 87. Cross-section of root specimen R104, with higher fiber content at insert.
20 mm
Skin and surface laminate damage
20 mmMatrix rich regions
Distorted reinforcement
20 mm
CDB200 triaxialfabric strips
Areas of improved fiber volume

166
The remaining five RTM specimens fabricated under the second round root study
addressed the low fiber volume noted around the steel insert (Fig. 87). The simplest
option for increasing fiber volume on each side of the insert was to add additional glass
reinforcement. Modifying the tool surface would have eliminated the need for added
material in the RTM’d root specimens, but this would have been the most time
consuming and costly solution to the problem. Hence, adding strips of 38 mm wide,
CDB200 triaxial reinforcement was the option chosen to address the matrix rich regions
of the root design in Figure 86. The specifications for the second round RTM root
specimens, as well as a few details on the adjustments made to increase the fiber volume
in locations near the insert are provided in Table 29. Illustrated in Figure 87 is a cross
section of specimen R106 where the addition of triaxial reinforcement is shown to
remedy the fiber volume concern previously noted. Matrix burn-offs were not feasible in
these regions because the lay-up and geometry varied in three dimensions and would
likely yield suspect fiber volume data. As a result, visual inspection techniques were
used for observing composite fiber volumes in complex regions.
Through the course of the second round root study, three hand lay-up specimens
were also manufactured. The identical lay-up used to manufacture the RTM roots was
used for these specimens. The hand lay-up root samples were fabricated to compare any
measurable differences in mechanical strength according to process. During processing,
it was found that wetting out the laminate around the steel insert was difficult. The
reinforcement had the tendency to pull away from the insert’s surface and required
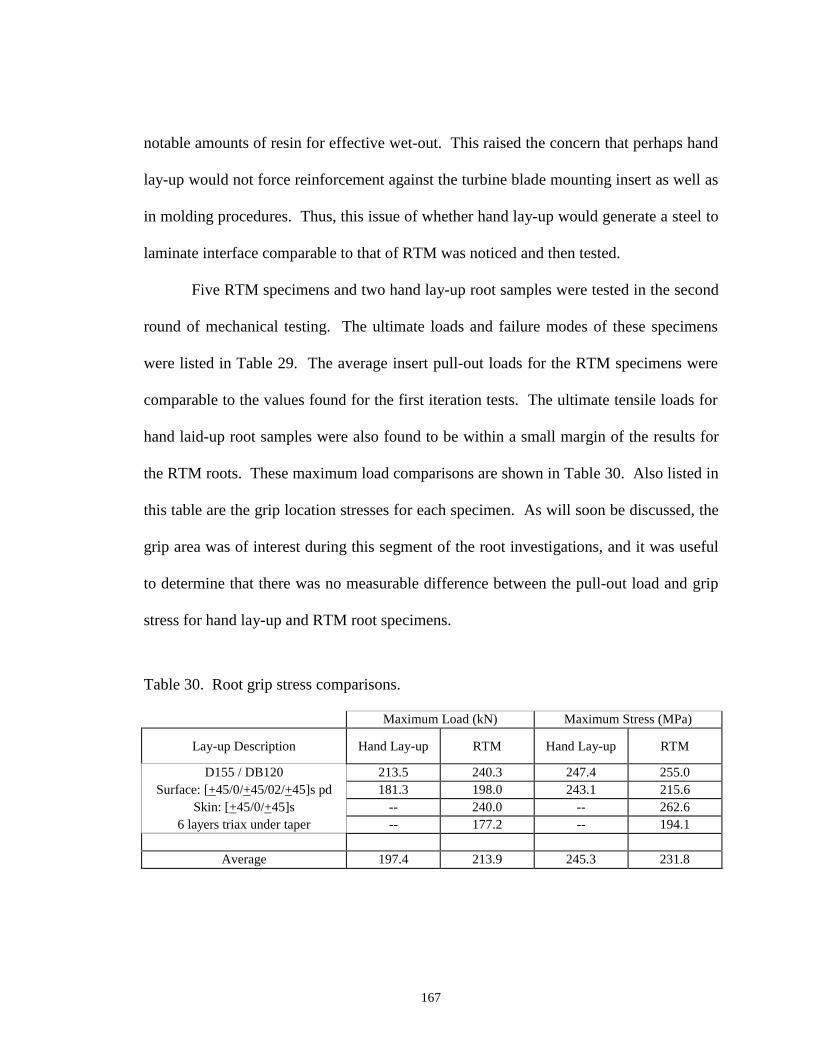
167
notable amounts of resin for effective wet-out. This raised the concern that perhaps hand
lay-up would not force reinforcement against the turbine blade mounting insert as well as
in molding procedures. Thus, this issue of whether hand lay-up would generate a steel to
laminate interface comparable to that of RTM was noticed and then tested.
Five RTM specimens and two hand lay-up root samples were tested in the second
round of mechanical testing. The ultimate loads and failure modes of these specimens
were listed in Table 29. The average insert pull-out loads for the RTM specimens were
comparable to the values found for the first iteration tests. The ultimate tensile loads for
hand laid-up root samples were also found to be within a small margin of the results for
the RTM roots. These maximum load comparisons are shown in Table 30. Also listed in
this table are the grip location stresses for each specimen. As will soon be discussed, the
grip area was of interest during this segment of the root investigations, and it was useful
to determine that there was no measurable difference between the pull-out load and grip
stress for hand lay-up and RTM root specimens.
Table 30. Root grip stress comparisons.
Maximum Load (kN) Maximum Stress (MPa)
Lay-up Description Hand Lay-up RTM Hand Lay-up RTM
D155 / DB120 213.5 240.3 247.4 255.0Surface: [+45/0/+45/02/+45]s pd 181.3 198.0 243.1 215.6
Skin: [+45/0/+45]s -- 240.0 -- 262.66 layers triax under taper -- 177.2 -- 194.1
Average 197.4 213.9 245.3 231.8

168
The adjustments in lay-up between the first and second root specimen
experiments yielded a quite different failure mode during static mechanical testing. In
round one, the predominate failure mode was insert pull-out. Increasing the fiber volume
about the insert resulted in specimens that were most likely to fail in the laminate near the
grip. This failure behavior was observed for five of the seven specimens tested in round
two. A laminate grip failure for root specimen R301 is shown in Figure 88. Failures in
this area were unexpected and to explore this behavior, matrix burn-offs were performed
on the flat grip regions of the hand lay-up and RTM specimens.
The corners of both hand lay-up and RTM specimens required notching to fit into
the static tensile testing apparatus. This provided material to obtain fiber volume data
from. The root specimen fiber volume data is collected with the matrix burn-off results
for the prior geometries in Appendix E. Average fiber volumes for hand lay-up and RTM
specimens in the testing grip area were found to be 29% and 26%, respectively. While
the average hand lay-up fiber volume was within the range found for flat plates, the fiber
volume of the RTM root specimens was under the minimum acceptable fiber volume for
the process of 30%. RTM fiber volumes below the 30% threshold do not yield
composites of comparable strength to other processes and are likely to washout the
reinforcement during processing. Consequently, only fiber volumes above 30% are
typically used for RTM structure designs. Since, it was found that the RTM root
specimens were below this acceptable fiber volume at the tensile grip location, it was
necessary to explore improving its fiber content in a third round of the root experiment
study.

169
Although five of the seven mechanical tests resulted in laminate failure, there is
significant evidence that the fiber volume issues concerning the insert were resolved.
First, visual inspection showed that a better distribution of reinforcement was achieved
and matrix rich regions were minimized (Fig. 87). Secondly, the two specimens of round
two that did not fail near the grips, failed by insert pull-out. The insert pull-out of
specimen R201 is shown in Figure 89. The insert of this specimen illustrates that
improving fiber content near the insert did in fact improve laminate / insert contact.
Noted in Figure 89 are the areas where reinforcement and matrix were removed along
with the insert. This interaction requires notably more energy to achieve failure. As a
result, it was desirable to incorporate this level of interaction between insert and laminate.
These specimens that did fail by insert pull-out demonstrate that the efforts of the second
iteration root experiments were successful.
The objective of the last round of root specimen investigations was to achieve
overall improvement in the fiber content of RTM roots, while still maintaining good wet-
out of the laminate. Eight RTM specimens were manufactured with additional skin and
surface laminate plies. The additional reinforcement improved fiber content, while the
number of specimens provided ample testing possibilities.
The final design lay-ups for the root specimen were [+45/0/0/+45]s for the skin
side of the laminate and [+45/0/+45/0/0/+45]s for the laminate that contours over the
insert surface. The complete lay-up of the root specimen also included the steel insert,
the triaxial fabric ahead and alongside the insert, and two rolled-up fabric darts. Two
RTM specimens with this prescribed lay-up were statically tested in tension during round
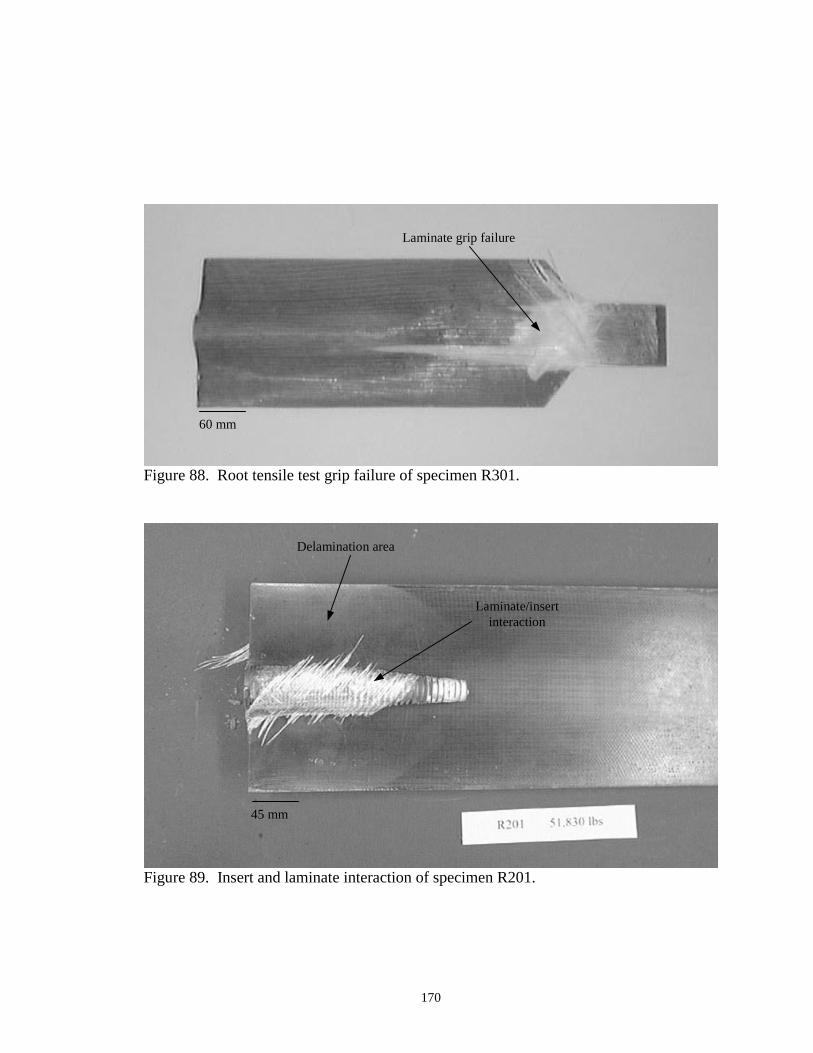
170
Figure 88. Root tensile test grip failure of specimen R301.
Figure 89. Insert and laminate interaction of specimen R201.
45 mm
Delamination area
Laminate/insertinteraction
60 mm
Laminate grip failure

171
three. The average ultimate load for these specimens was 254 kN, the highest average
load of all the root samples tested. In addition, the tensile tests demonstrated that the
failure of the latest root specimens would be for the hub attachment bolts. Delamination
and cracking was observed near the grip during testing. However, ultimate failure
occurred in the 19.1 mm diameter mounting bolts. With a failure load 2.6 times the
maximum load required under extreme wind conditions and a static strength that
surpasses the mechanical performance of the attaching bolts, it was determined that the
final root design exceeds the structural requirements.
It was found that the insert to laminate interaction and fiber volume requirements
were met, as well. Although insert pull-out was not observed for the static test
specimens, the results of the second round root study demonstrated that interactions were
evident. The interactions between steel and composite had potential for improvement as
fiber volumes were further increased with the additional skin and surface plies. Thus, the
interaction between laminate and insert had been maximized with the available
manufacturing techniques. The fiber volumes of the third round specimens also met the
required criteria. RTM root specimen fiber contents averaged about 33% at the grip
location. This was above the minimum RTM fiber volume threshold, and within the
acceptable range.
The final requirement to be satisfied was fatigue performance. The R112
specimen was chosen randomly as the first fatigue candidate to be fatigue tested. These
tests were selected for an R value of 0.1 with loads alternating between 89 kN and 9 kN.
Under this testing scenario, specimen R112 experienced 120,317 fatigue cycles and four

172
broken insert mounting apparatuses. As was observed during the static tests, the insert
bolts were weaker than the root specimens. This was especially evident for the fatigue
test. Consequently, the testing procedure involved fatiguing the specimen until mounting
apparatus failure, recording the number of cycles, replacing mounting hardware, and then
continuing the experiment. This methodology was followed to find the 120,317 fatigue
cycle results of specimen R112. After this number of cycles the unbroken root sample
was removed from the testing equipment and sectioned to determine what damage was
evident. Shown in Figure 90 is a cross section of the insert and laminate of root specimen
R112. It can be observed from this figure that there were a few cracks generated during
the sectioning process, however no visible damage was apparent in this section after its
fatigue testing.
The 120,317 cycles this specimen survived in fatigue corresponds to an actual hub
insert being loaded to 214 km/h, 11 times a day over a thirty-year blade lifespan. This
clearly demonstrates that the current root specimen design far exceeds its fatigue
requirements and that the hub to blade joint design is notably robust.
30 mm
Cracks formedduring sectioning
Cracks initiated during cure
Figure 90. Fatigue specimen, R112 cross-section with steel insert.
173
A final note concerning the root specimen: hand lay-up versus RTM comparisons
were limited for this group of experiments. The reason behind the limited work with
hand lay-up is that the process would not be a serious candidate for manufacturing a
complete root mount. Hand lay-up worked adequately on processing a single specimen
and the ultimate loads hand lay-up root samples supported were comparable to those of
RTM specimens. However, processing a complete, oval root section with ten inserts
using hand lay-up, would most likely be beyond its abilities. Hand lay-up works well for
laminates of flat or limited curvature, but would experience a series of difficulties for
more complex geometries. For example, in a complete root joint the hand lay-up process
would introduce complications with fabric lay-up, the wetting out of an oval cross
section, keeping the resin in place, securing the large fabric over complex contours, and
wet lay-up of small sections of reinforcement for transitions. A process like RTM
addresses many of these concerns. An RTM mold for the root assembly would be able to
secure complex, dry, preform reinforcements while also incorporating the mounting
inserts as an integral part of the mold. These features of RTM eliminate the cumbersome
wet lay-ups of individual fabric layers and the difficulty with supporting them during
processing with hand lay-up. As a result of these observations, it did not seem
worthwhile to explore the hand lay-up process as it showed little usefulness in fabricating
the complete root attachment.
174
CHAPTER 5
CONCLUSIONS AND FUTURE WORK
The results for the various evaluations between RTM and hand lay-up are
summarized in this chapter. Physical and mechanical investigation results are presented
for the five geometries that were researched. Finally, the future work items suggested by
this study of hand lay-up and RTM are provided.
Physical Property Study Results
Flat Plate Thickness and Fiber Volume
• Reductions in average thickness and standard deviation were found for all VARTMlaminates when compared to the hand lay-up baseline. Reductions in thickness forVARTM samples were between 0.01 – 1.5 mm for the specimens of this study, whilereductions in standard deviation were between 0.06 – 0.2 mm.
• These reductions in average thickness could result in significant shedding of bladeskin weight (1.5 mm less material correlates to an approximate 16% reduction inweight per hypothetical skin).
• The findings for better dimensional control with RTM suggest that this process iswell suited for achieving the smooth aerodynamic surfaces, the tight tolerancesbetween substructure assemblies, and the aggressive airfoil designs desired formodern turbine blades.
• Glass RTM mold surfaces may be beneficial in monitoring flow fronts, but are easilydeflected under normal RTM injection pressures. Mold reinforcement and post-injection venting assist in minimizing glass deflections.

175
• The majority of the fabric and lay-up combinations investigated in this study showedsignificant statistical differences in fiber volume and average thickness. Only theD155/DB120 [0/+45/0]s flat plate laminates manufactured by hand lay-up and RTMshowed no statistical differences in fiber volume and average thickness.
• The flat plate research demonstrated a maximum attainable fiber volume fraction ofapproximately 35% for hand lay-up laminates. Physical property research alsoshowed that RTM fiber contents are controlled by the reinforcement types andmolding assemblies. The RTM process is possible of achieving fiber volumecontents in excess of 70%, in certain applications [7].
• Thickness to fiber volume correlations for composite materials can be beneficial tofuture designers and are recorded for the flat plate and three-dimensionalsubstructures explored in this study.
Substructure Thickness and Fiber Volume
• Thickness of substructure laminates varied similar to the findings for flat plates, butthe greatest increases in cross-sectional area were due to transition radii and bondthicknesses.
• Transition radii of 2 mm and less were attainable with RTM, while the sharpest radiusfound for hand lay-up components was 6 mm.
• Transition radii and bond line thicknesses for hand laid-up substructures resulted incross-sectional area increases of 10 - 42%, when compared to the same geometriesmanufactured by RTM.
• Significant reductions in weight would be observed for turbine blade substructures ifRTM were substituted as the manufacturing process of choice.
• Small variations in root specimen weight are suspected to have little effect on bladerotational inertia and turbine efficiency.
Fabrication Times
• For all of the geometries researched, reductions in cycle times were observed forRTM fabrications when compared to hand lay-up (10 – 60 minutes time savings).
• The addition of a root insert in a composite laminate complicated mold fabricationand use. This was found to decrease the benefits the RTM process had on reducingcycle time.

176
• Fabrication time reductions with RTM were greater as part complexity and sizeincreased, when compared to hand lay-up. For example, flat plate specimensexperienced a 14% difference in fabrication time according to process, while I-beamcycle times varied by approximately 54%.
• Cure time was detrimental to hand lay-up manufacturing speed. RTM moldings canbe elevated in temperature and co-cured, whereas hand lay-up operations are moredifficult to heat during cure. Complex hand lay-up geometries also require secondarybonding and bond material curing.
• The ability to elevate resin temperatures can greatly decrease cycle times in an RTMproduction environment. Resins at elevated temperatures permeate preforms fasterduring injection and cross-link more quickly after mold fill than the same RTMinjections performed at ambient temperatures.
CT Scan Results
• At the present time, there exists a need for a convenient and accurate means tomeasure porosity in composite materials.
• Computed Tomography (CT) scanning technology was identified as a viable meansfor measuring laminate porosity. During this study, it was found that calibration ofthe digital images generated by CT methods with another porosity measuring processwas required.
• Microscopic inspection was chosen to calibrate the CT technique. Micrographsshowed average porosities of 2.4% for hand lay-up, 3.2% for RTM at the vent, 0.5%for RTM near the inlet port, and less than 0.5% for VARTM.
• The current CT porosity measurements found that the average pore contents for handlay-up flat plates, RTM flat plates, RTM T-stiffeners, and RTM I-beams were allapproximately 3%. This result suggests that that the CT method needs furtherrefinement.
RTM Mold Review
• Reviewing the molds of this study found that tools with toggle clamps, multiple,chemically inert seals, and matched mating surfaces would reduce cycle time and partquality.

177
• For full-scale blade RTM components, steel reinforced, composite tooling isrecommended. This tool design is the most cost and time effective, in addition tobeing able to take advantage of the previously mentioned benefits.
Flat Plate Testing
Transverse Tension
• Thickness variations according to processing method were found to bias strengthresults for flat plate testing. As a result, normalizing techniques were introduced tocompare samples at an identical fiber volume (30% for this study).
• The fiber volume contents of the [0/0/+45/0]s laminates exceeded the 5% rangetypically allowed for linear thickness normalizing. The significant differences infiber content complicated process comparisons for the eight ply laminates.
• Improvements in ultimate transverse tensile strength (UTTS) were between 13% and33% for the VARTM specimens of this study, when compared to hand lay-upsamples.
• Most fabric and lay-up combinations did not show significant differences in UTTSaccording to process. Statistical differences were observed only for the normalizedUTTS results of the A130/DB120 [0/+45/0]s specimens.
• Significant differences in transverse tensile modulus were found for the [0/0/+45/0]sflat plates according to process (23 – 34% difference between hand lay-up andVARTM). Differences in average transverse modulus between processes were 2 –6% for the [0/+45/0]s specimens.
• The range of data found for transverse initial damage strain was broad for allspecimen types tested. However, statistical improvements in the onset of initialfracture were observed for D155/DB120 [0/+45/0]s and A130/DB120 [0/0/+45/0]scomposites.
• Transverse strain to failure data was also scattered, and did not demonstratesignificant differences according to process.
178
Compression
• Ultimate compressive strengths (UCS) for laminates using D155 unidirectionalmaterial were 50% greater than those strengths found for composites with A130material. This agreed with previous experimental findings by Samborsky [50].
• For the specimen types utilized in this study, VARTM averaged 7% to 21% greaterUCS when compared to similar samples manufactured by hand lay-up.
• The [0/+45/0]s laminates of this study did not show any statistical differences innormalized UCS. The [0/0/+45/0]s hand lay-up specimens demonstrated a greaternormalized UCS over their VARTM counterparts. This behavior was explained bythe greater thicknesses introduced by hand lay-up processing and the resultantimprovements in buckling resistance.
Three-Point Bending
• Fabric type played a significant role in three-point bending ultimate load. Laminateswith A130 reinforcement failed at forces 25 - 38% below those for identical laminateswith D155 unidirectional fabric.
• The bending specimen failure behavior was also noted to vary according to fabrictype. Samples with A130 fabric were observed to delaminate entirely on thecompression side of the specimen. Similar laminates using D155 reinforcementshowed signs of damage on both surfaces of the specimen, with the majority of thedelamination occurring on the tensile side of the specimen.
• A 24% increase in calculated ultimate bending strength was found for D155/DB120[0/0/+45/0]s specimens using small displacement approximations. No statisticaldifference was found between the other specimen types.
• An increase in average bending stiffness was observed for all hand lay-up laminates.This was accounted for by the improvements in moment of inertia due to increasedlaminate thicknesses.
• Improvements in laminate fiber content with RTM versus hand lay-up were found toincrease flexural modulus. Results of the three-point bending tests showimprovements in bending modulus of 7 – 17% for the [0/+45/0]s samples and 10 –48% for the [0/0/+45/0]s specimens, manufactured by RTM.

179
Longitudinal Tension
• Flat plate laminates with A130 fabric yielded ultimate axial tensile strengths (UTS)16 – 19% below the ultimate strengths found for the same lay-ups using D155reinforcement. These findings agree with previous composites mechanical strengthresearch [50].
• The UTS did not demonstrate distinctions between process for the [0/+45/0]s lay-upstested. UTS did distinguish between hand lay-up and VARTM for [0/0/+45/0]s flatplates, however.
• Normalized UTS results showed a statistical difference between methods ofmanufacture for A130/DB120 [0/0/+45/0]s laminates only. Even the difference forthis set of samples was small, however, with a resultant P value of 0.03.
• For the two lay-ups explored in this study, laminates with A130 fabric experienced a9 – 18% reduction in longitudinal tensile modulus, when compared to similar sampleswith D155 fabric.
• No statistical differences in longitudinal tensile moduli were observed between[0/+45/0]s flat plate composites manufactured by hand lay-up and VARTM.Significant differences in moduli were noted between manufacturing methods for[0/0/+45/0]s specimens.
Fatigue
• Differences in average fatigue life were not significant between hand lay-up andVARTM specimens of [0/+45/0]s lay-up.
• The greater thicknesses of the hand lay-up A130/DB120 [0/+45/0]s specimensunfairly biased the first attempt at fatigue cycle results (similar stress loadingcorrelated to significantly higher forces for hand lay-up specimens).
• The second round fatigue life measurements for the A130/DB120 hand lay-up andVARTM samples, where identical testing forces were employed, showed nostatistical difference between processes.
A summary of the percent differences in average mechanical properties between
hand lay-up and VARTM for all the flat plate specimens tested in this study is presented
in Table 31:

180
Table 31. Summary of flat plate mechanical property comparisons in average values between VARTM and hand lay-up
Percent difference between VARTM and hand lay-up (%)[0/+45/0]s [0/0/+45/0]s
Mechanical Property D155 A130 D155 A130
Ultimate transverse tensile strength 13 23 32 27Normalized ult. transverse strength 5 19 -- --Transverse tensile modulus 6 2 34 23Transverse strain at initial damage 18 9 0 10Transverse strain to failure 21 -- -- --
Ultimate compressive strength 12 10 21 8Normalized ult. comp. strength 5 3 -- --
Three point bending maximum stress 3 (2) 24 2Flexural modulus 7 17 48 10
Ultimate tensile strength 1 10 32 19Normalized ultimate tensile strength 3 4 1 4Tensile modulus (3) 5 26 14
Fatigue life (R: -1) nd nd -- --( ) - denotes hand lay-up outperformed VARTMnd - no measurable difference between fatigue lifetimes
RTM Flat Plate Washout
• Fabric washout injection pressures data are useful to the composites manufacturer.Employing injection pressures slightly less than those required for washout willoptimize the cycle speeds for the RTM process.
• Fabric architecture was an important parameter in the washout study. Laminates thatincluded D155 unidirectional washed out at greater injection pressures than sampleswith A130 fabric, for a variety of lay-ups and injection locations.
• RTM injections where resin is fed into the perimeter of the mold should be avoided tominimize fabric washout. The findings of the current washout study show that thepressure required to washout identical reinforcements is less when injected from anend as opposed to the center of the reinforcement.
181
• Increased fiber content was found to improve a lay-up schedule’s resistance to fabricwashout.
• For the limited tests conducted, vacuum-assist effects introduced to the RTM processappear to reduce the injection pressure required to washout reinforcement.
Thin Flanged T-stiffener Mechanical Testing
• Unidirectional fabric type, bond interface, and material processing seemed to havelittle influence on initial damage, stiffness, and maximum pull-off load properties ofthe T-stiffeners tested.
• Typical hand lay-up fabrications resulted in specimens of greater moment of inertiawhen compared to similar samples manufactured by RTM and had increasedperformance under mechanical loading.
• Thickness variations presented a problem for the thin flanged T-stiffener specimensstudied. Compressible gasket/spacer materials in the T-mold did not yield identicaldimensions between specimens and adversely effected structural performance.
• A variety of failure modes were observed for the T-stiffener pull-off tests. This wasattributed to the unique dimensions and processing of each sample tested.
Thick Flanged T-stiffener and I-beam Testing
• The thick flanged T-specimens were not mechanically tested. However, the thinflanged T-stiffener results already demonstrated, that differences in geometry andmoment of inertia would be the determining factors for mechanical strength.
• I-beams of the current lay-up schedule manufactured by the hand lay-up processwould be complicated to test mechanically. The I-beams were excessively massive,difficult to assemble, and were not similar in moment of inertia when compared to theRTM beams. Comparing dissimilar specimens would not further the current processevaluations, and consequently, I-beams were excluded from mechanical testing.
Root Specimen Mechanical Testing
• Research experiments with the root specimen attempted to illustrate some importantissues with composite tooling and to develop a laminate architecture that would bebeneficial to the complete root joint developments.

182
• The requirements the final root insert design had to meet were:
− Support ultimate load of 98 kN under maximum wind load condition [3].− Demonstrate good interaction between mounting insert and root laminate.− Maintain fairly consistent fiber volume throughout root specimen.− Sustain a reasonable fatigue life at cycle loads approximating the maximum wind
condition.
• First round results demonstrated that low fiber volumes existed about the insert, D155fabric worked best for wetting-out the root samples, ultimate failure loads were 2.3times the maximum wind load condition, and failure modes were predominatelyinsert pull-out.
• The second round of root research focused on improving fiber volume near the steelinsert and comparing root specimens according to process. A total of nine sampleswere manufactured for these studies.
− Vacuum-assisted RTM was attempted on a number of samples, yet wasunsuccessful due to the limited vacuum integrity of the root tool.
− Visual inspection demonstrated that the 38 mm wide strips of triaxialreinforcement were adequate in addressing the previous concerns with insert areafiber volume.
− The second round static tensile tests of the root specimens showed that theultimate loads of RTM samples would be 2.3 times the maximum wind loadcondition and that the failure mode would be delamination near the testing grip.
− No significant differences were found between hand lay-up and VARTMaccording to root ultimate tensile load or maximum testing grip stress.
− Fiber volumes at the root testing grip were found to be 29% and 26% for handlay-up and RTM, respectively.
− A 26% fiber volume for RTM specimens was unacceptable. RTM parts aretypically manufactured with fiber contents above and beyond 30% [6].
• The third round root investigations strove to improve the overall fiber content ofRTM specimens and to determine the current laminate’s fatigue strength.
− A total of eight specimens were manufactured and two of the RTM roots weretested statically. Ultimate failure loads were 2.6 times the maximum windcondition loading. Some delamination was observed near the laminate grip, but

183
ultimate failure was observed in the 19.1 mm testing bolt and not in the compositespecimen.
− Additional plies in the skin and surface laminates improved RTM root fibervolume. Matrix burn-off tests near the grip showed that the average fiber contentwas 33%.
− A root fatigue test with an R value of 0.1 and a maximum load of 89 kN yielded afatigue life of 120,317 cycles. Four bolt support apparatuses failed during thecourse of the fatigue test. In addition, the specimen was sectioned after testingand no delamination damage was found.
− The root fatigue results, yielding a 120,317 cycle lifetime, is equivalent to a rootspecimen seeing the 214 km/h maximum wind load condition, 11 times a day fora 30 year blade lifetime. This information strongly suggests a high level offatigue resistance for the current root design.
− All manufactured specimens surpassed the wind turbine blade’s design limit load,and the third round of testing demonstrated that the weak link at the hub joint willbe the blade mounting fasteners.
• Hand lay-up root specimens were not as aggressively pursued as in the experimentsfor the previous geometries. This was due to the limited applicability of hand lay-upto a complete turbine blade root structure.
Future Work
Flat Plates
• Further investigations into alternative warp, unidirectional fabrics may yield areinforcement that significantly outperforms the current A130 fabric for laminatecompressive and bending properties in turbine blade applications.
• Comparisons in fatigue performance between hand lay-up and RTM flat plates shouldbe expanded with further variations in fiber volume, lay-up, and fabric type.
• Minimizing the use of gaskets that also serve as spacing materials would be beneficialto future resin transfer moldings. Combination gasket/spacers are poor indimensional repeatability, can undesirably effect fiber volume, and contribute tocomplications with maintaining vacuum integrity.
184
• The current VARTM flat plate mold could benefit from an additional O-ring seal.Modern vacuum-assisted RTM molds take advantage of multiple seals to guaranteevacuum integrity. An additional seal would ease manufacturing and improve thequality of composite flat plates.
• CT methods should be applied to smaller sample sizes and scanned at higherresolutions. This might resolve the issues with CT imaging that were raised in thiswork.
• Computed Tomography methods might be instrumental in other areas of compositeanalysis. Particularly, the issues of crack propagation and fiber content might bebenefited by this non-destructive test method.
Substructures
• Current work was primarily directed towards constant cross-section specimens.Future work could include research on the varying cross-sections of current turbineblade designs in an effort to approximate weight savings more accurately.
• The use of spray adhesives in fabricating reinforcement preforms needs investigation.It was observed that some preforming strategy is required for complex substructuresand spray adhesives may prove successful, if they do not adversely affect themechanical performance of fiberglass composites.
• Substructures could also be used to explore the advanced features of RTM with theRadius injector. Elevated injection and tool temperatures were not explored in thecurrent work, but could be included in further research.
• Additional research into thick versus thin subassemblies should be conducted. Futurework in comparing manufacturing techniques could help to separate geometricaleffects versus material performance. This is especially needed for laminates that areflexurally loaded.
• Hand lay-up I-beams should be assembled and tested. The assembly challenges andstructural performance of hand lay-up I-beams should be noted and compared tosimilar beams manufactured by RTM.
Full-Scale Turbine Blade
• Cost can be one of the primary determining factors in selecting the RTM process forwind turbine blade fabrication. It would be informative to explore the role cost playsin subassembly and full-scale turbine blade manufacturing.

185
• Polyester secondary bond performance could be tested – this would set the standardsfor bonding polyester to polyester in areas on the wind turbine blade, i.e. the leadingedge tabs.
• Experiments with molded syntactic foam cores might illustrate the advantages of atailorable (thickness and weight) core material over conventional balsa wood core.
• Specimens of a complete root connection assembly require investigation. Thiscritical structure design could also benefit from research into insert/fiberglassinteraction, manufacturing laminates of great thickness in a continuous cross-section,and the strength of blade components containing such a large amount of concentratedmass.
• The data acquisition feature of resin flow position sensing was not tested in thecurrent manufacturing evaluation. Yet, the use of this equipment could prove veryuseful in RTM developments with full-scale blades. The Radius resin positionsensors would assist in monitoring flow fronts in composite tools where flow frontscannot be observed through the mold surfaces.
186
REFERENCES CITED
1. Mallick, P.K., Fiber-Reinforced Composites, Marcel Dekker, Inc., New York, 1988.
2. Owens Corning Fiber Pricing vs. Weight Performance List,www.owenscorning.com/owens/composites/, 1999.
3. Cairns, D.S., et al., “Design/Manufacturing Synthesis of a Composite Blade for theAOC 15/50 Wind Turbine,” Proceedings of 37th AIAA Aerospace Sciences Meetingand Exhibit, 1999 ASME Wind Energy Symposium, Reno, NV, 11-14 January, 1999,AIAA/ASME, NY, 1999, 58-65.
4. Potter, K., An Introduction to Composite Products, Chapman & Hall, UK, 1997.
5. Mandell, J.F., Sutherland, H.J. and Samborsky, D.D., “ Effects of MaterialsParameters and Design Details on the Fatigue of Composite Materials for WindTurbine Blades,” Proceedings of 1999 European Wind Energy Conference andExhibition, Nice, France, 1-5 March, 1999, WIP-Munich, Germany, 1999.
6. Schwartz, M.M., Composite Materials – Processing, Fabrication, and Applications,Prentice Hall PTR, New Jersey, 1997, Vol. 2.
7. Swanson, S.R., Introduction to Design and Analysis with Advanced CompositeMaterials, Prentice Hall, New Jersey, 1997, 16.
8. Cairns, D.S., Humbert, D.R., and Mandell, J.F., “Modeling of Resin TransferMolding of Composite Materials with Oriented Unidirectional Plies,” Composites:Part A 30 (1999), Elsevier Science Limited, Great Britain, 1999, 375-383.
9. Lekakou, C. and Bader, M.G., “Mathematical Modeling of Macro- and Micro-Infiltration in Resin Transfer Molding (RTM),” Composites: Part A 29A (1998),Elsevier Science Limited, Great Britain, 1997.
10. Patel, N. and Lee, L.J., “Effect of Capillary Pressure on Mold Filling and FiberWetting in Liquid Composite Molding,” Proceedings of ASM/ESD 10th AnnualAdvanced Composites Conference, Dearborn, MI, USA, 7-10 November, 1994,ASM/ESD, Materials Park, OH, 325-333.
11. Parnas, R.S., et al., “The Interaction Between Microscopic and Macroscopic Flow inRTM Preforms,” Composite Structures, 1994, 27(1-2), 93-107.

187
12. Fontana, Q.P.V., “Viscosity: Thermal History Treatment in RTM ProcessModelling,” Composites Part A 29A (1998), Elsevier Science Limited, Great Britain,1997.
13. Young, W-B. and Lai, C-L., “Analysis of Edge Effects in Resin Transfer Molding,”Composites Part A 28A (1998), Elsevier Science Limited, Great Britain, 1997, 817-822.
14. Lai, C-L., Khomami, B. and Kardos, J.L., “Accurate Permeability Characterization ofPreforms in Polymer Matrix Composite Fabrication Processes,” Polymer Composites,June 1997, Vol. 18, No. 3, 368-377.
15. Friedman, H.L., et al., “Forced In-Plane Flow Through Complex DeformableStructures: Influence of an Imposed Curve,” Polymer Composites, October 1997, Vol.18, No. 5, 663-671.
16. Lundstrom, T.S., “Bubble Transport Through Constricted Capillary Tubes WithApplication to Resin Transfer Molding,” Polymer Composites, December 1996, Vol.17, No. 6, 770-779.
17. Summerscales, J., “Manufacturing Defects in Fiber-Reinforced Plastic Composites,”Insight, 1994, 36(12), 936-942.
18. Hayward, J.S. and Harris, B., “Effect of Process Variables on the Quality of RTMMoldings,” SAMPE Journal, 1990, 26, 39-46.
19. Hayward, J.S. and Harris, B., “The Effect of Vacuum Assistance in Resin TransferMolding,” Composites Manufacturing, 1990, 1, 161-166.
20. Chan, A.W. and Morgan, R.J., “Tow Impregnation During Resin Transfer Moldingof Bidirectional Nonwoven Fabrics,” Polymer Composites, 1993, 14(4), 335-340.
21. Lowe, J.R., Owen, M.J. and Rudd, C.D., “Void Formation in Resin TransferMolding,” Proceedings of ICAC 95, Nottingham, 1995, Institute of Materials,London.
22. Springer, G.S., “A Model of the Curing Process of Epoxy Matrix Composites,”Proceedings of ICCM 4, Tokyo, October 1982, North Holland Publishing Co.,Amsterdam, Vol. 1, 23-25.
23. Loos, A.C. and Springer, G.S., “Curing of Epoxy Matrix Composites,” Journal ofComposite Materials, 1983, 17(2), 135-169.
188
24. Kardos, J.L., et al., “Void Formation and Transport During Composite LaminateProcessing,” ASTM STP, 1983, 797, 96-109.
25. Kardos, J.L., Dave, R. and Dudukovic, M.P., “Void Growth and Resin TransportDuring Processing of Thermosetting Matrix Composites,” Advances in PolymerScience, 1986, 80(4), 101-123.
26. Kardos, J.L., Dave, R. and Dudukovic, M.P., “Voids in Composites,” ManufacturingInternational, 1988, (IV), 41-48, Proceedings of Manufacturing Science ofComposites, ASME, Atlanta, April 1988.
27. Holmberg, J.A. and Berglund L.A., “Manufacturing and Performance of RTM U-Beams,” Composites Part A 28A (1998), Elsevier Science Limited, Great Britain,1997, 513-521.
28. Branco, C.M., et al., “A Comparative Study of the Fatigue Behavior of GRP HandLay-up and Pultruded Phenolic Composites,” Int. J. Fatigue Vol. 18, No. 4, ElsevierScience Limited, Great Britain, 1996, 255-263.
29. Holmberg, J.A. and Berglund L.A., “Micromechanisms of Delamination Failure inRTM U-Beams,” Composites Part A 28A (1998), Elsevier Science Limited, GreatBritain, 1997, 709-717.
30. Hinrichs, R.J., “Quality Control”, Engineered Materials Handbook Volume 1,Composites, Dostal, C.A. ed., ASM International, 1987.
31. ANSYS (Revision 5.4), Engineering Analysis System, Swanson Analysis SystemsInc., Houston, Pennsylvannia.
32. Simacek, P., Sozer, E.M., and Advani, S.G., Liquid Injection Molding Simulation(Revision 4.0), User’s Manual, University of Delaware Center for CompositeMaterials, Newark, Delaware, February, 1998.
33. Hedley, C.W., “Mold Filling Parameters in Resin Transfer Molding of Composites,”Master’s Thesis, Montana State University-Bozeman, 1994.
34. Pearce, N.R.L, et al., “An Investigation into the Effects of Fabric Architecture on theProcessing and Properties of Fiber Reinforced Composites Produced by ResinTransfer Molding,” Composites: Part A 29A (1998), Elsevier Science Limited, GreatBritain, 1997.
35. Pearce, N.R.L., et al., “Optimization of Reinforcement Fabrics for the Resin TransferMolding of High Fiber Volume Fraction Composites,” Proceedings of 17th
International Conference, SAMPE European Chapter, Basel CH. 28-30, May 1996.

189
36. Yu, H-W., Young, W-B., “Optimal Design of Process Parameters for Resin TransferMolding”, Journal of Composite Materials, Vol. 31, No. 11, Technomic PublishingCo., 1997.
37. Pearce, N.R.L., et al., “A Study of the Effects of Convergent Flow Fronts on theProperties of Fiber Reinforced Composites Produced by RTM,” Composites Part A29A (1998), Elsevier Science Limited, Great Britain, 1997.
38. Lundstrom, T.S., et al., “Void Formation in RTM,” Proceedings of SPI CompositeInstitutes 47th Annual Conference, Cincinatti, 1992, SPI, New York.
39. Bowles, K.J. and Frimpong, S., “Void Effects on the Interlaminar Shear Strength ofUnidirectional Graphite Fiber-Reinforced Composites, Journal of CompositeMaterials, 1992, 26, 1487-1509.
40. Judd, N.C.W. and Wright, W.W., “Voids and their Effects on the MechanicalProperties of Composites – an Appraisal,” SAMPE Journal, 1978.
41. Ghiorse, S.R., “Effect of Void Content on the Mechanical Properties ofCarbon/Epoxy Laminates,” SAMPE Quarterly, 1993.
42. Stone, D.E.W. and Clarke, B., “Ultrasonic Attenuation as a Measure of Void Contentin Carbon-Fiber Reinforced Plastics,” Non-Destructive Testing, 1975.
43. Shenoi, R.A. and Wellicome, J.F., “Composite Materials in Marine StructuresVolume 1: Fundamental Concepts,” Cambridge University Press, Cambridge, UK,1993.
44. Varna, J., et al., “Effect of Voids on Failure Mechanisms in RTM Laminates,”Composite Science and Technology, 1995, 53, 241-249.
45. Rosell, S.M., Interim Master’s Thesis Work (to be published), Montana StateUniversity-Bozeman, 1999.
46. Haugen, D.J., “Fracture of Skin-Stiffener Intersections in Composite Wind TurbineBlade Structures,” Master’s Thesis, Montana State University-Bozeman, 1998.
47. Mandell, J.F., et al., “Fatigue of Composite Material Beam Elements Representativeof Wind Turbine Blade Substructure,” NREL/SR-500-24379, National RenewableEnergy Laboratory, Golden, CO, November, 1998.

190
48. Mandell, J.F. and Samborsky, D.D., “DOE/MSU Composite Material FatigueDatabase: Test Methods, Materials, and Analysis,” Contractor Report SAND97-3002,Sandia National Laboratories, Albuquerque, NM, 1997.
49. Fox, E., et al., SigmaStat Statistical Software for Windows (Revision 1.0), User’sManual, Jandel Scientific, CA, 1994.
50. Samborsky, D.D., Interim Master’s Thesis Work (to be published), Montana StateUniversity-Bozeman, 1999.
51. Hedley, C.W., CEO of Headwaters Composites, personal communication, June,1999.
52. Hull, D. and Clyne, T.W., An Introduction to Composite Materials, CambridgeUniversity Press, Great Britain, 1996.
53. Kawamura, T., “Nondestructive, Three-Dimensional Density Measurements of IceCore Samples by X Ray Computed Tomography,” Journal of Geophysical Research,Vol. 95, August, 1990.
54. Edens, M., Post-Doctorate Research Engineer – MSU, private communication, July,1999.
55. Reifsnider, K.L., Fatigue of Composite Materials, Elsevier Science PublishingCompany, Inc., New York, 1991, 30-38.
56. Broek, D., Elementary Engineering Fracture Mechanics (Third Edition), MartinusNijhoff Publishers, Netherlands, 1983.
57. Composite Mold Fabrication Guide, Glas-Craft/RTM Systems Inc., 1998.

191
APPENDICES

192
APPENDIX A
Flat Plate Experimental Data and Results

FP410 Mechanical Testing RTM [0/+45/0]s D155 / DB120
Transverse TensionThickness Width Modulus First Fracture Ultimate Fail
(mm) (mm) (GPa) (% strain) (lbs)410.01 3.00 27.81 9.81 0.27 1468410.02 3.05 27.61 10.16 0.26 1480410.03 3.00 27.53 9.72 0.30 1551410.04 3.05 27.58 10.24 0.29 1468410.05 3.10 27.58 10.01 0.29 1525410.06 3.00 27.74 9.34 0.31 1500
Compression410.12 3.07 27.76 -- -- 12100410.13 3.18 27.43 -- -- 11110410.14 3.20 27.89 -- -- 11440410.15 3.23 27.66 -- -- 10810410.16 3.23 27.53 -- -- 10940
FP411 Mechanical Testing RTM [0/+45/0]s D155 / DB 120
Transverse TensionThickness Width Modulus First Fracture Ultimate Fail
(mm) (mm) (GPa) (% strain) (lbs)411.01 3.12 26.83 9.95 0.29 1395411.02 2.93 26.88 10.36 0.29 1312411.03 2.97 26.91 10.09 0.31 1415411.04 3.13 26.87 10.07 0.31 1393411.05 3.00 26.95 10.06 0.30 1310411.06 3.04 26.76 9.34 0.30 1352411.07 3.00 26.96 9.41 0.30 1339411.08 3.04 26.85 9.85 0.29 1384
Compression411.17 3.21 26.31 -- -- 8980411.18 3.25 26.63 -- -- 8936411.19 3.29 26.74 -- -- 8939411.20 3.28 26.42 -- -- 8744411.21 3.08 26.87 -- -- 8450411.22 3.14 26.87 -- -- 8687411.23 3.11 26.76 -- -- 8437411.24 3.18 26.89 -- -- 8732
Sample No.
Sample No.

FP620 Mechanical Testing VARTM [0/0/+45/0]s D155 / DB120
Transverse TensionThickness Width Modulus First Fracture Ultimate Fail
(mm) (mm) (GPa) (% strain) (lbs)620.01 3.38 27.56 13.29 0.21 1502620.02 3.12 27.36 14.31 0.19 1482620.03 3.05 27.23 14.43 0.15 1414620.04 3.28 27.46 13.48 0.17 1459620.05 3.30 27.36 13.32 0.16 1530620.06 3.02 27.46 15.04 0.16 1390
Compression620.12 3.23 27.36 -- -- 14850620.13 3.25 27.25 -- -- 15130620.14 3.30 27.36 -- -- 15300620.15 3.25 27.36 -- -- 15190620.16 3.23 27.28 -- -- 14110
Tension620.17 3.44 21.75 32.8 1.03 15180620.18 3.34 21.66 34.8 1.00 15211620.19 3.20 21.60 36.1 0.94 14880620.20 3.41 21.74 33.6 0.69 15140620.21 3.30 21.71 34.6 0.95 15580
FP621 Mechanical Testing VARTM [0/0/+45/0]s A130 / DB120
Transverse TensionThickness Width Modulus First Fracture Ultimate Fail
(mm) (mm) (GPa) (% strain) (lbs)621.01 3.20 27.53 11.36 0.28 1564621.02 3.23 27.51 11.46 0.28 1624621.03 3.18 27.51 11.87 0.27 1562621.04 3.15 27.51 11.83 0.26 1677621.05 3.20 27.41 12.20 0.26 1600621.06 3.20 27.46 11.32 0.29 1630
Compression621.12 3.35 27.51 -- -- 7374621.13 3.38 27.38 -- -- 7300621.14 3.33 27.41 -- -- 7827621.15 3.25 27.25 -- -- 8150621.16 3.18 27.18 -- -- 7121
Tension621.17 3.35 21.49 30.0 1.44 12390621.18 3.50 21.73 28.3 1.45 12440621.19 3.34 21.45 27.4 1.48 12300621.20 3.36 21.45 29.2 1.32 12630621.21 3.55 21.44 25.8 1.42 12315
Sample No.
Sample No.

FP702 Mechanical Testing HL [0/+45/0]s D155 / DB120
Transverse TensionThickness Width Modulus First Fracture Ultimate Fail
(mm) (mm) (GPa) (% strain) (lbs)702.01 3.68 27.76 10.43 0.26 1343702.02 3.38 28.14 9.40 0.24 1321702.03 3.33 28.09 10.00 0.25 1244702.04 3.56 28.02 9.98 0.27 1277702.05 3.28 27.94 8.99 0.26 1310702.06
Compression702.12 3.25 28.02 -- -- 11450702.13 3.15 28.02 -- -- 12680702.14 3.12 28.02 -- -- 12790702.15 3.07 27.79 -- -- 12250702.16 3.12 27.41 -- -- 12510
Tension702.17 3.33 21.64 24.1 1.46 9990702.18 3.10 21.71 26.6 1.25 10370702.19 3.10 21.67 25.1 1.12 9824702.20 3.32 21.70 24.2 1.25 9538702.21 3.10 21.67 24.5 1.02 9896
FP705 Mechanical Testing HL [0/+45/0]s A130 / DB120
Transverse TensionThickness Width Modulus First Fracture Ultimate Fail
(mm) (mm) (GPa) (% strain) (lbs)705.01 3.20 28.04 9.44 0.27 1318705.02 3.15 28.07 9.47 0.30 1284705.03 3.18 28.09 -- -- --705.04 3.28 28.17 9.36 0.30 1351705.05 3.25 27.97 9.49 0.27 1383705.06
Compression705.12 3.30 27.81 -- -- 6509705.13 3.35 28.19 -- -- 6559705.14 3.28 28.30 -- -- 6683705.15 3.30 28.24 -- -- 5782705.16 3.45 28.07 -- -- 6570
Tension705.17 3.53 21.47 21.3 1.57 8338705.18 3.51 21.60 20.2 1.68 7603705.19 3.40 21.90 19.7 1.78 7968705.20 3.10 22.18 23.0 1.50 8471705.21 3.44 21.60 20.3 1.47 8096
Sample No.
Sample No.

FP714 Mechanical Testing HL [0/0/+45/0]s D155 / DB120
Transverse TensionThickness Width Modulus First Fracture Ultimate Fail
(mm) (mm) (GPa) (% strain) (lbs)714.01 5.28 27.91 8.45 0.22 1398714.02 4.67 28.19 9.46 0.19 1631714.03 4.70 28.27 9.92 0.21 1570714.04 4.70 28.14 9.86 0.17 1607714.05 4.70 28.14 9.63 0.24 1595714.06 5.31 28.22 8.60 0.24 1428
Compression714.12 4.39 28.27 -- -- 17260714.13 4.55 28.22 -- -- 16760714.14 4.67 28.14 -- -- 18560714.15 4.88 28.12 -- -- 17130714.16 5.05 28.30 -- -- 18350
Tension714.17 4.90 21.46 24.7 0.74 14720714.18 4.72 21.47 24.7 1.26 15220714.19 4.61 21.45 26.4 1.01 14300714.20 4.80 21.58 23.6 1.23 15580714.21 5.34 21.54 23.0 0.80 14860
FP710 Mechanical Testing HL [0/0/+45/0]s A130 / DB120
Transverse TensionThickness Width Modulus First Fracture Ultimate Fail
(mm) (mm) (GPa) (% strain) (lbs)710.01 4.01 28.24 9.36 0.28 1707710.02 4.06 28.14 9.22 0.23 1738710.03 5.16 28.07 8.83 0.25 1446710.04 4.22 28.35 8.84 0.22 1692710.05 4.06 28.30 9.20 0.27 1624710.06 5.21 28.22 8.76 0.22 1709
Compression710.12 4.24 27.94 -- -- 8794710.13 3.99 28.07 -- -- 9606710.14 4.29 28.14 -- -- 9278710.15 4.17 27.31 -- -- 7995710.16 3.89 28.02 -- -- 8501
Tension710.17 3.79 21.60 23.3 1.79 11520710.18 3.96 21.61 23.9 1.20 11900710.19 4.23 21.85 23.7 1.31 12040710.20 4.04 21.60 24.6 1.28 12590710.21 4.24 21.84 23.8 1.46 12240
Sample No.
Sample No.

Transverse Tensile Mechanical Testing (Round 2)
[0/+45/0]s D155 / DB120 0.1 in/min 5 points/sec (5 Hz) samplingtensile test #4
FP622 - Radius VARTMThickness Width Modulus First Fracture Ultimate Fail
(mm) (mm) (GPa) (% strain) (lbs)622.01 3.04 27.83 9.29 0.33 1636622.02 3.05 28.03 9.07 0.33 1603622.03 3.05 27.75 9.31 0.35 1593
Average 3.05 27.89 9.19 0.34 1598Std Dev. 0.00 0.20 0.17 0.01 7
FP411 - Radius RTMThickness Width Modulus First Fracture Ultimate Fail
(mm) (mm) (GPa) (% strain) (lbs)411.01 3.01 27.58 9.70 0.29 1355411.02 3.00 27.65 10.03 0.31 1404411.03 3.01 27.73 9.62 0.29 1343
Average 3.01 27.69 9.83 0.30 1374Std Dev. 0.01 0.06 0.29 0.01 43
FP412 - Spartan RTM ** specimens not fully cured and 45 stitching in weft directionThickness Width Modulus First Fracture Ultimate Fail
(mm) (mm) (GPa) (% strain) (lbs)412.01 3.02 27.31 -- -- 747412.02 3.05 27.30 -- -- 739412.03 3.00 27.44 -- -- 818412.04 2.97 27.45 -- -- 776412.05 3.12 27.92 -- -- --412.06 2.93 27.81 -- -- --
Average 3.01 27.58 -- -- 778Std Dev. 0.07 0.27 -- -- 40
FP704 - Hand Lay-upThickness Width Modulus First Fracture Ultimate Fail
(mm) (mm) (GPa) (% strain) (lbs)704.01 3.46 27.63 9.08 0.26 1451704.02 3.49 27.81 9.78 0.27 1567704.03 3.43 27.52 9.86 0.25 1458
Average 3.46 27.67 9.82 0.26 1513Std Dev. 0.04 0.21 0.06 0.01 77
Sample No.
Sample No.
Sample No.
Sample No.
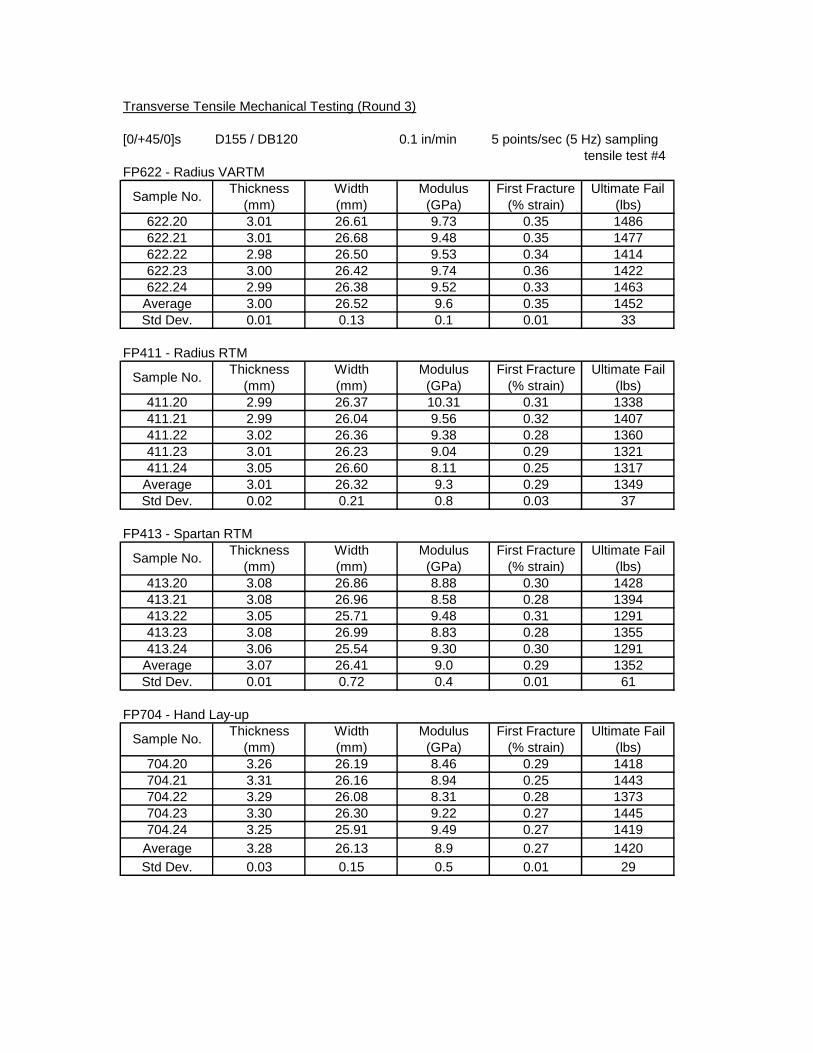
Transverse Tensile Mechanical Testing (Round 3)
[0/+45/0]s D155 / DB120 0.1 in/min 5 points/sec (5 Hz) samplingtensile test #4
FP622 - Radius VARTMThickness Width Modulus First Fracture Ultimate Fail
(mm) (mm) (GPa) (% strain) (lbs)622.20 3.01 26.61 9.73 0.35 1486622.21 3.01 26.68 9.48 0.35 1477622.22 2.98 26.50 9.53 0.34 1414622.23 3.00 26.42 9.74 0.36 1422622.24 2.99 26.38 9.52 0.33 1463
Average 3.00 26.52 9.6 0.35 1452Std Dev. 0.01 0.13 0.1 0.01 33
FP411 - Radius RTMThickness Width Modulus First Fracture Ultimate Fail
(mm) (mm) (GPa) (% strain) (lbs)411.20 2.99 26.37 10.31 0.31 1338411.21 2.99 26.04 9.56 0.32 1407411.22 3.02 26.36 9.38 0.28 1360411.23 3.01 26.23 9.04 0.29 1321411.24 3.05 26.60 8.11 0.25 1317
Average 3.01 26.32 9.3 0.29 1349Std Dev. 0.02 0.21 0.8 0.03 37
FP413 - Spartan RTMThickness Width Modulus First Fracture Ultimate Fail
(mm) (mm) (GPa) (% strain) (lbs)413.20 3.08 26.86 8.88 0.30 1428413.21 3.08 26.96 8.58 0.28 1394413.22 3.05 25.71 9.48 0.31 1291413.23 3.08 26.99 8.83 0.28 1355413.24 3.06 25.54 9.30 0.30 1291
Average 3.07 26.41 9.0 0.29 1352Std Dev. 0.01 0.72 0.4 0.01 61
FP704 - Hand Lay-upThickness Width Modulus First Fracture Ultimate Fail
(mm) (mm) (GPa) (% strain) (lbs)704.20 3.26 26.19 8.46 0.29 1418704.21 3.31 26.16 8.94 0.25 1443704.22 3.29 26.08 8.31 0.28 1373704.23 3.30 26.30 9.22 0.27 1445704.24 3.25 25.91 9.49 0.27 1419
Average 3.28 26.13 8.9 0.27 1420Std Dev. 0.03 0.15 0.5 0.01 29
Sample No.
Sample No.
Sample No.
Sample No.

Compression Mechanical Testing (Round 2)
[0/+45/0]s lay-up D155 / DB120 fabrics 0.5 in/sec 0.5" gauge
FP622 - Radius VARTMThickness Width Area Ultimate Fail
(mm) (mm) (mm^2) (lbs)622.12 3.05 27.52 83.9 11410622.13 3.06 27.47 84.1 11060622.14 3.05 27.04 82.5 12440622.15 3.09 27.32 84.4 11050622.16 3.10 27.72 85.9 10940622.17 3.11 27.66 86.0 11700
FP411 - Radius RTMThickness Width Area Ultimate Fail
(mm) (mm) (mm^2) (lbs)411.12 3.23 27.15 87.7 11190411.13 3.27 27.25 89.1 11710411.14 3.25 27.45 89.2 11650411.15 3.22 27.49 88.5 11750411.16 3.15 27.43 86.4 10620411.17 3.10 27.37 84.8 10820
FP412 - Spartan RTMThickness Width Area Ultimate Fail
(mm) (mm) (mm^2) (lbs)412.12 3.35 26.69 89.4 9556412.13 3.37 27.27 91.9 9362412.14 3.45 27.72 95.6 9678412.15 3.40 27.87 94.8 11260412.16 3.30 27.94 92.2 10430412.17 3.22 27.78 89.5 10770
FP704 - Hand Lay-upThickness Width Area Ultimate Fail
(mm) (mm) (mm^2) (lbs)704.12 3.97 25.59 101.6 10880704.13 3.77 26.14 98.5 10010704.14 3.54 27.51 97.4 11050704.15 3.50 27.51 96.3 11250704.16 3.47 27.70 96.1 11550704.17 3.50 27.66 96.8 10690
Sample No. Comments
Sample No. Comments
Sample No. Comments
Sample No. Comments

Compression Mechanical Testing (Round 3)
[0/+45/0]s lay-up D155 / DB 120 fabrics 0.5 in/sec 0.5" gauge
FP622 - Radius VARTMThickness Width Area Ultimate Fail
(mm) (mm) (mm^2) (lbs)622.30 3.05 26.46 80.7 11390622.31 2.97 26.42 78.5 12100622.32 2.96 26.48 78.4 11970622.33 3.03 26.51 80.3 10880622.34 3.10 26.11 80.9 9429
FP411 - Radius RTMThickness Width Area Ultimate Fail
(mm) (mm) (mm^2) (lbs)411.30 3.01 26.76 80.5 7503411.31 3.00 26.59 79.8 9390411.32 3.08 26.13 80.5 7805411.33 3.03 25.94 78.6 7713411.34 3.06 26.40 80.8 8629
FP413 - Spartan RTMThickness Width Area Ultimate Fail
(mm) (mm) (mm^2) (lbs)413.30 3.04 26.40 80.3 9165413.31 3.11 26.62 82.8 10120413.32 3.17 26.40 83.7 10790413.33 2.97 26.38 78.3413.34 2.97 26.56 78.9 10300
FP704 - Hand Lay-upThickness Width Area Ultimate Fail
(mm) (mm) (mm^2) (lbs)704.30 3.35 25.49 85.4 10630704.31 3.45 26.04 89.8 10220704.32 3.61 26.43 95.4 11680704.33 3.39 26.09 88.4 8829704.34 3.45 26.46 91.3 11760
Sample No. Comments
Sample No. Comments
Sample No. Comments
Sample No. Comments
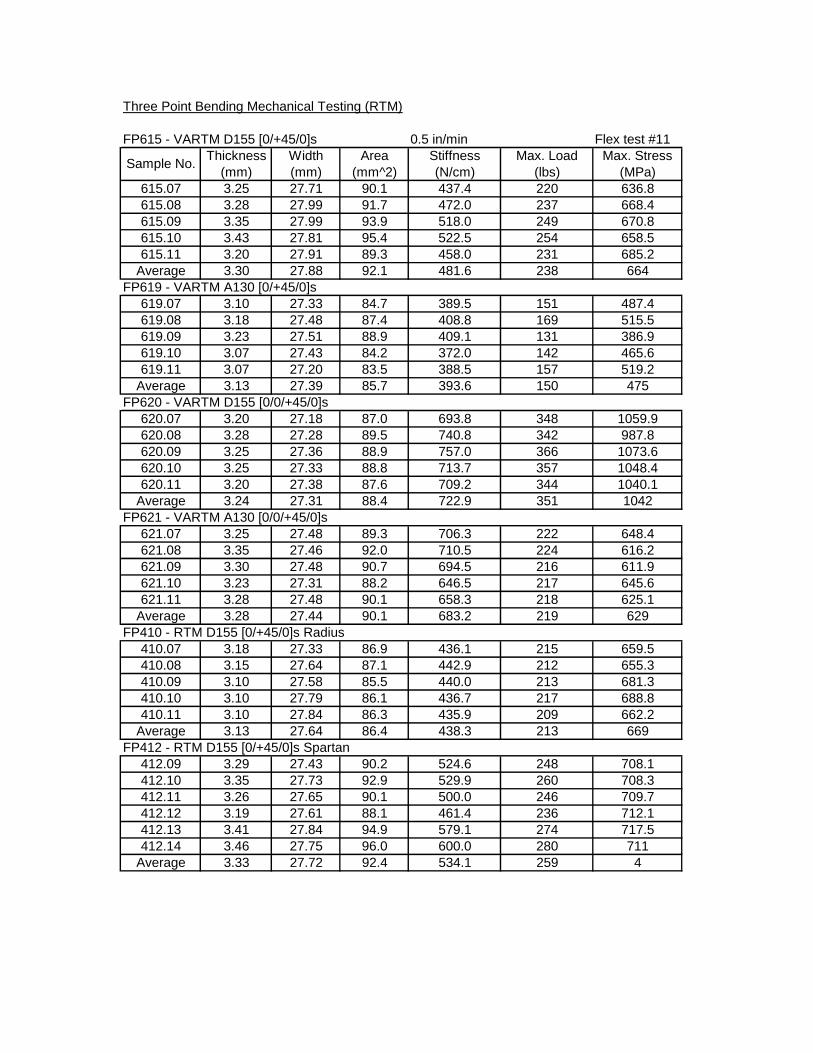
Three Point Bending Mechanical Testing (RTM)
FP615 - VARTM D155 [0/+45/0]s 0.5 in/min Flex test #11Thickness Width Area Stiffness Max. Load Max. Stress
(mm) (mm) (mm^2) (N/cm) (lbs) (MPa)615.07 3.25 27.71 90.1 437.4 220 636.8615.08 3.28 27.99 91.7 472.0 237 668.4615.09 3.35 27.99 93.9 518.0 249 670.8615.10 3.43 27.81 95.4 522.5 254 658.5615.11 3.20 27.91 89.3 458.0 231 685.2
Average 3.30 27.88 92.1 481.6 238 664FP619 - VARTM A130 [0/+45/0]s
619.07 3.10 27.33 84.7 389.5 151 487.4619.08 3.18 27.48 87.4 408.8 169 515.5619.09 3.23 27.51 88.9 409.1 131 386.9619.10 3.07 27.43 84.2 372.0 142 465.6619.11 3.07 27.20 83.5 388.5 157 519.2
Average 3.13 27.39 85.7 393.6 150 475FP620 - VARTM D155 [0/0/+45/0]s
620.07 3.20 27.18 87.0 693.8 348 1059.9620.08 3.28 27.28 89.5 740.8 342 987.8620.09 3.25 27.36 88.9 757.0 366 1073.6620.10 3.25 27.33 88.8 713.7 357 1048.4620.11 3.20 27.38 87.6 709.2 344 1040.1
Average 3.24 27.31 88.4 722.9 351 1042FP621 - VARTM A130 [0/0/+45/0]s
621.07 3.25 27.48 89.3 706.3 222 648.4621.08 3.35 27.46 92.0 710.5 224 616.2621.09 3.30 27.48 90.7 694.5 216 611.9621.10 3.23 27.31 88.2 646.5 217 645.6621.11 3.28 27.48 90.1 658.3 218 625.1
Average 3.28 27.44 90.1 683.2 219 629FP410 - RTM D155 [0/+45/0]s Radius
410.07 3.18 27.33 86.9 436.1 215 659.5410.08 3.15 27.64 87.1 442.9 212 655.3410.09 3.10 27.58 85.5 440.0 213 681.3410.10 3.10 27.79 86.1 436.7 217 688.8410.11 3.10 27.84 86.3 435.9 209 662.2
Average 3.13 27.64 86.4 438.3 213 669FP412 - RTM D155 [0/+45/0]s Spartan
412.09 3.29 27.43 90.2 524.6 248 708.1412.10 3.35 27.73 92.9 529.9 260 708.3412.11 3.26 27.65 90.1 500.0 246 709.7412.12 3.19 27.61 88.1 461.4 236 712.1412.13 3.41 27.84 94.9 579.1 274 717.5412.14 3.46 27.75 96.0 600.0 280 711
Average 3.33 27.72 92.4 534.1 259 4
Sample No.

Three Point Bending Mechanical Testing (Hand Lay-up)
FP702 - Hand Lay-up D155 [0/+45/0]sThickness Width Area Stiffness Ultimate Fail Max. Stress
(mm) (mm) (mm^2) (N/cm) (lbs) (MPa)702.07 3.20 27.99 89.6 452.8 214 632.9702.08 3.10 27.94 86.6 421.1 211 666.2702.09 3.12 28.07 87.6 430.3 217 673.2702.10 3.35 28.09 94.1 480.4 236 634.6702.11 3.51 28.12 98.7 579.8 266 650.9
Average 3.26 28.04 91.3 472.9 229 652Std Dev. 0.17 0.07 5.0 64.0 23 18
FP705 - Hand Lay-up A130 [0/+45/0]s705.07 3.30 27.20 89.8 436.4 171 489.4705.08 3.58 28.40 101.7 505.0 190 442.5705.09 3.38 27.86 94.2 428.4 202 538.0705.10 3.53 27.99 98.8 477.3 204 495.8705.11 3.43 28.24 96.9 459.2 181 461.8
Average 3.44 27.94 96.3 461.2 190 486Std Dev. 0.11 0.46 4.5 31.1 14 36
FP714 - Hand Lay-up D155 [0/0/+45/0]s714.07 4.70 27.89 131.1 1502.0 578 795.3714.08 4.52 28.35 128.1 1415.5 577 844.5714.09 4.70 28.42 133.6 1567.7 583 787.2714.10 4.93 28.35 139.8 1618.4 608 748.0714.11 4.57 27.69 126.5 1460.2 552 809.2
Average 4.68 28.14 131.8 1512.7 580 797Std Dev. 0.16 0.33 5.2 81.4 20 35
FP710 - Hand Lay-up A130 [0/0/+45/0]s710.07 3.91 27.84 108.9 946.6 309 615.4710.08 4.17 28.09 117.1 1037.8 357 619.6710.09 4.27 28.30 120.8 1171.8 363 596.4710.10 4.04 27.97 113.0 1020.8 315 584.9710.11 3.94 27.64 108.9 829.2 333 657.9
Average 4.07 27.97 113.7 1001.2 335 615Std Dev. 0.15 0.25 5.2 125.9 24 28
Sample No.
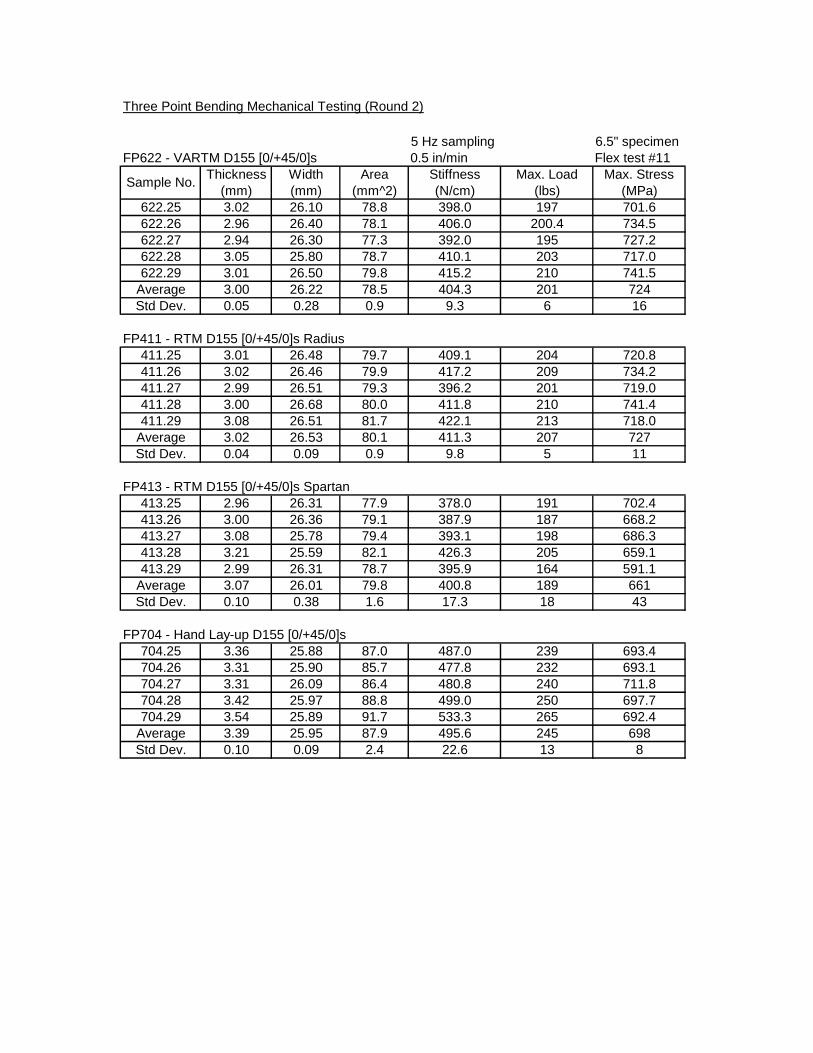
Three Point Bending Mechanical Testing (Round 2)
5 Hz sampling 6.5" specimenFP622 - VARTM D155 [0/+45/0]s 0.5 in/min Flex test #11
Thickness Width Area Stiffness Max. Load Max. Stress(mm) (mm) (mm^2) (N/cm) (lbs) (MPa)
622.25 3.02 26.10 78.8 398.0 197 701.6622.26 2.96 26.40 78.1 406.0 200.4 734.5622.27 2.94 26.30 77.3 392.0 195 727.2622.28 3.05 25.80 78.7 410.1 203 717.0622.29 3.01 26.50 79.8 415.2 210 741.5
Average 3.00 26.22 78.5 404.3 201 724Std Dev. 0.05 0.28 0.9 9.3 6 16
FP411 - RTM D155 [0/+45/0]s Radius411.25 3.01 26.48 79.7 409.1 204 720.8411.26 3.02 26.46 79.9 417.2 209 734.2411.27 2.99 26.51 79.3 396.2 201 719.0411.28 3.00 26.68 80.0 411.8 210 741.4411.29 3.08 26.51 81.7 422.1 213 718.0
Average 3.02 26.53 80.1 411.3 207 727Std Dev. 0.04 0.09 0.9 9.8 5 11
FP413 - RTM D155 [0/+45/0]s Spartan413.25 2.96 26.31 77.9 378.0 191 702.4413.26 3.00 26.36 79.1 387.9 187 668.2413.27 3.08 25.78 79.4 393.1 198 686.3413.28 3.21 25.59 82.1 426.3 205 659.1413.29 2.99 26.31 78.7 395.9 164 591.1
Average 3.07 26.01 79.8 400.8 189 661Std Dev. 0.10 0.38 1.6 17.3 18 43
FP704 - Hand Lay-up D155 [0/+45/0]s704.25 3.36 25.88 87.0 487.0 239 693.4704.26 3.31 25.90 85.7 477.8 232 693.1704.27 3.31 26.09 86.4 480.8 240 711.8704.28 3.42 25.97 88.8 499.0 250 697.7704.29 3.54 25.89 91.7 533.3 265 692.4
Average 3.39 25.95 87.9 495.6 245 698Std Dev. 0.10 0.09 2.4 22.6 13 8
Sample No.
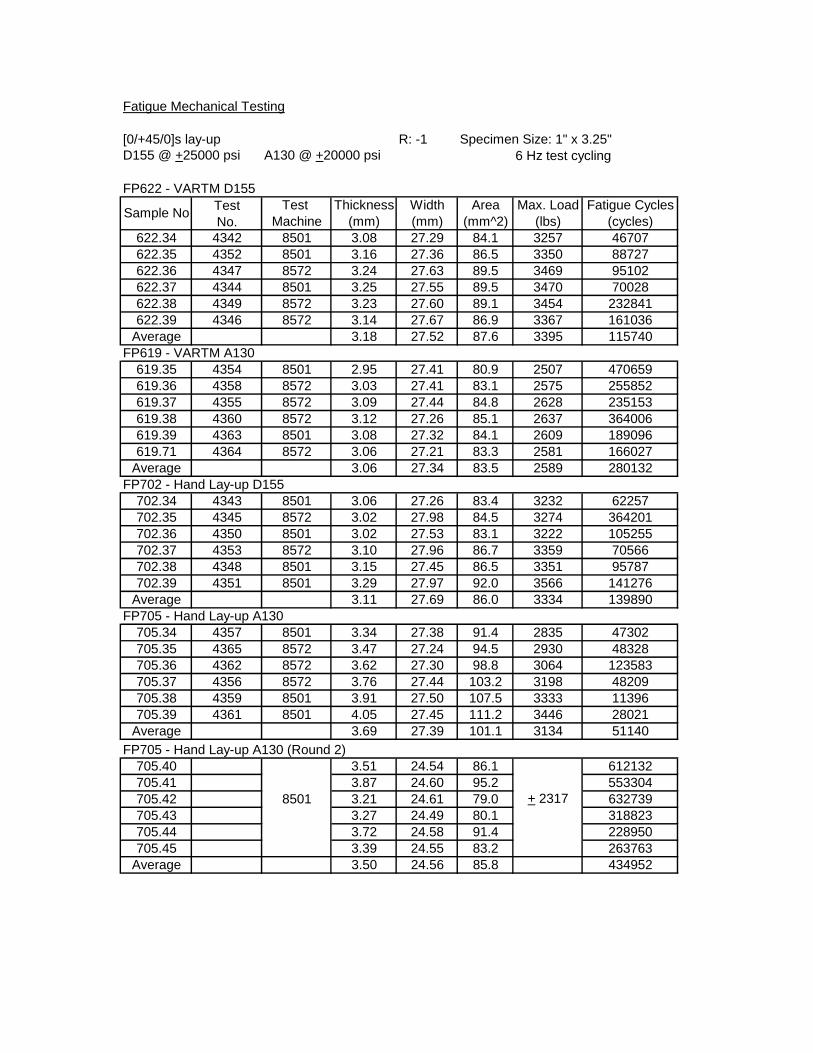
Fatigue Mechanical Testing
[0/+45/0]s lay-up R: -1 Specimen Size: 1" x 3.25"D155 @ +25000 psi A130 @ +20000 psi 6 Hz test cycling
FP622 - VARTM D155 Test Test Thickness Width Area Max. Load Fatigue CyclesNo. Machine (mm) (mm) (mm^2) (lbs) (cycles)
622.34 4342 8501 3.08 27.29 84.1 3257 46707622.35 4352 8501 3.16 27.36 86.5 3350 88727622.36 4347 8572 3.24 27.63 89.5 3469 95102622.37 4344 8501 3.25 27.55 89.5 3470 70028622.38 4349 8572 3.23 27.60 89.1 3454 232841622.39 4346 8572 3.14 27.67 86.9 3367 161036
Average 3.18 27.52 87.6 3395 115740FP619 - VARTM A130
619.35 4354 8501 2.95 27.41 80.9 2507 470659619.36 4358 8572 3.03 27.41 83.1 2575 255852619.37 4355 8572 3.09 27.44 84.8 2628 235153619.38 4360 8572 3.12 27.26 85.1 2637 364006619.39 4363 8501 3.08 27.32 84.1 2609 189096619.71 4364 8572 3.06 27.21 83.3 2581 166027
Average 3.06 27.34 83.5 2589 280132FP702 - Hand Lay-up D155
702.34 4343 8501 3.06 27.26 83.4 3232 62257702.35 4345 8572 3.02 27.98 84.5 3274 364201702.36 4350 8501 3.02 27.53 83.1 3222 105255702.37 4353 8572 3.10 27.96 86.7 3359 70566702.38 4348 8501 3.15 27.45 86.5 3351 95787702.39 4351 8501 3.29 27.97 92.0 3566 141276
Average 3.11 27.69 86.0 3334 139890FP705 - Hand Lay-up A130
705.34 4357 8501 3.34 27.38 91.4 2835 47302705.35 4365 8572 3.47 27.24 94.5 2930 48328705.36 4362 8572 3.62 27.30 98.8 3064 123583705.37 4356 8572 3.76 27.44 103.2 3198 48209705.38 4359 8501 3.91 27.50 107.5 3333 11396705.39 4361 8501 4.05 27.45 111.2 3446 28021
Average 3.69 27.39 101.1 3134 51140FP705 - Hand Lay-up A130 (Round 2)
705.40 3.51 24.54 86.1 612132705.41 3.87 24.60 95.2 553304705.42 8501 3.21 24.61 79.0 + 2317 632739705.43 3.27 24.49 80.1 318823705.44 3.72 24.58 91.4 228950705.45 3.39 24.55 83.2 263763
Average 3.50 24.56 85.8 434952
Sample No
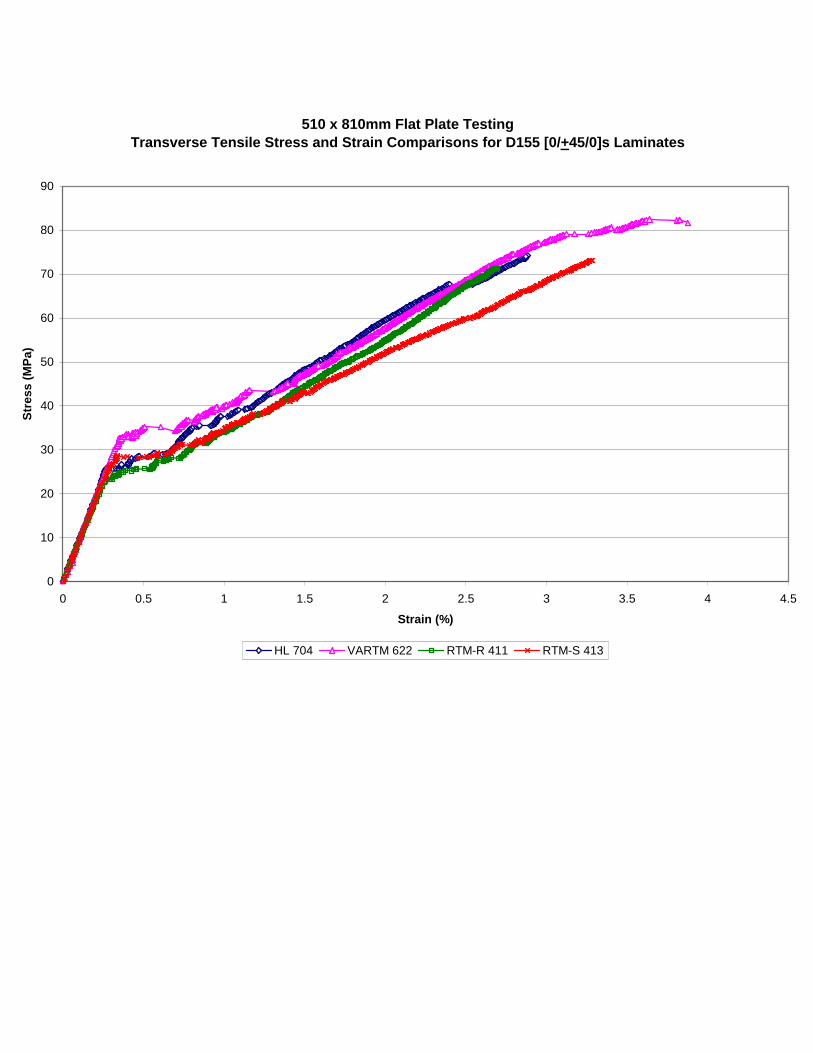
510 x 810mm Flat Plate TestingTransverse Tensile Stress and Strain Comparisons for D155 [0/+ 45/0]s Laminates
0
10
20
30
40
50
60
70
80
90
0 0.5 1 1.5 2 2.5 3 3.5 4 4.5
Strain (%)
Str
ess
(MP
a)
HL 704 VARTM 622 RTM-R 411 RTM-S 413

510 x 810mm Flat Plate ComparisonsTransverse Tensile Stress and Strain Comparisons
0
10
20
30
40
50
60
70
0 0.5 1 1.5 2 2.5 3 3.5
Strain (%)
Str
ess
(MP
a)
HL A130 6ply VARTM A130 6ply HL D155 8ply VARTM D155 8ply HL A130 8ply VARTM A130 8ply

193
APPENDIX B
T-Stiffener Experimental Data and Results

208
Thin flanged T-stiffener testing jig [46]
Thick flanged T-stiffener jig [46]
11.5
Test fixture supportDia. =1.92Spacing =12.7Radius =0.635
Load
LoadingGrips
12.7
1.0 Flange
Skin
Units in cm
9.8Test fixture supportDia. =1.92Spacing =12.7
15.9
Radius = 0.18
Load
LoadingGrips
Units in cm
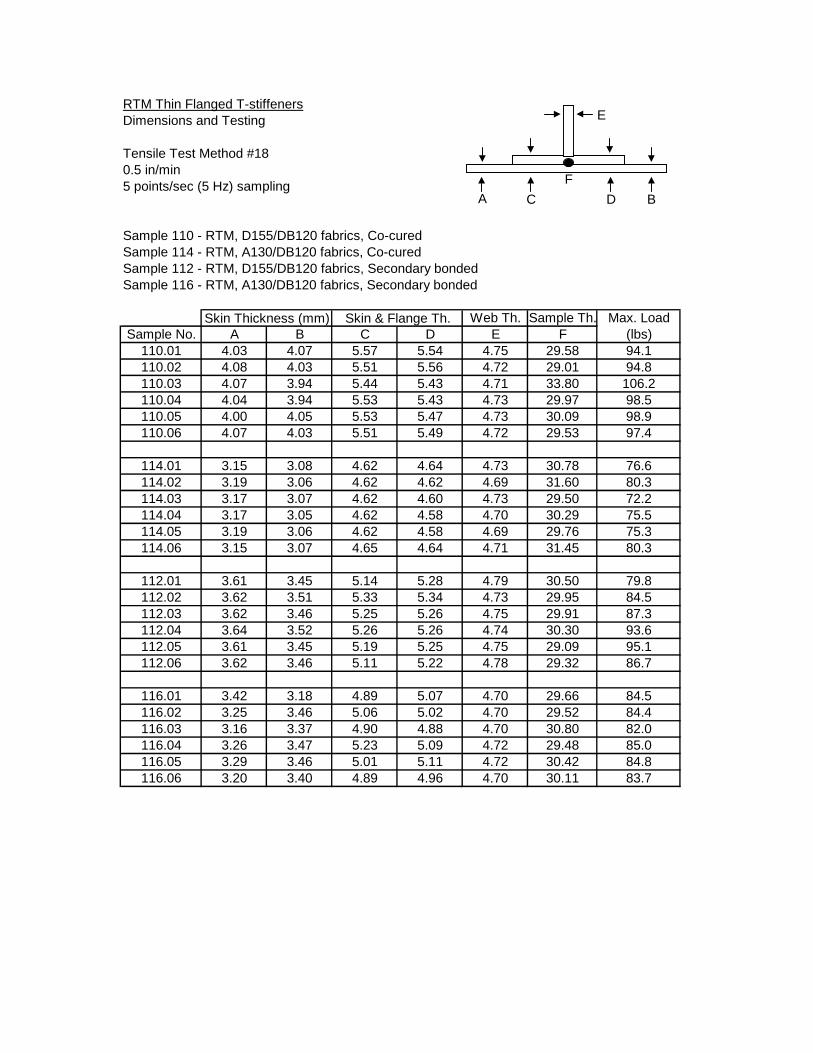
RTM Thin Flanged T-stiffenersDimensions and Testing
Tensile Test Method #180.5 in/min5 points/sec (5 Hz) sampling
Sample 110 - RTM, D155/DB120 fabrics, Co-curedSample 114 - RTM, A130/DB120 fabrics, Co-curedSample 112 - RTM, D155/DB120 fabrics, Secondary bondedSample 116 - RTM, A130/DB120 fabrics, Secondary bonded
Web Th. Sample Th. Max. LoadSample No. A B C D E F (lbs)
110.01 4.03 4.07 5.57 5.54 4.75 29.58 94.1110.02 4.08 4.03 5.51 5.56 4.72 29.01 94.8110.03 4.07 3.94 5.44 5.43 4.71 33.80 106.2110.04 4.04 3.94 5.53 5.43 4.73 29.97 98.5110.05 4.00 4.05 5.53 5.47 4.73 30.09 98.9110.06 4.07 4.03 5.51 5.49 4.72 29.53 97.4
114.01 3.15 3.08 4.62 4.64 4.73 30.78 76.6114.02 3.19 3.06 4.62 4.62 4.69 31.60 80.3114.03 3.17 3.07 4.62 4.60 4.73 29.50 72.2114.04 3.17 3.05 4.62 4.58 4.70 30.29 75.5114.05 3.19 3.06 4.62 4.58 4.69 29.76 75.3114.06 3.15 3.07 4.65 4.64 4.71 31.45 80.3
112.01 3.61 3.45 5.14 5.28 4.79 30.50 79.8112.02 3.62 3.51 5.33 5.34 4.73 29.95 84.5112.03 3.62 3.46 5.25 5.26 4.75 29.91 87.3112.04 3.64 3.52 5.26 5.26 4.74 30.30 93.6112.05 3.61 3.45 5.19 5.25 4.75 29.09 95.1112.06 3.62 3.46 5.11 5.22 4.78 29.32 86.7
116.01 3.42 3.18 4.89 5.07 4.70 29.66 84.5116.02 3.25 3.46 5.06 5.02 4.70 29.52 84.4116.03 3.16 3.37 4.90 4.88 4.70 30.80 82.0116.04 3.26 3.47 5.23 5.09 4.72 29.48 85.0116.05 3.29 3.46 5.01 5.11 4.72 30.42 84.8116.06 3.20 3.40 4.89 4.96 4.70 30.11 83.7
Skin Thickness (mm) Skin & Flange Th.
A BC D
E
F
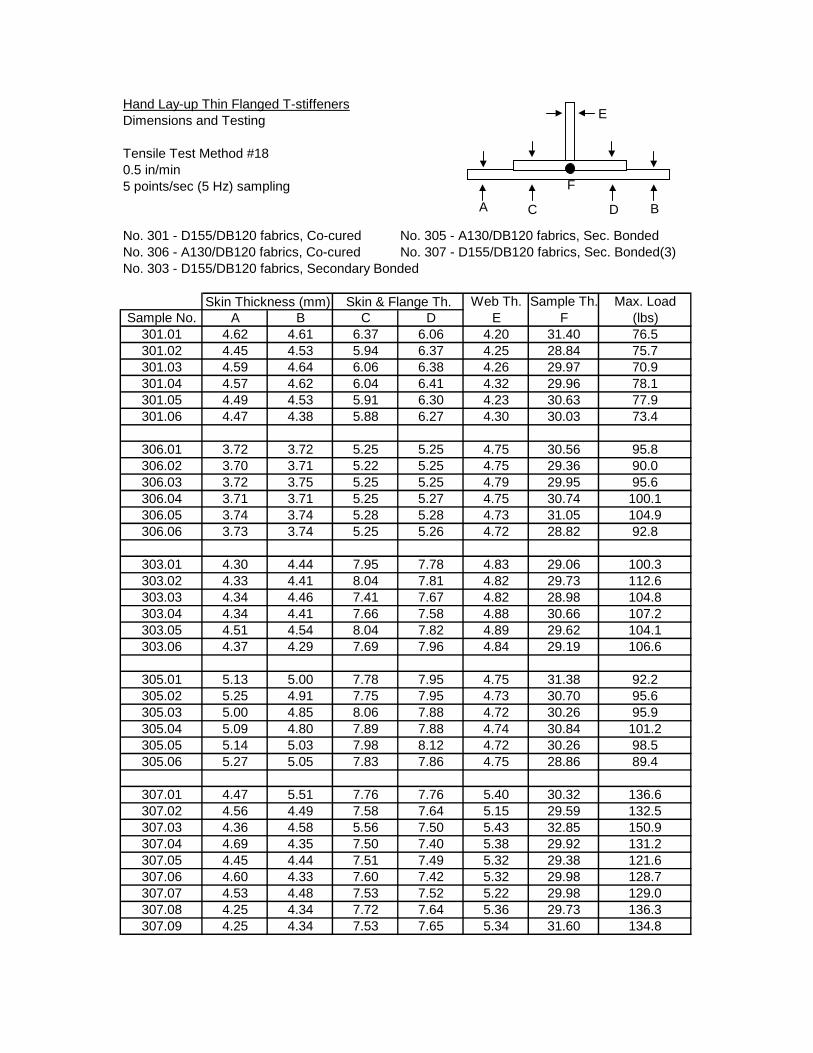
Hand Lay-up Thin Flanged T-stiffenersDimensions and Testing
Tensile Test Method #180.5 in/min5 points/sec (5 Hz) sampling
No. 301 - D155/DB120 fabrics, Co-cured No. 305 - A130/DB120 fabrics, Sec. BondedNo. 306 - A130/DB120 fabrics, Co-cured No. 307 - D155/DB120 fabrics, Sec. Bonded(3)No. 303 - D155/DB120 fabrics, Secondary Bonded
Web Th. Sample Th. Max. LoadSample No. A B C D E F (lbs)
301.01 4.62 4.61 6.37 6.06 4.20 31.40 76.5301.02 4.45 4.53 5.94 6.37 4.25 28.84 75.7301.03 4.59 4.64 6.06 6.38 4.26 29.97 70.9301.04 4.57 4.62 6.04 6.41 4.32 29.96 78.1301.05 4.49 4.53 5.91 6.30 4.23 30.63 77.9301.06 4.47 4.38 5.88 6.27 4.30 30.03 73.4
306.01 3.72 3.72 5.25 5.25 4.75 30.56 95.8306.02 3.70 3.71 5.22 5.25 4.75 29.36 90.0306.03 3.72 3.75 5.25 5.25 4.79 29.95 95.6306.04 3.71 3.71 5.25 5.27 4.75 30.74 100.1306.05 3.74 3.74 5.28 5.28 4.73 31.05 104.9306.06 3.73 3.74 5.25 5.26 4.72 28.82 92.8
303.01 4.30 4.44 7.95 7.78 4.83 29.06 100.3303.02 4.33 4.41 8.04 7.81 4.82 29.73 112.6303.03 4.34 4.46 7.41 7.67 4.82 28.98 104.8303.04 4.34 4.41 7.66 7.58 4.88 30.66 107.2303.05 4.51 4.54 8.04 7.82 4.89 29.62 104.1303.06 4.37 4.29 7.69 7.96 4.84 29.19 106.6
305.01 5.13 5.00 7.78 7.95 4.75 31.38 92.2305.02 5.25 4.91 7.75 7.95 4.73 30.70 95.6305.03 5.00 4.85 8.06 7.88 4.72 30.26 95.9305.04 5.09 4.80 7.89 7.88 4.74 30.84 101.2305.05 5.14 5.03 7.98 8.12 4.72 30.26 98.5305.06 5.27 5.05 7.83 7.86 4.75 28.86 89.4
307.01 4.47 5.51 7.76 7.76 5.40 30.32 136.6307.02 4.56 4.49 7.58 7.64 5.15 29.59 132.5307.03 4.36 4.58 5.56 7.50 5.43 32.85 150.9307.04 4.69 4.35 7.50 7.40 5.38 29.92 131.2307.05 4.45 4.44 7.51 7.49 5.32 29.38 121.6307.06 4.60 4.33 7.60 7.42 5.32 29.98 128.7307.07 4.53 4.48 7.53 7.52 5.22 29.98 129.0307.08 4.25 4.34 7.72 7.64 5.36 29.73 136.3307.09 4.25 4.34 7.53 7.65 5.34 31.60 134.8
Skin Thickness (mm) Skin & Flange Th.
A BC D
E
F

Thin Flanged T-stiffener Tolerance SummariesBond Mean Type Thickness max min
(mm) (mm) (mm) (mm)Skin 4.03 0.050 4.08 3.94Web 4.73 0.010 4.75 4.71Skin 3.55 0.080 3.64 3.45Web 4.76 0.020 4.79 4.73
D155 Skin 4.54 0.080 4.64 4.38DB120 Web 4.26 0.040 4.32 4.20
Hand Skin 4.4 0.080 4.54 4.29Lay-up Web 4.85 0.030 4.89 4.82
Skin 4.42 0.140 4.69 4.25Web 5.32 0.090 5.38 5.22Skin 3.12 0.060 3.19 3.05Web 4.71 0.020 4.73 4.69Skin 3.33 0.120 3.47 3.16
A130 Web 4.71 0.010 4.72 4.70DB120 Skin 3.72 0.020 3.75 3.70
Hand Web 4.75 0.020 4.79 4.72Lay-up Skin 5.04 0.150 5.27 4.80
Web 4.74 0.010 4.75 4.72
Thin Flanged T-stiffener Fiber Volume SummariesBond Mean Fiber Volume Type Vf min max
(%) (%) (%) (%)Skin 35.19 0.47 34.70 36.08Web 30.41 0.05 30.32 30.48Skin 40.82 1.08 39.57 42.16Web 30.30 0.09 30.18 30.40
D155 Skin 31.32 0.46 30.79 32.29DB120 Web 33.17 0.34 32.71 33.65
Hand Skin 32.21 0.53 31.30 32.94Lay-up Web 30.00 0.09 29.87 30.08
Skin 31.52 0.84 29.78 32.64Web N/A - - -Skin 41.61 0.75 40.66 42.50Web 27.75 0.08 27.66 27.83Skin 39.00 1.40 37.30 41.05
A130 Web 27.76 0.04 27.70 27.79DB120 Skin 34.64 0.15 34.39 34.88
Hand Web 27.59 0.10 27.43 27.70Lay-up Skin 26.71 0.35 26.27 27.39
Web 27.64 0.06 27.58 27.7RTM: Resin Transfer MoldingSB: Secondary bonded in two partsSB(3): Secondary bonded in three partsCC: Co-Cured Note: data obtained from six samples in each case.
ProcessStd. Dev.
ThicknessLocationFabric
Lay-up Fabric
[+45/02/+45]s
Lay-up
[+45/02/+45]s
CC
SB
CC
SB
SB(3)
CC
SB
SB
SB
RTM
CC
SB
RTM
CC
RTM
Process
RTM
CC
SB
SB(3)
Std. Dev.
CC
SB
Location
CC

194
APPENDIX C
I-Beam and Root Specimen Experimental Data and Results

Root specimen manufacturing and testing data. Current lay-up: Skin [+45/02/+45]sSurface [+45/0/+45/02/+45]s
Static Tensile TestsSample Ultimate Load
No. (kN)1
R101 A130 [+45/02/+45/02/+45]s Poor wet out 243.7 insert pull-outR102 A130 Poor wet out 213.5 composite failureR103 D155 Low Vf about insert 241.0 insert pull-outR201 VARTM D155 [+45/0/+45/02/+45]s ply drops Low Vf about insert 230.5R104 Low Vf / Super 77 / 3"-12" 240.2R106 9"-12" strips 197.9R107 Spartan / wash-out / 9"-12" 239.8R108 9"-12" strips 177.1R109 Current w/ skin: [+45/03/+45]s Spartan / High Vf at insert 254.0 two tests / bolt failure / yieldR110 Current Spartan 252.3 bolt failure / no insert yieldR301 No insert tip / 9"-12" 213.4R303 9"-12" strips 181.3
Fatigue TestsSample Fatigue cycles
No. (cycles)R105 2 [+45/0/+45/02/+45]s ply drops Low Vf / 3"-12" stripsR111 2
R112 535.2 R: 0.1, 20/2k, no damageR113 2 Current
R114 2
R115 2
R116 2
R302* HL D155 [+45/0/+45/02/+45]s ply drops 9"-12" strips1 -98 kN is the root specimen design limit load.2 -Manufactured but not tested
Notes on ManufacturingLay-up Schedule
RTM D155
Process
Comments
HL D155
Process Fabric
[+45/0/+45/02/+45]s ply drops composite failure
Notes on ManufacturingLay-up Schedule Comments
RTM[+45/02/+45/02/+45]s ply drops
Zero Fabric
[+45/0/+45/02/+45]s ply dropscomposite failure
RTM D155
good bonding w/ insert

195
APPENDIX D
Statistical Comparison Results

Transverse tension results statistical differences.
Laminate Zero Normality Equal Statistical StatisticalMechanical Lay-up Degree Processes Variance Comparison Method Difference
Property Fabric (P value) (P value) (P value)HL / V pass (0.353) fail (0.0003) ANOVA on Ranks (<0.05) Yes
HL / RR pass (0.353) fail (0.0003) ANOVA on Ranks (<0.05) YesUltimate D155 HL / RS pass (0.353) fail (0.0003) ANOVA on Ranks (<0.05) No
Transverse [0/+45/0]s V / RR pass (0.715) fail (0.0009) t-test (0.467) NoTensile V / RS pass (0.353) fail (0.0003) ANOVA on Ranks (<0.05) NoStrength RR / RS pass (0.186) pass (0.830) t-test (0.698) No
A130 HL / V pass (0.126) pass (0.163) t-test (<0.0001) Yes[0/0/+45/0]s D155 HL / V pass (0.329) pass (0.252) t-test (<0.0001) Yes
A130 HL / V pass (0.287) pass (0.480) t-test (0.0002) YesHL / V
HL / RRNormalized D155 HL / RS pass (0.881) fail (0.0036) ANOVA on Ranks (0.164) NoTransverse [0/+45/0]s V / RR
Tensile V / RSStrength RR / RS
A130 HL / V pass (0.594) pass (0.721) t-test (<0.0001) Yes[0/0/+45/0]s D155 HL / V pass (0.255) pass (0.365) t-test (0.158) No
A130 HL / V pass (0.235) pass (0.454) t-test (0.401) NoHL / V pass (0.551) pass (0.451) 1-Way ANOVA (0.105) Yes
HL / RR pass (0.559) pass (0.332) t-test (0.185) NoD155 HL / RS pass (0.726) pass (0.270) t-test (0.242) No
Transverse [0/+45/0]s V / RR pass (0.551) pass (0.451) 1-Way ANOVA (0.105) NoTensile V / RS pass (0.551) pass (0.451) 1-Way ANOVA (0.105) Yes
Modulus RR / RS pass (0.551) pass (0.451) 1-Way ANOVA (0.105) NoA130 HL / V pass (0.106) pass (0.293) t-test (0.363) No
[0/0/+45/0]s D155 HL / V pass (0.294) pass (0.543) t-test (<0.0001) YesA130 HL / V pass (0.058) pass (0.302) t-test (<0.0001) Yes
HL - Hand Lay-up V- VARTMRR - Radius RTM RS - Spartan RTM
21
5
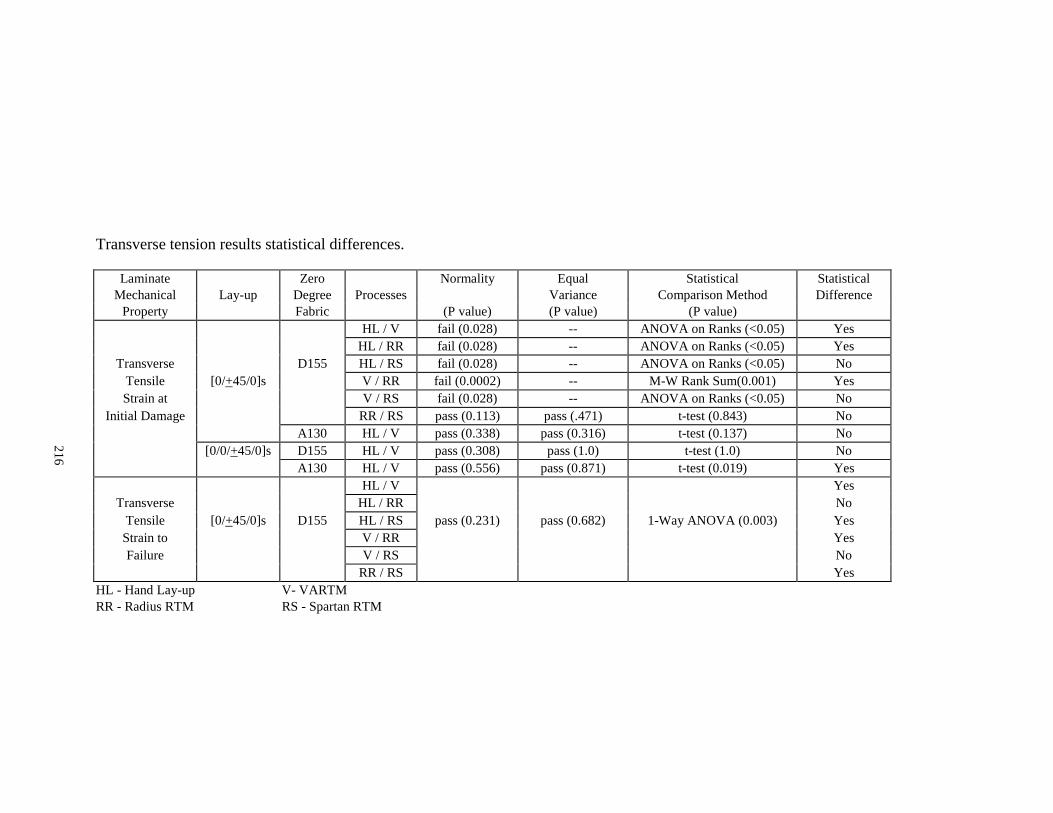
Transverse tension results statistical differences.
Laminate Zero Normality Equal Statistical StatisticalMechanical Lay-up Degree Processes Variance Comparison Method Difference
Property Fabric (P value) (P value) (P value)HL / V fail (0.028) -- ANOVA on Ranks (<0.05) Yes
HL / RR fail (0.028) -- ANOVA on Ranks (<0.05) YesTransverse D155 HL / RS fail (0.028) -- ANOVA on Ranks (<0.05) No
Tensile [0/+45/0]s V / RR fail (0.0002) -- M-W Rank Sum(0.001) YesStrain at V / RS fail (0.028) -- ANOVA on Ranks (<0.05) No
Initial Damage RR / RS pass (0.113) pass (.471) t-test (0.843) NoA130 HL / V pass (0.338) pass (0.316) t-test (0.137) No
[0/0/+45/0]s D155 HL / V pass (0.308) pass (1.0) t-test (1.0) NoA130 HL / V pass (0.556) pass (0.871) t-test (0.019) Yes
HL / V YesTransverse HL / RR No
Tensile [0/+45/0]s D155 HL / RS pass (0.231) pass (0.682) 1-Way ANOVA (0.003) YesStrain to V / RR YesFailure V / RS No
RR / RS YesHL - Hand Lay-up V- VARTMRR - Radius RTM RS - Spartan RTM
21
6

Compression and Bending test results statistical differences.
Laminate Zero Normality Equal Statistical StatisticalMechanical Lay-up Degree Processes Variance Comparison Method Difference
Property Fabric (P value) (P value) (P value)HL / V pass (0.650) pass (0.475) 1-Way ANOVA (<0.05) Yes
HL / RR pass (0.736) pass (0.588) t-test (0.663) NoUltimate D155 HL / RS pass (0.650) pass (0.475) 1-Way ANOVA (<0.05) No
Compressive [0/+45/0]s V / RR pass (0.650) pass (0.475) 1-Way ANOVA (<0.05) YesStrength V / RS pass (0.650) pass (0.475) 1-Way ANOVA (<0.05) Yes
RR / RS pass (0.121) pass (0.559) t-test (0.380) NoA130 HL / V pass (0.459) pass (0.506) t-test (0.005) Yes
[0/0/+45/0]s D155 HL / V pass (0.882) pass (0.237) t-test (<0.001) YesA130 HL / V pass (0.558) pass (0.956) t-test (0.087) No
HL / V pass (0.136) pass (0.228) 1-Way ANOVA (<0.001) NoHL / RR pass (0.136) pass (0.228) 1-Way ANOVA (<0.001) Yes
Normalized D155 HL / RS pass (0.136) pass (0.228) 1-Way ANOVA (<0.001) YesUltimate [0/+45/0]s V / RR pass (0.136) pass (0.228) 1-Way ANOVA (<0.001) Yes
Compressive V / RS pass (0.136) pass (0.228) 1-Way ANOVA (<0.001) YesStrength RR / RS pass (0.136) pass (0.228) 1-Way ANOVA (<0.001) No
A130 HL / V pass (0.235) pass (0.466) t-test (0.360) No[0/0/+45/0]s D155 HL / V pass (0.618) pass (0.620) t-test (<0.005) Yes
A130 HL / V pass (0.448) pass (0.533) t-test (0.007) YesHL / V fail (<0.0001) -- ANOVA on Ranks (0.137) No
HL / RR fail (<0.0001) -- ANOVA on Ranks (0.137) NoD155 HL / RS fail (<0.0001) -- ANOVA on Ranks (0.137) No
Bending [0/+45/0]s V / RR fail (<0.0001) -- ANOVA on Ranks (0.137) NoStrength V / RS fail (<0.0001) -- ANOVA on Ranks (0.137) No
RR / RS fail (<0.0001) -- ANOVA on Ranks (0.137) NoA130 HL / V pass (0.75) pass (0.55) t-test (0.73) No
[0/0/+45/0]s D155 HL / V pass (0.38) pass (0.85) t-test (<0.001) YesA130 HL / V pass (0.81) pass (0.42) t-test (0.35) No
21
7

Tension and fatigue test results statistical differences.
Laminate Zero Normality Equal Statistical StatisticalMechanical Lay-up Degree Processes Variance Comparison Method Difference
Property Fabric (P value) (P value) (P value)[0/+45/0]s D155 HL / V fail (0.002) -- M-W Rank Sum (1.0) No
Tensile A130 HL / V fail (0.02) -- M-W Rank Sum (0.95) NoStrength [0/0/+45/0]s D155 HL / V pass (0.51) pass (0.63) T-test (<0.001) Yes
A130 HL / V pass (0.18) pass (0.86) T-test (<0.001) YesNormalized [0/+45/0]s D155 HL / V fail (<0.001) -- M-W Rank Sum (0.27) No
Ultimate A130 HL / V pass (0.10) fail (0.01) M-W Rank Sum (0.095) NoTensile [0/0/+45/0]s D155 HL / V pass (0.17) pass (0.18) T-test (0.7) NoStrength A130 HL / V pass (0.11) pass (0.24) T-test (0.03) Yes
[0/+45/0]s D155 HL / V fail (<0.001) -- M-W Rank Sum (0.34) NoTensile A130 HL / V pass (0.30) pass (0.57) T-test (0.2) No
Modulus [0/0/+45/0]s D155 HL / V pass (0.50) pass (0.44) T-test (<0.001) YesA130 HL / V pass (0.52) fail (0.04) M-W Rank Sum (0.008) Yes
[0/+45/0]s D155 HL / V fail (<0.001) -- M-W Rank Sum (0.43) NoTensile A130 HL / V pass (0.72) pass (0.09) T-test (0.85) No
Initial Damage [0/0/+45/0]s D155 HL / V pass (0.27) pass (0.05) T-test (0.50) NoA130 HL / V fail (0.04) -- M-W Rank Sum (0.55) NoD155 HL / V fail (0.03) -- M-W Rank Sum (0.7) No
Fatigue [0/+45/0]s A130 HL / V fail (0.02) -- M-W Rank Sum (0.02) YesA130 HL / V pass (0.61) pass (0.05) T-test (0.11) No
21
8

196
APPENDIX E
Fiber Volume and Fabrication Time Records
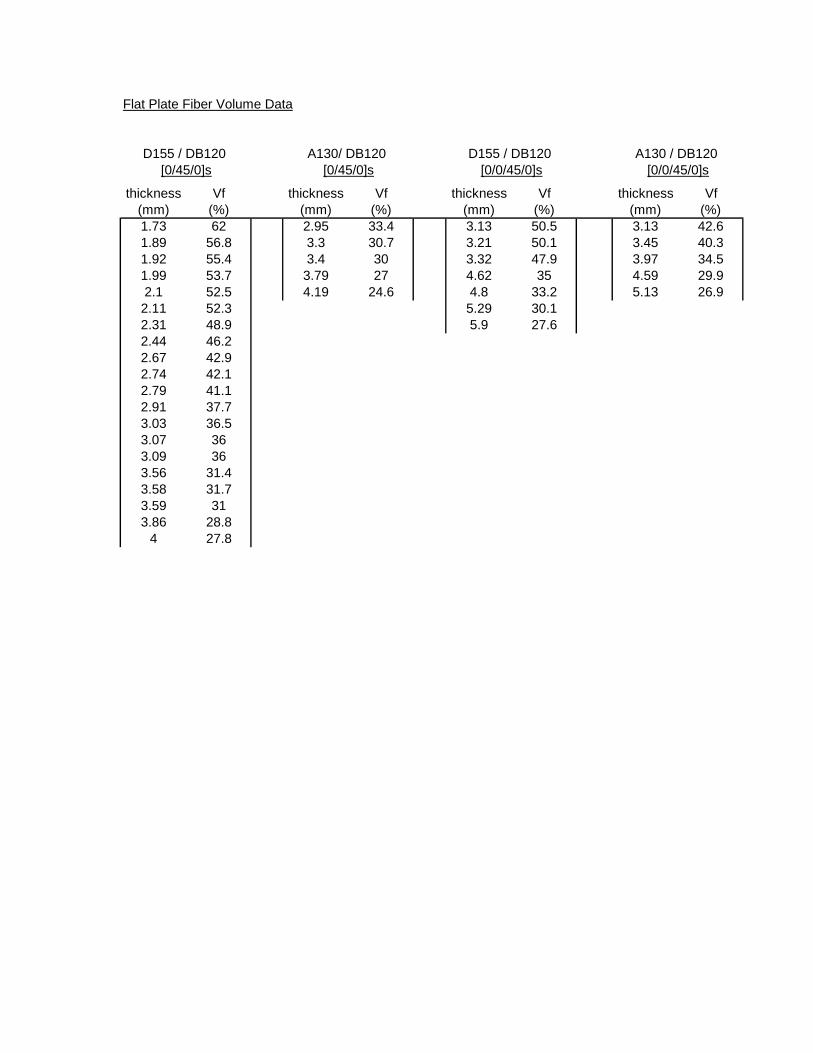
Flat Plate Fiber Volume Data
thickness Vf thickness Vf thickness Vf thickness Vf(mm) (%) (mm) (%) (mm) (%) (mm) (%)1.73 62 2.95 33.4 3.13 50.5 3.13 42.61.89 56.8 3.3 30.7 3.21 50.1 3.45 40.31.92 55.4 3.4 30 3.32 47.9 3.97 34.51.99 53.7 3.79 27 4.62 35 4.59 29.92.1 52.5 4.19 24.6 4.8 33.2 5.13 26.92.11 52.3 5.29 30.12.31 48.9 5.9 27.62.44 46.22.67 42.92.74 42.12.79 41.12.91 37.73.03 36.53.07 363.09 363.56 31.43.58 31.73.59 313.86 28.8
4 27.8
D155 / DB120 [0/45/0]s
A130/ DB120 [0/45/0]s
D155 / DB120 [0/0/45/0]s
A130 / DB120 [0/0/45/0]s

Fiber volume calculations data
Sample No. Part Fabric Location Lay-up Width Thickness Length Vol(cm^3)Fiber wt. (after burn)
Fiber Vol. (cm^3) % Vf
LTA.1 SKIN 35.00 3.00 60.28 6.33 7.00 2.73 43.20LTA.2 A130 WEB 36.61 4.67 62.00 10.60 7.60 2.97 28.01LTA.3 WEB [+-45/02/+-45]s 35.71 4.78 42.60 7.27 5.10 1.99 27.40LTD.1 SKIN 34.51 3.55 56.43 6.91 7.20 2.81 40.68LTD.2 D155 SKIN 32.51 4.44 59.23 8.55 6.90 2.70 31.53LTD.3 WEB 32.30 4.80 59.90 9.29 7.20 2.81 30.28IWD.1 28.18 3.41 56.78 5.46 4.20 1.64 30.07IWD.2 26.16 3.28 60.13 5.16 3.90 1.52 29.53IWU.1 [+-45/0/+-45]s 28.05 3.21 54.95 4.95 4.10 1.60 32.37IWU.2 27.98 3.10 52.10 4.52 3.90 1.52 33.71IWA.1 27.75 3.47 54.50 5.25 3.60 1.41 26.80IWA.2 28.26 3.32 57.56 5.40 3.90 1.52 28.21IFD.1 19.71 5.80 53.15 6.08 4.40 1.72 28.29IFD.2 D155 19.95 4.50 52.40 4.70 4.30 1.68 35.71IFD.3 19.81 4.05 53.30 4.28 4.40 1.72 40.19IFU.1 [0/+-45/0]s 20.00 5.04 52.70 5.31 4.80 1.88 35.30IFU.2 U1018 20.70 4.80 52.41 5.21 4.80 1.88 36.01IFU.3 19.82 4.25 59.08 4.98 5.40 2.11 42.39IFA.1 21.10 4.30 61.26 5.56 4.90 1.91 34.44IFA.2 19.60 4.90 57.81 5.55 4.10 1.60 28.85R301 32.80 9.30 43.48 13.26 9.70 3.79 28.57R201A Root 1 D155 GRIP 27.62 10.62 45.49 13.34 9.00 3.52 26.35R201B 33.35 11.09 43.84 16.21 10.50 4.10 25.30IWD.3 3.28 29.50IWD.4 I-Beam D155 WEB [+-45/0/+-45]s 3.36 29.1IWD.5 3.28 29.5R112A 10.52 33.7R112B 11.47 31.26
Root 2 D155 GRIP
Little T
I-Beam
FLANGE
WEB
D155
U1018
A130
A130
Note: Dimensions in mm unless stated otherwise.

I-Beam Composite Fiber Volumes
y = 10.94x2 - 110.61x + 314.86
y = 2.4363x2 - 30.8x + 124.97
y = -9.3184x + 74.506
y = -12.198x + 71.525
y = -9.4211x + 59.487
25
27
29
31
33
35
37
39
41
43
45
2.5 3.0 3.5 4.0 4.5 5.0 5.5 6.0
Laminate Thickness (mm)
Fib
er V
olum
e (%
)
I-Beam Flange - D155 I-Beam Flange - A130 I-Beam Flange - U1018 I- Beam Web - D155
I-Beam Web - A130 I-Beam Web - U1018
Lay-up: I-Beam Web [+45/0/+45]s
Lay-up: I- Beam Flange [0/+45/0]s + [+45/0/+45]

Thin Flanged T-Stiffener and Root Composite Fiber Volumes
y = 4.0754x2 - 42.524x + 140.36
y = 2.8158x2 - 30.741x + 110.07
y = -2.5684x + 60.72
y = 0.4489x2 - 10.893x + 91.013
20
25
30
35
40
45
50
2 4 6 8 10 12 14
Laminate Thickness (mm)
Fib
er V
olum
e (%
)
Thin T - D155 Thin T - A130 Root 1 Root 2
Root 1: [+45/0/+45/0/+45]s + [+45/0/+45]s
Root 2: [+45/0/+45/02/+45]s + [+45/02/+45]sT-stiffener web and skins: [+45/02/+45]s
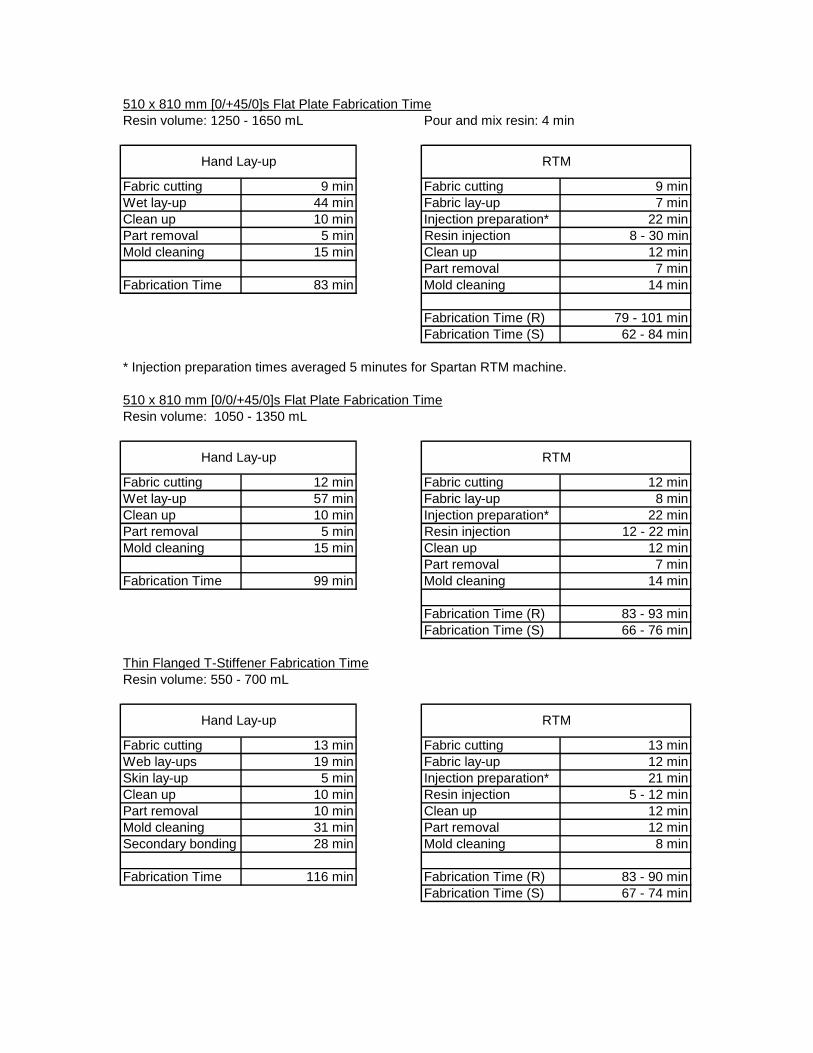
510 x 810 mm [0/+45/0]s Flat Plate Fabrication TimeResin volume: 1250 - 1650 mL Pour and mix resin: 4 min
Fabric cutting 9 min Fabric cutting 9 minWet lay-up 44 min Fabric lay-up 7 minClean up 10 min Injection preparation* 22 minPart removal 5 min Resin injection 8 - 30 minMold cleaning 15 min Clean up 12 min
Part removal 7 minFabrication Time 83 min Mold cleaning 14 min
Fabrication Time (R) 79 - 101 minFabrication Time (S) 62 - 84 min
* Injection preparation times averaged 5 minutes for Spartan RTM machine.
510 x 810 mm [0/0/+45/0]s Flat Plate Fabrication TimeResin volume: 1050 - 1350 mL
Fabric cutting 12 min Fabric cutting 12 minWet lay-up 57 min Fabric lay-up 8 minClean up 10 min Injection preparation* 22 minPart removal 5 min Resin injection 12 - 22 minMold cleaning 15 min Clean up 12 min
Part removal 7 minFabrication Time 99 min Mold cleaning 14 min
Fabrication Time (R) 83 - 93 minFabrication Time (S) 66 - 76 min
Thin Flanged T-Stiffener Fabrication TimeResin volume: 550 - 700 mL
Fabric cutting 13 min Fabric cutting 13 minWeb lay-ups 19 min Fabric lay-up 12 minSkin lay-up 5 min Injection preparation* 21 minClean up 10 min Resin injection 5 - 12 minPart removal 10 min Clean up 12 minMold cleaning 31 min Part removal 12 minSecondary bonding 28 min Mold cleaning 8 min
Fabrication Time 116 min Fabrication Time (R) 83 - 90 minFabrication Time (S) 67 - 74 min
Hand Lay-up RTM
Hand Lay-up RTM
Hand Lay-up RTM

Thick Flanged T-Stiffener Fabrication TimeResin volume: 950 - 1350 mL
Fabric cutting 24 min Fabric cutting 24 minWeb lay-ups 21 min Fabric lay-up 20 minFlange lay-up 18 min Injection preparation* 23 minSkin lay-up 6 min Resin injection 8 - 29 minClean up 10 min Clean up 12 minPart removal 14 min Part removal 15 minMold cleaning 30 min Mold cleaning 10 minSecondary bonding 41 min
Fabrication Time (R) 112 - 133 minFabrication Time 164 min Fabrication Time (S) 94 - 115 min
I-beam Fabrication TimeResin volume: 750 - 1000 mL
Fabric cutting 15 min Fabric cutting 15 minWeb lay-ups 30 min Fabric lay-up 30 minFlange lay-ups 8 min Injection preparation* 23 minClean up 10 min Resin injection 9 - 21 minPart removal 18 min Clean up 12 minMold cleaning 20 min Part removal 19 minSecondary bonding 74 min Mold cleaning 18 min
Fabrication Time 175 min Fabrication Time (R) 126 - 138 minFabrication Time (S) 108 - 120 min
Root Insert Fabrication TimeResin volume: 1750 - 2000 mL
Fabric cutting 34 min Fabric cutting 34 minWet lay-up 60 - 80 min Fabric lay-up 25 minClean up 10 min Injection preparation* 21 minPart removal 11 min Resin injection 15 - 30 minMold cleaning 8 min Clean up 12 min
Part removal 10 minFabrication Time 123 - 143 min Mold cleaning 10 min
Fabrication Time (R) 127 - 142 minFabrication Time (S) 111 - 126 min
Hand Lay-up RTM
Hand Lay-up RTM
Hand Lay-up RTM