Embed Size (px)
Citation preview
Evaluation of Heavy Metals Toxicity of Pharmaceuticals Industrial Wastewater by Pollution Indexing and
Chemometric Approaches
Vineeta Kumari1*, A. K. Tripathi1, A. Kannan2
1Ecology,Climate Change and Forest Influence Division, Forest Research
Institute(Deemed University), Dehradun, Uttrakhand, India 2Biomembrane Toxicology Laboratory, CSIR-Indian Institute of Toxicology Research,
Lucknow, Uttar Pradesh, India
Abstract : Water is the most important resource for life. Water quality and quantity is the main
global issue. Water scarcity dueto increased demand of water by different sectors for business,
industrial uses and agricultural activities has pressurized the sources of water. Industrialization has created the most challenging issues of water pollution by different types of organic,
inorganic and heavy metals which discharged into the water- bodies. Pharmaceutical also
contain different types of chemical constituents which released directly into the water-bodies without processing. Out of the inorganic and organic pollutants, heavy metals are the most
important toxicant which severely affects the water quality. In this study, water samples of two
pharmaceutical industries (A and B) were subjected to physico-chemical and heavy metal investigations. The obtained mean values of parameters were further processed for
Chemometric statistical assessment viz. Principal Component Analysis (PCA)/ Factor
Analysis (FA). The heavy metal toxicity was assessed by the indexing method such as Heavy
Metal Pollution Index (HPI) and Heavy Metal Evaluation Index (HEI). The PCA/FA showed that two factors F1and F2 values in the case of industry A and B were capable to explain
100% of total variances. The HPI values for industry A and B were108.78 and 52.14
respectively and HEI values were 4.15 and 8.67 respectively. The result revealed that the industry A falls in the category of high metal pollution category and low water quality and
industry B showed low heavy metal pollution and low water quality.
Keywords: Physico-chemical, chemometric, cluster analysis, heavy metal pollution index,
heavy metal evaluation.
Introduction
Recently, the increased demand of the pharmaceuticals has generated a large number of its
manufacturing units all over the globe and hence, the increased in pharmaceutical wastewater. Most of the drugs are manufactured by the chemical synthetic routes, which involves a series of complex chemical reactions
which release pharmaceutical wastewater. It is evaluated that about half of the global wastewater generated
from pharmaceutical industries are discharged as such from the outlets without its further required processing,
which contain different types of chemical ingredients in the form of inorganic and organic constituents, spent solvents, catalysts, total solids including heavy metals such as Cobalt, Iron, Cadmium, Nickel, Chromium
etc.(Ramola and Singh1,Rohit and Ponmurugan
2,Rao et al.
3,Mayabhate et al.
4, Vanerkar et al.
5, Sirtori et al.
6)are
potential ingredients having toxic characteristics to affect the soil, surface and ground water,which have
International Journal of ChemTech Research CODEN (USA): IJCRGG, ISSN: 0974-4290, ISSN(Online):2455-9555
Vol.10 No.5, pp 718-730, 2017
Vineeta Kumari et al /International Journal of ChemTech Research, 2017,10(5): 718-730. 719
adverse effects on the human health and living biotas(Oktem et al.
7, Foess and Ericson
8, Rashed 2010
9,
Chotpantarat et al.10
, Chotpantarat and Sutthirat11
, Taboada et al.12
). Water quality monitoring is a complicated
process in which a large number of datasets are generated and interpretations of the results become a tedious
work. The datasets contain rich hidden information. Water quality assessment of the indexing approach isthe method to study the composite effects of the various water quality parameters by organising the data in simple
and easiest way.For this purpose, various investigators have proposed different type of water quality indexing
methods and also pollution indices were developed for the specific purposes such as heavy metal pollution study (Prasad and Jaiprakas
13, Prasad and Bose
14).FA and PCA are the important methods for the study of the
relationships between samplevariables, distribution of data, reduction of data and finding out the patterns,
origin characteristic of parameters and the data representation, data interpretation and facilitation(Tariq et
al.15,16
,Bhuiyan et al.17
, Liu et al.18
, Ozbay et al.19
,Horton20
,Joung et al.21
, Landwehr22
, Nishidia et al.23
, Tiwary and Mishra
24, Franco et al.
25).Specific pollution indices also have been used to evaluate the extent of pollution
with respect to certain metals.In recent years heavy metal toxicity becomes most prominent issues in surface
and groundwater. Due to this reason, HPI a new method for evaluation of heavy metal pollution was developed (Prakash and Dagaonkar
26,Hui et al.
27).
Material and Methods
Study area
Lucknow district is a part of the central Gangetic plain of Uttar Pradesh covering an area of 2528 sq.km. It lies between 26
o30 ;́27
o10´N and 80
o 30 ;́81
o13´E. Two industries viz. Industry A Sarojaninagar at and
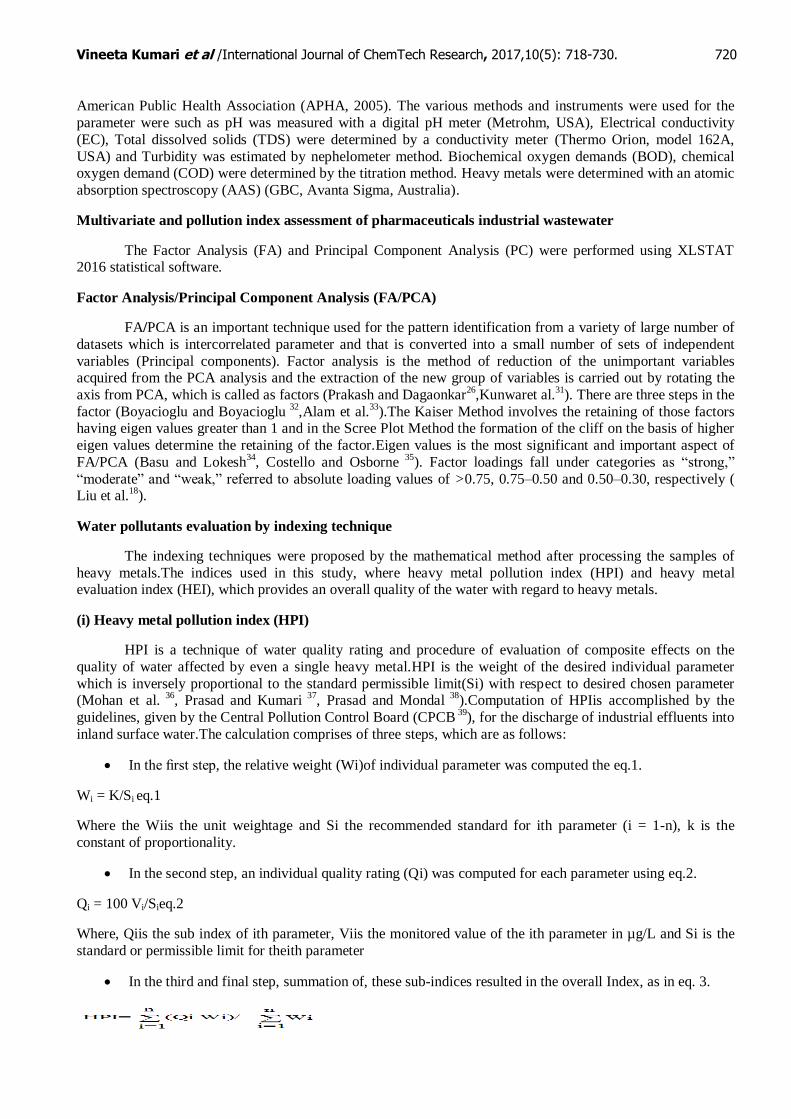
Industry B at Chinhat of Lucknow city was selected for the study (Figure 1).
Figure: 1 Location map of the study sites
(Websource = www.mapsofindia.com)
Physico-chemical and heavy metal assessment of wastewater
Total six samples were collected, three from each pharmaceutical industry, which are located at the
industrial area of Lucknow, Uttar Pradesh (India).
The samples were collected in 2 liter sterile plastic containers which were preserved by acidifying to
pH 2.0 with nitric acid and kept at 4oC until the analysis were carried out. The collected water samples were
filtered with Whatman filter paper no. 1.The collected wastewater samples as per the guidelines of the
Vineeta Kumari et al /International Journal of ChemTech Research, 2017,10(5): 718-730. 720
American Public Health Association (APHA, 2005). The various methods and instruments were used for the
parameter were such as pH was measured with a digital pH meter (Metrohm, USA), Electrical conductivity
(EC), Total dissolved solids (TDS) were determined by a conductivity meter (Thermo Orion, model 162A,
USA) and Turbidity was estimated by nephelometer method. Biochemical oxygen demands (BOD), chemical oxygen demand (COD) were determined by the titration method. Heavy metals were determined with an atomic
absorption spectroscopy (AAS) (GBC, Avanta Sigma, Australia).
Multivariate and pollution index assessment of pharmaceuticals industrial wastewater
The Factor Analysis (FA) and Principal Component Analysis (PC) were performed using XLSTAT 2016 statistical software.
Factor Analysis/Principal Component Analysis (FA/PCA)
FA/PCA is an important technique used for the pattern identification from a variety of large number of
datasets which is intercorrelated parameter and that is converted into a small number of sets of independent
variables (Principal components). Factor analysis is the method of reduction of the unimportant variables acquired from the PCA analysis and the extraction of the new group of variables is carried out by rotating the
axis from PCA, which is called as factors (Prakash and Dagaonkar26
,Kunwaret al.31
). There are three steps in the
factor (Boyacioglu and Boyacioglu 32
,Alam et al.33
).The Kaiser Method involves the retaining of those factors having eigen values greater than 1 and in the Scree Plot Method the formation of the cliff on the basis of higher
eigen values determine the retaining of the factor.Eigen values is the most significant and important aspect of
FA/PCA (Basu and Lokesh34
, Costello and Osborne 35
). Factor loadings fall under categories as “strong,”
“moderate” and “weak,” referred to absolute loading values of >0.75, 0.75–0.50 and 0.50–0.30, respectively ( Liu et al.
18).
Water pollutants evaluation by indexing technique
The indexing techniques were proposed by the mathematical method after processing the samples of
heavy metals.The indices used in this study, where heavy metal pollution index (HPI) and heavy metal evaluation index (HEI), which provides an overall quality of the water with regard to heavy metals.
(i) Heavy metal pollution index (HPI)
HPI is a technique of water quality rating and procedure of evaluation of composite effects on the
quality of water affected by even a single heavy metal.HPI is the weight of the desired individual parameter
which is inversely proportional to the standard permissible limit(Si) with respect to desired chosen parameter (Mohan et al.
36, Prasad and Kumari
37, Prasad and Mondal
38).Computation of HPIis accomplished by the
guidelines, given by the Central Pollution Control Board (CPCB 39
), for the discharge of industrial effluents into
inland surface water.The calculation comprises of three steps, which are as follows:
In the first step, the relative weight (Wi)of individual parameter was computed the eq.1.
Wi = K/Si eq.1
Where the Wiis the unit weightage and Si the recommended standard for ith parameter (i = 1-n), k is the
constant of proportionality.
In the second step, an individual quality rating (Qi) was computed for each parameter using eq.2.
Qi = 100 Vi/Sieq.2
Where, Qiis the sub index of ith parameter, Viis the monitored value of the ith parameter in µg/L and Si is the
standard or permissible limit for theith parameter
In the third and final step, summation of, these sub-indices resulted in the overall Index, as in eq. 3.
Vineeta Kumari et al /International Journal of ChemTech Research, 2017,10(5): 718-730. 721
Where, Qi is the sub index of ith parameter, Wiis the unit weightage for ith parameter and n is the number of
parameters considered. Normally, the critical pollution index value is 100.
(ii) Heavy metal evaluation index (HEI)
HEI is also the process of assessment of water quality with respect to heavy metals by providing
assigned values(Edet and Offiong 40
). HEI is computed as follows:
n
i=1
Hci/HmaciHEI=
Where Hcis the monitored value and Hmac is the maximum admissible concentration (MAC) of the ith parameter.
Results and Discussion
Physico-chemical and heavy metal analysis
Various physico-chemicals and heavy metal concentration determined and some basic descriptive statistics of wastewater of both the pharmaceutical industries are shown in Table1.After comparing with CPCB
standard, the result shows that pH, electrical conductivity, BOD and COD were above the permissible limit in
case of both the industries, whereas in the case of heavy metals, the concentration was almost within the limit except the Pb and As. In both the industries, Pb was above the permissible limit as prescribed by CPCB,while
As was greater than the prescribed limit (0.1ppm) in the case of industry B.Based on the concentration range
and abundance of heavy metals in both the industries ranking order are as follows:
Industry- A:Zn>Cu>Fe>Cr>Pb>Mn>Co>Cd>As>Ni >Hg
Industry –B:Zn.>Fe> Cu>As >Mn >Cr>Co> Pb>Ni>Cd>Hg
Table 1: Physico-chemical analysis and basic descriptive statistics of Pharmaceutical Industry Aand B
Parameters Unit Industry A
Mean ± SD
Industry B
Mean ± SD
Standard permissible
value (CPCB,39
)
Method
pH NS* 5.6±0.20 6.24±0.30 6.0-8.5 pH-meter
Conductivity µs/cm 1563.34±305 1336.67±81 1000 Conductivity-meter
TDS mg/L 920.34±238 741±42 21000 Conductivity-meter
Salinity ppt 2.7±1.0 1.72±1.0 NS* Conductivity-meter
BOD mg/L 7253.34±1770 3693.34±885 100 Winkler azide
COD mg/L 756.67±1948 7031.67±847 250 Dichromate method
Turbidity ntu 67.3±10 57.12±10 NS* Nephelometer
Cu mg/L 2.21±0.31 1.61±0.12 3 FAAS
Co mg/L 0.39±0.13 0.27±0.11 NS* FAAS
Cd mg/L 0.27±0.20 0.06±0.01 2 FAAS
Ni mg/L 0.05±0.01 0.07±0.02 3 FAAS
Pb mg/L 0.85±0.32 0.20±0.10 0.1 FAAS
Mn mg/L 0.84±0.23 0.56±0.15 2 FAAS
Cr mg/L 1.50±0.02 0.42±0.15 2 FAAS
Zn mg/L 3.11±0.45 2.39±0.51 5 FAAS
Fe mg/L 1.90±0.20 1.68±0.36 3 FAAS
As mg/L 0.07±0.02 0.82±0.18 0.2 AAS-VGA
Hg mg/L 0.004±0.001 0.002±0.001 0.01 VGA-Flameless AAS
Note: NS* abbreviate as: Not Specified
Vineeta Kumari et al /International Journal of ChemTech Research, 2017,10(5): 718-730. 722
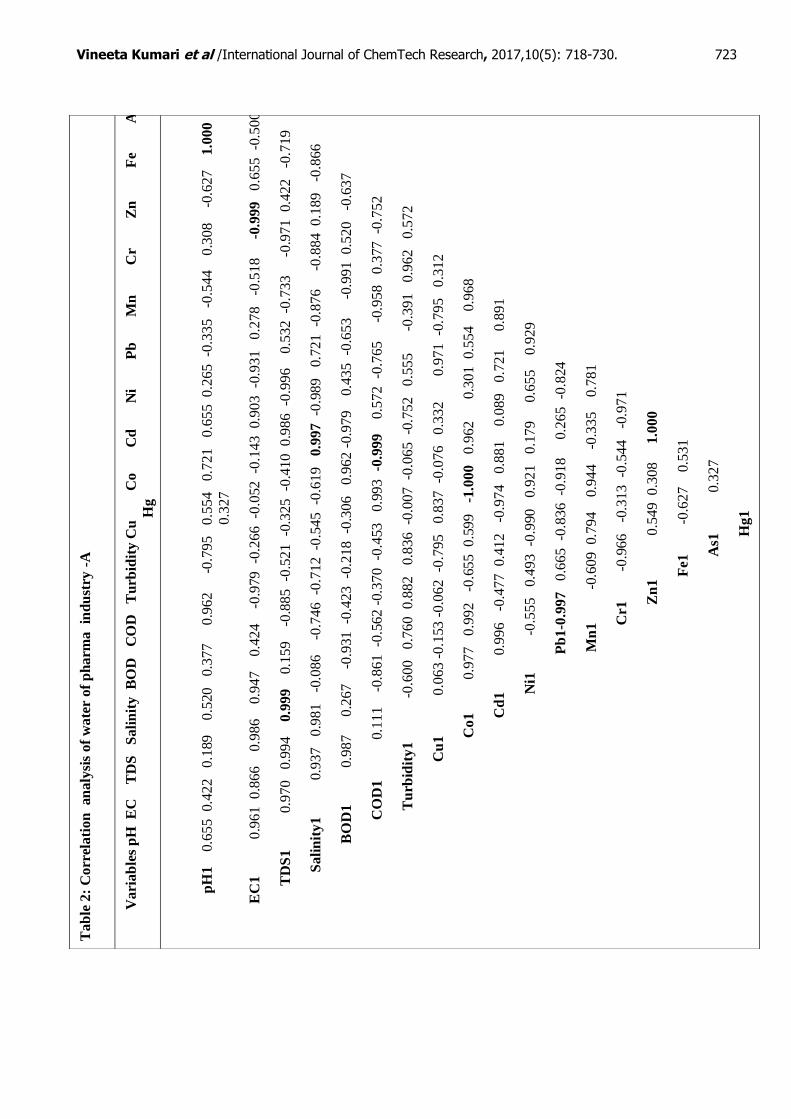
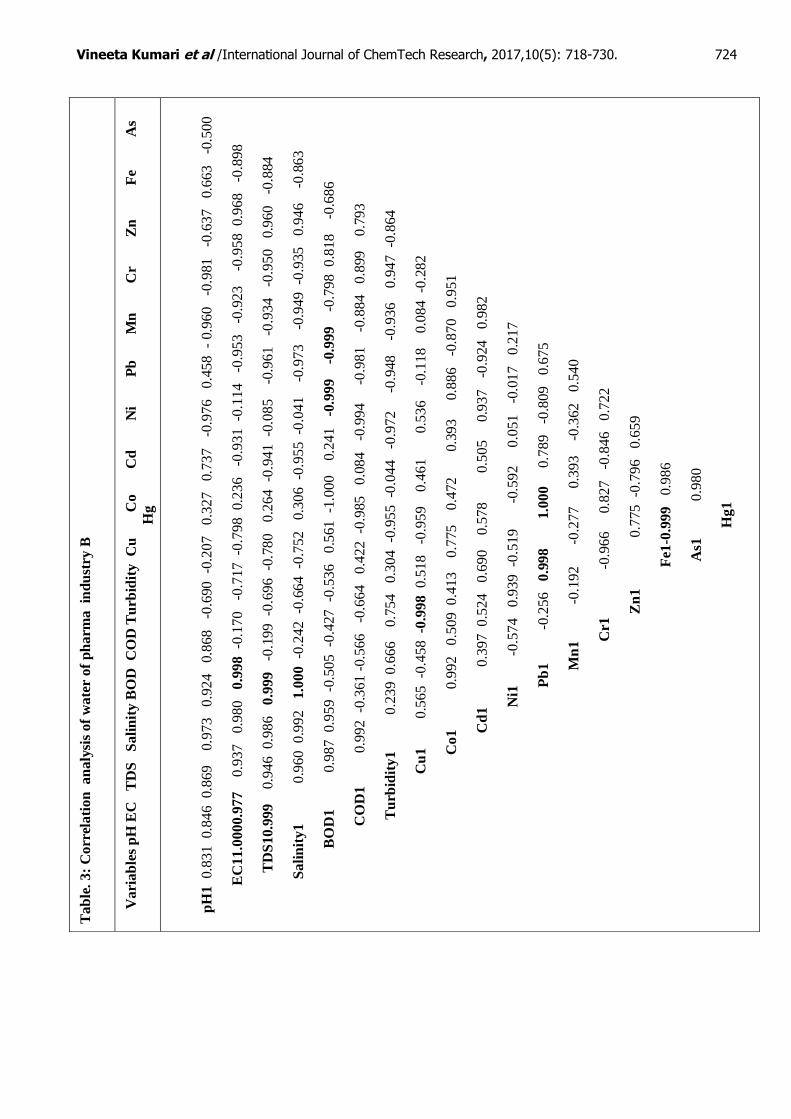
Factor/PCA analysis
For the evaluation of multivariate Factor/PCA analysis the raw data of sampling stations were subjected
into the Microsoft excel 2003 based statistical software packages known as Xlstat which generates the Pearson correlation matrix shown in Table 2 and 3 of industries A and B respectively. Eigen analysis of the Pearson
correlation coefficient matrix was applied to perform the factors/ principal components. Which, were
reproduced by the use of the statistical software Xlstat, which involves the centroid methods and varimax rotation (Ahmed et al.
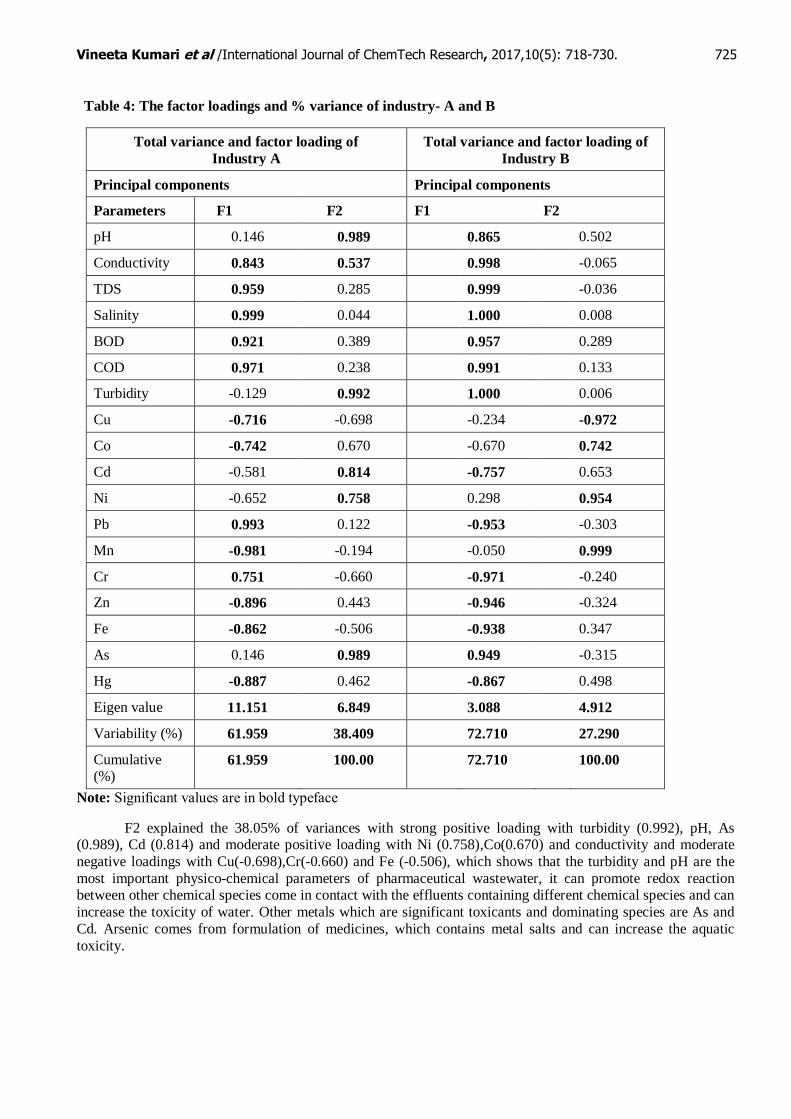
43). The result of FA/PCA (Table 4) indicated two components, showing the
characteristics of pharmaceutical industry wastewater A and B respectively. Only those factors were selected
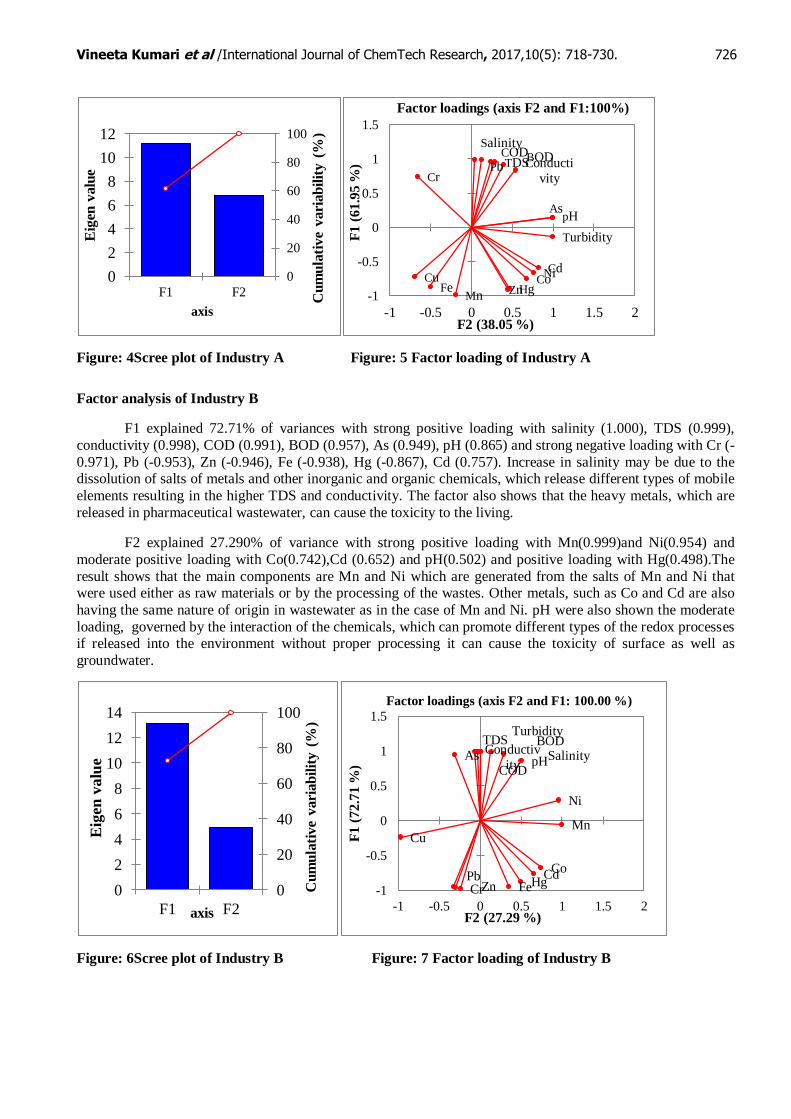
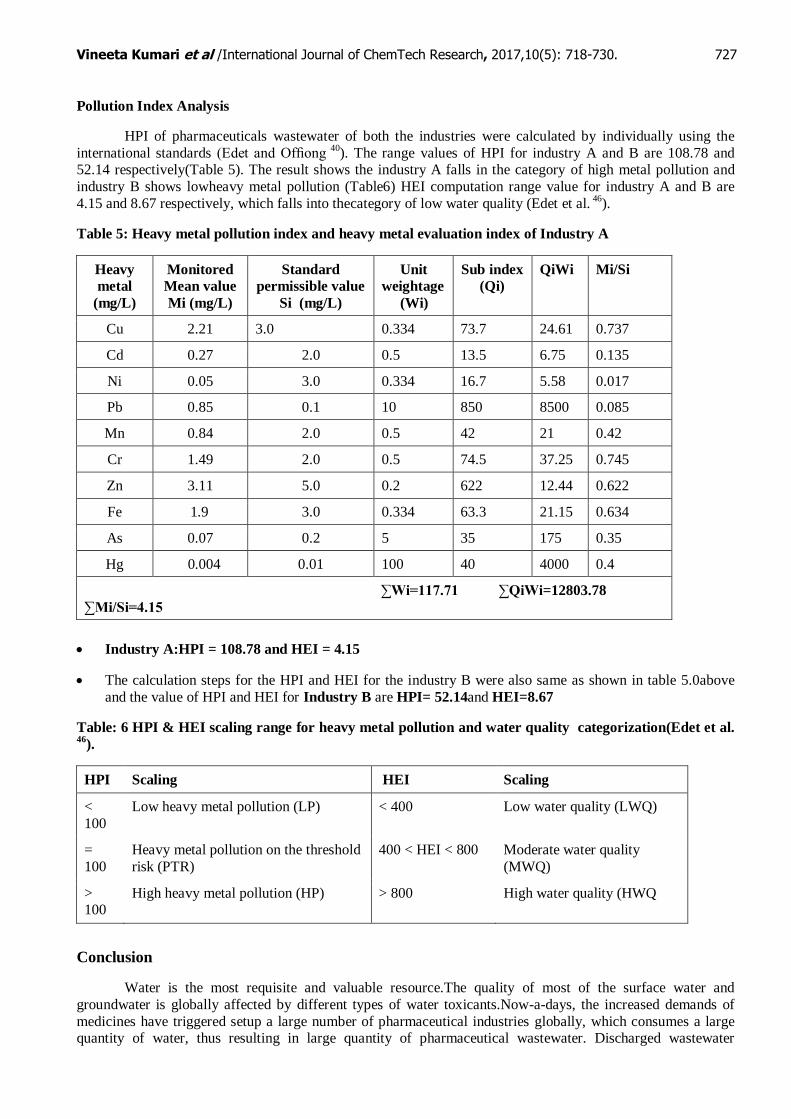
for the analysis, which have eigenvalue greater than one. The Fig. 4 and 6 shows the Scree plot of the eigenvalue for each component in which two Principal Component was obtained with eigenvalues >1 summing
100% of the total variance in the water dataset of Industry A and Industry B respectively. Figure 4 and 5, 6 and
7.0 respectively, represents the factor analysis result of industry A and B in which two significant factors were
generated which explain the eigen values, cumulative variability and factor loading variation of data set 100%. The factors are discussed below as in Table 4.0.
Factor Analysis of Pharma Industry A
F1 explained the 61.95% of variances with strong positive loadings with salinity (0.999), Pb
(0.993),COD(0.971), TDS (0.959), BOD (0.921), and conductivity (0.843) and negative strong loadings with Mn (-0.981), Zn (-0.896), Hg (-0.887), Fe (-0.862) and moderate positive loading with Cr (0.751) and moderate
negative loading with Co (-0.742) and Cu (-0.716).First factor shows the pollution of organic and inorganic
ingredients, which was used as raw materials for the chemical synthesis of pharmaceutical.Hence it generates a
higher amount of organic and inorganic toxicants, TDS, BOD, COD (Kavitha et al., 44
) and trace heavy metals in pharmaceutical wastewater (Rana et al.,
45).
Vineeta Kumari et al /International Journal of ChemTech Research, 2017,10(5): 718-730. 723
T
ab
le 2
: C
orr
ela
tio
n an
aly
sis
of
wate
r of
ph
arm
a
ind
ust
ry -
A
V
ari
ab
les
pH
E
C T
DS
S
ali
nit
y B
OD
C
OD
T
urb
idit
y C
u
Co C
d N
i P
b M
n C
r Z
n F
e A
s
Hg
pH
1
0.6
55
0.4
22 0
.189 0.5
20 0
.377 0
.962 -
0.7
95 0
.554 0
.721 0
.65
5 0
.26
5
-0.3
35 -
0.5
44 0
.30
8
-0.6
27
1.0
00
0.3
27
EC
1
0.9
61
0
.866 0.9
86 0.9
47 0.4
24
-0.9
79
-0.2
66
-0.0
52
-0.1
43
0.9
03
-0.9
31
0
.27
8 -
0.5
18
-
0.9
99
0
.65
5
-0.5
00
TD
S1
0.9
70 0
.994
0.9
99
0.1
59
-0.8
85
-0.5
21
-0.3
25
-0.4
10 0.9
86
-0
.99
6 0
.53
2
-0.7
33 -
0.9
71
0.4
22 -
0.7
19
Sa
lin
ity
1
0.9
37
0.9
81 -
0.0
86
-0.7
46
-0.7
12 -0
.545
-0.6
19 0
.99
7
-0.9
89
0
.72
1
-0.8
76
-
0.8
84 0
.18
9 -
0.8
66
BO
D1
0.9
87 0
.267
-0.9
31
-0.4
23
-0.2
18
-0.3
06 0
.962 -
0.9
79
0.4
35
-0.6
53
-
0.9
91
0.5
20 -
0.6
37
CO
D1
0
.111
-0.8
61
-0.5
62 -
0.3
70
-0.4
53 0
.993
-0.9
99
0.5
72
-0
.76
5 -
0.9
58 0
.377
-0
.75
2
Tu
rbid
ity1
-0.6
00 0
.760 0.8
82 0
.836
-0.0
07
-0.0
65
-0.7
52
0
.55
5
-0.3
91 0
.96
2 0
.57
2
Cu
1 0
.063 -
0.1
53 -
0.0
62
-0.7
95 0
.837
-0.0
76 0
.33
2 0
.97
1
-0.7
95
0
.31
2
Co1
0
.977 0
.992 -
0.6
55 0.5
99 -
1.0
00
0
.96
2
0.3
01
0.5
54
0.9
68
Cd
1
0.9
96 -
0.4
77
0.4
12 -
0.9
74 0
.881 0.0
89 0
.721
0
.89
1
Ni1
-0.5
55 0
.493
-0.9
90 0
.921 0
.17
9 0
.65
5
0.9
29
Pb
1-0
.997 0
.665
-0.8
36
-0.9
18 0
.26
5
-0.8
24
Mn
1
-
0.6
09 0.7
94 0.9
44
-0.3
35
0.7
81
Cr1
-0.9
66 -
0.3
13
-0.5
44 -
0.9
71
Zn
1
0.5
49 0.3
08 1
.00
0
Fe1
-0.6
27 0.5
31
As1
0
.327
Hg1
Vineeta Kumari et al /International Journal of ChemTech Research, 2017,10(5): 718-730. 724
Ta
ble
. 3
: C
orr
ela
tio
n a
naly
sis
of
wate
r of
ph
arm
a in
du
stry
B
V
ari
ab
les
pH
EC
T
DS
S
ali
nit
y B
OD
C
OD
Tu
rbid
ity C
u C
o C
d
Ni
P
b M
n C
r Z
n
F
e
As
Hg
pH
1
0.8
31
0.8
46
0.8
69
0.9
73 0
.924 0
.868 -
0.6
90
-0.2
07 0
.327 0
.737 -
0.9
76 0
.45
8
- 0.9
60
-
0.9
81
-
0.6
37 0
.66
3 -
0.5
00
EC
11
.00
00.9
77
0.9
37 0
.980 0
.998
-0.1
70 -
0.7
17
-0.7
98
0.2
36 -
0.9
31
-0.1
14 -
0.9
53 -
0.9
23
-0.9
58
0.9
68 -
0.8
98
TD
S1
0.9
99
0.9
46 0.9
86 0
.999 -
0.1
99
-0.6
96
-0.7
80 0
.264
-0.9
41
-0.0
85
-0.9
61
-
0.9
34 -
0.9
50 0
.96
0 -
0.8
84
Sa
lin
ity
1 0
.960 0.9
92 1
.000
-0.2
42
-0.6
64
-0.7
52 0
.306
-0.9
55
-0.0
41
-0.9
73
-0.9
49
-0
.935
0
.94
6
-0.8
63
BO
D1
0.9
87
0.9
59
-0.5
05
-0.4
27
-0.5
36 0
.561
-1.0
00 0.2
41
-
0.9
99
-0.9
99
-0.7
98
0
.81
8
-0.6
86
CO
D1
0
.992
-0.3
61 -
0.5
66 -
0.6
64 0
.422
-0.9
85 0
.084 -
0.9
94
-
0.9
81
-0.8
84 0
.899
0
.79
3
Tu
rbid
ity1
0.2
39 0.6
66 0.7
54 0
.304
-0.9
55
-0.0
44 -
0.9
72 -
0.9
48
-0.9
36 0
.94
7
-0.8
64
Cu
1
0.5
65
-0.4
58
-0.9
98
0.5
18 -
0.9
59 0.4
61 0
.53
6
-0.1
18
0.0
84
-0
.28
2
Co1
0
.992 0
.509 0.4
13 0.7
75 0.4
72 0
.39
3
0
.88
6 -
0.8
70 0
.951
Cd
1 0
.397 0.5
24 0
.690
0.5
78
0.5
05 0
.93
7 -
0.9
24
0
.98
2
Ni1
-0.5
74 0
.939
-0.5
19 -
0.5
92 0
.051
-
0.0
17
0
.21
7
Pb
1 -
0.2
56 0
.998 1.0
00 0
.789 -
0.8
09
0
.67
5
Mn
1
-0.1
92
-0.2
77 0
.393
-0.3
62
0
.54
0
Cr1
-
0.9
66 0
.827 -
0.8
46 0
.72
2
Zn
1
0.7
75
-0.7
96 0
.65
9
Fe1
-0.9
99
0
.986
As1
0.9
80
Hg1
Vineeta Kumari et al /International Journal of ChemTech Research, 2017,10(5): 718-730. 725
Table 4: The factor loadings and % variance of industry- A and B
Total variance and factor loading of
Industry A
Total variance and factor loading of
Industry B
Principal components Principal components
Parameters F1 F2 F1 F2
pH 0.146 0.989 0.865 0.502
Conductivity 0.843 0.537 0.998 -0.065
TDS 0.959 0.285 0.999 -0.036
Salinity 0.999 0.044 1.000 0.008
BOD 0.921 0.389 0.957 0.289
COD 0.971 0.238 0.991 0.133
Turbidity -0.129 0.992 1.000 0.006
Cu -0.716 -0.698 -0.234 -0.972
Co -0.742 0.670 -0.670 0.742
Cd -0.581 0.814 -0.757 0.653
Ni -0.652 0.758 0.298 0.954
Pb 0.993 0.122 -0.953 -0.303
Mn -0.981 -0.194 -0.050 0.999
Cr 0.751 -0.660 -0.971 -0.240
Zn -0.896 0.443 -0.946 -0.324
Fe -0.862 -0.506 -0.938 0.347
As 0.146 0.989 0.949 -0.315
Hg -0.887 0.462 -0.867 0.498
Eigen value 11.151 6.849 3.088 4.912
Variability (%) 61.959 38.409 72.710 27.290
Cumulative (%)
61.959 100.00 72.710 100.00
Note: Significant values are in bold typeface
F2 explained the 38.05% of variances with strong positive loading with turbidity (0.992), pH, As (0.989), Cd (0.814) and moderate positive loading with Ni (0.758),Co(0.670) and conductivity and moderate
negative loadings with Cu(-0.698),Cr(-0.660) and Fe (-0.506), which shows that the turbidity and pH are the
most important physico-chemical parameters of pharmaceutical wastewater, it can promote redox reaction between other chemical species come in contact with the effluents containing different chemical species and can
increase the toxicity of water. Other metals which are significant toxicants and dominating species are As and
Cd. Arsenic comes from formulation of medicines, which contains metal salts and can increase the aquatic
toxicity.
Vineeta Kumari et al /International Journal of ChemTech Research, 2017,10(5): 718-730. 726
Figure: 4Scree plot of Industry A Figure: 5 Factor loading of Industry A
Factor analysis of Industry B
F1 explained 72.71% of variances with strong positive loading with salinity (1.000), TDS (0.999),
conductivity (0.998), COD (0.991), BOD (0.957), As (0.949), pH (0.865) and strong negative loading with Cr (-
0.971), Pb (-0.953), Zn (-0.946), Fe (-0.938), Hg (-0.867), Cd (0.757). Increase in salinity may be due to the dissolution of salts of metals and other inorganic and organic chemicals, which release different types of mobile
elements resulting in the higher TDS and conductivity. The factor also shows that the heavy metals, which are
released in pharmaceutical wastewater, can cause the toxicity to the living.
F2 explained 27.290% of variance with strong positive loading with Mn(0.999)and Ni(0.954) and
moderate positive loading with Co(0.742),Cd (0.652) and pH(0.502) and positive loading with Hg(0.498).The
result shows that the main components are Mn and Ni which are generated from the salts of Mn and Ni that were used either as raw materials or by the processing of the wastes. Other metals, such as Co and Cd are also
having the same nature of origin in wastewater as in the case of Mn and Ni. pH were also shown the moderate
loading, governed by the interaction of the chemicals, which can promote different types of the redox processes if released into the environment without proper processing it can cause the toxicity of surface as well as
groundwater.
Figure: 6Scree plot of Industry B Figure: 7 Factor loading of Industry B
0
20
40
60
80
100
0
2
4
6
8
10
12
F1 F2
Cu
mu
lati
ve
vari
ab
ilit
y (
%)
Eig
en v
alu
e
axis
pH
Conducti
vity
TDS
Salinity BOD COD
Turbidity
Cu Co Cd Ni
Pb
Mn
Cr
Zn Fe
As
Hg -1
-0.5
0
0.5
1
1.5
-1 -0.5 0 0.5 1 1.5 2
F1
(6
1.9
5 %
)
F2 (38.05 %)
Factor loadings (axis F2 and F1:100%)
0
20
40
60
80
100
0
2
4
6
8
10
12
14
F1 F2
Cu
mu
lati
ve
vari
ab
ilit
y (
%)
Eig
en v
alu
e
axis
pH Conductiv
ity
TDS
Salinity BOD
COD
Turbidity
Cu
Co Cd
Ni
Pb
Mn
Cr Zn Fe
As
Hg -1
-0.5
0
0.5
1
1.5
-1 -0.5 0 0.5 1 1.5 2
F1 (
72.7
1 %
)
F2 (27.29 %)
Factor loadings (axis F2 and F1: 100.00 %)
Vineeta Kumari et al /International Journal of ChemTech Research, 2017,10(5): 718-730. 727
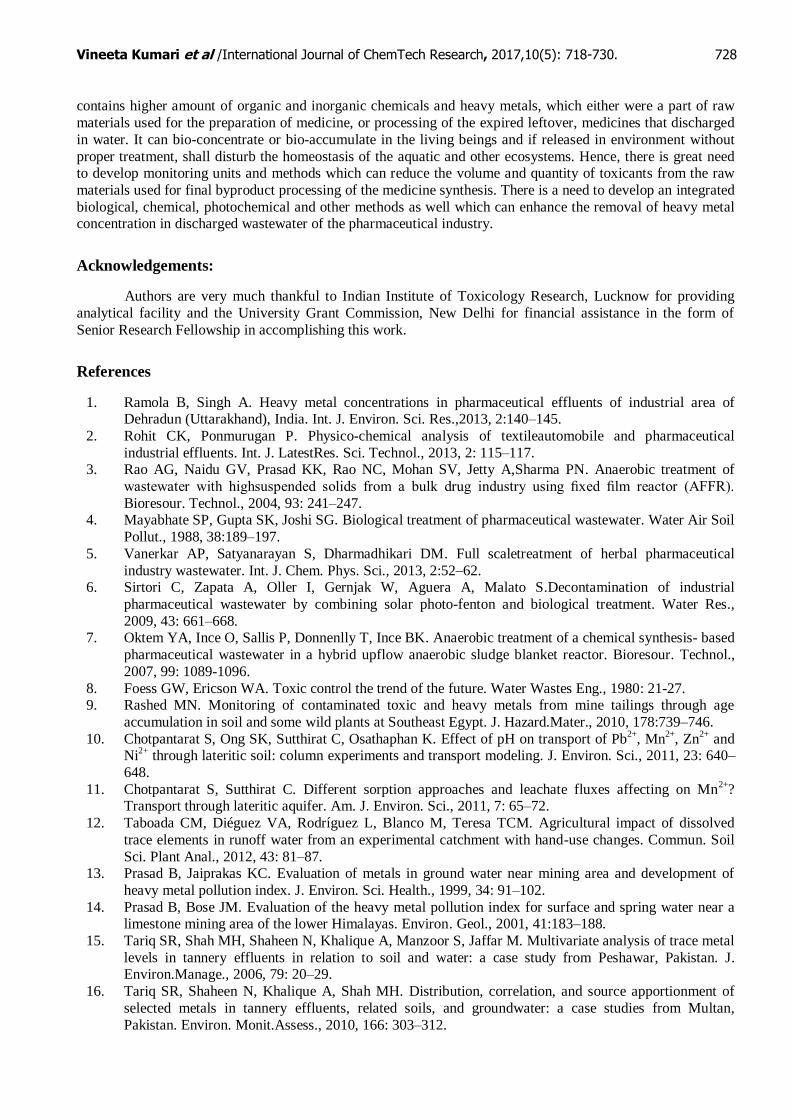
Pollution Index Analysis
HPI of pharmaceuticals wastewater of both the industries were calculated by individually using the
international standards (Edet and Offiong 40
). The range values of HPI for industry A and B are 108.78 and 52.14 respectively(Table 5). The result shows the industry A falls in the category of high metal pollution and
industry B shows lowheavy metal pollution (Table6) HEI computation range value for industry A and B are
4.15 and 8.67 respectively, which falls into thecategory of low water quality (Edet et al. 46
).
Table 5: Heavy metal pollution index and heavy metal evaluation index of Industry A
Heavy
metal
(mg/L)
Monitored
Mean value
Mi (mg/L)
Standard
permissible value
Si (mg/L)
Unit
weightage
(Wi)
Sub index
(Qi)
QiWi Mi/Si
Cu 2.21 3.0 0.334 73.7 24.61 0.737
Cd 0.27 2.0 0.5 13.5 6.75 0.135
Ni 0.05 3.0 0.334 16.7 5.58 0.017
Pb 0.85 0.1 10 850 8500 0.085
Mn 0.84 2.0 0.5 42 21 0.42
Cr 1.49 2.0 0.5 74.5 37.25 0.745
Zn 3.11 5.0 0.2 622 12.44 0.622
Fe 1.9 3.0 0.334 63.3 21.15 0.634
As 0.07 0.2 5 35 175 0.35
Hg 0.004 0.01 100 40 4000 0.4
∑Wi=117.71 ∑QiWi=12803.78
∑Mi/Si=4.15
Industry A:HPI = 108.78 and HEI = 4.15
The calculation steps for the HPI and HEI for the industry B were also same as shown in table 5.0above
and the value of HPI and HEI for Industry B are HPI= 52.14and HEI=8.67
Table: 6 HPI & HEI scaling range for heavy metal pollution and water quality categorization(Edet et al.
46).
HPI Scaling HEI Scaling
<
100
Low heavy metal pollution (LP) < 400 Low water quality (LWQ)
=
100
Heavy metal pollution on the threshold
risk (PTR)
400 < HEI < 800 Moderate water quality
(MWQ)
> 100
High heavy metal pollution (HP) > 800 High water quality (HWQ
Conclusion
Water is the most requisite and valuable resource.The quality of most of the surface water and
groundwater is globally affected by different types of water toxicants.Now-a-days, the increased demands of
medicines have triggered setup a large number of pharmaceutical industries globally, which consumes a large quantity of water, thus resulting in large quantity of pharmaceutical wastewater. Discharged wastewater
Vineeta Kumari et al /International Journal of ChemTech Research, 2017,10(5): 718-730. 728
contains higher amount of organic and inorganic chemicals and heavy metals, which either were a part of raw
materials used for the preparation of medicine, or processing of the expired leftover, medicines that discharged
in water. It can bio-concentrate or bio-accumulate in the living beings and if released in environment without
proper treatment, shall disturb the homeostasis of the aquatic and other ecosystems. Hence, there is great need to develop monitoring units and methods which can reduce the volume and quantity of toxicants from the raw
materials used for final byproduct processing of the medicine synthesis. There is a need to develop an integrated
biological, chemical, photochemical and other methods as well which can enhance the removal of heavy metal concentration in discharged wastewater of the pharmaceutical industry.
Acknowledgements:
Authors are very much thankful to Indian Institute of Toxicology Research, Lucknow for providing
analytical facility and the University Grant Commission, New Delhi for financial assistance in the form of
Senior Research Fellowship in accomplishing this work.
References
1. Ramola B, Singh A. Heavy metal concentrations in pharmaceutical effluents of industrial area of Dehradun (Uttarakhand), India. Int. J. Environ. Sci. Res.,2013, 2:140–145.
2. Rohit CK, Ponmurugan P. Physico-chemical analysis of textileautomobile and pharmaceutical
industrial effluents. Int. J. LatestRes. Sci. Technol., 2013, 2: 115–117. 3. Rao AG, Naidu GV, Prasad KK, Rao NC, Mohan SV, Jetty A,Sharma PN. Anaerobic treatment of
wastewater with highsuspended solids from a bulk drug industry using fixed film reactor (AFFR).
Bioresour. Technol., 2004, 93: 241–247. 4. Mayabhate SP, Gupta SK, Joshi SG. Biological treatment of pharmaceutical wastewater. Water Air Soil
Pollut., 1988, 38:189–197.
5. Vanerkar AP, Satyanarayan S, Dharmadhikari DM. Full scaletreatment of herbal pharmaceutical
industry wastewater. Int. J. Chem. Phys. Sci., 2013, 2:52–62. 6. Sirtori C, Zapata A, Oller I, Gernjak W, Aguera A, Malato S.Decontamination of industrial
pharmaceutical wastewater by combining solar photo-fenton and biological treatment. Water Res.,
2009, 43: 661–668. 7. Oktem YA, Ince O, Sallis P, Donnenlly T, Ince BK. Anaerobic treatment of a chemical synthesis- based
pharmaceutical wastewater in a hybrid upflow anaerobic sludge blanket reactor. Bioresour. Technol.,
2007, 99: 1089-1096.
8. Foess GW, Ericson WA. Toxic control the trend of the future. Water Wastes Eng., 1980: 21-27. 9. Rashed MN. Monitoring of contaminated toxic and heavy metals from mine tailings through age
accumulation in soil and some wild plants at Southeast Egypt. J. Hazard.Mater., 2010, 178:739–746.
10. Chotpantarat S, Ong SK, Sutthirat C, Osathaphan K. Effect of pH on transport of Pb2+
, Mn2+
, Zn2+
and Ni
2+ through lateritic soil: column experiments and transport modeling. J. Environ. Sci., 2011, 23: 640–
648.
11. Chotpantarat S, Sutthirat C. Different sorption approaches and leachate fluxes affecting on Mn2+
? Transport through lateritic aquifer. Am. J. Environ. Sci., 2011, 7: 65–72.
12. Taboada CM, Diéguez VA, Rodríguez L, Blanco M, Teresa TCM. Agricultural impact of dissolved
trace elements in runoff water from an experimental catchment with hand-use changes. Commun. Soil
Sci. Plant Anal., 2012, 43: 81–87. 13. Prasad B, Jaiprakas KC. Evaluation of metals in ground water near mining area and development of
heavy metal pollution index. J. Environ. Sci. Health., 1999, 34: 91–102.
14. Prasad B, Bose JM. Evaluation of the heavy metal pollution index for surface and spring water near a limestone mining area of the lower Himalayas. Environ. Geol., 2001, 41:183–188.
15. Tariq SR, Shah MH, Shaheen N, Khalique A, Manzoor S, Jaffar M. Multivariate analysis of trace metal
levels in tannery effluents in relation to soil and water: a case study from Peshawar, Pakistan. J. Environ.Manage., 2006, 79: 20–29.
16. Tariq SR, Shaheen N, Khalique A, Shah MH. Distribution, correlation, and source apportionment of
selected metals in tannery effluents, related soils, and groundwater: a case studies from Multan,
Pakistan. Environ. Monit.Assess., 2010, 166: 303–312.
Vineeta Kumari et al /International Journal of ChemTech Research, 2017,10(5): 718-730. 729
17. Bhuiyan MAH, Islam MA, Dampare SB, Parvez L, Suzuki S. Evaluation of hazardous metal pollution
in irrigation and drinking water systems in the vicinity of a coal mine area of northwestern Bangladesh.
J. Hazard Mater., 2010, 179:1065–1077.
18. Liu CW, Lin KH and Kuo YM. Application of factor analysis in the assessment of groundwater quality in a blackfoot disease area in Taiwan. Sci. Total Environ., 2003, 313:77–89.
19. Ozbay N, Yerel S and Ankara H. Investigation of cluster analysis in surface water in Yesilirmak River.
1st International Syposium on Sustainable Development, June 9-10 2009, Sarajevo, 237-240. 20. Horton RK. An index system for rating water quality. J. Water Pollut. Control Fed.,1965, 37:300–306.
21. Joung HM, Miller WW, Mahammah CN, Gultjens JCA. A generalised water quality index based on
multivariate factor analysis. J. Environ. Qual., 1979, 8:95–100.
22. Landwehr TM. A statistical view of a class of water quality indices. Water Res., 1979, 15:460- 468. 23. Nishidia N, Miyai M, Tada F, Suzuki S. Computation of index of pollution by metals in river water.
Environ.Pollut., 1982, 4:241–248.
24. Tiwary TN, Mishra M. A. Preliminary assignment of water quality index to major Indian rivers. Indian J. Environ. Prot., 1985, 5:276–279.
25. Franco UA, Lo´pez MC, Roca E, Ferna´ndez MML. Source identification of heavy metals in
pastureland by multivariate analysis in NW Spain. J. Hazard Mater., 2009, 165:1008– 1015. 26. Prakash MM, Dagaonkar A. Application of cluster analysis to physico-chemical parameters of
Munj Sagar Talab, Dhar (Madhya Pradesh, India). Recent Res. Sci. Technol., 2011, 3:41-50.
27. Hui Y, Yang Feng Zhou Huai-Cheng Guo, Hu Sheng,·Hui Liu and Xu Dao Cheng-Jie He. Analysis of
spatial and temporal water pollution patterns in Lake Dianchi using multivariate statistical methods. Environ. Monit.Assess., 2010, 170:407–416.
28. APHA. Standard Methods for the Examination of Water and Wastewater, American Public Health
Association, Washington, DC, USA, 21th edition.,2005. 29. Varol M, B Sen. Assessment of surface water quality using multivariate statistical techniques: a
case study of Behrimaz, Stream, Turkey. Environ. Monit.Assess., 2009, 159:543–553.
30. Zhaoa Y, Xia XH, Yang ZF and Wang F. Assessment of water quality in Baiyangdian lake using multivariate statistical techniques. The 18th Biennial Conference of International Society for
Ecological Modelling. Procedia Environmental Sciences. 2012, 13:1213-1226.
31. Kunwar SP, Malik A, Mohan D and Sinha S. Multivariate statistical techniques for the evaluation of
spatial and temporal variations in water quality of Gomti River (India): a case study. Water Res., 2004, 38: 3980–3992.
32. Boyacioglu H, Boyacioglu H. Surface water quality assessment by environmetric methods. Environ.
Monit.Assess., 2007, 131:71–376. 33. Alam MJB, Ahmed AAM and Ali E. Evaluation of surface water quality of Surma river using
factor analysis. Proc. of Int. Conf. Environ.Aspects of Bangladesh (ICEAB10), Japan. 2010, 186-188.
34. Basu S, Lokesh KS. Evaluation of Cauvery river water quality at Srirangapatna in Karnataka using
principal component analysis. Int. J. Eng. Sci., 2012, 1:6-12. 35. Costello AB, Osborne JW. Best Practices in exploratory factor analysis fourrecommendations for
getting the most from your analysis. Pract. Assess. Res. Eval., 2005, 10:1-9.
36. Mohan SV, Nithila P, Reddy SJ. Estimation of heavy metal in drinking water and development of heavy metal pollution index. J. Environ. Sci. Health Part A., 1996, 31:283-289.
37. Prasad B, Kumari S. Heavy metal pollution index of ground water of an abandoned open cast
mine filled with fly ash: A case study. Mine Water Environ., 2008, 27:265-267. 38. Prasad B, Mondal, KK. The impact of filling an abandoned opencast mine with fly ash on
ground water quality: A case study. Mine Water Environ., 2008, 27:40-45.
39. CPCB. General Standards for Discharge of Effluents, Gaseous Emission, Automobile Exhaust, Noise
and Ambient Air Quality. Central Pollution Control Board, New Delhi. 1995. 40. Edet AE, Offiong OE. Evaluation of water quality pollution indices for heavy metal contamination
monitoring: A study case from Akpabuyo-Odukpani area, Lower Cross river basin (southeastern
Nigeria). Geo. J., 2002, 57:295–304. 41. Onojake MC, Abrakasa S. Multivariate statistical analysis onpollution level of Woji River in Port
Harcourt, Nigeria. Int. J. Environ. Bioenergy, 2012 2:43-52.
42. Simeonova V, Stratisb JA, Samarac C, Zachariadisb G, Voutsac D, Anthemidis A, Sofonioub M, and
Kouimtzisc T. Assessment of the surface water quality in Northern Greece. Water Res., 2003, 37:4119–4124.
Vineeta Kumari et al /International Journal of ChemTech Research, 2017,10(5): 718-730. 730
43. Ahmed SM, Hussain M and Abderrahman W. Using multivariate factor analysis to assess
surface/logged water quality and source of contamination at a large irrigation project at Al-
Fadhli, Eastern Province, Saudi Arabia. Bull. Eng. Geol. Environ., 2005, 64:315-232.
44. Kavitha RV, Murthy VK, Makam R, Asith KA. Physico-Chemical analysis of effluents from pharmaceutical industry andits efficiency study. Int. J. Eng. Res. Appl., 2012, 2:103–110.
45. Rana RS, Singh P, Kandari V, Singh R, Dobhal R, Gupta S. A review on characterization and
bioremediationof pharmaceutical industries’ wastewater: an Indian perspective. Appl. Water Sci., 2013, 3:501-514.
46. Edet AE, Merkel BJ and Offiong OE. Trace element hydro-chemical assessment of the Calabar Coastal
Plain Aquifer, southeastern Nigeria using statistical methods. Environ. Geol., 2003, 44:137-149.
*****


![ISSN Metal Toxicity in the Biological Environment · detoxiication of heavy metals [14]. However, they may themselves be subject to metal toxicity. This is of importance in some key](https://img.pdfslide.net/doc/110x75/5ed29e4e9c816a0c43326359/issn-metal-toxicity-in-the-biological-environment-detoxiication-of-heavy-metals.jpg)