Embed Size (px)
Citation preview

Evaluation of High-Intensity Sheeting for Overhead Highway Signs
R. N. Robertson, Virginia Highway and Transportation Research Council
The purpose of this research was to determine the feasibility of using high·intensity sheeting on overhaad highway signs without external illumination. The brightness of five high·intensity overhead signs without illumination was compared with that of five conventional signs with illumination. All experimentation was conducted in the field under the physical and environmental conditions experienced by the highway user. Luminance measurements were made with a telephotometer at the driver's eye position in 11 domestic automobiles. A total of 4821 lumi· nance measurements were recorded from the travel lanes of illuminated and nonilluminated roadways. It was concluded that external lighting can be eliminated through the use of high-intensity sheeting on many overhead signs without adversely affecting the service to motorists.
The current practice in Virginia is to reflectorize and illuminate all overhead signs. Reflectorization is obtained by using enclosed-lens reflective sheeting as background and legend materials, and diffuse illumination on the sign surface is provided by lighting fixtures. Many of the lighting fixtures are fluorescent; however, the newer overhead sign installa.l:ions are equipped with mercury vapor fixtu 1·es. Although overhead signs play a significant role in the safe and 01·derly [low of traffic, they do create problems for traffic engineers and maintenance personnel. One of these problems is exte1·nal illumination. Cost is always an important facto1·, and the expense of the initial light installation is compounded by the greal distances to the power sources and unfavorable wo.rking conditions on heavily traveled highways . The maintenance of the lighting has proved to be a regu -lar and continuing process that requires periodic night inspections to locate malfunctioning lights, and thP. repairs require that equipment and workers be on t:he roadway. Associated with the malfunctioning illuirJ.nation is the loss of sign service to motorists. Several studies have shown that the brightness of conventional signs is reduced drastically when the lighting is eliminated, and thus the level of visibility on the conventional unlighted sign is not sufficient for the average driver
Publication of this paper sponsored by Committee on Visibility .
28
(1,2,3). Another factor is the demand for electrical energy. In view of the national prognm for energy selfsufficiency', every practical means of energy conservation must be explored.
Studies have concluded that the brightness of encapsulated-lens (high-intensity) sheeting is superior to that of the enclosed-lens sheeting currently used on overhead traffic signs (1,2,3,4). The performance of the high-intensity sheeting s1io\vs significant promise, a11d the purpose of this research was to determine the feasibility of using the material on overhead highway signs without illumination. Since s ign brightness standards have not been established a comparative technique was employed whereby the brightness of high-intensity overhead signs without illumination was compared with that of conventional signs with illumination.
All experimentation was conducted in the field under physical and environmental conditions experienced by motorists. Luminance measurements were made of the legend and background materials with a telepbotometer at the driver's eye position in a variety of conventional automobiles. All measurements were taken from the travel lanes. The major portion of the evaluation was performed on signs installed on nonilluminated highways; however, several experiments were conducted on Signs with ambient li hting because of the trend toward illuminating highways, especially in urban areas. Human factors were inco1·porated into the study by requesting individuals such as police officers, engineers, and motor·sts to make visual comparisons of the visibility and legibility of the signs.
PHOTOMETRIC INSTRUMENTATION
Luminance measurements were made with a telephotometer that measured the amount of i·eflected light from the sign surface. The instrument had a transistorizeu photomultiplier and electrometer a111plifie1·, independent battery power supply, 2-min angle sensing probe, and internal standardization and calibration. Allh ugh live acceptance angles we1·e available with the instrument the 2 -min angle sensing probe was chose:n since it closely approach s the 20/ 40 acuity eyesight required for licensing of drive1· in Virginia. Furthermore, this acceptance
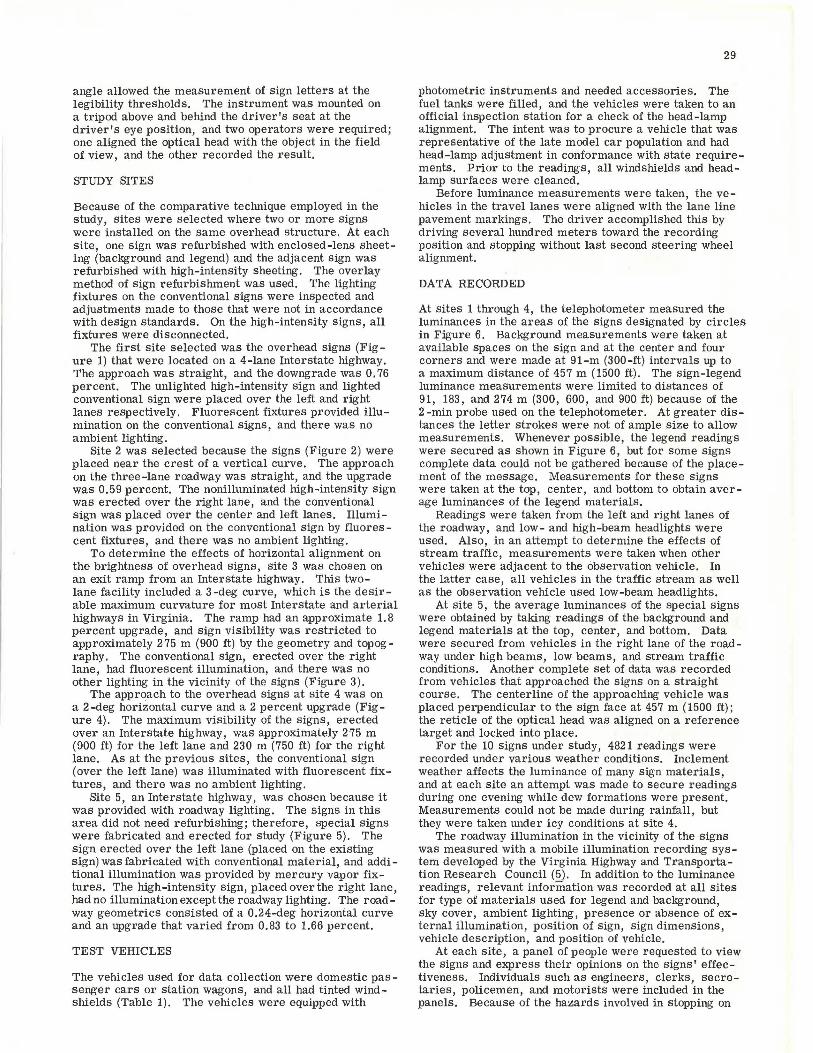
angle allowed the measurement of sign letters at the legibility thresholds. The instrument was mounted on a tripod above and behind the driver's seat at the driver's eye position, and two operators were required; one aligned the optical head with the object in the field of view, and the other recorded the result.
STUDY SITES
Because of the comparative technique employed in the study, sites were selected where two or more signs were installed on the same overhead structure. At each site, one sign was refurbished with enclosed-lens sheeting (background and legend) and the adjacent sign was refurbished with high-intensity sheeting. The overlay method of sign refurbishment was used. The lighting fixtures on the conventional signs were inspected and adjustments made to those that were not in accordance with design standards. On the high-intensity signs, all fixtures were disconnected.
The first site selected was the overhead signs (Figure 1) that were located on a 4-lane Interstate highway. The approach was straight, and the downgrade was 0. 76 percent. The unlighted high-intensity sign and lighted conventional sign were placed over the left and right lanes respectively. Fluorescent fixtures provided illumination on the conventional signs, and there was no ambient lighting.
Site 2 was selected because the signs (Figure 2) were placed near the crest of a vertical curve. The approach on the three-lane roadway was straight, and the upgrade was 0.59 percent. The nonilluminated high-intensity sign was erected over the right lane, and the conventional sign was placed over the center and left lanes. Illumination was provided on the conventional sign by flu ores -cent fixtures, and there was no ambient lighting.
To determine the effects of horizontal alignment on the brightness of overhead signs, site 3 was chosen on an exit ramp from an Interstate highway. This two-lane facility included a 3-deg curve, which is the desirable maximum curvature for most Interstate and arterial highways in Virginia. The ramp had an approximate 1. 8 percent upgrade, and sign visibility was restricted to approximately 275 m (900 ft) by the geometry and topography. The conventional sign, erected over the right lane, had fluorescent illumination, and there was no other lighting in the vicinity of the signs (Figure 3).
The approach to the overhead signs at site 4 was on a 2-deg horizontal curve and a 2 percent upgrade (Figure 4). The maximum visibility of the signs, erected over an Interstate highway, was approximately 275 m (900 ft) for the left lane and 230 m (750 ft) for the right lane. As at the previous sites, the conventional sign (over the left lane) was illuminated with fluorescent fixtures, and there was no ambient lighting.
Site 5, an Interstate highway, was chosen because it was provided with roadway lighting. The signs in this area did not need refurbishing; therefore, special signs were fabricated and erected for study (Figure 5). The sign erected over the left lane (placed on the existing sign) was fabricated with conventional material, and additional illumination was provided by mercury vapor fixtures. The high-intensity sign, placed over the right lane, had no illumination except the roadway lighting. The roadway geometrics consisted of a 0.24-deg horizontal curve and an upgrade that varied from 0.83 to 1.66 percent.
TEST VEHICLES
The vehicles used for data collection were domestic pas -senger cars or station wagons, and all had tinted windshields (Table 1). The vehicles were equipped with
29
photometric instruments and needed accessories, The fuel tanks were filled, and the vehicles were taken to an official inspection station for a check of the head-lamp alignment. The intent was to procure a vehicle that was representative of the late model car population and had head-lamp adjustment in conformance with state requirements. Prior to the readings, all windshields and headlamp surfaces were cleaned.
Before luminance measurements were taken, the vehicles in the travel lanes were aligned with the lane line pavement markings. The driver accomplished this by driving several hundred meters toward the recording position and stopping without last second steering wheel alignment.
DATA RECORDED
At sites 1 through 4, the telephotometer measured the luminances in the areas of the signs designated by circles in Figure 6. Background measurements were taken at available spaces on the sign and at the center and four corners and were made at 91-m (300-ft) intervals up to a maximum distance of 457 m (1500 ft). The sign-legend luminance measurements were limited to distances of 91, 183, and 274 m (300, 600, and 900 ft) because of the 2-min probe used on the telephotometer. At greater distances the letter strokes were not of ample siZe to allow measurements. Whenever possible, the legend readings were secured as shown in Figure 6, but for some signs complete data could not be gathered because of the placement of the message. Measurements for these signs were taken at the top, center, and bottom to obtain average luminances of the legend materials.
Readings were taken from the left and right lanes of the roadway, and low- and high-beam headlights were used. Also, in an attempt to determine the effects of stream traffic, measurements were taken when other vehicles were adjacent to the observation vehicle. In the latter case, all vehicles in the traffic stream as well as the observation vehicle used low-beam headlights.
At site 5, the average luminances of the special signs were obtained by taking readings of the background and legend materials at the top, center, and bottom. Data were secured from vehicles in the right lane of the roadway under high beams, low beams, and stream traffic conditions. Another complete set of data was recorded from vehicles that approached the signs on a straight course. The centerline of the approaching vehicle was placed perpendicular to the sign face at 457 m ( 1500 ft); the reticle of the optical head was aligned on a reference target and locked into place.
For the 10 signs under study, 4821 readings were recorded under various weather conditions. Inclement weather affects the luminance of many sign materials, and at each site an attempt was made to secure readings during one evening while dew formations were present. Measurements could not be niade during rainfall, but they were taken under icy conditions at site 4.
The roadway illumination in the vicinity of the signs was measured with a mobile illumination recording system developed by the Virginia Highway and Transportation Research Council (5). In addition to the luminance readings, relevant information was recorded at all sites for type of materials used for legend and background, sky cover, ambient lighting, presence or absence of external illumination, position of sign, sign dimensions, vehicle description, and position of vehicle.
At each site, a panel of people were requested to view the signs and express their opinions on the signs' effectiveness. Individuals such as engineers, clerks, secretaries, policemen, and motorists were included in the panels. Because of the hazards involved in stopping on

30
the traveled lanes, these observations were made from a vehicle parked on the right shoulder. On each visit the signs were first viewed at 366 m (1200 ft), or at the maximum visibility distance, under the various lighting conditions. With the signs displayed at this distance, the panel members were asked for their opinions relative to the attention or target value of the signs through
Figure 1. Experimental overhead signs at site 1.
~ WE S'
Dulles Airport
-L!.:..:~
Figure 2 . Experimental overhead signs at site 2.
Figure 3. Experimental overhead signs at site 3.
II' SOUTH
' Fairfax
II' NORTH
Vienna /'
Figure 4. Experimental overhead signs at site 4.
·;'.• SOUTH ',81
Salem Bristol
+ +
(!I' e NORTH
Lexinqton ___t_
Figure 5. Experimental overhead signs at site 5.
questions such as, Which sign did you observe first? What sign characteristics attracted your attention? and Do you feel that both signs have sufficient brightness to gain the attention of the motoring public at this distance? After the comments were recorded, the vehicle was moved forward and stopped at 183 m (600 ft). Questions were asked relative to legibility and the degree and uniformity of brightness. Upon leaving the site, each individual was requested to express a preference between the two traffic signs.
ANALYSIS OF RESULTS
It is generally accepted that the sign legibility distance is 15 m (50 ft) for every 2.5 cm (1 in) of letter height (6). The letters on the signs under study had heights of 30.5 and 40. 6 cm ( 12 and 16 in); therefore, the signs were legible in the 183 to 244-m (600 to 800-ft) range. A study has shown that the visibility distance is a function of the sign dimension, the brightness contrast of the letters to the sign background, and the contrast of the sign with its environment (7). Considering the size of the sign letters, the brightness-values of the sign materials, and the surrounding terrain, the visibility recognition distance for the signs erected over nonilluminated roadways (sites 1 through 4) was in the 335 to 366-m (1100 to 1200-ft) range. At site 5 the visibility distance of the signs on the illuminated roadway was in the 244 to 305-m (800 to 1000-ft) range.
Since the brightness or luminance of a sign placed over the highway is a function of the characteristics of the sign material; the trigonometric relationship between the car, the sign, and the roadway; and the illumination reaching the sign from the headlights, it is necessary to
Figure 6. Brightness
08 0
measurement locations. ol 0
0
0 !o oj
0
Table 1. Vehicles used in study.
No. o[ No. o[ Year Make and Modal Headli~hts Vehicles Site
1970 Plymouth, 4-door sedan 4 1. 2, 3, 1974 Ve~a. 2-door coupe 2 1, 2, 3, 1974 Mercury, 4-door sedan 4 3. 5 1970 Ford, station wagon 4 1. 4 1971 Plymouth, 4-door sedan 4 4 1972 Ambassador, 4-door sedan 4 1. 2, 4 1973 Pl.vmouth, 4-door sP.cian 4 l 2, 3
Total 11

discuss each site separately because the roadway geometrics vary.
Site 1
Figure 7 shows the measured average luminances of the background and legend materials of the two signs at site 1 under high beams, low beams, and stream traffic conditions. For high-beam headlights, the average luminance of the unlighted high-intensity background material was brighter than that for the conventional material at 183, 274, and 366 m (600, 900, and 1200 ft). A statistical analysis revealed that, although the luminance of the conventional legend material was greater than that for the high-intensity material, the difference was not statistically significant.
For a motorist traveling alone on the highway and using low beams the average luminance of the lighted conventional material was greater than that for the unlighted high-intensity material. Under stream traffic conditions, the average luminances of the conventional materials were slightly higher than those for the highintensity materials; however, the differences were not statistically significant within the visibility and legibility distances. The standard deviations revealed that the brightness of the high-intensity sign was much more uniform than that of the lighted conventional sign.
The majority of the 11 people viewing these signs stated that they first observed the conventional sign because of the bright spot created by the exterior lighting. However, they unanimously agreed that at 183 m (600 ft) the luminance appeared greater and more uniform for the high-intensity sign and that it was more legible than the conventional sign. Upon leaving the site, each person stated he or she would prefer the high-intensity sign.
Site 2
Because of roadway geometrics, more illumination from the headlights could reach the sign at site 2 than at site 1, and, as expected, the average luminance readings of the signs were greater. Figure 8 shows that with high beams the high-intensity material was brighter than the conventional material except at 91 m (300 ft). With low beams, the lighted conventional sign was brighter than the unlighted high-intensity sign. In stream traffic, the average luminances of the two background materials were practically the same, although the brightness of the conventional legend material was greater than that of the high-intensity material. The 13 people visiting this site responded in a similar manner to those who visited site 1, with the exception that one-third of the individuals stated that they observed the high-intensity sign before the conventional sign.
Site 3
The nighttime luminance data for site 3 are shown in Figure 9. The measurements were restricted to a maximum of 274 m (900 ft) because of a cut slope on the inside of the 3 -deg horizontal curve. Generally, the luminance readings for these signs were lower than those recorded at the previous two sites. The degree of illumination reaching the signs from the vehicle head lamps was limited because of the horizontal curve, and at all observation locations the brightness of the conventional sign was superior to that of the high-intensity sign. The 13 people who viewed these signs stated unanimously that the lighted conventional sign provided better visibility and legibility.
31
Site 4
Figure 10 shows that the luminances of the signs at site 4 were similar to those measured at site 3. Although the conventional sign was brighter than the high-intensity sign, the luminances for both signs were generally low. The six persons who viewed the signs agreed that the conventional sign provided the better service. Measurements were made of the conventional sign without exterior illumination to determine the effect of a service interruption on the brightness of the sign. At 183 m (600 ft), with high-beam head lamps, there were brightness reductions of 23 and 53 percent for the background and legend materials respectively. By using low beams, the motorist would experience a reduction of 83 percent in the luminance of background material, and the brightness of the legend decreased by 90 percent when the external lighting was absent on the conventional sign. Readings were taken when the signs were covered with ice, and the brightness of the conventional sign, even under nonilluminated conditions, increased while the luminance of the high-intensity sign was not affected.
Site 5
The luminances of the overhead signs at site 5, the only location studied that had roadway lighting, are shown in Figures 11 and 12. Figure 11 shows the data recorded when the signs were approached on a curve, and Figure 12 shows the brightness of the signs when the vehicle traveled directly toward them on a straight approach.
On the curved approach, under high-beam conditions, the luminances of the high-intensity background and legend materials exceeded those of the conventional materials within the legibility and visibility distances. Although the luminance readings of the conventional materials were greater than those of the high-intensity materials for low-beam and stream traffic conditions, there were no statistical differences between the background materials. On the straight approach (Figure 12) the special sign luminances, within the legibility range, were basically equivalent to those recorded on the curved approach; however, the brightness did increase at greater distances from the signs that were within the visibility distance range.
Six people viewed the special signs erected for this study site, and each expressed difficulty in observing the signs at 457 m (1500 ft); this fact emphasized the validity of the shorter computed visibility distances on illuminated roadways. For high-beam and stream traffic conditions, the unanimous preference of these people was for the highintensity sign. The majority of the same individuals stated that they observed no difference in the brightnesses between the two signs under low.,.beam head lamps.
CONCLUSIONS AND RECOMMENDATIONS
The objective of this study was to compare the field brightness of high-intensity overhead signs without external illumination to that of the lighted conventional signs. The sign luminances measured and reported in this study should not be interpreted as luminescent standards. The National Cooperative Highway Research Program is funding a project that will establish such standards. However, earlier investigators have suggested luminance levels for signs, and several of the measurements taken on the evaluated signs were below these levels (8). The analysis revealed a resemblance among the luminances of signs erected over roadways with similar configurations. The conclusions based on the findings from signs erected over straight, curved,

32
Figure 7. Nighttime average luminance versus distance at site 1.
LOW BEAHS IN
100 - STREAM TRAFFIC HIGH BEAMS
100 100 LOW BEAMS
50
"'
~--Q.,Conv.
E 'e
' LEGEND
~ 10 -H.I.
"' ~ u z < Conv . i!:
Qo...-,-0---e---0---0 ::;: ;..i ....
~ I.
~onv . 50 lir/ ~ p;, H.I.
"'-~ ~ 10
"' u z < i!: ::;: ;..i ....
1.
50 G)..-~onv . --El
"' E ' LEGEND .,; 10 .\!.
"' u H.I. z
<
~:v· i!: ::;: ::> ....
1. BACKGROUND --o
BACKGROUND .s .5 .5
I I I
0 91 274 457 91 274 457 0 91 274 457 DISTANCE (ml DISTANCE (ml DISTANCE (ml
Note: I m = 3.28 ft and I cd/m2 = 0.291 ft ·L
Figure 8. Nighttime average luminance versus distance at site 2.
HIGH BEAHS LOW BEAMS IN
100 100 -LOW BEAHS 100 - STREAH TRAFFIC
50 50 50
c:>---e---Q Conv. G)..---<:r--e Conv.
"' "'- .... LEGEND E 8 E ' ' LEGEND ' ~H.I. i 10 ~ 10 .,; 10 -
/H.I. .\!.
lol "' lol u u 5 - u z d'J z z < < Conv. < Conv . i!: i!: ..,......a..__>Q i!: ~ 0 • ... ::;: BACKGROUND ::s
~ ::s
8 8 8 H.J.
BACKGROUND 1, 1. 1.
BACKGROUND . 5 .5 .~
I I ' I ' 91 274 457 0 91 274 457 0 91 274 457
DISTANCE (m) DISTANCE (m) DISTANCE (m)
Note: I m = 3.28 fl and I cd/m~ = 0.291 fl.L.
Figure 9. Nighttime average luminance versus distance at site 3.
LOW BEAHS IN
100 HIGH BEAHS
100 LOW BEAMS 100 - STREAM TRAFFIC
50 50 50
"'- ' Conv. "'- ~v. .... 0.-~ Conv. ~ '~~
E ~ ' "0 LEGEND " . .,; 10 .,; 10 '-o .,; 10
.\!. . .\!. LEGEND .\!. ".\:> lol "' lol u u u
~ z z z < < '-._11.r. < i!: i!: z ::s ::s 0..._~onv, i 8 8 8
.
1. I . BACKGROUND 1 , - MC<~ . 5 . 5 .s -
H.I. I I
91 274 457 0 91 274 457 0 91 274 457
DISTANCE (m) DISTANCE (m) DISTANCE (ml
Note: I m = 3.28 ft and I cd/m2 = 0.291 ft -L.

Figure 10. Nighttime average luminance versus distance at site 4.
HIGH BEAMS 100 100 - LOW BEAMS
50 50 -
.Q Conv,
N- 0- N e.~nv. e LEGEi/<
e ' ' 'O
t 10 - H. I. .,; 10 - LEGEND !!.
"' "' ll. l. u u ~ z z
< < 1S ~Conv. z :i;l ~ H.J. i <:>---0 Conv, 9 j b---4H,I.
1. .BACKGROUND 1. BACKGROUND
.s - . 5
I I I I
91 274 457 91 274 457 DISTANCE (m) DIST.~NCE (ml
Note : Im= 3,28 ft and I ed/ni2 • 0.291 ft·L.
Figure 11. Nighttime average luminance versus distance at site 5, curved approach.
100 100 LOW BEAMS
50 50 -Conv.
l').-'<l>--~ ,,.-"' LEGEND ._-<D e e
':. ' "' 10 .,; 10 -!!. !!.
~-"' "' u 5 u ·z z < < 1S 1S Conv. :i;l :i;l G>----0---0---0--.Q
9 3 ~ 1. 1. -
BACKGROUND H.I.
. s • 5
I ' 0 91 274 457 0 91 274 457
DISTANCE (m) DISTANCE (m)
Nole~ I m = 3.28 ft and I cd/m2 = 0.291 ft·L.
Figure 12. Nighttime average luminance versus distance at site 5, straight approach.
100
50
N-
e ' .,; 10 !!.
"' u z < ~ ::; j
I.
• 5
91 274
DISTANCE (mf
Note : I m = 3.28 ft and I cd/m2 = 0.291 ft·L.
'N
~ .,; !!.
"' u z < z i j
457
100 - LOW BEAMS
50 Conv.
0---0.--().. --<>
LEGEND
10 H. I.
~
Conv.
~ H. I.
1. - BACKGROUND
. 5 -
91 27-1 457
DISTANCE (ml
33
LOW BEAMS IN 100 - STREAM TRArfIC
50
"' ' Conv • .f .,; 10 -
LEGE/l. !!.
"' H. I. u z < z i _.,..,...£J Conv. j 0---0'°
I. -~H.I.
BACKGROUND • 5
' 0 91 27-1 457 DISTANCE (ml
LOW BEAMS IN 100 -
STREAM TRArfIC
50
0..--Q.. Conv . --e..
"' LEGEND ---e e ' ~· .,; 10 !!.
"' u z < z Conv. i ~ ;:.> ,.,
1. H. I. BACKGROUND
.5 -
I I
91 274 457
DISTANCE (m)
100 -LOW BEAMS IN
STREAM TRAFFIC
50
<:>- --.(!).. Conv . --<:>---o
'N LEGEND ~ .,; !!.
10 - ~.I • ;.: u 5 -z < Conv. ~ ::; :-.:-: ~~ ~ H.I.
I. BACKGROUND
• 5
I
91 27-1 457
DISTANCE (ml

34
and illuminated roadways are presented in the following sections.
Nonilluminated Straight Roadways
For signs e1·ected over straight sections of roadway, there were no statistical diiferences in the brightnesses of the background materials for the two signs seen by motorists traveling in sb·eam traffic. AltJ1ough the average luminanccs of the high-intensity legend materials were not so bright as those of the illuminated conventional sign, the people who viewed the signs stated that the uniform brightness of the high-intensity sign provided greater legibility than the illuminated sign with the uneven light distribution. For a single vehicle traveling with high-beam lights, the high-intensity signs were much brighter; however, for the same vehicle using low beams, the luminance of the high-intensity signs was not so bright as that of the adjacent conventional signs. The people who conducted the study are of the opinion that there are only limited occasions when it is feasible for the lone motorist to use low beams on a freeway. In fact, it was uot possible to collect the low-beam clata at any of the study sites until after J a. u. when traffic volumes were low. The high-intensity materials provided a constant level of service whereas the brightness of conventional materials was governed by the external ligl1ting. When the external lighting was off, the luminances of the conventional mate1·ials were reduced dras -tically, and the brightness was insufficient to provide the motorist proper service.
Nonilluminated Curved Roadways
On a curved approach, when only a limited amount of light from the vehicles was projected on the overhead signs, the luminances of the unlighted high-intensity materials we1·e not sufficient to provide the motoriSts with the equivalent sign legibility and visibility obtained from the conventional signs. Although the luminance readings of the unlighted high-intensity sign were more uniform than those of the conventional sign, the persons who viewed the signs on the curved app1·oaches were unanimous in the opinion that the lighted sign provided better se1·vice.
Illuminated Roadways
The presence of roadway lighting reduces the maximum visibility clistance and tlms increases the probability that a sign will not be seen even though the legibility distance may be adequate. Furtl).ermore, the findings of this study indicated that roadway illumination did not significantly increase the luminances of the overhead signs at the oue location tested.
For an approach on a straight course and with highbeam headlights, it was concluded that the lumina:nces of the high-intensity materials exceeded those of the conventional materials within t he legibility a nd visibility distances. Fo1· stream traffic conditions, the nonilluminatecl high-intensity sign was prefenecl . For the approach on a slight curve (0.24 deg) and with high b ams, the luminances of the high-intensity signs were greater; however, at clistances within the visibility range the luminance levels decreased at a greater i·ate than they did 011 the straight approach. Under low-beam conditions the conventional materials were !>righter than the highintensity matel'ials on the straight and curved appl'oaches. At 457 m (1500 ft) the signs did have poor attention vahte characteristics, but the persons visiting the site stated that within the iegibiiity distance range the high-intensity sign provided bette1· service than the lighted conventio11al
sign under high-beam and stream traffic conditions. The foregoing conclusions indicate that the external
lightillg can be eliminated on many overhead signs thl·ough the use of high-intensity sheeting without adversely affecting the service to motorists. Consideration should be given to disconnecting or removing the illumination on existing and proposed high-intensity overhead signs on roadways that are susceptible to high-beam and stream traffic lighting conditions and that have a straight approach equal to or greate1· than the visibility recognition distance. Generally the maximum vi.Sibility distances in Virginia are approximately 305 and 366 m (1000 and 1200 ft) for illuminated and nonilluminated roadways respectively. Tllis recommendation should not be applied to signs on roadways where the lone motorist is required to use low-beam headlights, such as 11arrow median facilities for which state law requires motorists to dim theil' headlights to prevent the projection of glare into the oncoming d1·iver's eyes. The provi.Sion of external lighting on all overhead signs erected over curved sections of illuminated and uonilluminated roadways should be continued. Although lighting is required the use of the brighter, high-intensity overhead signs at these i·estricted visibility locations is beneficial, especially dul:ing service interruptions.
ACKNOWLEDGMENTS
The assistance i·eceived from the Traffic and Safety Division and the Culpeper and Salem Districts of the Virginia Departme11t of Highways and T1·ansportation is gratefully acknowledged. This study was conducted under the general supervision of J. H. Dillard o'f the Virginia Highway and Transpo1·tation R,esearch Council, and was financed through the HPR program of the Federal Highway Administration. The opinions, findings, and conclusions expressed in tllis report are those of the autho1· and not necessarily those of the sponsoring agencies.
REFERENCES
1. Evaluation of Reflective Sign Materials. Research and Development Section, Louisiana Department of Highways , Jan. 1973.
2. R. L. Rizenbergs. High Intensity Reflective Materials for Signs. Kentucky Department of Highways, research rept., May 1973.
3. W. P. Youngblood and H. L. Woltman. A Brightness Inventory of Contemporary Signing Materials for Guide Signs. HRB, Highway Research Record 377, 1971, pp. 69-91.
4. R. N. Robertson. Use of High Intensity Reflective Materials in Highway Signing: A Literature Review. Virginia Highway Research Council, Aug. 1973.
5. M. H. Hilton. Roadway Lighting Study-Route 264 in Downtown Norfolk. Virginia Highway Research Council, April 1974.
6. J. E. Baerwald, ed, Traffic Engineering Handbook. Institute of Traffic Engineers, Washington, D.C., 1965.
7. T. W. Forbes. Factors in Highway Sign Visibility. Traffic Engineering, Vol. 39, No. 12, Washington, D.C., Sept. 1969.
8. J. 0 . Elstad, J. T. Fitzpatrick, and H. L. Woltman. Requisite Luminance Characteristics for Reflective Signs. HRB, Bulletin 336, 1962, pp. 51-60.