Embed Size (px)
Citation preview
Natural Environment Change, Vol. 2, No. 2, Summer & Autumn 2016, pp. 165- 175
Evaluation of human thermal comfort using UTCI
index: case study Khorasan Razavi, Iran
Mohammad Baaghideh; Assistant Professor of Climatology, Department of Physical
Geography, Faculty of Geography and Environmental Science, Hakim Sabzevari
University, Sabzevar, Iran
Fatemeh Mayvaneh; PhD Student in Urban Climatology, Department of Physical
Geography, Faculty of Geography and Environmental Science, Hakim Sabzevari
University, Sabzevar, Iran
Ali Shekari badi; M.A. in Geomorphology, Department of Physical Geography, Faculty of
Geography and Environmental Science, Hakim Sabzevari University, Sabzevar, Iran
Taybeh Shojaee; PhD Student in Urban Climatology, Department of Physical
Geography, Faculty of Geography and Environmental Science, Hakim Sabzevari
University, Sabzevar, Iran
Received: Jun. 2, 2016 Accepted: Dec. 27, 2016
Abstract The Universal Thermal Climate Index (UTCI) addresses these shortcomings by
using an advanced thermo-physiological model. The aim of this study was to
investigate and prepare zoning of thermal comfort condition using UTCI.
Meteorological data including temperature, wind speed, cloudiness and relative
humidity were obtained on a daily time scale from 10 synoptic stations during
(2004-2013) period. For the calculation of UTCI index Ryman and Bioklima
softwares were used. Then the relationship between UTCI and elevation was
investigated and by using Digital Elevation Model (DEM), UTCI zoning was
prepared. The results showed that there is a strong inverse relationship between
UTCI and elevation. Spatial and temporal zoning maps showed the highest values
of UTCI were observed in the northeastern part of province (Sarakhs station) on
July. In the cold months the lowest values of UTCI has been recorded in January.
Extreme heat stress was observed across the East, South and South-East of
Khorasan Razavi province. While cold stress has been more dominant In the
Central and northern areas of the province. Generally there is a significant
correlation between the thermal comfort and elevation, so that thermal stresses are
often observed in the low regions in the warm period of the year.
Keyword Khorasan Razavi, thermal stress, UTCI.
Abbreviation UTCI: Universal Thermal Climate Index
DEM: Digital Elevation Model
PET: Physiologically Equivalent Temperature
MEMI: Munich Energy-Balance Model for Individuals
PT: Perceived Temperature
ISB: International Society of Biometeorology
COST: Cooperation in Science and Technical Development
Mrt: Mean radiant temperature
Corresponding Author: [email protected]; Tel/Fax: +98 5144013148, +98 9159822959

166 Natural Environment Change, Vol. 2, No. 2, Summer & Autumn 2016
RH: Relative Humidity
MCS: Moderate Cold Stress
SCS: Slight Cold Stress
NTS: No Thermal Stress
MHS: Moderate Heat Stress
SHS: Strong Heat Stress
1. Introduction Mathematical modelling of the human thermal system goes back to 70 years ago. Most of the
works have been carried out in the framework of occupational medicine or indoor climate
conditions design. Numerous procedures have been published as ISO- or ASHRAE standards.
In the past four decades more detailed, multi-node models of human thermoregulation have
been developed, e.g. Stolwijk (1980), Konz et al. (1977), Wissler (1985), Fiala et al. (2001),
Havenith (2001), Huizenga et al. (2001) and Tanabe et al. (2002). Parsons (2014) gives a
comprehensive overview. These models simulate phenomena of the human heat transfer inside
the body and at its surface taking into account the anatomical, thermal and physiological
properties of the human body. Heat losses from parts of the body to the environment are
modelled in detail considering the inhomogeneous distribution of temperature and
thermoregulatory responses over the body surface. Analysis of the human thermal environment
is the subject of special investigation among scientists serving at different disciplines such as
climatologists, urban planners, architects, biologists, and physicians. The assessment of
biometeorological conditions for tourism and recreational purposes is usually based on
fundamental meteorological data, climate-tourism indices or biometeorological indices
(McGregor, 2012). Thermal comfort can be defined clearly through different approaches. A
psychological perspective defines thermal comfort as a condition of mind that expresses
satisfaction with the thermal environment. It is an outcome of energy balance between the
human body surface and the environment, and it is influenced by human physiology,
psychology and behavior (Jendritzky et al., 2012; McGregor, 2012).
One of the fundamental issues in human biometeorology is the assessment and forecast of
the outdoor thermal environment in a sound, effective and practical way This is due to the need
for human beings to balance their heat budget in any climate to a state very close to thermal
neutrality in order to optimize their comfort, performance and health (Jendritzky et al., 2008).
Human thermal comfort models, on the other hand, consider in addition to atmospheric
parameters (air temperature, water vapor pressure, wind speed and mean radiant temperature
(Kántor & Unger, 2011)) complex metabolic processes including physical activity level and
clothing insulation. Human thermal comfort indices such as Physiologically Equivalent
Temperature (PET) (Höppe, 1999; Matzarakis et al., 1999; Mayer & Höppe, 1987) is based on
the Munich Energy-Balance Model for Individuals (MEMI) and the Klima–Michel model with
Perceived Temperature (PT) as the equivalent temperature (Jendritzky et al., 2000; Staiger et al.,
2012) have been commonly used in human-biometeorological assessments during the last
decade (Burkart et al., 2011; Gabriel & Endlicher, 2011; Jendritzky et al., 2009; Kim et al.,
2011; Laschewski & Jendritzky, 2002; Matzarakis et al., 2011).
In order to determine thermal stress, several factors, including air temperature, wind
velocity, water vapor pressure, short- and long-wave radiant fluxes, physiological strain,
behavior and the autonomous human thermoregulatory system, need to be considered
(Havenith, 2001; Jendritzky et al., 2009; Parsons, 2014).There are more than 100 indices used to
assess thermal health hazards. The first group of indices to be widely used were based on a
simple two-parameter combination of air temperature and humidity for ‘warm’ indices and air
temperature and wind speed (wind chill) for ‘cold’ indices (Blazejczyk et al., 2012). The UTCI
equivalent temperature for a given combination of wind, radiation, humidity and air temperature
is then defined as the air temperature of the reference environment that produces the same strain
index value (Bröde et al., 2012). The UTCI development was performed by a multidisciplinary
expert team in the framework of a commission of the International Society of Biometeorology
(ISB) and of COST Action 730 (Jendritzky et al., 2009) under the ‘umbrella’ of the World
Meteorological Organization Commission for Climatology (WMO-CCl).
Evaluation of human thermal comfort using UTCI index: case study Khorasan Razavi, Iran 167
The UTCI can be applied to key applications in human biometeorology, such as daily
forecasting and warnings, urban and regional planning, environmental epidemiology and
climate impact research; it is applicable for all climates.
The Universal Thermal Climate Index (UTCI) aims to assess outdoor thermal conditions in the
major fields of human biometeorology in terms of a one-dimensional quantity summarizing the
interaction of environmental temperature, wind speed, and humidity, and of the long wave and
short-wave radiant heat fluxes. This assessment should be based on the physiological response of
the human body, which in turn is simulated by a thermo physiological model. For this purpose,
based on an advanced multi-node model of human thermoregulation (Fiala et al., 1999; 2001;
2010; Lomas et al., 2003). the ‘UTCI-Fiala’ model of thermo-physiological comfort was derived
(Fiala et al., 2012)and coupled with a state-of-the-art clothing model. The UTCI was designed to
be applicable in all climate regions, and global NWP ensembles can be used to forecast the UTCI
anywhere in the world (Pappenberger et al., 2014). The main objective of this study is to present
an application of UTCI in climate valorization for the purposes of urban tourism and recreation
and Zoning maps of UTCI In order to estimate the thermal comfort in Khorasan Razavi province.
Another subject of interest of this study arises out of the fact that weather perception and thermal
comfort are influenced, not only by microclimatic conditions (the combined impact of air
temperature and humidity, wind and solar fluxes), but also by personal parameters like physical
activity, clothing, age or psychological factors (motivation, individual preferences or cultural
background). The secondary objective of this study is to determine whether biometeorological
indices (i.e. UTCI) may accurately reflect the actual thermal state, thermal sensations and weather
preferences of people engaged in tourism and recreational activities.
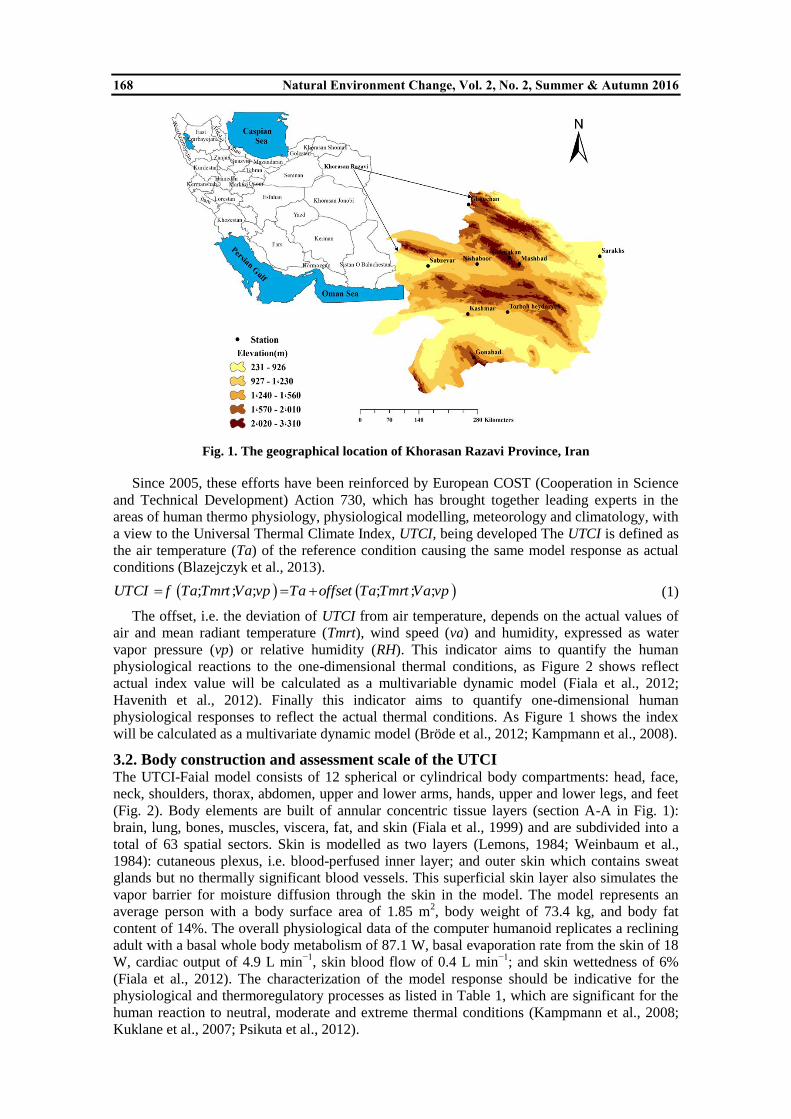
2. Study area The Khorasan Razavi is a province in northeastern Iran. This province is located between the
latitudes 30◦-24
◦N and 38
◦-17
◦N and longitudes 55
◦-17
’E and 61
◦-15
’E. (Fig. 1). It borders North
Khorasan province and Turkmenistan in the north, Semnan province in the west, Yazd and
South Khorasan provinces in the south and Afghanistan and Turkmenistan in the east. Khorasan
Razavi covers an area of 144,681 km² and has a population of 5,593,079 (2005). Sixty percent
of population lives in 20 cities, and the remaining are residents of rural areas. This wide region
with the population of over 6 million plays a crucial role in agricultural and economic sectors. It
has 19 counties and Mashhad is the center and capital of the province. Other major cities are
Ghoochan, Torbate Heydarieh, Torbate Jam, Kashmar, Neyshaboor and Sabzevar. The highest
point of the province is Binalood at 3615m and the low-lying area in the Sarakhs plain is
approximately 299 m above sea level. Factors such as the area of the province, high mountains,
being close to the desert areas in the west and south West, stay away from the sea and the
different winds, has caused a variety of climates in various areas of the province.
3. Materials and Methods In this study meteorological data including, temperature (˚C), wind speed (m/s), cloudiness
(okta)1 and relative humidity (%) were obtained from 10 synoptic station on a daily time scale
during 2004-2013 period. Mean radiation temperature (Tmrt) was calculated by Ray Man
software and finally using Bioklima software daily values of UTCI were calculated for each
station. UTCI equivalent temperature categorized in terms of thermal stress for each month in
stations. Then by using Pearson correlation model, the relationship between UTCI and elevation
was studied (p-value<0.05) and the Simple Linear Regression Models were provided for each
month. Finally according to regression equations and based on Digital Elevation Model (DEM)
UTCI monthly zoning maps were obtained using ArcGIS 10.2.1 software.
3.1. Universal thermal climate index In 1999, the International Society of Biometeorology (ISB) established a Commission ‘On the
development of a Universal Thermal Climate Index UTCI’. The goal of this project was to
derive a thermal index based on the most advanced thermophysiological model.
1. okta is a unit of measurement used to describe the amount of cloud cover at any given location such as a weather station
168 Natural Environment Change, Vol. 2, No. 2, Summer & Autumn 2016
Fig. 1. The geographical location of Khorasan Razavi Province, Iran
Since 2005, these efforts have been reinforced by European COST (Cooperation in Science
and Technical Development) Action 730, which has brought together leading experts in the
areas of human thermo physiology, physiological modelling, meteorology and climatology, with
a view to the Universal Thermal Climate Index, UTCI, being developed The UTCI is defined as
the air temperature (Ta) of the reference condition causing the same model response as actual
conditions (Blazejczyk et al., 2013).
; ; ; ; ; ;UTCI f Ta Tmrt Va vp Ta offset Ta Tmrt Va vp (1)
The offset, i.e. the deviation of UTCI from air temperature, depends on the actual values of
air and mean radiant temperature (Tmrt), wind speed (va) and humidity, expressed as water
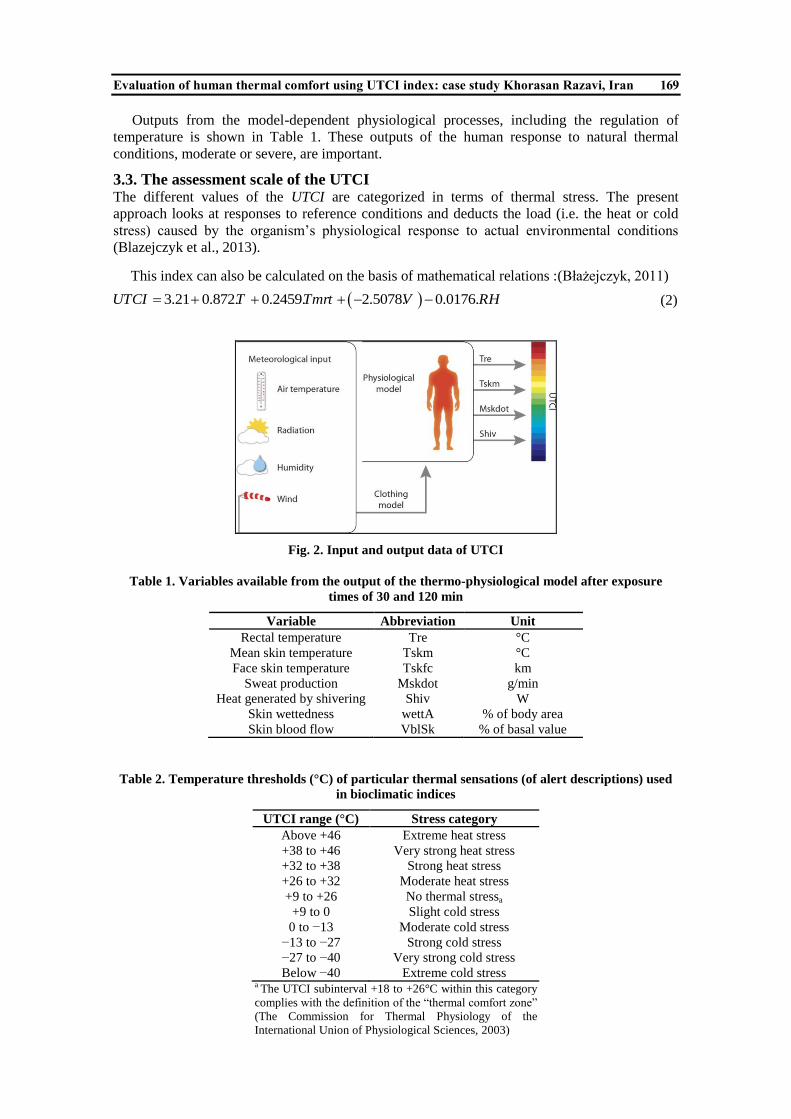
vapor pressure (vp) or relative humidity (RH). This indicator aims to quantify the human
physiological reactions to the one-dimensional thermal conditions, as Figure 2 shows reflect
actual index value will be calculated as a multivariable dynamic model (Fiala et al., 2012;
Havenith et al., 2012). Finally this indicator aims to quantify one-dimensional human
physiological responses to reflect the actual thermal conditions. As Figure 1 shows the index
will be calculated as a multivariate dynamic model (Bröde et al., 2012; Kampmann et al., 2008).
3.2. Body construction and assessment scale of the UTCI The UTCI-Faial model consists of 12 spherical or cylindrical body compartments: head, face,
neck, shoulders, thorax, abdomen, upper and lower arms, hands, upper and lower legs, and feet
(Fig. 2). Body elements are built of annular concentric tissue layers (section A-A in Fig. 1):
brain, lung, bones, muscles, viscera, fat, and skin (Fiala et al., 1999) and are subdivided into a
total of 63 spatial sectors. Skin is modelled as two layers (Lemons, 1984; Weinbaum et al.,
1984): cutaneous plexus, i.e. blood-perfused inner layer; and outer skin which contains sweat
glands but no thermally significant blood vessels. This superficial skin layer also simulates the
vapor barrier for moisture diffusion through the skin in the model. The model represents an
average person with a body surface area of 1.85 m2, body weight of 73.4 kg, and body fat
content of 14%. The overall physiological data of the computer humanoid replicates a reclining
adult with a basal whole body metabolism of 87.1 W, basal evaporation rate from the skin of 18
W, cardiac output of 4.9 L min−1
, skin blood flow of 0.4 L min−1
; and skin wettedness of 6%
(Fiala et al., 2012). The characterization of the model response should be indicative for the
physiological and thermoregulatory processes as listed in Table 1, which are significant for the
human reaction to neutral, moderate and extreme thermal conditions (Kampmann et al., 2008;
Kuklane et al., 2007; Psikuta et al., 2012).
Evaluation of human thermal comfort using UTCI index: case study Khorasan Razavi, Iran 169
Outputs from the model-dependent physiological processes, including the regulation of
temperature is shown in Table 1. These outputs of the human response to natural thermal
conditions, moderate or severe, are important.
3.3. The assessment scale of the UTCI The different values of the UTCI are categorized in terms of thermal stress. The present
approach looks at responses to reference conditions and deducts the load (i.e. the heat or cold
stress) caused by the organism’s physiological response to actual environmental conditions
(Blazejczyk et al., 2013).
Fig. 2. Input and output data of UTCI
Table 1. Variables available from the output of the thermo-physiological model after exposure
times of 30 and 120 min
Variable Abbreviation Unit
Rectal temperature Tre °C
Mean skin temperature Tskm °C
Face skin temperature Tskfc km
Sweat production Mskdot g/min
Heat generated by shivering Shiv W
Skin wettedness wettA % of body area
Skin blood flow VblSk % of basal value
Table 2. Temperature thresholds (°C) of particular thermal sensations (of alert descriptions) used
in bioclimatic indices
UTCI range (°C) Stress category
Above +46 Extreme heat stress
+38 to +46 Very strong heat stress
+32 to +38 Strong heat stress
+26 to +32 Moderate heat stress
+9 to +26 No thermal stressa
+9 to 0 Slight cold stress
0 to −13 Moderate cold stress
−13 to −27 Strong cold stress
−27 to −40 Very strong cold stress
Below −40 Extreme cold stress a The UTCI subinterval +18 to +26°C within this category
complies with the definition of the “thermal comfort zone”
(The Commission for Thermal Physiology of the
International Union of Physiological Sciences, 2003)
This index can also be calculated on the basis of mathematical relations :(Błażejczyk, 2011)
3.21 0.872. 0.2459. 2.5078. 0.0176.UTCI T Tmrt V RH (2)
170 Natural Environment Change, Vol. 2, No. 2, Summer & Autumn 2016
where:
1
:
:
: 10 .
: Re %
AirTemperature C
Mrt Mean RadiantTemperature C
V Wind velocitya at m above ground m s
RH lative humidity of air
One input datum involved in the calculation of the UTCI is mean radiant temperature, a
value that characterizes the thermal impact of solar radiation and air temperature on human
beings. It represents a uniform surface temperature of an imaginary enclosure surrounding the
person.
Mrt was calculated in line with the equation:(Błażejczyk, 2004)
0.250.5. 0.5.
273.h
R Lg LaTmrt
S S
(3)
where:
2
2
8 2 4
: .
: .
: 0.95
: tan 5.667.10 , . .
h
R Solar radition absorbed by a nude man W m
Lg Ground radiation W m
S The emissivity cofficient for the human body
S The Stefan Boltzmann cons t W m K
(Blażejczyk, 2011)
4. Results and Discussion
4.1. Evaluation indices UTCI UTCI is an equivalent temperature defined for a walking person (4 km/h) with adaptive clothing
(Havenith et al., 2012). in referent outdoor conditions with 50% relative humidity, still air, and
Tmrt equaling air temperature (Jendritzky et al., 2012). Wind speed at 10-m height is used for the
UTCI calculation (by definition) (Bröde et al., 2012)., in comparison with other indices, UTCI is
more sensitive to even slight changes in temperature, solar radiation, humidity and wind speed and
better describes various climatic conditions, which might be an opportunity for more appropriate
human-biometeorological assessments (Blazejczyk et al., 2012; Weihs et al., 2012). Thus, UTCI
allows all kinds of human thermal stress and discomfort to be addressed, e.g., cold (warm) and
extreme cold (warm) ambient temperatures, increased air velocities, dry and humid environments,
and conditions in which the human heat balance and the perception of the outdoor thermal
environment are affected by solar radiation (Schreier et al., 2013). In the present study the
calculated values of UTCI were classified according to Stress category (Table 2) for all stations.
UTCI equivalent temperature categorized in terms of thermal stress for each month in stations
were shown in Table 3. Based on the information in this table a class of cold stress (slight,
moderate or strong) is dominant in all stations on Jan, Feb, Nov and Dec and only in the Sarakhs
station Strong Heat Stress (SHS) category was observed for 3 months (Jun, Jul, Ague).
According to the correlation coefficients between the UTCI and elevation stations (Table 4)
these relations for 7 months (Apr, May, Jun, July, Aug, Sep and Oct) are negative and significant
(p-value<0.05). The highest correlation coefficient has been in June (r=-0.68) and the lowest
correlation was observed in January (r=-0.23). Simple linear regression equations between UTCI
and elevation are presented (Table 4) in which Y is the UTCI index and X is the elevation stations.
Zoning maps of UTCI for seven months (April to October) are shown in Figure 4, the
highest values of UTCI were observed in the lowlands of the province in the months of May and
June. Sarakhs station in East Province had the highest amount of UTCI so in terms of thermal
stress, strong heat stress is dominant and there is the possibility of injury, such as in July. Also,
there is the highest heat stress in the East, South and South east of the province during these
months (June, Jul and Aug). In the North and central areas of the province, severe cold stress
were observed compared to the other parts of the province.
.
Evaluation of human thermal comfort using UTCI index: case study Khorasan Razavi, Iran 171
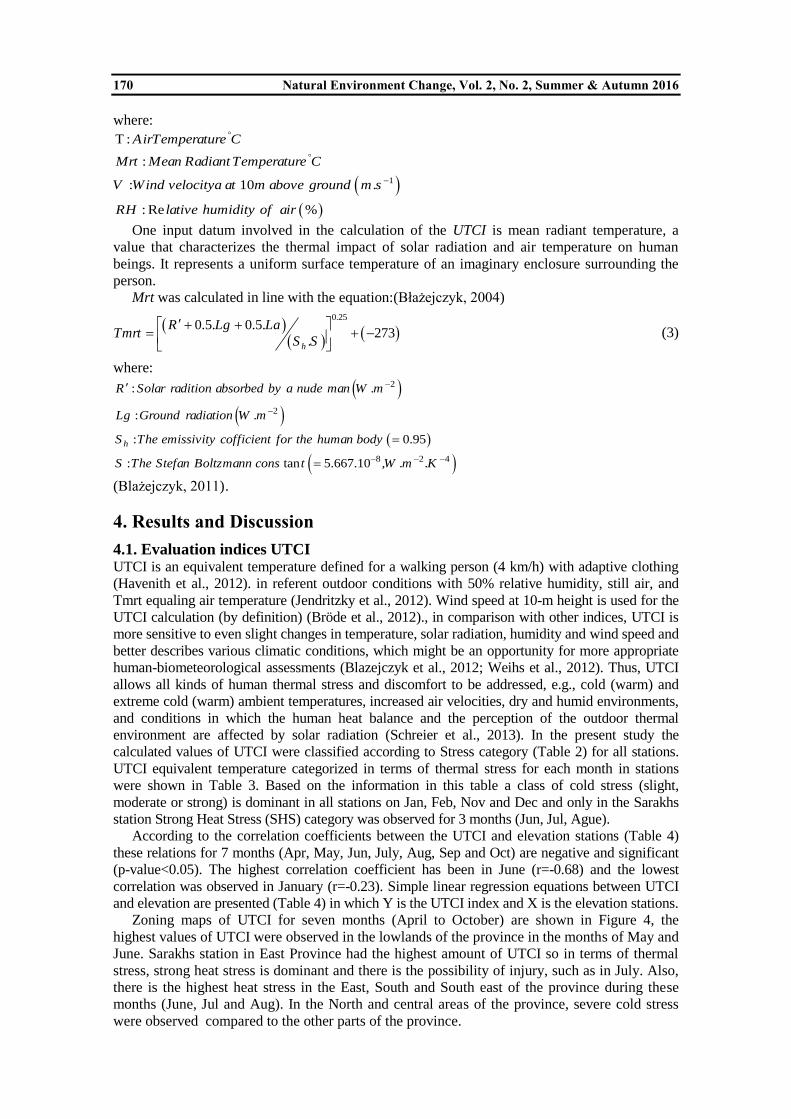
Table 3. UTCI equivalent temperature categorized in terms of thermal stress for each month of
each station
Station Jan Feb Mar Apr May June July Aug Sep Oct Nov Dec
Ghoochan MCS MCS SCS NTS NTS NTS NTS NTS NTS NTS SCS MCS
Mashhad MCS MCS SCS SCS NTS NTS NTS NTS NTS SCS SCS MCS
Sabzevar MCS MCS MCS SCS NTS NTS NTS NTS NTS SCS MCS MCS
Golmakan MCS MCS SCS NTS NTS NTS NTS NTS NTS NTS SCS MCS
Gonabad MCS MCS SCS SCS NTS NTS NTS NTS NTS NTS SCS MCS
Neyshaboor MCS MCS SCS SCS NTS NTS NTS NTS NTS SCS MCS MCS
Torbat-Jam MCS MCS MCS SCS NTS NTS NTS NTS NTS SCS MCS MCS
Torbat-Heydareyeh MCS MCS SCS SCS MHS NTS NTS NTS NTS SCS SCS MCS
Kashmar SCS SCS NTS NTS MHS MHS MHS SHS MHS NTS NTS SCS
Sarakhs SCS SCS NTS NTS NTS SHS SHS SHS MHS NTS NTS SCS
MCS: Moderate Cold Stress, SCS: Slight Cold Stress, NTS: No Thermal Stress, MHS: Moderate Heat Stress, SHS: Strong
Heat Stress
Fig. 3. Thermal sensation votes versus UTCI values
Table 4. Simple linear regression between (elevation and UTCI value) April to October
Month Regression model P-Value*
R
April 791.190086.0 x 0.1 -0.54
May 95.27009.0 x 0.04 -0.638
June 883.330099.0 x 0.02 -0.684
July 788.350098.0 x 0.03 -0.678
August 30.330096.0 x 0.04 -0.613
September 609.260087.0 x 0.1 -0.49
October 514.18007.0 x 0.2 -0.40
*The significance level=0.05
4.2. Zoning of UTCI The height difference creates a different climate and the comfortable condition. Based on the
regression equation and a digital elevation model, zoning maps UTCI index for seven months
(April to October), which had a strong negative relationship with height, was prepared (Fig. 4).
Most of the northern and central highlands provinces (2020m-3310m) in April and October are
less cold stress Also, in areas with low altitude (926m-231m) in the months of June, July and
August were observed that in July both the intensity and extent were increased so that there is a
risk of heart attacks, muscle cramps due to the heat, Syncoub (faint heat) and hypothermia
body.In May, and September, most parts of the province in terms of heat stress are very low
except for a very small range of 3310-2020 m elevations that slight cold stress conditions
prevail. In general, East, South and South East regions of province in June, July and August
have the highest levels of thermal stress and in the zones of the north and center of the province,
especially in April and October cold stress is dominated significantly more than other parts of
the province. In May and September thermal stresses are low, so many parts of the province are
without any thermal stress that this is considered in terms of bioclimatology and tourism.

172 Natural Environment Change, Vol. 2, No. 2, Summer & Autumn 2016
Fig. 4. Zoning heat stress conditions during April-October
Evaluation of human thermal comfort using UTCI index: case study Khorasan Razavi, Iran 173
5. Conclusions The Fiala model has been subject to general as well as application-specific validation studies
regarding human thermal and regulatory behaviors (Fiala et al., 2001), occupant comfort in
buildings (Lomas et al., 2003), transient indoor climate conditions in cars (Fiala et al., 2004),
asymmetric radiation scenarios and exposures to high intensity sources (Richards & Fiala,
2004), but also anesthesia and clinical trials studies show that there is a close relationship
between temperature and respiratory and cardiac mortality (Anderson & Bell, 2009).
Previous and similar studies show that thermal stresses have the highest relationship to
humidity and radiation in warm environments, as well as to wind speed in cold climates also the
influence of various types of land use, thus in shaping bio-thermal conditions it is
strong.(Broede et al., 2013; Milewski, 2013). Results of the study by Abdel-Ghany and his
colleagues (2013) also showed that both the PET and UTCI scales can be used successfully for
the arid environment to evaluate the thermal sensation, and heat stress and their results are
almost similar.
In this study emphasis was on the UTCI sensitivity and effectiveness of the height of each
area. Highlands in northern and central parts of the province (representative station: Sabzevar,
Neyshaboor and Ghoochan) in April and October to experience a slight cold stress and the
eastern and southern parts of the province due to the low altitude in the months of June, July and
August heat stress condition is prevailed. In the May and September throughout the province
except the peaks of the mountains are without thermal stress and in comfort. Similar studies
have been conducted in this regard. The only difference is that they do not consider elevation
(Bleta et al., 2014; Farajzadeh et al., 2015). The development of UTCI requires co-operation of
experts from thermo-physiology, thermo-physiological modelling, occupational medicine,
meteorology data handling and in particular radiation modelling, application development etc.
In order to achieve significant progress, it is necessary that the relevant scientists join together
on a regular basis. It is thus evident that for such a multidisciplinary task a COST Action
provides the best framework to derive a health related climate index as a standard.
Acknowledgment This research received no grants from any funding. We thank The Meteorological Organization
of Khorasan Razavi and especially Mrs. Golmakani who assisted in providing data.
References 1. Abdel-Ghany, A., Al-Helal, I., Shady, M. (2013). Human thermal comfort and heat stress in an
outdoor urban arid environment: a case study. Advances in Meteorology
2. Anderson, B.G., Bell, M.L. (2009). Weather-related mortality: how heat, cold, and heat waves affect
mortality in the United States. Epidemiology (Cambridge, Mass.), 20(2): 205.
3. Blażejczyk, K. (2011). Assessment of regional bioclimatic contrasts in Poland. Miscellanea
Geographica-Regional Studies on Development, 15: 79-91.
4. Błażejczyk, K. (2004). Radiation balance in man in various meteorological and geographical
conditions. Geographia Polonica, 77(1): 63-76.
5. Błażejczyk, K. (2011). Mapping of UTCI in local scale (the case of Warsaw). Prace i Studia
Geograficzne WGSR UW, 47, 275-283.
6. Blazejczyk, K., Epstein, Y., Jendritzky, G., Staiger, H., Tinz, B. (2012). Comparison of UTCI to
selected thermal indices. International journal of biometeorology, 56(3): 515-535.
7. Blazejczyk, K., Jendritzky, G., Bröde, P., Fiala, D., Havenith, G., Epstein, Y., ... Kampmann, B.
(2013). An introduction to the Universal Thermal Climate Index (UTCI). Geographia Polonica, 86(1):
5-10.
8. Bleta, A., Nastos, P.T., Matzarakis, A. (2014). Assessment of bioclimatic conditions on Crete Island,
Greece. Regional Environmental Change, 14(5): 1967-1981.
9. Bröde, P., Fiala, D., Błażejczyk, K., Holmér, I., Jendritzky, G., Kampmann, B., ... Havenith, G.
(2012). Deriving the operational procedure for the Universal Thermal Climate Index (UTCI).
International journal of biometeorology, 56(3): 481-494.
10. Broede, P., Blazejczyk, K., Fiala, D., Havenith, G., Holmer, I., Jendritzky, G., ... Kampmann, B.
(2013). The universal thermal climate index UTCI compared to ergonomics standards for assessing
the thermal environment. Industrial health, 51(1): 16-24.
174 Natural Environment Change, Vol. 2, No. 2, Summer & Autumn 2016
11. Burkart, K., Schneider, A., Breitner, S., Khan, M.H., Krämer, A., Endlicher, W. (2011). The effect of
atmospheric thermal conditions and urban thermal pollution on all-cause and cardiovascular mortality
in Bangladesh. Environmental Pollution, 159(8): 2035-2043.
12. Farajzadeh, H., Saligheh, M., Alijani, B., Matzarakis, A. (2015). Comparison of selected thermal
indices in the northwest of Iran. Natural Environment Change, 1(1): 1-20.
13. Fiala, D., Havenith, G., Bröde, P., Kampmann, B., Jendritzky, G. (2012). UTCI-Fiala multi-node
model of human heat transfer and temperature regulation. International journal of biometeorology,
56(3): 429-441.
14. Fiala, D., Psikuta, A., Jendritzky, G., Paulke, S., Nelson, D.A., van Marken Lichtenbelt, W.D., Frijns,
A.J. (2010). Physiological modeling for technical, clinical and research applications. Front Biosci S,
2: 939-968.
15. Fiala, D., Bunzl, A., Lomas, K.J., Cropper, P.C., Schlenz, D. (2004). A new simulation system for
predicting human thermal and perceptual responses in vehicles. In D. Schlenz (Ed.), PKW-
Klimatisierung III: Klimakonzepte, Regelungsstrategien und Entwicklungsmethoden, Haus der
Technik Fachbuch, Expert Verlag, Renningen, Haus der Technik Fachbuch, 27 ed., Vol. 27: 147-162.
16. Fiala, D., Lomas, K.J., Stohrer, M. (2001). Computer prediction of human thermoregulatory and
temperature responses to a wide range of environmental conditions. International Journal of
Biometeorology, 45(3): 143-159.
17. Fiala, D., Lomas, K.J., Stohrer, M. (1999). A computer model of human thermoregulation for a wide
range of environmental conditions: the passive system. Journal of Applied Physiology, 87(5): 1957-
1972.
18. Gabriel, K.M., Endlicher, W.R. (2011). Urban and rural mortality rates during heat waves in Berlin
and Brandenburg, Germany. Environmental Pollution, 159(8): 2044-2050.
19. Havenith, G. (2001). Individualized model of human thermoregulation for the simulation of heat
stress response. Journal of Applied Physiology, 90(5): 1943-1954.
20. Havenith, G., Fiala, D., Błazejczyk, K., Richards, M., Bröde, P., Holmér, I., ... Jendritzky, G. (2012).
The UTCI-clothing model. International Journal of Biometeorology, 56(3), 461-470.
21. Höppe, P. (1999). The physiological equivalent temperature–a universal index for the
biometeorological assessment of the thermal environment. International Journal of Biometeorology,
43(2): 71-75.
22. Huizenga, C., Hui, Z., Arens, E. (2001). A model of human physiology and comfort for assessing
complex thermal environments. Building and Environment, 36(6), 691-699.
23. Jendritzky, G., de Dear, R., Havenith, G. (2012). UTCI—Why another thermal index? International
journal of biometeorology, 56(3): 421-428.
24. Jendritzky, G., Havenith, G., Weihs, P., Batchvarova, E. (2009). Towards a Universal Thermal
Climate Index UTCI for assessing the thermal environment of the human being. Final Report COST
Action, 730: 1-26.
25. Jendritzky, G., Havenith, G., Weihs, P., Batschvarova, E., DeDear, R. (2008). The universal thermal
climate index UTCI–goal and state of COST Action 730. Paper presented at the 18th International
Conference on Biometeorology, Tokyo.
26. Jendritzky, G., Staiger, H., Bucher, K., Graetz, A., Laschewski, G. (2000). The perceived temperature:
the method of the Deutscher Wetterdienst for the assessment of cold stress and heat load for the
human body. Paper presented at the Internet workshop on Windchill.
27. Kampmann, B., Bröde, P., Havenith, G., Jendritzky, G. (2008). Der Entwicklungsstand des
klimatischen Belastungs-Index UTCI (Universal Thermal Climate Index). Paper presented at the
Produkt-und Produktions-Ergonomie-Aufgabe für Entwickler und Planer, 54. Kongress der
Gesellschaft für Arbeitswissenschaft. GfA-Press, Dortmund.
28. Kántor, N., Unger, J. (2011). The most problematic variable in the course of human-biometeorological
comfort assessment—the mean radiant temperature. Central European Journal of Geosciences, 3(1):
90-100.
29. Kim, Y.M., Kim, S., Cheong, H.K., Kim, E.H. (2011). Comparison of temperature indexes for the
impact assessment of heat stress on heat-related mortality. Environmental health and toxicology, 26.
30. Konz, S., Hwang, C., Dhiman, B., Duncan, J., Masud, A. (1977). An experimental validation of
mathematical simulation of human thermoregulation. Computers in biology and medicine, 7(1): 71-
82.
31. Kuklane, K., Gao, C., Holmér, I., Giedraitytė, L., Bröde, P., Candas, V., ... Havenith, G. (2007).
Calculation of clothing insulation by serial and parallel methods: effects on clothing choice by IREQ
and thermal responses in the cold. International Journal of Occupational Safety and Ergonomics,
13(2): 103-116.
Evaluation of human thermal comfort using UTCI index: case study Khorasan Razavi, Iran 175
32. Laschewski, G., Jendritzky, G. (2002). Effects of the thermal environment on human health: an
investigation of 30 years of daily mortality data from SW Germany. Climate research, 21(1): 91-103.
33. Lemons, D. (1984). Theory and Experiment for the Effect of Vascular iicrostructure on Surface Tissue
Heat Transfer—Part II: Model Formulation and Solution. Journal of Biomechanical Engineering, 106, 331.
34. Lomas, K., Fiala, D., Stohrer, M. (2003). First principles modeling of thermal sensation responses in
steady-state and transient conditions. ASHRAE Transactions, 109(1): 179-186.
35. Matzarakis, A., Muthers, S., Koch, E. (2011). Human biometeorological evaluation of heat-related
mortality in Vienna. Theoretical and Applied Climatology, 105(1-2): 1-10.
36. Matzarakis, A., Mayer, H., Iziomon, M.G. (1999). Applications of a universal thermal index:
physiological equivalent temperature. International journal of biometeorology, 43(2):76-84.
37. Mayer, H., Höppe, P. (1987). Thermal comfort of man in different urban environments. Theoretical
and Applied Climatology, 38(1): 43-49.
38. McGregor, G.R. (2012). Human biometeorology. Progress in Physical Geography, 36(1): 93-109.
39. Milewski, P. (2013). Application of the UTCI to the local bioclimate of Poland’s Ziemia Kłodzka
Region. Geographia Polonica, 86(1): 47-54.
40. Pappenberger, F., Jendritzky, G., Staiger, H., Dutra, E., Di Giuseppe, F., Richardson, D., Cloke, H.
(2014). Global forecasting of thermal health hazards: the skill of probabilistic predictions of the
Universal Thermal Climate Index (UTCI). International journal of biometeorology, 1-13.
41. Parsons, K. (2014). Human thermal environments: the effects of hot, moderate, and cold environments
on human health, comfort, and performance: Crc Press.
42. Psikuta, A., Fiala, D., Laschewski, G., Jendritzky, G., Richards, M., Błażejczyk, K., ... Havenith, G.
(2012). Validation of the Fiala multi-node thermophysiological model for UTCI application.
International journal of biometeorology, 56(3): 443-460.
43. Richards, M., & Fiala, D. (2004). Modelling fire-fighter responses to exercise and asymmetric
infrared radiation using a dynamic multi-mode model of human physiology and results from the
Sweating Agile thermal Manikin. European journal of applied physiology, 92(6), 649-653.
44. Schreier, S.F., Suomi, I., Bröde, P., Formayer, H., Rieder, H. E., Nadeem, I., ... Weihs, P. (2013). The
uncertainty of UTCI due to uncertainties in the determination of radiation fluxes derived from
numerical weather prediction and regional climate model simulations. International journal of
biometeorology, 57(2), 207-223.
45. Staiger, H., Laschewski, G., Grätz, A. (2012). The perceived temperature–a versatile index for the
assessment of the human thermal environment. Part A: scientific basics. International journal of
biometeorology, 56(1): 165-176.
46. Stolwijk, J.A. (1980). Mathematical models of thermal regulation. Annals of the New York Academy
of Sciences, 335(1): 98-106.
47. Tanabe, S.I., Kobayashi, K., Nakano, J., Ozeki, Y., Konishi, M. (2002). Evaluation of thermal comfort
using combined multi-node thermoregulation (65MN) and radiation models and computational fluid
dynamics (CFD). Energy and Buildings, 34(6): 637-646.
48. Weihs, P., Staiger, H., Tinz, B., Batchvarova, E., Rieder, H., Vuilleumier, L., . . . Jendritzky, G.
(2012). The uncertainty of UTCI due to uncertainties in the determination of radiation fluxes derived
from measured and observed meteorological data. International journal of biometeorology, 56(3),
537-555.
49. Weinbaum, S., Jiji, L., Lemons, D. (1984). Theory and experiment for the effect of vascular
microstructure on surface tissue heat transfer—Part I: Anatomical foundation and model
conceptualization. Journal of Biomechanical Engineering, 106(4): 321-330.
50. Wissler, E. (1985). Mathematical simulation of human thermal behavior using whole body models.
Heat transfer in medicine and biology, 1(13): 325-373.