Embed Size (px)
Citation preview

e
SVENSK KÄRNBRÄNSLEHANTERING AB
SWEDISH NUCLEAR FUEL
AND WASTE MANAGEMENT CO
Box 3091, SE-169 03 Solna
Phone +46 8 459 84 00
skb.se
SVENSK KÄRNBRÄNSLEHANTERING
Evaluation of Hydraulic Interference Tests in Forsmark with KFM24 as pumping borehole
Johan Harrström
Oskar Sjöberg
Johan Öhman
Report
P-17-17April 2018

Tänd ett lager: P, R eller TR.
Evaluation of Hydraulic Interference Tests in Forsmark with KFM24 as pumping borehole
Johan Harrström, Oskar Sjöberg, Johan Öhman Geosigma AB
ISSN 1651-4416SKB P-17-17ID 1583438
April 2018
Keywords: Interference test, KFM24, Transient, Hydraulic response, Pumping test, Forsmark, Access area.
This report concerns a study which was conducted for Svensk Kärnbränslehantering AB (SKB). The conclusions and viewpoints presented in the report are those of the authors. SKB may draw modified conclusions, based on additional literature sources and/or expert opinions.
Data in SKB’s database can be changed for different reasons. Minor changes in SKB’s database will not necessarily result in a revised report. Data revisions may also be presented as supplements, available at www.skb.se.
A pdf version of this document can be downloaded from www.skb.se.
© 2018 Svensk Kärnbränslehantering AB

SKB P-17-17 3
Abstract
Five hydraulic interference tests were carried out from September to October, 2016, within the Forsmark access area with the core-drilled borehole KFM24 as pumping borehole.
The interference tests comprise pumping in five sections of borehole KFM24 while monitoring head responses in selected surrounding boreholes. The interference tests were designed according to the results of the previous flow logging of KFM24 together with supporting geological information.
This report describes the execution, analysis and results of the hydraulic interference tests. Hydraulic parameters and response indices were evaluated for the observed responses assuming a porous medium. Finally, a resulting response matrix was prepared together with 3D-images of the responses in the analyzed boreholes.
During the five interference tests in KFM24, only a few hydraulic responses were obtained in surrounding observation boreholes. The responses were mainly characterized distinct but slow. No responses were observed during the tests in KFM24: 45–65.0 m and 396–416.0 m. In the test in KFM24: 121–141.0 m, a strong but very slow response of 0.43 m was observed in section KFM08A:9 (0–161.0 m) and during the test in KFM24: 145–165.0 m, KFM08A:8 (162.0–215.0 m) responded slow but strong with a drawdown of 0.83 m. No other responses were indicated during these tests.
The interference test in KFM24:177–197.0 m was the most active test, both in terms of obtained flow and responses. The responding sections were KFM08A:6–9 (0–280.0 m in all), KFM08B:1 (113.0–200.5 m) and KFM08C:4 (146.0–310.0 m). The strongest responses occurred in sections KFM08A:8 (162.0–215.0 m) with 9.16 m and KFM08B:1 (113.0–200.5 m) with 2.6 m. The most rapid response occurred in section KFM08A:8.
The estimated transmissivity of the responses ranges from ca. 1 × 10⁻⁷ to 2 × 10⁻⁵ m2/s, whereas the estimated storativity ranges from ca. 3 × 10⁻⁶ to 1 × 10⁻⁴. These values assume an equivalent homogeneous porous medium and thus constitute average values for a large volume of rock within the influence volume of the test.
4 SKB P-17-17
Sammanfattning
Hydrauliska interferenstester utfördes under september och oktober 2016 i Forsmarks undersökning-sområde med kärnborrhålet KFM24 som pump borrhål.
Interferenstesterna omfattar pumpning i fem sektioner av KFM24, medan tryckresponser mättes i utvalda omkringliggande borrhål. Interferenstesterna utformades på basis av resultaten från tidigare flödesloggning i borrhålen tillsammans med kompletterande geologisk information.
Denna rapport beskriver utförande, analys och resultat från de hydrauliska interferens-testerna. Hydrauliska parametrar och responsindex utvärderades för observerade responser med transient tolkningsmetodik. Slutligen sammanställdes en sammanfattande responsmatris och 3D-bilder för responserna i de borrhål som studerades under interferenstesterna.
Endast ett fåtal tryckresponser i observationssektionerna erhölls under de fem interferenstesterna i KFM24. Generellt var dessa responser distinkta men långsamma. Under testerna i KFM24: 45–65,0 m och 396–416,0 m observerades inga responser i omkringliggande borrhål. I testet i KFM24: 121–141,0 m erhölls en långsam men stark respons i KFM08A:9 (0–161.0 m) med en avsänkning på 0.43 m och under testet i 145–165,0 m responderade KMF08A:8 (162.0–215.0 m) långsamt men distinkt med en avsänkning på 0.83 m. Inga andra responser observerades under dessa test.
Interferenstestet i KFM24: 177–197,0 m var det mest aktiva testet med avseende på flöde och antalet erhållna responser. Responderande sektioner var KFM08A: 6–9 (0–280.0 m totalt), KFM08B:1 (113.0–200.5 m) och KFM08C:4 (146.0–310.0 m). De mest distinkta responserna erhölls i sektion-erna KFM08A:8 (162.0–215.0 m) med 9.16 m avsänkning och i KFM08B:1 (113.0–200.5 m) med en avsänkning på 2.6 m och den snabbaste responsen uppstod i KFM08A:8.
Den skattade transmissiviteten för responserna till testerna i KFM24 varierar från ca 1 × 10⁻⁷ till 2 × 10⁻⁵ m2/s, medan den skattade magasinskoefficienten varierar från ca 3 × 10⁻⁶ till 1 × 10⁻⁴. Dessa värden representerar ett ekvivalent homogent sprickigt medium och utgör sålunda me delvärden för en större bergvolym inom influensområdet för testen.
SKB P-17-17 5
Contents
1 Introduction 7
2 Objective and scope of work 11
3 Methodology and evaluation 133.1 Test evaluation 13
3.1.1 General 133.1.2 Pumping boreholes 133.1.3 Observation boreholes 14
3.2 Response analysis and estimation of hydraulic diffusivity 14
4 Execution of the hydraulic interference tests 174.1 Procedure 174.2 Description of equipment 194.3 Description of test performance 19
4.3.1 Interference test in KFM24: 45.0–65.0 m 194.3.2 Interference test in KFM24: 121.0–141.0 m 204.3.3 Interference test in KFM24: 145.0–165.0 m 204.3.4 Interference test in KFM24: 177.0–197.0 m 204.3.5 Interference test in KFM24: 396.0-416.0 m 20
5 Response analysis of the observation sections 21
6 Transient evaluation of the interference tests 256.1 Interference test in KFM24: 45.0–65.0 m 26
6.1.1 Pumped borehole section 266.2 Interference test in KFM24: 121.0–141.0 m 26
6.2.1 Pumped borehole section 266.2.2 Observed responses 26
6.3 Interference test in KFM24: 145.0–165.0 m 276.3.1 Pumped borehole section 276.3.2 Observed responses 27
6.4 Interference test in KFM24: 177.0–197.0 m 276.4.1 Pumped borehole section 276.4.2 Observed responses 28
6.5 Interference test in KFM24: 396.0–416.0 m 306.5.1 Pumped borehole section 306.5.2 Observed responses 30
7 Summary of results 31
References 37
Appendix 1 Plots 39Appendix 2 Hydraulic interference test diagrams 47Appendix 3 Observation borehole sections 61

SKB P-17-17 7
1 Introduction
Svensk Kärnbränslehantering AB (SKB) has applied for a deep repository for spent nuclear fuel at the Forsmark site (Figure 1-1). Site investigations have demonstrated that the upper bedrock (c. 200 m) is locally highly transmissive and hydraulically connected over long distances (Follin 2008). KFM24 is a core-drilled borehole made to investigate the premises for the planned skip shaft to the repository (Figure 1-2).
The interference tests include pumping tests in five sections of borehole KFM24, while head is being monitored in a selection of surrounding boreholes. The observation boreholes have permanently installed monitoring sections and the pressure data was collected by SKB’s Hydro Monitoring System (HMS) or by loggers installed at the boreholes.
This report includes the execution, analysis and results of the hydraulic interference tests. Data and results are also available in the SKB database, Sicada.
This work was carried out in accordance with activity plan AP SFK-16-005. In Table 1-1 controlling documents for performing this activity are listed. The activity plan and the method descriptions are SKB’s internal controlling documents.
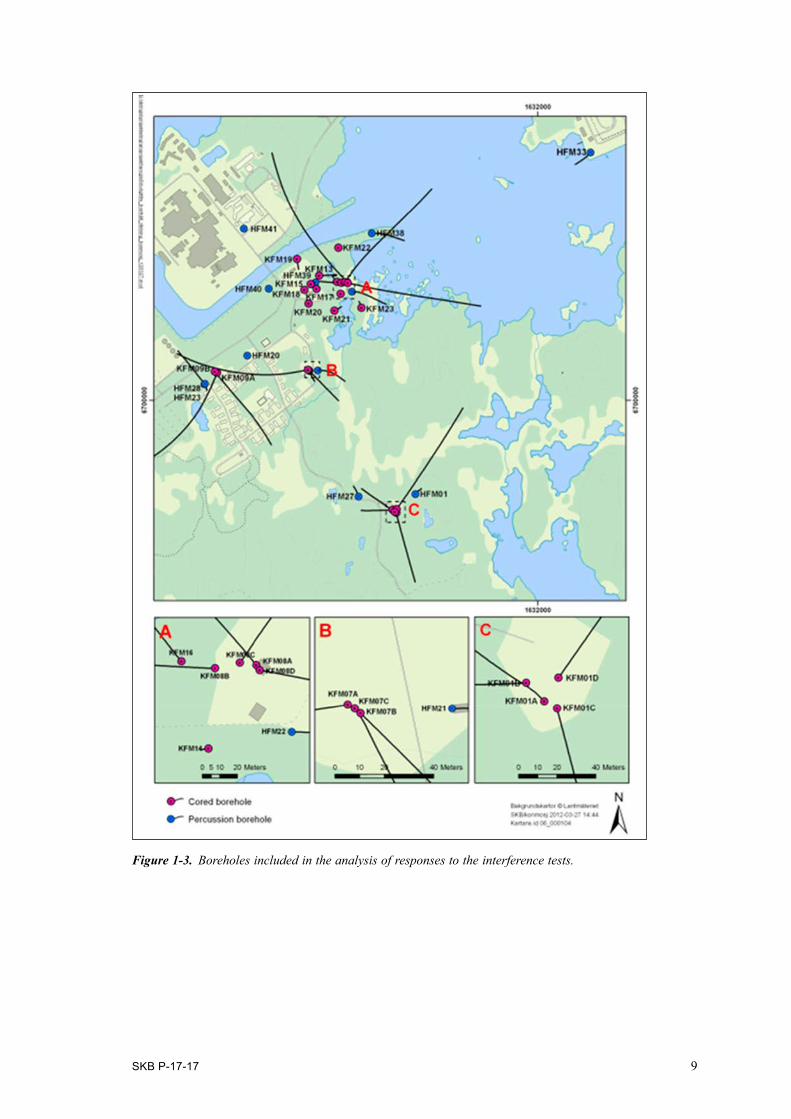
The following boreholes were primarily included in the hydraulic interference tests: HFM20, HFM21, HFM22, HFM23, HFM28, HFM38, HFM39, HFM40, HFM41, KFM07A, KFM07B, KFM07C, KFM08A, KFM08B, KFM08C, KFM08D, KFM09A, KFM09B, KFM13, KFM14, KFM15, KFM16, KFM17, KFM18, KFM19, KFM20, KFM21, KFM22 and KFM23. The locations of the boreholes are shown in Figure 1-3.
Table 1-1. Controlling documents for performance of the activity.
Table text Number VersionInterferenstester i i området för sänkschakt AP SFK-16-005 0.4
Method descriptions Number VersionMetodinstruktion för analys av injektions- och enhålspumptester
SKB MD 320.004 2.0
Metodbeskrivning för interferenstester SKB MD 330.003 2.0

8 SKB P-17-17
Figure 1‑2. Location of borehole KFM24 within the Forsmark area. The lines visualize the direction and extent of the boreholes.
Figure 1‑1. Planned deep repository for spent nuclear fuel in the Forsmark area.
SKB P-17-17 9
Figure 1‑3. Boreholes included in the analysis of responses to the interference tests.

SKB P-17-17 11
2 Objective and scope of work
The aim of the interference tests was to provide local information on hydraulic connectivity for the construction of the skip shaft to the planned deep repository (SKB 2016). The primary objectives of this work were to identify and quantify hydraulic responses to interference tests in KFM24, which has been drilled in the proximity of the planned skip shaft (Nilsson 2017).
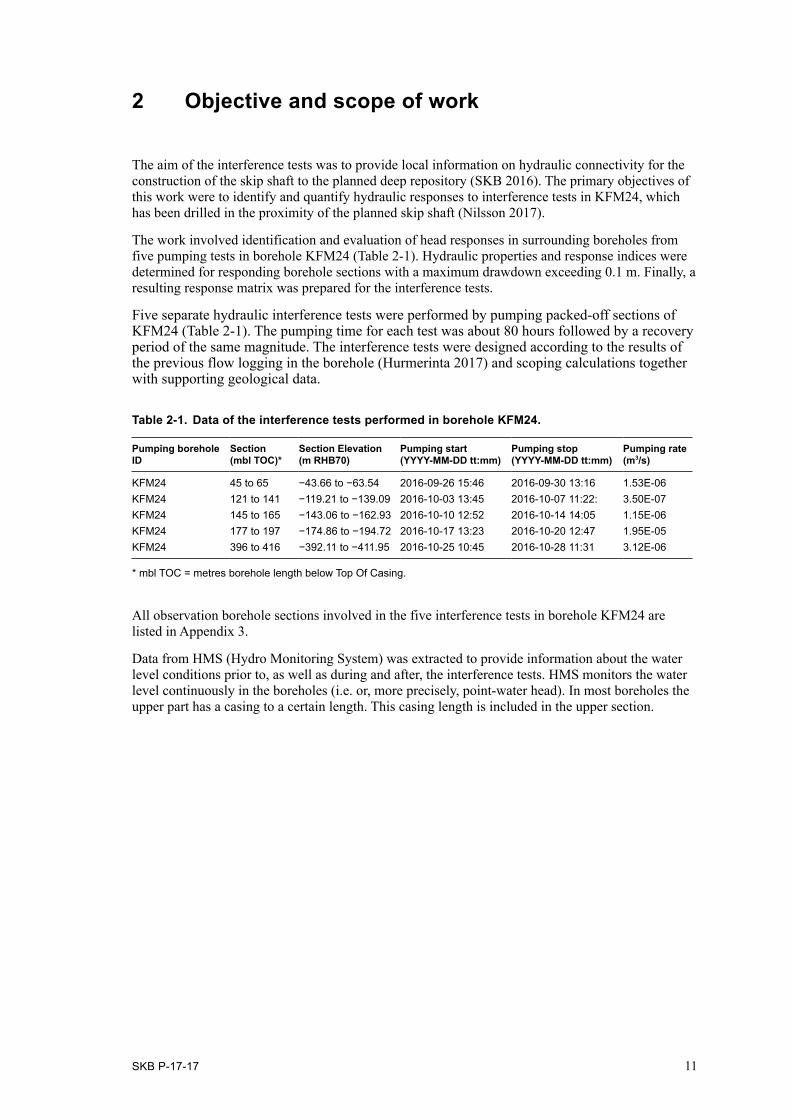
The work involved identification and evaluation of head responses in surrounding boreholes from five pumping tests in borehole KFM24 (Table 2-1). Hydraulic properties and response indices were determined for responding borehole sections with a maximum drawdown exceeding 0.1 m. Finally, a resulting response matrix was prepared for the interference tests.
Five separate hydraulic interference tests were performed by pumping packed-off sections of KFM24 (Table 2-1). The pumping time for each test was about 80 hours followed by a recovery period of the same magnitude. The interference tests were designed according to the results of the previous flow logging in the borehole (Hurmerinta 2017) and scoping calculations together with supporting geological data.
Table 2-1. Data of the interference tests performed in borehole KFM24.
Pumping borehole Section Section Elevation Pumping start Pumping stop Pumping rateID (mbl TOC)* (m RHB70) (YYYY-MM-DD tt:mm) (YYYY-MM-DD tt:mm) (m3/s)
KFM24 45 to 65 −43.66 to −63.54 2016-09-26 15:46 2016-09-30 13:16 1.53E-06KFM24 121 to 141 −119.21 to −139.09 2016-10-03 13:45 2016-10-07 11:22: 3.50E-07KFM24 145 to 165 −143.06 to −162.93 2016-10-10 12:52 2016-10-14 14:05 1.15E-06KFM24 177 to 197 −174.86 to −194.72 2016-10-17 13:23 2016-10-20 12:47 1.95E-05KFM24 396 to 416 −392.11 to −411.95 2016-10-25 10:45 2016-10-28 11:31 3.12E-06
* mbl TOC = metres borehole length below Top Of Casing.
All observation borehole sections involved in the five interference tests in borehole KFM24 are listed in Appendix 3.
Data from HMS (Hydro Monitoring System) was extracted to provide information about the water level conditions prior to, as well as during and after, the interference tests. HMS monitors the water level continuously in the boreholes (i.e. or, more precisely, point-water head). In most boreholes the upper part has a casing to a certain length. This casing length is included in the upper section.

SKB P-17-17 13
3 Methodology and evaluation
3.1 Test evaluation3.1.1 GeneralStandard methods for constant flow rate interference tests in an equivalent porous medium were used for transient evaluation of the responses in the observation borehole sections in accordance with the methodology description for interference tests (SKB MD 330.003 v2.0). The responses in the pumped sections in KFM24 were evaluated according to theories for single-hole tests, taking effects of wellbore storage and skin into account (SKB MD 320.004 v.2.0).
Transient analysis was performed using the software AQTESOLV Pro v. 4.50 (Hydrosolve, Inc.) that enables both manual and automatic type-curve matching. The analysis was carried out as an iterative process of manual type-curve matching and automatic non-linear regression. The estimation of the hydraulic parameters is normally based on the identified flow regime and associated flow regimes during the tests. The flow regimes are derived from diagnostic analysis of the transient responses.
All hydraulic head data from the observation boreholes presented in this report have, prior to evalua-tion, been corrected automatically in HMS for atmospheric pressure changes by subtracting the latter pressure from the measured (absolute) pressure. No other corrections of the measured drawdown due to e.g. precipitation, drought periods and tidal effects have been made. The pressure in the pumping boreholes has not been corrected for atmospheric pressure changes at the site, as it is negligible in relation to drawdown in the pumping borehole.
3.1.2 Pumping boreholesPrior to the transient analysis, interpretation of the transmissivity based on the assumption of stationary conditions in the pumping boreholes was performed according to Moye’s formula (Equation 3-1).
MM C
dpgQ
Tp
wp ⋅=
π22
ln1
+
= w
w
rL
CM
Equation 3-1
Qp = flow rate by the end of the flow period [m3/s]
ρw = density of water [kg/m3]
g = acceleration of gravity [m/s2]
CM = geometrical shape factor [-]
dpp = pp – pi [Pa]
rw = borehole radius [m]
Lw = section length [m]
The transmissivity and skin factor of the pumping borehole were obtained from transient analysis based on the diagnostic analysis of flow regimes. The storativity, S [-], was estimated accord-ing to Rhén et al. (1997). This is an empirical regression relationship between storativity and transmissivity.
The wellbore storage coefficient, CWBS [m3/Pa], in an isolated pumping borehole section can be obtained from the estimated fictive casing radius, r(c) [m], in an equivalent open test system accord-ing to Equation 3-2.
gcrCWBS ⋅
⋅=ρ
π 2)( Equation 3-2
14 SKB P-17-17
The radius of influence at a certain time during the test may be estimated from Jacob’s approxima-tion of the Theis’ well function according to Equation 3-3. This approximation assumes a cylindrical flow regime in a completely penetrating well in a horizontal porous medium.
StTri
⋅⋅= 25.2
Equation 3-3
Where ri [m] is the radius of influence at time t [s] after start of pumping, usually at stop of pumping, and S being the Storativity.
3.1.3 Observation boreholesData from all the observation-hole sections considered were included in the diagnostic analysis (Figure 3-1) where linear plots of head versus time were studied to identify potential responses. However, very weak responses (sp < 0.1 m) and/or uncertain responses were not included in the analysis. Corresponding diagrams of air pressure and sea-level fluctuations were also used in the diagnostic analysis to assist the identification of responding sections.
The evaluation of the dominating transient flow regimes, i.e. pseudo-linear flow (PLF), pseudo-radial flow (PRF), and pseudo-spherical flow (PSF), and outer hydraulic boundary conditions was mainly based on diagnostic plots with logarithmic scaling. In particular, PRF is reflected by a constant (horizontal) derivative, whereas apparent No-Flow- (NFB) and Constant-Head Boundaries (CHB) are characterized by a rapid increase and decrease in the derivative, respectively. Based on the diagnostic analysis, relevant models were selected for the transient evaluation of the responses.
In the transient evaluation of hydraulic properties for clear responses, standard methods were employed to determine transmissivity and storativity (Kruseman and de Ridder 1990). The hydraulic diffusivity of responses (i.e. pressure-propagation rate) is usually determined based on a response time defined for a standard drawdown criterion of 0.01 m. However, owing to fluctuations in monitored head of the observation sections (i.e. the prevailing noise level), the standard drawdown criterion was not possible to apply, and therefore it was not meaningful to calculate hydraulic diffusivity.
3.2 Response analysis and estimation of hydraulic diffusivityResponding sections where the drawdown, sp [m], exceeds the response criterion (sp> 0.1 m) are evaluated by means of so-called response indices 1 and 2-new (defined below). These indices represent the speed of propagation rate and strength of the responses, respectively, which in turn are assumed to characterize the hydraulic connection between the pumping and the observation sections. Index 1 is directly related to the hydraulic diffusivity (T/S) of the formation. The hydraulic diffusivity is also evaluated based on transient evaluation of the responses. The maximal drawdown, sp [m], occurred in several observation sections long after the pumping had stopped. The response time, dtL [s], is defined as the time lag after start of pumping until a response of 0.1 m is observed in the observation section. This criterion was used for calculating the response indices.
The pumping flow rate, Qp [m3/s], was used in combination with the response time (dtL), spherical distance between the pumped borehole section and the responding borehole section, rs [m], and maximum drawdown sp [m] to calculate the response indices 1 and 2-new. The spherical distance is calculated from the midpoints of the pumped borehole section and the observation sections. Since these tests are performed in selected fractures the flow is not uniformly distributed in space. The response indices were calculated as follows:
Index 1 [m²/s]: Normalised spherical distance (rs) with respect to the response time dtL (s = 0.1 m).
L
s
dtrIndex2
1 = Equation 3-4
SKB P-17-17 15
Index 2 new [s/m2]:Normalized maximum drawdown (sp) with respect to the pumping rate by the end of the flow period (Qp), also considering the distance (rs) assuming r0=1 m (fictive borehole radius) according to SKB MD 330.003.
⋅=
0
ln2rr
Qs
newIndex s
p
p Equation 3-5
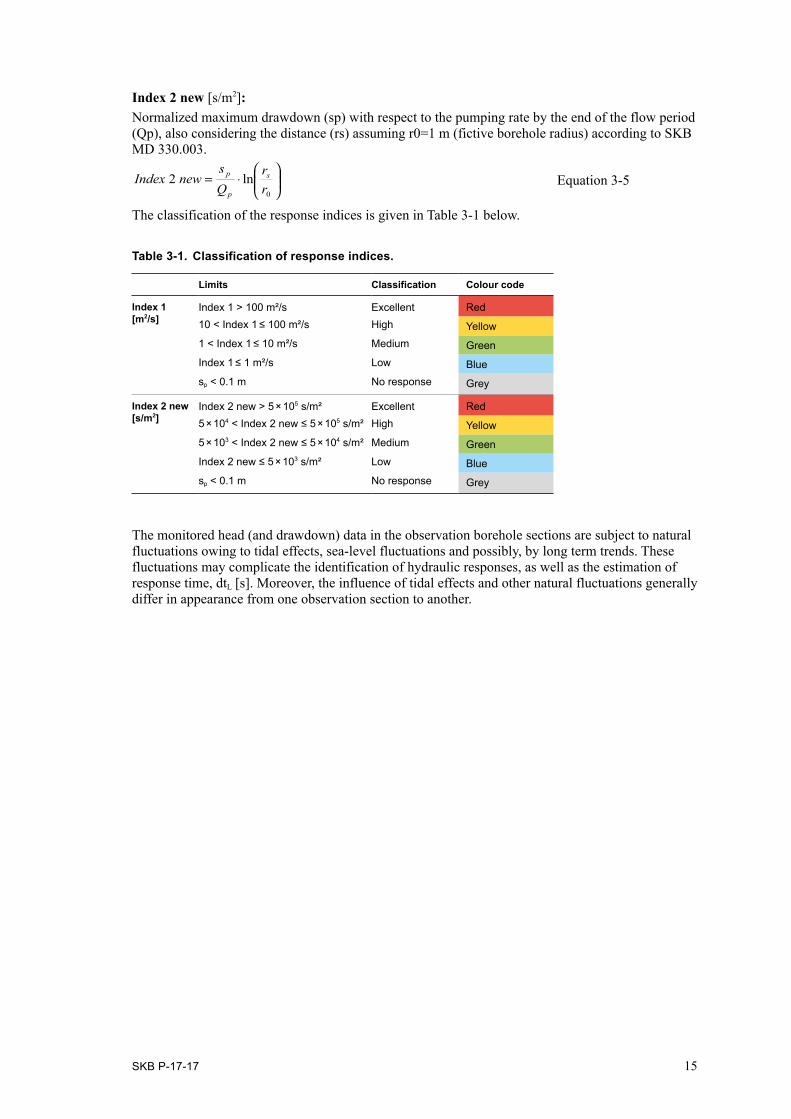
The classification of the response indices is given in Table 3-1 below.
Table 3-1. Classification of response indices.
Limits Classification Colour code
Index 1 [m2/s]
Index 1 > 100 m²/s Excellent Red10 < Index 1 ≤ 100 m²/s High Yellow1 < Index 1 ≤ 10 m²/s Medium GreenIndex 1 ≤ 1 m²/s Low Bluesp < 0.1 m No response Grey
Index 2 new [s/m2]
Index 2 new > 5 × 10⁵ s/m² Excellent Red5 × 104 < Index 2 new ≤ 5 × 10⁵ s/m² High Yellow5 × 103 < Index 2 new ≤ 5 × 10⁴ s/m² Medium GreenIndex 2 new ≤ 5 × 10³ s/m² Low Bluesp < 0.1 m No response Grey
The monitored head (and drawdown) data in the observation borehole sections are subject to natural fluctuations owing to tidal effects, sea-level fluctuations and possibly, by long term trends. These fluctuations may complicate the identification of hydraulic responses, as well as the estimation of response time, dtL [s]. Moreover, the influence of tidal effects and other natural fluctuations generally differ in appearance from one observation section to another.

SKB P-17-17 17
4 Execution of the hydraulic interference tests
4.1 ProcedureThe hydraulic interference tests were performed as pumping tests in different sections of borehole KFM24. Prior to the interference test a PFL logging of KFM24 was performed and using those data, five sections of interest for testing was chosen, see further AP SFK-16-005. Several boreholes in the vicinity of KFM24 were utilized to collect hydraulic head response data before, during and after each period of pumping. A list of all observation sections used in these interference tests are listed in Appendix 3.
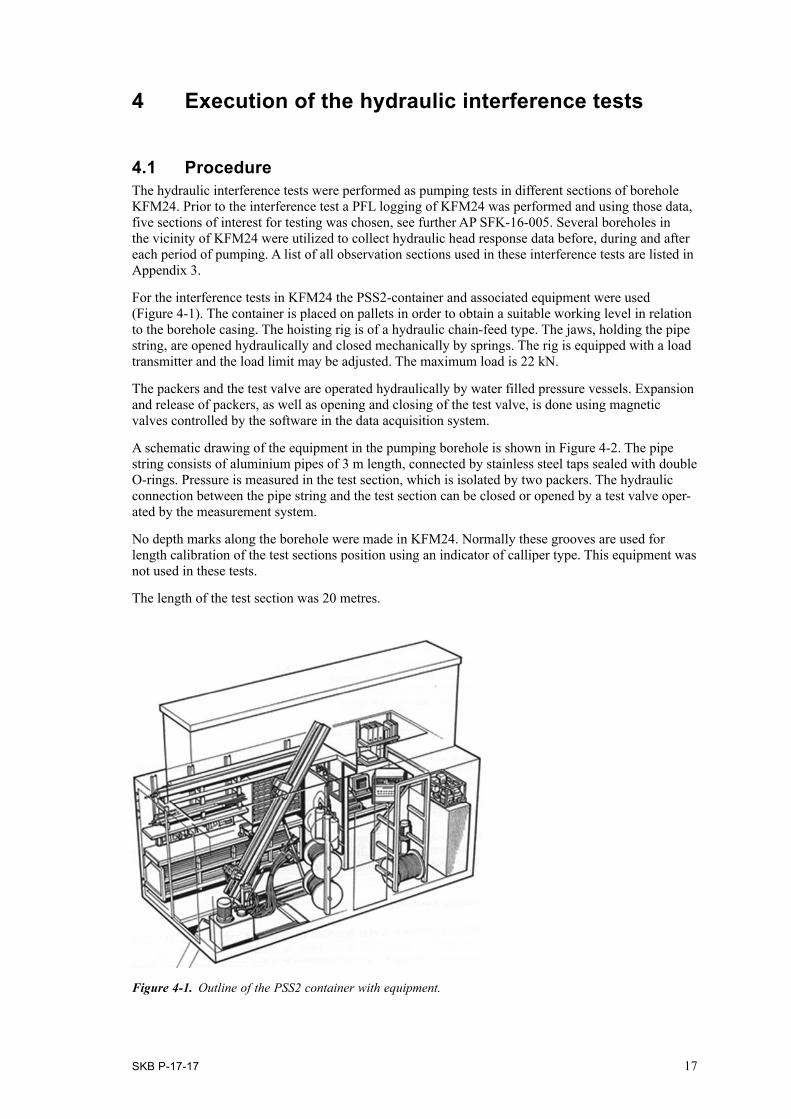
For the interference tests in KFM24 the PSS2-container and associated equipment were used (Figure 4-1). The container is placed on pallets in order to obtain a suitable working level in relation to the borehole casing. The hoisting rig is of a hydraulic chain-feed type. The jaws, holding the pipe string, are opened hydraulically and closed mechanically by springs. The rig is equipped with a load transmitter and the load limit may be adjusted. The maximum load is 22 kN.
The packers and the test valve are operated hydraulically by water filled pressure vessels. Expansion and release of packers, as well as opening and closing of the test valve, is done using magnetic valves controlled by the software in the data acquisition system.
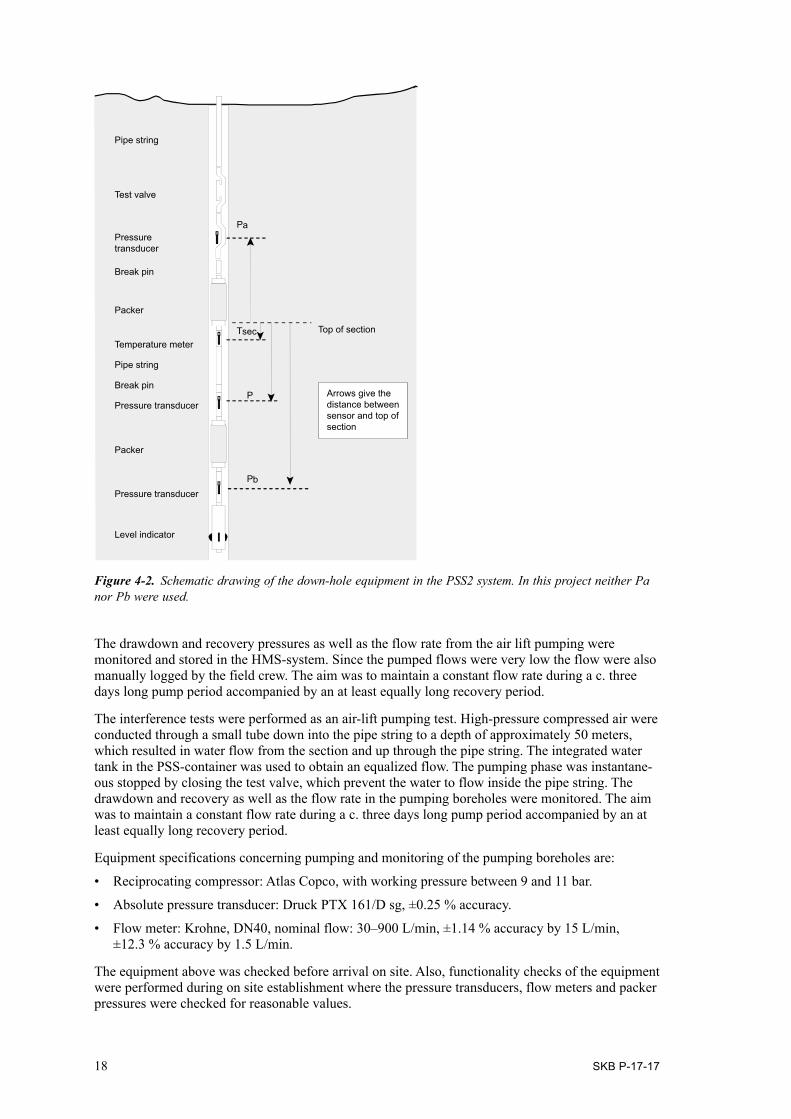
A schematic drawing of the equipment in the pumping borehole is shown in Figure 4-2. The pipe string consists of aluminium pipes of 3 m length, connected by stainless steel taps sealed with double O-rings. Pressure is measured in the test section, which is isolated by two packers. The hydraulic connection between the pipe string and the test section can be closed or opened by a test valve oper-ated by the measurement system.
No depth marks along the borehole were made in KFM24. Normally these grooves are used for length calibration of the test sections position using an indicator of calliper type. This equipment was not used in these tests.
The length of the test section was 20 metres.
Figure 4‑1. Outline of the PSS2 container with equipment.
18 SKB P-17-17
The drawdown and recovery pressures as well as the flow rate from the air lift pumping were monitored and stored in the HMS-system. Since the pumped flows were very low the flow were also manually logged by the field crew. The aim was to maintain a constant flow rate during a c. three days long pump period accompanied by an at least equally long recovery period.
The interference tests were performed as an air-lift pumping test. High-pressure compressed air were conducted through a small tube down into the pipe string to a depth of approximately 50 meters, which resulted in water flow from the section and up through the pipe string. The integrated water tank in the PSS-container was used to obtain an equalized flow. The pumping phase was instantane-ous stopped by closing the test valve, which prevent the water to flow inside the pipe string. The drawdown and recovery as well as the flow rate in the pumping boreholes were monitored. The aim was to maintain a constant flow rate during a c. three days long pump period accompanied by an at least equally long recovery period.
Equipment specifications concerning pumping and monitoring of the pumping boreholes are:
• Reciprocating compressor: Atlas Copco, with working pressure between 9 and 11 bar.
• Absolute pressure transducer: Druck PTX 161/D sg, ±0.25 % accuracy.
• Flow meter: Krohne, DN40, nominal flow: 30–900 L/min, ±1.14 % accuracy by 15 L/min, ±12.3 % accuracy by 1.5 L/min.
The equipment above was checked before arrival on site. Also, functionality checks of the equipment were performed during on site establishment where the pressure transducers, flow meters and packer pressures were checked for reasonable values.
Test valve
Break pin
Pipe string
Packer
Packer
Pressure transducer
Pa
Pb
Tsec
PPressure transducer
Temperature meter
Break pin
Pipe string
Pressure transducer
Level indicator
Top of section
Arrows give the distance between sensor and top of section
Figure 4‑2. Schematic drawing of the down-hole equipment in the PSS2 system. In this project neither Pa nor Pb were used.
SKB P-17-17 19
4.2 Description of equipmentAll the observation boreholes included in the interference tests are part of the SKB’s hydro monitoring system (HMS), in which head is recorded continuously. The water level is automatically corrected for air pressure in the HMS.
The point-water head within each observation section is continuously calculated by means of pres-sure transducers. Each section is isolated by use of packers, expanded with nitrogen gas, strategically isolating specific lengths within boreholes. The isolated sections are hydraulically connected to water-level standpipes by polyamide tubes and lead-through pipes in the packers. The water-level standpipes are installed above the uppermost packer enabling easy pressure gauge maintenance and manual level measurements for each observation section.
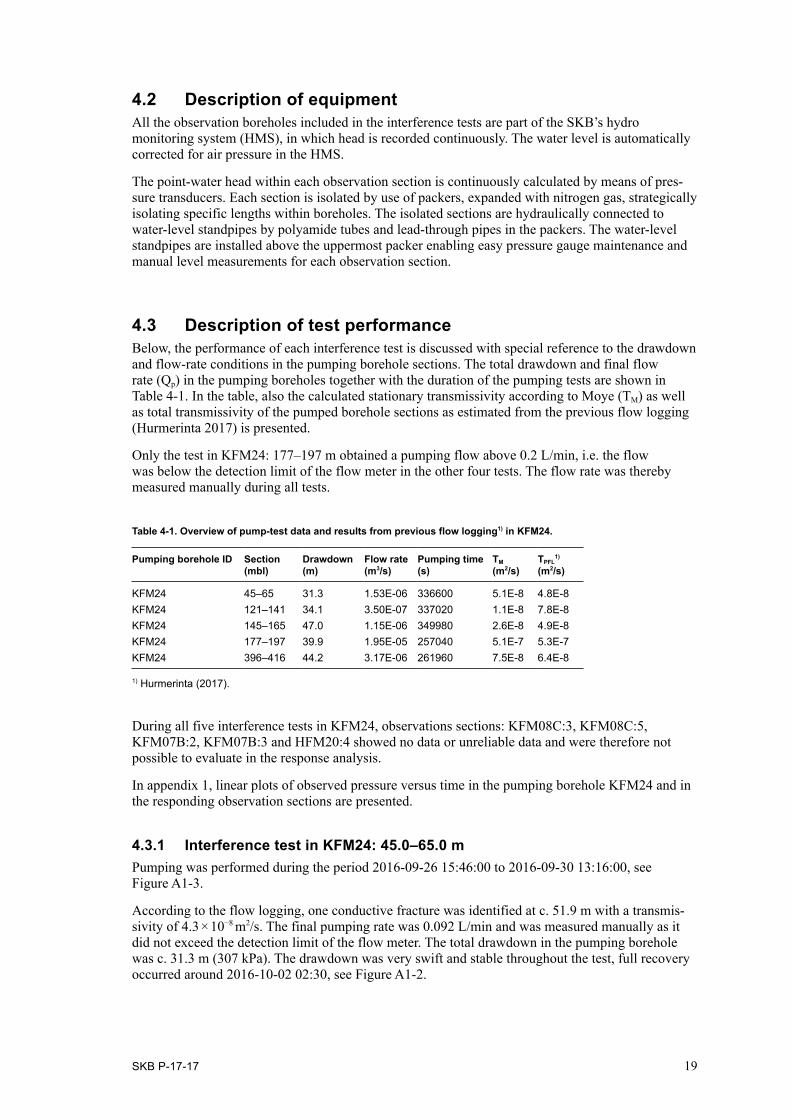
4.3 Description of test performanceBelow, the performance of each interference test is discussed with special reference to the drawdown and flow-rate conditions in the pumping borehole sections. The total drawdown and final flow rate (Qp) in the pumping boreholes together with the duration of the pumping tests are shown in Table 4-1. In the table, also the calculated stationary transmissivity according to Moye (TM) as well as total transmissivity of the pumped borehole sections as estimated from the previous flow logging (Hurmerinta 2017) is presented.
Only the test in KFM24: 177–197 m obtained a pumping flow above 0.2 L/min, i.e. the flow was below the detection limit of the flow meter in the other four tests. The flow rate was thereby measured manually during all tests.
Table 4-1. Overview of pump-test data and results from previous flow logging1) in KFM24.
Pumping borehole ID Section Drawdown Flow rate Pumping time TM TPFL1)
(mbl) (m) (m3/s) (s) (m2/s) (m2/s)
KFM24 45–65 31.3 1.53E-06 336600 5.1E-8 4.8E-8KFM24 121–141 34.1 3.50E-07 337020 1.1E-8 7.8E-8KFM24 145–165 47.0 1.15E-06 349980 2.6E-8 4.9E-8KFM24 177–197 39.9 1.95E-05 257040 5.1E-7 5.3E-7KFM24 396–416 44.2 3.17E-06 261960 7.5E-8 6.4E-8
1) Hurmerinta (2017).
During all five interference tests in KFM24, observations sections: KFM08C:3, KFM08C:5, KFM07B:2, KFM07B:3 and HFM20:4 showed no data or unreliable data and were therefore not possible to evaluate in the response analysis.
In appendix 1, linear plots of observed pressure versus time in the pumping borehole KFM24 and in the responding observation sections are presented.
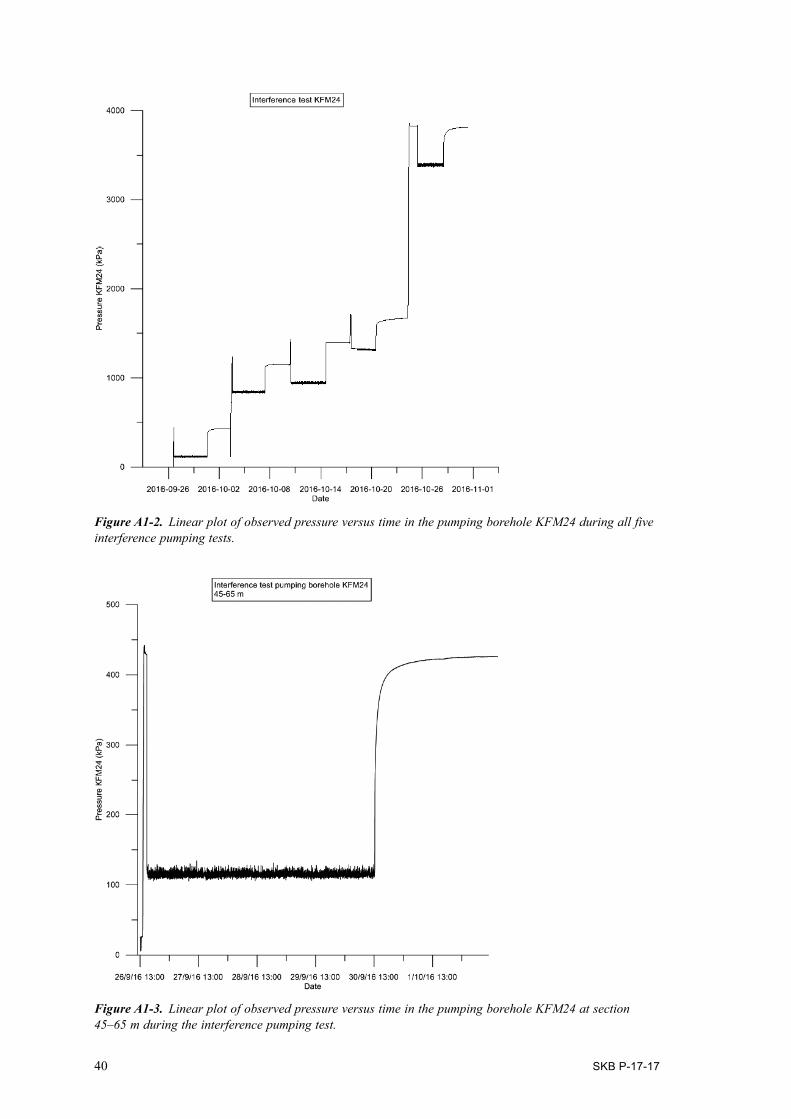
4.3.1 Interference test in KFM24: 45.0–65.0 mPumping was performed during the period 2016-09-26 15:46:00 to 2016-09-30 13:16:00, see Figure A1-3.
According to the flow logging, one conductive fracture was identified at c. 51.9 m with a transmis-sivity of 4.3 × 10⁻⁸ m2/s. The final pumping rate was 0.092 L/min and was measured manually as it did not exceed the detection limit of the flow meter. The total drawdown in the pumping borehole was c. 31.3 m (307 kPa). The drawdown was very swift and stable throughout the test, full recovery occurred around 2016-10-02 02:30, see Figure A1-2.
20 SKB P-17-17
4.3.2 Interference test in KFM24: 121.0–141.0 mPumping was performed during the period 2016-10-03 13:45:00 to 2016-10-07 11:22:00, see Figure A1-4.
According to the flow logging, one conductive fracture was identified at c. 126.7 m with a transmis-sivity of 2.90 × 10⁻⁸ m2/s.
The initial pumping rate was 0.025 L/min (manually measured) and the final rate was 0.021 L/min (manually measured). The total drawdown in the pumping borehole was c. 34.1 m (334 kPa). The drawdown was very swift and stable throughout the test, full recovery occurred around 2016-10-08 02:30, see Figure A1-2.
4.3.3 Interference test in KFM24: 145.0–165.0 mPumping was performed during the period 2016-10-10 12:52:00 to 2016-10-14 14:05:00, see Figure A1-5.
The initial pumping rate was 0.047 L/min (manually measured) and the final rate was 0.069 L/min (manually measured).
According to the flow logging, one conductive fracture was identified at c. 158.1 m with a transmis-sivity of 4.86 10−8 m2/s. The total drawdown in the pumping borehole was c. 47 m (462 kPa). The drawdown was very swift and stable throughout the test, full recovery occurred almost directly after pumping stop, see Figure A1-5.
During the test period were observation sections: KFM07A:1, KFM07A:3, KFM07A:5, KFM07C:1, KFM07C:2, KFM07C:3, KFM09A:1, KFM09A:2, KFM09B:1 and KFM09B:2 affected by external work hence the data may be misleading.
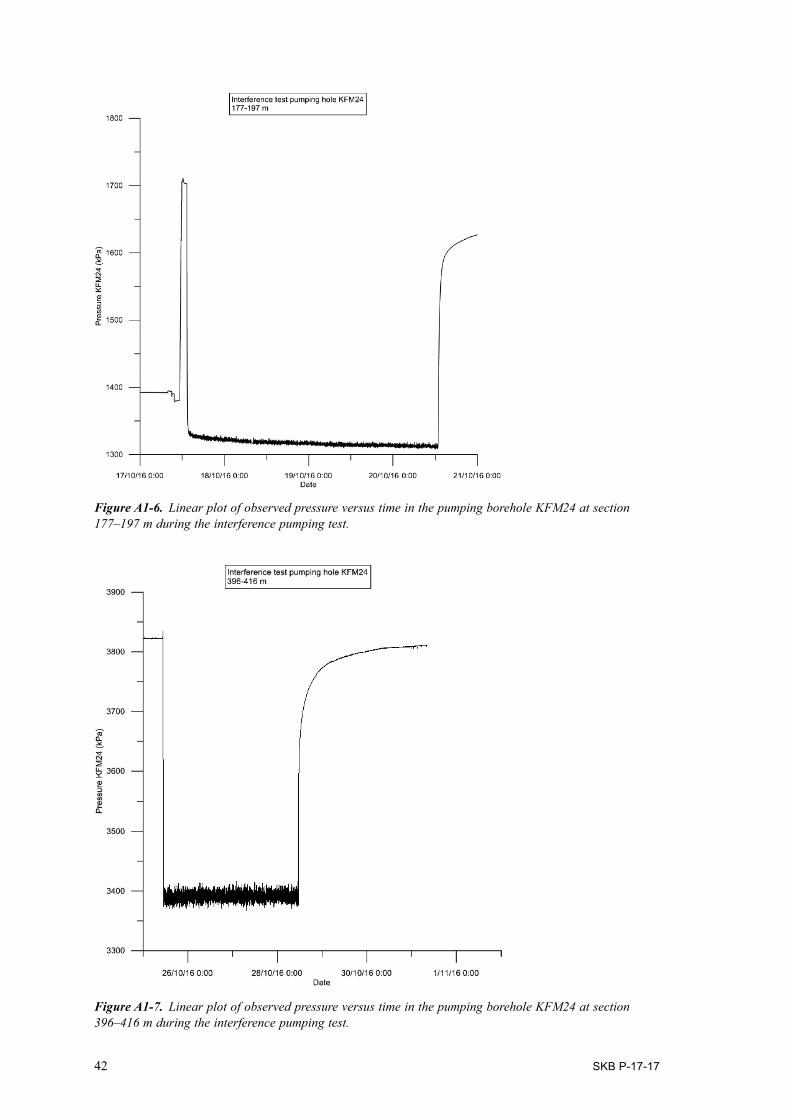
4.3.4 Interference test in KFM24: 177.0–197.0 mPumping was performed during the period 2016-10-17 13:23:00 to 2016-10-20 12:47:00, see Figure A1-6.
According to the flow logging, five conductive fractures were identified in the pumped borehole interval 180.8–195.1 m. The estimated total transmissivity of these fractures was c. 5.3 × 10⁻⁷ m2/s from transient evaluation of the flow logging.
The initial pumping rate was 0.44 L/min (manually measured) and the final rate was 1.17 L/min (manually measured). The total drawdown in the pumping borehole was c. 40 m (391 kPa). The drawdown was more transient in appearance than the other tests but still rather fast and stable throughout the test, full recovery did not occur before the preparation of the next test, see Figure A1-2.
4.3.5 Interference test in KFM24: 396.0-416.0 mPumping was performed during the period 2016-10-25 10:45:00 to 2016-10-28 11:31:00, see Figure A1-7.
According to the flow logging, two conductive fractures were identified in the pumped borehole interval 399.1–412.9 m. The estimated total transmissivity of these fractures was c. 6.4 × 10⁻⁸ m2/s from transient evaluation of the flow logging.
The initial pumping rate was 0.30 L/min (manually measured) and the final rate was 0.19 L/min (manually measured). The total drawdown in the pumping borehole was c. 44.2 m (434 kPa). The drawdown was very swift and stable throughout the test. Full recovery did not occur before the recovery period was ended and the test section removed.
SKB P-17-17 21
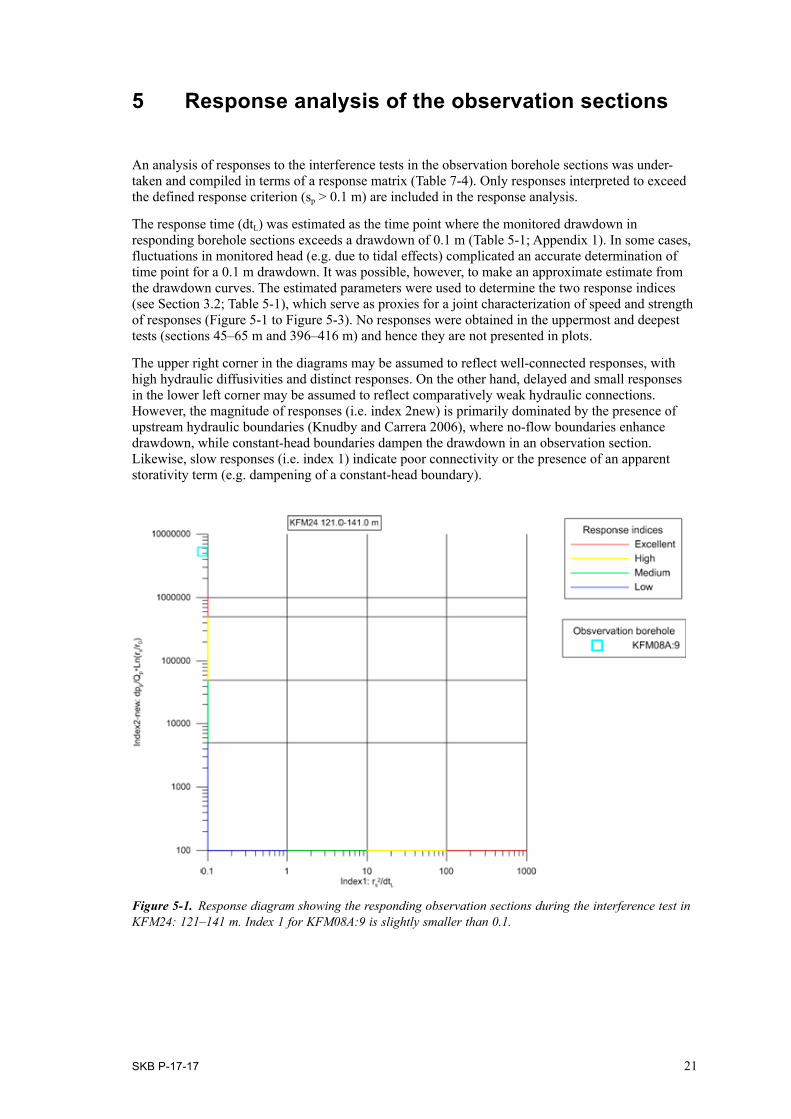
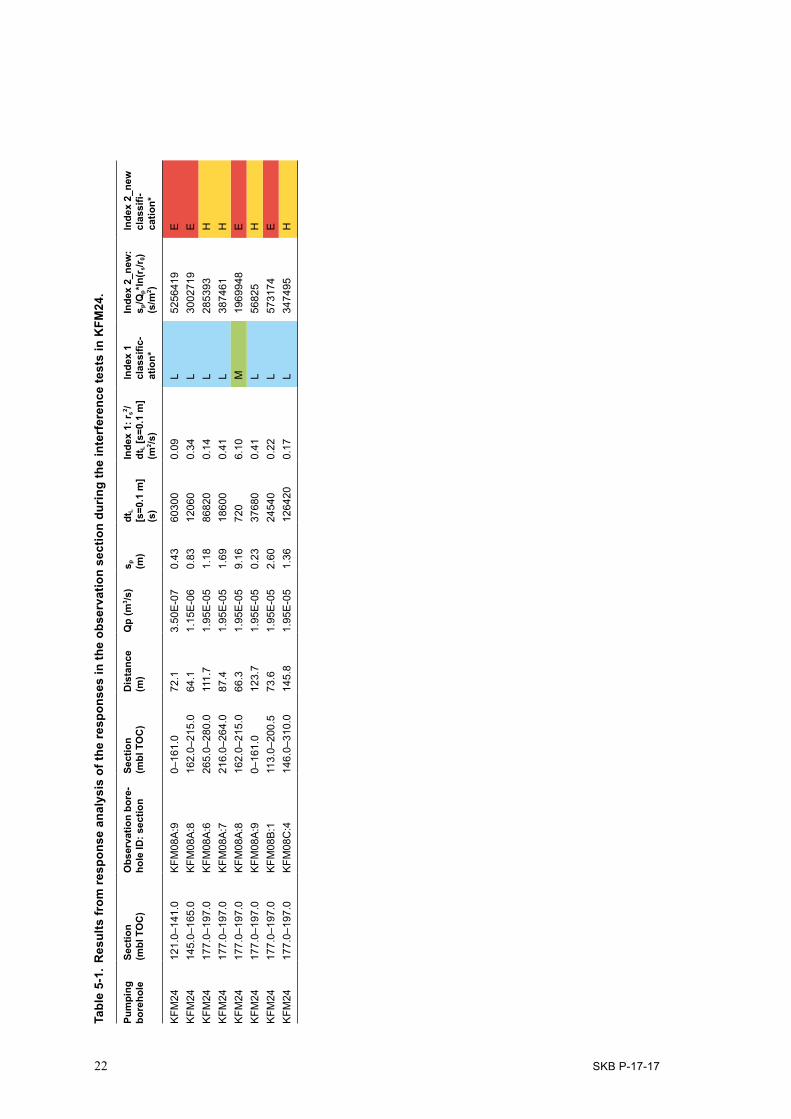
5 Response analysis of the observation sections
An analysis of responses to the interference tests in the observation borehole sections was under-taken and compiled in terms of a response matrix (Table 7-4). Only responses interpreted to exceed the defined response criterion (sp > 0.1 m) are included in the response analysis.
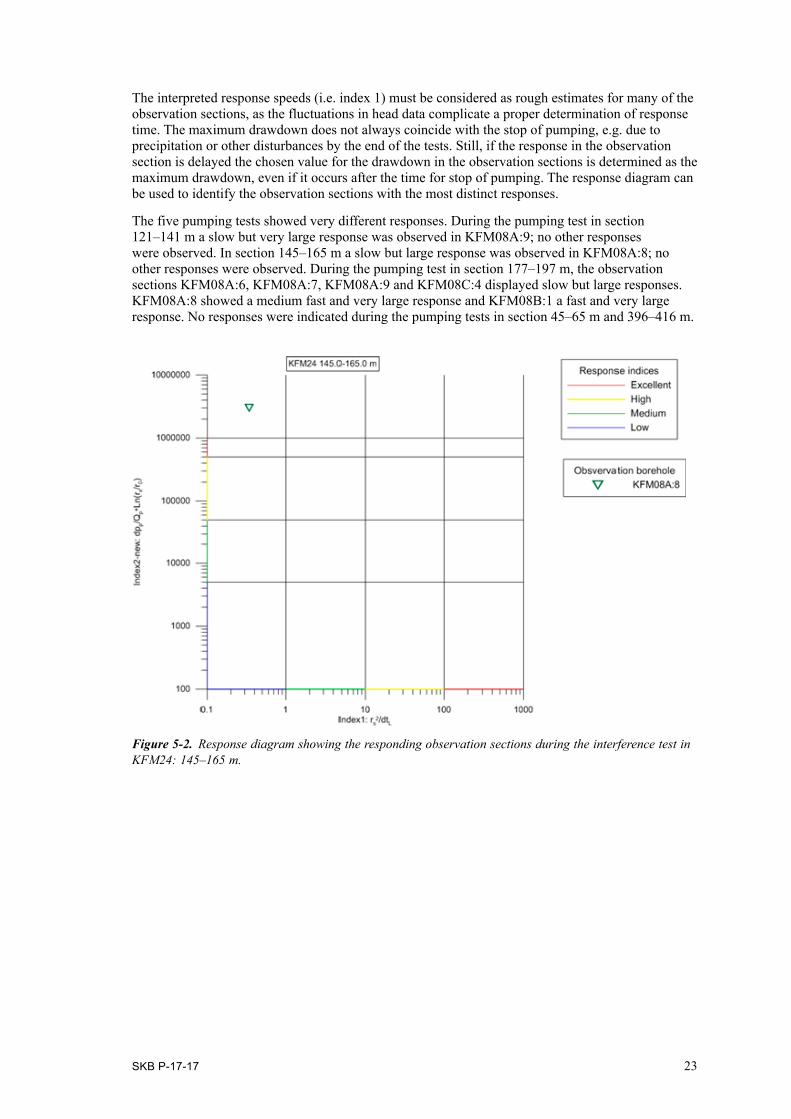
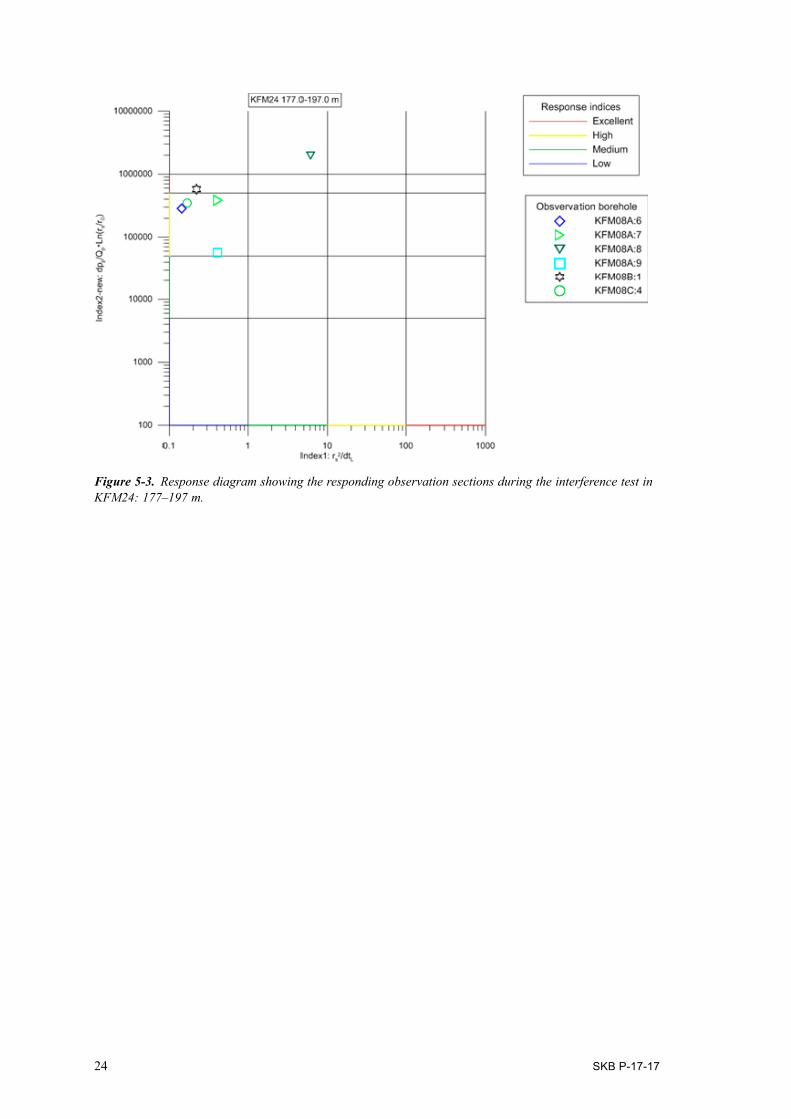
The response time (dtL) was estimated as the time point where the monitored drawdown in responding borehole sections exceeds a drawdown of 0.1 m (Table 5-1; Appendix 1). In some cases, fluctuations in monitored head (e.g. due to tidal effects) complicated an accurate determination of time point for a 0.1 m drawdown. It was possible, however, to make an approximate estimate from the drawdown curves. The estimated parameters were used to determine the two response indices (see Section 3.2; Table 5-1), which serve as proxies for a joint characterization of speed and strength of responses (Figure 5-1 to Figure 5-3). No responses were obtained in the uppermost and deepest tests (sections 45–65 m and 396–416 m) and hence they are not presented in plots.
The upper right corner in the diagrams may be assumed to reflect well-connected responses, with high hydraulic diffusivities and distinct responses. On the other hand, delayed and small responses in the lower left corner may be assumed to reflect comparatively weak hydraulic connections. However, the magnitude of responses (i.e. index 2new) is primarily dominated by the presence of upstream hydraulic boundaries (Knudby and Carrera 2006), where no-flow boundaries enhance drawdown, while constant-head boundaries dampen the drawdown in an observation section. Likewise, slow responses (i.e. index 1) indicate poor connectivity or the presence of an apparent storativity term (e.g. dampening of a constant-head boundary).
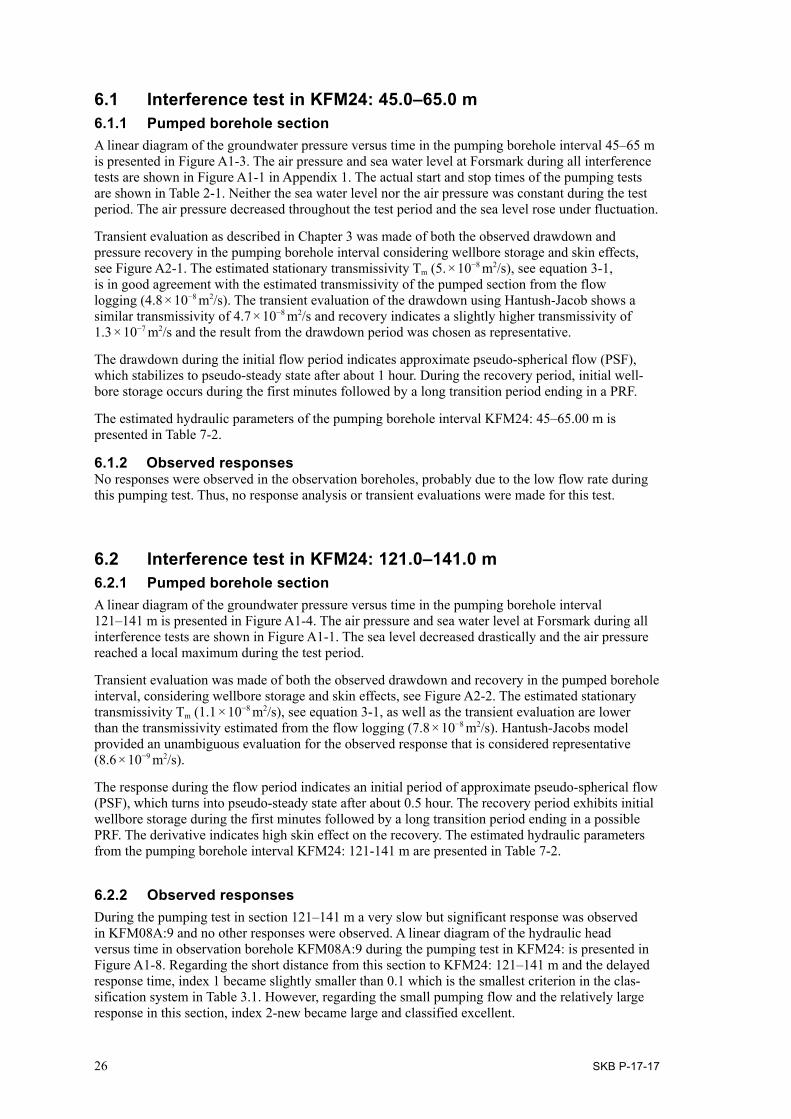
Figure 5‑1. Response diagram showing the responding observation sections during the interference test in KFM24: 121–141 m. Index 1 for KFM08A:9 is slightly smaller than 0.1.
22 SKB P-17-17
Tabl
e 5-
1. R
esul
ts fr
om re
spon
se a
naly
sis
of th
e re
spon
ses
in th
e ob
serv
atio
n se
ctio
n du
ring
the
inte
rfer
ence
test
s in
KFM
24.
Pum
ping
bo
reho
le
Sect
ion
(m
bl T
OC
)O
bser
vatio
n bo
re-
hole
ID: s
ectio
nSe
ctio
n
(mbl
TO
C)
Dis
tanc
e (m
)Q
p (m
3 /s)
s p
(m)
dtL
[s=0
.1 m
] (s
)
Inde
x 1:
r s2 /
dtL [
s=0.
1 m
] (m
2 /s)
Inde
x 1
clas
sific
-at
ion*
Inde
x 2_
new
: s p
/Qp*
ln(r
s/r0)
(s/m
2 )
Inde
x 2_
new
cl
assi
fi-ca
tion*
KFM
2412
1.0–
141.
0K
FM08
A:9
0–16
1.0
72.1
3.50
E-0
70.
4360
300
0.09
L52
5641
9E
KFM
2414
5.0–
165.
0K
FM08
A:8
162.
0–21
5.0
64.1
1.15
E-0
60.
8312
060
0.34
L30
0271
9E
KFM
2417
7.0–
197.
0K
FM08
A:6
265.
0–28
0.0
111.
71.
95E
-05
1.18
8682
00.
14L
2853
93H
KFM
2417
7.0–
197.
0K
FM08
A:7
216.
0–26
4.0
87.4
1.95
E-0
51.
6918
600
0.41
L38
7461
HK
FM24
177.
0–19
7.0
KFM
08A
:816
2.0–
215.
066
.31.
95E
-05
9.16
720
6.10
M19
6994
8E
KFM
2417
7.0–
197.
0K
FM08
A:9
0–16
1.0
123.
71.
95E
-05
0.23
3768
00.
41L
5682
5H
KFM
2417
7.0–
197.
0K
FM08
B:1
113.
0–20
0.5
73.6
1.95
E-0
52.
6024
540
0.22
L57
3174
EK
FM24
177.
0–19
7.0
KFM
08C
:414
6.0–
310.
014
5.8
1.95
E-0
51.
3612
6420
0.17
L34
7495
H
SKB P-17-17 23
The interpreted response speeds (i.e. index 1) must be considered as rough estimates for many of the observation sections, as the fluctuations in head data complicate a proper determination of response time. The maximum drawdown does not always coincide with the stop of pumping, e.g. due to precipitation or other disturbances by the end of the tests. Still, if the response in the observation section is delayed the chosen value for the drawdown in the observation sections is determined as the maximum drawdown, even if it occurs after the time for stop of pumping. The response diagram can be used to identify the observation sections with the most distinct responses.
The five pumping tests showed very different responses. During the pumping test in section 121–141 m a slow but very large response was observed in KFM08A:9; no other responses were observed. In section 145–165 m a slow but large response was observed in KFM08A:8; no other responses were observed. During the pumping test in section 177–197 m, the observation sections KFM08A:6, KFM08A:7, KFM08A:9 and KFM08C:4 displayed slow but large responses. KFM08A:8 showed a medium fast and very large response and KFM08B:1 a fast and very large response. No responses were indicated during the pumping tests in section 45–65 m and 396–416 m.
Figure 5‑2. Response diagram showing the responding observation sections during the interference test in KFM24: 145–165 m.
24 SKB P-17-17
Figure 5‑3. Response diagram showing the responding observation sections during the interference test in KFM24: 177–197 m.
SKB P-17-17 25
6 Transient evaluation of the interference tests
The location of the boreholes included in the interference tests, including the pumping borehole KFM24, is shown in Figure 1-2 and Figure 1-3. Measurements of air pressure and sea level at Forsmark together with the observed pressure in the pumping boreholes and hydraulic head in all responding observation borehole sections are shown in linear (HMS)-diagrams in Appendix 1. In this appendix, observation sections with a response smaller than 0.1 m are not included. Several observation sections exhibit oscillation in monitored head, which may be caused by so-called tidal fluctuations or earth tides in combination with changes in the sea level. These phenomena have, to some extent, been investigated previously at Forsmark in Ludvigson et al. (2004). In many cases, the monitored head is strongly correlated to the sea water level at the sampled time scale.
Transient evaluation was made for the pumped borehole sections and for all responding observation sections with maximum drawdown (sp) exceeding 0.1 m. Test diagrams together with the transient evaluation in the responding observation borehole sections are shown in Appendix 2. In the transient analysis of the responses, the reference time (t0= 0 s) and initial drawdown (s(t0) = 0 m) are initial-ized by the actual start of pumping and the actual head in the observation borehole sections at this time, respectively.
Since the transient evaluation was based on an evaluation model for an equivalent homogeneous porous medium, the estimated hydraulic parameters represent average values for a large volume of rock within the influence volume of the test. As the spatial distribution of the discharge in the pump-ing borehole is unknown, the evaluated parameter values may not represent the specific hydraulic connection between the pumping borehole and the observation sections.
The estimated transmissivity of observation sections assumed to have good hydraulic connection to the pumping borehole should be more representative of the actual pathway between these boreholes. In such cases the estimated transmissivity from the observation sections are of the same magnitude as the estimated transmissivity of the sections from single-hole tests (Ludvigson and Hjerne 2014).
In many cases, the drawdown in the observation sections was significantly delayed after the stop of pumping. This fact caused the drawdown in most sections to continue and reach its maximum drawdown rather long after the stop of pumping. For this reason it was decided to apply both the flow and recovery periods – as a joint sequence – in the transient evaluation of responses, while the flow and recovery periods were analyzed separately in the evaluation of pumped borehole sections.
The time delay is assumed to represent a limited hydraulic connection between the observation section and the pumped borehole interval. For observation sections with good hydraulic connection the delay (normalized by the distance) is usually small.
All of the responding observation sections showed different flow-regimes and responses. The PRF regime developed only in KFM08A:9.
In most of the cases, the drawdown derivative first indicated a transition period that often lasted until the recovery period started. In some cases a possible NFB boundary effect could be seen. Theis´ method was applied to evaluate responses characterized by PRF or only a transition period, while Hantush-Jacob’s method was applied for those exhibiting pseudo-spherical (leaky) flow at the end. Responses affected by apparent no-flow boundaries (NFB), were evaluated both on the early phase (i.e. unaffected by boundary) and on the entire response curve.
The corresponding methods were applied for the pumped borehole intervals, but also taking into account wellbore storage and skin effects (see Section 3.1). In two of the pumping sections an observation section model, Hantush-Jacobs, was used as well. The estimated transmissivity To and storativity So of the observation sections are listed in Table 7-3 in Chapter 7. The estimated transmis-sivity of the pumped borehole intervals is shown in Table 7-2.
26 SKB P-17-17
6.1 Interference test in KFM24: 45.0–65.0 m6.1.1 Pumped borehole sectionA linear diagram of the groundwater pressure versus time in the pumping borehole interval 45–65 m is presented in Figure A1-3. The air pressure and sea water level at Forsmark during all interference tests are shown in Figure A1-1 in Appendix 1. The actual start and stop times of the pumping tests are shown in Table 2-1. Neither the sea water level nor the air pressure was constant during the test period. The air pressure decreased throughout the test period and the sea level rose under fluctuation.
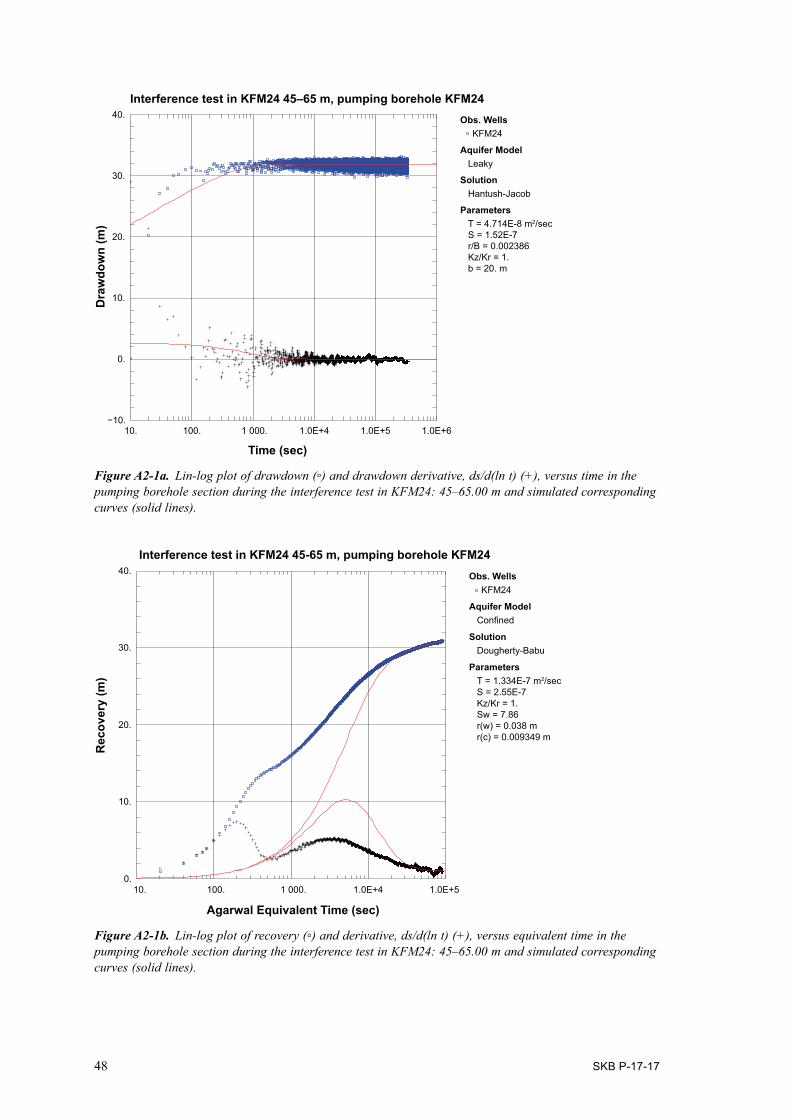
Transient evaluation as described in Chapter 3 was made of both the observed drawdown and pressure recovery in the pumping borehole interval considering wellbore storage and skin effects, see Figure A2-1. The estimated stationary transmissivity Tm (5. × 10−8 m2/s), see equation 3-1, is in good agreement with the estimated transmissivity of the pumped section from the flow logging (4.8 × 10⁻⁸ m2/s). The transient evaluation of the drawdown using Hantush-Jacob shows a similar transmissivity of 4.7 × 10⁻⁸ m2/s and recovery indicates a slightly higher transmissivity of 1.3 × 10⁻⁷ m2/s and the result from the drawdown period was chosen as representative.
The drawdown during the initial flow period indicates approximate pseudo-spherical flow (PSF), which stabilizes to pseudo-steady state after about 1 hour. During the recovery period, initial well-bore storage occurs during the first minutes followed by a long transition period ending in a PRF.
The estimated hydraulic parameters of the pumping borehole interval KFM24: 45–65.00 m is presented in Table 7-2.
6.1.2 Observed responsesNo responses were observed in the observation boreholes, probably due to the low flow rate during this pumping test. Thus, no response analysis or transient evaluations were made for this test.
6.2 Interference test in KFM24: 121.0–141.0 m6.2.1 Pumped borehole sectionA linear diagram of the groundwater pressure versus time in the pumping borehole interval 121–141 m is presented in Figure A1-4. The air pressure and sea water level at Forsmark during all interference tests are shown in Figure A1-1. The sea level decreased drastically and the air pressure reached a local maximum during the test period.
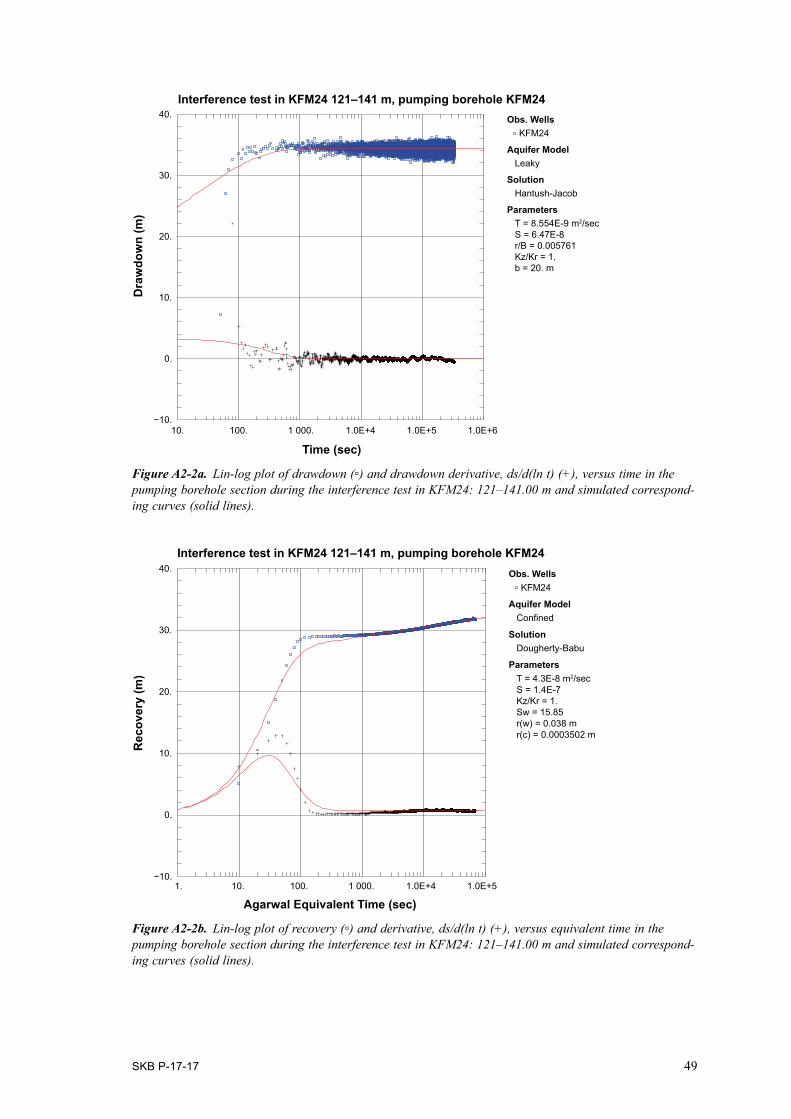
Transient evaluation was made of both the observed drawdown and recovery in the pumped borehole interval, considering wellbore storage and skin effects, see Figure A2-2. The estimated stationary transmissivity Tm (1.1 × 10⁻⁸ m2/s), see equation 3-1, as well as the transient evaluation are lower than the transmissivity estimated from the flow logging (7.8 × 10⁻⁸ m2/s). Hantush-Jacobs model provided an unambiguous evaluation for the observed response that is considered representative (8.6 × 10⁻⁹ m2/s).
The response during the flow period indicates an initial period of approximate pseudo-spherical flow (PSF), which turns into pseudo-steady state after about 0.5 hour. The recovery period exhibits initial wellbore storage during the first minutes followed by a long transition period ending in a possible PRF. The derivative indicates high skin effect on the recovery. The estimated hydraulic parameters from the pumping borehole interval KFM24: 121-141 m are presented in Table 7-2.
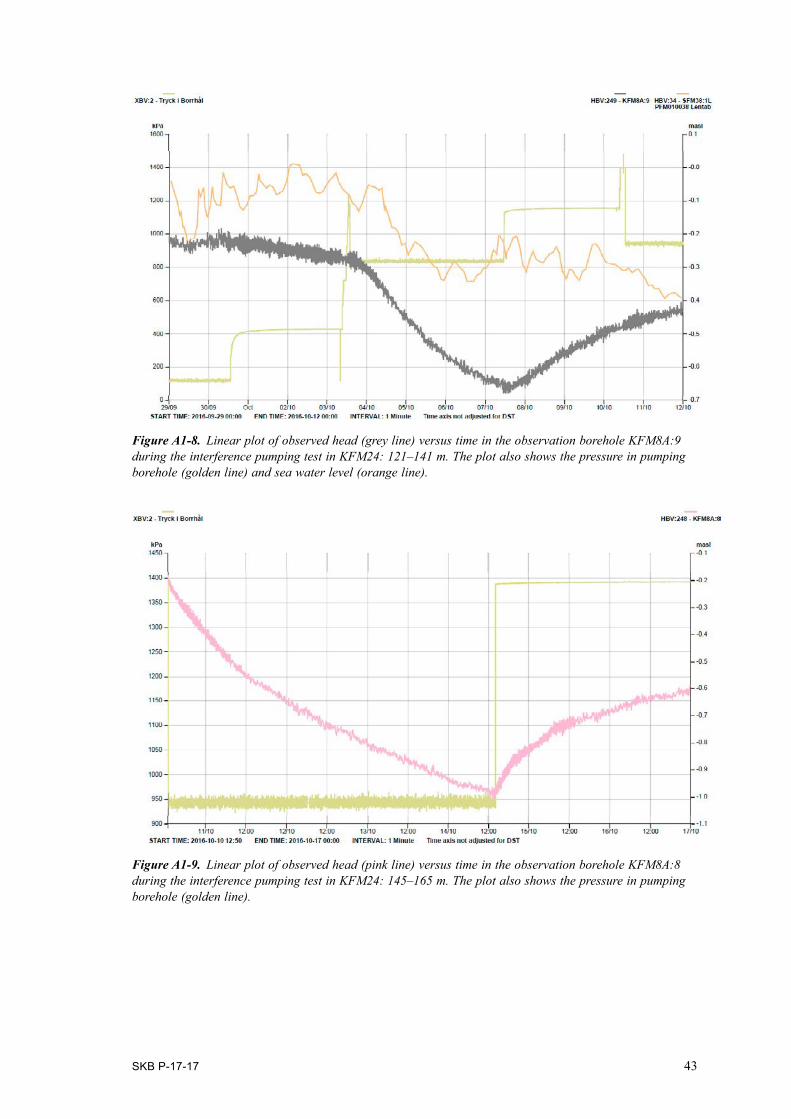
6.2.2 Observed responsesDuring the pumping test in section 121–141 m a very slow but significant response was observed in KFM08A:9 and no other responses were observed. A linear diagram of the hydraulic head versus time in observation borehole KFM08A:9 during the pumping test in KFM24: is presented in Figure A1-8. Regarding the short distance from this section to KFM24: 121–141 m and the delayed response time, index 1 became slightly smaller than 0.1 which is the smallest criterion in the clas-sification system in Table 3.1. However, regarding the small pumping flow and the relatively large response in this section, index 2-new became large and classified excellent.
SKB P-17-17 27
The distances to the responding observation sections together with the estimated hydraulic param-eters from the observation borehole sections are presented in Table 7-3. The transient evaluation of section KFM08A:9 during the interference test in KFM24: 121–141 m is presented in Figures A2-6a and A2-6b in Appendix 2. The flow regime indicates a transition period followed by a Pseudo-Radial Flow (PRF) and the transient evaluation gives a transmissivity for the section of 1.2 × 10⁻⁷ m2/s (See Table 7-3).
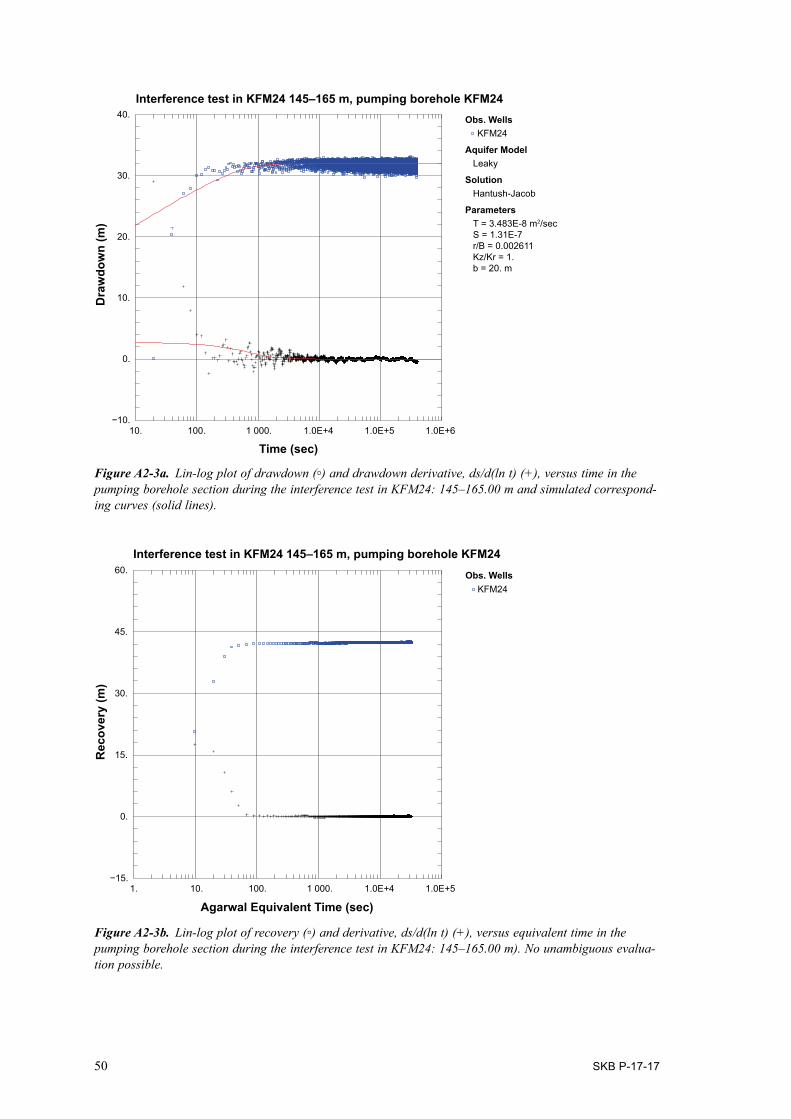
6.3 Interference test in KFM24: 145.0–165.0 m6.3.1 Pumped borehole sectionA linear diagram of the groundwater pressure versus time in the pumping borehole interval KFM24: 145–165 m is presented in Figure A1-5. The air pressure, precipitation and sea water level at Forsmark during a time period covering all interference tests in KFM24 are shown in Figure A1-1. During the test period was the air-pressure stable, however the sea level decreased.
Separate transient evaluations were made of the observed drawdown and pressure recovery in the pumping borehole interval considering wellbore storage and skin effects, see Figure A2-3. Using Hantush-Jacobs model for observation borehole on the drawdown it was possible to get at unam-biguous evaluation that is considered representative for the section (3.2 × 10⁻⁸ m2/s). The estimated stationary transmissivity Tm (2.6 × 10⁻⁸ m2/s), see equation 3-1, as well as the transient evaluation of the drawdown (3.5 × 10⁻⁸ m2/s) is in the same range as the estimated transmissivity of the pumped section from the flow logging (4.9 × 10⁻⁸ m2/s).
The response during the flow period indicates an initial period of approximate pseudo-spherical flow (PSF). After about 1 hour the response turns into a pseudo-steady state flow regime. Indicating that the fractures in the section is connected to a zone or fracture with higher transmissivity. During the recovery period, initial wellbore storage occurs during the first minutes followed by a long transition period ending in a possible PRF. The derivative indicates a high skin effect on the recovery hence no transient evaluation were possible on the recovery. The estimated hydraulic parameters from the pumping borehole interval KFM23: 145–165 m is presented in Table 7-2.
6.3.2 Observed responsesIn section 145–165 m a slow but very large response was observed in KFM08A:8, see Figure 5-2, no other responses was observed. A linear diagram of the hydraulic head versus time in observation borehole KFM08A:8 during the pumping test in KFM24: 145–165.0 m is presented in Figure A1-9. Observe that this is the section below KFM08A:9 which was the only responding section for the test in KFM24: 121–141 m.
The distances to the responding observation sections together with the estimated hydraulic parameters from the observation borehole sections are presented in Table 7-3. The flow regime of the response indicates transition period towards a possible period of Pseudo-Radial Flow (PRF) at the end and the transient evaluation gives a transmissivity for the section of 2.8 × 10⁻⁷ m2/s (See Table 7-3). The transient evaluation of section KFM08A:8 for this test is presented in Figures A2-7a and A2-7b in Appendix 2.
6.4 Interference test in KFM24: 177.0–197.0 m6.4.1 Pumped borehole sectionA linear diagram of the groundwater pressure versus time in the pumping borehole interval 177–197 m in KFM24 is presented in Figure A1-6. The sea water level was rather stable during this test (Figure A1-1). The air pressure reached a local minimum in the middle of the test period.
Separate transient evaluations were made of the observed drawdown and pressure recovery in the pumping borehole interval considering wellbore storage and skin effects, see Figures A2-4. The drawdown was rather fast and stationary during the test, however a transient evaluation was
28 SKB P-17-17
possible on both drawdown and recovery. Result from the recovery period using Moench´s model (4.1 × 10⁻⁷ m2/s) was chosen as representative for the section. The estimated stationary transmissivity Tm (5.1 × 10⁻⁷ m2/s), see equation 3-1, as well as the transient value is larger than the estimated transmissivity of the pumped section from the flow logging (4.8 × 10⁻⁸ m2/s).
The transient response during the flow period indicates an initial period of well-bore storage fol-lowed by a transition to a pseudo-radial flow (PRF). At the end of the drawdown the flow seems to make a transition to a possible No-flow boundary (NFB) or another PRF. The derivative indicates a high skin effect on the drawdown. Using the transient model for PRF, Dougherty-Babu, the evalu-ation converge but with a very high the skin factor. The recovery starts with a transition into what seems to be a PRF. At the end of the recovery period the flow makes a transition to a possible NFB. The transient evaluation of the recovery using Moench case 1 is chosen as representative for this sec-tion. The estimated hydraulic parameters from the pumping borehole interval KFM24: 177–197 m is presented in Table 7-2.
6.4.2 Observed responsesAccording to the response diagram in Figure 5-3 the strongest responses occurred in sections KFM08A:8 and KFM08B:1. The most rapid response occurred in section KFM08A:8.
Below, the responses in the responding observation boreholes together with transient analysis of the responses are discussed section by section with reference to the linear HMS-diagrams in Appendix 1 and the transient evaluations in Appendix 2. Non responding sections and boreholes are not discussed.
The distances to the responding observation sections together with the estimated hydraulic param-eters from the observation borehole sections are presented in Table 7-3.
KFM08A:6A linear diagram of the hydraulic head versus time in observation borehole KFM08A:6 during the pumping test in KFM24: 177–197 m is presented in Figure A1-10. The response in KFM08A:6 were very slow and maximum drawdown occurred almost two days after pumping stop. The drawdown was significant; however regarding the small distance to the pumping borehole index 1 became medium size.
The flow regime of the response indicates a long transition to a possible short period of Pseudo-Radial Flow (PRF) and the transient evaluation gives a transmissivity for the section of 5.5 × 10⁻⁷ m2/s (See Table 7-3). The transient evaluation of section KFM08A:6 are presented in Figures A2-8a and A2-8b in Appendix 2.
KFM08A:7A linear diagram of the hydraulic head versus time in observation borehole KFM08A:7 during the pumping test in KFM24: 177–197 m is presented in Figure A1-11. A slow and medium large response was indicated, maximum drawdown occurred by the end of the pumping.
The flow regime indicates a Pseudo-Radial Flow (PRF). The flow then makes a transition into a possible No-Flow boundary (NFB) and the transient evaluation using Hantush-Jacob gives a transmissivity for the section of 1.9 × 10⁻⁶ m2/s (See Table 7-3). The transient evaluation of section KFM08A:7 are presented in Figures A2-9a and A2-9b in Appendix 2.
KFM08A:8A linear diagram of the hydraulic head versus time in observation borehole KFM08A:8 during the pumping test in KFM24: 177–197 m is presented in Figure A1-12. The response in KFM08A:8 were both the fastest and the largest for the test. Drawdown started immediately by the start of pumping and reached its maximum by the end of the test.
SKB P-17-17 29
The flow regime firstly might show sign of Pseudo-Linear Flow (PLF) followed by a transition into some other flow regime, possibly a Pseudo-Radial Flow (PRF). The transient evaluation using Theis model gives a transmissivity for the section of 3.8 × 10⁻⁷ m2/s (See Table 7-3). The transient evalua-tion of section KFM08A:8 are presented in Figures A2-10a and A2-10b in Appendix 2.
KFM08A:9A linear diagram of the hydraulic head versus time in observation borehole KFM08A:9 during the pumping test in KFM24: 177–197 m is presented in Figure A1-13. The response in KFM08A:9 were the weakest for the responding sections in the test, however still significant in size. The response time was slow and the maximum drawdown occurred by the end of the pumping.
The flow regime starts with a transition into a PRF after about 10000 seconds. The transient evalu-ation using Theis model gives a rather high transmissivity and is for the section of 2.1 × 10⁻⁵ m2/s (See Table 7-3). The transient evaluation of section KFM08A:9 are presented in Figures A2-11a and A2-11b in Appendix 2.
KFM08B:1A linear diagram of the hydraulic head versus time in observation borehole KFM08B:1 during the pumping test in KFM24: 177–197 m is presented in Figure A1-14. A very strong but slow response was indicated in KFM08B:1 and maximum drawdown was reached almost one day after the stop of pumping.
The flow regime starts with a transition that turns into a possible No-Flow boundary (NFB). The transient evaluation using Theis model gives a transmissivity for the section of 4.9 × 10⁻⁷ m2/s (See Table 7-3) and is considered representative for the section. The transient evaluation of section KFM08B:1 is presented in Figures A2-12a and A2-12b in Appendix 2.
KFM08C:4A linear diagram of the hydraulic head versus time in observation borehole KFM08C:4 during the pumping test in KFM24: 177–197 m is presented in Figure A1-15. The response in KFM08C:4 were very slow but significant and reached its maximum drawdown more than two days after the stop of pumping.
The flow regime of the response indicates shorter periods of transition states to some flow regime during the response period of the test but no clear responses develop. The transient evaluation using Theis model gives a transmissivity for the section of 3.4 × 10⁻⁷ m2/s (See Table 7-3). The transient evaluation of section KFM08C:4 are presented in Figures A2-13a and A2-13b in Appendix 2.
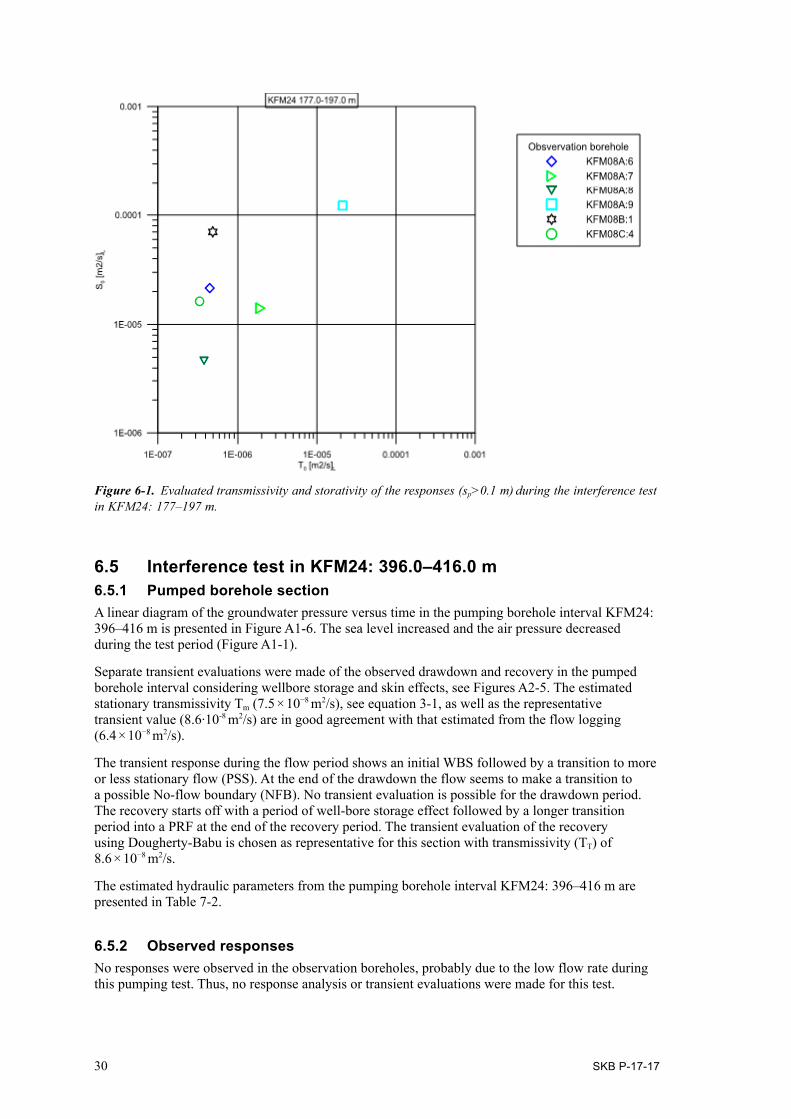
Cross plot of To and So
The evaluated transmissivity To and storativity So of responses (sp > 0.1 m) to the interference test KFM24: 177–197 m are compared in a cross-plot (Figure 6-1). The estimated To and So are based on the assumption of an equivalent porous medium and may thus not always represent specific flow paths between the observation sections and the pumping borehole, particularly for poorly connected flow paths. The To-values represents a larger rock volume than the So-value which is more sensitive to the specific pathway to the pumped section.
The estimated To-values for responses with good hydraulic connection are normally strongly influenced by the transmissivity of the pumped borehole section.
30 SKB P-17-17
6.5 Interference test in KFM24: 396.0–416.0 m6.5.1 Pumped borehole sectionA linear diagram of the groundwater pressure versus time in the pumping borehole interval KFM24: 396–416 m is presented in Figure A1-6. The sea level increased and the air pressure decreased during the test period (Figure A1-1).
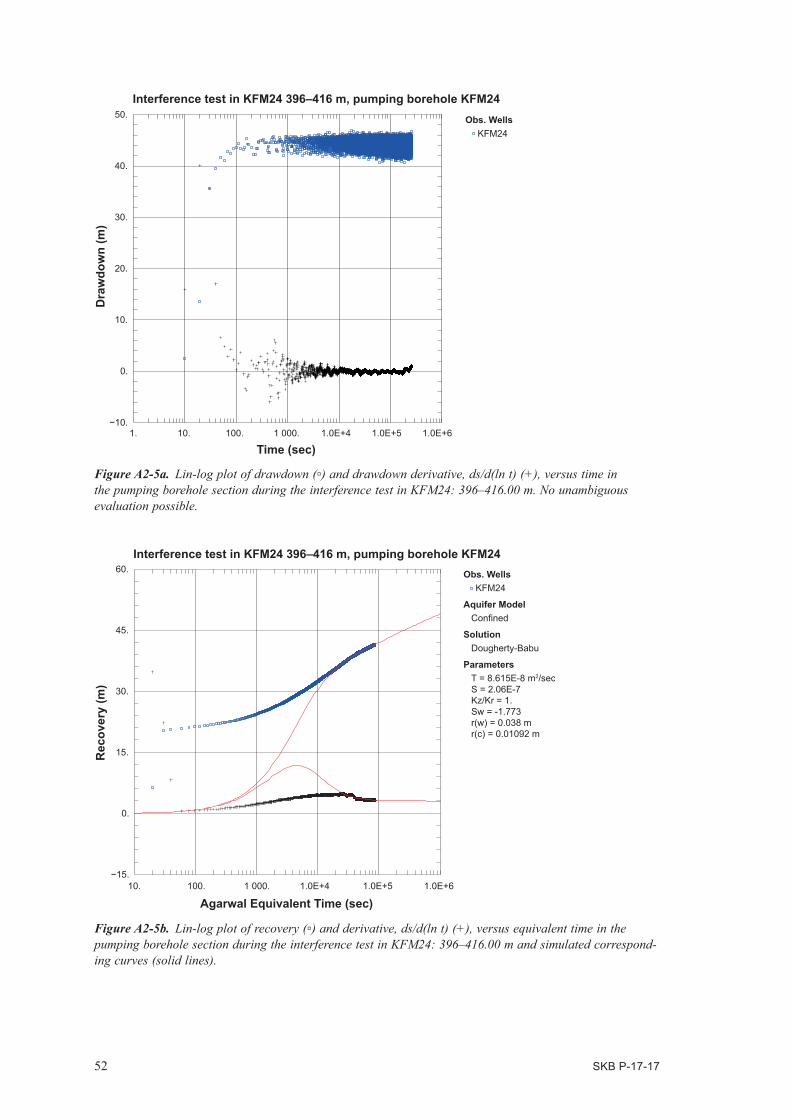
Separate transient evaluations were made of the observed drawdown and recovery in the pumped borehole interval considering wellbore storage and skin effects, see Figures A2-5. The estimated stationary transmissivity Tm (7.5 × 10⁻⁸ m2/s), see equation 3-1, as well as the representative transient value (8.6∙10-8 m2/s) are in good agreement with that estimated from the flow logging (6.4 × 10⁻⁸ m2/s).
The transient response during the flow period shows an initial WBS followed by a transition to more or less stationary flow (PSS). At the end of the drawdown the flow seems to make a transition to a possible No-flow boundary (NFB). No transient evaluation is possible for the drawdown period. The recovery starts off with a period of well-bore storage effect followed by a longer transition period into a PRF at the end of the recovery period. The transient evaluation of the recovery using Dougherty-Babu is chosen as representative for this section with transmissivity (TT) of 8.6 × 10⁻⁸ m2/s.
The estimated hydraulic parameters from the pumping borehole interval KFM24: 396–416 m are presented in Table 7-2.
6.5.2 Observed responsesNo responses were observed in the observation boreholes, probably due to the low flow rate during this pumping test. Thus, no response analysis or transient evaluations were made for this test.
Figure 6‑1. Evaluated transmissivity and storativity of the responses (sp>0.1 m) during the interference test in KFM24: 177–197 m.

SKB P-17-17 31
7 Summary of results
This report describes five interference tests conducted in packed-off borehole intervals of KFM24, which is a pilot hole to the planned skip shaft of the planned deep repository for spent nuclear fuel at the Forsmark site (Figure 1-1). Pumped flow rates in the five tested intervals was very low (Qp ≈ 0.02 to 1.2 L/min) with a drawdown in each section of about 40 m (Table 7-1). Giving the five tested intervals are not particularly transmissive (i.e. on the order 10−8 to 10−7 m2/s; Table 7-2).
Based on the experience from previous interference tests in the Forsmark site a wide selection of surrounding borehole sections are included in the analysis for potential responses (Figure 1-3; Table 7-4).
However, the responses to the current tests are confined to the immediate surroundings of KFM24:
• No responses were observed from the uppermost and deepest tests (45–65.0 m and 396–416.0 m).
• Two tests (121.0–141 m and 145–165 m) only yielded responses in KFM08A (c. 75 m north from KFM24; see Figure 1-2.
• One test (177–197 m) yielded responses in three boreholes, KFM08A-C (at c. 75 m to 150 m distance from KFM24; see Figure 1-3.
The index classification of propagation rate in responses (i.e. Index 1) ranges from Low to Medium (Table 7-4) and the rather long response times has been seen in some other interference tests (Walger et al. 2010). The classification of response strength, as evaluated in terms of the so-called Index 2 new, range from High to Excellent (Table 7-4). High response strengths imply that the interference tests cause exceptionally large responses relative to the low pumping rates (i.e. suggesting the pres-ence of a No-Flow Boundary).
The response in KFM08A:9 during pumping in section 121.0–141 m is very slow giving it a very low index 1 value. These sections probably have a long pathway in between.
Notably, the test in KFM24: 177–197 m has a response in KFM08A:9 (0–161 m) with an anoma-lously high evaluated transmissivity of 2.1 × 10⁻⁵ m2/s. Although the evaluated transmissivity of this response exceeds that of the pumped borehole section by c. two orders of magnitude, it may still be realistic, as the responding drawdown is more than two orders of magnitude lower than that in the pumped borehole section. No hydraulic data are available in the upper 100 m and this part is also covered by a casing. If there are any flow anomalies of high magnitude in that region of KFM08A it is possible that it might be some interconnect to the KFM08A:9. There is also one singular PSS interval of TT = 1.4 × 10⁻⁵ m2/s that occurs just below KFM08A:9 (at 189 to 195 m borehole length in KFM08A; Walger et al. 2006), which also might interconnect to KFM08A:9 and provide a potential explanation to the anomalous response pattern to the test at 177–197 m.
There are several of the responses with a long lag time compared to the magnitude of the response indicating poorly connected fractures in the rock mass. In KFM08A there are responses in four consecutive sections during the same interference test in section 177–197 m. However in one sec-tion, KFM08A:8, the response is large and fast while responses in sections KFM08A:6, KFM08A:7 and KFM08A:9 are much more delayed and of smaller magnitudes (Figure 5-3). This indicates that KFM08A:8 is well connected to the pumped section whilst the other responses in KFM08A might be caused by interconnections in the rock mass.
Nomenclature used:
hi = initial hydraulic head
hp = ground water level at the end of pumping
sp = hydraulic head change at the end of pumping
Qp = flow rate at stop of pumping
TM = steady state transmissivity from Moye´s equation
32 SKB P-17-17
TT = transmissivity from transient evaluation of single-hole test
S* = assumed storativity by the estimation of the skin factor in single hole tests
C = wellbore storage coefficient
ξ = skin factor
Sp = drawdown
ri = radius of influence from pumping
To = transmissivity from transient evaluation of interference test
So = storativity from transient evaluation of interference test
To/So = hydraulic diffusivity (m2/s)
Table 7-1. Data summary from the pumped borehole sections during the interference tests.
Pumping borehole ID
Section (mbl TOC)
Test Type1) Pumped time (s)
sp (m)
Qp (m3/s)
KFM24 45–65 1B 336 600 31.31 1.5E-06KFM24 121–141 1B 337 020 34.09 3.5E-07KFM24 145–165 1B 349 980 47.05 1.2E-06KFM24 177–197 1B 257 040 39.88 2.0E-05KFM24 396–416 1B 261 960 44.23 3.2E-06
1) 1B: Pumping test-submersible pump.
Table 7-2. Hydraulic parameters evaluated for the pumped borehole sections.
Pumping borehole ID
Section (mbl TOC)
Q/s (m2/s)
TM (m2/s)
TT (m2/s)
ζ (-)
C (m3/Pa)
S* (-)
ri (m)
KFM24 45–65 4.9E-08 5.1E-08 4.7E-08 1.5E-07 485KFM24 121–141 1.0E-08 1.1E-08 8.5E-09 6.5E-08 316KFM24 145–165 2.4E-08 2.6E-08 3.5E-08 1.3E-07 458KFM24 177–197 4.9E-07 5.1E-07 4.1E-07 −3.00 6.1E-08 4.5E-07 726KFM24 396–416 7.2E-08 7.5E-08 8.6E-08 −1.77 3.8E-08 2.1E-07 497
Table 7-3. Hydraulic parameters evaluated for responses to the KFM24 interference test.
Pumping borehole
Section (mbl TOC)
Observation borehole ID: section
Section (mbl TOC)
Distance (m)
hi (masl)
hp (masl)*
sp (m)
To (m2/s)
So (-)
To/So (m2/s)
KFM24 121–141 KFM08A:9 0–161.0 72.1 −0.25 −0.68 0.43 1.2E-07 3.4E-06 3.6E-02KFM24 145–165 KFM08A:8 162.0–215.0 64.1 −0.18 −1.01 0.83 2.8E-07 4.2E-06 6.5E-02KFM24 177–197 KFM08A:6 265.0–280.0 111.7 −0.74 −1.92 1.18 4.5E-07 2.1E-05 2.1E-02KFM24 177–197 KFM08A:7 216.0–264.0 87.4 −0.57 −2.26 1.69 1.9E-06 1.4E-05 1.4E-01KFM24 177–197 KFM08A:8 162.0–215.0 66.3 −0.53 −9.69 9.16 3.8E-07 4.7E-06 8.2E-02KFM24 177–197 KFM08A:9 0–161.0 123.7 −0.39 −0.62 0.23 2.1E-05 1.2E-04 1.7E-01KFM24 177–197 KFM08B:1 113.0–200.5 73.6 −0.43 −3.03 2.60 5.0E-07 7.0E-05 7.1E-03KFM24 177–197 KFM08C:4 146.0–310.0 145.8 −0.58 −1.94 1.36 3.4E-07 1.6E-05 2.1E-02
* For the interference test hp is chosen as the maximum drawdown, even if it occurs after stop of pumping.
SKB P-17-17 33
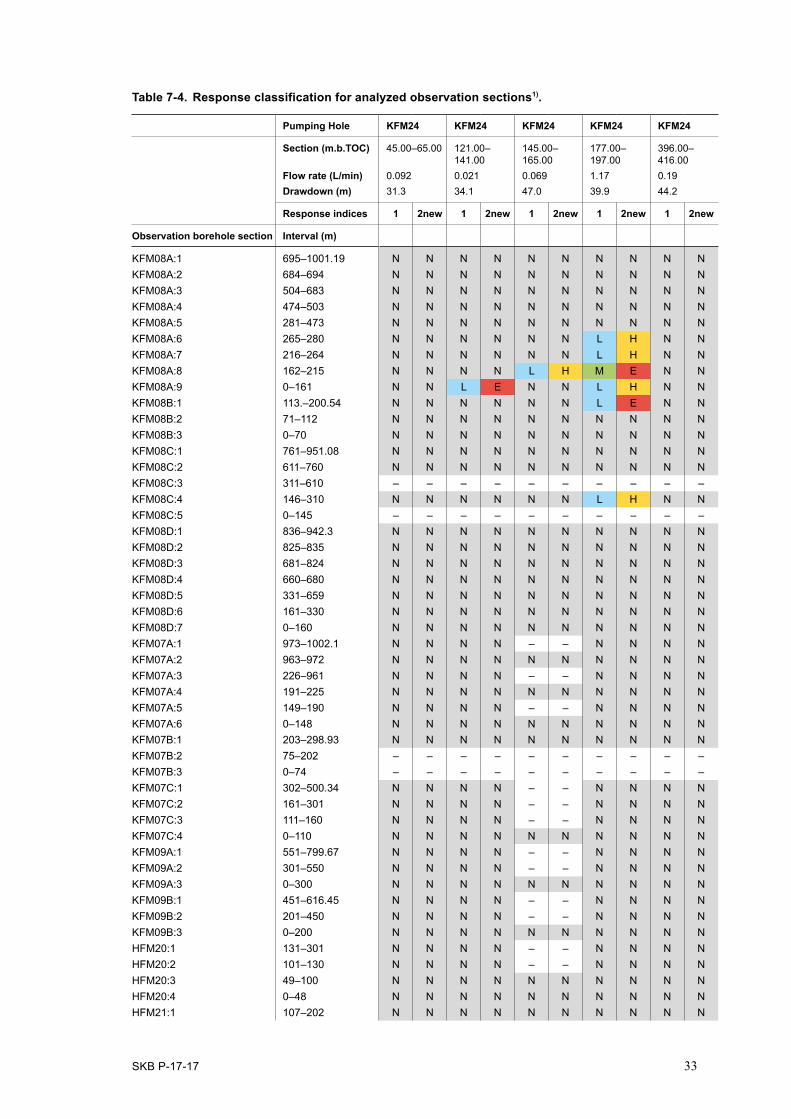
Table 7-4. Response classification for analyzed observation sections1).
Pumping Hole KFM24 KFM24 KFM24 KFM24 KFM24
Section (m.b.TOC) 45.00–65.00 121.00–141.00
145.00–165.00
177.00–197.00
396.00–416.00
Flow rate (L/min) 0.092 0.021 0.069 1.17 0.19Drawdown (m) 31.3 34.1 47.0 39.9 44.2
Response indices 1 2new 1 2new 1 2new 1 2new 1 2new
Observation borehole section Interval (m)
KFM08A:1 695–1001.19 N N N N N N N N N NKFM08A:2 684–694 N N N N N N N N N NKFM08A:3 504–683 N N N N N N N N N NKFM08A:4 474–503 N N N N N N N N N NKFM08A:5 281–473 N N N N N N N N N NKFM08A:6 265–280 N N N N N N L H N NKFM08A:7 216–264 N N N N N N L H N NKFM08A:8 162–215 N N N N L H M E N NKFM08A:9 0–161 N N L E N N L H N NKFM08B:1 113.–200.54 N N N N N N L E N NKFM08B:2 71–112 N N N N N N N N N NKFM08B:3 0–70 N N N N N N N N N NKFM08C:1 761–951.08 N N N N N N N N N NKFM08C:2 611–760 N N N N N N N N N NKFM08C:3 311–610 – – – – – – – – – –KFM08C:4 146–310 N N N N N N L H N NKFM08C:5 0–145 – – – – – – – – – –KFM08D:1 836–942.3 N N N N N N N N N NKFM08D:2 825–835 N N N N N N N N N NKFM08D:3 681–824 N N N N N N N N N NKFM08D:4 660–680 N N N N N N N N N NKFM08D:5 331–659 N N N N N N N N N NKFM08D:6 161–330 N N N N N N N N N NKFM08D:7 0–160 N N N N N N N N N NKFM07A:1 973–1002.1 N N N N – – N N N NKFM07A:2 963–972 N N N N N N N N N NKFM07A:3 226–961 N N N N – – N N N NKFM07A:4 191–225 N N N N N N N N N NKFM07A:5 149–190 N N N N – – N N N NKFM07A:6 0–148 N N N N N N N N N NKFM07B:1 203–298.93 N N N N N N N N N NKFM07B:2 75–202 – – – – – – – – – –KFM07B:3 0–74 – – – – – – – – – –KFM07C:1 302–500.34 N N N N – – N N N NKFM07C:2 161–301 N N N N – – N N N NKFM07C:3 111–160 N N N N – – N N N NKFM07C:4 0–110 N N N N N N N N N NKFM09A:1 551–799.67 N N N N – – N N N NKFM09A:2 301–550 N N N N – – N N N NKFM09A:3 0–300 N N N N N N N N N NKFM09B:1 451–616.45 N N N N – – N N N NKFM09B:2 201–450 N N N N – – N N N NKFM09B:3 0–200 N N N N N N N N N NHFM20:1 131–301 N N N N – – N N N NHFM20:2 101–130 N N N N – – N N N NHFM20:3 49–100 N N N N N N N N N NHFM20:4 0–48 N N N N N N N N N NHFM21:1 107–202 N N N N N N N N N N
34 SKB P-17-17
Pumping Hole KFM24 KFM24 KFM24 KFM24 KFM24
Section (m.b.TOC) 45.00–65.00 121.00–141.00
145.00–165.00
177.00–197.00
396.00–416.00
Flow rate (L/min) 0.092 0.021 0.069 1.17 0.19Drawdown (m) 31.3 34.1 47.0 39.9 44.2
Response indices 1 2new 1 2new 1 2new 1 2new 1 2new
Observation borehole section Interval (m)
HFM21:2 33–106 N N N N N N N N N NHFM21:3 22–32 N N N N N N N N N NHFM21:4 0–21 – – – – – – – – – –HFM38:1 42–200.75 N N N N N N N N N NHFM38:2 24–41 N N N N N N N N N NHFM38:3 0–23 N N N N N N N N N NKFM13:1 0–150.21 N N N N N N N N N NKFM14:1 0–60.18 N N N N N N N N N NKFM15:1 0–62.30 N N N N N N N N N NKFM16:1 0–60.35 N N N N N N N N N NKFM17:1 0–60.45 N N N N N N N N N NKFM18:1 0–60.46 N N N N N N N N N NKFM19:1 0–102.37 N N N N N N N N N NKFM20:1 0–60.50 N N N N N N N N N NKFM21:1 0–101.06 N N N N N N N N N NKFM22:1 0–60.26 N N N N N N N N N NKFM23:1 0–100.64 N N N N N N N N N NHFM22:1 0–222 N N N N N N N N N NHFM23:1 0–211.5 N N N N N N N N N NHFM28:1 0–151.2 N N N N N N N N N NHFM39:1 0–151.2 N N N N N N N N N NHFM40:1 0–101.7 N N N N N N N N N NHFM41:1 0–101.5 N N N N N N N N N N
1) The indices [Index 1] and [Index-2 new] are described in Section 3. “–“ denotes error during the test. The response indices are also shown in cross-plots in Chapter 5.
The results of the test in KFM24: 177–197.0 m are illustrated in a 3D view of the area (Figure 7-1 and Figure 7-2; see also Figure 1-3 for location of the boreholes). Four of the responses occur in the uppermost sections of KFM08A, with response speeds ranging from Low to Medium (classification in terms of the diffusivity proxy Index 1; Section 3.2) and High to Excellent response strengths (classed in terms of Index 2 new; Section 3.2).
Large responses were also seen in KFM08B:1 and KFM08C:4, which both are located close to the pumping borehole. The farthest response was only c. 145 m away. The responding sections in KFM08A and KFM08C are located to the north or northeast of the pumping section while the responding section in KFM08B is located to the southwest.

SKB P-17-17 35
Figure 7‑1. Speed of responses [Index 1] to the pump test in KFM24: 177–197.0 m.
Figure 7‑2. Strength of responses [Index 2 new] to the pump test in KFM24: 177–197.0 m.

SKB P-17-17 37
References
SKB’s (Svensk Kärnbränslehantering AB) publications can be found at www.skb.com/publications.
Follin S, 2008. Bedrock hydrogeology Forsmark. Site descriptive modelling, SDM-Site Forsmark. SKB R-08-95, Svensk Kärnbränslehantering AB.
Hurmerinta E, 2017. Forsmark site investigations. Difference flow logging in borehole KFM24. SKB P-16-27, Svensk Kärnbränslehantering AB.
Knudby C, Carrera J, 2006. On the use of apparent hydraulic diffusivity as indicator of connectiv-ity. Journal of Hydrology 329, 377–389.
Kruseman G P, de Ridder N A, 1990. Analysis and evaluation of pumping test data. 2nd ed. Wageningen, The Netherlands: International Institute for Land Reclamation and Improvement. (ILRI publication 47)
Ludvigson J-E, Hjerne C, 2014. Detailed analysis of selected hydraulic interference tests and review of new test analysis methods. SKB R-10-73, Svensk Kärnbränslehantering AB.
Ludvigson J-E, Jönsson S, Levén J, 2004. Hydraulic evaluation of pumping activities prior to hydro-geochemical sampling in borehole KFM03A – Comparison with results from difference flow logging. Forsmark site investigation. SKB P-04-96, Svensk Kärnbränslehantering AB.
Nilsson G, 2017. Steered core drilling of borehole KFM24. SKB P-16-32, Svensk Kärnbränslehantering AB.
Rhén I (ed), Gustafson G, Stanfors R, Wikberg P, 1997. Äspö HRL – Geoscientific evaluation 1997/5, Models based on site characterization 1986–1995. SKB TR 97-06, Svensk Kärnbränslehantering AB.
SKB, 2016. Detaljundersökningsprogram vid uppförande och drift av Kärnbränsleförvaret. SKB R-16-10, Svensk Kärnbränslehantering AB. (In Swedish.)
Walger E, Hjerne C, Ludvigson J-E, Harrström J, 2006. Forsmark site investigation. Single-hole injection tests and pressure pulse tests in borehole KFM08A. SKB P-06-194, Svensk Kärnbränslehantering AB.
Walger E, Ludvigson J-E, Gentzschein B, 2010. SFR Site investigation. Evaluation of selected interference tests and pressure responses during drilling at SFR. SKB P-10-43, Svensk Kärnbränslehantering AB.


SKB P-17-17 39
Appendix 1
PlotsLinear plots of hydraulic pressure versus time for pumping boreholes and hydraulic head versus time for responding observation sections, together with barometric pressure and sea level data.
Figure A1‑1. Registered air pressure and sea water level at Forsmark during the interference test period in KFM24. Each parameter has its own Y-scale.
40 SKB P-17-17
Figure A1‑2. Linear plot of observed pressure versus time in the pumping borehole KFM24 during all five interference pumping tests.
Figure A1‑3. Linear plot of observed pressure versus time in the pumping borehole KFM24 at section 45–65 m during the interference pumping test.

SKB P-17-17 41
Figure A1‑4. Linear plot of observed pressure versus time in the pumping borehole KFM24 at section 121–141 m during the interference pumping test.
Figure A1‑5. Linear plot of observed pressure versus time in the pumping borehole KFM24 at section 145–165 m during the interference pumping test.
42 SKB P-17-17
Figure A1‑6. Linear plot of observed pressure versus time in the pumping borehole KFM24 at section 177–197 m during the interference pumping test.
Figure A1‑7. Linear plot of observed pressure versus time in the pumping borehole KFM24 at section 396–416 m during the interference pumping test.
SKB P-17-17 43
Figure A1‑8. Linear plot of observed head (grey line) versus time in the observation borehole KFM8A:9 during the interference pumping test in KFM24: 121–141 m. The plot also shows the pressure in pumping borehole (golden line) and sea water level (orange line).
Figure A1‑9. Linear plot of observed head (pink line) versus time in the observation borehole KFM8A:8 during the interference pumping test in KFM24: 145–165 m. The plot also shows the pressure in pumping borehole (golden line).
44 SKB P-17-17
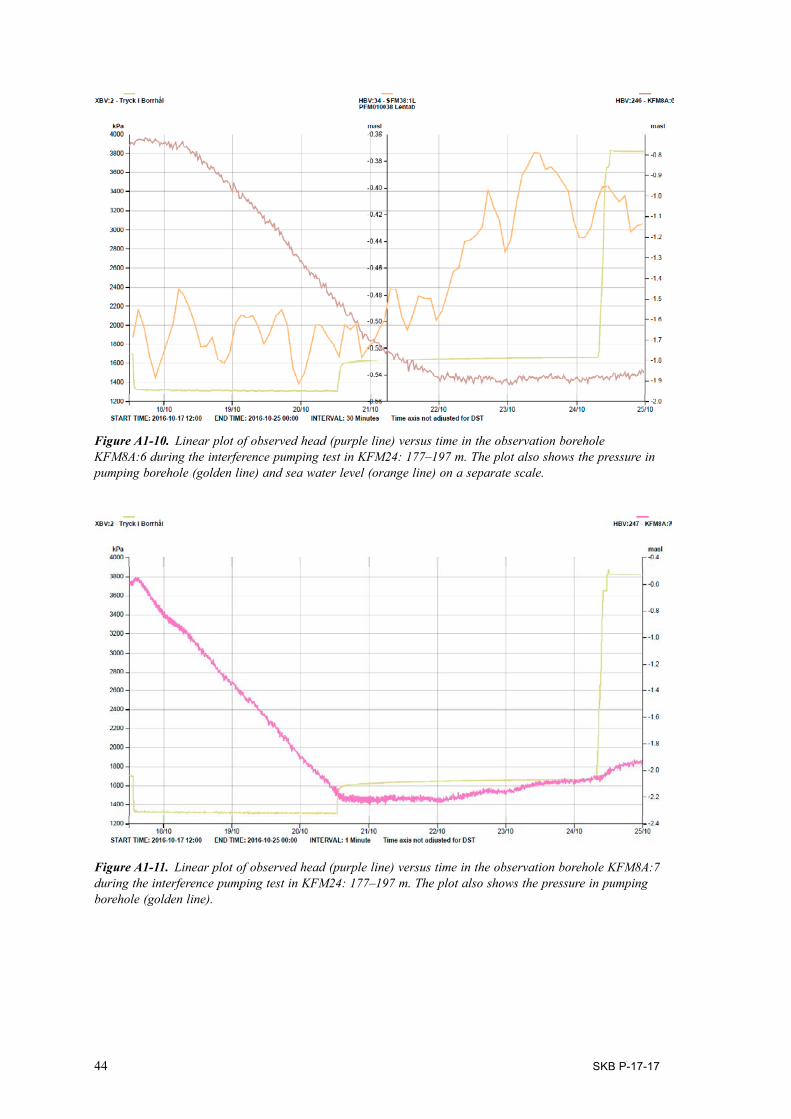
Figure A1‑10. Linear plot of observed head (purple line) versus time in the observation borehole KFM8A:6 during the interference pumping test in KFM24: 177–197 m. The plot also shows the pressure in pumping borehole (golden line) and sea water level (orange line) on a separate scale.
Figure A1‑11. Linear plot of observed head (purple line) versus time in the observation borehole KFM8A:7 during the interference pumping test in KFM24: 177–197 m. The plot also shows the pressure in pumping borehole (golden line).
SKB P-17-17 45
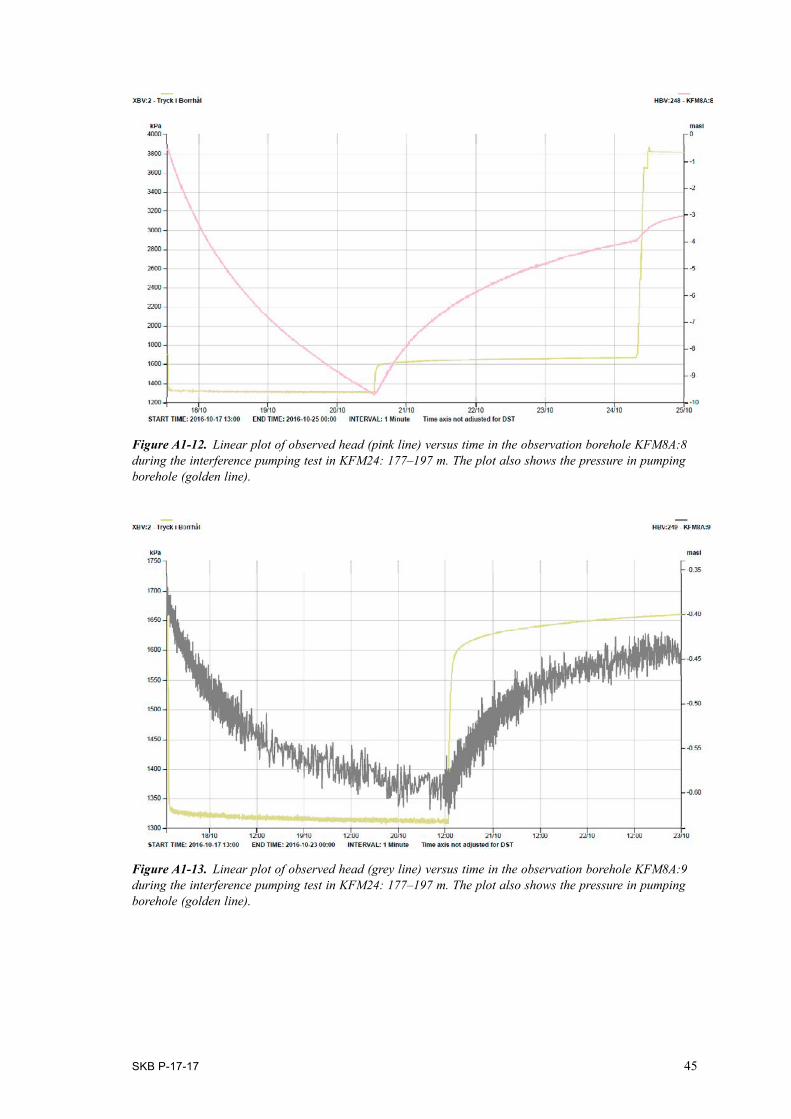
Figure A1‑12. Linear plot of observed head (pink line) versus time in the observation borehole KFM8A:8 during the interference pumping test in KFM24: 177–197 m. The plot also shows the pressure in pumping borehole (golden line).
Figure A1‑13. Linear plot of observed head (grey line) versus time in the observation borehole KFM8A:9 during the interference pumping test in KFM24: 177–197 m. The plot also shows the pressure in pumping borehole (golden line).

46 SKB P-17-17
Figure A1‑14. Linear plot of observed head (green-yellow line) versus time in the observation borehole KFM8B:1 during the interference pumping test in KFM24: 177–197 m. The plot also shows the pressure in pumping borehole (golden line) and sea water level (orange line) on a separate scale.
Figure A1‑15. Linear plot of observed head (purple line) versus time in the observation borehole KFM8C:4 during the interference pumping test in KFM24: 177–197 m. The plot also shows the pressure in pumping borehole (golden line) and sea water level (orange line) on a separate scale.
SKB P-17-17 47
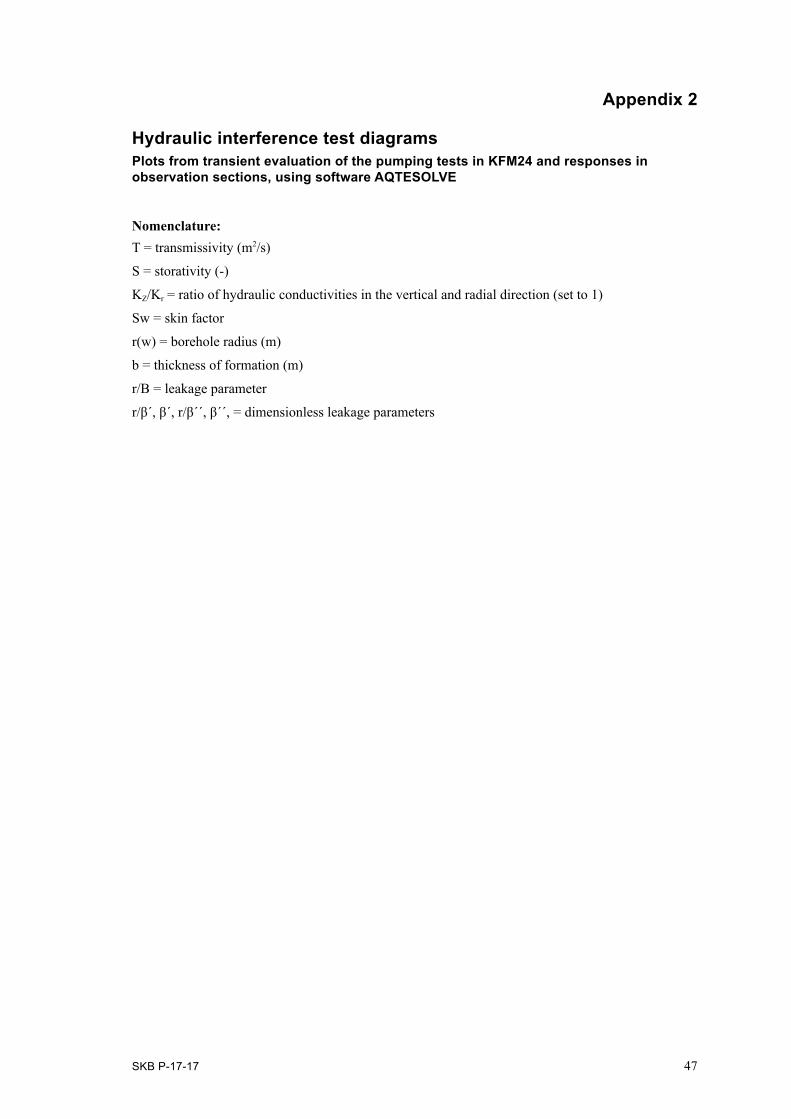
Appendix 2
Hydraulic interference test diagramsPlots from transient evaluation of the pumping tests in KFM24 and responses in observation sections, using software AQTESOLVE
Nomenclature:T = transmissivity (m2/s)
S = storativity (-)
KZ/Kr = ratio of hydraulic conductivities in the vertical and radial direction (set to 1)
Sw = skin factor
r(w) = borehole radius (m)
b = thickness of formation (m)
r/B = leakage parameter
r/β´, β´, r/β´´, β´´, = dimensionless leakage parameters
48 SKB P-17-17
Interference test in KFM24 45-65 m, pumping borehole KFM24
0.
10.
20.
30.
40.
Agarwal Equivalent Time (sec)
Rec
over
y (m
)
Obs. WellsKFM24
Aquifer ModelConfined
SolutionDougherty-Babu
ParametersT = 1.334E-7 m2/secS = 2.55E-7Kz/Kr = 1.Sw = 7.86r(w) = 0.038 mr(c) = 0.009349 m
10. 100. 1 000. 1.0E+51.0E+4
Figure A2‑1b. Lin-log plot of recovery (▫) and derivative, ds/d(ln t) (+), versus equivalent time in the pumping borehole section during the interference test in KFM24: 45–65.00 m and simulated corresponding curves (solid lines).
Interference test in KFM24 45–65 m, pumping borehole KFM24
10. 100. 1 000.−10.
0.
10.
20.
30.
40.
Time (sec)
Dra
wdo
wn
(m)
Obs. WellsKFM24
Aquifer ModelLeaky
SolutionHantush-Jacob
ParametersT = 4.714E-8 m2/secS = 1.52E-7r/B = 0.002386Kz/Kr = 1.b = 20. m
1.0E+61.0E+51.0E+4
Figure A2‑1a. Lin-log plot of drawdown (▫) and drawdown derivative, ds/d(ln t) (+), versus time in the pumping borehole section during the interference test in KFM24: 45–65.00 m and simulated corresponding curves (solid lines).
SKB P-17-17 49
Interference test in KFM24 121–141 m, pumping borehole KFM24
10. 100.−10.
0.
10.
20.
30.
40.
Time (sec)
Dra
wdo
wn
(m)
Obs. WellsKFM24
Aquifer ModelLeaky
SolutionHantush-Jacob
ParametersT = 8.554E-9 m2/secS = 6.47E-8r/B = 0.005761Kz/Kr = 1.b = 20. m
1 000. 1.0E+4 1.0E+5 1.0E+6
Interference test in KFM24 121–141 m, pumping borehole KFM24
−10.
0.
10.
20.
30.
40.
Agarwal Equivalent Time (sec)
Rec
over
y (m
)
Obs. WellsKFM24
Aquifer ModelConfined
SolutionDougherty-Babu
ParametersT = 4.3E-8 m2/secS = 1.4E-7Kz/Kr = 1.Sw = 15.85r(w) = 0.038 mr(c) = 0.0003502 m
10.1. 100. 1 000. 1.0E+4 1.0E+5
Figure A2‑2a. Lin-log plot of drawdown (▫) and drawdown derivative, ds/d(ln t) (+), versus time in the pumping borehole section during the interference test in KFM24: 121–141.00 m and simulated correspond-ing curves (solid lines).
Figure A2‑2b. Lin-log plot of recovery (▫) and derivative, ds/d(ln t) (+), versus equivalent time in the pumping borehole section during the interference test in KFM24: 121–141.00 m and simulated correspond-ing curves (solid lines).
50 SKB P-17-17
Interference test in KFM24 145–165 m, pumping borehole KFM24
10. 100. 1 000. 1.0E+4 1.0E+5 1.0E+6−10.
0.
10.
20.
30.
40.
Time (sec)
Dra
wdo
wn
(m)
Obs. WellsKFM24
Aquifer ModelLeaky
SolutionHantush-Jacob
ParametersT = 3.483E-8 m2/secS = 1.31E-7r/B = 0.002611Kz/Kr = 1.b = 20. m
Interference test in KFM24 145–165 m, pumping borehole KFM24
−15.
0.
15.
30.
45.
60.
Agarwal Equivalent Time (sec)
Rec
over
y (m
)
Obs. WellsKFM24
10. 100. 1 000. 1.0E+4 1.0E+51.
Figure A2‑3a. Lin-log plot of drawdown (▫) and drawdown derivative, ds/d(ln t) (+), versus time in the pumping borehole section during the interference test in KFM24: 145–165.00 m and simulated correspond-ing curves (solid lines).
Figure A2‑3b. Lin-log plot of recovery (▫) and derivative, ds/d(ln t) (+), versus equivalent time in the pumping borehole section during the interference test in KFM24: 145–165.00 m). No unambiguous evalua-tion possible.

SKB P-17-17 51
Interference test in KFM24 177–197 m, pumping borehole KFM24
10. 100. 1 000. 1.0E+4 1.0E+5 1.0E+6−12.
0.
12.
24.
36.
48.
Time (sec)
Dra
wdo
wn
(m)
Obs. WellsKFM24
Aquifer ModelConfined
SolutionDougherty-Babu
ParametersT = 3.356E-6 m2/secS = 1.3E-6Kz/Kr = 1.Sw = 32.61r(w) = 0.038 mr(c) = 0.005342 m
Figure A2‑4a. Lin-log plot of drawdown (▫) and drawdown derivative, ds/d(ln t) (+), versus time in the pumping borehole section during the interference test in KFM24: 177–197.00 m and simulated correspond-ing curves (solid lines).
Figure A2‑4b. Lin-log plot of recovery (▫) and derivative, ds/d(ln t) (+), versus equivalent time in the pumping borehole section during the interference test in KFM24: 177–197.00 m and simulated correspond-ing curves (solid lines).
52 SKB P-17-17
Interference test in KFM24 396–416 m, pumping borehole KFM24
1. 10. 100. 1 000. 1.0E+4 1.0E+5−10.
0.
10.
20.
30.
40.
50.
Time (sec)
Dra
wdo
wn
(m)
Obs. WellsKFM24
1.0E+6
Interference test in KFM24 396–416 m, pumping borehole KFM24
10. 100. 1 000. 1.0E+4 1.0E+5 1.0E+6−15.
0.
15.
30.
45.
60.
Agarwal Equivalent Time (sec)
Rec
over
y (m
)
Obs. WellsKFM24
Aquifer ModelConfined
SolutionDougherty-Babu
ParametersT = 8.615E-8 m2/secS = 2.06E-7Kz/Kr = 1.Sw = -1.773r(w) = 0.038 mr(c) = 0.01092 m
Figure A2-5a. Lin-log plot of drawdown (▫) and drawdown derivative, ds/d(ln t) (+), versus time in the pumping borehole section during the interference test in KFM24: 396–416.00 m. No unambiguous evaluation possible.
Figure A2-5b. Lin-log plot of recovery (▫) and derivative, ds/d(ln t) (+), versus equivalent time in the pumping borehole section during the interference test in KFM24: 396–416.00 m and simulated correspond-ing curves (solid lines).
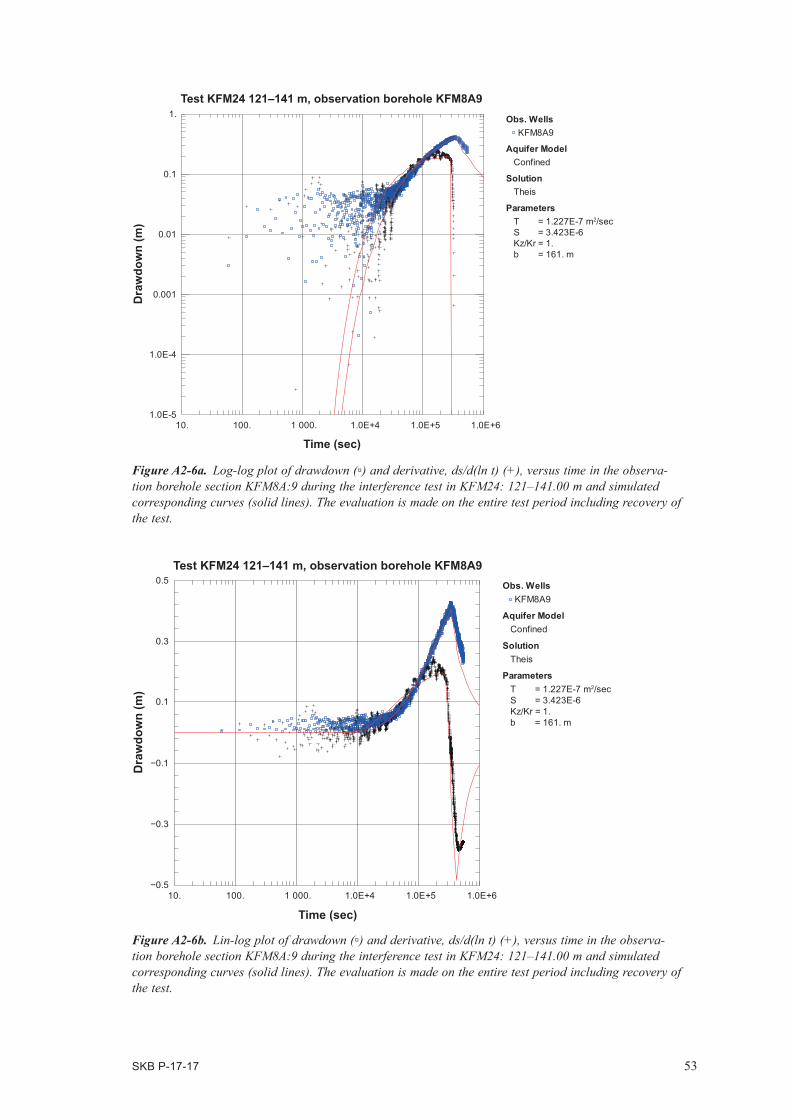
SKB P-17-17 53
Test KFM24 121–141 m, observation borehole KFM8A9
10. 100. 1 000. 1.0E+4 1.0E+5 1.0E+61.0E-5
1.0E-4
0.001
0.01
0.1
1.
Time (sec)
Dra
wdo
wn
(m)
Obs. WellsKFM8A9
Aquifer ModelConfined
SolutionTheis
ParametersT = 1.227E-7 m2/secS = 3.423E-6Kz/Kr = 1.b = 161. m
Test KFM24 121–141 m, observation borehole KFM8A9
10. 100. 1 000. 1.0E+4 1.0E+5 1.0E+6−0.5
−0.3
−0.1
0.1
0.3
0.5
Time (sec)
Dra
wdo
wn
(m)
Obs. WellsKFM8A9
Aquifer ModelConfined
SolutionTheis
ParametersT = 1.227E-7 m2/secS = 3.423E-6Kz/Kr = 1.b = 161. m
Figure A2-6a. Log-log plot of drawdown (▫) and derivative, ds/d(ln t) (+), versus time in the observa-tion borehole section KFM8A:9 during the interference test in KFM24: 121–141.00 m and simulated corresponding curves (solid lines). The evaluation is made on the entire test period including recovery of the test.
Figure A2-6b. Lin-log plot of drawdown (▫) and derivative, ds/d(ln t) (+), versus time in the observa-tion borehole section KFM8A:9 during the interference test in KFM24: 121–141.00 m and simulated corresponding curves (solid lines). The evaluation is made on the entire test period including recovery of the test.
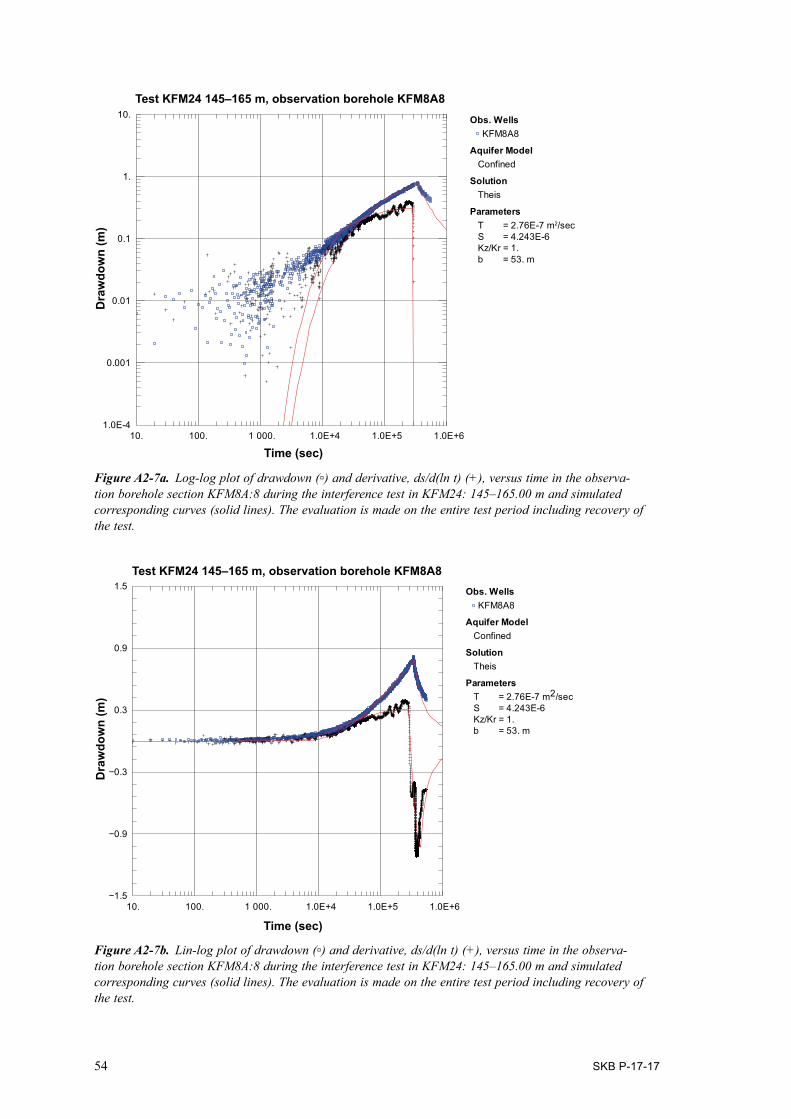
54 SKB P-17-17
Test KFM24 145–165 m, observation borehole KFM8A8
10. 100. 1 000. 1.0E+4 1.0E+5 1.0E+61.0E-4
0.001
0.01
0.1
1.
10.
Time (sec)
Dra
wdo
wn
(m)
Obs. WellsKFM8A8
Aquifer ModelConfined
SolutionTheis
ParametersT = 2.76E-7 m2/secS = 4.243E-6Kz/Kr = 1.b = 53. m
Test KFM24 145–165 m, observation borehole KFM8A8
10. 100. 1 000. 1.0E+4 1.0E+5 1.0E+6−1.5
−0.9
−0.3
0.3
0.9
1.5
Time (sec)
Dra
wdo
wn
(m)
Obs. WellsKFM8A8
Aquifer ModelConfined
SolutionTheis
ParametersT = 2.76E-7 m2/secS = 4.243E-6Kz/Kr = 1.b = 53. m
Figure A2‑7a. Log-log plot of drawdown (▫) and derivative, ds/d(ln t) (+), versus time in the observa-tion borehole section KFM8A:8 during the interference test in KFM24: 145–165.00 m and simulated corresponding curves (solid lines). The evaluation is made on the entire test period including recovery of the test.
Figure A2‑7b. Lin-log plot of drawdown (▫) and derivative, ds/d(ln t) (+), versus time in the observa-tion borehole section KFM8A:8 during the interference test in KFM24: 145–165.00 m and simulated corresponding curves (solid lines). The evaluation is made on the entire test period including recovery of the test.
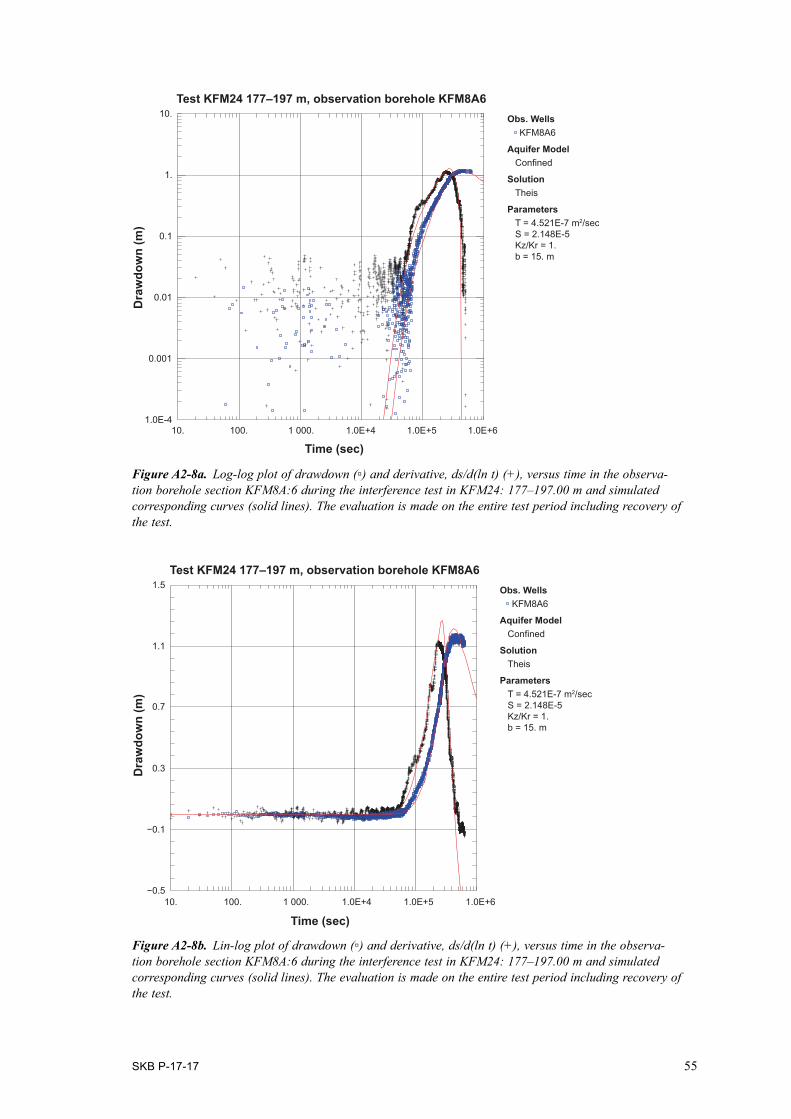
SKB P-17-17 55
Test KFM24 177–197 m, observation borehole KFM8A6
10. 100. 1 000. 1.0E+4 1.0E+5 1.0E+61.0E-4
0.001
0.01
0.1
1.
10.
Time (sec)
Dra
wdo
wn
(m)
Obs. WellsKFM8A6
Aquifer ModelConfined
SolutionTheis
ParametersT = 4.521E-7 m2/secS = 2.148E-5Kz/Kr = 1.b = 15. m
Test KFM24 177–197 m, observation borehole KFM8A6
10. 100. 1 000. 1.0E+4 1.0E+5 1.0E+6−0.5
−0.1
0.3
0.7
1.1
1.5
Time (sec)
Dra
wdo
wn
(m)
Obs. WellsKFM8A6
Aquifer ModelConfined
SolutionTheis
ParametersT = 4.521E-7 m2/secS = 2.148E-5Kz/Kr = 1.b = 15. m
Figure A2‑8a. Log-log plot of drawdown (▫) and derivative, ds/d(ln t) (+), versus time in the observa-tion borehole section KFM8A:6 during the interference test in KFM24: 177–197.00 m and simulated corresponding curves (solid lines). The evaluation is made on the entire test period including recovery of the test.
Figure A2‑8b. Lin-log plot of drawdown (▫) and derivative, ds/d(ln t) (+), versus time in the observa-tion borehole section KFM8A:6 during the interference test in KFM24: 177–197.00 m and simulated corresponding curves (solid lines). The evaluation is made on the entire test period including recovery of the test.

56 SKB P-17-17
Test KFM24 177–197 m, observation borehole KFM8A7
10. 100. 1 000. 1.0E+4 1.0E+5 1.0E+61.0E-4
0.001
0.01
0.1
1.
10.
Time (sec)
Dra
wdo
wn
(m)
Obs. WellsKFM8A7
Aquifer ModelLeaky
SolutionHantush-Jacob
ParametersT = 1.93E-6 m2/secS = 1.408E-5r/B = 1.147Kz/Kr = 1.b = 48. m
Test KFM24 177−197 m, observation borehole KFM8A7
10. 100. 1 000. 1.0E+4 1.0E+5 1.0E+6−2.
−1.
0.
1.
2.
3.
Time (sec)
Dra
wdo
wn
(m)
Obs. WellsKFM8A7
Aquifer ModelLeaky
SolutionHantush-Jacob
ParametersT = 1.93E-6 m2/secS = 1.408E-5r/B = 1.147Kz/Kr = 1.b = 48. m
Figure A2‑9a. Log-log plot of drawdown (▫) and derivative, ds/d(ln t) (+), versus time in the observa-tion borehole section KFM8A:7 during the interference test in KFM24: 177–197.00 m and simulated corresponding curves (solid lines). The evaluation is made on the entire test period including recovery of the test.
Figure A2‑9b. Log-log plot of drawdown (▫) and derivative, ds/d(ln t) (+), versus time in the observa-tion borehole section KFM8A:7 during the interference test in KFM24: 177–197.00 m and simulated corresponding curves (solid lines). The evaluation is made on the entire test period including recovery of the test.
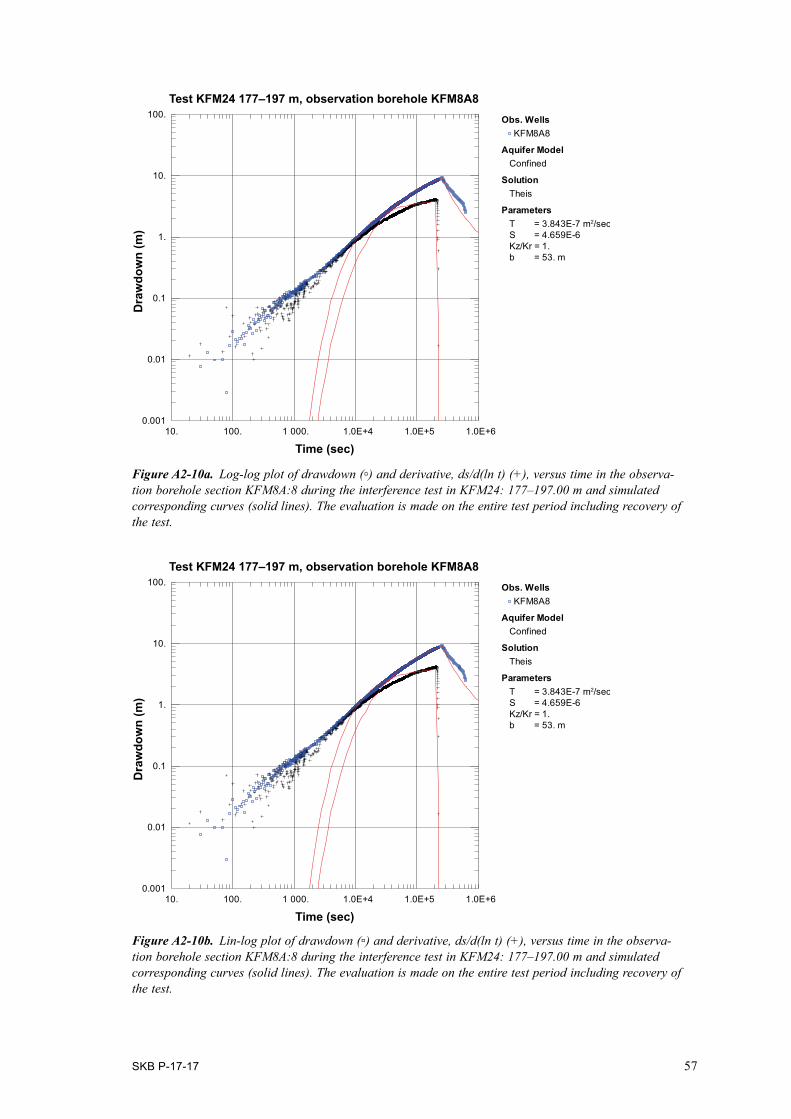
SKB P-17-17 57
Test KFM24 177–197 m, observation borehole KFM8A8
10. 100. 1 000. 1.0E+4 1.0E+5 1.0E+60.001
0.01
0.1
1.
10.
100.
Time (sec)
Dra
wdo
wn
(m)
Obs. WellsKFM8A8
Aquifer ModelConfined
SolutionTheis
ParametersT = 3.843E-7 m2/secS = 4.659E-6Kz/Kr = 1.b = 53. m
Test KFM24 177–197 m, observation borehole KFM8A8
10. 100. 1 000. 1.0E+4 1.0E+5 1.0E+60.001
0.01
0.1
1.
10.
100.
Time (sec)
Dra
wdo
wn
(m)
Obs. WellsKFM8A8
Aquifer ModelConfined
SolutionTheis
ParametersT = 3.843E-7 m2/secS = 4.659E-6Kz/Kr = 1.b = 53. m
Figure A2‑10a. Log-log plot of drawdown (▫) and derivative, ds/d(ln t) (+), versus time in the observa-tion borehole section KFM8A:8 during the interference test in KFM24: 177–197.00 m and simulated corresponding curves (solid lines). The evaluation is made on the entire test period including recovery of the test.
Figure A2‑10b. Lin-log plot of drawdown (▫) and derivative, ds/d(ln t) (+), versus time in the observa-tion borehole section KFM8A:8 during the interference test in KFM24: 177–197.00 m and simulated corresponding curves (solid lines). The evaluation is made on the entire test period including recovery of the test.
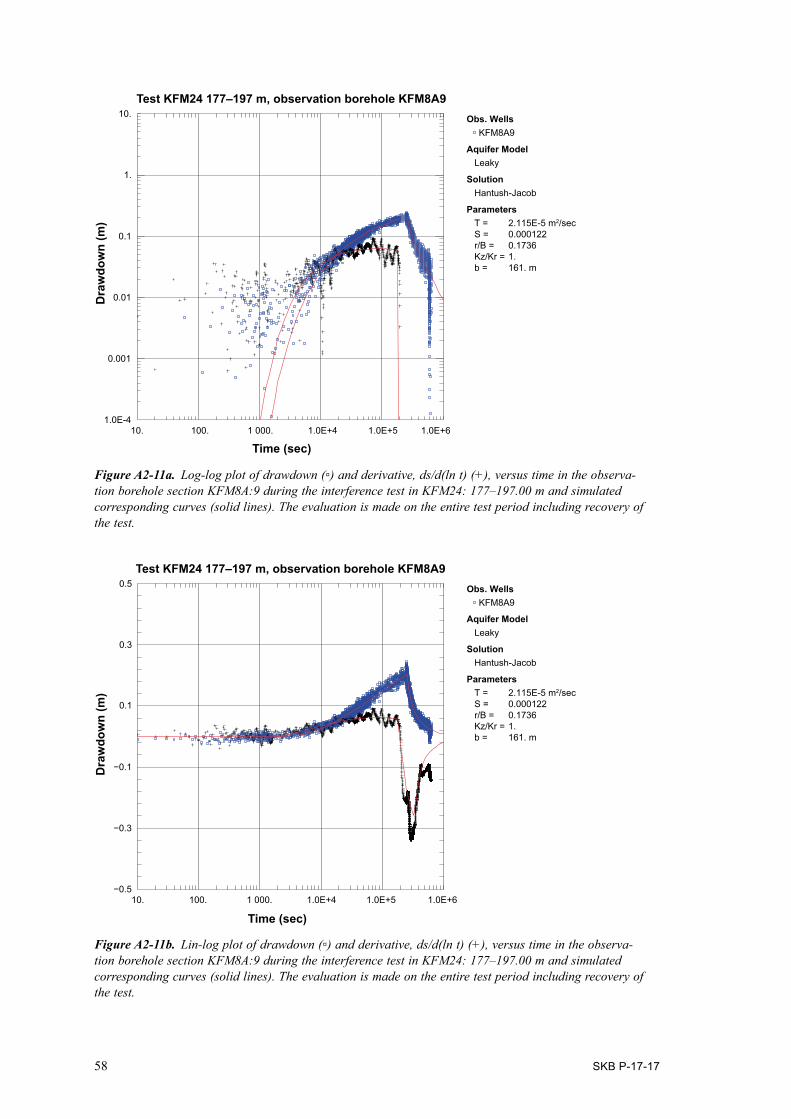
58 SKB P-17-17
Figure A2‑11a. Log-log plot of drawdown (▫) and derivative, ds/d(ln t) (+), versus time in the observa-tion borehole section KFM8A:9 during the interference test in KFM24: 177–197.00 m and simulated corresponding curves (solid lines). The evaluation is made on the entire test period including recovery of the test.
Test KFM24 177–197 m, observation borehole KFM8A9
10. 100. 1 000. 1.0E+4 1.0E+5 1.0E+61.0E-4
0.001
0.01
0.1
1.
10.
Time (sec)
Dra
wdo
wn
(m)
Obs. WellsKFM8A9
Aquifer ModelLeaky
SolutionHantush-Jacob
ParametersT = 2.115E-5 m2/secS = 0.000122r/B = 0.1736Kz/Kr = 1.b = 161. m
Test KFM24 177–197 m, observation borehole KFM8A9
10. 100. 1 000. 1.0E+4 1.0E+5 1.0E+6−0.5
−0.3
−0.1
0.1
0.3
0.5
Time (sec)
Dra
wdo
wn
(m)
Obs. WellsKFM8A9
Aquifer ModelLeaky
SolutionHantush-Jacob
ParametersT = 2.115E-5 m2/secS = 0.000122r/B = 0.1736Kz/Kr = 1.b = 161. m
Figure A2‑11b. Lin-log plot of drawdown (▫) and derivative, ds/d(ln t) (+), versus time in the observa-tion borehole section KFM8A:9 during the interference test in KFM24: 177–197.00 m and simulated corresponding curves (solid lines). The evaluation is made on the entire test period including recovery of the test.
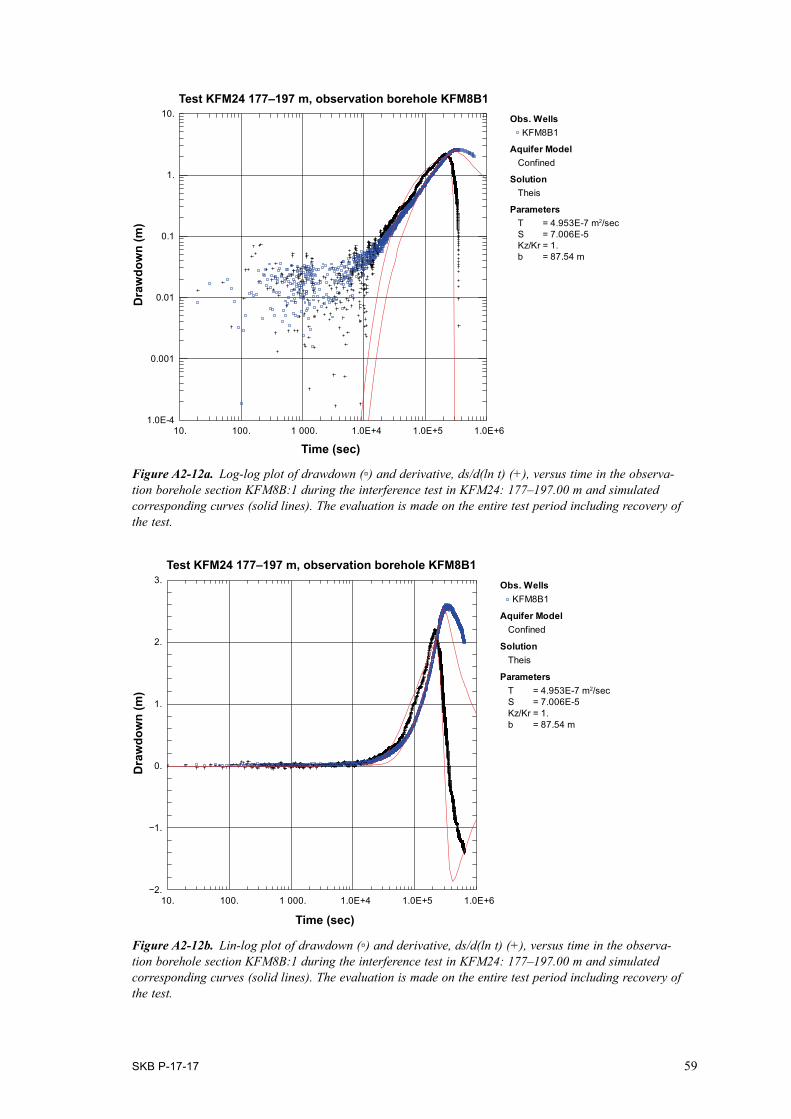
SKB P-17-17 59
Figure A2‑12a. Log-log plot of drawdown (▫) and derivative, ds/d(ln t) (+), versus time in the observa-tion borehole section KFM8B:1 during the interference test in KFM24: 177–197.00 m and simulated corresponding curves (solid lines). The evaluation is made on the entire test period including recovery of the test.
Figure A2‑12b. Lin-log plot of drawdown (▫) and derivative, ds/d(ln t) (+), versus time in the observa-tion borehole section KFM8B:1 during the interference test in KFM24: 177–197.00 m and simulated corresponding curves (solid lines). The evaluation is made on the entire test period including recovery of the test.
Test KFM24 177–197 m, observation borehole KFM8B1
10. 100. 1 000. 1.0E+4 1.0E+5 1.0E+61.0E-4
0.001
0.01
0.1
1.
10.
Time (sec)
Dra
wdo
wn
(m)
Obs. WellsKFM8B1
Aquifer ModelConfined
SolutionTheis
ParametersT = 4.953E-7 m2/secS = 7.006E-5Kz/Kr = 1.b = 87.54 m
Test KFM24 177–197 m, observation borehole KFM8B1
10. 100. 1 000. 1.0E+4 1.0E+5 1.0E+6−2.
−1.
0.
1.
2.
3.
Time (sec)
Dra
wdo
wn
(m)
Obs. WellsKFM8B1
Aquifer ModelConfined
SolutionTheis
ParametersT = 4.953E-7 m2/secS = 7.006E-5Kz/Kr = 1.b = 87.54 m
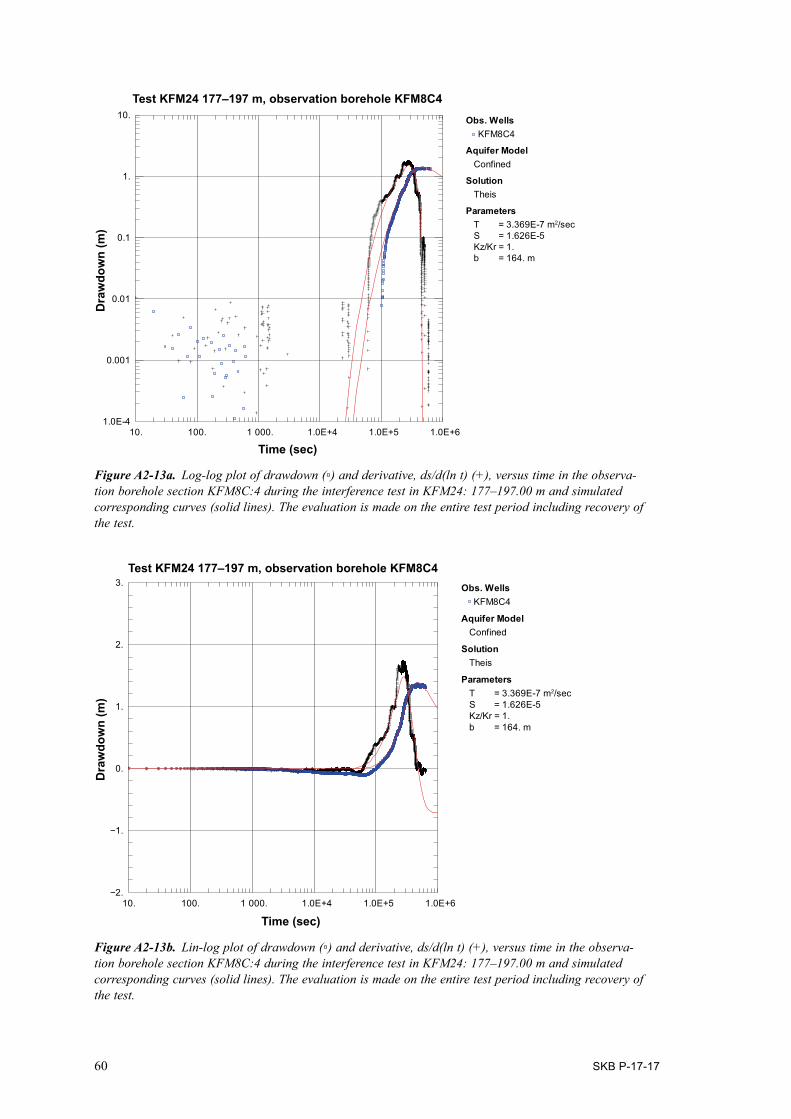
60 SKB P-17-17
Test KFM24 177–197 m, observation borehole KFM8C4
10. 100. 1 000. 1.0E+4 1.0E+5 1.0E+61.0E-4
0.001
0.01
0.1
1.
10.
Time (sec)
Dra
wdo
wn
(m)
Obs. WellsKFM8C4
Aquifer ModelConfined
SolutionTheis
ParametersT = 3.369E-7 m2/secS = 1.626E-5Kz/Kr = 1.b = 164. m
Test KFM24 177–197 m, observation borehole KFM8C4
10. 100. 1 000. 1.0E+4 1.0E+5 1.0E+6−2.
−1.
0.
1.
2.
3.
Time (sec)
Dra
wdo
wn
(m)
Obs. WellsKFM8C4
Aquifer ModelConfined
SolutionTheis
ParametersT = 3.369E-7 m2/secS = 1.626E-5Kz/Kr = 1.b = 164. m
Figure A2‑13a. Log-log plot of drawdown (▫) and derivative, ds/d(ln t) (+), versus time in the observa-tion borehole section KFM8C:4 during the interference test in KFM24: 177–197.00 m and simulated corresponding curves (solid lines). The evaluation is made on the entire test period including recovery of the test.
Figure A2‑13b. Lin-log plot of drawdown (▫) and derivative, ds/d(ln t) (+), versus time in the observa-tion borehole section KFM8C:4 during the interference test in KFM24: 177–197.00 m and simulated corresponding curves (solid lines). The evaluation is made on the entire test period including recovery of the test.
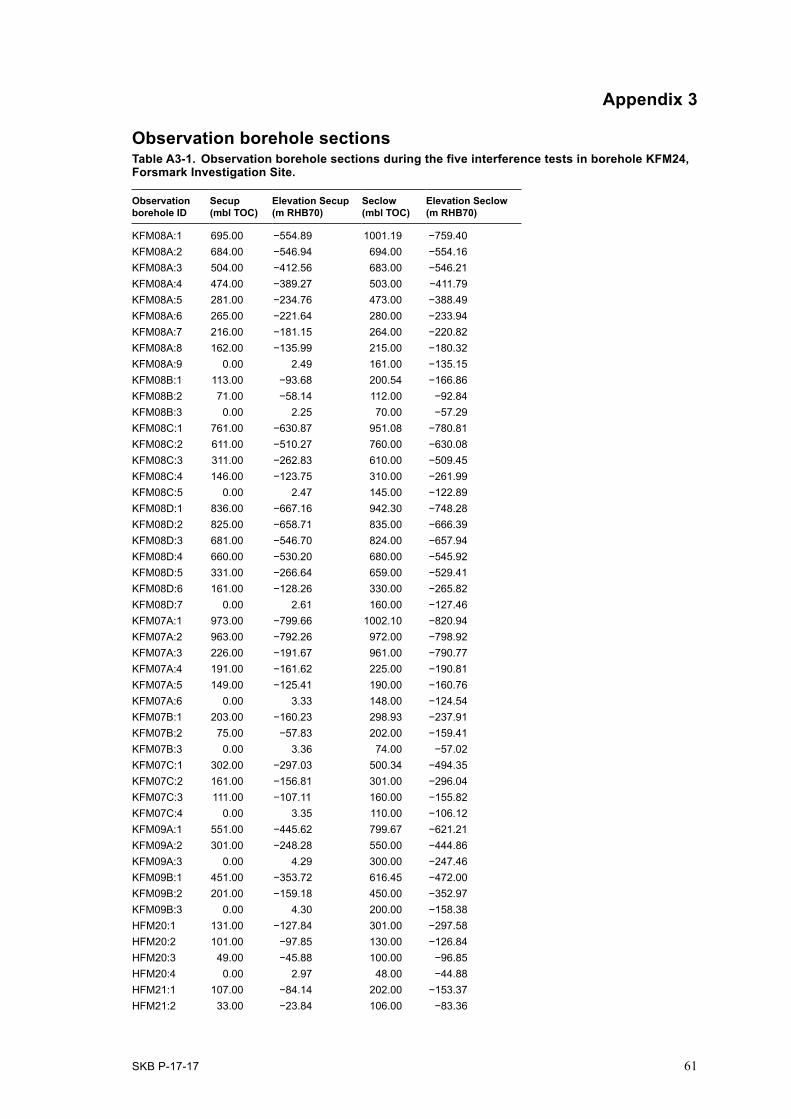
SKB P-17-17 61
Appendix 3
Observation borehole sectionsTable A3-1. Observation borehole sections during the five interference tests in borehole KFM24, Forsmark Investigation Site.
Observation borehole ID
Secup (mbl TOC)
Elevation Secup (m RHB70)
Seclow (mbl TOC)
Elevation Seclow (m RHB70)
KFM08A:1 695.00 −554.89 1001.19 −759.40KFM08A:2 684.00 −546.94 694.00 −554.16KFM08A:3 504.00 −412.56 683.00 −546.21KFM08A:4 474.00 −389.27 503.00 −411.79KFM08A:5 281.00 −234.76 473.00 −388.49KFM08A:6 265.00 −221.64 280.00 −233.94KFM08A:7 216.00 −181.15 264.00 −220.82KFM08A:8 162.00 −135.99 215.00 −180.32KFM08A:9 0.00 2.49 161.00 −135.15KFM08B:1 113.00 −93.68 200.54 −166.86KFM08B:2 71.00 −58.14 112.00 −92.84KFM08B:3 0.00 2.25 70.00 −57.29KFM08C:1 761.00 −630.87 951.08 −780.81KFM08C:2 611.00 −510.27 760.00 −630.08KFM08C:3 311.00 −262.83 610.00 −509.45KFM08C:4 146.00 −123.75 310.00 −261.99KFM08C:5 0.00 2.47 145.00 −122.89KFM08D:1 836.00 −667.16 942.30 −748.28KFM08D:2 825.00 −658.71 835.00 −666.39KFM08D:3 681.00 −546.70 824.00 −657.94KFM08D:4 660.00 −530.20 680.00 −545.92KFM08D:5 331.00 −266.64 659.00 −529.41KFM08D:6 161.00 −128.26 330.00 −265.82KFM08D:7 0.00 2.61 160.00 −127.46KFM07A:1 973.00 −799.66 1002.10 −820.94KFM07A:2 963.00 −792.26 972.00 −798.92KFM07A:3 226.00 −191.67 961.00 −790.77KFM07A:4 191.00 −161.62 225.00 −190.81KFM07A:5 149.00 −125.41 190.00 −160.76KFM07A:6 0.00 3.33 148.00 −124.54KFM07B:1 203.00 −160.23 298.93 −237.91KFM07B:2 75.00 −57.83 202.00 −159.41KFM07B:3 0.00 3.36 74.00 −57.02KFM07C:1 302.00 −297.03 500.34 −494.35KFM07C:2 161.00 −156.81 301.00 −296.04KFM07C:3 111.00 −107.11 160.00 −155.82KFM07C:4 0.00 3.35 110.00 −106.12KFM09A:1 551.00 −445.62 799.67 −621.21KFM09A:2 301.00 −248.28 550.00 −444.86KFM09A:3 0.00 4.29 300.00 −247.46KFM09B:1 451.00 −353.72 616.45 −472.00KFM09B:2 201.00 −159.18 450.00 −352.97KFM09B:3 0.00 4.30 200.00 −158.38HFM20:1 131.00 −127.84 301.00 −297.58HFM20:2 101.00 −97.85 130.00 −126.84HFM20:3 49.00 −45.88 100.00 −96.85HFM20:4 0.00 2.97 48.00 −44.88HFM21:1 107.00 −84.14 202.00 −153.37HFM21:2 33.00 −23.84 106.00 −83.36

62 SKB P-17-17
Observation borehole ID
Secup (mbl TOC)
Elevation Secup (m RHB70)
Seclow (mbl TOC)
Elevation Seclow (m RHB70)
HFM21:3 22.00 −14.62 32.00 −23.01HFM21:4 0.00 3.98 21.00 −13.78HFM38:1 42.00 −31.40 200.75 −140.68HFM38:2 24.00 −17.21 41.00 −30.62HFM38:3 0.00 2.21 23.00 −16.41KFM13: 0.00 2.80 150.21 −127.63KFM14: 0.00 1.97 60.18 −58.03KFM15: 0.00 3.47 62.30 −58.48KFM16: 0.00 1.50 60.35 −50.50KFM17: 0.00 3.64 60.45 −56.66KFM18: 0.00 3.47 60.46 −56.89KFM19: 0.00 2.78 102.37 −90.13KFM20: 0.00 2.80 60.50 −57.49KFM21: 0.00 2.62 101.06 −92.58KFM22: 0.00 2.75 60.26 −57.36KFM23: 0.00 2.27 100.64 −93.93HFM22: 0.00 1.54 222.00 −155.59HFM23: 0.00 4.25 211.50 −72.78HFM28: 0.00 4.27 151.20 −143.77HFM39: 0.00 4.16 151.20 −144.85HFM40: 0.00 2.35 101.70 −98.34HFM41: 0.00 3.45 101.50 −97.22


SVENSK KÄRNBRÄNSLEHANTERING
Arkite
ktkop
ia AB
, Bro
mm
a, 20
18
SKB is responsible for managing spent nuclear fuel and radioactive
waste produced by the Swedish nuclear power plants such that man
and the environment are protected in the near and distant future.
skb.se