Embed Size (px)
Citation preview

1
EVALUATION OF HYT BIOFERTILIZERS
AND BIOCHAR ON THE GROWTH
CHARACTERS AND YIELD OF HOT PEPPER
BY
George Buernortey Appah (10358472)
THIS THESIS IS SUBMITTED TO THE UNIVERSITY OF GHANA,
LEGON, IN PARTIAL FULFILLMENT OF THE REQUIREMENT
FOR THE AWARD OF MASTER OF PHILOSOPHY DEGREE IN
CROP SCIENCE
COLLEGE OF AGRICULTURE AND CONSUMER SCIENCE
DEPARTMENT OF CROP SCIENCE
UNIVERSITY OF GHANA
LEGON
JULY, 2013
University of Ghana http://ugspace.ug.edu.gh
I
DECLARATION
This is to certify that this thesis is the result of research undertaken by Appah George Buernortey
towards the award of the Masters of Philosophy Crop Science (Agronomy) in the Department of
Crop Science, College of Agriculture and Consumer Sciences, University of Ghana.
George Buernortey Appah
(Student)
……………………………………………… …………………………………………….
(Signature) (Date)
Prof. George O. Nkansah
(Supervisor)
……………………………………………… …………………………………………….
(Signature) (Date)
Dr. (Mrs.) C. Amoatey
(Supervisor)
……………………………………………… …………………………………………….
(Signature) (Date)
University of Ghana http://ugspace.ug.edu.gh

II
ABSTRACT
The research was conducted to investigate the effects of High Yield Technology (HYT)
biofertilizers, biochar and inorganic fertilizer on the growth and yield of pepper. The studies
were conducted at the University of Ghana Forest and Horticultural Crops Research Centre
(FOHCREC), Kade from May 2011 to April 2012. The experiment consisted of three factors
namely, HYT, Biochar and inorganic fertilizer at three levels each (HYT: 100%, 50% and 0%);
Biochar: 7t/ha, 3.5t/ha and 0t/ha; inorganic fertilizer: 100%, 50% and 0% of recommended rate).
There were twenty seven treatments with three replications arranged in a randomized complete
block design (RCBD). Data were collected on plant height, plant diameter and leaf number, fruit
number per plant and yield (t/ha) as well as soil chemical and microbial properties. Analysis of
variance (ANOVA) was used to analyze the data. The results indicated that application of HYT
biofertilizers and biochar significantly affected plant height, stem girth, number of leaves and
fruit yield and plant nutrients. The results revealed that 3.5t/ha to 7t/ha biochar + 50-100% HYT
biofertilizer combination increased the yield of hot pepper. Microbial count before and after
planting also showed significant increased with the application of biofertilizers.
University of Ghana http://ugspace.ug.edu.gh

III
DEDICATION
I dedicate this work to my dear wife and children for their sacrifice towards my education and
this work.
University of Ghana http://ugspace.ug.edu.gh

IV
ACKNOWLEDGEMENTS
This thesis could not have been completed without the support and guidance of my supervisors,
family and friends. I express my sincerest appreciation to my supervisors Prof. G.O. Nkansah
(Head of centre, FOHCREC) and Dr. (Mrs) C. Amoatey (Head of Department, Department of
Crop Science, College of Agriculture and Consumer Sciences, University of Ghana) for their
guidance, and useful suggestions and various contributions.
I am extremely grateful to all staff and workers of FOHCREC especially Mr. Ayana Alex, Mr.
Twumasi Ankrah Rexford, Wofa K and Mr. Teye, for their unflinching support during my study.
I do appreciate the invaluable assistance by Emmanuel Amponsah Adjei, Frederick Effah Adu
and George Sasu Mensah. I thank you very much for your time and energy offered for this work
to be successful.
I am also grateful for the understanding, support of my dear wife, children, and Pastor Evans
Kwame Danso for their financial and spiritual support.
Above all, I thank God for being my strength and direction throughout my graduate studies.
University of Ghana http://ugspace.ug.edu.gh

V
TABLE OF CONTENT
DECLARATION I
ABSTRACT II
DEDICATION III
ACKNOWLEDGEMENTS IV
TABLE OF CONTENT V
LIST OF TABLES IX
LIST OF FIGURES X
ABBREVIATIONS XI
CHAPTER ONE 1
INTRODUCTION 1
1.1 Background 1
1.2 Objective 6
1.3 Specific Objective 6
CHAPTER TWO 8
LITERATURE REVIEW 8
2.1 Introduction: Botany and agronomy of Pepper 8
2.2 Biochar application to soil. 8
2.2.1 Biochar composition. 8
2.2.2 Impacts of biochar on soil 10
2.2.3 Biochar-aggregate analogy 12
2.2.4 Influence of nutrient and carbon availability on microbial abundance 12
University of Ghana http://ugspace.ug.edu.gh

VI
2.2.5 Biochar and plant roots 12
2.3 Biofertilizers 13
2.3.1 Effect of biofertilizers on growth, yield and quality parameters of hot pepper 14
2.3.2 Effect of FYM on growth parameters 15
2.3.3 Effect of FYM on fruit yield 18
2.4 Effect of inorganic application 18
2.4.1 Nitrogen, phosphorus and potassium 18
CHAPTER THREE 21
MATERIALS AND METHODS 21
3.1 Experimental Site 21
3.2 Soil characterization 21
3.3 Climate 21
3.4 Experimental Material 22
3.5 Experimental details 22
3.6 Experiment I: Field experiment (major and minor planting seasons) 23
3.6.1 Previous Crop Thriving of Site 23
3.6.2 Experimental layout 23
3.6.3 Plot Size and planting Distance 25
3.7 Cultural practices 26
3.7.1 Germination test 26
3.7.2 Nursery preparation 26
3.7.3 Biochar preparation 26
3.7.4 Land preparation and Biochar application 27
3.8 HYT preparation and application 27
3.8.1 Thinning 28
University of Ghana http://ugspace.ug.edu.gh

VII
3.8.2 Fertilizer application 28
3.8.3 Cultural practices 29
3.8.4 Harvesting 29
3.8.5 Experimental data collection 29
3.8.5.1 Vegetative growth – related characters 29
3.8.5.2 Fruit number and yield parameters 30
3.8.5.3 Fruit quality parameters 30
3.9 Harvesting 32
3.10 Soil, biochar and plant nutrient analyses 32
3.10.1 Soil and biochar chemical properties analyses 32
3.10.2 Soil microbial analysis 34
3.10.3 Plant analyses 34
3.11 Statistical Analysis 35
RESULTS 36
4.1 Vegetative growth parameters of hot pepper in the major and minor seasons 36
4.1.1 The effect of HYT biofertilizer and biochar on the Plant height of hot pepper at major
and minor season 36
4.1.2 The effect of HYT biofertilizer and biochar on the plant diameter of pepper at major
and minor season 38
4.1.3 The effect of HYT biofertilizer and biochar on the number of leaves of hot pepper at
major and minor season 39
4.1.4 The effect of HYT biofertilizer and biochar on canopy size of hot pepper for major and
minor seasons 41
4.2 Flowering of hot pepper plant 43
4.3 Yield and fruit quality parameters of pepper 45
University of Ghana http://ugspace.ug.edu.gh

VIII
4.3.1 The effect of HYT biofertilizer and biochar on number of lobes, number of seeds per
fruit, pericarp thickness and 100 seed weight of pepper 45
4.3.2 The effect of HYT biofertilizer and biochar on yield per plot of hot pepper (kg/ha) 46
4.4 Soil and plant nutrients parameters 47
4.4.1. The effect of HYT biofertilizer and biochar on plant nutrients 48
4.4.2 The effect of HYT biofertilizer and biochar on soil nutrients 49
4.4.3 The effect of HYT biofertilizer and biochar on soil pH and EC 51
4.4.4 The effect of HYT biofertilizer and biochar on microbial count 53
CHAPTER FIVE 54
DISCUSSION 54
CHAPTER SIX 58
6.0 CONCLUSION AND RECOMMENDATION 58
6.1 Conclusion 58
6.2 Recommendation 58
REFERENCES 58
APPENDICES 76
University of Ghana http://ugspace.ug.edu.gh

IX
LIST OF TABLES
Table 1: Treatment combinations 25
Table 2: Application regime 28
Table 3: The effect of HYT biofertilizer and Biochar on plant height of hot pepper in different
seasons 37
Table 4: The effect of HYT biofertilizer and Biochar on plant diameter of hot pepper in different
seasons 39
Table 5: The effect of HYT biofertilizer and Biochar on number of leaves of hot pepper at
different seasons 41
Table 6: The effect of HYT biofertilizer and Biochar on canopy size of pepper for major and
minor seasons 43
Table 7: The HYT biofertilizer and biochar on the days to 50% flowering of pepper 44
Table 8: The effect of HYT biofertilizer and Biochar on yield parameters and fruit quality of hot
pepper 46
Table 9: The effect of HYT biofertilizer and Biochar on yield per plot of hot pepper for major
and minor seasons 46
Table 10: The effect of HYT biofertilizer and Biochar the amount of hot pepper plant nutrients 49
Table 11: The effect of HYT biofertilizer and Biochar the amount of soil nutrients 51
Table 12: The effect of HYT biofertilizer and Biochar the amount of soil pH and EC 52
Table 13: The effect of HYT biofertilizer and Biochar on microbial count before and after
planting 53
University of Ghana http://ugspace.ug.edu.gh

X
LIST OF FIGURES
Figure 1: Rainfall distribution at the experimental site during the experimental period from May
– Dec. 2011 22
Figure 2: Diagram showing treatment combinations. 24
University of Ghana http://ugspace.ug.edu.gh

XI
ABBREVIATIONS
ADP Adenosine Diphosphate
ATP Adenosine Triphosphate
BNF Biological Nitrogen fixation
CEC Cation Exchange Capacity
CN ratio Carbon Nitrogen Ratio
DAS Days After sowing
DAT Days After Transplanting
EC Electrical Conductance
FYM Farm Yard Manure
HYT High Yield Technology
NPK Nitrogen Phosphorus Potassium
Ppm Parts per million
RDF Recommended Dose of Fertilizer
VAM Vesicular Arbuscular Mycorrhizae
University of Ghana http://ugspace.ug.edu.gh

1
CHAPTER ONE
INTRODUCTION
1.1 Background
Hot pepper (Capsicum spp) is reputed to be an important vegetable crop worldwide. It belongs to
the Solanaceae family of which tomato, potato, tobacco, and petunia are members (Bosland and
Votava, 2000; Seleshi, 2011). Capsicum was domesticated at least five times by prehistoric
people in different parts of South and Middle America. The genus Capsicum consists of
approximately 22 wild species and five domesticated species. The five domesticated species
include C. annuum L, C. frutescens L, C. chinenses, C. baccatum L, and C. pubescens R
(Bosland and Votava, 2000; Seleshi, 2011). On the other hand, Capsicum species can be divided
into several groups based on fruit/pod characteristic ranging in pungency, colour, shape, intended
use, flavor and size. Despite their vast trait differences most cultivars of peppers commercially
cultivated in the world belong to the species C. annuum L (Smith et al., 1987; Bosland, 1992;
Seleshi, 2011 ).
According to Bosland and Votava (2000); and Seleshi, (2011) sweet pepper and hot pepper, like
tomato and eggplant are rich in Vitamins A and C and a good source of B2, potassium,
phosphorus and calcium. Capsicum fruits are consumed as fresh, dried or processed, as table
vegetables and as spices or condiments (Geleta, 1998; Seleshi, 2011). The nutritional value of
hot pepper needs special attention, since it is a rich source of vitamin A, C and E (Poulos, 1993;
Seleshi, 2011). Both hot and sweet peppers contain more vitamin C than any other vegetable
crops (Poulos, 1993; Seleshi, 2011). Hot pepper pungency is a desirable attribute in many foods
University of Ghana http://ugspace.ug.edu.gh

2
(Hoffman et al., 1983; Seleshi, 2011). Pungency is produced by the capsaicinoids, alkaloid
compounds (C18H27NO3) that are found only in the plant genus, Capsicum (Hoffman et al., 1983;
Seleshi, 2011).
According to Sonago, (2003) and Nkansah et al., (2011) pepper fruits may be used as a
vegetable, spice and colouring as well as for medicinal purposes. A survey of the Mayan
pharmacopoeia revealed that the tissue of Capsicum species is included in a number of herbal
remedies for different kinds of ailments of probable microbial origin (I-San Lin, 1994).
According to Bosland and Votava (2000), pepper is the most recommended tropical medication
for arthritis. The pharmaceutical industry uses capsaicin as balm (cream), for external application
of sore muscles (Thakur, 1993).
In Ghana, pepper is one of the leading vegetable crops noted for export (Nkansah et al., 2011).
Its production is a good source of income for small producers or out growers and is significantly
one of the foreign exchange earning vegetable crops (Bonsu et al., 2003; Nkansah et al., 2011).
It is used daily in most homes and makes positive impact at the local and export markets
(Nkansah et al., 2011)
Capsicum has been in existence since the beginning of civilization in the Western Hemisphere. It
has been a part of the human diet since 7500 BC (Mac Neish, 1964; Seleshi, 2011). Hot pepper is
produced in all the continents except for Antarctica, and historically it has been associated with
the voyage of Columbus (Heiser, 1976; Seleshi, 2011). Columbus is given credit for introducing
hot pepper to Europe, and subsequently to Africa and Asia. On his first voyage, he encountered a
University of Ghana http://ugspace.ug.edu.gh

3
plant whose fruits mimicked the pungency of the black pepper; Piper nigrum L. Columbus called
them red pepper because the pods were red, later, it was classified as Capsicum. It has since been
commercially grown in the United States (DeWitt and Gerlach, 1990; Seleshi, 2011). However,
it is also believed chilli and sweet pepper (Capsicum annuum) are from Mexico while aromatic
hot pepper (Capsicum chinense) is from the Amazonian region and bird pepper (Capsicum
frutescence), the coastal regions of the southern part of tropical South America (Purseglove et
al., 1981; Grubben et al., 2004; Nkansah et al., 2011)
The long viability of the seeds and the ease with which they can be transported assisted in its
rapid spread in the tropics and subtropics throughout the world after 1492 (Purseglove, 1988)
Capsicum frutescens is cultivated mainly in the tropics and in the warmer regions of the USA
(Kochhar, 1981). Capsicum annuum is grown as sole crop in Nigeria where it is used for export,
however, Capsicum frutescens which is used locally, may be intercropped (Irvine, 1979). Both
Capsicum annuum and Capsicum frutescens are cultivated in Ghana and usually treated as
annuals, although when grown near houses they may be grown as perennials (Irvine, 1979).
Pepper is produced in every region in Ghana, but especially in the Greater Accra, Volta, Eastern,
Ashanti and Brong Ahafo regions (MoFA, 2011). The two main varieties of pepper in West
Africa are Capsicum annuum and Capsicum frutescens, called commercially Capsicum and
Chilli. Capsicum annuum has many varieties and its fruits are larger than those of Capsicum
frutescens. Fruits of both species vary greatly in size and shape and are usually bright red
although they may be white, pale yellow, orange, or purple. (Irvine, 1979)
University of Ghana http://ugspace.ug.edu.gh

4
Farmers in Ghana largely depend on the use of chemical fertilizers and other agro-chemicals
such as herbicides and insecticides. The use of such agro-chemicals indiscriminately, results in
polluting water bodies and also degrading the environment impacting negatively on how
attractive agro-inputs remain. Thus many farmers are resorting to adopting alternative practices
such as the use of organic agro-inputs. The demand for organic crops for consumption including
even organic spice crops on the international market has been showing an upward trend, with
consumers willing to pay a premium price for organic products against conventional products.
(Owusu and Owusu 2013)
Generally, excessive amounts of inorganic fertilizers are applied to vegetables to achieve higher
yields (Stewart et al., 2005 and Deore et al., 2010) and maximum value of growth (Badr and
Fekry, 1998; Arisha and Bradisi, 1999; Dauda et al., 2008; Deore et al., 2010). The use of
inorganic fertilizer alone, however, may cause problems for human health and environment
(Arisha and Bradisi, 1999; Deore et al., 2010). Studies on various crops have shown that the
balanced use of NPK fertilizer alone, could not maintain the higher yields over a long time due to
emergence of secondary and micronutrients and deterioration of soil physical properties (Deore
et al., 2010). However, the use of only organic manures can also not satisfy the crop nutrients
requirement (Kondapa et al., 2009; Deore et al., 2010). Bokhtiar et al., 2008; and Deore et al.,
2010), reported that when organic manures are applied with chemical fertilizers, it results in
better yield than when applied individually. Consumers these days are demanding higher quality
and safer food and are therefore highly interested in organic products (Deore et al., 2010).
University of Ghana http://ugspace.ug.edu.gh

5
According to Abd El-Hakeem (2003), farmers try to increase yields of vegetable crops by means
of heavy nutrition. He went on to say that the use of chemical nitrogen and phosphorus fertilizers
at high levels had an adverse effect on the accumulation of NH4+, NO3- and PO4
- in fruit tissues,
therefore, clean agriculture now depends on using organic and biofertilizers in order to produce
high yields with the best fruit quality without contamination and less accumulation with heavy
metals.
Biofertilizers are substances that contain living microorganisms, when they are applied to seeds
or plants, they colonize the rhizosphere or the interior of the plant and promote growth by
increasing the supply or availability of primary nutrients to host plant (Revllas et al., 2000,
Vessey, 2003 and Shanmuga et al., 2013). The use of artificial fertilizers leads to environmental
pollution and causes depletion of important nutrients (Shanmuga, et al., 2013). Biofertilizers
contain symbiotic or nonsymbiotic microorganisms stimulate the growth plant. Cultivation of
plants with biofertilizers could result in resistance to diseases, the production of phyto hormones
and water soluble vitamins (Kumar, et al., 2001 and Shanmuga, et al., 2013). Biochar is an
organic charred material produced from thermal decomposition of biomass by the process called
pyrolysis or high temperature burning of agricultural biomass without the presence of oxygen.
The limitation of oxygen in the system prevents the complete burning, and produces the charcoal
that captures much more of the natural carbon from the biomaterial. Such a form of carbon will
not only be able to capture additional carbon, but also store carbon dioxide in sinks and out of
the atmosphere for thousands of years. Biochar has been found to be biochemically recalcitrant
compared to un-charred organic matter and possesses considerable potential to enhance long-
term soil carbon pool (Lehmann et al., 2006; Tshewang et al., 2010). Biochar has been shown to
University of Ghana http://ugspace.ug.edu.gh

6
improve soil structure and water retention, enhance nutrient availability and retention, ameliorate
acidity, and reduce aluminium toxicity to plant roots and soil microbes (Glasser et al., 2002;
Tshewang et al., 2010).
HYT is an organic product which helps to improve the fertility of the soil (Agrinos, 2011). The
product comes in three forms, that is, HYTa HYT
b and HYT
c (Agrinos, 2011). There are no
nutrients in HYTa, but the product helps in Nitrogen fixation, and this optimizes the uptake of
Nitrogen from other sources (Agrinos, 2011). When the microbes colonize the soil they also
break up bindings in the soil in the process, and through that also loosen the soil (Agrinos, 2011).
This ensures a break through the soil pan opening up new sources of nutrients in deeper soil
layers (Agrinos, 2011). Permeable soils with a lot of microbial activity also prevent water run‐off
and with that additional loss of nutrients. Permeable soil is also better capable of storing moisture
which is exceptionally important for plant growth, especially in areas that on regular bases are
hampered by drought (Agrinos, 2011). The microbial ecosystem after some time is reported to
collapse and die. The dead bodies of the microbes upon decomposition help to improve organic
matter content of soil (Agrinos, 2011).
1.2 Objective
The main objective of the project was to evaluate the effect of biochar, and organic substrate
(HYT) on the growth and yield of pepper.
1.3 Specific Objective
The specific objectives of the study were also to:
University of Ghana http://ugspace.ug.edu.gh

7
1. Determine the effects of biochar and biofertilizer (HYT) on vegetative growth of hot
pepper.
2. Evaluate the effect of biochar and biofertilizer (HYT) on fruiting and yield of hot pepper
3. Identify possible combinations of inorganic and organic fertilizers for profitable and
effective cultivation of hot pepper in Ghana.
University of Ghana http://ugspace.ug.edu.gh

8
CHAPTER TWO
LITERATURE REVIEW
2.1 Biochar application to soil.
According to McElligot (2011), biochar, a byproduct of pyrolysis, is a biomass-derived black
carbon intended for use as a soil amendment. It is similar to charcoal manufactured through
traditional or modern pyrolysis methods, and to black carbon found naturally in fired
ecosystems. Biochar from pyrolysis and charcoal produced through natural burning have similar
characteristics such as long residence time in the soils and a soil conditioning effect (Glasser et
al., 2002). Lehmann and Joseph (2009) reported that biochar is used as a soil amendment to
improve soil nutrient status, carbon storage and /or filtration of percolating soil water. It has been
shown through research that application of biochar to soil may be more desirable as it increases
soil organic carbon, improves the supply of nutrients to plants and therefore enhance plants
growth and soil physical, chemical and biological properties (Glasser et al., 2002; Lehmann et
al., 2003; Rondon et al., 2007). Not considering its commercial market value, biochar presents
an opportunity to return site nutrients lost from biomes removal projects, which may overshadow
other potential uses (McElligot,2011).
2.2.1 Biochar composition.
Biochar is produced from biomass and is mainly composed of recalcitrant organic carbon with
contents of plant micro and macro nutrients retained from the start. It is known, from research on
wild fire occurrences and the development of Anthrosols up Terra Preta soils, in the Amazon,
that charcoal can remain in the soil for hundreds to thousands of years (Agee, 1996; Lehmann
and Rondon, 2006). Biochar can therefore rapidly increase the recalcitrant soil carbon fraction of
University of Ghana http://ugspace.ug.edu.gh

9
soil. The carbon in biochar, which is held in aromatic form, is resistant to decomposition when
added as a soil amendment (Amonette and Joseph, 2009). Biochar ash consists of calcium (Ca),
iron (Fe), magnesium (Mg), sodium (Na), potassium (K), phosphorus (P), silica (Si) and
aluminium (Al) (Amonette and Joseph, 2009). Long-term positive effects of biochar applications
were observed in a few studies which were monitored over several years (Steiner et al., 2008;
Blackwell et al., 2009; Major et al., 2010). Composition varies by feedstock type and conditions
of pyrolysis (Downie et al., 2009). The actual carbon contents can range between 172g kg-1
and
905g kg-1
. Nitrogen content ranges from 1.8g kg-1
to 56.4g kg-1
, total phosphorus from 2.7g kg-1
to total potassium from 1.0g kg-1
to 58g kg-1
(Lehmann et al., 2003; Lima and Marshall, 2005;
Chan et al., 2007). Biochar also contains varying concentrations of other elements such as
oxygen, hydrogen, nitrogen, sulphur, phosphorus base cations and heavy metals (Preston and
Schmudt, 2006). According to Lehmann et al., 2005 and Cohen-Ofri et al., 2007, freshly
produced biochar consists of crystalline phase with grapheme layers and an amorphous phase of
aromatic structures. It is noted that the outer surfaces contain oxygen and hydrogen functional
groups and the grapheme sheets may contain O groups and free radicals (Bourke et al., 2007).
Biochar has also been produced with a range of pH values between 4 and 12, and this depends on
the starting feedstock and operating conditions (Lehmann, 2007). Generally, low pyrolysis
temperatures (<4000C) yield acidic biochar, while increasing pyrolysis temperatures produce
alkaline biochar. When it is incorporated to the soil, the surface oxidation occurs due to reactions
of water, oxygen and various soil agents (Cheng et al., 2006; Lehmann, 2007). The cation
exchange capacity (CEC) of fresh biochar is actually very low, but increases with time as the
biochar stays longer in the presence of oxygen and water (Cheng et al., 2006; Liang et al., 2006;
Cheng et al., 2008).
University of Ghana http://ugspace.ug.edu.gh

10
2.2.2 Impacts of biochar on soil
Biochar has a lot of potential soil improvement due to its unique physical, chemical and
biological properties and their interactions with soil and plant communities (McElligott, 2011). If
biochar is used as soil amendment, it could help reduce the possible negative impacts of forest
biomass removal operations (McElligott, 2011)
The physical properties of biochar give several benefits to the soil. The porous nature of biochar
results from retaining the cell wall structure of the biomass feedstock. The wide range of pore
sizes within the biochar results in a large surface area and a low bulk density. The application of
biochar to the soil could alter soil physical properties such as structure, pore size distribution and
density, with implications for aeration, water holding capacity, plant growth and soil workability
(Downie et al., 2009). Research has suggested that biochar application into soil may increase the
overall net soil surface area (Chan et al., 2007) and may also improve soil water nutrient
retention (Downie et al., 2009) and soil aeration especially in fine-textured soil (Kolb, et al.,
2007). Biochar has a bulk density much lower than that of mineral soils (-0.3m gm-3
for biochar
compared to typical soil bulk density 1.3m gm-3
) the application of biochar can therefore, reduce
the total bulk density of the soil which is generally desirable for most plant growth (Brady and
Weil, 2004).
The increase in surface area, porosity and lower bulk density in mineral soil with biochar can
change water retention, aggregation, and decrease soil erosion. Biochar has higher surface area
and greater porosity compared to other types of organic matter, and can therefore improve soil
texture and aggregation which improve water retention in soil (McElligot, 2011). Biochar can
affect soil aggregation through interactions with some minerals and microorganisms; however,
University of Ghana http://ugspace.ug.edu.gh

11
the surface charge characteristics and their development over time determine the long-term effect
on soil aggregation (McElligot, 2011).
Biochar has the potential to increase nutrient availability for plants (Lehmann et al., 2003).
According to Liang et al., (2006) and Lehmann, (2007) nutrient availability can be affected by
increasing cation exchange capacity, (CEC) altering pH or direct nutrient contributions from
biochar. Liang et al., (2006) and Lehmann, (2007) continued that one potential mechanism for
enhanced nutrient retention and supply following biochar amendment is increasing CEC by up to
50% as compared to unamended soil.
It is also known that biochar can serve as liming agent resulting in increased pH and nutrient
availability for a number of different soil types (Glasser et al., 2002; Lehmann and Rondon,
2006). The concentration of biochar facilitates liming in soil and raises soil pH of neutral or
acidic soils (VanZweiten et al., 2007). Tyron (1948) reported a greater increase in pH in sandy
and loamy soils than in clayey soils.
Fresh biochar can have net positive or net negative surface charge, but typically have initially
low cation exchange capacities (CEC) compared to soil organic matter on a mass basis
(Lehmann, 2007, Chan and Xu, 2009).
Biochar application can also change soil bulk density (Major et al., 2010); with possible effects
on soil water relations rooting patterns and soil fauna. This occurs both because the density of
biochar is lower than that of some minerals, and also because biochar contains macro-and micro
pores (Downie et al., 2009), which can hold air or water greatly reducing the bulk density of the
entire biochar particles. According to Chan et al., (2007) there is evidence which claims that
biochar application into soil may increase the surface area of soil, this may at the end improve
University of Ghana http://ugspace.ug.edu.gh

12
the retention of water and nutrient (Downie et al., 2009). According to Kolb et al., (2007) the
application of biochar improves soil aeration especially in soils which are fine-textured.
According to Chan et al., (2007) some biochar feedstocks produce better carbonate
concentrations due to pyrolysis conditions, and this makes some of the biochar better liming
agents than others. Depending on the various concentrations, carbonates could have
concentrations between 0.5% and 33%. Alkaline biochar could increase the pH of acidic soils
and also help to improve microbial activity. This helps to promote the decomposition of organic
matter in the soil (McElligott, 2011).
2.2.3 Biochar-aggregate analogy
Biochar properties such as total surface area and pore size distribution are known to vary with
feedstock properties and pyrolysis temperatures (Downie et al., 2009). In addition, surface area
and pore volume may change upon contact with soil by pore clogging from sorbed organic and
mineral material (Pignatello et al., 2006; Joseph et al., 2010).
2.2.4 Influence of nutrient and carbon availability on microbial abundance
Nutrient additions by fertilizers reduced the enhancing effect of biochar on microbial
reproduction rates (Steiner et al., 2008). Similarly Blackwell et al., (2010), found significant
increases in the proportion of root colonization of wheat with AM in biochar-amended soils at no
or low fertilizer additions but no significant increases when large amounts of nutrients were
applied. This effect depends on the type of fertilizer applied and the particular microorganism
2.2.5 Biochar and plant roots
Biochar type materials have been reported to stimulate root growth for some time. The very
different properties of biochar in comparison to surrounding soil in most known cases improved
University of Ghana http://ugspace.ug.edu.gh

13
root growth. According to Matsubara et al., (2002) the number of storage roots of asparagus
increased with coconut biochar additions to a tropical soil.
2.3 Biofertilizers
Basically, biofertilizer is a substance which contains microorganisms that colonize the
rhizosphere or the zone that surrounds the roots of the plants (Ahmad, 2009). These
microorganisms have the ability to convert nutritionally important elements such as nitrogen (N),
phosphorus (P) and potassium (K) from unavailable to available form through biological
processes. There is evidence that proves that beneficial microbes had been used in agricultural
practices over sixty years and now these beneficial microbial populations can be resistant to
adverse environmental stress (Ahmad, 2009)
HYTa comes as a liquid concentrate and is diluted with 100 litres of ground water per litre
product. It is 100% organic and a safe blend of naturally occurring non-pathogenic, microbial
complex based in the soil, the enzymes which restore and increase the activity of microbes in the
soil. The microbes fix atmospheric nitrogen and increase fertilizer efficiency (Agrinos, 2011)
HYTa
contains twenty one different strains of microbes with Clostridium pasteurianum and
Azobactervinelandii as the primary species (Agrinos, 2011). Through the activities of the
microbes, they break through the soil pan resulting in opening the soil nutrient and these results
in better root formation (Agrinos, 2011).
HYTb is an organic free L-amino acids and mineral nutrient source which is plant and microbial
bio-stimulant and stress relief (Agrinos, 2011). It is constituted of 12% L-amino acids of L-
triptophan, L-aspartic acid, L-serine, L-histodine, L-glycine, L-thereonine, L-alanine, L-proline,
L-tryosine, L-arginine, L-valine, L-metionine, L-isleucine, L-phenylalamine.6% ultra-soluble
University of Ghana http://ugspace.ug.edu.gh

14
minerals i.e. Ca and Mg, and 82% transport (Agrinos, 2011). Jain and Patriquin, (1985) found
that bacteria of the genera Azotobacter and Azospirillum could produce more than 30 mg of
indole acetic acid (IAA), solution of enzymatic complex, lactic acid, polysaccharides,
polypeptides and carbohydrates (Agrinos, 2011). It increases stress resistance, and also increases
and supports photosynthesis, pollination and fruit set, stimulates vitamin formation and increases
sugar content (Agrinos, 2011; Adu, 2012).
HYTc is chitin- the super polymer. This is derived from shrimp exoskeleton. Chitin stimulates
certain plant sensors strengthening immune system (Agrinos, 2011).
2.3.1 Effect of biofertilizers on growth, yield and quality parameters of hot pepper
Monib et al., (1990), Abd El-Hakeem, (2003), found that when tomato plant seeds were
inoculated with Azosperillum brasilense and Azotobacter choococcum, it resulted in a significant
increase in plant height as compared to the control. It is possible inoculation of winter legumes
with Azospirillum could increase nodulation, nitrogen fixation and crop yield (Sarig et al., 1986).
Amirthalingam (1988), Siddesh (2006) observed that when soil inoculation was done with
Azospirillum along with 50 per cent recommended dose of nitrogen, there was increase in plant
height and number branches in chilli. Paramguru and Natarajan (1993), Siddesh, (2006) noticed
significant difference in growth parameters in chilli when Azospirillum (10 kg/ha) with nitrogen
(56 kg/ha) was applied compared to the control. Deka et al., (1996), Siddesh, (2006) reported
that application of Azospirillum to chilli plants with 70 kg N per ha produced the higher plant
height (101.1 cm) and branches (11.2/plant) as compared to 70 kg N per ha applied singly, with
plant height and number of branches (92.2 cm and 8.3 respectively). Jeevansab (2000), Siddesh,
(2006) reported that Azospirillum + RDF (150:75:50) took more number of days to 50 per cent
flowering as compared to RDF alone in Capsicum.
University of Ghana http://ugspace.ug.edu.gh

15
2.3.2 Effect of Farm Yard Manure (FYM) on growth parameters
Damke et al., (1988) and Siddesh, (2006) observed greater plant height (60.3cm) and yield in
chilli (1.52t/ha) with application of farm yard manure (FYM) 9t/ha along with 50:50:50kg of N,
P2O5 and K2O per hectar. Siddesh, (2006), reported greater plant height (58.6 cm) and number of
branches of capsicum (4.2) with the application of farmyard manure at 20 t/ha along with
100:80:100 kg N, P2O5 and K2O per ha. Natarajan, (1990) and Siddesh, (2006), reported
maximum plant height (65.5 cm) and number of branches per plant (10.1) in chilli when FYM
was applied at 25t/ha along with 75:35:35 kg/ha NPK compared to inorganic fertilizers alone
(56.7 cm and 8.93). Integrated application of recommended dose of NPK+FYM improved the
growth parameters as well as yield and yield components in chilli (Mallanagouda et al., 1995;
Siddesh, 2006). Application of FYM (15 t/ha) + 150:100:50 kg NPK per ha recorded
significantly higher plant height (73.21 cm) and number of branches (62.01/plant) as compared
to different fertilizer levels in tomato.(Sendurkumaran et al., 1998, Siddesh, 2006)
It is well known that N application in mineral and organic fertilizer plays an important role on
plant vegetative growth, C/N ratio in plant leaves, flowering and fruit setting as well as early and
total fruit yield. (Martinez et al., 1994; Abd-El Hakeem, 2003) found that soil inoculation with
Azotobacter chroococum increased the number of flowers per plant in tomatoes and reduced
flower drop which resulted in earlier flowering.
Many investigators mentioned a positive response to fruit yields of solanaceous crops by
inoculating soil or seeds with nitrogen free living bacteria. This increment in fruit yield depended
on the genus and species of used bacteria; Azotobacter sp, Azospirillum sp, and Kelebsilla sp and
it varied also due to the crops itself, the growing season and the inoculation method as well as
soil conditions (Abd El-Hakeem, 2003). Chindo and Khan (1986) and Abd El-Hakeem, (2003)
University of Ghana http://ugspace.ug.edu.gh

16
and observed that, tomato plant growth was increased with increased level of poultry manure
application up to 8 tons/ha. Shashidhara (2000) noticed that Azospirillum + phosphobacteria
recorded higher 1000-seed weight (5.93) which was significantly superior over 50% RDF (5.40)
in chilli.
Chandrashekar (2003) and Jagadeesha (2008) observed that the plant growth parameters viz.,
shoot and root length and number of leaves per plant in green gram plants at 45 DAS were
significantly increased due to inoculation of P-solubilizing of fungal strains along with rock
phosphate application as compared to rock phosphate alone (control). Vasanthakumar (2003)
Jagadeesha (2008) reported that combined inoculation of Azospirillum (AZUS10) and (PSB7)
produced synergistic effect, resulting in increased root length, shoot length, stem girth, number
of leaves and number of branches in solanaceous crop plants. Labeena (2001); Jagadeesha
(2008); reported that the plant height, fruit weight per plant and diameter of the fruits were
higher in mycorrhizae inoculated plants of tomato compared to uninoculated control plants.
Jeevansab (2000) and Jagadeesha (2008) recorded significantly higher number of seeds (194.8)
per fruit, seed weight (1.44g) and 100-seed weight (0.75g) with the application of Azospirillum +
RDF as compared to 50% RDF (175.8, 1.32g and 0.72g, respectively) in capsicum.
Narasappa et al., 1985 and Siddesh, 2006 reported that the application of 150 kg N and 10t FYM
per ha increased the green chilli by 60.42 % over the control. In Abd El-Hakeem (2003) field
experiment carried out on sweet pepper where results showed that the most favorable treatment
was that inoculated with Nitrobin + Phosphorin and fertilized with 75% of the required N and P
level; 60 kg N + 48kg P2O5 + 96 kg K2O gave the highest growth, yield and fruit quality of sweet
pepper in both seasons.
University of Ghana http://ugspace.ug.edu.gh

17
Rafi et al., (2002) and Babli (2007) reported that application of 50% recommended dose of
fertilizer and FYM (12.5t/ha) with reduced level of recommended dose of fertilizer (50% RDF)
helps in higher vegetative growth and yield in tomato. Naidu et al., (1999) and Babli (2007)
reported that application of NPK (80:60:50 kg/ha) + FYM (20 t/ha) helped in obtaining higher
plant height, number of leaves per plant, intermodal length and number of nodes per plant in
okra.
Prabhu et al., (2002) and Babli (2007) reported that, application of biofertilizers and FYM with
reduced dose of inorganic fertilizers increased yields and yield attributes in okra. The treatment
combination of FYM (10 t/ha) + 2/3 RDF + Azospirillum + VAM resulted in higher yield,
suggesting possibility of reducing about 1/3 RDF without any detrimental effect on yield. Chindo
and Khan, (1986) and Abd-El Hakeem, (2003) observed that, tomato plant growth was increased
with increased level of poultry manure application up to 8 tons/ha.
Jeevansab (2000) reported that Azosperillum + RDF (150:75:50) took more number of days to
50% flowering to RDF alone in capsicum. This was attributed to improvement in plant
vegetative growth at the expense of the development of the plants and their reproductive growth.
A lot of studies realized increased yield by application of biofertilizers as compared to the
control, (Shasidhara 2000; Nanthakumar and Veeraraghavathatham, 2001; Naik and Hosamani,
2003; Wange and Kale, 2004). According to Norman et al., (2011), the observed results could be
allocated to the cumulative plants vegetative growth such as plant height, number of leaves and
branches due to the supply of balanced nutrition to the plants which led to effective
photosynthesis and the efficient distribution of photo assimilates which increase in yield.
University of Ghana http://ugspace.ug.edu.gh
18
2.3.3 Effect of FYM on fruit yield
Narasappa et al., (1985) and Siddesh (2006) reported that the application of 150 kg N + 10t FYM
per ha increased green chilli by 60.42% over the control. Higher fruit yield of chilli (1.83 t/ha)
when FYM 25 tonnes per ha applied as basal dose along with 75:35:35 kg NPK per hectare has
also been reported by Natarajan (1990).
2.4 Effect of inorganic application
2.4.1 Nitrogen, phosphorus and potassium
According to Siddesh (2006) major nutrients like nitrogen (N), phosphorus (P2O5) and potassium
(K2O) play an important role in vegetative and reproductive phase of crop growth. He went on to
say to say that nitrogen is a component of protoplasm, protein, nucleic acid, chlorophyll and
plays a vital role in both vegetative and reproductive phase of crop growth.
Phosphorus is a constituent of nucleoproteins, and it is involved in energy transfer of
compounds like ADP, ATP. It also plays an important role in the transfer of energy in the
metabolic processes (Siddesh, 2006). It is believed that phosphorus results in a better yield and
more red coloured fruits (Matta and Cotter, 1994)
Potassium is responsible for regulation and maintenance of electrochemical equilibrium in cells
and other parts involved in enzyme activities. In addition, it takes part in protein synthesis,
carbohydrate metabolism, regulation of activities of the essential elements, and control in plants
(Siddesh, 2006).
The amount of fertilizer to be applied depends on soil fertility, fertilizer recovery rate and
organic matter, soil mineralization of nitrogen, and soil leaching of nitrogen (Berke et al., 2005
and Seleshi, 2011). According to Seleshi, (2011) peppers require adequate amount of major and
University of Ghana http://ugspace.ug.edu.gh

19
minor nutrients. However, they appear to be less responsive to fertilizer, compared with onion,
lettuce and crops Cole crops (Cotter, 1986; Seleshi, 2011).
2.4.2 Effect of nitrogen, phosphorus and potassium on growth parameters
Nathulal and Pundnik (1971) observed the highest plant height (63.62cm) when 100kgN, 70kg
P2O5 and 50kg K2O per ha on the trial of NPK on chilli at different levels of N at 0, 60, 80, and
100kg per ha; P at 0, 70 and 90kg per ha and K at 0 and 50kg per ha. Shukla et al., (1986); Kiran
(2006) observed maximum plant height with maximum nitrogen (180kg/ha) level, while the
response to P application was non-significant. It was observed by Hanchinamani (1980) that
increased levels of nitrogen, phosphorus and potassium at 200:150:100 kg per ha, increased the
plant height in Brinjal (Kiran, 2006).
According to Prabhakar et al., (1987), Kiran, (2006) maximum plant height was noticed with the
highest N (90 kg/ha) level, while P application showed non-significant response in respect of
plant height in chilli cultivar G-3 (Sharma, 1995). Kiran, (2006) in the study for the
determination of optimum doses of nitrogen, phosphorus and potassium fertilization in tomato
revealed that increase in the levels of nitrogen application showed increase in plant height and
number of branches per plant. In the application of 150:75:75 kg NPK per ha compared to
100:50:50 and 125:62.5:62.5 kg NPK per ha in two chilli varieties Balaraj (1999), Kiran (2006)
recorded significantly higher plant height and number of branches per plant.
University of Ghana http://ugspace.ug.edu.gh

20
2.5 Effect of integration of biofertilizer, inorganic fertilizer and biochar on:
2.5.1 Plant vegetative growth
In trials on Capsicum grown in a clay loam soil under semi-arid conditions, Paramaguru and
Natarajan (1993), Abd El-Hakeem (2003), when Azosperillum was applied as seed inoculation
and soil application combined with 56 kg N per ha, there was an increase in plant height than the
control treatment when no bacterial treatment was added. Considering the number of branches
and weight of shoots as affected by N-biofertilizers, Paramaguru and Natarajan (1993), Abd El-
Hakeem (2003), mentioned that, when Capsicum seeds and soil were treated with Azosperillum
combined with 56 kg N per ha, there was an increase in plant growth as expressed as number and
weight of branches as compared to the control without bacterial treatment.
Studies on the effect of inoculation of two commercial tomato varieties; Castle rock and UC 97-3
with Azosperillum brasilense (N-fixing bacteria) and Bacillus polymaxa (P-dissolving bacteria)‟
there was an increase in plant height, fresh and dry weight of plants inoculated with Bacillus
polymaxa than plants treated Azosperillum brasilense and uninoculated control. (Moustafa and
Omar, 1990; Abd El-Hakeem, 2003).
University of Ghana http://ugspace.ug.edu.gh

21
CHAPTER THREE
MATERIALS AND METHODS
3.1 Experimental Site
The experiment was carried out at the Forest and Horticultural Crops Research Centre
(FOHCREC) Kade, in the forest zone. FOHCREC is 114m above sea level on latitude 60.1573
/ N
and longitude 00.9153
/ W (Nkansah et al., 2011). The centre is located in the semi-deciduous
forest agro-ecological zone of Ghana in the Kwaebibrim district of the Eastern Region, 175km
NE of Accra (Nkansah et al., 2011).
3.2 Soil characterization
The soil moisture regime is udic and soil temperature regime is isohyperthermic (Van Wambeke,
1992; Owusu-Benoah et al., 2000). The dominant soil is Haplic Acrisol (FAO/UNESCO, 1990;
Nkansah et al., 2007; Nkansah et al., 2011).
3.3 Climate
The climate of the area is humid tropical, with temperature of between 25-380C (Ofosu-Budu,
2003; Nkansah et al., 2011). The annual rainfall ranges between 1300mm-1700mm and the
distribution is bi-modal two peaks around June-July and September-October (Ofosu-Budu, 2003;
Nkansah et al., 2011). The rainfall regime during the experimental period is shown in Figure 1.
University of Ghana http://ugspace.ug.edu.gh

22
Figure 1: Rainfall distribution at the experimental site during the experimental period from May –
Dec. 2011
3.4 Experimental Material
Pepper variety “Scotch Bonnet” was used for the experiment. It was purchased from Agriseed
limited in Accra. HYT biofertilizers were provided by Agrinos while inorganic fertilizers used
were acquired from Forest and Horticultural Crops Research Centre. Biochar was prepared at
the centre by pyrolising rice husk.
3.5 Experimental details
Two field experiments (major and minor planting seasons) were conducted. The major planting
season started in April and ended in July and the minor season commenced in August and ended
in November.
University of Ghana http://ugspace.ug.edu.gh

23
3.6 Experiment I: Field experiment (major and minor planting seasons)
3.6.1 Previous Crop Thriving of Site
The experimental site used for the major planting season was an abandoned citrus plantation.
The plantation was destroyed and the site was prepared for the experiment. The experimental site
used for the minor season was previously used to cultivate maize and was left to fallow for two
years. The predominant plant species in the area were Panicum maximum, Digitaria horizontalis,
Commelina erecta, Mimosa pudica, Tridax procumbens, Cassia obtusifolia and Crotolaria
retusa.
3.6.2 Experimental layout
The experiments were laid out in a randomized complete block design (RCBD) with four
replications. The experiment consisted of 27 different treatments each replicated four times. The
treatments were biochar (carbonated rice husk), HYTa and HYT
b biofertilizers and inorganic
fertilizers, in the combinations as per the tree diagram.
University of Ghana http://ugspace.ug.edu.gh

24
Figure 2: Diagram showing treatment combinations.
University of Ghana http://ugspace.ug.edu.gh

25
Table 1: Treatment combinations
Treatment Treatment explanation
T1:F0B0H0 Control
T2:F0B50H0 3.3t biochar
T3:F0B100H0 7t biochar
T4:F50B100H0 50% fertilizer +7t biochar
T5:F50B50H0 50%fertilizer + 3.5t biochar
T6:F50B0H0 50% fertilizer
T7:F100B100H0 100% fertilizer+ 7t biochar
T8:F100B50H0 100% fertilizer + 3.5t biochar
T9:F100B0H0 100% fertilizer
T10:F100B100H100 100% fertilizer+ 7t biochar+ 100% HYT
T11:F50B50H50 50% fertilizer +3.5t biochar+50% HYT
T12:F100B0H100 100% fertilizer+ 100% HYT
T13:F100B0H50 100% fertilizer + 50% HYT
T14:F50B0H100 50% fertilizer + 100% HYT
T15:F50B0H50 50% fertilizer + 50% HYT
T16:F100B100H50 100% fertilizer+7t biochar+ 100% HYT
T17:F100B50H100 100% fertilizer+3.5t biochar + 100% HYT
T18:F100B50H50 100% fertilizer+3.5t biochar +50% HYT
T19:F50B100H100 50% fertilizer+ 7t biochar +50%HYT
T20:F50B100H50 50%fertilizer+7t biochar+ 50%HYT
T21:F50B50H100 50% fertilizer+ 3.5t biochar+100%HYT
T22:F0B100H100 7t biochar +100% HYT
T23:F0B0H50 50% HYT
T24:F0B0H100 100% HYT
T25:F0B100H50 7t biochar +50% HYT
T26:F0B50H100 3.5t biochar +100% HYT
T27:F0B50H50 3.5t biochar +50% HYT
3.6.3 Plot Size and planting Distance
Each experimental plot was 8m2 (8m x 1m) in both seasons with 0.3m between plots and 0.6m
pathway. The planting distance adopted at both sites was 70cm ×60cm, and the plant population
per plot was 28.
University of Ghana http://ugspace.ug.edu.gh

26
3.7 Cultural practices
3.7.1 Germination test
Prior to sowing of seeds, a germination test was carried out on the seeds to ascertain the viability
and number of seeds needed to be nursed. Fifty seeds were placed in a petri dish containing a
moist filter paper and covered and kept in a dark room. The process was repeated four times and
the mean germination percentage determined by the formula below
3.7.2 Nursery preparation
Seedlings were raised using carbonated rice husk (biochar) as growing medium on 14 May 2011
and 16 August 2011 for the major and minor seasons respectively. A starter solution of 5g/L of
N.P.K. 15-15-15 was applied two weeks after emergence at 10ml per plant. A nutrient solution
of the same concentration and volume was also applied one week after the initial application.
Fungicides Mancozeb 80 WP (Mancozeb dithiocarbamate) and Top Cop (Sulphur and Tribasic
copper sulphate) were applied alternatively to prevent damping off at 10g/litre and 14ml/litre
respectively. Cyperdicot (dimethoate 250g/L + cypermethrin 30g/litre) at 7.5ml/litre was applied
fortnightly to control the activities of grasshoppers (Zonocerus variegatus), aphids (Aphis
gossypii) and white flies (Bemisia tabaci)
3.7.3 Biochar preparation
A metal drum was cut at both ends and perforated at several places on the cylinder. Firewood
was burnt inside the drum and when enough heat was generated, dried rice husk was heaped
around the metal drum. It was left to pyrolyse. After pyrolising it was watered to cool down and
University of Ghana http://ugspace.ug.edu.gh

27
put off the presence of any glowing material. It was then air dried and weighed into sacks ready
for application on the field. Biochar was applied to their respective plots.
3.7.4 Land preparation and Biochar application
The land was deep ploughed and then harrowed twice to give fine tilth, on 11 May 2011 and 12
August 2011 in the major and minor seasons respectively. The plots were prepared according to
the specifications and biochar was applied on 22 May 2011 and 23 August 2011 at 7.0t/ha
(100%), 3.0t/ha (50%) and 0t/ha (0%) for major and minor seasons respectively. The application
was done by incorporating biochar to the top 5cm of the soil with the aid of a hoe.
HYT biofertilizers were activated into their respective concentrations on 27 May 2011 in the
major season and 29 August 2011 in the minor season then applied to the various experimental
plots three days later using a knapsack sprayer. The solution of the mixture (0.9litre) was
measured and applied on each treatment plot (8m2). All cultural practices were followed using
instructions as per package.
3.8 HYT preparation and application
In preparing the HYT, 4 liters (100%) and 2 liters (50%) of HYTb
was added each to 100 liters of
water and stirred for thorough mixing. The mixture was then allowed to stand for 15 minutes
before the same quantity of HYTa
was added and stirred thoroughly to activate the enzymes and
microbes. It was covered and stored away from rain and excessive heat. After seventy two (72)
hours, the colour and smell of activated solution altered becoming less pungent in odour, with a
light film forming on the surface of the solution with foam also appearing. These signs showed
the successful activation of the product (Agrinos, 2011). The same volume of HYTb
(4 liters and
University of Ghana http://ugspace.ug.edu.gh

28
2 liters for 100% and 50% respectively) was then added and agitated to reactivate the enzymes in
accordance to the Agrinos (2011) Protocol. The solution was used for soil application at 900ml
per 8m2 close to the root zone of the plants. The process was repeated fortnightly for three
months.
HYTb
was added to 100 liters of water and applied at 450ml per 8m2 as foliar application. The
process was also repeated every fortnight for three months.
Table 2: Application regime (of HYT)
Time/WAT 1 2 3 4 5 6 7 8 9 10 11
Application Soil Foliar Soil Foliar Soil Foliar Soil Foliar Soil Foliar Soil
WAT: weeks after transplanting.
3.8.1 Thinning
At 7 days after transplanting (DAT) weak crop seedlings were thinned out retaining only one
plant per stand.
3.8.2 Fertilizer application
NPK 15-15-15 at 250 kg/ha (100%) and 125kg/ha were applied at 14 DAT. Sulphate of
ammonia was applied at flowering at 150kg/ha (100%) and 75kg/ha (50%). Ring placement
method was used for the application of the various fertilizer treatments. The application rate per
plant was calculated using the area of a hectare and the planting distance as follows:
University of Ghana http://ugspace.ug.edu.gh

29
3.8.3 Cultural practices
The experimental plots were kept free from weeds by regular hand hoeing. Supplementary
irrigation was given as and when necessary. Necessary plant protection measures were taken to
control the pests and diseases as and when necessary. Cymethoate at a rate of 7.5ml/l of water
was sprayed on the field to prevent termites and cricket attack, Pyrinex 48EC at 3ml/l
(Chlorpyrifos 480g/l an organophosphorus compound) was also applied four weeks after
transplanting to control aphids (Aphis spp) and white flies (Bemisia tabaci). Cyperdicot
(dimethoate 250gm/l + cypermethrin 30gm/L) at 7.5ml/l was applied to control the activities of
leaf miners (Liriomyza spp), grasshoppers (Zonocerus variegatus), aphids (Aphis gossypii) and
white flies (Bemisia tabaci). Broad spectrum fungicides Mancozeb 80 WP and Top Cop (Sulphur
and Tribasic copper sulphate) were applied to prevent fungal attack.
3.8.4 Harvesting
Harvesting of the fruits was done at maturity. The harvested crops were weighed using the
electronic scale.
3.8.5 Experimental data collection
Five plants from each treatment in each replication were randomly selected and tagged for record
taking on growth, yield and yield components as well as fruit quality parameters.
The following data were collected:
3.8.5.1 Vegetative growth – related characters
1. Plant height
It was recorded in centimeters from the base of plant to the terminal growing point of tagged
plants at 15, 30 and 45 DAT using a meter rule. Mean plant length was computed as;
University of Ghana http://ugspace.ug.edu.gh

30
2. Stem diameter
The diameters were measured using vernier caliper and the averages worked out. The diameter
was measured from about 5cm from the soil surface around the base of the plants at 15, 30 and
45 DAT.
3. Number of leaves per plant
The numbers of leaves per plant were counted at 15, 30 and 45 DAT.
4. Plant canopy size
Plant canopy size was determined using a meter rule. Canopy was measured in the north – south
and east – west directions at 50% flowering stage.
5. Phenology parameters
Days to Flowering
The number of days taken for 50% of plants to flower was recorded in each treatment.
3.8.5.2 Fruit number and yield parameters
1. Number of fruits per plant
The mean fruit number per plant was worked out from the total number of fruits harvested over
the entire harvest period of two months.
University of Ghana http://ugspace.ug.edu.gh

31
2. Fruit yield per plant
The mean fruit weight per plant was calculated from the fruits harvested over all the pickings.
3. Fruit yield per plot
The total fruit weight from the tagged plants was recorded from the fruits harvested from all the
harvested fruits and fruit yield per plot computed as
Fruit yield per plot = Average fruit yield per plant * number of plants per plot.
4. Fruit yield per hectare
The total fruit weight per hectare was computed based on the fruit weight per net plot.
3.8.5.3 Fruit quality parameters
1. Number of lobes per fruit
The number of lobes found in the fruits were counted and recorded
2. Fruit Pericarp thickness
Five fruits from each treatment and replication were dissected transversally and the thickness of
the pericarp measured with a vernier caliper at the four cardinal points and averaged using the
formula below:
3. Number of seeds/fruit
The number of seeds in harvested fruits were counted and recorded.
University of Ghana http://ugspace.ug.edu.gh

32
4. Weight of 100 seeds
100 seeds from fruits selected from the tagged plants were weighed.
3.9 Harvesting
Fruits were harvested at the red ripe stage.
3.10 Soil, biochar and plant nutrient analyses
Soil and biochar samples were air dried and were sieved using a 2mm mesh and stored before the
laboratory analyses. Plant samples were oven dried at 700C for 72 hours, milled and sieved for
the analyses of chemical properties.
3.10.1 Soil and biochar chemical properties analyses
Core soil samples were collected randomly from the 0-15cm depth on the site using a soil auger.
Soil was then mixed thoroughly and the bulk sample was taken to the laboratory, air-dried and
sieved to pass through a 2mm screen for chemical analysis. The soil pH (1:1 soil/water) and
biochar pH (1: 2.5 biochar/water) were determined using a glass calomel electrode system
(Crockford and Nowell, 1956). The soil N was determined by the microkjedahl method (AOAC,
1994) while available soil P was extracted by the Bray P1 extractant, measured by the Murphy
blue colouration and determined on a spectronic 20 at 882 Um (Murphy and Riley, 1962). Soil
K, Ca, and Mg were extracted with a 1M NH4OAC (Ammonium acetate), pH 7 solution, then K
analyzed with a flame photometer while Mg and Ca were determined with an atomic absorption
spectrophotometer (Jackson, 1973).
Total nitrogen in sample was calculated as shown:
University of Ghana http://ugspace.ug.edu.gh

33
Available P in samples was calculated as shown
The concentration of potassium in the soil or biochar sample expressed in percentage was
calculated as follows:
The concentration of calcium and magnesium in the soil or biochar sample expressed in
percentage was calculated as follows:
Soil particle size determination was done using the Bouyoucos Hydrometer Method (Bouyocous,
1962). The particle size distribution was determined using the formula:
(silt)%= (α) – (β)
University of Ghana http://ugspace.ug.edu.gh

34
3.10.2 Soil microbial analysis
A screw cap bottle of about 250 ml volume was washed and covered with aluminum foil and
sterilized in an autoclave at 121oC for 15 minutes. A long rope was tied around the neck of the
bottle. The cap of the bottle was opened aseptically and lowered down into the well to a depth of
about 1 m making no air escaped. The bottle was raised out of the well and carefully replaced.
The bottle was labeled, placed in an ice chest loaded with ice packs and immediately transported
to the laboratory for incubation. 9ml of ¼ strength phosphate saline buffer were added to 1ml of
well water sample for 1 in 10 dilutions.
The pour plate method was used in which 1ml aliquot of the well water sample was transferred
aseptically with a micro pipette into a sterile petri dish. 10 ml of the sterile plate count agar
(PCA) was added when palm hot (45oC), mixed and allowed to set. It was then incubated at 35
oC
for 18-24 hours. The microbial growth on the media was counted using the Start Scientific
Colony Counter.
3.10.3 Plant analyses
The Kjeldahl digestion procedure as described by Okalebo et al., (2002) was used in
determination of N, P, K, Mg and Ca in the plants. A 0.1 g of milled and sieved plant samples
were weighed into cleaned dry 125ml Pyrex conical flask. Five milliliters H2SO4 was added and
left to stand for about 1 hour. The flask and its content were heated on a hot plate in a fume
chamber and few drops of H2O2, adding 3 – 4 drops at a time to avoid vigorous reaction of the
content until the solution turned colourless. The solution was cooled and transferred into 100ml
volumetric flask. The content was topped to the mark using distilled water and used to determine
N, P, K, Ca and Mg. Total nitrogen in plant samples was determined using the microkjedal
method of distillation and titration as described for soil and biochar above. Available P was
University of Ghana http://ugspace.ug.edu.gh

35
determined following colour development using the Bray P1 extractant, measured by the Murphy
blue colouration (Murphy and Riley, 1962) and determined on a Spectrophotometer (model
Perkin Elmer Lamda 45). Exchangeable K in samples was read by aspirating directly into
Jenway flame photometer (PFP7). Calcium and Mg in the extract was determined using the
Atomic Absorption Spectrometer (AAS). All parameters determined were expressed in
percentages using the equations above.
3.11 Statistical Analysis
The data collected were analyzed using analysis of variance (ANOVA) at p=0.05 (GenStat,
version 11). Significant differences among treatment means were separated using least
significant difference (LSD) at p=0.05.
University of Ghana http://ugspace.ug.edu.gh

36
CHAPTER FOUR
RESULTS
4.1 Vegetative growth parameters of hot pepper in the major and minor seasons
The study revealed that significant differences with the application of HYT biofertilizers and
biochar on growth characters and yield of hot pepper at the vegetative stage in both the major
and minor seasons.
4.1.1 The effect of HYT biofertilizer and biochar on the Plant height of hot pepper at major
and minor season
Results in Table 3 show the effect of HYT biofertilizer and Biochar on plant height in the
different seasons. It was observed that there were significant differences in both seasons at the
various Days After Transplanting. AT 45 DAT there was significant increase in the plant height
among the treatments and between the major and minor season. In the major season, the highest
plant height at 45 DAT was identified to be 39.56 cm for treatment 50% fertilizer and the
corresponding highest plant height at 45 DAT for minor season was 35.32 cm for treatment
100% fertilizer +3.5t biochar +50% HYT. Generally there was a significant increase in plant
height in the major season than the minor season for the hot pepper among the various DAT.
University of Ghana http://ugspace.ug.edu.gh

37
Table 3: The effect of HYT biofertilizer and Biochar on plant height of hot pepper in at 15,
30 and 45DAT in the major and minor seasons
Treatments
Major Season
plant height (cm)
Minor Season
Plant height (cm)
15
DAT
30
DAT
45
DAT
15
DAT
30
DAT
45
DAT
Control 18.25 23.40 28.43 14.75 22.81 27.65
3.5t biochar 18.50 23.85 26.80 16.35 23.32 26.68
7t biochar 20.75 25.52 28.88 17.56 23.41 26.18
50% fertilizer+7t biochar 23.35 26.25 28.90 18.36 22.96 26.27
50%fertilizer+ 3.5t biochar 25.50 31.83 35.10 21.59 26.35 30.38
50% fertilizer 30.75 35.85 39.56 28.77 31.25 34.16
100% fertilizer+ 7t biochar 22.25 25.25 28.05 18.24 24.35 26.27
100%fertilizer + 3.5t biochar 19.50 24.47 28.05 16.18 23.68 26.83
100% fertilizer 22.25 26.20 29.53 21.12 29.85 33.10
100% fertilizer+ 7t biochar+ 100% HYT 20.75 24.60 28.16 20.33 23.32 24.74
50% fertilizer +3.5t biochar+50% HYT 24.00 30.10 34.25 24.13 30.71 33.66
100%fertilize+ 100% HYT 22.75 28.07 31.31 25.26 31.31 34.22
100% fertilizer + 50% HYT 24.50 31.32 36.23 20.86 25.89 28.22
50% fertilizer + 100% HYT 18.75 22.73 26.96 17.73 23.69 26.34
50% fertilizer + 50% HYT 25.00 32.15 35.38 16.26 23.61 26.76
100%fertilizer+7t biochar+ 100%HYT 24.00 29.90 33.48 22.09 25.55 27.56
100%fertilizer+3.5t biochar + 100% HYT 29.00 35.50 38.20 21.19 27.51 30.45
100%fertilizer+3.5t biochar +50% HYT 23.00 33.35 38.27 21.60 31.58 35.32
50%fertilizer+ 7t biochar +50%HYT 22.75 27.70 33.86 22.32 26.62 29.25
50%fertilizer+7t biochar+ 50%HYT 23.50 28.75 30.95 21.56 26.34 28.60
50%fertilizer+ 3.5t biochar+100%HYT 24.75 33.02 36.05 21.41 29.49 32.82
7t biochar +100% HYT 22.75 27.92 33.35 22.76 27.31 31.42
50% HYT 25.00 29.58 31.85 22.37 27.43 29.51
100% HYT 24.00 31.37 34.43 22.39 29.50 32.51
7t biochar +50%HYT 21.50 26.70 33.57 17.12 23.34 25.41
3.5t biochar +100% HYT 22.25 27.40 30.62 18.57 23.52 26.31
3.5t biochar +50% HYT 28.75 33.02 37.28 27.11 31.64 33.63
LSD (P=5%) 4.483 4.095 4.006 0.1888 1.1714 0.1741
University of Ghana http://ugspace.ug.edu.gh

38
4.1.2 The effect of HYT biofertilizer and biochar on the stem diameter of pepper at major
and minor season
Plant diameter is also one of the vegetative growth parameters that were used to identify the
effect that HYT biofertilizer and Biochar had on hot pepper for the major and minor seasons.
From Table 4 it was found out that there were significant differences among all the seasons at the
various DAT, which are 15, 30 and 45 DAT. For the major season at 15 DAT the highest plant
diameter observed was for the 50% fertilizer with a diameter of 0.51 cm as seen in Table 4. The
lowest in plant diameter was found to be with fertilizer combinations of 100 fertilizer and 50%
HYT. The biofertilizers were noticed to have narrow plant diameter in the major season. At 30
DAT, the widest plant diameter was for the 50% fertilizer only and this proved the minimum
effect of the HYT fertilizer and the biochar. In the minor season there were appreciable
significant differences observed in the plant diameter from 15 DAT to 45 DAT. The widest in
plant diameter observed in fertilizer combinations 100% fertilizer was the value of 0.92 cm. It
was also observed that the fertilizer combination between 100% fertilizer +7t biochar +100%
HYT gave the lowest plant diameter as 0.47 cm from Table 4.
University of Ghana http://ugspace.ug.edu.gh

39
Table 4: The effect of HYT biofertilizer and Biochar on plant diameter of hot pepper in
different seasons
Treatment
Major season
Stem diameter(cm)
Minor season
Stem diameter (cm)
15
DAT
30
DAT
45
DAT
15
DAT
30
DAT
45
DAT
Control 0.40 0.51 0.66 0.34 0.41 0.63
3.5t biochar 0.33 0.45 0.63 0.36 0.51 0.68
7t biochar 0.31 0.49 0.62 0.36 0.53 0.68
50% fertilizer+7t biochar 0.40 0.51 0.64 0.38 0.57 0.74
50%fertilizer+ 3.5t biochar 0.45 0.57 0.78 0.46 0.65 0.83
50% fertilizer 0.51 0.69 0.88 0.47 0.60 0.70
100% fertilizer+ 7t biochar 0.39 0.48 0.64 0.38 0.54 0.72
100%fertilizer + 3.5t biochar 0.41 0.59 0.78 0.39 0.55 0.82
100% fertilizer 0.44 0.63 0.84 0.41 0.64 0.92
100% fertilizer+ 7t biochar+ 100% HYT 0.34 0.53 0.64 0.32 0.39 0.47
50% fertilizer +3.5t biochar+50% HYT 0.34 0.47 0.69 0.25 0.37 0.55
100%fertilize+ 100% HYT 0.33 0.41 0.52 0.32 0.41 0.52
100% fertilizer + 50% HYT 0.28 0.48 0.60 0.42 0.35 0.56
50% fertilizer + 100% HYT 0.32 0.64 0.87 0.30 0.49 0.86
50% fertilizer + 50% HYT 0.38 0.49 0.67 0.30 0.38 0.52
100%fertilizer+7t biochar+ 100%HYT 0.41 0.54 0.67 0.39 0.48 0.57
100%fertilizer+3.5t biochar + 100% HYT 0.51 0.62 0.55 0.55 0.66 0.91
100%fertilizer+3.5t biochar +50% HYT 0.43 0.52 0.71 0.38 0.43 0.62
50%fertilizer+ 7t biochar +50%HYT 0.34 0.51 0.63 0.36 0.45 0.55
50%fertilizer+7t biochar+ 50%HYT 0.35 0.45 0.54 0.35 0.41 0.50
50%fertilizer+ 3.5t biochar+100%HYT 0.35 0.47 0.67 0.34 0.42 0.64
7t biochar +100% HYT 0.51 0.63 0.77 0.37 0.56 0.72
50% HYT 0.44 0.53 0.64 0.46 0.53 0.67
100% HYT 0.51 0.64 0.76 0.43 0.53 0.69
7t biochar +50%HYT 0.31 0.45 0.63 0.35 0.44 0.62
3.5t biochar +100% HYT 0.41 0.50 0.66 0.49 0.59 0.74
3.5t biochar +50% HYT 0.33 0.49 0.68 0.32 0.45 0.65
LSD (P=5%) 0.07737 0.07431 0.0711 0.05233 0.02466 0.00786
4.1.3 The effect of HYT biofertilizer and biochar on the number of leaves of hot pepper at
major and minor season
In the major and minor season experiments, number of leaves was one of the vegetative growth
parameters used to determine the effect of HYT biofertilizer and biochar on pepper. Table 5
University of Ghana http://ugspace.ug.edu.gh

40
shows the effect of HYT biofertilizer and Biochar on the number of leaves for major and minor
seasons, there were no significant differences for the 15 DAT at the major season but there were
significant differences among the 30 and 45 DAT for both major and minor seasons among the
various treatments. However the lowest number of leaves was recorded for the control for the
major season at 15 DAT with a number of 23. The lowest reading for 30 DAT was 59, still under
the control whilst that of 45 DAT was 101. The highest number of leaves for major season was
260 for the combination of 50% fertilizer + 50%HYT at 45 DAT and the highest for the minor
season was observed for the 50% fertilizer +7t Biochar with the number of 183 at 45 DAT. The
highest number of leaves for 30 DAT was 120 leaves for the minor and this was recorded by the
100% fertilizer.
University of Ghana http://ugspace.ug.edu.gh

41
Table 5: The effect of HYT biofertilizer and Biochar on number of leaves of hot pepper at
different seasons
Treatment
Major
No. of Leaves
Minor
No. of Leaves
15
DAT
30
DAT
45
DAT
15
DAT
30
DAT
45
DAT
Control 23 59 101 29 53 128 3.5t biochar 63 103 137 51 92 124 7t biochar 73 115 151 52 83 110 50% fertilizer+7t biochar 73 132 207 66 114 183 50%fertilizer+ 3.5t biochar 69 103 148 59 94 138 50% fertilizer 78 158 263 59 100 139 100% fertilizer+ 7t biochar 68 124 196 64 102 168 100%fertilizer + 3.5t biochar 68 143 229 59 97 129 100% fertilizer 61 144 221 77 120 155 100% fertilizer+ 7t biochar+ 100% HYT 71 83 170 46 55 141 50% fertilizer +3.5t biochar+50% HYT 47 73 106 62 84 113 100%fertilize+ 100% HYT 94 126 191 49 80 140 100% fertilizer + 50% HYT 54 116 260 29 55 123 50% fertilizer + 100% HYT 36 88 139 44 62 119 50% fertilizer + 50% HYT 72 118 160 56 94 134 100%fertilizer+7t biochar+ 100%HYT 44 89 128 45 65 120 100%fertilizer+3.5t biochar + 100% HYT 83 119 146 68 105 131 100%fertilizer+3.5t biochar +50% HYT 88 131 173 62 103 145 50%fertilizer+ 7t biochar +50%HYT 53 109 200 28 73 151 50%fertilizer+7t biochar+ 50%HYT 86 116 162 67 83 127 50%fertilizer+ 3.5t biochar+100%HYT 65 110 231 53 99 133 7t biochar +100% HYT 40 85 143 25 64 129 50% HYT 83 123 173 57 97 147 100% HYT 73 114 156 49 86 127 7t biochar +50%HYT 55 121 197 31 65 127 3.5t biochar +100% HYT 69 105 235 52 91 132 3.5t biochar +50% HYT 63 100 195 46 73 121 LSD (P=5%) 96.25 18.33 50.65 0.56 1.32 1.15
4.1.4 The effect of HYT biofertilizer and biochar on canopy size of hot pepper for major
and minor seasons
Canopy size is one of the growth parameters that show the area covered by the branches and
leaves of the plant. It was noticed that there were significant differences in the major and minor
University of Ghana http://ugspace.ug.edu.gh

42
seasons for the various fertilizer combinations and control plots respectively (Table 6). The
minor season had the least canopy size of 0.041 m2
for 50% fertilizer whilst the fertilizer
combinations 50% fertilizer and 100% HYT had the least (0.121 m2) for the major season. It was
also observed that the canopy size was very wide for fertilizer combination for 100% fertilizer +
3.5t biochar + 100% HYT in the minor season with a value of 1.610 m2. Although the
differences in the canopy size were not that wide there were statistically significant differences in
the canopy size in pepper for both major and minor season (Table 6).
University of Ghana http://ugspace.ug.edu.gh

43
Table 6: The effect of HYT biofertilizer and Biochar on canopy size of pepper for major
and minor seasons
Treatment
CANOPY SIZE
(m2)
Major Minor
Control 0.167 0.140
3.5t biochar 0.267 0.272
7t biochar 0.241 0.230
50% fertilizer+7t biochar 0.393 0.371
50%fertilizer+ 3.5t biochar 0.427 0.389
50% fertilizer 0.416 0.041
100% fertilizer+ 7t biochar 0.321 0.301
100%fertilizer + 3.5t biochar 0.440 0.365
100% fertilizer 0.274 0.313
100% fertilizer+ 7t biochar+ 100% HYT 0.154 0.156
50% fertilizer +3.5t biochar+50% HYT 0.207 0.205
100%fertilize+ 100% HYT 0.127 0.133
100% fertilizer + 50% HYT 0.170 0.200
50% fertilizer + 100% HYT 0.121 0.122
50% fertilizer + 50% HYT 0.477 0.386
100%fertilizer+7t biochar+ 100%HYT 0.131 0.131
100%fertilizer+3.5t biochar + 100% HYT 0.146 1.610
100%fertilizer+3.5t biochar +50% HYT 0.427 0.428
50%fertilizer+ 7t biochar +50%HYT 0.235 0.201
50%fertilizer+7t biochar+ 50%HYT 0.266 0.268
50%fertilizer+ 3.5t biochar+100%HYT 0.372 0.370
7t biochar +100% HYT 0.465 0.352
50% HYT 0.386 0.393
100% HYT 0.311 0.311
7t biochar +50%HYT 0.358 0.352
3.5t biochar +100% HYT 0.351 0.303
3.5t biochar +50% HYT 0.276 0.277
LSD (P=5%) 0.08 0.09
4.2 Flowering of hot pepper plant
The reproduction of pepper for the seasons was calculated using days to 50% flowering as the
main parameter. The observations made showed that there were no significant differences in the
days to 50% flowering despite the changes that were identified in the various fertilizer
University of Ghana http://ugspace.ug.edu.gh

44
combinations and the control plot. The longest days to flowering was observed in the control
plants (65 days) while the least days to flowering was 53, observed in plants grown with the
fertilizer combinations of 50% fertilizer + 7t biochar + 50% HYT, 100% fertilizer + 100%
fertilizer + 50% HYT, 100% fertilizer + 3.5t biochar + 100% HYT, 50% fertilizer + 3.5t biochar
+ 100% HYT (Table 7).
Table 7: The effect of HYT biofertilizer and biochar on days to 50% flowering of pepper
Treatment Days of 50%
flowering
Control 65
3.5t biochar 55
7t biochar 57
50% fertilizer+7t biochar 62
50%fertilizer+ 3.5t biochar 55
50% fertilizer 60
100% fertilizer+ 7t biochar 57
100%fertilizer + 3.5t biochar 57
100% fertilizer 53
100% fertilizer+ 7t biochar+ 100% HYT 55
50% fertilizer +3.5t biochar+50% HYT 57
100%fertilize+ 100% HYT 57
100% fertilizer + 50% HYT 53
50% fertilizer + 100% HYT 56
50% fertilizer + 50% HYT 54
100%fertilizer+7t biochar+ 100%HYT 56
100%fertilizer+3.5t biochar + 100% HYT 53
100%fertilizer+3.5t biochar +50% HYT 56
50%fertilizer+ 7t biochar +50%HYT 55
50%fertilizer+7t biochar+ 50%HYT 53
50%fertilizer+ 3.5t biochar+100%HYT 53
7t biochar +100% HYT 59
50% HYT 55
100% HYT 56
7t biochar +50%HYT 56
3.5t biochar +100% HYT 55
3.5t biochar +50% HYT
LSD (P=5%)
56
0.075
University of Ghana http://ugspace.ug.edu.gh
45
4.3 Yield and fruit quality parameters of pepper
The use of biochar, HYT biofertilizer and inorganic fertilizer were used with some yield
parameter such as yield per plot and fruit quality parameter for instance shape of lobes, number
of seeds, pericarp thickness, and 100 seeds weights were used to identify the effect of the
fertilizers on the yield of pepper in both seasons.
4.3.1 The effect of HYT biofertilizer and biochar on number of lobes, number of seeds per
fruit, pericarp thickness and 100 seed weight of pepper
The effects of HYT biofertilizers and biochar in association with the inorganic fertilizers on the
fruit quality of pepper were found to be significantly different at a probability of 0.05. Despite
the similarities observed in the number of lobes it was detected that the highest number of lobes
was 4 and the lowest was 3. This was mainly recorded for the fertilizer combinations of HYT
biofertilizer and inorganic fertilizers respectively. For the number of seeds per fruit of pepper,
the lowest number of seeds per fruit of pepper was 25 and this was observed for the fertilizer
combination of 50% fertilizer + 7t biochar + 50% HYT (Table 8). The control, however had
more number of seeds per fruit than the other treatments with an average of 31 seeds/fruit. The
pericarp thickness of pepper ranged from 1.30 cm to 2.60 cm for the various fertilizer
combinations and the control (Table 8). The lowest size pericarp for the treatment combinations
were observed for the control (1.30 cm). The treatment combination with HYT biofertilizer and
the biochar resulted in appreciable increase in pericarp thickness with values ranging between
1.60 cm and 2.22cm. The highest seed weight was observed in the treatment combination of 50
% fertilizer + 50% HYT (0.86 g). The HYT biofertilizer combinations were identified to have
increased the weight of 100 seeds.
University of Ghana http://ugspace.ug.edu.gh
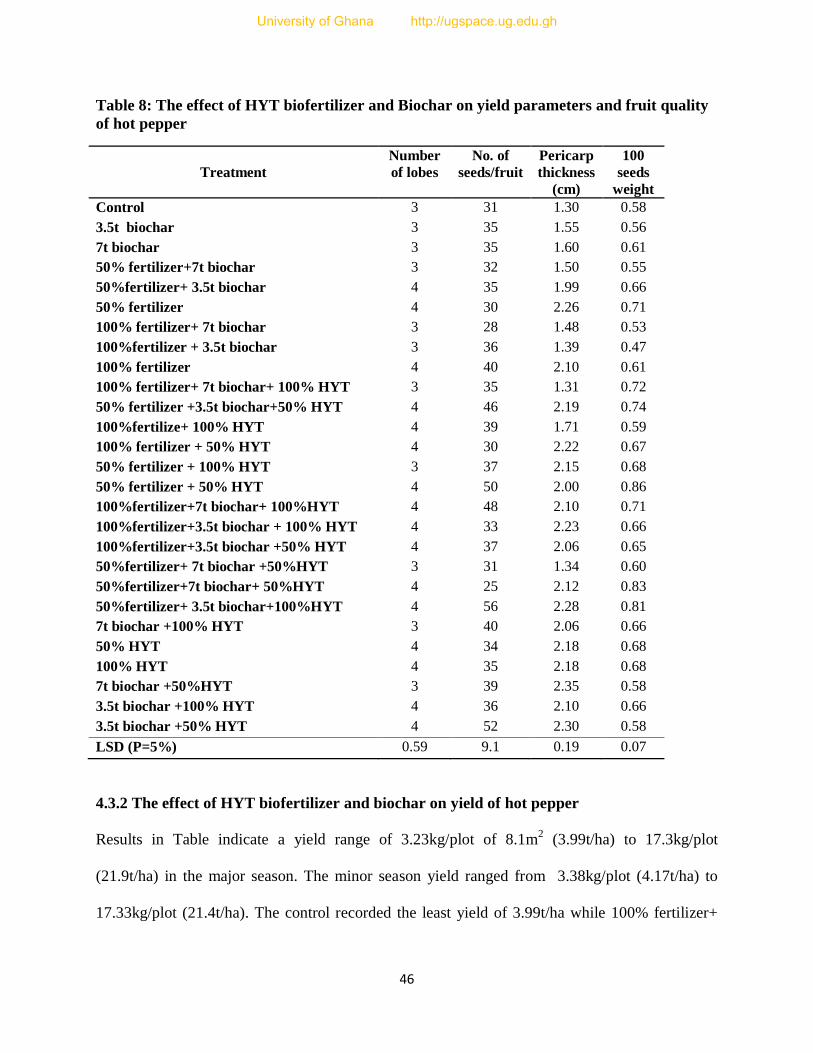
46
Table 8: The effect of HYT biofertilizer and Biochar on yield parameters and fruit quality
of hot pepper
Treatment
Number
of lobes
No. of
seeds/fruit
Pericarp
thickness
(cm)
100
seeds
weight
Control 3 31 1.30 0.58
3.5t biochar 3 35 1.55 0.56
7t biochar 3 35 1.60 0.61
50% fertilizer+7t biochar 3 32 1.50 0.55
50%fertilizer+ 3.5t biochar 4 35 1.99 0.66
50% fertilizer 4 30 2.26 0.71
100% fertilizer+ 7t biochar 3 28 1.48 0.53
100%fertilizer + 3.5t biochar 3 36 1.39 0.47
100% fertilizer 4 40 2.10 0.61
100% fertilizer+ 7t biochar+ 100% HYT 3 35 1.31 0.72
50% fertilizer +3.5t biochar+50% HYT 4 46 2.19 0.74
100%fertilize+ 100% HYT 4 39 1.71 0.59
100% fertilizer + 50% HYT 4 30 2.22 0.67
50% fertilizer + 100% HYT 3 37 2.15 0.68
50% fertilizer + 50% HYT 4 50 2.00 0.86
100%fertilizer+7t biochar+ 100%HYT 4 48 2.10 0.71
100%fertilizer+3.5t biochar + 100% HYT 4 33 2.23 0.66
100%fertilizer+3.5t biochar +50% HYT 4 37 2.06 0.65
50%fertilizer+ 7t biochar +50%HYT 3 31 1.34 0.60
50%fertilizer+7t biochar+ 50%HYT 4 25 2.12 0.83
50%fertilizer+ 3.5t biochar+100%HYT 4 56 2.28 0.81
7t biochar +100% HYT 3 40 2.06 0.66
50% HYT 4 34 2.18 0.68
100% HYT 4 35 2.18 0.68
7t biochar +50%HYT 3 39 2.35 0.58
3.5t biochar +100% HYT 4 36 2.10 0.66
3.5t biochar +50% HYT 4 52 2.30 0.58
LSD (P=5%) 0.59 9.1 0.19 0.07
4.3.2 The effect of HYT biofertilizer and biochar on yield of hot pepper
Results in Table indicate a yield range of 3.23kg/plot of 8.1m2 (3.99t/ha) to 17.3kg/plot
(21.9t/ha) in the major season. The minor season yield ranged from 3.38kg/plot (4.17t/ha) to
17.33kg/plot (21.4t/ha). The control recorded the least yield of 3.99t/ha while 100% fertilizer+
University of Ghana http://ugspace.ug.edu.gh

47
3.5t biochar + 100% HYT and 50% fertilizer + 50% HYT had the highest yield of 21.89t/ha in
the major season (Table 9). In the minor season, the control again had the least yield (4.17t/ha)
and the highest yield was recorded by 50% fertilizer +50% HYT.
Table 9: The effect of HYT biofertilizer and Biochar on yield of hot pepper for major and
minor seasons
Treatment Major Season Minor season
Yield (kg/plot) Yield (t/ha) Yield (kg/plot) Yield (t/ha)
CONTROL 3.23 3.99 3.38 4.17
100% HYT 6.1 7.53 6.9 8.52
50% HYT 8.45 10.43 8.5 10.49
7t biochar 4.63 5.72 8.68 10.72
7t biochar + 50% HYT 6.23 7.69 7.23 8.93
3.5t biochar 5.1 6.30 5.48 6.77
3.5t biochar + 100% HYT 5.2 6.42 5.6 6.91
3.5t biochar + 50% HYT 5.13 6.33 5.93 7.32
100% fertilizer 8.88 10.96 9.18 11.33
100% fertilizer + 100% HYT 8.38 10.35 8.43 10.41
7t biochar + 100% HYT 8.45 10.43 8.48 10.47
100% fertilizer + 7t biochar 6.38 7.88 6.45 7.96
100% fertilizer + 7t biochar +100% HYT 7.68 9.48 6.93 8.56
100% fertilizer + 7t biochar + 50% HYT 8.75 10.80 10.13 12.51
100% Fertilizer + 3.5t biochar 8.73 10.78 8.45 10.43
100% fertilizer + 50% HYT 8.5 10.49 7.75 9.57
100 fertilizer+3.5t biochar + 100% HYT 17.73 21.89 11.28 13.93
100% fertilizer + 3.5t biochar + 50%HYT 12.05 14.88 11.73 14.48
50% fertilizer 7.2 8.89 7.1 8.77
50% fertilizer+ 100% HYT 10.48 12.94 10 12.35
50% fertilizer + 50% HYT 17.73 21.89 17.33 21.40
50% fertilizer + 7t biochar 5.4 6.67 5.25 6.48
50% fertilizer + 7t biochar + 100% HYT 10.75 13.27 8.98 11.09
50% fertilizer + 7tbiochar+ 50% HYT 8.15 10.06 8.5 10.49
50% fertilizer + 3.5t biochar 6.38 7.88 6.53 8.06
50% fertilizer + 3.5t biochar + 100% HYT 9.45 11.67 9.85 12.16
50% fertilizer + 3.5t biochar + 50% HYT 8.18 10.10 8.08 9.98
LSD (P=5%) 0.58 3.85 0.69 2.12
University of Ghana http://ugspace.ug.edu.gh

48
4.4 Soil and plant nutrients parameters
The plant and soil nutrients determined included calcium, potassium, magnesium, nitrogen and
phosphorus.
4.4.1. The effect of HYT biofertilizer and biochar on plant nutrients
The effect of HYT biofertilizer and biochar on the plant nutrients were identified to differed
among the various treatments. It was observed that there were significant differences for the
various plant nutrients. Calcium had a range of contents from 2.12 ppm to 12.72 ppm for
fertilizer combinations of 100% fertilizer +7t biochar + 100% HYT and 3.5t biochar + 100%
HYT, respectively as seen in Table 10. Potassium on the other hand ranged from 14.68 ppm to
41. 20 ppm for fertilizer combinations of 50% fertilizer + 7t biochar + 50% HYT and 7t biochar
+ 100% HYT respectively. Magnesium was observed to show larger range of nutrient content
from 2.78 ppm to 9.18 ppm for fertilizer combinations of 50% fertilizer + 3.5t biochar and 100%
fertilizer + 3.5t biochar + 100% HYT respectively. The nitrogen content in the plants was
observed to have minimal differences. However the differences were significant. They ranged
from 0.99 ppm to 2.12 ppm for fertilizer combinations of 7t biochar and 50% fertilizer + 7t
biochar+ 50% HYT respectively. The last nutrient content that was observed from the hot pepper
was phosphorus; it also ranged from 2.83 ppm to 7.43 ppm for the fertilizer combinations of 7t
biochar +50% HYT and 100% fertilizer +100% HYT respectively.
University of Ghana http://ugspace.ug.edu.gh

49
Table 10: The effect of HYT biofertilizer and Biochar the amount of hot pepper plant
nutrients
Treatment
Plant
Nitrogen
Plant
Phosphorus
Plant
Potassium
Plant
Calcium
Plant
Magnesium
N
(ppm)
P
(ppm)
K
(ppm)
Ca
(ppm)
Mg
(ppm)
Control 1.26 4.60 25.26 9.64 7.35
3.5t biochar 1.34 3.55 18.68 2.78 5.69
7t biochar 0.99 3.68 16.25 12.12 6.54
50% fertilizer+7t biochar 1.13 3.69 17.48 9.99 4.98
50%fertilizer+ 3.5t biochar 1.23 2.85 26.30 3.16 2.78
50% fertilizer 1.57 5.38 35.10 7.16 5.28
100% fertilizer+ 7t biochar 1.05 3.69 27.68 7.14 6.44
100%fertilizer + 3.5t biochar 1.32 4.07 30.30 10.23 5.97
100% fertilizer 1.44 3.52 40.45 4.42 4.93
100% fertilizer+ 7t biochar+ 100% HYT 1.24 3.49 36.00 7.69 7.21
50% fertilizer +3.5t biochar+50% HYT 1.08 2.88 27.50 8.56 5.24
100%fertilizer+ 100% HYT 1.73 7.43 22.83 8.66 7.09
100% fertilizer + 50% HYT 1.64 3.33 35.30 6.99 6.86
50% fertilizer + 100% HYT 1.68 2.86 30.60 8.48 5.22
50% fertilizer + 50% HYT 1.96 3.69 37.50 10.55 8.60
100%fertilizer+7t biochar+ 100%HYT 1.01 4.02 22.83 2.12 7.66
100%fertilizer+3.5t biochar + 100% HYT 1.25 4.05 35.30 11.33 9.18
100%fertilizer+3.5t biochar +50% HYT 1.71 4.41 30.60 4.22 4.99
50%fertilizer+ 7t biochar +50%HYT 1.19 3.69 14.68 9.56 6.03
50%fertilizer+7t biochar+ 50%HYT 2.12 4.14 34.60 8.34 6.59
50%fertilizer+ 3.5t biochar+100%HYT 1.98 4.47 37.70 4.32 6.86
7t biochar +100% HYT 1.50 4.22 41.20 5.27 8.53
50% HYT 1.13 4.75 31.43 3.14 4.19
100% HYT 1.33 4.96 34.40 10.25 7.24
7t biochar +50%HYT 1.14 2.83 19.14 10.87 7.12
3.5t biochar +100% HYT 1.31 2.94 17.73 12.72 5.85
3.5t biochar +50% HYT 1.05 3.75 35.20 5.59 5.85
LSD (P=5%) 0.07913 0.06993 1.3631 0.1694 0.7077
4.4.2 The effect of HYT biofertilizer and biochar on soil nutrients
The effect of HYT biofertilizers and biochar on the soil nutrients was observed to be different.
From Table 11, there were significant differences for the various soil nutrients. Generally, there
were high amounts of the various nutrients in the soil as compared to the plants. Calcium content
University of Ghana http://ugspace.ug.edu.gh

50
in soil ranged from 10.55 ppm to 67.61 ppm for fertilizer combinations of 50% fertilizer+7t
biochar and 3.5t biochar +50% HYT respectively (Table 11). Potassium on the other hand
ranged from 9.08 ppm to 36.30 ppm for the different fertilizer combinations. Magnesium
constituted a large range of nutrient contents ranging from 18.17 ppm to 37.51 ppm for the
fertilizer combinations. Nitrogen content of the soil was not however much different despite the
fact that the differences were with contents ranging from 0.67 ppm to 2.13 ppm. Phosphorus
ranged from 0.25 ppm to 18.24 ppm for the fertilizer combinations of 7t biochar and 100%
fertilizer + 7t biochar + 100% HYT respectively. The HYT bio fertilizers had a considerable
effect on the nutrient content in the soil as seen in Table 11.
University of Ghana http://ugspace.ug.edu.gh
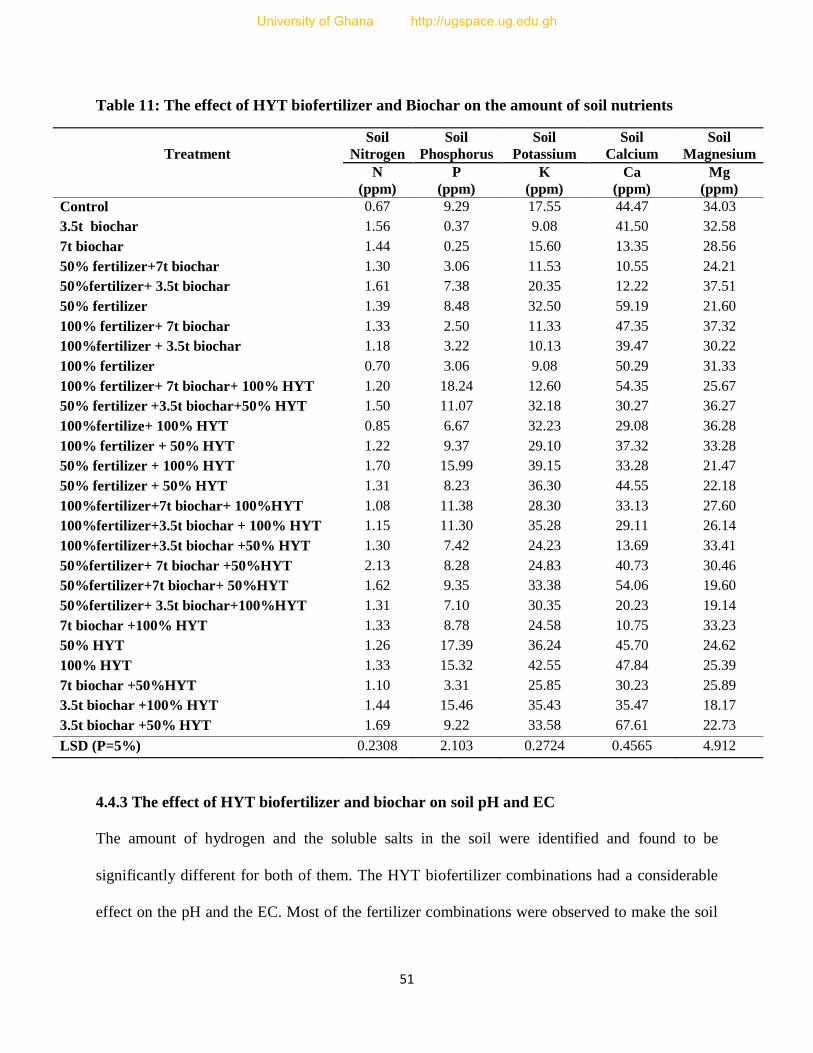
51
Table 11: The effect of HYT biofertilizer and Biochar on the amount of soil nutrients
Treatment
Soil
Nitrogen
Soil
Phosphorus
Soil
Potassium
Soil
Calcium
Soil
Magnesium
N
(ppm)
P
(ppm)
K
(ppm)
Ca
(ppm)
Mg
(ppm)
Control 0.67 9.29 17.55 44.47 34.03
3.5t biochar 1.56 0.37 9.08 41.50 32.58
7t biochar 1.44 0.25 15.60 13.35 28.56
50% fertilizer+7t biochar 1.30 3.06 11.53 10.55 24.21
50%fertilizer+ 3.5t biochar 1.61 7.38 20.35 12.22 37.51
50% fertilizer 1.39 8.48 32.50 59.19 21.60
100% fertilizer+ 7t biochar 1.33 2.50 11.33 47.35 37.32
100%fertilizer + 3.5t biochar 1.18 3.22 10.13 39.47 30.22
100% fertilizer 0.70 3.06 9.08 50.29 31.33
100% fertilizer+ 7t biochar+ 100% HYT 1.20 18.24 12.60 54.35 25.67
50% fertilizer +3.5t biochar+50% HYT 1.50 11.07 32.18 30.27 36.27
100%fertilize+ 100% HYT 0.85 6.67 32.23 29.08 36.28
100% fertilizer + 50% HYT 1.22 9.37 29.10 37.32 33.28
50% fertilizer + 100% HYT 1.70 15.99 39.15 33.28 21.47
50% fertilizer + 50% HYT 1.31 8.23 36.30 44.55 22.18
100%fertilizer+7t biochar+ 100%HYT 1.08 11.38 28.30 33.13 27.60
100%fertilizer+3.5t biochar + 100% HYT 1.15 11.30 35.28 29.11 26.14
100%fertilizer+3.5t biochar +50% HYT 1.30 7.42 24.23 13.69 33.41
50%fertilizer+ 7t biochar +50%HYT 2.13 8.28 24.83 40.73 30.46
50%fertilizer+7t biochar+ 50%HYT 1.62 9.35 33.38 54.06 19.60
50%fertilizer+ 3.5t biochar+100%HYT 1.31 7.10 30.35 20.23 19.14
7t biochar +100% HYT 1.33 8.78 24.58 10.75 33.23
50% HYT 1.26 17.39 36.24 45.70 24.62
100% HYT 1.33 15.32 42.55 47.84 25.39
7t biochar +50%HYT 1.10 3.31 25.85 30.23 25.89
3.5t biochar +100% HYT 1.44 15.46 35.43 35.47 18.17
3.5t biochar +50% HYT 1.69 9.22 33.58 67.61 22.73
LSD (P=5%) 0.2308 2.103 0.2724 0.4565 4.912
4.4.3 The effect of HYT biofertilizer and biochar on soil pH and EC
The amount of hydrogen and the soluble salts in the soil were identified and found to be
significantly different for both of them. The HYT biofertilizer combinations had a considerable
effect on the pH and the EC. Most of the fertilizer combinations were observed to make the soil
University of Ghana http://ugspace.ug.edu.gh
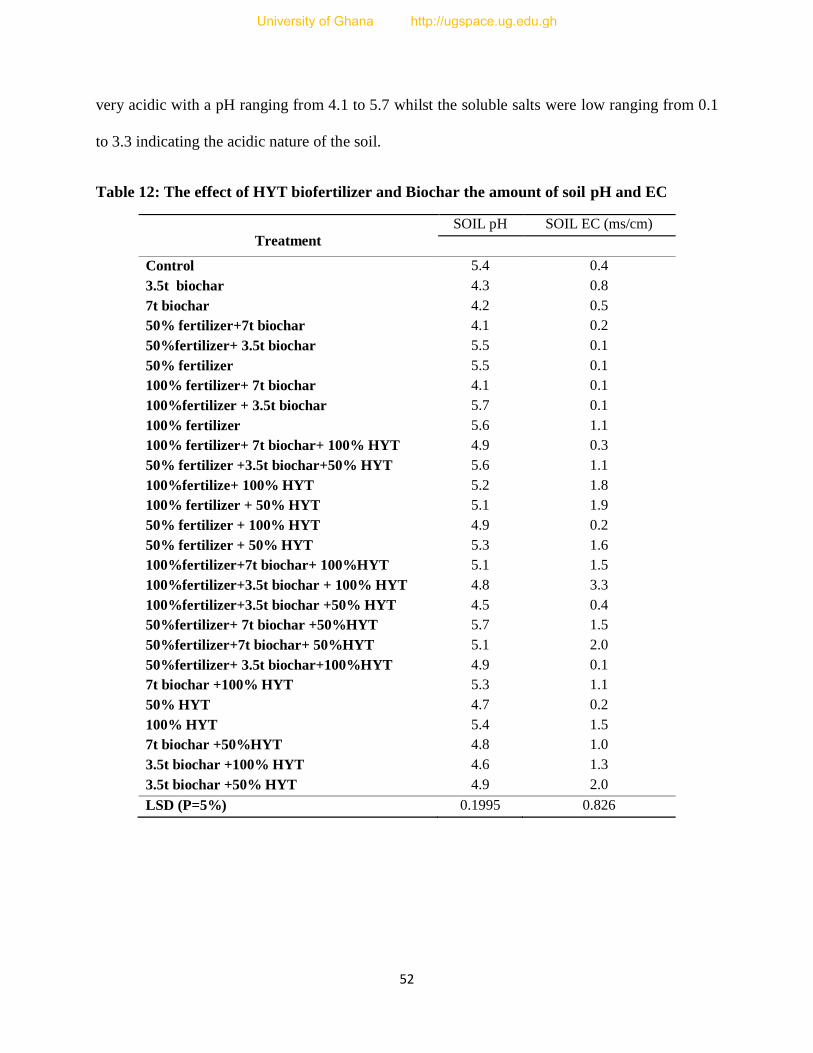
52
very acidic with a pH ranging from 4.1 to 5.7 whilst the soluble salts were low ranging from 0.1
to 3.3 indicating the acidic nature of the soil.
Table 12: The effect of HYT biofertilizer and Biochar the amount of soil pH and EC
Treatment
SOIL pH SOIL EC (ms/cm)
Control 5.4 0.4
3.5t biochar 4.3 0.8
7t biochar 4.2 0.5
50% fertilizer+7t biochar 4.1 0.2
50%fertilizer+ 3.5t biochar 5.5 0.1
50% fertilizer 5.5 0.1
100% fertilizer+ 7t biochar 4.1 0.1
100%fertilizer + 3.5t biochar 5.7 0.1
100% fertilizer 5.6 1.1
100% fertilizer+ 7t biochar+ 100% HYT 4.9 0.3
50% fertilizer +3.5t biochar+50% HYT 5.6 1.1
100%fertilize+ 100% HYT 5.2 1.8
100% fertilizer + 50% HYT 5.1 1.9
50% fertilizer + 100% HYT 4.9 0.2
50% fertilizer + 50% HYT 5.3 1.6
100%fertilizer+7t biochar+ 100%HYT 5.1 1.5
100%fertilizer+3.5t biochar + 100% HYT 4.8 3.3
100%fertilizer+3.5t biochar +50% HYT 4.5 0.4
50%fertilizer+ 7t biochar +50%HYT 5.7 1.5
50%fertilizer+7t biochar+ 50%HYT 5.1 2.0
50%fertilizer+ 3.5t biochar+100%HYT 4.9 0.1
7t biochar +100% HYT 5.3 1.1
50% HYT 4.7 0.2
100% HYT 5.4 1.5
7t biochar +50%HYT 4.8 1.0
3.5t biochar +100% HYT 4.6 1.3
3.5t biochar +50% HYT 4.9 2.0
LSD (P=5%) 0.1995 0.826
University of Ghana http://ugspace.ug.edu.gh

53
4.4.4 The effect of HYT biofertilizer and biochar on microbial count
The population of microbes before and after planting was identified to be significantly different
for the various periods of count. Before planting microbial count ranged from 2325 to 17750
whilst that of the counting after planting was determined to be from 1700 to 8400.
Table 13: The effect of HYT biofertilizer and Biochar on microbial count before and after
planting
Treatment
Microbial Count INITIAL
Microbial Count – FINAL
(BEFORE) (AFTER)
Control 5525 7225
3.5t biochar 4600 4525
7t biochar 4475 4300
50% fertilizer+7t biochar 6375 6325
50%fertilizer+ 3.5t biochar 6375 8400
50% fertilizer 8400 4650
100% fertilizer+ 7t biochar 5825 5650
100%fertilizer + 3.5t biochar 2550 3150
100% fertilizer 4575 4450
100% fertilizer+ 7t biochar+ 100% HYT 2400 1800
50% fertilizer +3.5t biochar+50% HYT 15500 5350
100%fertilize+ 100% HYT 3650 2150
100% fertilizer + 50% HYT 5350 8150
50% fertilizer + 100% HYT 4350 3825
50% fertilizer + 50% HYT 4900 2575
100%fertilizer+7t biochar+ 100%HYT 2750 2550
100%fertilizer+3.5t biochar + 100% HYT 16756 4575
100%fertilizer+3.5t biochar +50% HYT 17750 4200
50%fertilizer+ 7t biochar +50%HYT 4200 3800
50%fertilizer+7t biochar+ 50%HYT 17000 6550
50%fertilizer+ 3.5t biochar+100%HYT 11250 2625
7t biochar +100% HYT 5050 4650
50% HYT 6900 1600
100% HYT 4025 4275
7t biochar +50%HYT 7900 8400
3.5t biochar +100% HYT 5500 1700
3.5t biochar +50% HYT 2325 4650
LSD (P=5%) 805.9 156.5
University of Ghana http://ugspace.ug.edu.gh

54
CHAPTER FIVE
DISCUSSION
5.1 HYT biofertilizer and biochar on vegetative parameters of hot pepper
The study of the evaluation of HYT biofertilizers and biochar on the vegetative parameters on
hot pepper showed an appreciable variation in the various factors under study. The vegetative
differences that were observed in the hot pepper for the application of the various fertilizer
combinations were observed to be significantly different for the study in plant height, stem
diameter and number of leaves (Tables 3,4 and5) at the various seasons (Major and minor).
These differences were also observed in Kiran et al., (2010). In the study, Kiran et al., (2010)
observed that there were significant increases in these growth parameters by plant due to increase
in the fertilizer levels. It could be attributed to the increased uptake of nutrient in the plants
leading to enhanced chlorophyll content and carbohydrate synthesis. But in this present study
the changes were due to the fertilizer combinations in the biofertilizers and biochar. This was
also confirmed by Jagadeesha (2008) who also observed that there was a considerable change in
the various vegetative parameters. The study continues to show that recommended dose of
fertilizer alone recorded significantly higher values for growth parameters. It could be attributed
to the quick and readily availability of major nutrients like N, P and K to plants at earlier stages
of plant growth. While, organic manures recorded significantly lower values for growth
parameters because of slower release of nutrients to the plants.
These results are supported by the report of Sharma (1995) in tomato, Wange and Kale (2004) in
brinjal. Satesh Kumar and Sharma (2006) studied the effect of different methods of biofertilizer
application in tomato seed production. They used four biofertilizers, namely Azotobacter,
University of Ghana http://ugspace.ug.edu.gh

55
Azospirillum, Pseudomonas and vesicular arbuscular mycorrhiza (VAM), application of these
biofertilizers were done with three methods i.e., nursery soil treatment, seedling treatment and
field soil treatment, individually and in combinations. The study revealed that when Azotobacter
was applied to nursery, there was a maximum increase in the number of fruits per plant (19.23),
fruit yield per plant (1109 g) and per hectare (356.9 g), 1000 seed weight (3.63 g), seed yield per
plant (4.58 g) and per hectare (152.70 kg).
Plant yield is the ultimate manifestation of morphological, physiological, biochemical processes
and growth parameters and is considered to result from trapping and conversion of solar energy
efficiently. Improvement in yield can be realized in two ways i.e. by adopting the existing
varieties to grow better in their environment or be altering the relative proportion of different
plant parts so as to increase the yield of economically important parts (Humphries, 1969).
5.2 HYT biofertilizer and biochar on the yield of hot pepper
In the present study, the results have indicated that all measured traits of yield and fruits quality
of hot pepper were significantly affected by using the various fertilizer combinations of
biofertilizer and biochar. Interactions were significant for all the parameters. Increase in fruit
yield and its parameters can be attributed to the increase in the number of leaves which worked
as an efficient photosynthesis structure and produced high amount of carbohydrates in the plant
system. Similar findings were also reported by Nanthakumar and Veeraraghathatham (2001) and
Anburani et al., (2002) in brinjal. Increase in seed yield and its components may be ascribed to
increase in seed weight per fruit, as a result of improvement in seed number to adequate mother
plant nutrition. Further, it could be due to influence of other yield attributes such as number of
University of Ghana http://ugspace.ug.edu.gh

56
branches per plant, number of fruits per plant, increase in fruit weight, fruit length, fruit diameter
and fruit yield per plant.
The results are in agreement with the findings of Shashidhara (2000) in chilli. The increase in the
fruit yield and its parameters may be due to more number of flowers per plant, which is one of
the most vital attributes, was produced due to the combined application of inorganic fertilizers
and biofertilizers. The significant differences in seed yield per plant were noticed in treatment
and biofertilizers, where the interaction effect was also found to be significant (Table 8).
Significantly higher seed yield per plant was noticed in biofertilizers application as compared to
without biofertilizers application. The 100 seed weight, the number of lobes, number of seeds per
fruits and pericarp thickness had a significant increase in the quality and quantity respectively.
This was confirmed in the work done by Sharma, (2005).
5.3 Effect of HYT biofertilizer and biochar on the amount of plant and soil nutrients (N, P,
K, Mg and Ca) on hot pepper
Nutrient efficiency is a measure of how much crop is produced per unit of nutrient supplied. The
higher the efficiency, the more products is produced per unit of nutrient. The quality of soil
affects nutrient use efficiency. Soil quality is measured or evaluated by a number of indicators.
Data concerning the effect of mineral N, P, K, Mg and Ca levels on vegetative growth
parameters of hot pepper plants that is the amount that is present in the soil and the plant (Table
10 and 11). The present result indicated that application of N, P, K, Mg and Ca levels
significantly increased in both the soil and plant for the various fertilizer combinations especially
for HYT biofertilizer and biochar. The necessity of N, P and K for growth has been demonstrated
by several investigators, since nitrogen supply was desirable for vegetative growth, dry matter
University of Ghana http://ugspace.ug.edu.gh

57
accumulation as well as nutrient uptake by potato plants (El- Ghamriny and Saeed, 2007a). The
increase in plant growth may be attributed to the beneficial effects of nitrogen on stimulating the
meristematic activity for producing more tissues and organs, since it plays major roles in the
synthesis of structural proteins and other several macro molecules, in addition to its vital
contribution in several biochemical processes that related to plant growth (Marschner, 1995).
Also, nitrogen may be contributed with the activation of cell division and cell elongation
(Medani et al., 2000). The promating effect of growth parameters could be attributed to
phosphorus as structural part of high energy compounds (Sarg, 2004). It is also a constituent of
the cell nucleus and is essential for cell division and the meristematic tissues development
(Frank, 2002). The obtained results of growth parameters in this investigation are in good
agreement with those obtained by El-Arquan et al., (2002), El- Ghamriny and Saeed (2007a),
Kamel et al., (2008), Rafla et al., (2009) on different crops.
University of Ghana http://ugspace.ug.edu.gh

58
CHAPTER SIX
CONCLUSION AND RECOMMENDATION
6.1 Conclusion and Recommendation
This work has indicted that the application of inorganic fertilizer, HYT biofertilizer and biochar
on hot pepper resulted in significant difference in the vegetative growth, yield and nutrient
quality for both the soil and the plant.
The study has shown marked differences in yield in the application of biochar and biofertilizers
on yield of hot pepper. The results indicated a yield of 3.99t/ha for the control and 21.89t for
100% fertilizer + 3.5t biochar + 100% HYT and 50% fertilizer + 50% HYT in the major season.
In the minor season, a combination of 50% fertilizer +50% HYT gave the highest yield
(21.4t/ha) and the control the least yield (4.17t/ha).
The combination of inorganic, biochar and biofertilizers resulted in higher yields than pepper
yields achieved in Ghana (8.0t/ha).
From the study it can be recommended that 50% -100% rate of NPK fertilizer, biochar and HYT
biofertilizers be used by farmers due to its higher yields.
University of Ghana http://ugspace.ug.edu.gh

59
REFERENCES
Abd El-Hakeem S.A.E. A. S. (2003). Response of sweet pepper crop to organic and biofertilizer
application. Master of Science in Agricultural Science Horticulture (Vegetable Crops)
Department of Horticulture, Faculty of Agriculture, Moshtohor, Zagazig University
(Benha Branch)
Adu, E.F., (2012). Bioefficacy evaluation of High Yield Technology (HYT) biofertilizers and
Biochar on the growth yield and fruit quality of tomato (Solanum lycopersicon L)
Agrinos (2011) Activation protocol. Technical paper 1-3
Agee, J. K. (1996). Fire Ecology of Pacific Northwest Forests. Island Press 505 p.
Ahmed, A. B. Z. (2009). Growth optimization of potassium solubilizing bacteria isolated from
biofertilizer.
Amirthalingam, S., (1988) Studies on the effect of Azospirillum, nitrogen and NAA on growth
and yield of chilli. South Indian Horticulture, 36 : 218.
Amburani, A., and Manivannan, K. (2002). Effect of integrated nutrient management on
growth in brinjal (Solanum melongena) CV Annamalai South Indian Horticulture 50 (4-
6): 377- 386.
Amonette J. E. and Joseph S. (2009). Characteristics of\biochar: Microchemical properties. In:
Lehmann JL, Joseph S. ed. Biochar for Environmental Management, Science and
Technology, London: Earthscan, 2009, 33-52.
University of Ghana http://ugspace.ug.edu.gh

60
AOAC (1994). Official Methods of Analysis. Association of Official Analytical Chemists.
1111 North 19th Street, Suite 20, 16th Edition. Arlington, Virginia, USA. 22209.
Arisha, H.M. and Bradisi, A., (1999). Effect of mineral fertilizers and organic fertilizers on
growth, yield and quality of potato under sandy soil conditions. Zagazig J. Agric Res.,
26: 391–405.
Babli, M. (2007). Effect of organic and inorganic biofertilizers on the productivity potential in
carrot (Daucus carota L). Master of Science (Agriculture) Thesis Submitted to the
University of Agricultural Sciences, Dharwad.
Badr, L.A.A. and Fekry,W.A., (1998). Effect of intercropping and doses of fertilization on
growth and productivity of taro and cucumber plants. 1-vegetative growth and chemical
constituents of foliage. Zagazig J Agric Res., 25: 1087–101
Balaraj, R. (1999). Investigations in seed technological aspects in chilli (Capsicum annuum L.).
Ph.D. Thesis, University of Agricultural Sciences Dharad.
Berke, T.I.I. Black.N.S. Talekar. J.F. Wang,P. Gniffke.S.K. Green, T.C.Wang and
R.Morris, (2005). Suggested cultural practices for chili pepper. International
cooperators guide. AVRDC. Pub#05620. www.avrdc..org/. Accessed on 12/10/2009.
Blackwell, P., Krull, E., Butler, G., Herbert, A., Solaiman, Z., (2010). Effect of banded
biochar on dry land wheat production and fertilizer use in south-western Austrian: an
agronomic and economic perspective. Austrian Journal of Soil Research 48: 531-545.
University of Ghana http://ugspace.ug.edu.gh
61
Blackwell, P., Riethmuller, G., Collins, M. (2009). Biochar application to soil (Chapter 12) in
J. Lehmann and S. Joseph (Eds.), Biochar for Environmental Management: Sccience
and Technology, Earthscan, London, UK pp 207.
Bokhtiar, S. M., Paul, G. C., and Alam, K. M., (2008). Effects of Organic and Inorganic
Fertilizer on Growth,Yield, and Juice Quality and Residual Effects on Ratoon Crops of
Sugarcane. Journal of Plant Nutrition, 1532-4087, 31 (10):1832 – 1843. Bosland, P.W.
(1992). Chiles: a diverse crop. Hort. Technology 2: 6-10
Bonus, K.O., Owusu, E. O., Nkansah, G.O., Oppong-Konadu, E. and Adu-Dapah, H.
(2003). Morphological characterization of hot pepper (Capsicum sp.). Germplasm in
Ghana. Ghana J. Hortic. 2:17-23
Bosland, P.W. (1992). Chiles: a diverse crop. Hort. Technology 2:6-10
Bosland, P.W. and Votava, E.J. (2000). Peppers, Vegetables and Spices (Crop production
sciencein Horticulture) CABI; 0851993354
Bourke, J., Manley-Harris, M., Fushimi, C., Dowali, K., Nunoura, T., and Antal, M. J. Jr.
(2007). Do all carbonized charcoals have the same chemical structure? 2. A model of
the chemical structure of carbonized charcoal. Industrial and Engineering Chemistry
Research 46: 5954-5967.
Bouyoucos G. J. (1962). Hydrometer methods improved for making particle sizeanalysis of
siols. Soil Science Society of America Proceeding 26: 464-465.
Brady, N. C. and Weill, R. R. (2004). Elements of the Nature and Properties of Soils 2nd
Ed.
Pearson Prentice Hall. Upper Saddle River NJ. pp. 111- 112.
University of Ghana http://ugspace.ug.edu.gh

62
Chan, K. Y and Xu, Z; (2009). Biochar: nutrient properties and their enhancement. In:
Lehmann, J; Joseph, S. (Eds), Biochar for Environmental Management: Science and
Technology. Earthscan, London.
Chan, K.Y., Van Zwieten, L., Meszaros, I., Downie, A., and Joseph, S. (2007). Agronomic
values of greenwaste biochar as a soil amendment. Austrailian Journal of Soil Research
45: 629 634.
Chandrashekar, B.S. (2003). Studies on mineral phosphate solubilizing fungifungi from
vertisols of Northern Kamataka and other Biofertilizer potential. Ph. D. Thesis, Univ.
Agric. Sci., Dharwad, Kamataka, India.
Cheng, C. H., Lehmann, J., and Engelhard, M.H. (2008). Natural oxidation of black carbon in
soils: Changes in molecular from surface charge along a climosequence. Geochem.
Cosmochim. Acta 72: 1598- 1610.
Cheng, C.H., Lehmann, J., Thies, J.E., Burton, S.D., and Englhard, M.H. (2006). Oxidation
of black carbon by biotic processes. Organic Geochemistry. 37: 1477- 1488
Chindo, P. S and F. A. Khan (1986): Effect of organic amendment with poultry manure on the
damage caused by the root-knot nematode on tomato.Nematology Network
Newsletter,3:30-33.
Cohen-Ofri, I., Popovitz-Biro, R., and weiner, S. (2007). Structural characterization of modern
and fossilized charcoal produced in natural fires as determined by using electron energy
loss spectroscopy. Chemistry – A European Journal 13: 2306- 2310.
University of Ghana http://ugspace.ug.edu.gh

63
Cotter, D.J. (1986). Preplant broadcast and banded phosphate effects on growth and yield of
long green mildly pungency Chile. P 269 In:Wein, H.C (eds). Peppers. The physiology
of vegetable crops. CAB international, Oxon, UK.
Crockford L. and R. Nowell (1956). “Laboratory manual of Physical Chemistry”. John Wiley
and Sons N.Y. Experiments 31 and 32: 58 – 59.
Damke, M.M., Kawarkhe, V.J. and Patil, C.O., (1988). Effect of phosphorus and potassium
on growth and yield of chilli. Punjabrao Krishi Vidhyapeeth. Res. J., 12: 110-114
Dauda, S.N., Ajayi, F.A. and Ndor, E., (2008). Growth and yield of water melon (Citrulus
lanatus) as affected by poultry manure application. J. Agric. Soc. Sci., 4: 121–124.
Deka, B. C., Baro, G. C. and Shadequi, A., (1996) Effect of Azospirillum on growth and yield
of chilli (Capsicum annuum L.) cv. Pusa Jwala. Haryana Journal of Horticultural
Science, 325:44-46.
Deore, G.B., Limaye, A.S., Shinde, B.M. and Laware, S.L. (2010). Effect of novel organic
liquid fertilizer on growth and yield chilli (Capsicum annuum L.). Society of Applied
Sciences: Asian J. Exp. Biol. Sci. Spl: 15-19
De Witt, D. and Gerlach. (1990). The whole Chilie pepper book. Little, Brown, and Co., Boston
Downie, A; Crosky, A; Munroe, P; (2009). Physical properties of biochar. In Lehmann, J;
Joseph, S; (Eds), Biochar for Environmental Management: Science and Technology.
Earthscan, London, pp 13-32.
El-Arquan, M.Y, El-Hamdi K. H, Saleem E.M , El-Tantawy I.M (2002). Nutrient uptake of
sugar beet as affected by NPK fertilization and soil salinity levels. Egypt. J. Soil Sci.,
42:783-797.
University of Ghana http://ugspace.ug.edu.gh

64
El-Ghamriny, E.A, Saeed M.N A (2007a). Effect of irrigation intervals, Mineral fertilizers and
biofertilizers on potato plants grown under sandy soil conditions. I-Growth, water
relations, chemical contents and leaf anatomy. Egypt. J. Appl. Sci., 22: 480-511.
Esiken, A., Ercisli, S., Karlidag, H., and Sahim, F. (2005). Potential use of plant growth
promoting rhizobacteria (PGPR) in organic apricot production. In: Proceedings of the
International Scientific Conference of Environmentally Friendly Fruit Growing, Tartu-
Estonia pp 90-97.
Esittken, A. Pirlak, L. Turan, M. and Sahin, F. (2006). Effect of floral and foliar application
of plant growth promoting rhizobacteria (PGPR) on yield, growth and nutrition of sweet
cherry. Scientia Horticulturae 110: 324-327.
FAO/UNESCO, (1990). Soil Map of the World. Revised Legends. World Soils Resource
Repot. Acta Horticulturae, 439: 449-456
Frank, W.S. (2002). The phosphate uptake mechanism, Plant Soil, 245:105-114.
Geleta, L. (1998). Genetic variability and association study for yield, quality and other traits of
yield of hot pepper (Capsicum species). M.Sc. thesis (Hort.) Hramaya University.
Glasser, B., Lehmann, J., and Zech, W. (2002). Ameliorating physical and chemical properties
of highly weathered soils in the tropics with charcoal- a review, Biology and Fertility of
Soils. 35:219-230
Grubben, H.G., Denton, O.A., Messiaen, C.M., Schippers, R.R ., Lemaneus, R.H. and
Oyen, L.P. (2004). Plant Resources of Tropical Africa 2 PROTA Foundation,
Netherland, pp: 27-29.
University of Ghana http://ugspace.ug.edu.gh
65
Hanchinamani, D.S., (1980). Response of “Pusa Kranti” brinjal to varying schedules of
fertilizers and spacing. M. Sc. (Agric) Thesis. University of Agricultural Sciences,
Bangalore.
Heiser, C.B. (1976). Peppers Capsicum (Solanaceae) In N.W. Simmonds (eds.), The evolution
of crop plants. Longman Press. London.
Hoffman, P.G., M.C. Lego, and W.G. Galetto. (1983). Separation and quantitation of red
pepper major heat principles by reverse-phase high pressure liquid chromatography. J.
Food Chem. 31:1326-1330.
Humphries, E. C., (1969). The dependence of photosynthesis on carbohydrates sinks. Current
concepts proceedings of international symposium on tropical root crops, Univ. West
Indies, II, II, pp. 34-35 Irvine, F.R. (1979) West African Crops. Oxford University
Press, Walton Street, Oxford OX2 6DP)
I-San Lin. R. (1994). Pharmacological properties and medical use of pepper (P.nigrum. L.). In:
Caralambous G. 1994. (Ed), Spices, herbs and edible fungi. Elsevier Science B.V. pp.
469-479.
Irvine, F.R. (1979) West African Crops Oxford University Press, Walton Street, Oxford OX2
6DP
Jackson. M., L., (1973). Soil and Chemical Analysis, Prentice Hall of India Private Limited
New Delhi.
Jagadeesha, V. (2008). Effect of organic manures and Biofertilizers on growth, seed yield and
Quality in tomato (Lycopersicon esculentum Mill.) Cv. Megha. Department of seed
University of Ghana http://ugspace.ug.edu.gh

66
science and technology, College of Agriculture, Dharwad University of Agricultural
Sciences Dharwad-580 005. August.
Jain, D. K. and D. G. Patriquin (1985): Characterization of a substance produced by
Azospirillum which causes branching of wheat root hairs. Can. J. Microbiol. 31:206-210.
Jeevansab (2000). Effect of nutrient sources on growth, yield and quality of capsicum cv.
California Wonder grown under different environments. M. Sc. (Agri.) Thesis, Univ.
Agric. Sci., Dharwad, Karnataka, India.
Joseph, S.D., Camps-Arbestian, M., Lin, Y; Munroe, P., Chia, P.H., Hook, J., Van
Zwienten, L; Kimber, S., Kimber, S., Cowie, A., Singh, B.P., Lehmann, J., Foidl,
N., Smemik, R.J., & Amonette, J.E., (2010). An investigation into the reactions of
biochar in soil. Australian Journal of Soil Research 48, 501-515.
Kamel, N.H., Mokebel, E.M.M., Saeed, M.N.A., & Desoky, E.M. (2008). physiological and
anatomical effects of biofertilizers in combination with mineral NPK on wheat plant.
Egypt. J. Appl. Sci., 23: 446-475.
Kiran, J. (2006). Effect of fertilizer, biofertilizer and micronutrients on seed yield and quality of
Brinjal (Solanum melongena L). Master of Science Thesis submitted to the University of
Agricultural Sciences. Dharward
Kiran, J.B.S. Vyakaranahal, S.D. Raikar, G.H. Ravikumar and V.K. Deshpande, (2010).
Seed yield and quality of brinjal as influenced by crop nutrition Indian J. Agric. Res., 44
(1) : 1 - 7,
Kochhar, S.L. (1981). Tropical crops: a textbook of economic botany. Pub Macmillan
Publishers Ltd. 467p
University of Ghana http://ugspace.ug.edu.gh

67
Kolb T.E., Agee, J.K., Fule P.Z., McDowell, N.G., Pearson, K., Sala, A. and Waring, R.H.
(2007). Perpetuating old ponderosa pine. Forest Ecology and Management 249: 141–157.
Kondapa, D., Radder, B. M., Patil, P. L., Hebsur, N. S. and Alagundagi, S. C., (2009). Effect
of integrated nutrient management on growth, yield and economics of chilli (Cv. Byadgi
dabbi) in a vertisol. Kamataka J. Agric. Sci., 22(2) : 438-440.
Kumar, V., Behl, R.K., and Narula, N. (2001). Establishment of phosphate solubilising strains
of Azotobacter chroococum in the rhizosphere and their effect on wheat cultivars under
greenhouse conditions. Microbiol Res. Vol.156: 87-93
Labeena, P. (2001). Effects of interaction between Arbuscular mycorrhizae and Meloidogyne
incognita on tomato. M. Sc. (Agri.) Thesis, Univ. Agric. Sci., Dharwad, Karnataka, India.
Lehmann, J., (2007). Bioenergy in the black. Frontiers in Ecology and the Environment, vol 5,
pp 381-387.
Lehmann, J. and Joseph, S. (eds.) (2009). Biochar for Environmental Management: Science
and Technology, Earthscan, London and Sterling, VA 416p.
Lehmann, J. and Rondon, M. (2006). Biochar Sequestration in Terrestrial Ecosystems –A
Review Mitigation and Adaptation Strategies for Global Change 11: 395-419.
Lehmann, J., Gaut, J., Rondon, M., (2006). Biochar sequestration in terrestrial ecosystems – a
Review Mitigation and Adaptation Strategies for Global Change. 11: 403-427
Lehmann, J., Liang, B., Solomon,D., Lerotic, M., Luizao, F., Kinyangi, F.,
Schafer,T.,Wirick, S. and Jacobsen, C. (2005). Near-edge X-ray absorption fine
structure (NEXAFS) spectroscopy for mapping nano-scale distribution of organic carbon
University of Ghana http://ugspace.ug.edu.gh
68
forms in soil: Application to black carbon particles. Global Biogeochemical Cycles, vol
19, pGB1013
Lehmann, J., da Silva Jr, J.B., Steiner, C., Nehis, T., Zech, W. and Glasser, B. (2003).
Nutrient availability and leaching in an archeological Anthrosol and a Ferrasol of the
Central Amazon basin: Fertilizer, manure and charcoal amendments. Plant and soil 249.
343-357
Liang, B., Lehmann, J., Solomon, D., Kinangi, J., Grossman, J., O’Neil, B., Skjemstad,
J.O., Thies, J., Luizao, F.J., Peterson, J and Nerves, E.G. (2006). Black carbon
increases cation exchange capacity in soils. SSSAJ. 70: 1719-1730.
Lima I. and Marshall W.E. (2005). Ultilization of turkey manure as granular activated carbon:
Physical, chemical and adsorptive properties. Waste management. 25: 726-32.
MacNesh, R.S. (1964). Ancient Mesoamerican civilization. Science . 143: 531-537
Major, J., Lehmann, J., Rondon, M., and Goddale, C. (2010). Fate of soil applied black
carbon; downward migration leaching and soil respiration. Global Change Biology 16,
1366-1379.
Mallanagouda, B., Sulikeri, G.S., Murthy, B.G. and Prathibha, N.C., (1995). Effect of NPK,
FYM and companion crops on growth, yield and yield components of chilli (Capsicum
annuum L.). Advances in Agril. Res. India. 3: 548-569
Marschner, H. (1995). Mineral nutrition of higher plants. 2nd Ed. Academic. Press. London
New York, p. 889.
Martinez V. R. ; Dibut A.B; Gonzalez, P.R. and Acosta, R.M. (1994). Effect of the
application of biopreparations based on Azotobacter chroococcum on tomato and onion
University of Ghana http://ugspace.ug.edu.gh

69
crops in red ferrallitic soils. 90-anos-de-la-Estacion-Experimental-Agronomica-de-
Santiago-de-las-Vegas. 167-184. (C.F. CAB Abstracts computer reseach 1996-1998 ).
Matta, F.R. and Cotter D.J, (1994). Chile production in North-Centeral New Mwxico. NM
Cooperative Extension Circular. Las Cruces NM: 18/9/2009.
Matsubara, Y., Hasegawa, N., Fukui, H. (2002). Incidence of Fusarium root rot in asparagus
seedlings infected with Arbuscular mycorrhizal findings as affected by several
amendments. Journal of the Japanese Society for Horticultural Science 71:370-374.
McElligott, K. M. (2011). Biochar amendments to forest soil: Effects on soil properties and tree
growth. M.Sc. Thesis, College of Graduate Studies, University of Idaho. USA.
Medani, R.A., Mohamed, S.A., El-Yazal, M.A., and Mahfouz, S.A. (2000). Growth, Yield
and chemical composition of sugar beet as affected by specific isolated biofertilizers in
relation on nitrogen application. Annals Agric. Sci. Moshtohor, 38(4): 20119-2038.
MoFA, (2011). Facts and Figures. Statistics, Research and Information Directorate (SRID)
Monib, M., Saber, M., Gomaa, A.M. and Hegazi, N.A. (1990). Enrichment of tomato sand
culture with composite inocula of associative dinitrogen fixers, P-dissolving bacilli and
VAM. The 6th inter. symp. on Nitrogen Fixation with Non-legumes, Ismailia: Egypt
317-319
Moustafa, S. S. and Omar, M. N. (1990). Effect of bio-fertilizers as an inoculate on yield and
quality of tomato. Egypt. J Appli. Sci., 5: 209 - 226.
Murphy, J. and Riley J. P. (1962). A modified Simple Solution method for the determination of
Phosphates in natural waters.
University of Ghana http://ugspace.ug.edu.gh

70
Naidu, A.K., Kushwah, S.S. and Dwivedie, Y.C., (1999). Influences of organic manure,
chemical and biofertilizers on growth, yield and economics of brinjal. South Indian
Hortic., 50(4-6): 370-376.
Naik, H. B. and Hosamani, R. M. (2003). Influence of Azospirillum on growth and yield of
green chilli (Capsicum annuum L.) cv. Byadagi dabbi and different nitrogen levels.
Karnataka Journal of Agricultural Science. 16(1): 108-112.
Nanthakumar, S. and Veeraraghathatham, D. (2001). Effect of integrated nutrient
management on yield and quality attributes of brinjal. (Solanum melongena) South
Indian Hort., 49: 195-198
Narasappa, K., Reddy, E.N. and Reddy, U.P., (1985). Effect of nitrogen fertilization on chilli
(Capsicum annuum L.). cv. Sindhur. South Indian Horticulture, 33: 252-254
Natarajan, S., (1990). Standardization of nitrogen application for chilli (Capsicum annuum L.)
growth under semi-dry condition. South Indian Hortic. 47 (1-6): 252-254.
Nathulal and Pundnik (1971). Effect of nitrogen, phosphorus and potassium on chilli
(Capsicum frutescens L.). Punjab Horticultural Science, 9(3-4): 165-169.
Nkansah, G.O., Okyere, P., Coffie, R. and Voisard, J.M. (2007). Evaluation of four
exportable hybrid okra varieties in three different ecological zones of Ghana. Ghana J.
Horticulture, 6: 25-31
Nkansah, G.O., Ayarna, A.and Gbokie, T.J. (2011). Morphological and yield evaluation of
some Capsicum Pepper lines in two agro-ecological zones of Ghana. Journal of
Agronomy 10 (3): 84-91
University of Ghana http://ugspace.ug.edu.gh
71
Norman J. C., J. Opata and E. Ofori (2011). Growth and yield of okra and pepper as affected
by mulching. Ghana Journal of Horticulture, 9: 32-42.
O’Connell, P.F (1992). Sustainable agriculture- a valid alternative Outlook Agriculture 21: 5-
12
Ofosu-Budu, K. G. (2003). Performance of citrus rootstocks in the forest zone of Ghana. Ghana
J. Hort., 3: 1-9
Okalebo J. R., Cuthua, K. W., and Woomer, P, J. (2002). Laboratory methods of soil and
plant analysis- A working manual.TSBF- CIAT and SACRED Africa, Nairobi,
Kenya.Pp. 128.
Owusu- Bennoah, E., T., W., Awadzi, E., Boateng, L. Krogh, H., Breuning- Madsen and
Borggaard , O. K. (2000). Soil properties of a Toposeguence in a moist Semi-
deciduous Forest Zone of Ghana, West African Journal of Applied Ecology, Vol. 1;
1- 10.
Owusu, V. and Owusu, A.M. (2013). Consumer Willingness to pay a Premium for Organic
Fruit and Vegetable in Ghana International Food and Agribusiness Management
Review. Volume 16 Issue 1, 2013
Paramaguru, P. and Natarajan, S., (1993) Effect of Azosperillum on growth and yield of chilli
(Capsicum annuum L.) grown under semi-dry conditions. South Indian Horticulture,
41(2): 80-83.
Pignatello, J.J; Kwon, S. and Lu, Y. (2006) Effect of natural organic substances on the surface
and adsorptive properties of environmental black carbon (char): attenuation of surface
University of Ghana http://ugspace.ug.edu.gh

72
activity by humic and fulvic acids. Environmental Science and Technology 40. 7757-
7763.
Poulos, J.M., (1993). Pepper breeding. In Breeding of Solonaceous and Cole crops. Research
Journal of the American Society for horticultural Science, 129:826-832.
Prabhakar, B.S., Srinivas, K. and Shukla, J. V., (1987). Growth and yield response of chilli to
nitrogen and phosphorus fertilization. Indian Cocoa, Arecanut and Spices Journal, 11
(1): 12-14
Prabhu, T., Naiwadkar, P.R., Sajindranathm, A.K. and Mohd, H., (2002). Integrated
nutrient management studies in okra. South Indian Hortic., 50(5-6): 550-553
Preston, C.M. and Schmidt, M.W.I. (2006). “Black (pyrogenic) carbon: a synthesis of current
knowledge and uncertainties with special consideration of boreal regions”,
Biogeosciences, 2, 397-420.
Purseglove, J.W. (1988). Tropical Crops-Dicotyledons Longman Group Ltd
Purseglove, J.W., Brown, E.G., Green, C.I and Robbins, S.R.I, (1981). Spices Vol.1.
Longman Inc., New York, USA. Page; 365
Rafi, N.P.R., Prabhu, T. and Sajindranath, A.K. (2002). Effect of organic and inorganic
fertilizers on growth and yield of tomato (Lycopersicon esculentum Hill.). south Indian
Hortic., 50(4-6) 522-526.
Rafla, H., Linda, H., Antoun, S.W. and Zakaria, M. (2009). Response of cotton seed yield
and its components to different nitrogen and sulphur additions. Egypt. J. Appl. Sci., 24:
365-381.
University of Ghana http://ugspace.ug.edu.gh
73
Revillas, J. J., Rodelas, B., Pozo, C; Martinez-Toledo, M. V. And Gonzalez-Lopez J. (2000).
Production of B-group Vitamins by two Azotobacter strains with phenolic compounds
as sole carbon source under diazotrophic and adiazotrophic conditions. J. Appl.
Microbiol Vol.89. 486 - 493
Rondon, M.A., Lehmann, J., Pamirez, J. and Hurtado, M. (2007). Biological nitrogen
fixation by common beans (Phaseolus valgaris L) increases with biochar additions.
Biology and Fertility of soils.
Sarg S.M.A (2004). Influence of seed inoculation with phosphorein and levels of phosphorus
fertilization on growth, mineral contents, seedless green pods yield and yield of seeds of
three sugar pea cultivars under sandy soil conditions. J. Agric. Sci. Mansoura Univ., 29:
4729-4744.
Sarig, S., Kapulnik, Y. and Okoni, Y., (1986). Effect of Azospirillum inoculation on N fixation
and growth of several winter legumes. Plant and Soil, 90 : 335-342.
Sateh, K. and Sharma, S.K. (2006). Effect of different methods of biofertilizer in tomato seed
production. Seed production. Seed Res., 34(1): 15-19
Seleshi D. (2011). Evaluation of elite pepper varieties (Capsicum species) for growth, dry pod
yield and quality under Jimma condition, South West Ethiopia: Master of Science
Thesis Submitted to School of Graduate Studies:- Jimma University College of
Agriculture and Veterinary Medicine.
Sendurkumaran, S., Natarajan, S. and Thamburaj, S., (1998). Effect of organic and
inorganic fertilizers on growth, yield and quality of tomato. South Indian Horticulture.
46 : 203-205.
University of Ghana http://ugspace.ug.edu.gh

74
Sharma, S. K. (1995). Seed production of tomato as influenced by nitrogen, phosphorous and
potassium fertilization. Annals of Agril. Res., 16 : 399-400.
Shashidhara, G. B. (2000). Integrated nutrient management for chilli (Capsicum annuum L.) in
Alfispos of Northern Transision zone of Karnataka. M. Sc. (Agri.) Thesis, University of
Agricultural Sciences, Dharwad.
Shukla, V., Srinivas, K. and Prabhakar, B.S. (1987). Response of bell pepper to nitrogen,
phosphorus and potassium fertilization. Indian J. Hortic., 44 (1-2): 81-84
Siddesh, H.K. (2006). Studies on integrated nutrient management on seed yield and quality of
chilli. Master of Science (Agriculture) Thesis submitted to the University of Agricultural
Sciences, Dharwad.
Shanmuga, P. M.; Reyaz, F., Divyashree K., Satheesh Babu, A. K., Lakshmi, P. M.; Prasad,
M. P. (2013). Pilot scale production of Azotobacter biofertilizer and its effect on the
growth parameters of Ocimum sanctum. International Journal of Engineering and
Advanced Technology. Vol. 2. ISSN: 2249-8958.
Smith, P. G., Villalon, B. and Vlla, P. L. (1987). Horticultural classification of pepper grown in
the United States. Journal of Horticultural Science. 22: 11-13
Sonago, S., (2003). Chile pepper and the threat of wilt diseases. Health Progress Plant, 10.
1094/PHP-2003-0430-01-RV
Steiner C, Glaser B, Teixeira W G, Lehmann J, Blum W E H and Zech, W. ( 2008).
Nitrogen retention and plant uptake on a highly weathered central Amazonian Ferralsol
amended with compost and charcoal. Journal of Plant Nutrition and Soil Science-
Zeitschrift Fur Pflanzenernahrung Und Bodenkunde 171, 893-899.
University of Ghana http://ugspace.ug.edu.gh

75
Stewart, M.W., Dibb, W.D., Johnston, E.A. and Smyth, J.T. (2005). The Contribution of
Commercial Fertilizer Nutrients to Food Production. Agron J., 97: 1-6.
Thakur, P.C. (1993). Heritability in sweet pepper: Capsicum Newsletter. Institute of plant
breeding and seed production. Giuria.Turin, Italy, 7: 42- 43.
Tshewang, N; Balwant, S. and Bhupinder, P. S. (2010). Plant availability of arsenic and
cadmium as influenced by biochar application to soil solutions for a changing world.
1-6 August 2010, Brisbane, Australia. Published on DVD
Tyron, E.H. (1948). Effect of charcoal on certain physical, chemical, and biological properties
of forest soils. Ecol. Monogr. 18: 82-115.
Vasanthakumar, S. K. (2003). Studies on beneficial endorhizosphere bacteria in solanaceous
crop plants. M. Sc. (Agri.) Thesis, Univ. Agric. Sci., Dharwad, Karnataka, India.
Van Wambeke, A., (1992) Soils of the Tropics.McGraw- Hill, New York. 343pp.
Van Zwieten, L., Kimber, S., Downie, A., Chan, K.Y., Cowie, A., Wainberg, R.and Morris,
S. (2007). „Papermill char: Benefits to soil health and plant production‟ in Proceedings
of the Conference of the International Agrichar Initiative, 30 April-2 May 2007,
Terrigal, NSW, Australia.
Vessey, J. K. (2003). Plant growth promoting rhizobacteria as biofertilizers. Plant soil Vol 225.
571 – 586.
Wange, S. S. and Kale, R. H. (2004). Effect of biofrtilizers under graded nitrogen levels on
brinjal crop. Journal of Soils and Crops, 14(1): 9-11.
University of Ghana http://ugspace.ug.edu.gh

76
APPENDICES
Appendix 1: ANOVA of plant diameter of major season at 15 dat
Source of
variation
Degrees
of
freedom
Sum of
squares
Mean
squares
Variance F pr.
Replication 3 0.026063 0.008688 2.88
Treatment 26 0.491407 0.0189 6.26 <.001
Residual 78 0.235637 0.003021
Total 107 0.753107
Appendix 2: ANOVA of number of major season at 15 dat
Source of
variation
Degrees
of
freedom
Sum of
squares
Mean
squares
Variance F pr.
Replication 3 14723 4908 1.05
Treatment 26 136040 5232 1.12 0.342
Residual 78 364725 4676
Total 107 515489
Appendix 3: ANOVA of plant height of major season at 15 dat
Source of
variation
Degrees
of
freedom
Sum of
squares
Mean
squares
Variance F pr.
Replication 3 25.41 8.47 0.84
Treatment 26 950.24 36.55 3.6 <.001
Residual 78 791.09 10.14
Total 107 1766.74
Appendix 4: ANOVA of plant diameter at 15 dat
Source of
variation
Degrees
of
freedom
Sum of
squares
Mean
squares
Variance F pr.
Replication 3 0.009595 0.003198 2.31
Treatment 26 0.470563 0.018099 13.1 <.001
Residual 78 0.107771 0.001382
Total 107 0.587929
University of Ghana http://ugspace.ug.edu.gh

77
Appendix 5: ANOVA of no. of leaves at 15 dat
Source of
variation
Degrees
of
freedom
Sum of
squares
Mean
squares
Variance F pr.
Replication 3 17.815 5.938 1.68
Treatment 26 366.685 14.103 3.99 <.001
Residual 78 275.685 3.534
Total 107 660.185
Appendix 6: ANOVA of plant height at 15 dat
Source of
variation
Degrees
of
freedom
Sum of
squares
Mean
squares
Variance F pr.
Replication 3 0.53879 0.1796 9.98
Treatment 26 1174.33343 45.16667 2510.37 <.001
Residual 78 1.40338 0.01799
Total 107 1176.2756
Appendix 7: ANOVA of plant height of minor season at 15 dat
Source of
variation
Degrees
of
freedom
Sum of
squares
Mean
squares
Variance F pr.
Replication 3 0.53879 0.1796 9.98
Treatment 26 1174.33343 45.16667 2510.37 <.001
Residual 78 1.40338 0.01799
Total 107 1176.2756
Appendix 8: ANOVA of no. of leaves at 15 dat
Source of
variation
Degrees
of
freedom
Sum of
squares
Mean
squares
Variance F pr.
Replication 3 3.3013 1.1004 6.86
Treatment 26 19408.0436 746.4632 4655.9 <.001
R esidual 78 12.5055 0.1603
Total 107 19423.8503
University of Ghana http://ugspace.ug.edu.gh
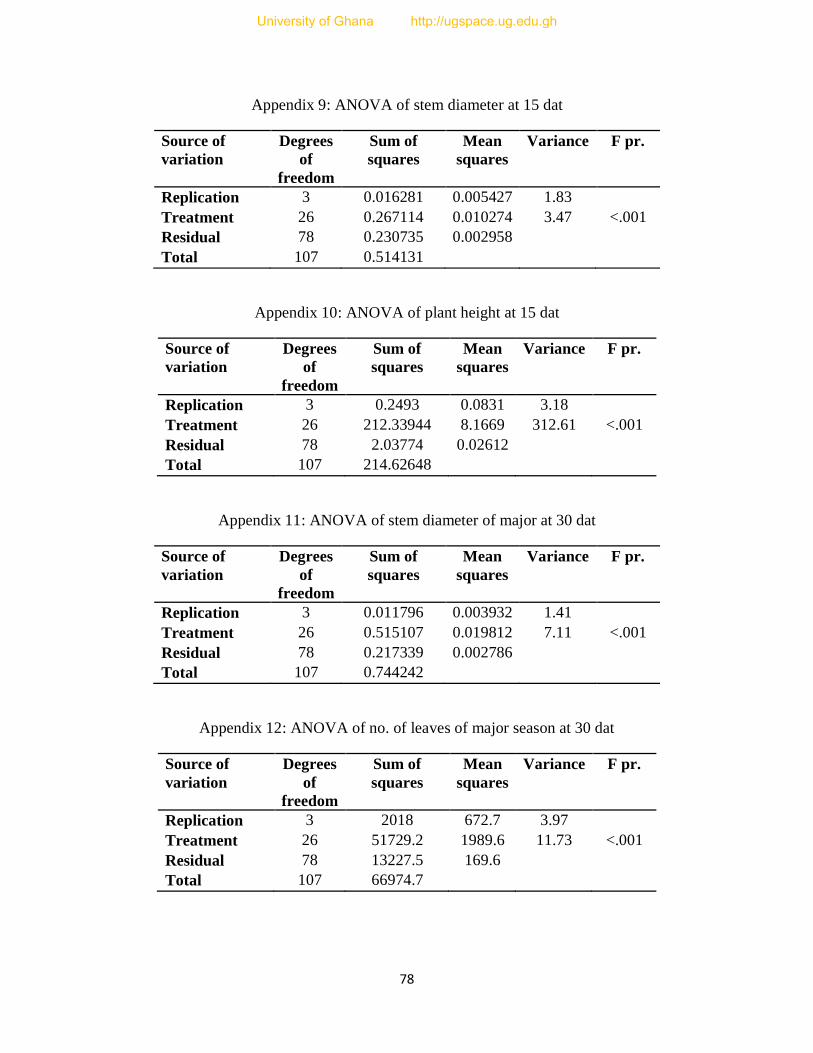
78
Appendix 9: ANOVA of stem diameter at 15 dat
Source of
variation
Degrees
of
freedom
Sum of
squares
Mean
squares
Variance F pr.
Replication 3 0.016281 0.005427 1.83
Treatment 26 0.267114 0.010274 3.47 <.001
Residual 78 0.230735 0.002958
Total 107 0.514131
Appendix 10: ANOVA of plant height at 15 dat
Source of
variation
Degrees
of
freedom
Sum of
squares
Mean
squares
Variance F pr.
Replication 3 0.2493 0.0831 3.18
Treatment 26 212.33944 8.1669 312.61 <.001
Residual 78 2.03774 0.02612
Total 107 214.62648
Appendix 11: ANOVA of stem diameter of major at 30 dat
Source of
variation
Degrees
of
freedom
Sum of
squares
Mean
squares
Variance F pr.
Replication 3 0.011796 0.003932 1.41
Treatment 26 0.515107 0.019812 7.11 <.001
Residual 78 0.217339 0.002786
Total 107 0.744242
Appendix 12: ANOVA of no. of leaves of major season at 30 dat
Source of
variation
Degrees
of
freedom
Sum of
squares
Mean
squares
Variance F pr.
Replication 3 2018 672.7 3.97
Treatment 26 51729.2 1989.6 11.73 <.001
Residual 78 13227.5 169.6
Total 107 66974.7
University of Ghana http://ugspace.ug.edu.gh

79
Appendix 13: ANOVA of plant height of major season at 30 dat
Source of
variation
Degrees
of
freedom
Sum of
squares
Mean
squares
Variance F pr.
Replication 3 18.3 6.1 0.72
Treatment 26 1440.701 55.412 6.55 <.001
Residual 78 659.888 8.46
Total 107 2118.889
Appendix 14: ANOVA of stem diameter at 30 DAT
Source of
variation
Degrees
of
freedom
Sum of
squares
Mean
squares
Variance F pr.
Replication 3 0.0013842 0.000461 1.5
Treatment 26 0.8339399 0.032075 104.61 <.001
Residual 78 0.0239164 0.000307
Total 107 0.8592404
Appendix 15: ANOVA on no. of leaves of minor season at 30 DAT
Source of
variation
Degrees
of
freedom
Sum of
squares
Mean
squares
Variance F pr.
Replication 3 6.988 2.3293 2.64
Treatment 26 36206.3776 1392.553 1578.88 <.001
Residual 78 68.7951 0.882
Total 107 36282.1608
Appendix 16: ANOVA on plant height of minor season at30 DAT
Source of
variation
Degrees
of
freedom
Sum of
squares
Mean
squares
Variance F pr.
Replication 3 2.7844 0.9281 1.34
Treatment 26 1018.5304 39.1742 56.58 <.001
Residual 78 54.0052 0.6924
Total 107 1075.32
University of Ghana http://ugspace.ug.edu.gh

80
Appendix 18: ANOVA of no. of leaves at 30 DAT
Source of
variation
Degrees
of
freedom
Sum of
squares
Mean
squares
Variance F pr.
Replication 3 21.519 7.173 1.75
Treatment 26 691.074 26.58 6.47 <.001
Residual 78 320.481 4.109
Total 107 1033.074
Appendix 19: ANOVA on stem diameter at 30 DAT
Source of
variation
Degrees
of
freedom
Sum of
squares
Mean
squares
Variance F pr.
Replication 3 0.22206 0.07402 0.88
Treatment 26 2.12798 0.08185 0.98 0.507
Residual 78 6.53196 0.08374
Total 107 8.882
Appendix 20: ANOVA on plant height at 45 DAT
Source of
variation
Degrees
of
freedom
Sum of
squares
Mean
squares
Variance F pr.
Replication 3 8853419 2951140 1
Treatment 26 76759143 2952275 1 0.479
Residual 78 230304139 2952617
Total 107 315916701
Appendix 21: ANOVA on weight of 100 seeds
Source of
variation
Degrees
of
freedom
Sum of
squares
Mean
squares
Variance F pr.
Replication 3 0.011529 0.003843 1.42
Treatment 26 0.863585 0.033215 12.31 <.001
Residual 78 0.210496 0.002699
Total 107 1.08561
University of Ghana http://ugspace.ug.edu.gh

81
Appendix 22: ANOVA on Ca
Source of
variation
Degrees
of
freedom
Sum of
squares
Mean
squares
Variance F pr.
Replication 3 0.03154 0.01051 0.73
Treatment 26 985.6781 37.9107 2617.94 <.001
Residual 78 1.12953 0.01448
Total 107 986.83917
Appendix 23: ANOVA on Ca 1 Ca
Source of
variation
Degrees
of
freedom
Sum of
squares
Mean
squares
Variance F pr.
Replication 3 1.8421 0.614 5.84
Treatment 26 24157.354 929.129 8834.39 <.001
Residual 78 8.2034 0.1052
Total 107 24167.3996
Appendix 24: ANOVA on EC
Source of
variation
Degrees
of
freedom
Sum of
squares
Mean
squares
Variance F pr.
Replication 3 1.1927 0.3976 1.16
Treatment 26 67.6923 2.6036 7.56 <.001
Residual 78 26.8454 0.3442
Total 107 95.7303
Appendix 25: ANOVA on K
Source of
variation
Degrees
of
freedom
Sum of
squares
Mean
squares
Variance F pr.
Replication 3 3.1611 1.0537 1.12
Treatment 26 7337.7085 282.2196 301.01 <.001
Residual 78 73.1311 0.9376
Total 107 7414.0007
University of Ghana http://ugspace.ug.edu.gh

82
Appendix 26: ANOVA on K 1 K
Source of
variation
Degrees
of
freedom
Sum of
squares
Mean
squares
Variance F pr.
Replication 3 4.18E+00 1.39E+00 37.17
Treatment 26 1.10E+04 4.22E+02 11266.78 <.001
Residual 78 2.92E+00 3.74E-02
Total 107 1.10E+04
Appendix 27: ANOVA on Mg
Source of
variation
Degrees
of
freedom
Sum of
squares
Mean
squares
Variance F pr.
Replication 3 0.4128 0.1376 0.54
Treatment 26 206.0615 7.9254 31.36 <.001
Residual 78 19.7151 0.2528
Total 107 226.1894
Appendix 28: ANOVA on Mg 1 Mg
Source of
variation
Degrees
of
freedom
Sum of
squares
Mean
squares
Variance F pr.
Replication 3 45.5 15.17 1.24
Treatment 26 3655.79 140.61 11.54 <.001
Residual 78 950.41 12.18
Total 107 4651.7
Appendix 29: ANOVA on N
Source of
variation
Degrees
of
freedom
Sum of
squares
Mean
squares
Variance F pr.
Replication 3 0.01313 0.004377 1.39
Treatment 26 10.364417 0.398631 126.18 <.001
Residual 78 0.24642 0.003159
Total 107 10.623967
University of Ghana http://ugspace.ug.edu.gh

83
Appendix 30: ANOVA on N 1 N
Source of
variation
Degrees
of
freedom
Sum of
squares
Mean
squares
Variance F pr.
Replication 3 1.15311 0.38437 14.3
Treatment 26 994.37656 38.24525 1423.22 <.001
Residual 78 2.09604 0.02687
Total 107 997.62571
Appendix 31: ANOVA on P
Source of
variation
Degrees
of
freedom
Sum of
squares
Mean
squares
Variance F pr.
Replication 3 0.014119 0.004706 1.91
Treatment 26 95.307741 3.665682 1485.46 <.001
Residual 78 0.192481 0.002468
Total 107 95.514341
Appendix 32: ANOVA on PH
Source of
variation
Degrees
of
freedom
Sum of
squares
Mean
squares
Variance F pr.
Replication 3 0.64423 0.21474 10.7
Treatment 26 24.41295 0.93896 46.77 <.001
Residual 78 1.56582 0.02007
Total 107 26.623
Appendix 33: ANOVA on pot exp
Source of
variation
Degrees
of
freedom
Sum of
squares
Mean
squares
Variance F pr.
Replication 3 0.0018803 0.000627 0.85
Treatment 26 0.0309989 0.001192 1.62 0.053
Residual 78 0.0572871 0.000734
Total 107 0.0901663
University of Ghana http://ugspace.ug.edu.gh

84
Appendix 34: ANOVA on P 1 P
Source of
variation
Degrees
of
freedom
Sum of
squares
Mean
squares
Variance F pr.
Replication 3 4.869 1.623 0.73
Treatment 26 2570.398 98.861 44.29 <.001
Residual 78 174.117 2.232
Total 107 2749.384
Appendix 35: ANOVA on shape of fruit/ no. of lobes
Source of
variation
Degrees
of
freedom
Sum of
squares
Mean
squares
Variance F pr.
Replication 3 0.7407 0.2469 1.4
Treatment 26 14.1667 0.5449 3.09 <.001
Residual 78 13.7593 0.1764
Total 107 28.6667
Appendix 36: ANOVA on minor ex2
Source of
variation
Degrees
of
freedom
Sum of
squares
Mean
squares
Variance F pr.
Replication 3 0.015729 0.005243 1.57
Treatment 26 1.361038 0.052348 15.72 <.001
Residual 78 0.259777 0.00333
Total 107 1.636544
Appendix 37: ANOVA on minor ex2
Source of
variation
Degrees
of
freedom
Sum of
squares
Mean
squares
Variance F pr.
Replication 3 0.027455 0.009152 2.08
Treatment 26 1.05914 0.040736 9.25 <.001
Residual 78 0.343534 0.004404
Total 107 1.430128
University of Ghana http://ugspace.ug.edu.gh

85
Appendix 38: ANOVA on no. of seeds /fruit
Source of
variation
Degrees
of
freedom
Sum of
squares
Mean
squares
Variance F pr.
Replication 3 188.04 62.68 1.5
Treatment 26 5627.5 216.44 5.18 <.001
Residual 78 3259.46 41.79
Total 107 9075
Appendix 39: ANOVA on pericarp thickness
Source of
variation
Degrees
of
freedom
Sum of
squares
Mean
squares
Variance F pr.
Replication 3 0.021 0.007 0.37
Treatment 26 12.89662 0.49602 26.15 <.001
Residual 78 1.47932 0.01897
Total 107 14.39694
University of Ghana http://ugspace.ug.edu.gh