Embed Size (px)
Citation preview
THE OPEN UNIVERSITY: A SURVEY AND ECONOMIC ANALYSISAuthor(s): KEITH G. LUMSDEN and CHARLES RITCHIESource: Instructional Science, Vol. 4, No. 3/4, Evaluation of Instructional Technology (October1975), pp. 237-291Published by: SpringerStable URL: http://www.jstor.org/stable/23368143 .
Accessed: 28/06/2014 13:19
Your use of the JSTOR archive indicates your acceptance of the Terms & Conditions of Use, available at .http://www.jstor.org/page/info/about/policies/terms.jsp
.JSTOR is a not-for-profit service that helps scholars, researchers, and students discover, use, and build upon a wide range ofcontent in a trusted digital archive. We use information technology and tools to increase productivity and facilitate new formsof scholarship. For more information about JSTOR, please contact [email protected].
.
Springer is collaborating with JSTOR to digitize, preserve and extend access to Instructional Science.
http://www.jstor.org
This content downloaded from 91.238.114.202 on Sat, 28 Jun 2014 13:19:03 PMAll use subject to JSTOR Terms and Conditions
Instructional Science 4 (1975) 237-291
© Elsevier Scientific Publishing Company, Amsterdan — Printed in the Netherlands
THE OPEN UNIVERSITY: A SURVEY
AND ECONOMIC ANALYSIS*
KEITH G. LUMSDEN and CHARLES RITCHIE
The Esmée Fairbairn Research Centre, Heriot-Watt
University, Edinburgh, Scotland
1. Introduction
Today in higher education, increasing attention is being focused on the
problem of maintaining or improving output performance with relatively fewer resource inputs. Despite rapid progress in the communications in
dustry, institutions of higher learning, with few exceptions, have resisted the
adoption of new media in the teaching field, even though research shows
that quality could be still maintained, at substantially reduced costs. The
reasons for the resistance have been well documented in other publications.1 This paper describes in detail a significant departure from the conventional
university and attempts to contrast and compare, in many dimensions, an
innovative institution — Britain's Open University — with its traditional
counterparts. It attempts also to examine the economic implications of
establishing an open learning system in the United States.
The Open University of the United Kingdom constitutes the first major
attempt in university education to use television and radio for formal
lectures in most courses offered. Furthermore, academic or ability prerequi sites for the student are nonexistent. Students are allowed to take no more
than two full courses per year, and only 10 percent of them have indeed
taken two courses; for the large majority only one full course is taken per
year. The course lasts from January until examination time in November
with two breaks during this period, and typically includes 16 television
*The research reported here was supported by National Science Foundation Grant
EC-37762 to the Educational Testing Service, Princeton, New Jersey, and by the Depart
ment of Health, Education, and Welfare Contract HEW—05—71 —169 to the Esmée
Fairbairn Economics Research Centre, Heriot-Watt University, Edinburgh. The authors
are indebted to Alexander Scott and Desmond Tierney (The Esmée Fairbairn Economics
Research Centre), Leslie Wagner (The Open University), Dean T.. Jamison (Educational
Testing Service), and Peter Spain (Stanford University) for comments on an earlier draft
of this paper.
This content downloaded from 91.238.114.202 on Sat, 28 Jun 2014 13:19:03 PMAll use subject to JSTOR Terms and Conditions
238
programs. These 25-minute programs are shown during evenings from 6:30 to 7:30 and on Saturdays and Sundays; each program is repeated once.
Complementary radio programs of equivalent length are broadcast, also
during the evenings and on weekends. Each full course has 32 such broad
casts, each repeated once.
Periodically, the Open University student receives materials and home
work assignments by mail; it is his responsibility to return the homework
assignments — they help determine his final grade in the course. The students also attend bimonthly (normally) tutorial sessions held in local "study
centers," where the mass-media lectures are discussed and clarified and where course problems are analyzed. The student also has access to coun
selling services in the same local centers. The counselling services are avail able to help him with both academic and personal problems.
Although the summer school policy is under review, the student is
normally required to attend a six-day summer school in one of the OU centers.
Failure to complete a sufficient proportion of home assignments or to attend summer school normally makes the student ineligible to sit for the November examination which constitutes 50 percent of the final grade.
Fees vary by course level. The typical undergraduate tuition fee is
approximately $60 per course, and total annual tuition fees meet less than 19 percent of the total annual cost of the OU. The rest is financed through a central government subsidy.
Important differences exist between the United Kingdom and United States usage of several academic words and expressions, and these should be clarified. In United Kingdom parlance, faculty refers both to faculty mem bers and also to an academic discipline. Tuition, in the United Kingdom, refers to the teaching process, not to the payable fee. Tutorials in the United
Kingdom are a common feature in all universities and take the form of an instructor lecturing to, or discussing issues with, small groups of students.
Teaching costs are defined to include all costs incurred in providing students with their university courses with the exception of students' oppor tunity costs, and do not refer solely to instructors' salaries.
Fixed costs are those costs which are independent of student numbers, whereas variable costs are positively correlated with student numbers.
Finally, as would be expected with an innovative institution, changes are occurring constantly as the Open University learns by doing. As a
consequence many of the cost data, to take one example, have changed and
will continue to change in the evolutionary period. Where it is felt that certain costs will be or could be significantly different in the future or under other institutional arrangements, the necessary adjustments have been at
tempted in this report. Also, it has now become apparent that the costs of
This content downloaded from 91.238.114.202 on Sat, 28 Jun 2014 13:19:03 PMAll use subject to JSTOR Terms and Conditions
239
providing that variety of course offerings initially thought necessary will be
beyond its present resources, particularly if existing budgetary constraints
are continued by future governments. After three years of operation, actual
resource requirements are now obliging the OU authorities to examine the
direction which the OU will take and, in particular, to question the alloca
tion of resources within it. The whole area of student preference, and its
intimate relationship with resource allocation, is now under review.
In addition to the re-examination of its aims, the OU is also looking
again at its teaching techniques. Serious study is taking place of the effects
on student learning of qualitative differences in television and radio programs. The effect of these changes would appear to be a shift in emphasis from the
counselling system to the tutoring role.
2. History and Structure of the Open University
The 1963 Robbins Report2 first documented the increased demand for
places within the entire higher education system — all post high school
education where the level of work/study was of degree quality. Later in
1963 the leader of the Opposition Labour Party, Mr. Harold Wilson, expres sed his anxiety about the growing problems of students qualified to attend
university for whom no places were available. He proposed that a university be established which would teach primarily through the media of radio and
television. His suggested title for this institution was "The University of the
Air." In February 1966 came the publication of a White Paper3 on the
subject. (In the intervening period, Wilson had become Prime Minister with
the election of the Labour government in 1964). While the White Paper received a mixed reception, the government announced its intention to go ahead with the project, but with major changes. The most significant alteration was embodied in the change of name — the Open University —
since traditional university entrance requirements were completely aban
doned. The other aspect of "openness" lay in the fact that students would
be able to choose, almost without restriction, from any faculty courses
which would contribute to their degree. In May 1969, the Open University received its Royal Charter, the power to confer degrees.
DEGREE REQUIREMENTS4
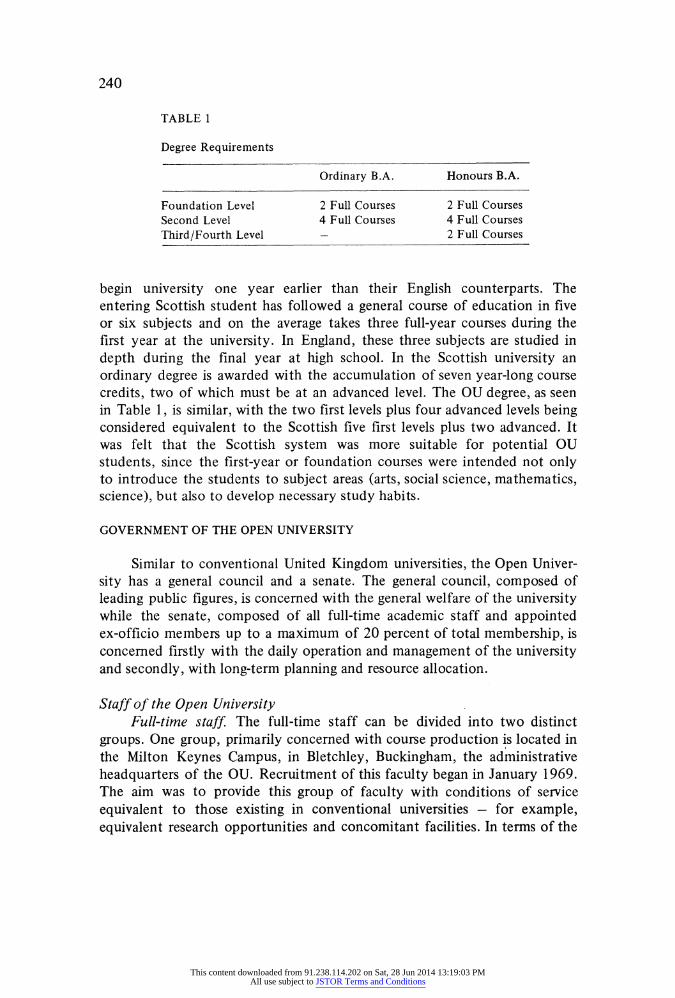
Only one undergraduate degree is offered — the OU Bachelor of Arts
degree — but it is offered at an ordinary or honours level. Table 1 distin
guishes the requirements. The OU degree is based upon the Scottish univer
sity degree system rather than the English. In Scotland students typically
This content downloaded from 91.238.114.202 on Sat, 28 Jun 2014 13:19:03 PMAll use subject to JSTOR Terms and Conditions
240
TABLE 1
Degree Requirements
Ordinary B.A. Honours B.A.
Foundation Level 2 Full Courses 2 Full Courses
Second Level 4 Full Courses 4 Full Courses
Third/Fourth Level - 2 Full Courses
begin university one year earlier than their English counterparts. The
entering Scottish student has followed a general course of education in five
or six subjects and on the average takes three full-year courses during the
first year at the university. In England, these three subjects are studied in
depth during the final year at high school. In the Scottish university an
ordinary degree is awarded with the accumulation of seven year-long course
credits, two of which must be at an advanced level. The OU degree, as seen
in Table 1, is similar, with the two first levels plus four advanced levels being considered equivalent to the Scottish five first levels plus two advanced. It
was felt that the Scottish system was more suitable for potential OU
students, since the first-year or foundation courses were intended not only to introduce the students to subject areas (arts, social science, mathematics, science), but also to develop necessary study habits.
GOVERNMENT OF THE OPEN UNIVERSITY
Similar to conventional United Kingdom universities, the Open Univer
sity has a general council and a senate. The general council, composed of
leading public figures, is concerned with the general welfare of the university while the senate, composed of all full-time academic staff and appointed ex-officio members up to a maximum of 20 percent of total membership, is
concerned firstly with the daily operation and management of the university and secondly, with long-term planning and resource allocation.
Staff of the Open University Full-time staff. The full-time staff can be divided into two distinct
groups. One group, primarily concerned with course production is located in
the Milton Keynes Campus, in Bletchley, Buckingham, the administrative
headquarters of the OU. Recruitment of this faculty began in January 1969.
The aim was to provide this group of faculty with conditions of service
equivalent to those existing in conventional universities — for example,
equivalent research opportunities and concomitant facilities. In terms of the
This content downloaded from 91.238.114.202 on Sat, 28 Jun 2014 13:19:03 PMAll use subject to JSTOR Terms and Conditions
241
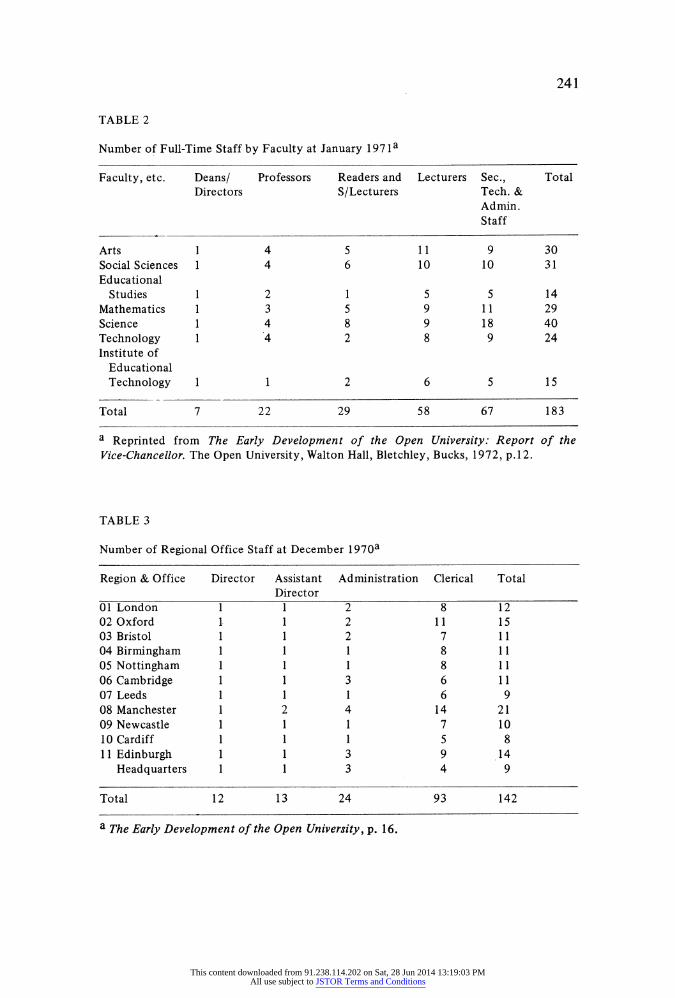
TABLE 2
Number of Full-Time Staff by Faculty at January 1971a
Faculty, etc. Deans/ Directors
Professors Readers and
S/Lecturers
Lecturers Sec., Tech. &
Admin.
Staff
Total
Arts 1 4 5 11 9 30
Social Sciences 1 4 6 10 10 31
Educational
Studies 1 2 1 5 5 14
Mathematics 1 3 5 9 11 29
Science 1 4 8 9 18 40
Technology 1 4 2 8 9 24
Institute of
Educational
Technology 1 1 2 6 5 15
Total 7 22 29 58 67 183
a Reprinted from The Early Development of the Open University: Report of the
Vice-Chancellor. The Open University, Walton Hall, Bletchley, Bucks, 1972, p.12.
TABLE 3
Number of Regional Office Staff at December 1970a
Region & Office Director Assistant Administration Clerical Total
Director
01 London 1 1 2 8 12
02 Oxford 1 1 2 11 15
03 Bristol 1 1 2 7 11
04 Birmingham 1 1 1 8 11
05 Nottingham 1 1 1 8 11
06 Cambridge 1 1 3 6 11
07 Leeds 1 1 1 6 9
08 Manchester 1 2 4 14 21
09 Newcastle 1 1 1 7 10
10 Cardiff 1 1 1 5 8
11 Edinburgh 1 1 3 9 14
Headquarters 1 1 3 4 9
Total 12 13 24 93 142
a The Early Development of the Open University, p. 16.
This content downloaded from 91.238.114.202 on Sat, 28 Jun 2014 13:19:03 PMAll use subject to JSTOR Terms and Conditions
242
production of course materials, it was estimated that four faculty members in each of twenty-two disciplines would be sufficient to achieve the desired
objectives and provide intellectual cross-fertilization within each discipline. This number has proven to be quite inadequate to the extent that additional recruitment5 has been necessary, but the addition of more staff has not solved the course production problems. Table 2 shows the distribution of
faculty and administration immediately prior to the first intake of students in January 1971.
The second group of full-time faculty consists of senior counsellors and staff tutors based in 12 (later 13) regions in the UK. Each region is the
responsibility of a director who is also a full-time faculty member. Table 3 summarizes the numbers of organizational staff in each region. The senior counsellors' role is establishing a network of counselling services conducted
by part-time counsellors, and the staff tutors' role is the establishment of the tutorial services, again carried out by part-time tutors.
Part-time staff. In each region there are many study centers normally open most evenings and on Saturday mornings, at which times the counsel lors meet with students. The role of these counsellors is to establish personal contact with the students to discuss possible problems, to assist and advise them about their studies, but not normally to teach. The counsellor is also
responsible for the smooth operation of the study centers. Typical coun sellors have a full-time appointment elsewhere, normally in educational
establishments, and are in charge of 20 students with whom they have continuous contact over the academic year.
Tutoring takes two definite forms. One set of tutors is concerned only with correspondence, i.e., the grading of home assignments, and as a rule
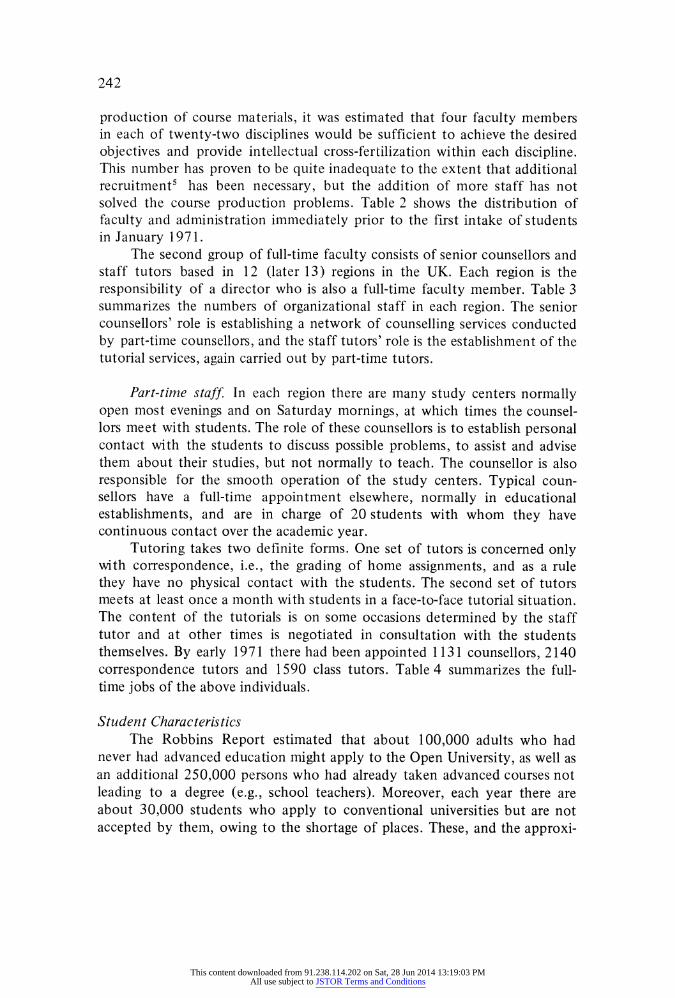
they have no physical contact with the students. The second set of tutors meets at least once a month with students in a face-to-face tutorial situation. The content of the tutorials is on some occasions determined by the staff tutor and at other times is negotiated in consultation with the students themselves. By early 1971 there had been appointed 1131 counsellors, 2140
correspondence tutors and 1590 class tutors. Table 4 summarizes the full time jobs of the above individuals.
Student Characteristics
The Robbins Report estimated that about 100,000 adults who had never had advanced education might apply to the Open University, as well as an additional 250,000 persons who had already taken advanced courses not
leading to a degree (e.g., school teachers). Moreover, each year there are about 30,000 students who apply to conventional universities but are not
accepted by them, owing to the shortage of places. These, and the approxi
This content downloaded from 91.238.114.202 on Sat, 28 Jun 2014 13:19:03 PMAll use subject to JSTOR Terms and Conditions
243
TABLE 4
Source of Part-Time Staff3
Institution or Other Origin Percentage
University 19
College of Education 13
Polytechnic 13
Technical College 8
College of Further Education 8
Secondary School 7
Government Research Institute 2
WEA and Extra-Mural 2
Industry 2
Local and Central Government 1
Otherb 17
No Reply 8
d The Early Development of the Open University, p. 19. b
E.g., housewives, retired persons, postgraduate students and part-time employees of
the institutions listed above.
mately 40,000 annual high-school dropouts, might ultimately (at age 21) wish to avail themselves of the Open University option. Since it was not
known how many adults of all backgrounds might actually apply, the Open
University decided it could offer about 25,000 places in its first year, with
plans to achieve, within two to three years, a maximum student population of 55,000. In 1971, therefore, 24,191 applications were accepted. All
applicants were over 21 and were selected on a first-come, first-served basis, after initial screening for the purpose of achieving a balanced geographical,
subject, and occupational mix.
University Facilities
The main University facility which houses the central administration
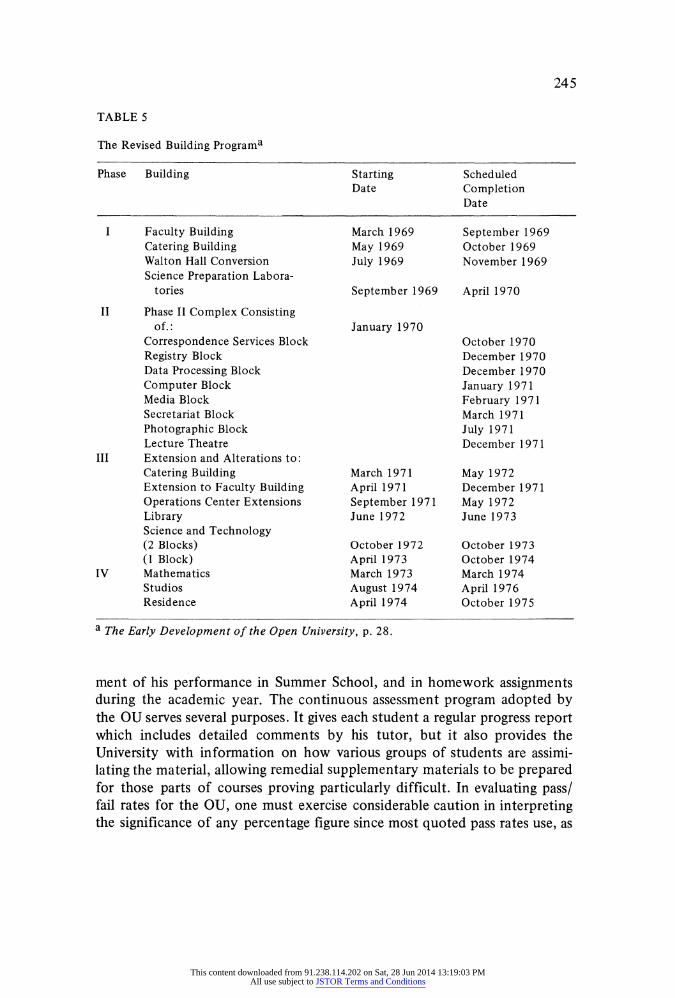
and full-time, on-campus faculty and staff is located in Milton Keynes around Walton Hall, a Georgian manor house standing in 70 acres. Table 5
summarizes the existing buildings and building programmed to late 1975.
Many University activities, however, will emanate from centers and
offices within the 13 regions. One of the major instances of economy in the
Open University, which incidentally also uses national higher educational
facilities more efficiently, occurs through the employment of underused
educational capacity. In urban areas the majority of study centers (total
equals 273) are housed in polytechnics (institutions of higher education
originally specializing in applied science and technology but now become
This content downloaded from 91.238.114.202 on Sat, 28 Jun 2014 13:19:03 PMAll use subject to JSTOR Terms and Conditions
244
broader based) and in technical colleges. Only 12 are housed in universities.
In rural areas where such colleges are less prevalent, high school facili
ties are normally used. Ideally the capital requirements in the facilities
include projectors and tape relay machines, references sets of correspond ence materials (the same sets that students receive) and, in some area
centers, teletype terminals linked to a national computer; the terminals are
used mainly for mathematics students.
Many of these institutions also make facilities such as libraries and
common rooms available to Open University students and staff. The flow of
benefits is not all one way since many of the institutions within which Open
University capital equipment is installed are allowed use of the equipment
during their regular classes.
As will be seen in the section on costs of the Open University, the real
marginal costs incurred in using existing facilities in polytechnics, technical
colleges, schools, etc., are not always borne by the Open University. The
decision as to who bears the costs is made by the authority responsible for
the facilities. In some instances a nominal rental charge is made, in other
incremental costs are charged, and in still others the facilities are provided at
zero cost to the Open University and are borne by local or central govern ment. On the other side of the coin, however, the Open University does not
charge the resident institutions for the use of the equipment it has installed
in the study centers.
While students are not obliged to take part in the study center tutorial
sessions, they must attend a one-week-per-course resident summer school to
be eligible to take the final examination. All summer schools are held in
universities [in 1971 Bangor (Wales), Durham, East Anglia, Exeter, Keele,
Loughborough, Stirling (Scotland), and York]. One distinguishing feature of
the chosen eight (mostly very new universities) is the availability of on
campus accommodation facilities. The Open University stresses the impor tance of those summer schools as an integral part of each course. Students
pay, either from their own pockets or from local government grants, approx
imately $60 for first-level courses and $85 for higher-level courses for these
summer sessions.
3. Output of the Open University
The results presented here are for the four original foundation courses
in 1971 and for the five foundation courses in 1972.
After completing a course and taking the end-of-year examination, a
student may obtain a pass with distinction, a straight pass, or a fail. His final
grade is determined by his score in the end-of-year examination, in assess
This content downloaded from 91.238.114.202 on Sat, 28 Jun 2014 13:19:03 PMAll use subject to JSTOR Terms and Conditions
245
TABLE 5
The Revised Building Programa
Phase Building Starting Scheduled
Date Completion
Date
I Faculty Building
Catering Building Walton Hall Conversion
Science Preparation Labora
tories
II Phase II Complex Consisting
of.:
Correspondence Services Block
Registry Block
Data Processing Block
Computer Block
Media Block
Secretariat Block
Photographic Block
Lecture Theatre
III Extension and Alterations to:
Catering Building Extension to Faculty Building
Operations Center Extensions
Library Science and Technology
(2 Blocks)
(1 Block) IV Mathematics
Studios
Residence
March 1969
May 1969
July 1969
September 1969
October 1969
November 1969
September 1969 April 1970
January 1970
October 1970
December 1970
December 1970
January 1971
February 1971
March 1971
July 1971
December 1971
March 1971
April 1971
September 1971
June 1972
May 1972
December 1971
May 1972
June 1973
October 1972
April 1973
March 1973
August 1974
April 1974
October 1973
October 1974
March 1974
April 1976
October 1975
a The Early Development of the Open University, p. 28.
ment of his performance in Summer School, and in homework assignments
during the academic year. The continuous assessment program adopted by the OU serves several purposes. It gives each student a regular progress report which includes detailed comments by his tutor, but it also provides the
University with information on how various groups of students are assimi
lating the material, allowing remedial supplementary materials to be prepared for those parts of courses proving particularly difficult. In evaluating pass/ fail rates for the OU, one must exercise considerable caution in interpreting the significance of any percentage figure since most quoted pass rates use, as
This content downloaded from 91.238.114.202 on Sat, 28 Jun 2014 13:19:03 PMAll use subject to JSTOR Terms and Conditions
246
TABLE 6a
Initial Final Took Passed Failed
Registrations Registrations Examinations Examinations Examinations
1971 1972
28,329 29,824
100% 100%
1971 1972
21,715 22,799
76.7% 76.4%
1971 1972
17,666 17,750
62.4% 59.5%
1971 1972
16,346 16,228
57.7% 54.4%
1971 1972
1,320 1,522
4.7% 5.1%
a It should be recalled that students, by not having to pay tuition fees until the end of
April, were implicitly given 3 months to decide whether or not to continue with the
course(s) for which they had initially registered. Source: Open University Statistical
Bulletin Feb./March 1973, Tables 1A1 & 1A2.
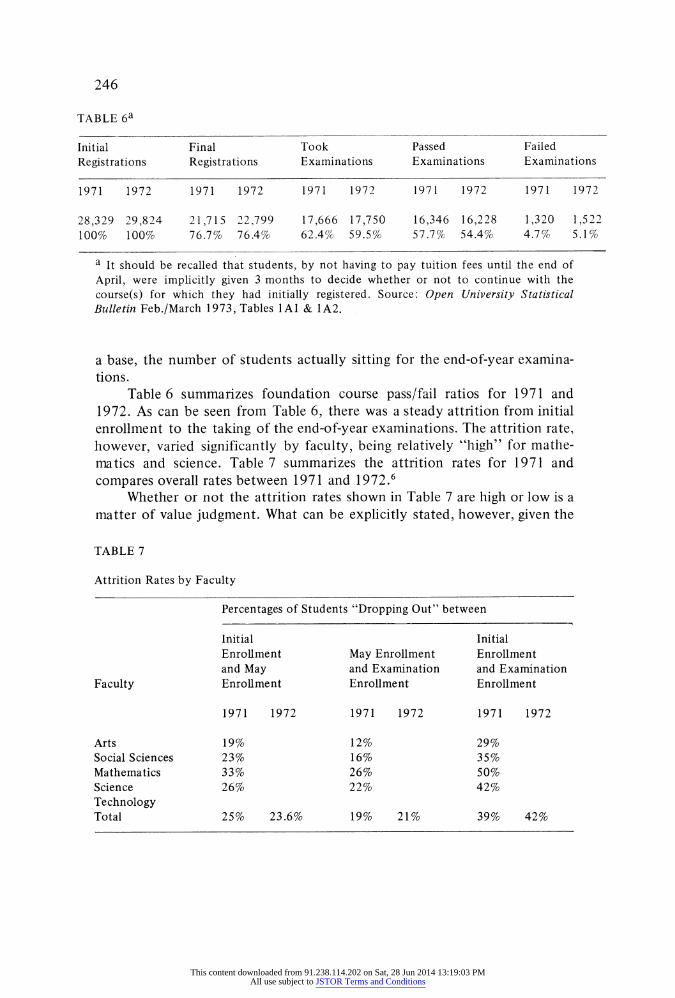
a base, the number of students actually sitting for the end-of-year examina
tions.
Table 6 summarizes foundation course pass/fail ratios for 1971 and
1972. As can be seen from Table 6, there was a steady attrition from initial
enrollment to the taking of the end-of-year examinations. The attrition rate,
however, varied significantly by faculty, being relatively "high" for mathe
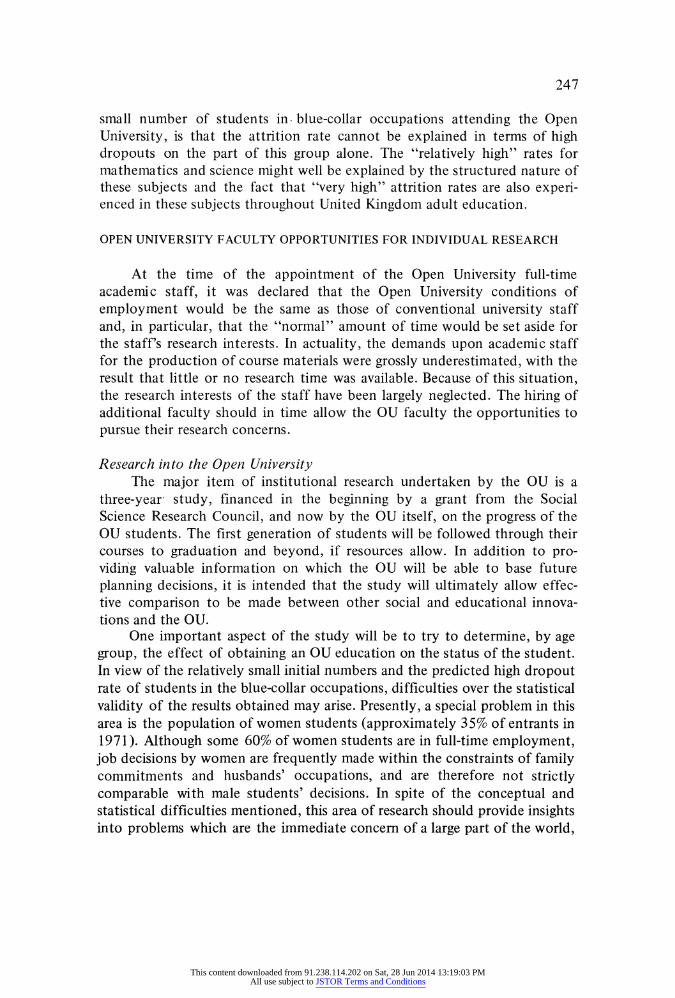
matics and science. Table 7 summarizes the attrition rates for 1971 and
compares overall rates between 1971 and 1972.6
Whether or not the attrition rates shown in Table 7 are high or low is a
matter of value judgment. What can be explicitly stated, however, given the
TABLE 7
Attrition Rates by Faculty
Percentages of Students "Dropping Out" between
Faculty
Initial
Enrollment
and May
Enrollment
1971 1972
Arts
Social Sciences
Mathematics
Science
Technology Total
19%
23%
33%
26%
25% 23.6%
May Enrollment
and Examination
Enrollment
Initial
Enrollment
and Examination
Enrollment
1971 1972 1971 1972
12% 16% 26% 22%
29% 35% 50% 42%
19% 21' 39% 42%
This content downloaded from 91.238.114.202 on Sat, 28 Jun 2014 13:19:03 PMAll use subject to JSTOR Terms and Conditions
247
small number of students in blue-collar occupations attending the Open University, is that the attrition rate cannot be explained in terms of high dropouts on the part of this group alone. The "relatively high" rates for
mathematics and science might well be explained by the structured nature of these subjects and the fact that "very high" attrition rates are also experi enced in these subjects throughout United Kingdom adult education.
OPEN UNIVERSITY FACULTY OPPORTUNITIES FOR INDIVIDUAL RESEARCH
At the time of the appointment of the Open University full-time
academic staff, it was declared that the Open University conditions of
employment would be the same as those of conventional university staff
and, in particular, that the "normal" amount of time would be set aside for
the staffs research interests. In actuality, the demands upon academic staff
for the production of course materials were grossly underestimated, with the
result that little or no research time was available. Because of this situation, the research interests of the staff have been largely neglected. The hiring of
additional faculty should in time allow the OU faculty the opportunities to
pursue their research concerns.
Research into the Open University The major item of institutional research undertaken by the OU is a
three-year' study, financed in the beginning by a grant from the Social
Science Research Council, and now by the OU itself, on the progress of the
OU students. The first generation of students will be followed through their
courses to graduation and beyond, if resources allow. In addition to pro
viding valuable information on which the OU will be able to base future
planning decisions, it is intended that the study will ultimately allow effec
tive comparison to be made between other social and educational innova
tions and the OU. One important aspect of the study will be to try to determine, by age
group, the effect of obtaining an OU education on the status of the student.
In view of the relatively small initial numbers and the predicted high dropout rate of students in the blue-collar occupations, difficulties over the statistical
validity of the results obtained may arise. Presently, a special problem in this
area is the population of women students (approximately 35% of entrants in
1971). Although some 60% of women students are in full-time employment,
job decisions by women are frequently made within the constraints of family commitments and husbands' occupations, and are therefore not strictly
comparable with male students' decisions. In spite of the conceptual and
statistical difficulties mentioned, this area of research should provide insights into problems which are the immediate concern of a large part of the world,
This content downloaded from 91.238.114.202 on Sat, 28 Jun 2014 13:19:03 PMAll use subject to JSTOR Terms and Conditions
248
namely the short- and long-term effects of educational inputs on particular socioeconomic groups.
An important research question arises from the fact that the combina
tion of materials and teaching techniques is unique as a university system and is serving a group of students widely diverse in many characteristics. Since the learning process itself for conventional students is extremely complex and little understood, the problems are magnified as student
homogeneity decreases. The research in this area will attempt to identify the
contribution of various factors to the learning process within different student groups.
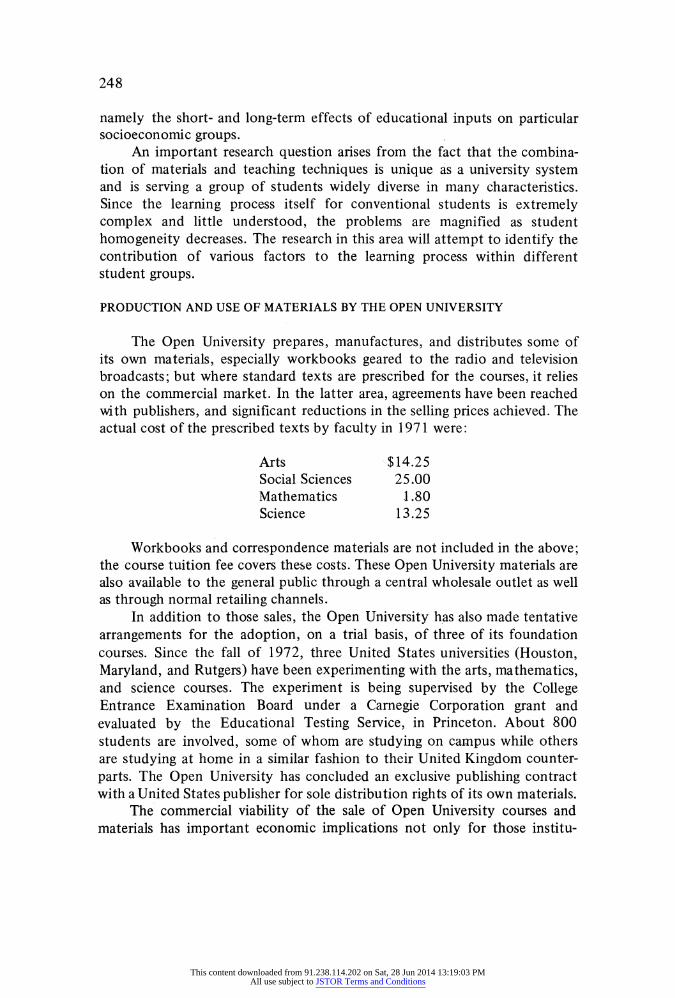
PRODUCTION AND USE OF MATERIALS BY THE OPEN UNIVERSITY
The Open University prepares, manufactures, and distributes some of
its own materials, especially workbooks geared to the radio and television
broadcasts; but where standard texts are prescribed for the courses, it relies
on the commercial market. In the latter area, agreements have been reached
with publishers, and significant reductions in the selling prices achieved. The
actual cost of the prescribed texts by faculty in 1971 were:
Workbooks and correspondence materials are not included in the above; the course tuition fee covers these costs. These Open University materials are
also available to the general public through a central wholesale outlet as well
as through normal retailing channels.
In addition to those sales, the Open University has also made tentative
arrangements for the adoption, on a trial basis, of three of its foundation
courses. Since the fall of 1972, three United States universities (Houston,
Maryland, and Rutgers) have been experimenting with the arts, mathematics, and science courses. The experiment is being supervised by the College Entrance Examination Board under a Carnegie Corporation grant and
evaluated by the Educational Testing Service, in Princeton. About 800
students are involved, some of whom are studying on campus while others
are studying at home in a similar fashion to their United Kingdom counter
parts. The Open University has concluded an exclusive publishing contract
with a United States publisher for sole distribution rights of its own materials.
The commercial viability of the sale of Open University courses and
materials has important economic implications not only for those institu
Arts
Social Sciences
Mathematics
Science
$14.25 25.00
1.80
13.25
This content downloaded from 91.238.114.202 on Sat, 28 Jun 2014 13:19:03 PMAll use subject to JSTOR Terms and Conditions
249
tions purchasing them but also for the Open University itself, since this may
prove to be one method of financing its expansion to planned optimum size
despite the cutback in government subsidy. It is of interest to note that in
1972 sales of Open University materials realized a net profit of some
£38,000.
CONVERSION RATES
In analyzing the economics of the Open University and in comparing it
with conventional United Kingdom universities, certain calculations have to
be made to achieve valid comparisons. To compare Open University students, for example, with conventional
students, adjustments have to be made in the latter figure since the conven
tional student body is composed of both graduates and undergraduates, whereas almost all the Open University students are, at present, under
graduates. The adjustment is necessary since different student groups require different resource inputs, e.g., faculty time, library facilities, laboratories, and equipment. The official United Kingdom estimates use as a numeraire
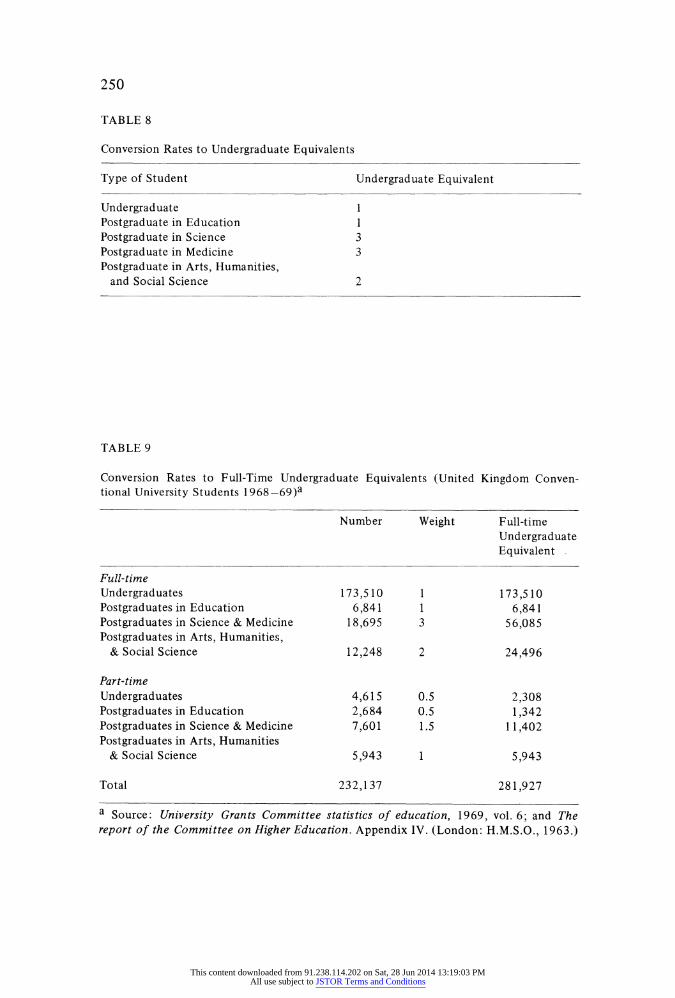
"unit of undergraduate load." Table 8 shows the ratios used to convert
students into undergraduate equivalents. Another adjustment required in making meaningful comparisons arises
from the part-time nature of the Open University students. All of the Open
University students are part-time (since no student is allowed to take more
than two courses) in any one year. In contrast, only 9 percent of students
attending conventional universities were part-time in the academic year 1968—69. Table 9 shows the full-time equivalent undergraduate total for
United Kingdom conventional university students.
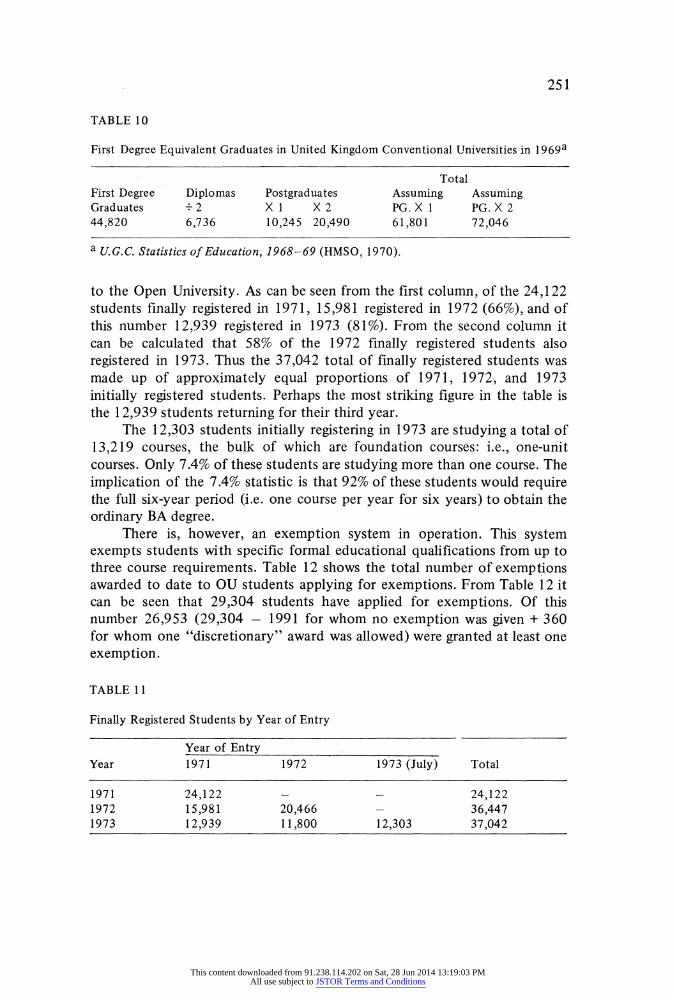
A further problem arises in comparing graduates of the OU with their
conventional counterparts. In the OU it will be assumed that only under
graduate degrees will be produced and that each OU graduate will be
equivalent to a first-degree graduate from conventional universities. Conven
tional universities also produce honours, diplomas, and postgraduate degrees. Thus in comparing costs between the OU and an "equivalent" conventional
university, a weighting scheme must be adopted for the different degrees. It
is extremely difficult, because of joint-cost problems, to estimate precisely the cost of any one degree in an institution which provides regular under
graduate degrees, diplomas, and postgraduate degrees. Because of this, two
sets of assumptions governing postgraduate degrees have been made. Table
10 sets out these assumptions and the assumption adopted by the University Grants Committee (UGC) that two diplomas equal one undergraduate
degree. Table 11 shows numbers of finally registered students by year of entry
This content downloaded from 91.238.114.202 on Sat, 28 Jun 2014 13:19:03 PMAll use subject to JSTOR Terms and Conditions
250
TABLE 8
Conversion Rates to Undergraduate Equivalents
Type of Student Undergraduate Equivalent
Undergraduate 1
Postgraduate in Education 1
Postgraduate in Science 3
Postgraduate in Medicine 3
Postgraduate in Arts, Humanities,
and Social Science 2
TABLE 9
Conversion Rates to Full-Time Undergraduate Equivalents (United Kingdom Conven
tional University Students 1968—69)a
Number Weight Full-time
Undergraduate
Equivalent
Full-time
Undergraduates
Postgraduates in Education
Postgraduates in Science & Medicine
Postgraduates in Arts, Humanities,
& Social Science
Part-time
Undergraduates
Postgraduates in Education
Postgraduates in Science & Medicine
Postgraduates in Arts, Humanities
& Social Science
173,510 1 173,510
6,841 1 6,841
18,695 3 56,085
12,248 2 24,496
4,615 0.5 2,308 2,684 0.5 1,342
7,601 1.5 1 1,402
5,943 1 5,943
Total 232,137 281,927
a Source: University Grants Committee statistics of education, 1969, vol. 6; and The
report of the Committee on Higher Education. Appendix IV. (London: H.M.S.O., 1963.)
This content downloaded from 91.238.114.202 on Sat, 28 Jun 2014 13:19:03 PMAll use subject to JSTOR Terms and Conditions
251
TABLE 10
First Degree Equivalent Graduates in United Kingdom Conventional Universities in 1969a
Total
First Degree Diplomas Postgraduates Assuming Assuming Graduates ^2 XI X2 PG. X 1 PG. X 2
44,820 6,736 10,245 20,490 61,801 72,046
a U.G.C. Statistics of Education, 1968—69 (HMSO, 1970).
to the Open University. As can be seen from the first column, of the 24,122 students finally registered in 1971, 15,981 registered in 1972 (66%), and of
this number 12,939 registered in 1973 (81%). From the second column it
can be calculated that 58% of the 1972 finally registered students also
registered in 1973. Thus the 37,042 total of finally registered students was
made up of approximately equal proportions of 1971, 1972, and 1973
initially registered students. Perhaps the most striking figure in the table is
the 12,939 students returning for their third year. The 12,303 students initially registering in 1973 are studying a total of
13,219 courses, the bulk of which are foundation courses: i.e., one-unit
courses. Only 7.4% of these students are studying more than one course. The
implication of the 7.4% statistic is that 92% of these students would require the full six-year period (i.e. one course per year for six years) to obtain the
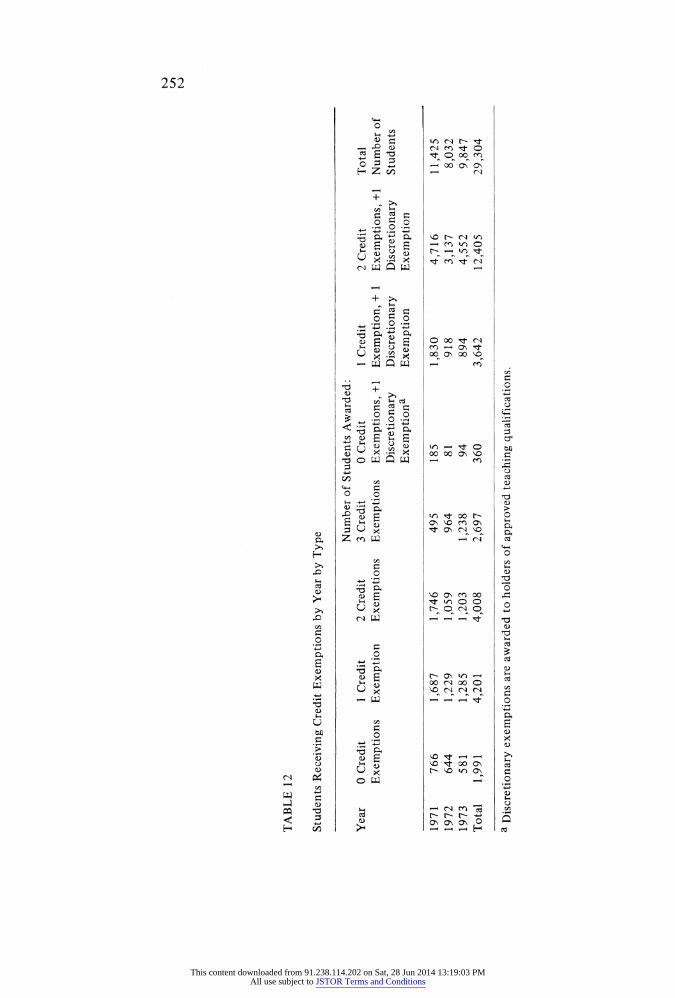
ordinary BA degree. There is, however, an exemption system in operation. This system
exempts students with specific formal educational qualifications from up to three course requirements. Table 12 shows the total number of exemptions awarded to date to OU students applying for exemptions. From Table 12 it can be seen that 29,304 students have applied for exemptions. Of this
number 26,953 (29,304 — 1991 for whom no exemption was given + 360 for whom one "discretionary" award was allowed) were granted at least one
exemption.
TABLE 11
Finally Registered Students by Year of Entry
Year
Year of Entry
Total 1971 1972 1973 (July)
1971 24,122 _ _ 24,122 1972 15,981 20,466 — 36,447 1973 12,939 11,800 12,303 37,042
This content downloaded from 91.238.114.202 on Sat, 28 Jun 2014 13:19:03 PMAll use subject to JSTOR Terms and Conditions
252
TABLE
12
Students
Receiving
Credit
Exemptions
by
Year
by
Type
£ c , x) (u cd g o 3 3 h Z co
u
c 2 ■2 |
6 g o ^ X
c .2 a a <u X
m w q w
+ >> r, ^
G g •2 §
u
q o
n, e
- m q w
.. c/3 c3 • ~
c o •2 o
a Ed vh
£ ^
c/3 (1) c (J g w « <d x -jr1 x 73 o w q w 3
cw c 0 o
1 ^ £ e 2 s 5 r > "° 3 u x Z n w
=3 o "
i o g (n w
c o
+-> +3
2 £ e g -h w
c o
t3 ^ a) £ u ° u X o w
<d
uo <n r- tj" (n m "t o
c» co —< 00 on On —< cn
\0 h m ^ -h m m O
»—^ lo ^ "st* co "st" (n
O co 1" (n co —* On tt 00^ On 00 VO —t co
m —« tt O oo oo o\ vo
in tf oo h on vo co On tt On vo
w-S ot
vo On co 00 -3- m o o t> o (n o
^}
r- On m —< 00 (n 00 O vo (n (n (n
vo ^t vo "*3" 00 On o vo l/->
r—i cn co 13 r r r On on On o -—1 '—1 h
3 er bß C
T3 <1) > O W-4 Cli a
This content downloaded from 91.238.114.202 on Sat, 28 Jun 2014 13:19:03 PMAll use subject to JSTOR Terms and Conditions
253
TABLE 13
1972 Second-Level Courses Examination Results
(1) (2) (3) (4) (5) (6) Registered Allocated to
Courses in Examination Absent from
Jan. 1972a Centers Examined Passed Failed Examination
No. of Students 24,349 21,349 18,326 17,096 1,230 3,023
Pet. of No. in Col. 1 100% 87.6% 75.2% 70.1% 5.1% 12.4% Pet. of No. in Col. 2 - 100.0% 85.8% — - —
Pet. of No. in Col. 3 - - 100.0% 93.3% 6.7% -
a Source: Open University Statistical Bulletin (February/March 1973). Continuing stu
dents who have not registered by end of January are considered to have left the Open
University (at least for that year).
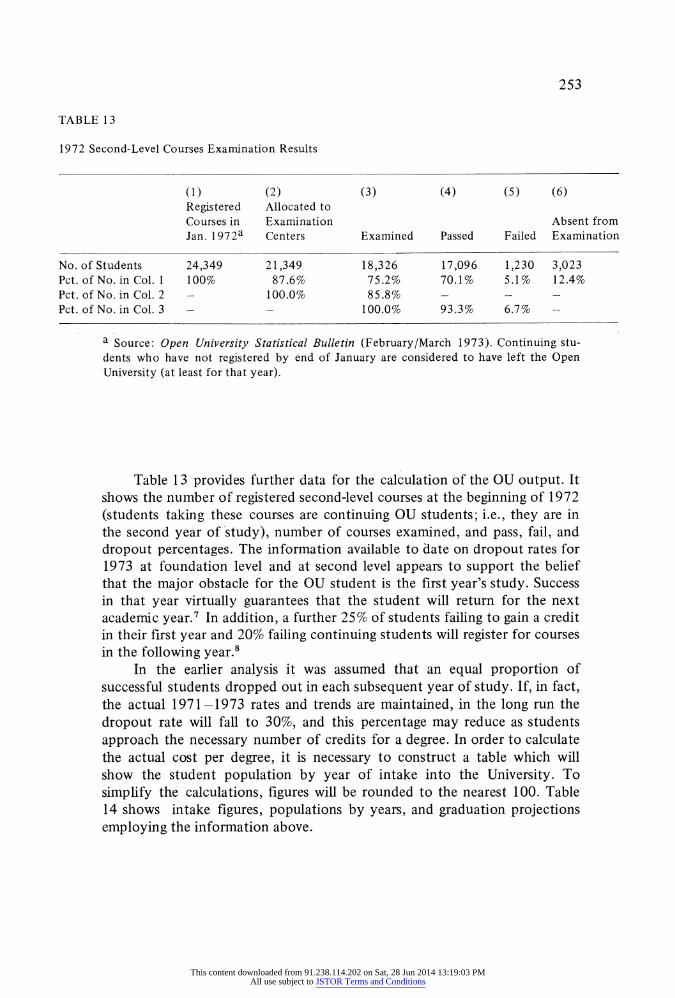
Table 13 provides further data for the calculation of the OU output. It
shows the number of registered second-level courses at the beginning of 1972
(students taking these courses are continuing OU students; i.e., they are in
the second year of study), number of courses examined, and pass, fail, and
dropout percentages. The information available to date on dropout rates for
1973 at foundation level and at second level appears to support the belief
that the major obstacle for the OU student is the first year's study. Success
in that year virtually guarantees that the student will return for the next
academic year.7 In addition, a further 25% of students failing to gain a credit
in their first year and 20% failing continuing students will register for courses
in the following year.8 In the earlier analysis it was assumed that an equal proportion of
successful students dropped out in each subsequent year of study. If, in fact, the actual 1971—1973 rates and trends are maintained, in the long run the
dropout rate will fall to 30%, and this percentage may reduce as students
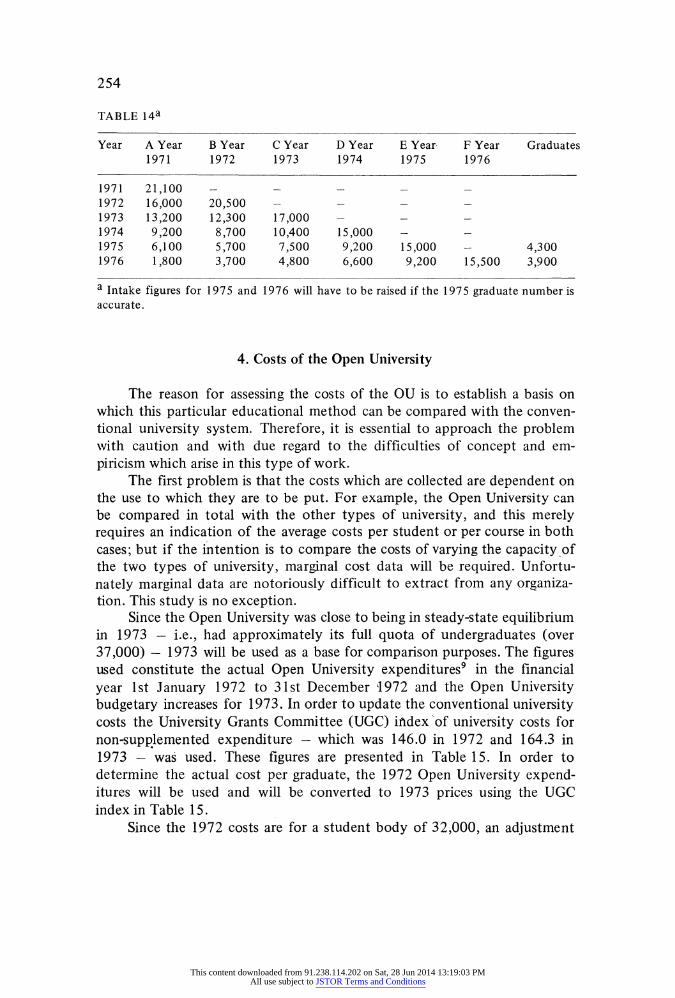
approach the necessary number of credits for a degree. In order to calculate
the actual cost per degree, it is necessary to construct a table which will
show the student population by year of intake into the University. To
simplify the calculations, figures will be rounded to the nearest 100. Table
14 shows intake figures, populations by years, and graduation projections
employing the information above.
This content downloaded from 91.238.114.202 on Sat, 28 Jun 2014 13:19:03 PMAll use subject to JSTOR Terms and Conditions
254
TABLE 14a
Year A Year B Year CYear DYear E Year F Year Graduates
1971 1972 1973 1974 1975 1976
1971 21,100
1972 16,000 20,500 — — — —
1973 13,200 12,300 17,000 — — —
1974 9,200 8,700 10,400 15,000 — —
1975 6,100 5,700 7,500 9,200 15,000 4,300 1976 1,800 3,700 4,800 6,600 9,200 15,500 3,900
a Intake figures for 1975 and 1976 will have to be raised if the 1975 graduate number is
accurate.
4. Costs of the Open University
The reason for assessing the costs of the OU is to establish a basis on
which this particular educational method can be compared with the conven
tional university system. Therefore, it is essential to approach the problem with caution and with due regard to the difficulties of concept and em
piricism which arise in this type of work.
The first problem is that the costs which are collected are dependent on
the use to which they are to be put. For example, the Open University can
be compared in total with the other types of university, and this merely
requires an indication of the average costs per student or per course in both
cases; but if the intention is to compare the costs of varying the capacity of
the two types of university, marginal cost data will be required. Unfortu
nately marginal data are notoriously difficult to extract from any organiza tion. This study is no exception.
Since the Open University was close to being in steady-state equilibrium in 1973 — i.e., had approximately its full quota of undergraduates (over
37,000) — 1973 will be used as a base for comparison purposes. The figures used constitute the actual Open University expenditures9 in the financial
year 1st January 1972 to 31st December l1972 and the Open University
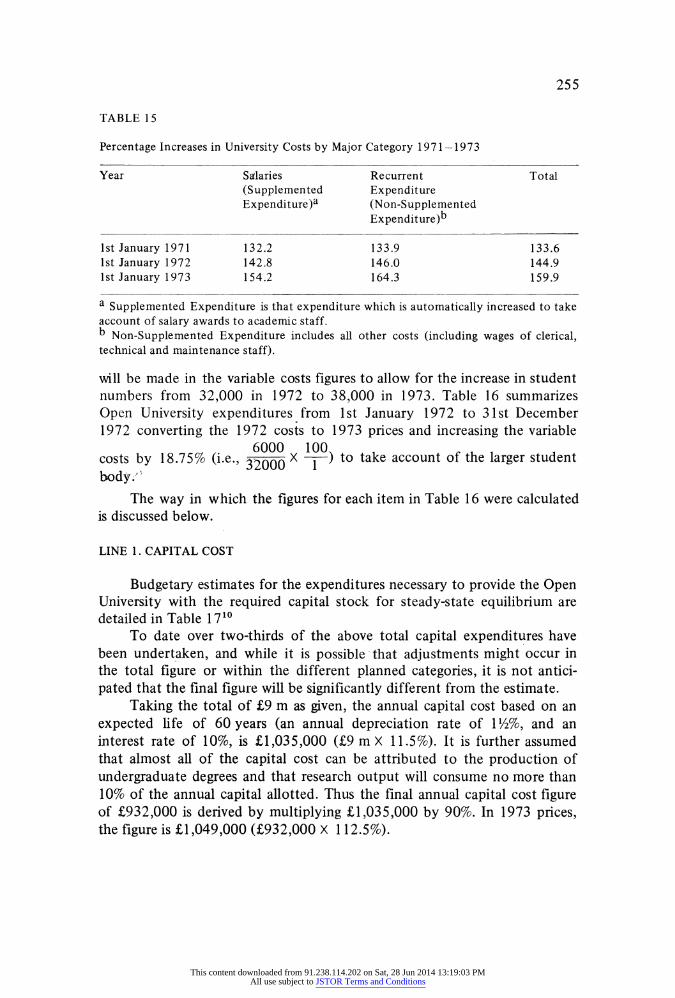
budgetary increases for 1973. In order to update the conventional university costs the University Grants Committee (UGC) iftdex of university costs for
non-supplemented expenditure - which was 146.0 in 1972 and 164.3 in
1973 — was used. These figures are presented in Table 15. In order to
determine the actual cost per graduate, the 1972 Open University expend itures will be used and will be converted to 1973 prices using the UGC
index in Table 15.
Since the 1972 costs are for a student body of 32,000, an adjustment
This content downloaded from 91.238.114.202 on Sat, 28 Jun 2014 13:19:03 PMAll use subject to JSTOR Terms and Conditions
255
TABLE 15
Percentage Increases in University Costs by Major Category 1971-1973
Year Salaries
(Supplemented
Expenditure)3
Recurrent
Expenditure
(Non-Supplemented
Expenditure)'3
Total
1st January 1971 132.2 133.9 133.6 1st January 1972 142.8 146.0 144.9
1st January 1973 154.2 164.3 159.9
a Supplemented Expenditure is that expenditure which is automatically increased to take
account of salary awards to academic staff. "
Non-Supplemented Expenditure includes all other costs (including wages of clerical, technical and maintenance staff).
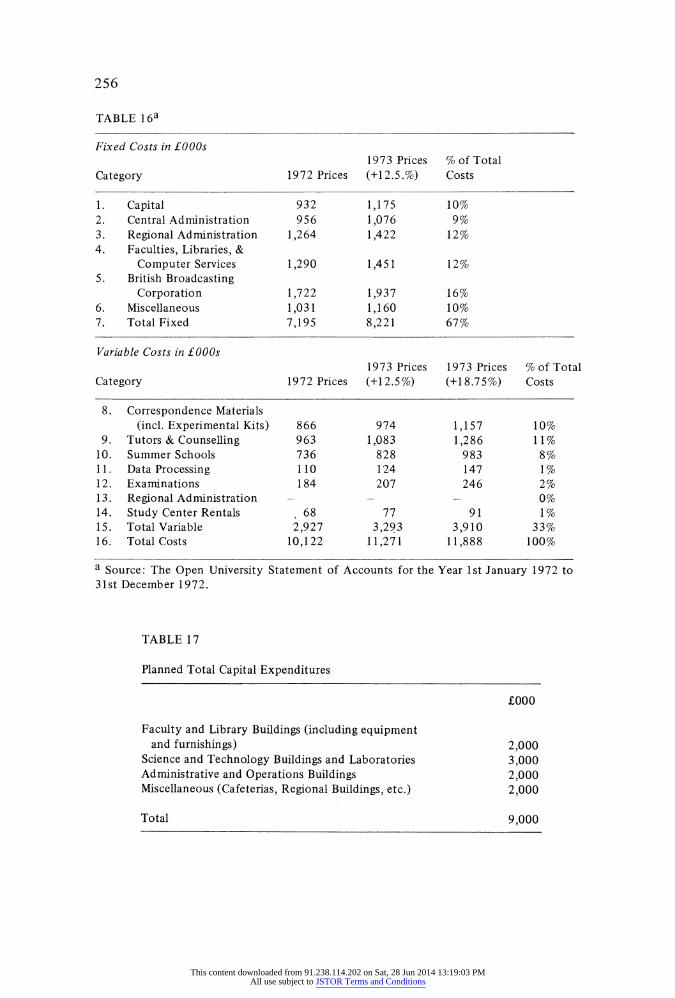
will be made in the variable costs figures to allow for the increase in student
numbers from 32,000 in 1972 to 38,000 in 1973. Table 16 summarizes
Open University expenditures from 1st January 1972 to 31st December
1972 converting the 1972 costs to 1973 prices and increasing the variable
6000 100, , r u , costs by 18.75% (i.e., ^qqq
x ~j~~)
to take account of the larger student
body.''
The way in which the figures for each item in Table 16 were calculated
is discussed below.
LINE 1. CAPITAL COST
Budgetary estimates for the expenditures necessary to provide the Open
University with the required capital stock for steady-state equilibrium are
detailed in Table 1710
To date over two-thirds of the above total capital expenditures have
been undertaken, and while it is possible that adjustments might occur in
the total figure or within the different planned categories, it is not antici
pated that the final figure will be significantly different from the estimate.
Taking the total of £9 m as given, the annual capital cost based on an
expected life of 60 years (an annual depreciation rate of 1 Vi%, and an
interest rate of 10%, is £1,035,000 (£9 m X 11.5%). It is further assumed
that almost all of the capital cost can be attributed to the production of
undergraduate degrees and that research output will consume no more than
10% of the annual capital allotted. Thus the final annual capital cost figure of £932,000 is derived by multiplying £1,035,000 by 90%. In 1973 prices, the figure is £1,049,000 (£932,000 X 112.5%).
This content downloaded from 91.238.114.202 on Sat, 28 Jun 2014 13:19:03 PMAll use subject to JSTOR Terms and Conditions
256
TABLE 16a
Fixed Costs in £000s
1973 Prices % of Total
Category 1972 Prices (+12.5.%) Costs
1. Capital 932 1,175 10%
2. Central Administration 956 1,076 9%
3. Regional Administration 1,264 1,422 12%
4. Faculties, Libraries, &
Computer Services 1,290 1,451 12%
5. British Broadcasting
Corporation 1,722 1,937 16%
6. Miscellaneous 1,031 1,160 10%
7. Total Fixed 7,195 8,221 67%
Variable Costs in £000s
1973 Prices 1973 Prices % of Tota
Category 1972 Prices (+12.5%) (+18.75%) Costs
8. Correspondence Materials
(incl. Experimental Kits) 866 974 1,157 10% 9. Tutors & Counselling 963 1,083 1,286 11%
10. Summer Schools 736 828 983 8%
11. Data Processing 110 124 147 1%
12. Examinations 184 207 246 2%
13. Regional Administration - - — 0%
14. Study Center Rentals . 68 77 91 1%
15. Total Variable 2,927 3,293 3,910 33%
16. Total Costs 10,122 11,271 11,888 100%
a Source: The Open University Statement of Accounts for the Year 1st January 1972 to
31st December 1972.
TABLE 17
Planned Total Capital Expenditures
£000
Faculty and Library Buildings (including equipment and furnishings) 2,000
Science and Technology Buildings and Laboratories 3,000 Administrative and Operations Buildings 2,000 Miscellaneous (Cafeterias, Regional Buildings, etc.) 2,000
Total 9,000
This content downloaded from 91.238.114.202 on Sat, 28 Jun 2014 13:19:03 PMAll use subject to JSTOR Terms and Conditions
257
LINE 2. CENTRAL ADMINISTRATION COSTS
The Central Administrative Department is composed of the following divisions: correspondence services, data processing, finance, information,
publishing, marketing, academic administration, Vice-Chancellor's Office, and Council Affairs. Of these, data processing costs vary with the number of
students and, consequently, are included under variable costs. It is assumed
that 100% of the cost is properly attributable to the undergraduate teaching
activity.
LINE 3. REGIONAL ADMINISTRATION COSTS
There are 13 regions covering the United Kingdom, each region having a
director, a supporting administrator and clerical staff, 3 to 4 senior coun
sellors, and 5 to 7 staff tutors on average. On the main campus there is also a
central regional staff consisting of a director and 6 to 10 supporting adminis
trative staff. The Regional Administration costs are independent of student
numbers and consequently are fixed. Total Regional Administrative costs
also include rentals for study centers and tutoring and counselling costs, both of which could be expected to vary with the number of students
enrolled. However, for the range within which the University plans to
operate — i.e., 38,000—55,000 students - the number (and therefore the
cost) of this staff is fixed.
LINE 4. FACULTIES, LIBRARIES, AND COMPUTER SERVICES
Faculty costs consist largely of salaries and expenditures on the produc tion of courses. In the calculation of expenditure on the production of
correspondence units, faculties are charged by other areas of the Open
University for services provided; e.g., publishing charge for copyright clear
ance and editing and media development charges for graphics production. In
addition each faculty is allocated funds for consultants, external assessment,
etc., per unit produced. Since the initial intention was to make Open
University academic staff comparable in terms of research opportunities to
their conventional university counterparts, one would be expected to
allocate only part of academic staff output to teaching and the remainder to
research. As will be seen, however, almost 100% of academic staff output has
been required for course production. For this reason all of the academic
salary costs will be attributed to teaching output. Faculty costs in 1972 were
£1,501,000. Of this amount, £1,054,000 was paid in academic staff salaries,
£121,000 in computer hire, and the remainder (£326,000) appears in the
miscellaneous category. Library costs11 totalled £115,000.
This content downloaded from 91.238.114.202 on Sat, 28 Jun 2014 13:19:03 PMAll use subject to JSTOR Terms and Conditions
258
TABLE 18
Open University 1973 Course Offerings
Faculty Title of Course Credit
Rating
Arts Humanities: A Foundation Course 1
Mathematics Mathematics: A Foundation Course 1
Mathematics/Science/ Elementary Mathematics for Science &
Technology Technology 1/2
Science Science: A Foundation Course 1
Social Sciences Understanding Society: A Foundation Course 1
Technology The Man-Made World: A Foundation Course 1
Arts Renaissance and Reformation 1
The Age of Revolutions 1
General Science and the Rise of Technology since
1800 1/2 Integrative Studies 1: Design Methods 1/2
Social Sciences Decision Making in Britain 1
New Trends in Geography 1/2
National Income and Economic Policy 1/2 The Sociological Perspective 1/2 Fundamentals of Psychology 1/2 Prices and Markets 1 /2
Educational Studies Personality Growth and Learning 1/2 School and Society 1/2 The Curriculum: Context, Design and
Development 1/2 Mathematics Linear Mathematics 1
Mathematics: Continuous and Discrete 1
An Algorithmic Approach to Computing 1/2
Mathematics/Science/ Elementary Mathematics for Science and
Technology Technology 1/2 Mechanics and Applied Calculus 1/2
Mathematics/Social
Science/Educational Statistics 1/2 Studies
Science Comparative Physiology 1/3
Geology 1/3
An Introduction to the Chemistry of
Carbon Compounds 1/3
Structure, Bonding, and the Periodic Law 1/3 The Earth's Resources 1/3
Biochemistry 1 /6
Geochemistry 1/6 Environment 1 / 6
Geophysics 1 /6
Development and Genetics 1/6
This content downloaded from 91.238.114.202 on Sat, 28 Jun 2014 13:19:03 PMAll use subject to JSTOR Terms and Conditions
259
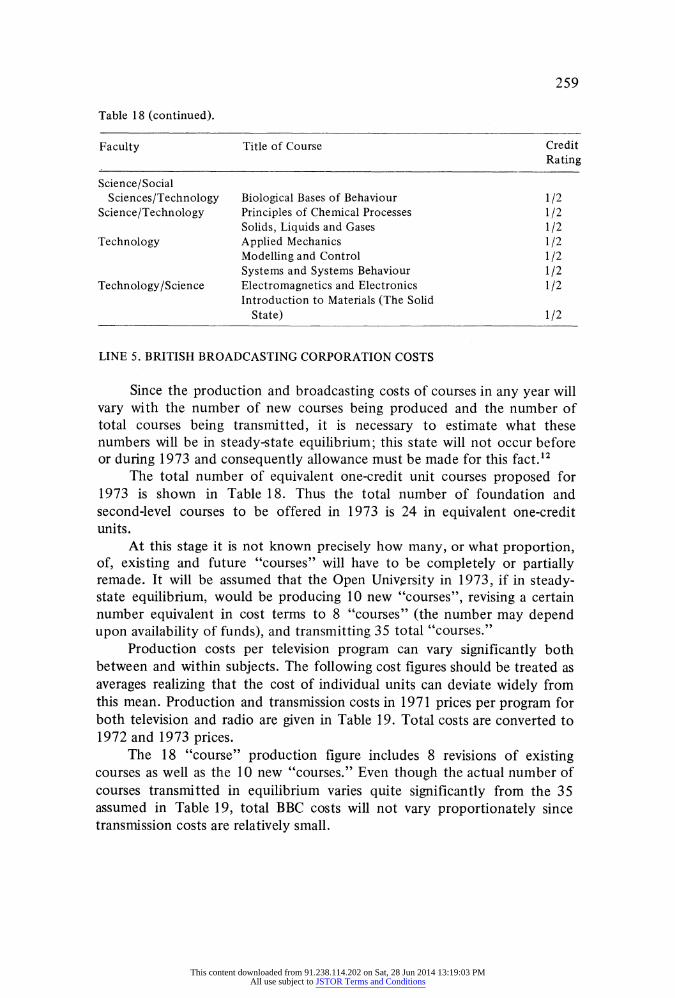
Table 18 (continued).
Faculty Title of Course Credit
Rating
Science/Social
Sciences/Technology Biological Bases of Behaviour 1/2 Science/Technology Principles of Chemical Processes 1/2
Solids, Liquids and Gases 1/2 Technology Applied Mechanics 1/2
Modelling and Control 1/2 Systems and Systems Behaviour 1/2
Technology/Science Electromagnetics and Electronics 1/2 Introduction to Materials (The Solid
State) 1/2
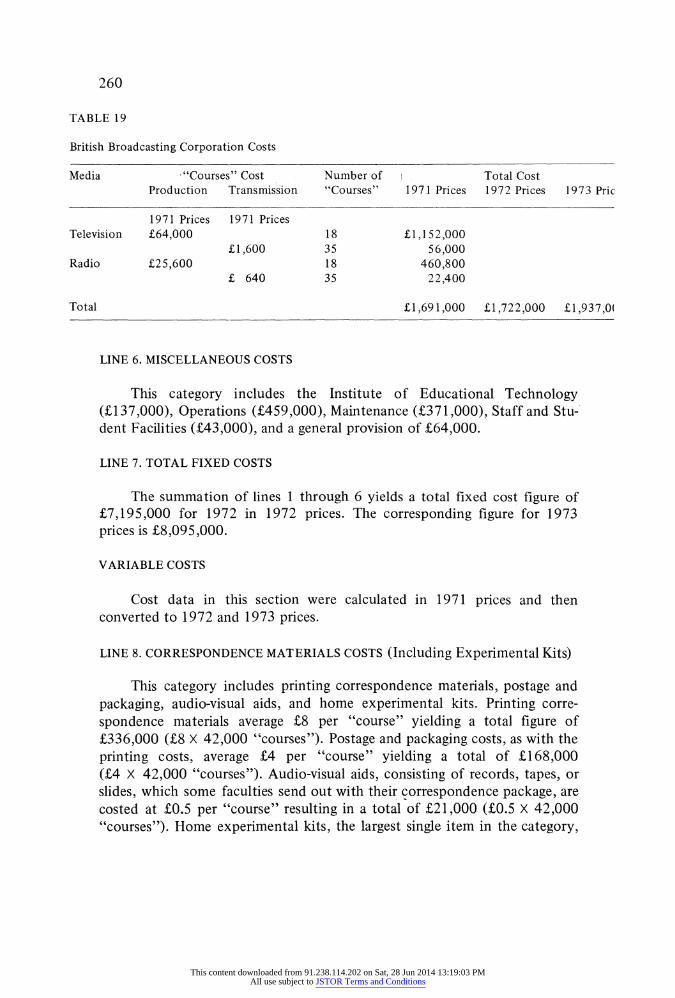
LINE 5. BRITISH BROADCASTING CORPORATION COSTS
Since the production and broadcasting costs of courses in any year will
vary with the number of new courses being produced and the number of total courses being transmitted, it is necessary to estimate what these numbers will be in steady-state equilibrium; this state will not occur before or during 1973 and consequently allowance must be made for this fact.12
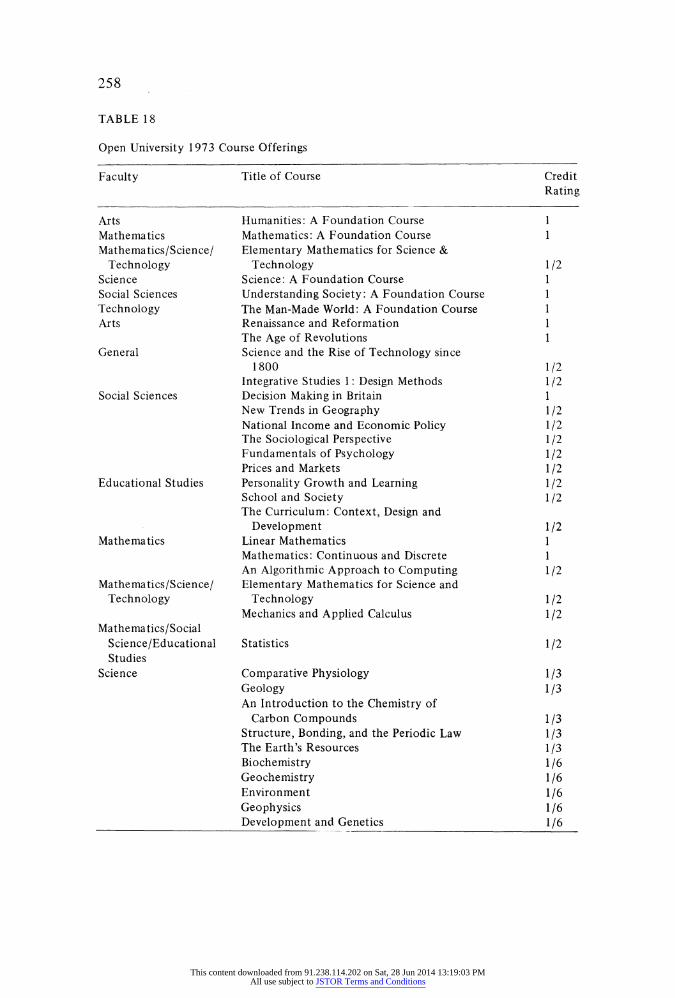
The total number of equivalent one-credit unit courses proposed for
1973 is shown in Table 18. Thus the total number of foundation and
second-level courses to be offered in 1973 is 24 in equivalent one-credit units.
At this stage it is not known precisely how many, or what proportion, of, existing and future "courses" will have to be completely or partially remade. It will be assumed that the Open University in 1973, if in steady state equilibrium, would be producing 10 new "courses", revising a certain
number equivalent in cost terms to 8 "courses" (the number may depend upon availability of funds), and transmitting 35 total "courses."
Production costs per television program can vary significantly both between and within subjects. The following cost figures should be treated as
averages realizing that the cost of individual units can deviate widely from this mean. Production and transmission costs in 1971 prices per program for both television and radio are given in Table 19. Total costs are converted to 1972 and 1973 prices.
The 18 "course" production figure includes 8 revisions of existing courses as well as the 10 new "courses." Even though the actual number of
courses transmitted in equilibrium varies quite significantly from the 35 assumed in Table 19, total BBC costs will not vary proportionately since transmission costs are relatively small.
This content downloaded from 91.238.114.202 on Sat, 28 Jun 2014 13:19:03 PMAll use subject to JSTOR Terms and Conditions
260
TABLE 19
British Broadcasting Corporation Costs
Media "Courses" Cost Number of ; . Total Cost
Production Transmission "Courses" 1971 Prices 1972 Prices 1973 Pric
1971 Prices
Television £64,000
Radio £25,600
1971 Prices
18 £1,152,000
£1,600 35 56,000 18 460,800
£ 640 35 22,400
Total £1,691,000 £1,722,000 £1,937,0*
LINE 6. MISCELLANEOUS COSTS
This category includes the Institute of Educational Technology (£137,000), Operations (£459,000), Maintenance (£371,000), Staff and Stu
dent Facilities (£43,000), and a general provision of £64,000.
LINE 7. TOTAL FIXED COSTS
The summation of lines 1 through 6 yields a total fixed cost figure of
£7,195,000 for 1972 in 1972 prices. The corresponding figure for 1973
prices is £8,095,000.
VARIABLE COSTS
Cost data in this section were calculated in 1971 prices and then
converted to 1972 and 1973 prices.
LINE 8. CORRESPONDENCE MATERIALS COSTS (Including Experimental Kits)
This category includes printing correspondence materials, postage and
packaging, audio-visual aids, and home experimental kits. Printing corre
spondence materials average £8 per "course" yielding a total figure of
£336,000 (£8 X 42,000 "courses"). Postage and packaging costs, as with the
printing costs, average £4 per "course" yielding a total of £168,000
(£4 X 42,000 "courses"). Audio-visual aids, consisting of records, tapes, or
slides, which some faculties send out with their correspondence package, are
costed at £0.5 per "course" resulting in a total of £21,000 (£0.5 X 42,000
"courses"). Home experimental kits, the largest single item in the category,
This content downloaded from 91.238.114.202 on Sat, 28 Jun 2014 13:19:03 PMAll use subject to JSTOR Terms and Conditions
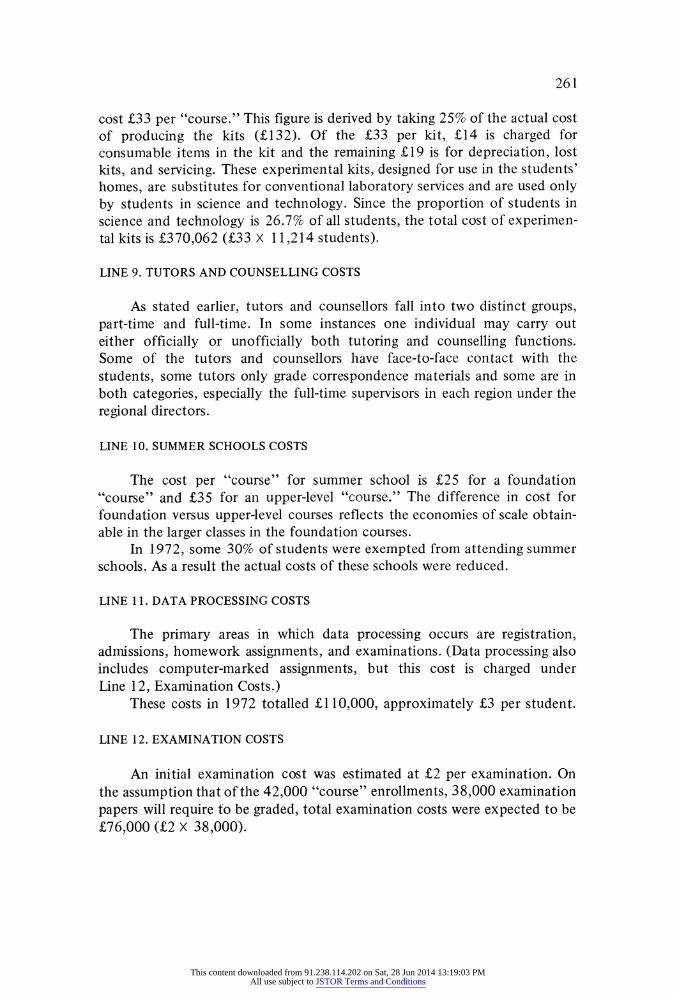
261
cost £33 per "course." This figure is derived by taking 25% of the actual cost
of producing the kits (£132). Of the £33 per kit, £14 is charged for
consumable items in the kit and the remaining £19 is for depreciation, lost
kits, and servicing. These experimental kits, designed for use in the students'
homes, are substitutes for conventional laboratory services and are used only
by students in science and technology. Since the proportion of students in
science and technology is 26.7% of all students, the total cost of experimen tal kits is £370,062 (£33 X 11,214 students).
LINE 9. TUTORS AND COUNSELLING COSTS
As stated earlier, tutors and counsellors fall into two distinct groups,
part-time and full-time. In some instances one individual may carry out
either officially or unofficially both tutoring and counselling functions.
Some of the tutors and counsellors have face-to-face contact with the
students, some tutors only grade correspondence materials and some are in
both categories, especially the full-time supervisors in each region under the
regional directors.
LINE 10. SUMMER SCHOOLS COSTS
The cost per "course" for summer school is £25 for a foundation
"course" and £35 for an upper-level "course." The difference in cost for
foundation versus upper-level courses reflects the economies of scale obtain
able in the larger classes in the foundation courses.
In 1972, some 30% of students were exempted from attending summer
schools. As a result the actual costs of these schools were reduced.
LINE 11. DATA PROCESSING COSTS
The primary areas in which data processing occurs are registration,
admissions, homework assignments, and examinations. (Data processing also
includes computer-marked assignments, but this cost is charged under
Line 12, Examination Costs.) These costs in 1972 totalled £110,000, approximately £3 per student.
LINE 12. EXAMINATION COSTS
An initial examination cost was estimated at £2 per examination. On
the assumption that of the 42,000 "course" enrollments, 38,000 examination
papers will require to be graded, total examination costs were expected to be
£76,000 (£2 X 38,000).
This content downloaded from 91.238.114.202 on Sat, 28 Jun 2014 13:19:03 PMAll use subject to JSTOR Terms and Conditions
262
The costs in this category have increased considerably from these
original estimates. The only explanation for this fact is that the original estimates were based on a per-student cost which has since proved un
realistic.
LINE 13. REGIONAL ADMINISTRATION COSTS
Since all of the costs in this category have now been attributed to the
fixed costs area for the reasons already given, there is no entry in the variable
costs category.
LINE 14. RENTAL COSTS
As discussed earlier the price charged to the Open University for rental
of buildings for tutorials is determined either by a central or local authority in charge of each building and may vary from zero to some figure covering cost. This is an area of OU operations significantly subsidized by local and
central government.
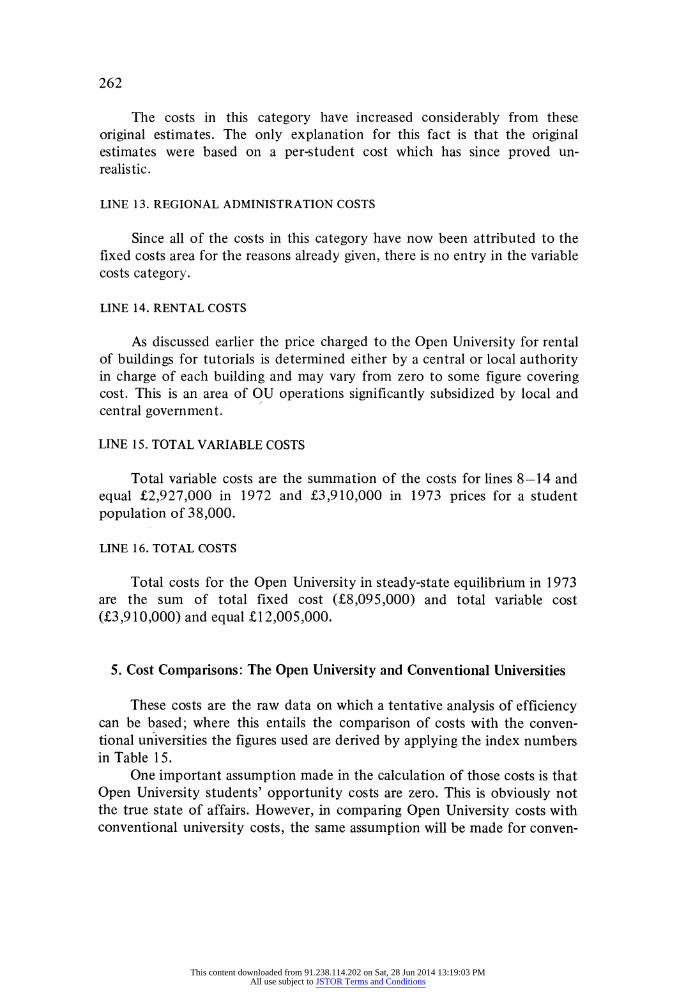
LINE 15. TOTAL VARIABLE COSTS
Total variable costs are the summation of the costs for lines 8—14 and
equal £2,927,000 in 1972 and £3,910,000 in 1973 prices for a student
population of 38,000.
LINE 16. TOTAL COSTS
Total costs for the Open University in steady-state equilibrium in 1973 are the sum of total fixed cost (£8,095,000) and total variable cost
(£3,910,000) and equal £12,005,000.
5. Cost Comparisons: The Open University and Conventional Universities
These costs are the raw data on which a tentative analysis of efficiency can be based; where this entails the comparison of costs with the conven
tional universities the figures used are derived by applying the index numbers in Table 15.
One important assumption made in the calculation of those costs is that
Open University students' opportunity costs are zero. This is obviously not the true state of affairs. However, in comparing Open University costs with conventional university costs, the same assumption will be made for conven
This content downloaded from 91.238.114.202 on Sat, 28 Jun 2014 13:19:03 PMAll use subject to JSTOR Terms and Conditions
263
tional university students. Since one purpose of the study is to compare costs by type of institution, all student opportunity costs will be ignored
because, while it is not its main purpose, an Open University could be
substituted for a conventional university. It is now possible to consider the question of the cost of education
using the Open University system compared to the cost of conventional
universities. This is a question for which it is not possible to formulate a
precise answer because the comparison between the two requires a definition
of output, and there is more than one way of defining what is meant by the
output of an educational process. If any decisions are to be made which are based on per-student costs in
the two types of university, we must be careful not to abdicate the decision
making process by choosing particular student equivalences. The real ques tion involves determining the returns from resources allocated on an Open
University student compared to allocations on a conventional student; this
cannot be resolved by using arbitrary methods of "equating" the two types of students. The use of equivalents may have the unfortunate effect of
providing a seemingly plausible answer which in fact diverts attention from
the crucial question of understanding the Open University output. We are in no position at the moment to evaluate the output of a
student year in the Open University compared to a student year in a
conventional university; this would involve the use of an educational assess
ment method which at the moment can hardly be visualized in principle. But
the fact that such a direct measure of output does not exist does not leave us
completely at an impasse; this is because the degree which the Open
University ultimately awards is at the moment generally regarded as equiva lent to the degree awarded by a conventional university. If the ultimate
output is regarded as homogeneous then the contribution which each
element of the course makes towards this final output can also be regarded as homogeneous. The question of comparing the year which a student spends
studying in the two types of university can then be expressed as follows:
"What is the contribution towards the final degree of an average student year in the Open University compared to an average student year in a conven
tional university?" There are at least four ways of approaching this question, and each of these provides the basis for a different calculation of equivalence between Open University and conventional university students.
The first possibility is to accept that a cost or input study such as this
can say very little about outputs. The calculation would simply be to find
out the cost of educating the average Open University student for a year
compared to that of educating the average conventional student for a year; the reason for any differences could subsequently be discussed in the light of
a number of output issues. At some point the decision has to be made on
This content downloaded from 91.238.114.202 on Sat, 28 Jun 2014 13:19:03 PMAll use subject to JSTOR Terms and Conditions
264
whether the returns on the money spent per student are acceptable. A second method involves time taken to complete a degree. Since the
bulk of conventional students take the honours degree, and on the basis of
present evidence it would appear that most graduates of the OU will aspire to the honours degree, it is perhaps more appropriate to consider the
contribution which two courses would make to the completion of the
honours degree. The requirement of the OU for an honours degree is eight course credits. Thus two courses in one year contribute one-fourth, and thus
the calculation of student equivalents must be weighted to account for this.
Since a conventional student can obtain the honours degree in three years, and since the OU student is regarded as a half-time student, the weighting of
course units to be used is therefore 3/4 X 1/2 = 3/8. The third possibility is to adapt this approach to take account of the
fact that the average student in the Open University does not have to
complete six or eight courses for the degree because there is an exemption
system in operation. This results in a considerable reduction in the average time required to gain an Open University degree. The time to complete the
ordinary degree, assuming the student takes 1.1 courses per year and is
granted 1.4 exemptions, is 4.1 years; if the pattern is the same for those who
go on to honours, the time required would be 6 years. We can here assume
that the exemptions awarded by conventional universities are negligible, and
that the average length of time required for a degree is three years. This
means that in terms of the ordinary degree the Open University student year is 3 -5- 4.1 that of the conventional university student year, while if the basis
of comparison is the honours degree then the equivalent is 3-^6. The
calculation therefore involves the actual number of students in the Open
University weighted by these ratios to arrive at the full-time equivalent. The final possibility is to calculate the cost per graduate: the rationale
for the derivation of the previous methods is that the degrees awarded are
homogeneous. This is, of course, an incomplete measure of output since the
Open University is not merely a "degree-producing factory" and since the
procedure allows no weight to be attached to the educational benefits to be
gained from nongraduating students. Furthermore, the costs involved will
depend on the graduation rate and at the moment the information available
on this refers only to one year. At the moment a graduation rate of 27% in
steady state, giving 4,000 graduates per year, seems to have general accept
ance, but the calculations are also carried out for 20% and 40% graduation rates to indicate the effect which could result from different actual rates.
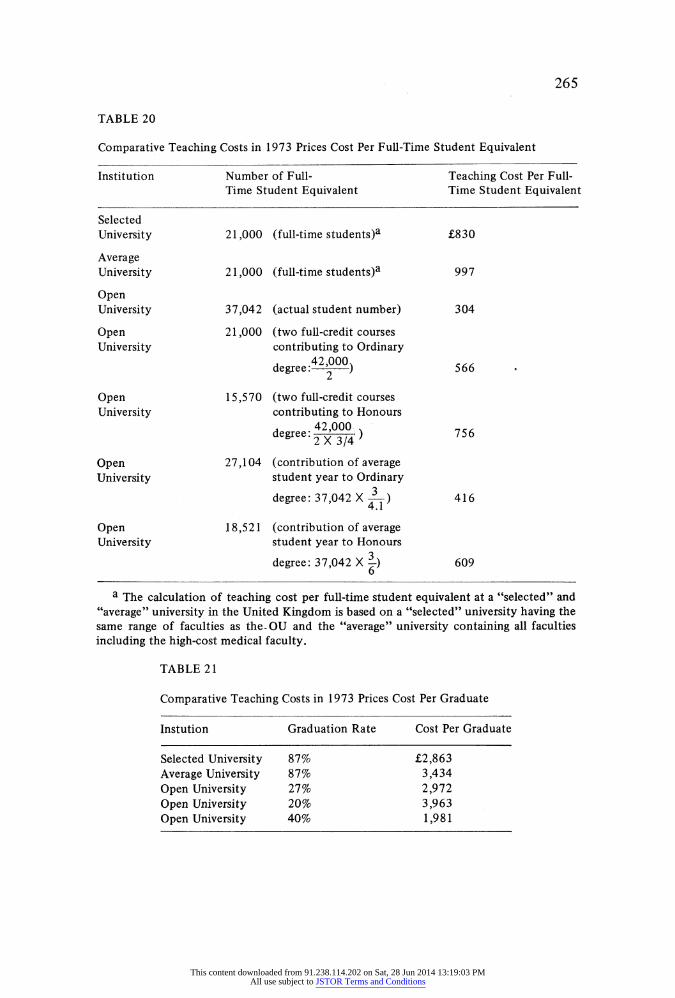
The cost per full-time student equivalent obtained from the application of the first three methods outlined above is set out in Table 20; the cost per
graduate is set out in Table 21.
This content downloaded from 91.238.114.202 on Sat, 28 Jun 2014 13:19:03 PMAll use subject to JSTOR Terms and Conditions
265
TABLE 20
Comparative Teaching Costs in 1973 Prices Cost Per Full-Time Student Equivalent
Institution Number of Full
Time Student Equivalent
Teaching Cost Per Full
Time Student Equivalent
21,000 (full-time students)3
21,000 (full-time students)3
37,042 (actual student number)
21,000 (two full-credit courses
contributing to Ordinary
,42,000, degree -)
15,570 (two full-credit courses
contributing to Honours
, 42,000 , degree: 2 X 374 }
27,104 (contribution of average
student year to Ordinary
degree: 37,042 X ~)
18,521 (contribution of average student year to Honours
degree: 37,042 X h 6
£830
997
304
566
756
416
609
a The calculation of teaching cost per full-time student equivalent at a "selected" and
"average" university in the United Kingdom is based on a "selected" university having the
same range of faculties as the-OU and the "average" university containing all faculties
including the high-cost medical faculty.
TABLE 21
Comparative Teaching Costs in 1973 Prices Cost Per Graduate
Instution Graduation Rate Cost Per Graduate
Selected University 87% £2,863 Average University 87% 3,434 Open University 27% 2,972 Open University 20% 3,963 Open University 40% 1,981
This content downloaded from 91.238.114.202 on Sat, 28 Jun 2014 13:19:03 PMAll use subject to JSTOR Terms and Conditions
266
It is clear that in terms of the actual numbers of students educated the
Open University is considerably less costly than the conventional system : the
cost of providing education for a year in the Open University is 37% of that
incurred in the "selected" university and 30% of that in the "average"
university. As explained above, any judgment on the returns to the two
types of student year would depend on a study of outputs. When the
attempt is made to adjust the numbers of students according to the notions
of equivalence it would appear that the Open University still maintains its
cost advantage; the important question is by how much. The figures are
particularly susceptible to whether the Open University ordinary or honours
degree is compared with the average degree awarded by the conventional
university. The assumption that the Open University ordinary degree is equal to the average degree of the conventional university is clearly weak, and the
alternative of comparing the honours degree of the Open University indicates
that the cost advantage of the Open University could be at the most 27% and
may be as low as 9%. It would appear that on the basis of Table 21 the Open University
per-degree cost is not very much different from that of the conventional
university on the assumption of the 27% graduation rate. If the graduation rate were to fall below this, the cost per graduate would be higher. On the
other hand if the graduation rates were even to be half those of the
conventional system, then there is no doubt that the costs per graduate would be relatively low.
Although these figures are striking, there are a number of issues which
are not covered by this presentation. For example, the calculations of degree costs are based on an annual intake of 15,000 students and a steady-state
population of 38,000; however, the Open University was originally intended
to accommodate 55,000 students. It would be of interest to investigate the
cost implications of increasing the Open University to this size. This is not a
question to which a precise answer can be formulated given the information
available at the moment, but some indication of the magnitudes involved can
be obtained. If it is assumed that the additional students would have similar
characteristics to the present Open University population, the required entry rate would be approximately 20,000 students per year. Since the University was designed for 55,000 students the fixed costs can be treated as largely
unchanged at £8,095,000. If it is assumed that there will be no significant economies of scale, then the variable costs will increase to 55/38 X
£3,910,000 = £5,659,000; the total costs would then be £13,754,000. If the
graduation rate were assumed to be 27%, then the stream of graduates would
be 20,000 X .27 = 5,400 in steady state, which would result in a cost per
graduate of £2,547. This is considerably less than the calculated cost per
graduate in the "selected" university as shown in Table 21.
This content downloaded from 91.238.114.202 on Sat, 28 Jun 2014 13:19:03 PMAll use subject to JSTOR Terms and Conditions
267
TABLE 22 Teaching Costs by Institution with Increased Enrollment
Teaching Costs (in £000s) Institution Student Fixed Variable Cost Per Full-time
Equivalent Student Equivalent
Selected University 21,000 Zero 17,437 830 30,400 Zero 25,284 830
Average University 21,000 Zero 20,933 997 30,400 Zero 30,353 997
Open University 21,000 7,978 3,293 542
30,400 7,978 4,775 423
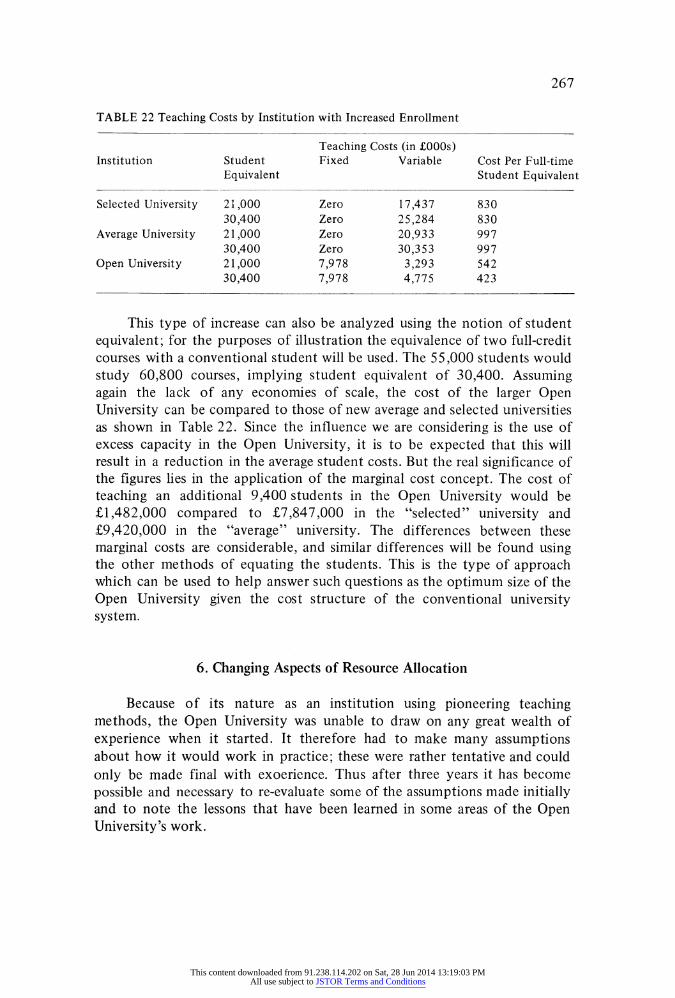
This type of increase can also be analyzed using the notion of student
equivalent; for the purposes of illustration the equivalence of two full-credit
courses with a conventional student will be used. The 55,000 students would
study 60,800 courses, implying student equivalent of 30,400. Assuming
again the lack of any economies of scale, the cost of the larger Open
University can be compared to those of new average and selected universities
as shown in Table 22. Since the influence we are considering is the use of
excess capacity in the Open University, it is to be expected that this will result in a reduction in the average student costs. But the real significance of the figures lies in the application of the marginal cost concept. The cost of
teaching an additional 9,400 students in the Open University would be
£1,482,000 compared to £7,847,000 in the "selected" university and
£9,420,000 in the "average" university. The differences between these
marginal costs are considerable, and similar differences will be found using the other methods of equating the students. This is the type of approach which can be used to help answer such questions as the optimum size of the
Open University given the cost structure of the conventional university system.
6. Changing Aspects of Resource Allocation
Because of its nature as an institution using pioneering teaching methods, the Open University was unable to draw on any great wealth of
experience when it started. It therefore had to make many assumptions about how it would work in practice; these were rather tentative and could
only be made final with exoerience. Thus after three years it has become
possible and necessary to re-evaluate some of the assumptions made initially and to note the lessons that have been learned in some areas of the Open
University's work.
This content downloaded from 91.238.114.202 on Sat, 28 Jun 2014 13:19:03 PMAll use subject to JSTOR Terms and Conditions
268
While many of the assumptions (about pass rates, course production
rates, etc.) have had to be re-evaluated generally for the Open University certain financial implications have had to be taken care of, the main problem now seems to be not overall assumptions about the workings of the Open
University, but the re-evaluations which have had to be made for the
different faculties; problems arise which necessitate a re-evaluation of re
source allocation between faculties within the Open University owing to
different costs/student and costs/graduate as a consequence of interfaculty differences in course production costs and in student performance.
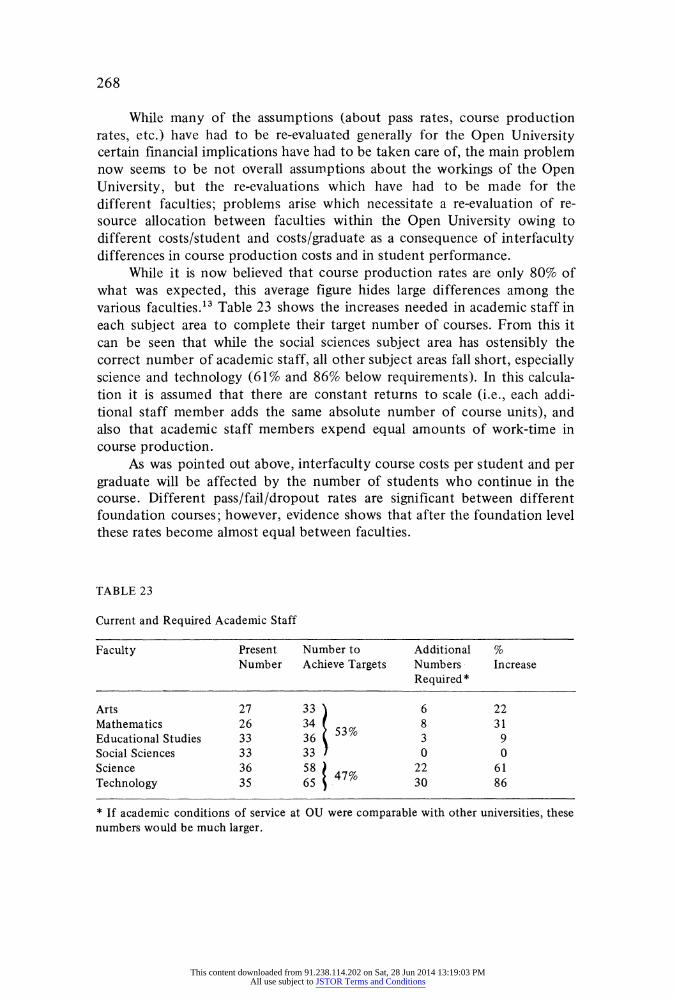
While it is now believed that course production rates are only 80% of
what was expected, this average figure hides large differences among the
various faculties.13 Table 23 shows the increases needed in academic staff in
each subject area to complete their target number of courses. From this it
can be seen that while the social sciences subject area has ostensibly the
correct number of academic staff, all other subject areas fall short, especially science and technology (61% and 86% below requirements). In this calcula
tion it is assumed that there are constant returns to scale (i.e., each addi
tional staff member adds the same absolute number of course units), and
also that academic staff members expend equal amounts of work-time in
course production. As was pointed out above, interfaculty course costs per student and per
graduate will be affected by the number of students who continue in the course. Different pass/fail/dropout rates are significant between different
foundation courses; however, evidence shows that after the foundation level
these rates become almost equal between faculties.
TABLE 23
Current and Required Academic Staff
Faculty Present Number to Additional %
Number Achieve Targets Numbers Increase
Required*
Arts 27 33 1 | 6 22 Mathematics 26 34 ( ' 53%
8 31 Educational Studies 33 36 ( 3 9 Social Sciences 33 33 - 1 0 0
Science 36 58 J
| 47% 22 61 Technology 35 65 ] 30 86
* If academic conditions of service at OU were comparable with other universities, these
numbers would be much larger.
This content downloaded from 91.238.114.202 on Sat, 28 Jun 2014 13:19:03 PMAll use subject to JSTOR Terms and Conditions
269
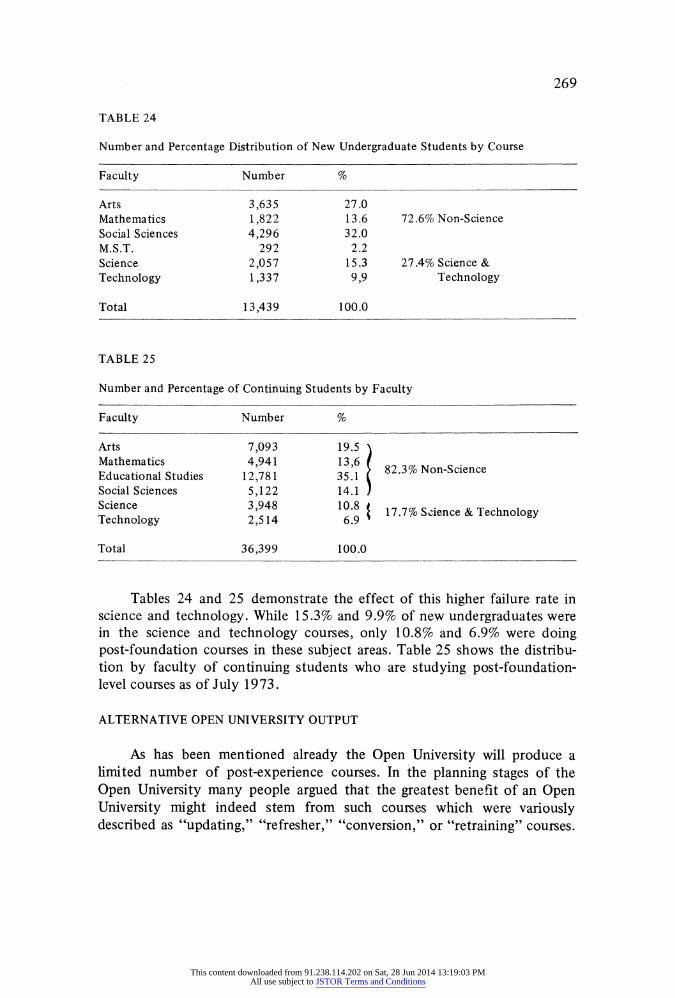
TABLE 24
Number and Percentage Distribution of New Undergraduate Students by Course
Faculty Number %
Arts 3,635 27.0
Mathematics 1,822 13.6 72.6% Non-Science
Social Sciences 4,296 32.0
M.S.T. 292 2.2 Science 2,057 15.3 27.4% Science &
Technology 1,337 9,9 Technology
Total 13,439 100.0
TABLE 25
Number and Percentage of Continuing Students by Faculty
Faculty Number %
Arts 7,093
Mathematics 4,941
Educational Studies 12,781 Social Sciences 5,122 Science 3,948
Technology 2,514
Total 36,399
19.5 \
35'j [ 82.3% Non-Science
14.1 )
^6 9 ^ 17.7% Science & Technology
100.0
Tables 24 and 25 demonstrate the effect of this higher failure rate in science and technology. While 15.3% and 9.9% of new undergraduates were in the science and technology courses, only 10.8% and 6.9% were doing post-foundation courses in these subject areas. Table 25 shows the distribu
tion by faculty of continuing students who are studying post-foundation level courses as of July 1973.
ALTERNATIVE OPEN UNIVERSITY OUTPUT
As has been mentioned already the Open University will produce a
limited number of post-experience courses. In the planning stages of the
Open University many people argued that the greatest benefit of an Open University might indeed stem from such courses which were variously described as "updating," "refresher," "conversion," or "retraining" courses.
This content downloaded from 91.238.114.202 on Sat, 28 Jun 2014 13:19:03 PMAll use subject to JSTOR Terms and Conditions
270
Courses of this kind provide either for people to keep up to date with
developments in their own specialized field of work in a time of accelerating
technological change, or for teaching people a new skill for a new occupation because that very technological change has made their former specialty obsolete. It is true that in the United Kingdom, as in most developed countries, there is no shortage of the post-experience type of course, but
since many employers are unwilling or unable to grant leave-of-absence for
full-time study to their employees, the advantage of the Open University
system lies in the fact that individuals can continue full-time employment and take these courses in their leisure time.
While the Open University intends in the future to produce a wide
range of post-experience courses, thus bringing the university to the people rather than bringing the people to the university, it was felt that the Open
University's name had to be firmly established and academic creditability
gained through its undergraduate program before launching into the post
experience field.
The development of any type of course involves substantial resources, and the Open University faces a cash-flow problem in the post-experience field even if, as is intended, the course fees cover the entire cost of producing and operating the course since a one- to two-year time lag exists between the
beginning of course development and the collection of fees.
Because of stringent government control of financing, the Open Univer
sity may have to seek outside funding from those industries, to which
benefits will accrue from Open University post-experience courses, for the
development of such courses.
ENROLLMENT OF EIGHTEEN-YEAR-OLDS
One interesting development, forced on the Open University by the
government, which was not the original intention of the Open University
planners involves the admission of eighteen-year-olds and constitutes another
Open University output. The Open University was not set up to compete with conventional universities for students and, to this end, no one under the
age of twenty-one years was eligible for enrollment.14 The lack of entrance
qualifications essentially made the Open University the university of a
"second chance". In 1974, 571 eighteen-year-olds will be enrolled, 376 of
whom will not meet conventional university entrance requirements. The
remaining 195 would have been eligible to attend a conventional university had they so chosen. The Open University emphasizes the fact that this is an
experimental venture which has two main purposes. The first is to determine
the suitability of the Open University system with its nontraditional teaching format for students just out of high school who may lack the maturity and
This content downloaded from 91.238.114.202 on Sat, 28 Jun 2014 13:19:03 PMAll use subject to JSTOR Terms and Conditions
271
self-discipline, in comparison with the normal Open University intake, to
complete an Open University degree. The second is to find out whether some
of the Open University courses could be substituted for courses currently
taught to full-time students in other institutions of higher learning. In many such institutions specializing in one field, e.g., engineering, considerable
resources must be devoted to providing their specialist students with at least
an introduction to liberal studies. Were the Open University courses sub
stitutable, economies of scale could be realized by having these courses
taught by the Open University and resources freed within these specialist institutions. This additional market for those courses would also provide the
Open University with needed extra finances.
CHANGES IN THE MIX OF OPEN UNIVERSITY FACTOR INPUTS
The Open University experiment has been watched closely not only for
its impact on adult student education but also for the cost implications of its
adopted method of tuition. These cost implications have been discussed
above. This section will explore the cost implications, based on the experi ence of the Open University, of alternative models of tuition.
The Open University uses a combination of methods, the mix varying between different courses and levels of study. At this point it might be
useful to repeat them briefly.
Correspondence Material — Prepared by staff members and linked to
particular set books.
Assessment and Assignment Material — Objective and tutor-marked
tests to enable both the student and the University to evaluate the
student's understanding of the material.
Broadcasting — Television and radio programs linked to correspondence material.
Home Experimental Kits — Used by science and technology students to
enable experiments to be undertaken at home.
Audio-Visual Aids — Records, tapes, photographs or slides used by certain courses as teaching material.
Personal Tuition — Weekly, fortnightly, or monthly sessions with tutor
and counsellor. These are less frequent at post-foundation-level courses.
Summer Schools or Day Schools — Week, weekend, or day of tuition.
Compulsory foundation-level tuition of one week's continuous dura
tion; weekend or day tuition is more likely to be used for post foundation-level courses.
From the data already analyzed, one can trace the broad implications
This content downloaded from 91.238.114.202 on Sat, 28 Jun 2014 13:19:03 PMAll use subject to JSTOR Terms and Conditions
272
of different factor input mixes. A more detailed study of the cost implica tions of three alternatives is provided below. The alternatives are:
1. To delete correspondence tuition, substituting this with a far larger
broadcasting component which would become the main element of tuition,
supplemented by the existing personal tuition services.
2. To delete broadcasting, using the resources for a larger element of
personal tuition and maintaining the present correspondence element.
3. To substitute radio for television broadcasting, using the resources
released for a greater element of personal tuition.
The analysis assumes all other factors in the Open University system remain the same, i.e., 10 hours per week of study per full-time course
equivalent, 37 equivalent full-credit courses over 6 faculties with an average of 10 new courses per year.
Alternative 1 - Delete correspondence tuition and replace by broad
casts.15
Practical considerations rule out this alternative for part-time students
in the United Kingdom. The constraint with part-time students is that
broadcasting can only take place in the early morning (0600 to 0800),
evening (1800 to midnight) and weekends (0900 to midnight). This provides a total transmission time of 70 hours. With 37 courses this allows less than
2 hours per course per week; and, if broadcasting is to become the main
tuition component, then allowance will have to be made for broadcasts to be
repeated. This would mean less than 1 hour of television and 1 hour of radio
per week per course which are probably insufficient to meet the educational
objectives of this alternative.
In the United States, however, it may be feasible to use this alternative
for full-time students so that daytime transmission can be used. It may therefore be useful to give some broad indication of the cost alternatives.
Assuming 10 hours total study per course per week, some 5 hours
might be devoted to broadcasting made up of 2 hours television and 3 hours
radio. The cost implications show wide variations according to the assump tions made about broadcasting costs! The data given, however, allow the cost
implications of alternative assumptions about broadcasting mix to be cal
culated.
Television costs average £8,000 per hour. There may be some econo
mies of scale with longer programs, but more television time is likely to
involve more programs of the same length, rather than longer programs. More programs may also produce economies of scale through the shift use of
television studios. Assuming constant returns to scale, the television produc tion costs of a unit of two hours' television will be £16,000, amounting to a
full 32-unit cost of £512,000. With 10 new full credit courses, as at present,
This content downloaded from 91.238.114.202 on Sat, 28 Jun 2014 13:19:03 PMAll use subject to JSTOR Terms and Conditions
273
this gives a total television production cost of £5,120,000. Transmission costs are more difficult to calculate. The cost of £100 per
half hour is the marginal use of the existing BBC—2 transmitter. The
transmitting costs given by Pratten16 for the operating costs of a new station seem more appropriate, as the system is likely to require 148 hours of transmission per week (37 courses X 2 hours X 2 hours for repeats). This
produces transmission costs of £2 million if 80 percent of the population is
covered, and this is the figure budgeted. Radio production costs amount to £2,000 per hour. Therefore, a
32-week course of 3 hours per week produces radio costs of £192,000, which for 10 new courses amounts to £1,920,000 per annum.
Transmission costs are approximately £50 per hour. Thus for 3 hours
per week for 32 weeks for 37 courses the total cost is £177,600. The overall
costs of 2 hours television and 3 hours radio per week for 37 courses for
32 weeks amount to £9.2 m (television production £5.0 m + television trans
mission £2.0 + radio production £2.0 + radio transmission £0.2). Total
broadcasting costs will be about £9 million compared to £1.70 million at
present.
Savings will occur in correspondence services, publishing, and media
and amount in total to about £250,000. However, a larger number of
programs will require more video and audio tapes for study centers. As
suming constant costs this could amount to an extra cost of nearly £1 mil
lion. Therefore, there is a net cost to other areas of the University of about
£750,000. The total increase in fixed costs would come to about £8 million.
Direct student cost. Having no correspondence material saves printing costs of just over £400,000 for 38,000.students. Postage, home experimental
kits, tuition, and counselling would still be required, so an average reduction of only about £11 per student might be expected.
It is clear from the above figures why the original concept of the
University of the Air in the United Kingdom was abandoned. There are
practical difficulties in providing enough air time for a large number of
courses and the overall effect of substituting 2 hours television and 3 hours
radio for the present correspondence material is likely to double the cost per student.
Alternative 2 — Delete broadcasting and use the resourses to provide a
larger element of personal tuition maintaining the present level of corre
spondence tuition.
As a result of abolishing broadcasting some £1.7 million would be
saved. How much extra tuition will this buy and what are the cost implica tions of changing student numbers? The problem in this comparison is that
broadcasting costs are fixed, whereas tuition costs vary with students numbers.
Part-time tuition and counselling costs average less than £30 per student
This content downloaded from 91.238.114.202 on Sat, 28 Jun 2014 13:19:03 PMAll use subject to JSTOR Terms and Conditions
274
course. Thus if the £1.7 million saved by deleting broadcasting were spread over the 42,000 "courses" part-time tuition could be more than doubled
and, if economies of scale exist, it might be possible to triple this activity. It should be emphasized that no assumption is being made about what
form the extra tuition might take. It could take the form of more tutor
marked assignments, more evening tutorials, day or weekend tutorials, or
summer schools. By adopting this alternative, however, the Open University would not differ significantly from many of the existing institutions which
provide a mix of correspondence and personal tuition services. In addition, the innovative nature of the Open University in harnessing the media of
television and radio for educational purposes would be lost.
Alternative 3 — To substitute radio for television, allowing the re
sources released to be used for a greater element of personal tuition.
Total broadcasting costs will amount to approximately £1.7 m in 1973.
Of this, television costs are approximately £1.4 m and radio £0.3 m. If radio
programs were to be substituted on a one-to-one basis for Open University television programs instead of having 300 television productions, 1,300 television transmissions, 300 radio productions and 1,250 radio trans
missions, the Open University could produce 600 radio programs and 2,500 radio transmissions.
If constant costs are assumed in radio production and transmission, there will be a saving of £1.4 m from television and an additional cost of £0.3 m for the extra radio programs producing a net saving of £1.1 m. At an
approximate cost of £30 per student this would enable tutorial provision to be doubled for 38,000 students.
As with alternative 2, appeal and potential effectiveness of carefully prepared televised lectures would be lost.
7. Conclusion
What does emerge from this research is that the British Open University
using existing technologies has sound comparative cost reasons for its
existence; its comparative benefits will only be realized in the fullness of
time when data become available. Additional research on the operation of a
potential United States Open University might well concentrate on the
application of new technologies to the model outlined above. For example, the potential of computer-assisted instruction has barely been tapped and the possibility of satellite communications systems for educational purposes remains virtually unexplored. While many conventional universities currently
This content downloaded from 91.238.114.202 on Sat, 28 Jun 2014 13:19:03 PMAll use subject to JSTOR Terms and Conditions
275
employ, albeit to a limited extent, video and audio cassettes, closed circuit
television, programmed instruction, games, and cases, the high equipment costs and limited enrollments in any one institution inhibit all but the largest institutions from utilizing these techniques.
Because of the potential size of a United States OU student body, it
may be cost-effective for such an institution to develop materials using new
technologies even if the market were limited to its own students. The fact
that a potential market for such materials may well exist outside an OU is no
guarantee that any one smaller institution will be willing and able to
undertake both the costs and risks of production and distribution. Each
institution tends to be concerned with local, not global, educational efficien
cy. The latter may only be achieved by the introduction of an institution
whose scale dictates that it employ these new technologies to achieve
internal efficiency and which achieves global efficiency as a by-product
through small institutions which make use of those materials but bear only their marginal costs. Thus, the potential impact of an Open University is
twofold; it may well provide a public good to other institutions in the form
of lower cost materials made possible by exploiting economies of scale and
will also increase the educational options and opportunities for individuals
seeking higher education.
Many people in the United States argue that the need for an open
learning system has been amply demonstrated in the findings of the Carnegie Commision on Non-Traditional Studies, the Newman Commission, and other
bodies studying national educational policy. The State University of
Nebraska Project (SUN) with initial financing from the National Institute of
Education and grants from the Clark Foundation and National Endowment
for the Humanities appears to be the major open learning model to be
developing in the United States. A recently formed non-profit educational
corporation, the University of Mid-America (UMA) encompassing the states
of Nebraska, Kansas, Missouri and Iowa, will, beginning in 1975, be respon sible for the production of open learning multi-media courseware, with each
state having its own delivery system. In Nebraska, SUN will continue to be
that delivery system using the state's educational television network and
employing a network of learning centers where students can come for
advising, for meeting with faculty and other students and for review of, or
accelerated work on, course materials. Since comparative cost studies of
UMA-SUN and conventional US educational institutions are still in the
development stages, the model of an open learning system which will be
costed for the United States will be the British model. These data appear in
the Appendix to the paper, the remainder of which is concerned with the
potential impact of some type of open learning system in the United States.
This content downloaded from 91.238.114.202 on Sat, 28 Jun 2014 13:19:03 PMAll use subject to JSTOR Terms and Conditions
276
The Impact of the Open University on Existing Institutions
An Open University in the US can be expected to affect both the
demand and supply functions of other institutions of higher learning. If, as is
assumed for the UK Open University, the degree awarded by the US Open
University is to be equivalent to that of conventional universities, there
would undoubtedly be some students of conventional universities and col
leges who would prefer the Open University format since it would enable
them to obtain a degree without having to give up full-time or part-time
employment. This choice would be available not only to new students, but
also, assuming credits could be transferred, to students currently attending conventional institutions and to graduates who want a post-graduate degree on a part-time basis. At present the determinants of demand in this area are
not known.
Another source of Open University students consists of those trade,
business, or technical institutions which do not provide degrees, whose
students might thus be attracted to an Open University offering a much
wider variety of courses (as well as a possible degree) than currently are offered at separate institutions. A third major category consists of students
who, disillusioned by their experience in conventional higher education,
drop out, and, in seeking a second chance, find many conventional doors closed to them.
A fourth group of potential Open' University students underrepre sented in higher educational institutions, consists of racial minorities. A detailed analysis of California higher education17 indicates the marked degree of underrepresentation of minorities in higher education. Four principal reasons for this state of affairs are: (1) the severe high school dropout rates of many minorities; (2) the lack of encouragement, counselling, and
guidance; (3) the relatively high costs to the poorest sections of the com
munity in terms of income foregone in participating in full-time education; (4) the lack of educational institutions in poor areas. An Open University, with appropriate tutoring and counselling, can overcome many of these
disadvantages which the community and junior colleges cannot. While it is true that the British experience does not hold very much promise that a
significant number of applicants for an Open University-type of education will emerge from this group, it is also true that no incentives of the kind that are available to minority students in the US exist in the UK. The demand in this area is not, at present, being met by the existing institutions and its
extent is likely to remain unknown until an Open University or similar
university is actually established.
The third largest occupational group, after teachers and individuals in
the professions and the arts, applying for admission to the UK Open
This content downloaded from 91.238.114.202 on Sat, 28 Jun 2014 13:19:03 PMAll use subject to JSTOR Terms and Conditions
277
University consisted of housewives (9% of the total). Were a similar pattern to emerge in the US, the Open University would make available educational
opportunities to women unable to pursue higher education along conven
tional lines because of employment and/or family commitments. Since it has been found that the educational attainment of the mother has a major
impact on the learning of the children, the benefits of an Open University educational system would be magnified.
A sixth important category, already discussed in the British setting, consists of individuals seeking post-experience courses either to enhance their employment potential or to open up fields of study for consumption purposes. The recent upsurge of interest in the US for adult education
programs is evidence that the demand is not confined only to degree-level courses. Not only might individuals personally seek this post-experience education, but firms might also wish to provide opportunities for their
employees to take Open University courses, were the real costs to the firms
sufficiently modest; i.e., employees need not travel to take extended courses
and, with a sufficiently large audience, the price for the course should be less than for corresponding courses in existing institutions.
While it is relatively easy to identify groups which might benefit from
the establishment of a United States Open University, it is extremely difficult to estimate the potential demand with any degree of precision. The
British experience is not particularly helpful, partly because the British
estimates of potential Open University enrollment varied between 35,000 and 184,000 — and these estimates were obtained by carrying out a survey —
but also because, even if the estimates had been much less divergent, the US
and UK systems of education are in no way compatible; i.e., the "open"
system of the US cannot be compared with the "closed" system of the UK.
The relative benefits which the two systems confer on their societies is a
question for the comparative educationist; in this section, attention will be
confined to the merits of the US educational hierarchy with particular
emphasis on the lower strata, the two- and four-year colleges, and the
potential impact of a US Open University in this area.
In the discussion of future educational needs, two facts are apparent. The first is that by the end of this decade, the college and university
population of the US will number between 12,000,000 and 14,000,000,
representing an approximate increase of 50% in a relatively short time span. The second, if present trends are indicative of future events, is that an even
larger proportion of these future students will fail to graduate and will drop out for many reasons, not the least of which is that their perceived educa
tional needs will not be satisfied within the existing educational environ
ment. While nationally the variety of courses now being offered is much
greater today than at any time in the past, there is no guarantee that the
This content downloaded from 91.238.114.202 on Sat, 28 Jun 2014 13:19:03 PMAll use subject to JSTOR Terms and Conditions
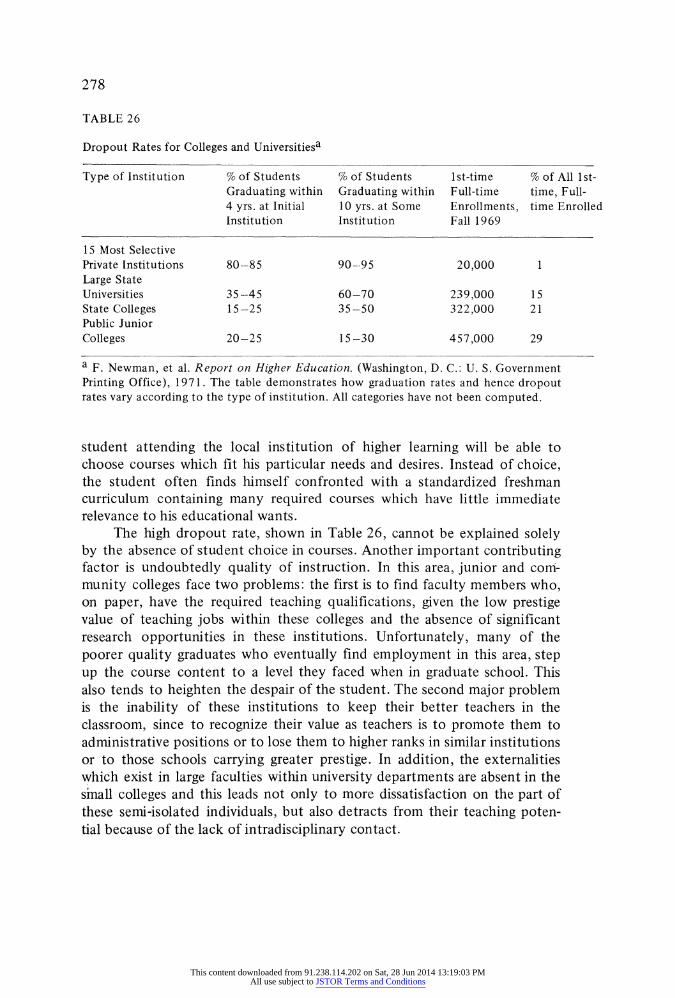
278
TABLE 26
Dropout Rates for Colleges and Universities3
Type of Institution % of Students % of Students lst-time % of All lst
Graduating within Graduating within Full-time time, Full
4 yrs. at Initial 10 yrs. at Some Enrollments, time Enrolled
Institution Institution Fall 1969
15 Most Selective
Private Institutions 80—85
Large State
Universities 35—45
State Colleges 15—25
Public Junior
Colleges 20-25
90-95 20,000 1
60-70 239,000 15
35-50 322,000 21
15-30 457,000 29
a F. Newman, et al. Report on Higher Education. (Washington, D. C.: U. S. Government
Printing Office), 1971. The table demonstrates how graduation rates and hence dropout rates vary according to the type of institution. All categories have not been computed.
Student attending the local institution of higher learning will be able to
choose courses which fit his particular needs and desires. Instead of choice, the student often finds himself confronted with a standardized freshman curriculum containing many required courses which have little immediate
relevance to his educational wants.
The high dropout rate, shown in Table 26, cannot be explained solely
by the absence of student choice in courses. Another important contributing factor is undoubtedly quality of instruction. In this area, junior and com
munity colleges face two problems: the first is to find faculty members who, on paper, have the required teaching qualifications, given the low prestige value of teaching jobs within these colleges and the absence of significant research opportunities in these institutions. Unfortunately, many of the
poorer quality graduates who eventually find employment in this area, step
up the course content to a level they faced when in graduate school. This
also tends to heighten the despair of the student. The second major problem is the inability of these institutions to keep their better teachers in the
classroom, since to recognize their value as teachers is to promote them to
administrative positions or to lose them to higher ranks in similar institutions
or to those schools carrying greater prestige. In addition, the externalities
which exist in large faculties within university departments are absent in the
small colleges and this leads not only to more dissatisfaction on the part of
these semi-isolated individuals, but also detracts from their teaching poten tial because of the lack of intradisciplinary contact.
This content downloaded from 91.238.114.202 on Sat, 28 Jun 2014 13:19:03 PMAll use subject to JSTOR Terms and Conditions
279
To meet all local educational needs, a college or university offering a
wide variety of high-quality courses would have to be established in every urban community. Given the financial constraints at present operating and
likely to continue into the foreseeable future, such a solution is not only
highly improbable but also does not take advantage of the technological innovations discussed above.
An Open University with high-quality faculty preparing the widest
possible variety of carefully produced courses, adopting the media of tele
vision, radio, and a national computer system, and using tuition and coun
selling services, might well prove to be a viable alternative. This would be
true especially for those racial and ethnic groups who have been deprived of
such services in the traditional programs and whose total environment
minimizes the probability of their receiving the parental and school tutoring and counselling which is an intrinsic part of white middle-class students'
lives.
The research above has indicated that substantial cost savings could
result were an Open University adopted in the US, but the total impact of
such a system may well yield benefits far in excess of those obtainable under
the 55,000-student model which has been discussed. The US Open Univer
sity will, however, require both the vision and courage of educational
planners, especially in the face of the massive inertia or worse of the
entrenched self-interest groups in higher education; it will similarly require a
substantial resource commitment to promote that scale of institution neces
sary to achieve economic efficiency and educational effectiveness.
APPENDIX
Cost Estimates of an Open University in the United States
In estimating the costs of an Open University in the United States, it will be
assumed that the size of the Open University under study will be 55,000 students. This
will enable comparisons to be made with the United Kingdom Open University since its
existing fixed costs have been determined with this size of student body in mind. This, of
course, in no way implies that 55,000 students constitute an optimum-sized Open
University (the optimum would be determined by the demand for an Open University
education, and the relative efficiency of the Open University compared with alternatives)
but since the factor inputs of the United Kingdom model have been isolated, it is possible
to price this model in United States prices and compare it with conventional United
States universities and colleges as was done for the United Kingdom. It may well be that a
This content downloaded from 91.238.114.202 on Sat, 28 Jun 2014 13:19:03 PMAll use subject to JSTOR Terms and Conditions
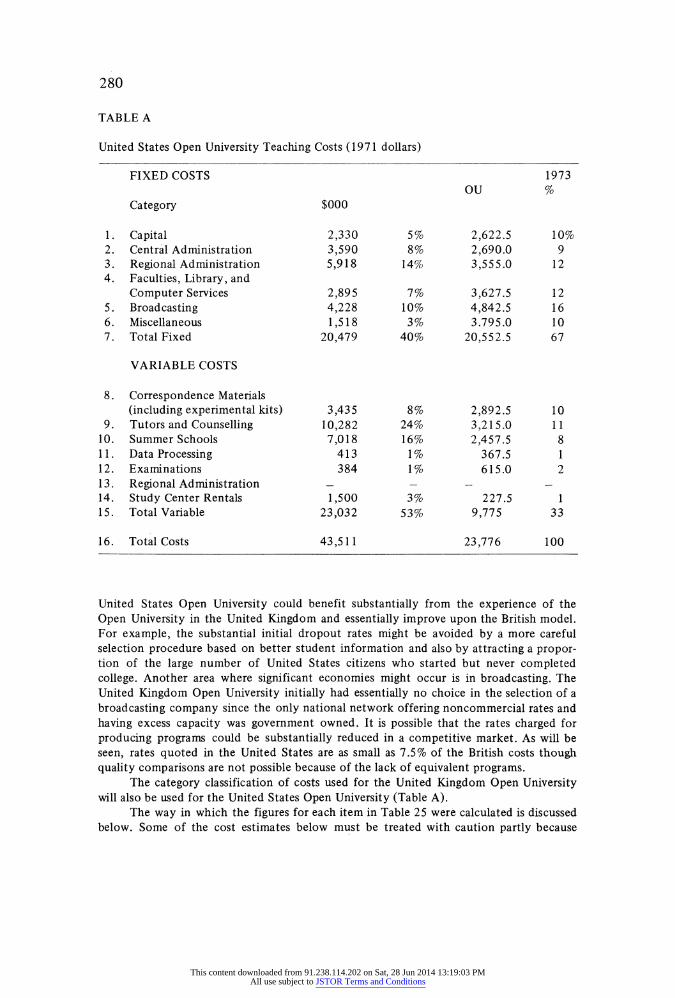
280
TABLE A
United States Open University Teaching Costs (1971 dollars)
FIXED COSTS 1973 OU %
Category $000
1. Capital 2,330 5% 2,622.5 10%
2. Central Administration 3,590 8% 2,690.0 9
3. Regional Administration 5,918 14% 3,555.0 12
4. Faculties, Library, and
Computer Services 2,895 7% 3,627.5 12 5. Broadcasting 4,228 10% 4,842.5 16 6. Miscellaneous 1,518 3% 3.795.0 10 7. Total Fixed 20,479 40% 20,552.5 67
VARIABLE COSTS
8. Correspondence Materials
(including experimental kits) 3,435 8% 2,892.5 10
9. Tutors and Counselling 10,282 24% 3,215.0 11
10. Summer Schools 7,018 16% 2,457.5 8
11. Data Processing 413 1% 367.5 1 12. Examinations 384 1% 615.0 2
13. Regional Administration — — — —
14. Study Center Rentals 1,500 3% 227.5 1
15. Total Variable 23,032 53% 9,775 33
16. Total Costs 43,511 23,776 100
United States Open University could benefit substantially from the experience of the
Open University in the United Kingdom and essentially improve upon the British model.
For example, the substantial initial dropout rates might be avoided by a more careful
selection procedure based on better student information and also by attracting a propor tion of the large number of United States citizens who started but never completed
college. Another area where significant economies might occur is in broadcasting. The
United Kingdom Open University initially had essentially no choice in the selection of a
broadcasting company since the only national network offering noncommercial rates and
having excess capacity was government owned. It is possible that the rates charged for
producing programs could be substantially reduced in a competitive market. As will be
seen, rates quoted in the United States are as small as 7.5% of the British costs though
quality comparisons are not possible because of the lack of equivalent programs.
The category classification of costs used for the United Kingdom Open University
will also be used for the United States Open University (Table A).
The way in which the figures for each item in Table 25 were calculated is discussed
below. Some of the cost estimates below must be treated with caution partly because
This content downloaded from 91.238.114.202 on Sat, 28 Jun 2014 13:19:03 PMAll use subject to JSTOR Terms and Conditions
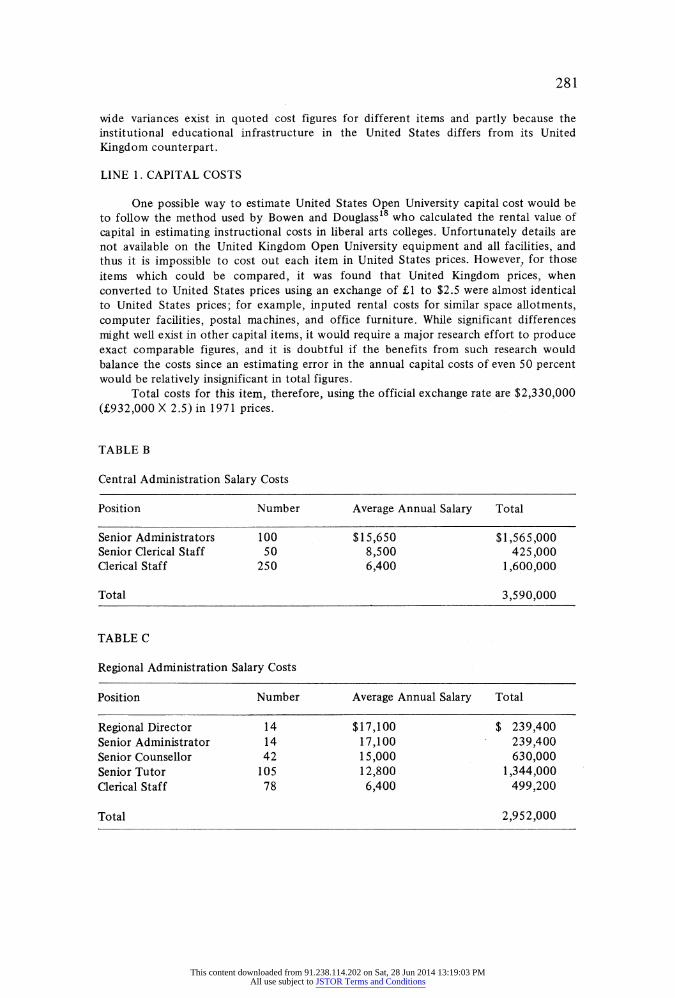
281
wide variances exist in quoted cost figures for different items and partly because the
institutional educational infrastructure in the United States differs from its United
Kingdom counterpart.
LINE 1. CAPITAL COSTS
One possible way to estimate United States Open University capital cost would be
to follow the method used by Bowen and Douglass18 who calculated the rental value of
capital in estimating instructional costs in liberal arts colleges. Unfortunately details are
not available on the United Kingdom Open University equipment and all facilities, and
thus it is impossible to cost out each item in United States prices. However, for those
items which could be compared, it was found that United Kingdom prices, when
converted to United States prices using an exchange of £1 to $2.5 were almost identical
to United States prices; for example, inputed rental costs for similar space allotments,
computer facilities, postal machines, and office furniture. While significant differences
might well exist in other capital items, it would require a major research effort to produce
exact comparable figures, and it is doubtful if the benefits from such research would
balance the costs since an estimating error in the annual capital costs of even 50 percent
would be relatively insignificant in total figures.
Total costs for this item, therefore, using the official exchange rate are $2,330,000
(£932,000 X 2.5) in 1971 prices.
TABLE B
Central Administration Salary Costs
Position Number Average Annual Salary Total
Senior Administrators 100 $15,650 $1,565,000 Senior Clerical Staff 50 8,500 425,000 Clerical Staff 250 6,400 1,600,000
Total 3,590,000
TABLE C
Regional Administration Salary Costs
Position Number Average Annual Salary Total
Regional Director 14 $17,100 $ 239,400 Senior Administrator 14 17,100 239,400 Senior Counsellor 42 15,000 630,000 Senior Tutor 105 12,800 1,344,000 Clerical Staff 78 6,400 499,200
Total 2,952,000
Position Number Average Annual Salary Total
Regional Director 14 $17,100 $ 239,400 Senior Administrator 14 17,100 239,400 Senior Counsellor 42 15,000 630,000 Senior Tutor 105 12,800 1,344,000 Clerical Staff 78 6,400 499,200
Total 2,952,000
This content downloaded from 91.238.114.202 on Sat, 28 Jun 2014 13:19:03 PMAll use subject to JSTOR Terms and Conditions
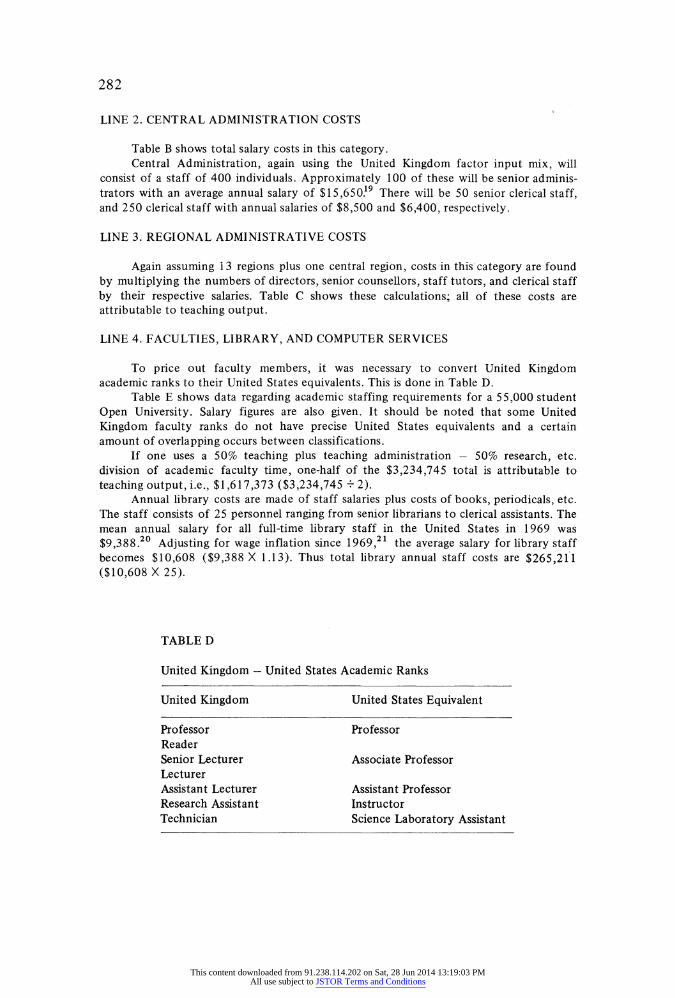
282
LINE 2. CENTRAL ADMINISTRATION COSTS
Table B shows total salary costs in this category.
Central Administration, again using the United Kingdom factor input mix, will
consist of a staff of 400 individuals. Approximately 100 of these will be senior adminis
trators with an average annual salary of $15,650.19 There will be 50 senior clerical staff, and 250 clerical staff with annual salaries of $8,500 and $6,400, respectively.
LINE 3. REGIONAL ADMINISTRATIVE COSTS
Again assuming 13 regions plus one central region, costs in this category are found
by multiplying the numbers of directors, senior counsellors, staff tutors, and clerical staff
by their respective salaries. Table C shows these calculations; all of these costs are
attributable to teaching output.
LINE 4. FACULTIES, LIBRARY, AND COMPUTER SERVICES
To price out faculty members, it was necessary to convert United Kingdom academic ranks to their United States equivalents. This is done in Table D.
Table E shows data regarding academic staffing requirements for a 55,000 student
Open University. Salary figures are also given. It should be noted that some United
Kingdom faculty ranks do not have precise United States equivalents and a certain
amount of overlapping occurs between classifications.
If one uses a 50% teaching plus teaching administration — 50% research, etc.
division of academic faculty time, one-half of the $3,234,745 total is attributable to
teaching output, i.e., $1,617,373 ($3,234,745 -^2). Annual library costs are made of staff salaries plus costs of books, periodicals, etc.
The staff consists of 25 personnel ranging from senior librarians to clerical assistants. The
mean annual salary for all full-time library staff in the United States in 1969 was
$9,388.20 Adjusting for wage inflation since 1969,21 the average salary for library staff
becomes $10,608 ($9,388 X 1.13). Thus total library annual staff costs are $265,211
($10,608 X 25).
TABLE D
United Kingdom — United States Academic Ranks
United Kingdom United States Equivalent
Professor Professor
Reader
Senior Lecturer Associate Professor
Lecturer
Assistant Lecturer Assistant Professor
Research Assistant Instructor
Technician Science Laboratory Assistant
This content downloaded from 91.238.114.202 on Sat, 28 Jun 2014 13:19:03 PMAll use subject to JSTOR Terms and Conditions
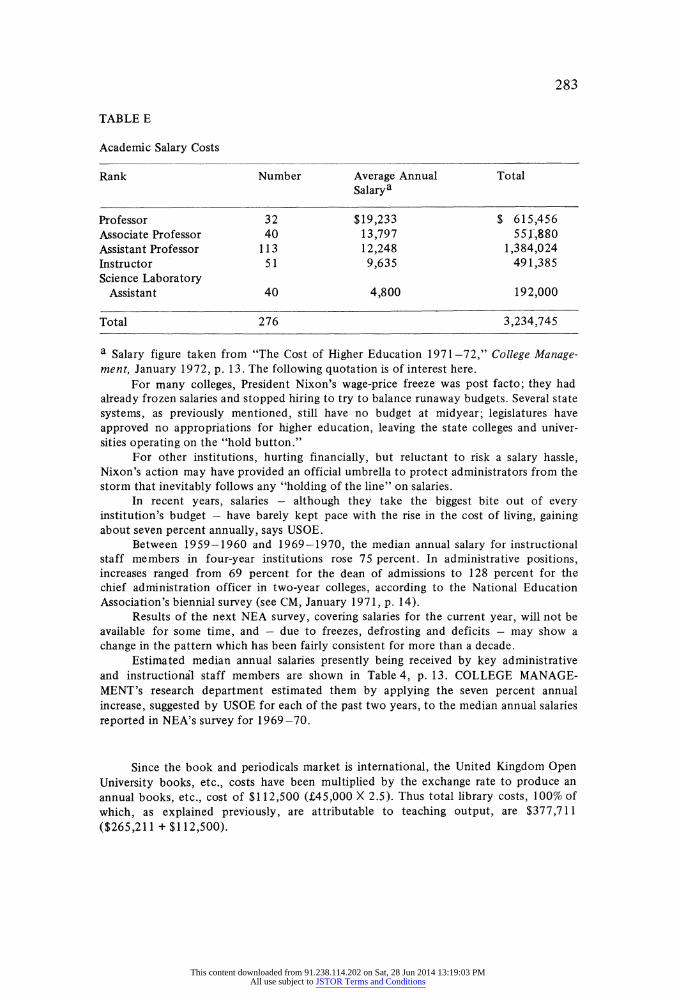
283
TABLE E
Academic Salary Costs
Rank Number Average Annual
Salary a
Total
Professor 32 $19,233 $ 615,456 Associate Professor 40 13,797 551,880 Assistant Professor 113 12,248 1,384,024 Instructor 51 9,635 491,385 Science Laboratory
Assistant 40 4,800 192,000
Total 276 3,234,745
a Salary figure taken from "The Cost of Higher Education 1971—72," College Manage
ment, January 1972, p. 13. The following quotation is of interest here.
For many colleges, President Nixon's wage-price freeze was post facto; they had
already frozen salaries and stopped hiring to try to balance runaway budgets. Several state
systems, as previously mentioned, still have no budget at midyear; legislatures have
approved no appropriations for higher education, leaving the state colleges and univer
sities operating on the "hold button."
For other institutions, hurting financially, but reluctant to risk a salary hassle, Nixon's action may have provided an official umbrella to protect administrators from the
storm that inevitably follows any "holding of the line" on salaries.
In recent years, salaries — although they take the biggest bite out of every institution's budget — have barely kept pace with the rise in the cost of living, gaining about seven percent annually, says USOE.
Between 1959 — 1960 and 1969 — 1970, the median annual salary for instructional
staff members in four-year institutions rose 75 percent. In administrative positions, increases ranged from 69 percent for the dean of admissions to 128 percent for the
chief administration officer in two-year colleges, according to the National Education
Association's biennial survey (see CM, January 1971, p. 14).
Results of the next NEA survey, covering salaries for the current year, will not be
available for some time, and — due to freezes, defrosting and deficits — may show a
change in the pattern which has been fairly consistent for more than a decade.
Estimated median annual salaries presently being received by key administrative
and instructional staff members are shown in Table 4, p. 13. COLLEGE MANAGE
MENT'S research department estimated them by applying the seven percent annual
increase, suggested by USOE for each of the past two years, to the median annual salaries
reported in NEA's survey for 1969—70.
Since the book and periodicals market is international, the United Kingdom Open
University books, etc., costs have been multiplied by the exchange rate to produce an
annual books, etc., cost of $112,500 (£45,000 X 2.5). Thus total library costs, 100% of
which, as explained previously, are attributable to teaching output, are $377,71 1
($265,211 +$112,500).
This content downloaded from 91.238.114.202 on Sat, 28 Jun 2014 13:19:03 PMAll use subject to JSTOR Terms and Conditions
284
The student computer services require a staff of 32. The average salary for these
individuals in the United Kingdom was £3,125 per annum. Comparable computer per
sonnel salaries in the United States are estimated to average $12,500 per annum. This
figure is approximately 25% higher than the average of all computer staff salaries22 in
institutions of higher learning in the United States because the Open University computer
staff is biased toward more senior computer personnel who have an academic as well as a
technical function. Thus, total computer salaries equal $400,000 ($12,500 X 32). Other
computer cost directly comparable to United Kingdom costs as discussed earlier are
$500,000 (£200,000 X 2.5). Thus total annual computer costs are $900,000 ($400,000 + $500,000). Total
costs, therefore, for Line 4 are $2,894,544 ($1,617,373 + $377,171 + $900,000).
LINE 5. BROADCASTING COSTS
United Kingdom television production cost of £8,000 per hour appeared to the
investigators to be inordinately high. KQED, a television station in San Francisco, quoted
total costs for a one-hour lecture format production from $1,370 to $l,670;i.e., almost
negligible when compared with the British equivalent of $20,000 (£8,000 X 2.5). Further
research in this area unearthed the information that a regional commercial television
company in Britain (Grampian Television) was able to produce one-hour lecture/discus sion programs for $825 (£330 X 2.5) Part of this wide discrepancy in cost figures can be
explained by qualitative differences though no information is available on how more
effective, in terms of learning, the more expensive programs are. For example, it was
discovered that in the £8,000 per hour productions, a program producer and his staff
might produce no more than six half-hour programs per annum, i.e., their total annual
output; because of this and accompanying restrictive employment practices, costs per
program can rise very rapidly. It is impossible to know what television costs would be in
the United States without a substantial amount of research input and perhaps even only when an institution actually negotiated with television companies, would the precise costs
emerge. Another possibility in this area, which the United Kingdom Open University is
currently considering involves setting up its own television and radio facilities.
Faced with the range of possibilities which emerged, the procedure initially adopted has been to convert British television and radio costs using the exchange rate. This
produces a total cost for Line 5 of $4,227,500 (£1,691,000 X 2,5) with the proviso that
such costs might be reduced by over 50 percent, and that the figure used is an upper limit.
LINE 6. MISCELLANEOUS COSTS
In the United Kingdom, miscellaneous costs which include media production,
staff/student facilities, educational technology, and maintenance were approximately
9.5% of the total of costs in Lines 1—5. Using the same ratio for the United States Open
University produces a figure of $1,518,085 for this category ($15,995,000 X .09491), all
of which is again attributable to teaching output.
LINE 7. TOTAL FIXED COSTS
Total fixed costs, which are found by summing the individual totals for Lines 1—6,
equal $20,479,000.
This content downloaded from 91.238.114.202 on Sat, 28 Jun 2014 13:19:03 PMAll use subject to JSTOR Terms and Conditions
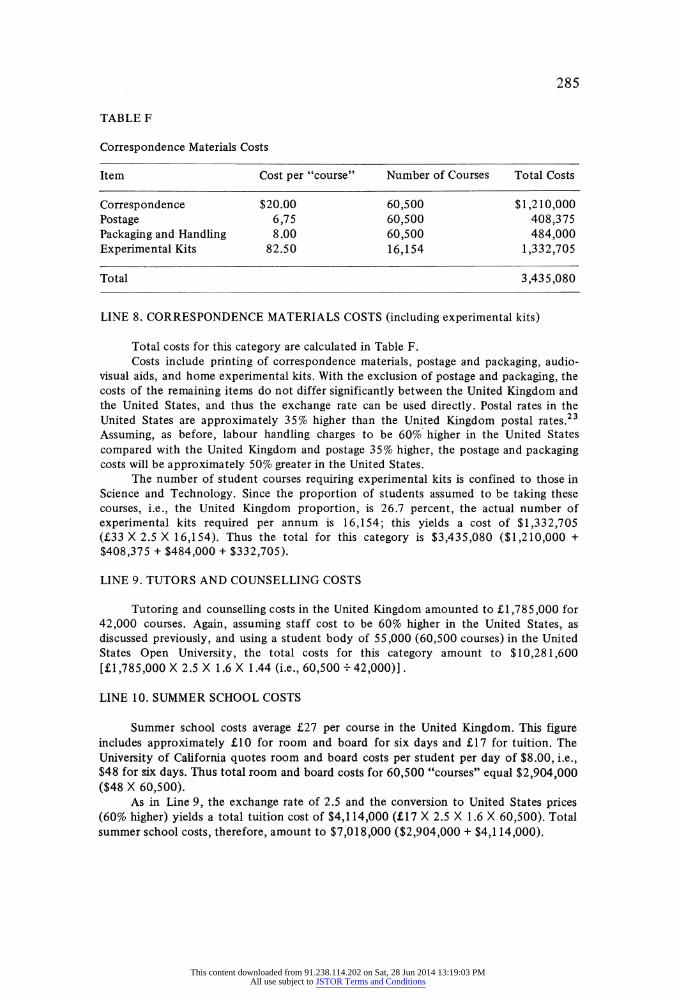
285
TABLE F
Correspondence Materials Costs
Item Cost per "course" Number of Courses Total Costs
Correspondence $20.00 60,500 $1,210,000 Postage 6,75 60,500 408,375 Packaging and Handling 8.00 60,500 484,000 Experimental Kits 82.50 16,154 1,332,705
Total 3,435,080
LINE 8. CORRESPONDENCE MATERIALS COSTS (including experimental kits)
Total costs for this category are calculated in Table F.
Costs include printing of correspondence materials, postage and packaging, audio
visual aids, and home experimental kits. With the exclusion of postage and packaging, the
costs of the remaining items do not differ significantly between the United Kingdom and
the United States, and thus the exchange rate can be used directly. Postal rates in the
United States are approximately 35% higher than the United Kingdom postal rates.23
Assuming, as before, labour handling charges to be 60% higher in the United States
compared with the United Kingdom and postage 35% higher, the postage and packaging costs will be approximately 50% greater in the United States.
The number of student courses requiring experimental kits is confined to those in
Science and Technology. Since the proportion of students assumed to be taking these
courses, i.e., the United Kingdom proportion, is 26.7 percent, the actual number of
experimental kits required per annum is 16,154; this yields a cost of $1,332,705
(£33 X 2.5 X 16,154). Thus the total for this category is $3,435,080 ($1,210,000 +
$408,375 + $484,000 + $332,705).
LINE 9. TUTORS AND COUNSELLING COSTS
Tutoring and counselling costs in the United Kingdom amounted to £1,785,000 for
42,000 courses. Again, assuming staff cost to be 60% higher in the United States, as
discussed previously, and using a student body of 55,000 (60,500 courses) in the United
States Open University, the total costs for this category amount to $10,281,600
[£1,785,000 X 2.5 X 1.6 X 1.44 (i.e., 60,500 -î- 42,000)].
LINE 10. SUMMER SCHOOL COSTS
Summer school costs average £27 per course in the United Kingdom. This figure
includes approximately £10 for room and board for six days and £17 for tuition. The
University of California quotes room and board costs per student per day of $8.00, i.e.,
$48 for six days. Thus total room and board costs for 60,500 "courses" equal $2,904,000
($48 X 60,500). As in Line 9, the exchange rate of 2.5 and the conversion to United States prices
(60% higher) yields a total tuition cost of $4,114,000 (£17 X 2.5 X 1.6 X 60,500). Total summer school costs, therefore, amount to $7,018,000 ($2,904,000 + $4,114,000).
This content downloaded from 91.238.114.202 on Sat, 28 Jun 2014 13:19:03 PMAll use subject to JSTOR Terms and Conditions
286
LINE 11. DATA PROCESSING COSTS
Data processing costs are also not significantly different between the United States
and the United Kingdom where £3 per student is the cost. The United States equivalent
total therefore is $412,500 (£3 X 2.5 X 55,000). It should be noted that data processing
costs do not change significantly with the number of courses taken by each student.
LINE 12. EXAMINATION COSTS
Examination costs in the United Kingdom are £2 per student course. Using the 1.6
labour-cost ratio and the exchange rate yields a United States equivalent of $8.00 per student course.
If the same percentage of finally enrolled students taking the examination in the
United Kingdom Open University is assumed for the United States Open University
(79%), approximately 48,000 examinations out of the 60,500 courses will be taken,
producing a total cost in this category of $384,000 ($8,000 X 48,000).
LINE 13. REGIONAL ADMINISTRATION COSTS
Since all the costs in this category have been attributed to fixed costs because, within the prescribed range of the O.U., population numbers of regional staff will not
vary, no entry is required in this line.
LINE 14. STUDY CENTER RENTALS
As with broadcasting costs, research in this area of rental of existing educational
facilities during evenings and weekends produced wide variation in potential costs. The
University of California, for example, stated that university buildings would be provided at zero cost for bona fide educational purposes, and indeed the whole topic of com
munity colleges providing for local education needs dictates fuller utilization of existing facilities at marginal cost. A fee would be assessed only in cases where additional
university or college resources would be required, such as personnel operating video
equipment, etc.
Since the bulk of Open University tutorial sessions would not require extra
janitorial or other services, it could be assumed that for all or most of California, rental
charges would be close to zero. At the other extreme, however, one university planning for continuing education classes stated it would charge an annual rental fee of $4,500 for
100 students. If such a rate were applied to the 60,500 "courses," rental charges would
total $2,722,500 ($4,500 X 60,500 -r 100). The expected cost for rentals undoubtedly lies somewhere within the limits of zero to $3 m. Arbitrarily, a figure of $1.5 m has been
chosen.
LINE 15. TOTAL VARIABLE COSTS
Total variable costs are the summation of the costs for Lines 8 through 14 and
equal $23,032,000.
This content downloaded from 91.238.114.202 on Sat, 28 Jun 2014 13:19:03 PMAll use subject to JSTOR Terms and Conditions
287
LINE 16. TOTAL COSTS
Total costs which equal total fixed costs (Line 7) and total variable costs (Line 15)
equal $43,511,000.
UNITED STATES CONVENTIONAL UNIVERSITY TEACHING COSTS
The data used to provide the first estimate of total teaching costs in public and
private colleges and universities in the United States have been taken from June O'Neill's
detailed report, Resource Use in Higher Education,24
The base unit used for calculating costs is a "credit hour," and the average cost of
the unit in 1966—67 prices is $50.1. The average number of such units taken per year by
a full-time undergraduate student is 28, and four years of full-time study are required to
graduate. Thus the cost of"a basic undergraduate degree to the graduating individual (or
the authority paying for that degree) is $5,611 ($50.1 X 28 X 4) which equals $6,845
($5,611 X 1.22) in 1971 prices.25 The corresponding figures for United States private
colleges and universities (approximately one-third of the total) are $60.4 per credit hour
and $6,765 and $8,253 per degree in 1967 and 1971 prices respectively. The $6,845
figure would also be the cost per graduate if all initially enrolling students were to
graduate. If steady-state equilibrium were assumed, the cost per graduate could also be
calculated by dividing annual total costs by the number of graduates. For example, total
costs for 1966—67 were estimated at $8,073.6 m26 and individual cost of obtaining a degree
was $5,611. Thus the number of graduates, assuming zero attrition, was 1,438,888 out of
a total student body of 5.75 m (1,438,888 X 4), i.e., one-quarter graduating each year. In
reality, of course, the number of initially enrolling students who actually graduate is
much less than 100%. If the dropout rate were 50%, costs per graduate would rise by from 50% to 100%, depending on how much of the degree program the average dropout
completes. The actual number of graduates in 1967 was 749,000,27 and the total instructional
cost in that year was estimated at $8,073.6 m. Thus the costs per graduate, again
assuming a steady-state student body, were $10,480, in 1967. Allowing for the price
difference, the figure per graduate becomes $13,152 ($10,780 X 1.22)in 1971 prices. In comparing United States Open University costs with those of conventional
universities, one should note that the United States Open University consists of a student
body similar in composition by faculty (i.e., proportions of students in each faculty —
27% in Science and Technology and 73% in Arts and Social Science) to the United
Kingdom Open University, while no such adjustments have been made for the conven
tional United States "average" university.
Although it would be desirable if resources were available to make such adjust
ments, as was seen in the United Kingdom, costs would not alter significantly; such
changes that would occur are insignificant within the margin of uncertainty which
currently exists and has been discussed above.
Table G summarizes the United States comparisons.
Thus there appears little doubt that teaching costs in an open university are
significantly lower compared with conventional universities. It should also be recalled
that upper cost estimates have been adopted for the Open University and that a reduction
in these costs by 10 percent, which may be quite feasible, reduces the annual total
teaching costs per full-time student equivalent to $1,294. Other areas of potential cost savings involve the substitution of relatively cheaper
This content downloaded from 91.238.114.202 on Sat, 28 Jun 2014 13:19:03 PMAll use subject to JSTOR Terms and Conditions
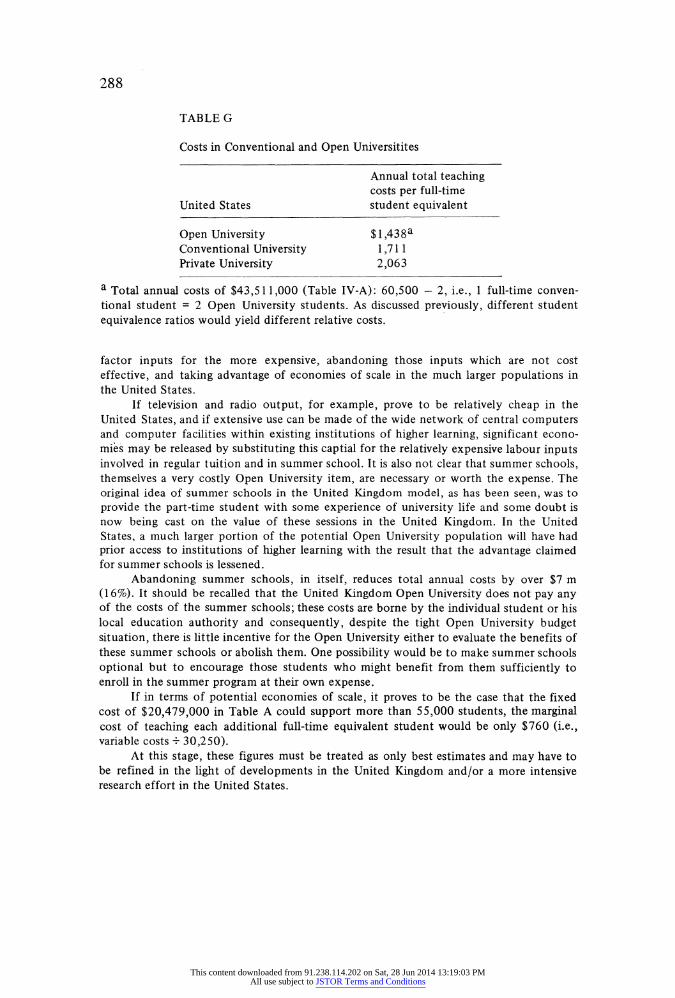
288
TABLE G
Costs in Conventional and Open Universitites
Annual total teaching
costs per full-time
United States student equivalent
Open University $l,438a Conventional University 1,711
Private University 2,063
a Total annual costs of $43,511,000 (Table IV-A): 60,500 — 2, i.e., 1 full-time conven
tional student = 2 Open University students. As discussed previously, different student
equivalence ratios would yield different relative costs.
factor inputs for the more expensive, abandoning those inputs which are not cost
effective, and taking advantage of economies of scale in the much larger populations in
the United States.
If television and radio output, for example, prove to be relatively cheap in the
United States, and if extensive use can be made of the wide network of central computers
and computer facilities within existing institutions of higher learning, significant econo
mies may be released by substituting this captial for the relatively expensive labour inputs involved in regular tuition and in summer school. It is also not clear that summer schools,
themselves a very costly Open University item, are necessary or worth the expense. The
original idea of summer schools in the United Kingdom model, as has been seen, was to
provide the part-time student with some experience of university life and some doubt is
now being cast on the value of these sessions in the United Kingdom. In the United
States, a much larger portion of the potential Open University population will have had
prior access to institutions of higher learning with the result that the advantage claimed
for summer schools is lessened.
Abandoning summer schools, in itself, reduces total annual costs by over $7 m
(16%). It should be recalled that the United Kingdom Open University does not pay any of the costs of the summer schools; these costs are borne by the individual student or his
local education authority and consequently, despite the tight Open University budget
situation, there is little incentive for the Open University either to evaluate the benefits of
these summer schools or abolish them. One possibility would be to make summer schools
optional but to encourage those students who might benefit from them sufficiently to
enroll in the summer program at their own expense. If in terms of potential economies of scale, it proves to be the case that the fixed
cost of $20,479,000 in Table A could support more than 55,000 students, the marginal
cost of teaching each additional full-time equivalent student would be only $760 (i.e.,
variable costs -f- 30,250).
At this stage, these figures must be treated as only best estimates and may have to
be refined in the light of developments in the United Kingdom and/or a more intensive
research effort in the United States.
This content downloaded from 91.238.114.202 on Sat, 28 Jun 2014 13:19:03 PMAll use subject to JSTOR Terms and Conditions
289
Notes
1. See, for example, K. G. Lumsden (Ed.), Efficiency in Universities: The La Paz
Papers. (Amsterdam: Elsevier, 1974).
2. The Report of the Committee on Higher Education in the United Kingdom under the
Chairmanship of Lord Robbins. (London: HMSO, 1963).
3. A White Paper is an official government publication setting out the discussions which
have taken place on the subject in question and inviting further debate and comment.
4. The ordinary degree necessitates the accumulation of 6 credit units. A full-year
course is rated 1 credit unit. Fractions of credit units are obtained for the completion
of part-year courses.
5. Both faculty and administrative jobs were widely advertised, and the ratio of
applicants to jobs was approximately 40 to 1.
6. The ethos of the OU is such that attrition is not seen as a serious defect. Everyone is
invited to "have a go" at higher education at this "open" university.
7. Open University Statistical Bulletin, February/March 1973, Table 1G2. Table 1.
8. Ibid., Table 1G2, Table 2.
9. Since in the following section possible confusion might be created by converting
British to United States prices using the official exchange rate, all calculations have
been made made in British £ (pounds sterling). In a later section, the factor inputs in
the Open University will be costed in United States prices in order to price out the
British Open University model in the United States higher education market. Using
the official rate of exchange would of course price out the British University model
in British relative prices.
10. One possible additional capital expenditure involves an on-campus broadcasting
center estimated at £3 m. This would increase the above total capital costs and
decrease the annual BBC costs. Since there is considerable uncertainty as to whether
these expenditures will be made, broadcasting costs have been included, presupposing
the current arrangements will continue in the future.
11. The library is mainly a teaching library for the use of the central academic staff.
Research work by the staff is often undertaken using the library facilities of other
universities, especially Oxford and London.
Library facilities will be used, of course, by Open University students, but such
facilities will take the form of the "local library" which is financed by local
government and which is essentially free to users. All local libraries are sent lists of
prescribed and recommended books for Open University courses by the Open
University. Since it is the duty of the local library to meet the library requirements
of the local population (no matter how specialized the demand) this cost element of
the Open University does not appear in any Open University budget but is borne by
local government.
12. The "steady-state" aim for the future is to stabilise at the transmission of about 90
courses per year. By 1984, the OU hopes to be able to offer about 90 course-credits.
13. See page 247 for a discussion of the issues of faculty research time and course
production targets. There is agreement that present rates of course production
This content downloaded from 91.238.114.202 on Sat, 28 Jun 2014 13:19:03 PMAll use subject to JSTOR Terms and Conditions
290
cannot be sustained with existing faculty numbers. The real question concerns the
required future course production rate.
14. Physically handicapped people were eligible if they were under 21, but were unable
to attend conventional university.
15. Costs in this section are calculated in 1971 prices.
16. Cf., A. E. Pratten, The Economics of Television. (London: PEP, 1970) p. 36.
17. Government Committee on Higher Education, California Legislature, "The challenge
of achievement." p. 66. (1969, unpublished)
18. H. R. Bowen and G. K. Douglass, Efficiency in Liberal Education, issued by the
Carnegie Commission on Higher Education, McGraw-Hill, 1971.
19. Salary estimates in these sections taken from University of California administrative
and clerical salaries.
20. Library Statistics of Colleges and Universities, Fall 1969, Analytic Report O.E.
15031-69, Washington, D. C., 1971.
21. Economic Report of the President, Washington, D. C.: U.S.G.P.O., 1972.
22. Selected Statistics on Educational Personnel, Washington, D. C., 1970.
23. The cost of sending a 2-pound package, 2nd class in the United Kingdom is £0.23.
The corresponding 4th-class parcel post rate in California to zone 4 is $0.75 and to
zone 5 is $0.80. Averaging between zones and comparing yields a ratio of US postal
rates/UK postal rates of 1.35 [*'23 X 2 5] '
24. June O'Neill, Resource Use in Higher Education: Trends in Outputs and Inputs, 1930
to 1967. A report prepared for the Carnegie Commission on Higher Education, 1947
Center Street, Berkeley, California, 1971.
25. 1966/67 prices are converted into 1971 prices by multiplying by 1.22. See the GNP
implicit price deflators — Economic Report of the President, 1972, p. 198.
26. O'Neill, op. cit., p. 91.
27. U. S. Office of Education, Digest of Educational Statistics, Washington, D.C., 1968,
p. 69.
References
Bottomley et al. (1971). Cost Effectiveness in Higher Education. Paris: OECD.
Bowen, H. R., Douglass, G. K. (1971). Efficiency in Liberal Education. A report of the
Carnegie Commission on Higher Education. New York: McGraw-Hill.
Digest of Educational Statistics: 1968 Edition. Washington, D.C.: U.S.G.P.O., 1968.
Government Committee on Higher Education, California Legislature. The Challenge of
Achievement." Sacramento: The Legislature, unpublished document, 1969.
Guide for applicants for undergraduate courses 1973. The Open Univeristy, 1973.
Jamison, D., with Klees, S. (1973). The Cost of Instructional Radio and Television for
Developing Countries. Stanford, Calif.: Institute for Communication Research, Stan
ford University, March.
This content downloaded from 91.238.114.202 on Sat, 28 Jun 2014 13:19:03 PMAll use subject to JSTOR Terms and Conditions
291
Jamison, D., Suppes, P., and Wells, S. (1974). The effectiveness of alternative instruc
tional media: A survey. Review of Educational Research, 44, 1—67.
Library Statistics of Colleges and Universities, Fall 1969. Washington, D.C.: U.S. Office
of Education, 1971.
Lumsden, K. G. (Ed.) (1974). Efficiency in Universities: The La Paz Papers. Amsterdam:
Elsevier.
Newman, F. et al. (1971). Report on Higher Education. Washington, D. C.: U.S.G.P.O.
O'Neill, J. (1971).Resource use in Higher Education: Trends in Outputs and Inputs, 1930
to 1967. Berkeley, Calif.: Carnegie Commission on Higher Education.
Open University Planning Office Statistical Bulletin, April/May 1973.
Open University Statistical Bulletin, February/March 1973.
Pratten, A. E. (1970). The Economics of Television. London: Political and Economic
Planning.
"The cost of higher education." College Management, January 1972.
The Early Development of the Open University: Report of the Vice-Chancellor. Walton
Hall, Bletchley, Bucks: The Open University, 1972.
The report of the Committee on Higher Education in the United Kingdom. Lord
Robbins, Chairman. London: H.M.S.O., 1963.
University Grants Committee statistics of education. Vol. 6. London.: H.M.S.O., 1969
This content downloaded from 91.238.114.202 on Sat, 28 Jun 2014 13:19:03 PMAll use subject to JSTOR Terms and Conditions