Embed Size (px)
Citation preview
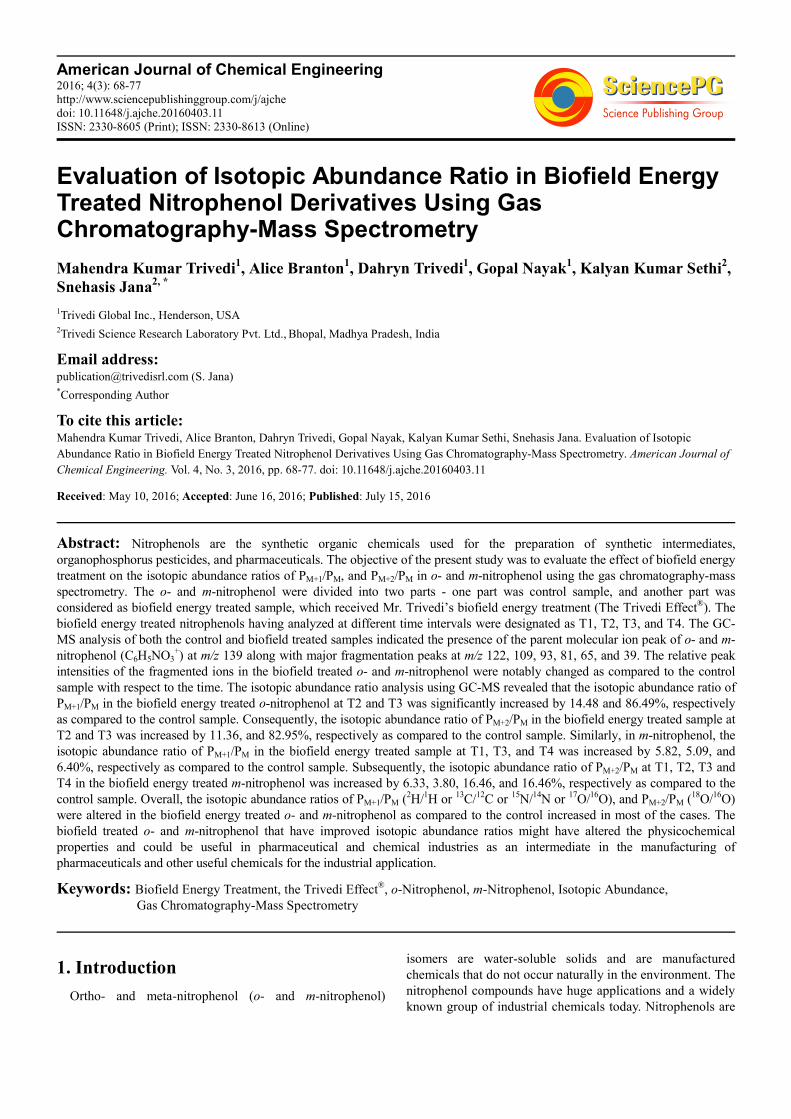
American Journal of Chemical Engineering 2016; 4(3): 68-77
http://www.sciencepublishinggroup.com/j/ajche
doi: 10.11648/j.ajche.20160403.11
ISSN: 2330-8605 (Print); ISSN: 2330-8613 (Online)
Evaluation of Isotopic Abundance Ratio in Biofield Energy Treated Nitrophenol Derivatives Using Gas Chromatography-Mass Spectrometry
Mahendra Kumar Trivedi1, Alice Branton
1, Dahryn Trivedi
1, Gopal Nayak
1, Kalyan Kumar Sethi
2,
Snehasis Jana2, *
1Trivedi Global Inc., Henderson, USA 2Trivedi Science Research Laboratory Pvt. Ltd., Bhopal, Madhya Pradesh, India
Email address: [email protected] (S. Jana) *Corresponding Author
To cite this article: Mahendra Kumar Trivedi, Alice Branton, Dahryn Trivedi, Gopal Nayak, Kalyan Kumar Sethi, Snehasis Jana. Evaluation of Isotopic
Abundance Ratio in Biofield Energy Treated Nitrophenol Derivatives Using Gas Chromatography-Mass Spectrometry. American Journal of
Chemical Engineering. Vol. 4, No. 3, 2016, pp. 68-77. doi: 10.11648/j.ajche.20160403.11
Received: May 10, 2016; Accepted: June 16, 2016; Published: July 15, 2016
Abstract: Nitrophenols are the synthetic organic chemicals used for the preparation of synthetic intermediates,
organophosphorus pesticides, and pharmaceuticals. The objective of the present study was to evaluate the effect of biofield energy
treatment on the isotopic abundance ratios of PM+1/PM, and PM+2/PM in o- and m-nitrophenol using the gas chromatography-mass
spectrometry. The o- and m-nitrophenol were divided into two parts - one part was control sample, and another part was
considered as biofield energy treated sample, which received Mr. Trivedi’s biofield energy treatment (The Trivedi Effect®). The
biofield energy treated nitrophenols having analyzed at different time intervals were designated as T1, T2, T3, and T4. The GC-
MS analysis of both the control and biofield treated samples indicated the presence of the parent molecular ion peak of o- and m-
nitrophenol (C6H5NO3+) at m/z 139 along with major fragmentation peaks at m/z 122, 109, 93, 81, 65, and 39. The relative peak
intensities of the fragmented ions in the biofield treated o- and m-nitrophenol were notably changed as compared to the control
sample with respect to the time. The isotopic abundance ratio analysis using GC-MS revealed that the isotopic abundance ratio of
PM+1/PM in the biofield energy treated o-nitrophenol at T2 and T3 was significantly increased by 14.48 and 86.49%, respectively
as compared to the control sample. Consequently, the isotopic abundance ratio of PM+2/PM in the biofield energy treated sample at
T2 and T3 was increased by 11.36, and 82.95%, respectively as compared to the control sample. Similarly, in m-nitrophenol, the
isotopic abundance ratio of PM+1/PM in the biofield energy treated sample at T1, T3, and T4 was increased by 5.82, 5.09, and
6.40%, respectively as compared to the control sample. Subsequently, the isotopic abundance ratio of PM+2/PM at T1, T2, T3 and
T4 in the biofield energy treated m-nitrophenol was increased by 6.33, 3.80, 16.46, and 16.46%, respectively as compared to the
control sample. Overall, the isotopic abundance ratios of PM+1/PM (2H/
1H or
13C/
12C or
15N/
14N or
17O/
16O), and PM+2/PM (
18O/
16O)
were altered in the biofield energy treated o- and m-nitrophenol as compared to the control increased in most of the cases. The
biofield treated o- and m-nitrophenol that have improved isotopic abundance ratios might have altered the physicochemical
properties and could be useful in pharmaceutical and chemical industries as an intermediate in the manufacturing of
pharmaceuticals and other useful chemicals for the industrial application.
Keywords: Biofield Energy Treatment, the Trivedi Effect®, o-Nitrophenol, m-Nitrophenol, Isotopic Abundance,
Gas Chromatography-Mass Spectrometry
1. Introduction
Ortho- and meta-nitrophenol (o- and m-nitrophenol)
isomers are water-soluble solids and are manufactured
chemicals that do not occur naturally in the environment. The
nitrophenol compounds have huge applications and a widely
known group of industrial chemicals today. Nitrophenols are
69 Mahendra Kumar Trivedi et al.: Evaluation of Isotopic Abundance Ratio in Biofield Energy Treated
Nitrophenol Derivatives Using Gas Chromatography-Mass Spectrometry
used as intermediates in the synthesis of some
organophosphorus pesticides and pharmaceuticals, i.e.
fungicides [1-3]. o-Nitrophenol is a light yellow solid with a
peculiar sweet smell used in medicine, rubber auxiliaries,
dye, reaction intermediate, and indicator of single colour pH
value [2, 3]. In spite of many applications o- and m-
nitrophenol, these compounds have many disadvantages.
Releases into the environment are primarily by hydrolytic
and photolytic degradation of the respective pesticides and
caused by the dry and wet deposition of airborne nitrophenol
from the atmosphere [1]. Experiment on mice revealed
clinical signs following oral exposure were unspecific and
included dyspnoea, staggering, trembling, somnolence,
apathy, and cramps [4, 5]. Over the last several years,
numerous articles and books have specifically addressed the
toxicity and mutagenicity of o- and m-nitrophenol [6-9].
Therefore, it is a very important challenge with respect to
scientific concern to check the toxicity and hazardous effect
of o- and m-nitrophenol by means of physicochemical,
thermal, and structural modification.
The introduction of heavier stable isotopes to a molecule
might be an alternative approach for physicochemical,
thermal, and structural modification of o- and m-nitrophenol.
The stable isotopic ratio analysis widely used in several
fields such as geographical, agricultural, food authenticity,
biochemistry, metabolism, medical research, and sports, etc.
[10-14]. The isotopic abundance of a molecule can be altered
by means of chemical reactions [11, 15]. Mr. Trivedi’s
biofield energy treatment has the remarkable capability to
alter the isotopic abundance ratios of various compounds [16-
20]. For e.g. the isotopic abundance ratio of PM+1/PM (13
C/12
C
or 2H/
1H or
15N/
14N) in 4-bromoaniline was increased after
biofield energy treatment up to 368.3% [18]. The isotopic
abundance ratio of PM+2/PM (18
O/16
O or 37
Cl/35
Cl) in biofield
treated 2,4-dichlorophenol was increased by 40.57%,
respectively [20]. Biofield energy is an electromagnetic field
existed in an around the human body [21-23]. The energy can
be harnessed from the universe and then, it can be applied by
the healing practitioner on living or non-living objects to
achieve the alterations in the characteristic properties. The
applications of The Trivedi Effect® have gained significantly
scientific attention in the field of materials science [24-31],
agriculture [32-34], biotechnology [35-37], pharmaceuticals
[38-40], and medical sciences [41, 42].
The choice for the isotope ratio analysis is the mass
spectrometry (MS) technique [43]. The gas chromatography-
mass spectrometry (GC-MS) can perform isotope ratio
measurement at low micro molar concentration levels [43-
46]. Recently, it has been reported that Mr. Trivedi’s biofield
energy treatment (The Trivedi Effect®) has the amazing
capability to alter the physicochemical and thermal properties
of nitrophenol such as crystallite size, particle size and
thermal stability that might affect the rate of chemical
reaction [24]. Based on all these aspects, the current study
was designed to investigate the isotopic abundance ratios of
PM+1/PM and PM+2/PM in the biofield energy treated o- and m-
nitrophenol using the GC-MS technique.
2. Materials and Method
2.1. Chemicals and Reagents
o-Nitrophenol and m-nitrophenol were procured from
Loba Chemie Pvt. Ltd., India. All the other chemicals used in
this experiment were analytical grade purchased from the
local vendors.
2.2. Biofield Energy Treatment Strategies
o-Nitrophenol and m-nitrophenol were divided into two
parts; one was kept as a control (un-treated) while another
part was subjected to biofield energy treatment and coded as
treated sample. The treatment groups in sealed pack were
handed over to Mr. Trivedi for biofield treatment under
standard laboratory condition. Mr. Trivedi provided the
biofield energy treatment through his unique energy
transmission process approximately for 5 minutes without
touching the samples. The biofield treated samples were
returned in similar sealed condition for further analysis.
2.3. Gas Chromatography - Mass Spectrometry (GC-MS)
GC-MS analysis was conducted on Perkin Elmer/Auto
system XL with Turbo mass, USA. The GC-MS was
accomplished in a silica capillary column. It was furnished
with a quadrupole detector with pre-filter. The mass
spectrometer was functioned in an electron ionization (EI)
+ve/-ve, and chemical ionization mode at 70 eV. Mass range:
10-650 Daltons (amu), stability: ± 0.1 m/z mass accuracy
over 48 hours. The characterization was performed by the
comparison of retention time and the mass spectra of
identified substances with references.
2.4. Methods of GC-MS Analysis and Calculation of
Isotopic Abundance Ratio
The GC-MS analysis of biofield treated o-nitrophenol and
m-nitrophenol were analyzed at the different time intervals
designated as T1, T2, T3, and T4, respectively. The mass
spectra were obtained in the form of % abundance vs. mass to
charge ratio (m/z). The natural abundance of each isotope can
be predicted from the comparison of the height of the isotope
peak with respect to the base peak. The values of the natural
isotopic abundance of the common elements are obtained
from several literatures [43-46] and presented in Table 1.
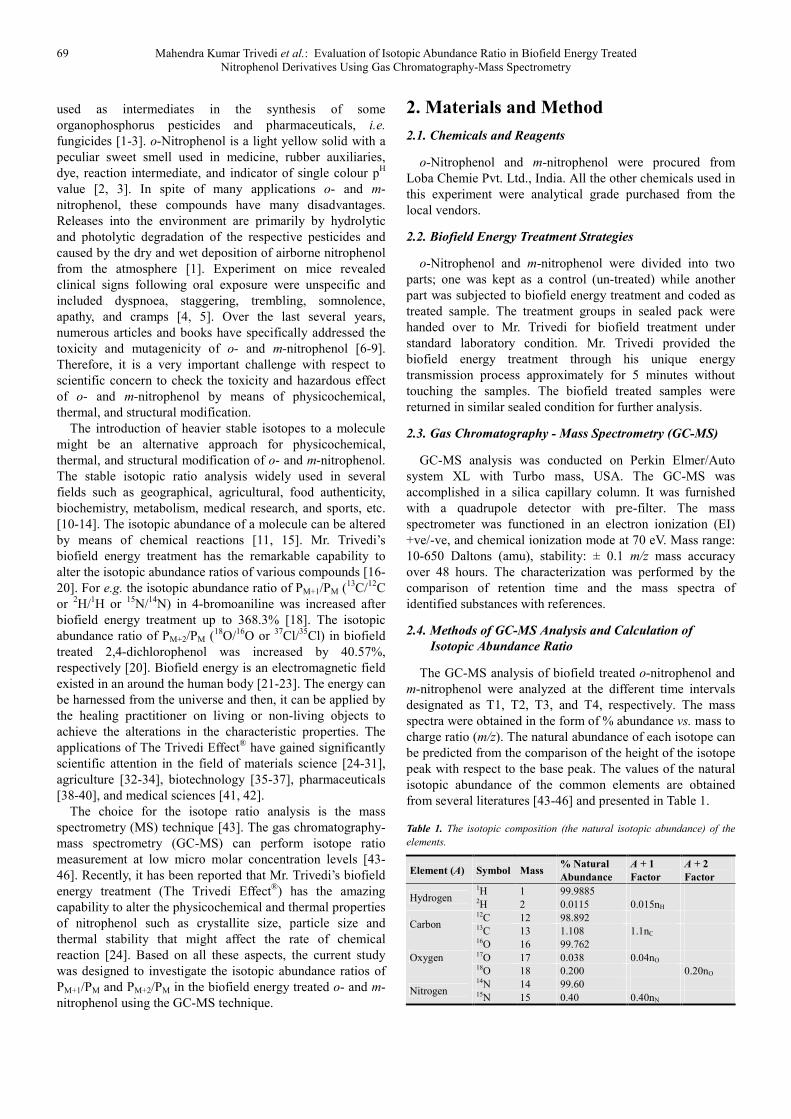
Table 1. The isotopic composition (the natural isotopic abundance) of the
elements.
Element (A) Symbol Mass % Natural
Abundance
A + 1
Factor
A + 2
Factor
Hydrogen 1H 1 99.9885 2H 2 0.0115 0.015nH
Carbon 12C 12 98.892 13C 13 1.108 1.1nC
Oxygen
16O 16 99.762 17O 17 0.038 0.04nO 18O 18 0.200 0.20nO
Nitrogen 14N 14 99.60 15N 15 0.40 0.40nN
American Journal of Chemical Engineering 2016; 4(3): 68-77 70
Element (A) Symbol Mass % Natural
Abundance
A + 1
Factor
A + 2
Factor
Chlorine 35Cl 35 75.78 37Cl 37 24.22 32.50nCl
A: Element; n: no of H, C, O, Cl, etc.
The following method was used for calculating the
isotopic abundance ratio:
PM stands for the relative peak intensity of the parent
molecular ion [M+] expressed in percentage. In other way, it
indicates the probability to have A element (for e.g. 12
C, 1H,
16O,
14N, etc.) contributions to the mass of the parent
molecular ion [M+].
PM+1 represents the relative peak intensity of the isotopic
molecular ion [(M+1)+] expressed in percentage
= (no. of 13
C x 1.1%) + (no. of 15
N x 0.40%) + (no. of 2H x
0.015%) + (no. of 17
O x 0.04%)
i.e. the probability to have A + 1 element (for e.g. 13
C, 2H,
15N, etc.) contributions to the mass of the isotopic molecular
ion [(M+1)+]
PM+2 represents the relative peak intensity of the isotopic
molecular ion [(M+2)+] expressed in the percentage
= (no. of 18
O x 0.20%) + (no. of 37
Cl x 32.50%)
i.e. the probability to have A + 2 element (for e.g. 18
O, 37
Cl, 34
S, etc.) contributions to the mass of isotopic molecular
ion [(M+2)+]
Isotopic abundance ratio (IAR) for A + 1 element = PM +
1/PM
Similarly, isotopic abundance ratio for A + 2 element =
PM+2/PM
Percentage (%) change in isotopic abundance ratio =
[(IARTreated – IARControl)/ IARControl) x 100]
Where, IARTreated = isotopic abundance ratio in the treated
sample and IARControl = isotopic abundance ratio in the
control sample.
3. Results and Discussion
The mass spectra obtained by the GC-MS analysis for the
control and biofield energy treated o- and m-nitrophenol
(C6H5NO3) in the positive-ion mode are shown in Figure 1-4.
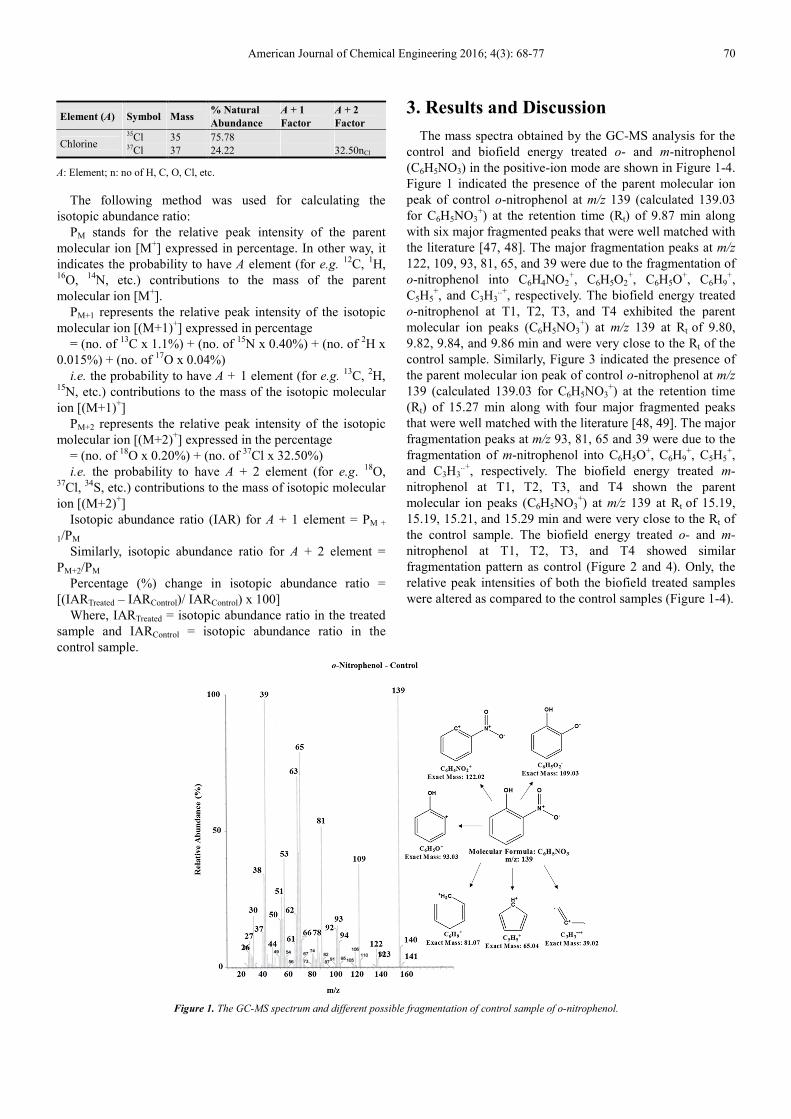
Figure 1 indicated the presence of the parent molecular ion
peak of control o-nitrophenol at m/z 139 (calculated 139.03
for C6H5NO3+) at the retention time (Rt) of 9.87 min along
with six major fragmented peaks that were well matched with
the literature [47, 48]. The major fragmentation peaks at m/z
122, 109, 93, 81, 65, and 39 were due to the fragmentation of
o-nitrophenol into C6H4NO2+, C6H5O2
+, C6H5O
+, C6H9
+,
C5H5+, and C3H3
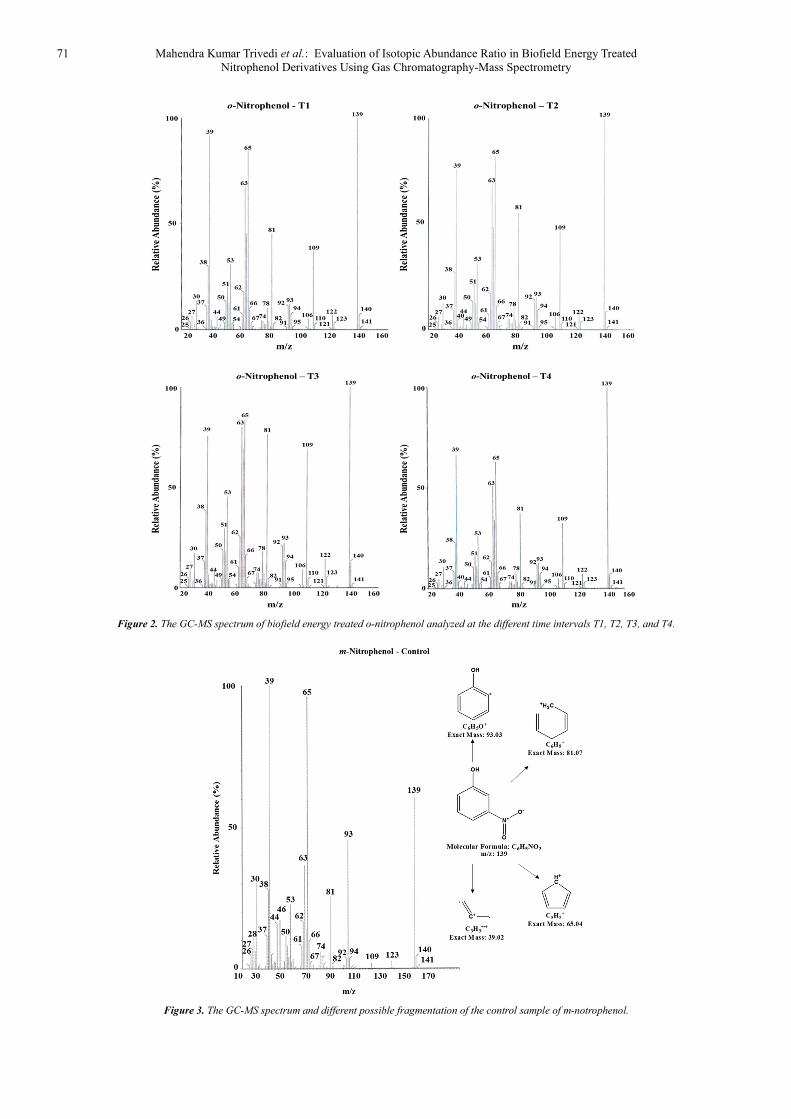
..+, respectively. The biofield energy treated
o-nitrophenol at T1, T2, T3, and T4 exhibited the parent
molecular ion peaks (C6H5NO3+) at m/z 139 at Rt of 9.80,
9.82, 9.84, and 9.86 min and were very close to the Rt of the
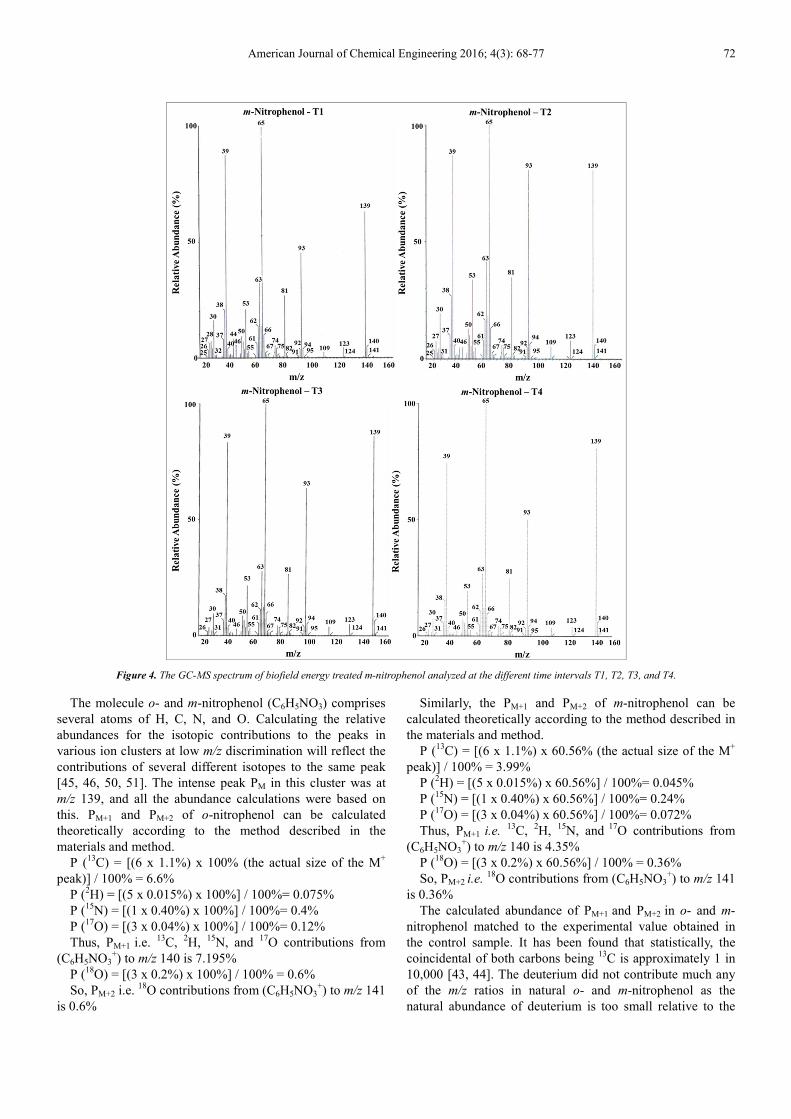
control sample. Similarly, Figure 3 indicated the presence of
the parent molecular ion peak of control o-nitrophenol at m/z
139 (calculated 139.03 for C6H5NO3+) at the retention time
(Rt) of 15.27 min along with four major fragmented peaks
that were well matched with the literature [48, 49]. The major
fragmentation peaks at m/z 93, 81, 65 and 39 were due to the
fragmentation of m-nitrophenol into C6H5O+, C6H9
+, C5H5
+,
and C3H3..+
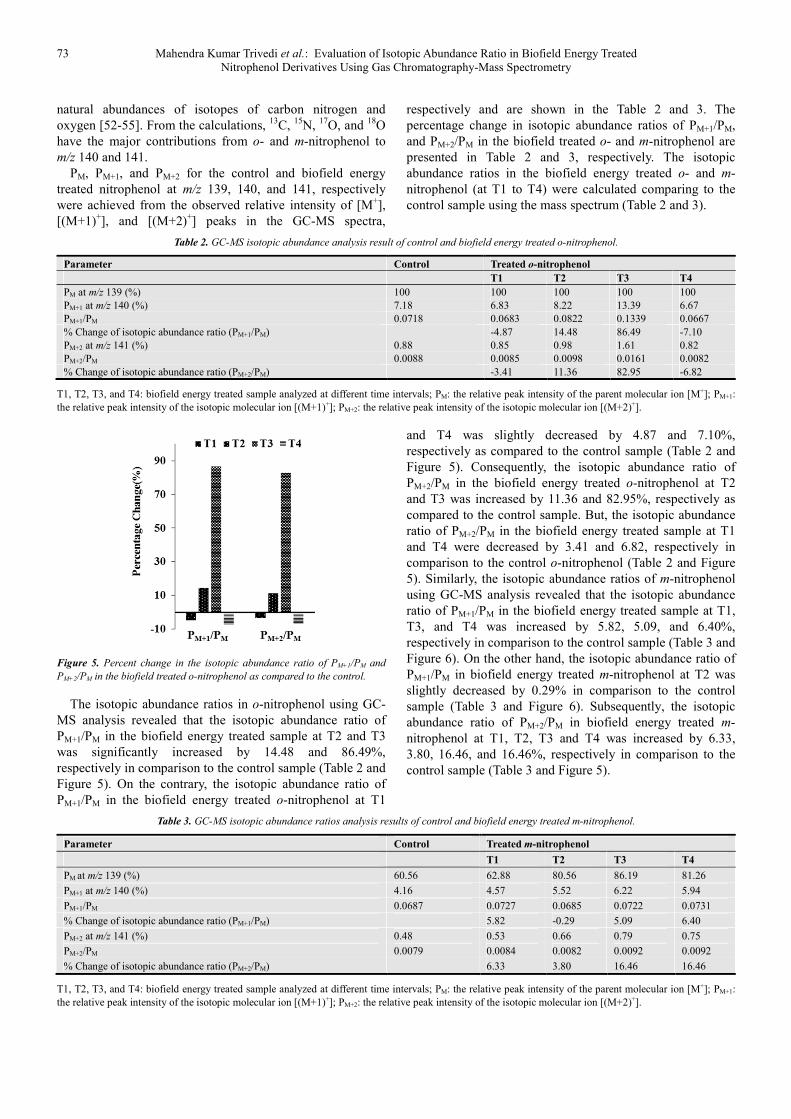
, respectively. The biofield energy treated m-
nitrophenol at T1, T2, T3, and T4 shown the parent
molecular ion peaks (C6H5NO3+) at m/z 139 at Rt of 15.19,
15.19, 15.21, and 15.29 min and were very close to the Rt of
the control sample. The biofield energy treated o- and m-
nitrophenol at T1, T2, T3, and T4 showed similar
fragmentation pattern as control (Figure 2 and 4). Only, the
relative peak intensities of both the biofield treated samples
were altered as compared to the control samples (Figure 1-4).
Figure 1. The GC-MS spectrum and different possible fragmentation of control sample of o-nitrophenol.
71 Mahendra Kumar Trivedi et al.: Evaluation of Isotopic Abundance Ratio in Biofield Energy Treated
Nitrophenol Derivatives Using Gas Chromatography-Mass Spectrometry
Figure 2. The GC-MS spectrum of biofield energy treated o-nitrophenol analyzed at the different time intervals T1, T2, T3, and T4.
Figure 3. The GC-MS spectrum and different possible fragmentation of the control sample of m-notrophenol.
American Journal of Chemical Engineering 2016; 4(3): 68-77 72
Figure 4. The GC-MS spectrum of biofield energy treated m-nitrophenol analyzed at the different time intervals T1, T2, T3, and T4.
The molecule o- and m-nitrophenol (C6H5NO3) comprises
several atoms of H, C, N, and O. Calculating the relative
abundances for the isotopic contributions to the peaks in
various ion clusters at low m/z discrimination will reflect the
contributions of several different isotopes to the same peak
[45, 46, 50, 51]. The intense peak PM in this cluster was at
m/z 139, and all the abundance calculations were based on
this. PM+1 and PM+2 of o-nitrophenol can be calculated
theoretically according to the method described in the
materials and method.
P (13
C) = [(6 x 1.1%) x 100% (the actual size of the M+
peak)] / 100% = 6.6%
P (2H) = [(5 x 0.015%) x 100%] / 100%= 0.075%
P (15
N) = [(1 x 0.40%) x 100%] / 100%= 0.4%
P (17
O) = [(3 x 0.04%) x 100%] / 100%= 0.12%
Thus, PM+1 i.e. 13
C, 2H,
15N, and
17O contributions from
(C6H5NO3+) to m/z 140 is 7.195%
P (18
O) = [(3 x 0.2%) x 100%] / 100% = 0.6%
So, PM+2 i.e. 18
O contributions from (C6H5NO3+) to m/z 141
is 0.6%
Similarly, the PM+1 and PM+2 of m-nitrophenol can be
calculated theoretically according to the method described in
the materials and method.
P (13
C) = [(6 x 1.1%) x 60.56% (the actual size of the M+
peak)] / 100% = 3.99%
P (2H) = [(5 x 0.015%) x 60.56%] / 100%= 0.045%
P (15
N) = [(1 x 0.40%) x 60.56%] / 100%= 0.24%
P (17
O) = [(3 x 0.04%) x 60.56%] / 100%= 0.072%
Thus, PM+1 i.e. 13
C, 2H,
15N, and
17O contributions from
(C6H5NO3+) to m/z 140 is 4.35%
P (18
O) = [(3 x 0.2%) x 60.56%] / 100% = 0.36%
So, PM+2 i.e. 18
O contributions from (C6H5NO3+) to m/z 141
is 0.36%
The calculated abundance of PM+1 and PM+2 in o- and m-
nitrophenol matched to the experimental value obtained in
the control sample. It has been found that statistically, the
coincidental of both carbons being 13
C is approximately 1 in
10,000 [43, 44]. The deuterium did not contribute much any
of the m/z ratios in natural o- and m-nitrophenol as the
natural abundance of deuterium is too small relative to the
73 Mahendra Kumar Trivedi et al.: Evaluation of Isotopic Abundance Ratio in Biofield Energy Treated
Nitrophenol Derivatives Using Gas Chromatography-Mass Spectrometry
natural abundances of isotopes of carbon nitrogen and
oxygen [52-55]. From the calculations, 13
C, 15
N, 17
O, and 18
O
have the major contributions from o- and m-nitrophenol to
m/z 140 and 141.
PM, PM+1, and PM+2 for the control and biofield energy
treated nitrophenol at m/z 139, 140, and 141, respectively
were achieved from the observed relative intensity of [M+],
[(M+1)+], and [(M+2)
+] peaks in the GC-MS spectra,
respectively and are shown in the Table 2 and 3. The
percentage change in isotopic abundance ratios of PM+1/PM,
and PM+2/PM in the biofield treated o- and m-nitrophenol are
presented in Table 2 and 3, respectively. The isotopic
abundance ratios in the biofield energy treated o- and m-
nitrophenol (at T1 to T4) were calculated comparing to the
control sample using the mass spectrum (Table 2 and 3).
Table 2. GC-MS isotopic abundance analysis result of control and biofield energy treated o-nitrophenol.
Parameter Control Treated o-nitrophenol
T1 T2 T3 T4
PM at m/z 139 (%) 100 100 100 100 100
PM+1 at m/z 140 (%) 7.18 6.83 8.22 13.39 6.67
PM+1/PM 0.0718 0.0683 0.0822 0.1339 0.0667
% Change of isotopic abundance ratio (PM+1/PM) -4.87 14.48 86.49 -7.10
PM+2 at m/z 141 (%) 0.88 0.85 0.98 1.61 0.82
PM+2/PM 0.0088 0.0085 0.0098 0.0161 0.0082
% Change of isotopic abundance ratio (PM+2/PM) -3.41 11.36 82.95 -6.82
T1, T2, T3, and T4: biofield energy treated sample analyzed at different time intervals; PM: the relative peak intensity of the parent molecular ion [M+]; PM+1:
the relative peak intensity of the isotopic molecular ion [(M+1)+]; PM+2: the relative peak intensity of the isotopic molecular ion [(M+2)+].
Figure 5. Percent change in the isotopic abundance ratio of PM+1/PM and
PM+2/PM in the biofield treated o-nitrophenol as compared to the control.
The isotopic abundance ratios in o-nitrophenol using GC-
MS analysis revealed that the isotopic abundance ratio of
PM+1/PM in the biofield energy treated sample at T2 and T3
was significantly increased by 14.48 and 86.49%,
respectively in comparison to the control sample (Table 2 and
Figure 5). On the contrary, the isotopic abundance ratio of
PM+1/PM in the biofield energy treated o-nitrophenol at T1
and T4 was slightly decreased by 4.87 and 7.10%,
respectively as compared to the control sample (Table 2 and
Figure 5). Consequently, the isotopic abundance ratio of
PM+2/PM in the biofield energy treated o-nitrophenol at T2
and T3 was increased by 11.36 and 82.95%, respectively as
compared to the control sample. But, the isotopic abundance
ratio of PM+2/PM in the biofield energy treated sample at T1
and T4 were decreased by 3.41 and 6.82, respectively in
comparison to the control o-nitrophenol (Table 2 and Figure
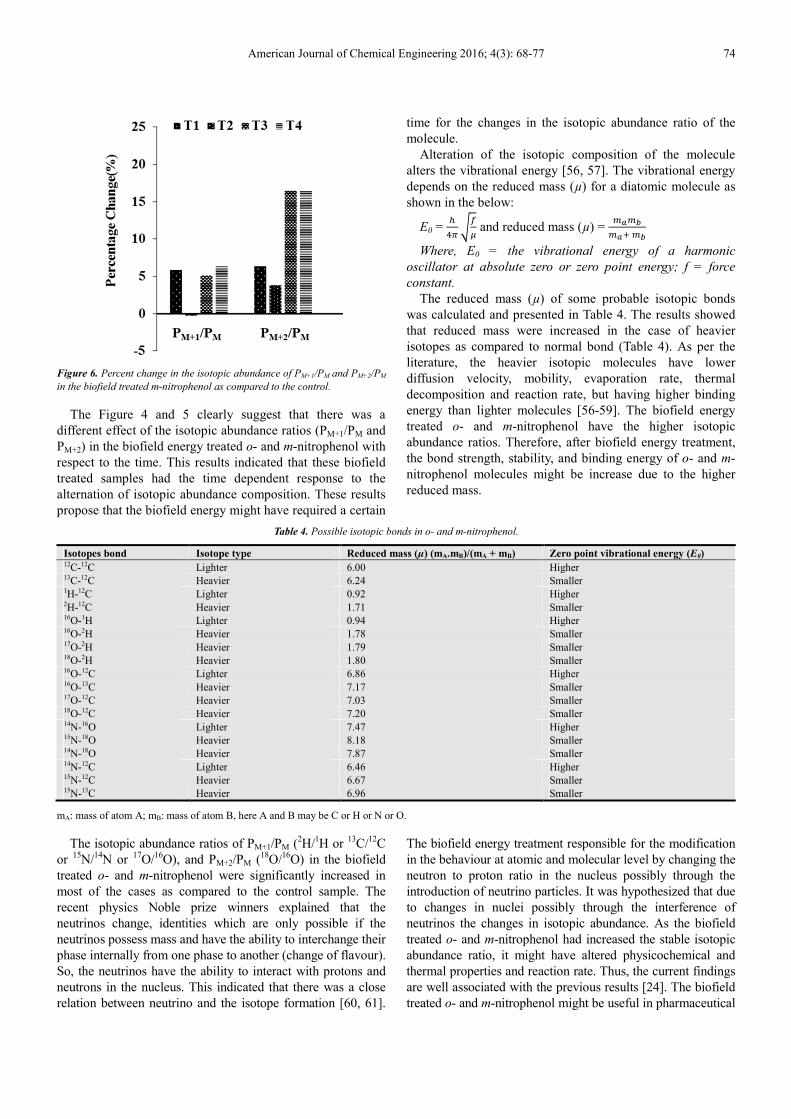
5). Similarly, the isotopic abundance ratios of m-nitrophenol
using GC-MS analysis revealed that the isotopic abundance
ratio of PM+1/PM in the biofield energy treated sample at T1,
T3, and T4 was increased by 5.82, 5.09, and 6.40%,
respectively in comparison to the control sample (Table 3 and
Figure 6). On the other hand, the isotopic abundance ratio of
PM+1/PM in biofield energy treated m-nitrophenol at T2 was
slightly decreased by 0.29% in comparison to the control
sample (Table 3 and Figure 6). Subsequently, the isotopic
abundance ratio of PM+2/PM in biofield energy treated m-
nitrophenol at T1, T2, T3 and T4 was increased by 6.33,
3.80, 16.46, and 16.46%, respectively in comparison to the
control sample (Table 3 and Figure 5).
Table 3. GC-MS isotopic abundance ratios analysis results of control and biofield energy treated m-nitrophenol.
Parameter Control Treated m-nitrophenol
T1 T2 T3 T4
PM at m/z 139 (%) 60.56 62.88 80.56 86.19 81.26
PM+1 at m/z 140 (%) 4.16 4.57 5.52 6.22 5.94
PM+1/PM 0.0687 0.0727 0.0685 0.0722 0.0731
% Change of isotopic abundance ratio (PM+1/PM) 5.82 -0.29 5.09 6.40
PM+2 at m/z 141 (%) 0.48 0.53 0.66 0.79 0.75
PM+2/PM 0.0079 0.0084 0.0082 0.0092 0.0092
% Change of isotopic abundance ratio (PM+2/PM) 6.33 3.80 16.46 16.46
T1, T2, T3, and T4: biofield energy treated sample analyzed at different time intervals; PM: the relative peak intensity of the parent molecular ion [M+]; PM+1:
the relative peak intensity of the isotopic molecular ion [(M+1)+]; PM+2: the relative peak intensity of the isotopic molecular ion [(M+2)+].
American Journal of Chemical Engineering 2016; 4(3): 68-77 74
Figure 6. Percent change in the isotopic abundance of PM+1/PM and PM+2/PM
in the biofield treated m-nitrophenol as compared to the control.
The Figure 4 and 5 clearly suggest that there was a
different effect of the isotopic abundance ratios (PM+1/PM and
PM+2) in the biofield energy treated o- and m-nitrophenol with
respect to the time. This results indicated that these biofield
treated samples had the time dependent response to the
alternation of isotopic abundance composition. These results
propose that the biofield energy might have required a certain
time for the changes in the isotopic abundance ratio of the
molecule.
Alteration of the isotopic composition of the molecule
alters the vibrational energy [56, 57]. The vibrational energy
depends on the reduced mass (µ) for a diatomic molecule as
shown in the below:
E0 = �
�� ��� and reduced mass (µ) =
����� �
Where, E0 = the vibrational energy of a harmonic
oscillator at absolute zero or zero point energy; f = force
constant.
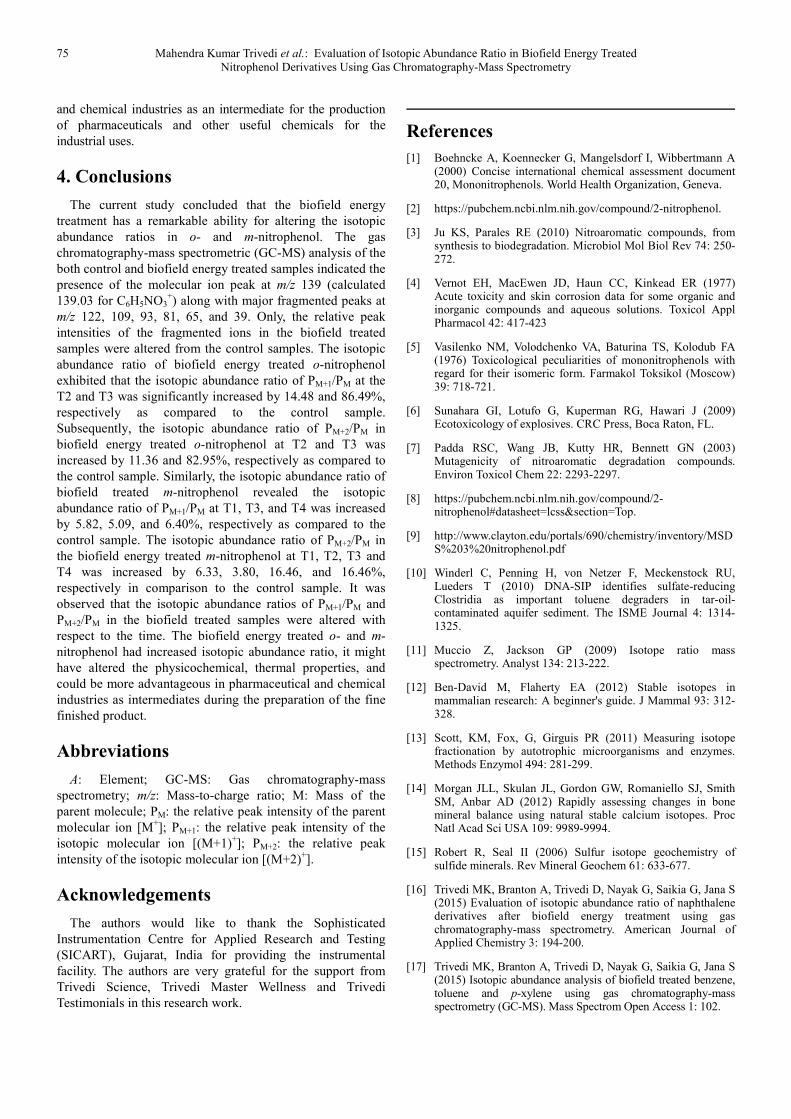
The reduced mass (µ) of some probable isotopic bonds
was calculated and presented in Table 4. The results showed
that reduced mass were increased in the case of heavier
isotopes as compared to normal bond (Table 4). As per the
literature, the heavier isotopic molecules have lower
diffusion velocity, mobility, evaporation rate, thermal
decomposition and reaction rate, but having higher binding
energy than lighter molecules [56-59]. The biofield energy
treated o- and m-nitrophenol have the higher isotopic
abundance ratios. Therefore, after biofield energy treatment,
the bond strength, stability, and binding energy of o- and m-
nitrophenol molecules might be increase due to the higher
reduced mass.
Table 4. Possible isotopic bonds in o- and m-nitrophenol.
Isotopes bond Isotope type Reduced mass (µ) (mA.mB)/(mA + mB) Zero point vibrational energy (E0) 12C-12C Lighter 6.00 Higher 13C-12C Heavier 6.24 Smaller 1H-12C Lighter 0.92 Higher 2H-12C Heavier 1.71 Smaller 16O-1H Lighter 0.94 Higher 16O-2H Heavier 1.78 Smaller 17O-2H Heavier 1.79 Smaller 18O-2H Heavier 1.80 Smaller 16O-12C Lighter 6.86 Higher 16O-13C Heavier 7.17 Smaller 17O-12C Heavier 7.03 Smaller 18O-12C Heavier 7.20 Smaller 14N-16O Lighter 7.47 Higher 15N-18O Heavier 8.18 Smaller 14N-18O Heavier 7.87 Smaller 14N-12C Lighter 6.46 Higher 15N-12C Heavier 6.67 Smaller 15N-13C Heavier 6.96 Smaller
mA: mass of atom A; mB: mass of atom B, here A and B may be C or H or N or O.
The isotopic abundance ratios of PM+1/PM (2H/
1H or
13C/
12C
or 15
N/14
N or 17
O/16
O), and PM+2/PM (18
O/16
O) in the biofield
treated o- and m-nitrophenol were significantly increased in
most of the cases as compared to the control sample. The
recent physics Noble prize winners explained that the
neutrinos change, identities which are only possible if the
neutrinos possess mass and have the ability to interchange their
phase internally from one phase to another (change of flavour).
So, the neutrinos have the ability to interact with protons and
neutrons in the nucleus. This indicated that there was a close
relation between neutrino and the isotope formation [60, 61].
The biofield energy treatment responsible for the modification
in the behaviour at atomic and molecular level by changing the
neutron to proton ratio in the nucleus possibly through the
introduction of neutrino particles. It was hypothesized that due
to changes in nuclei possibly through the interference of
neutrinos the changes in isotopic abundance. As the biofield
treated o- and m-nitrophenol had increased the stable isotopic
abundance ratio, it might have altered physicochemical and
thermal properties and reaction rate. Thus, the current findings
are well associated with the previous results [24]. The biofield
treated o- and m-nitrophenol might be useful in pharmaceutical
75 Mahendra Kumar Trivedi et al.: Evaluation of Isotopic Abundance Ratio in Biofield Energy Treated
Nitrophenol Derivatives Using Gas Chromatography-Mass Spectrometry
and chemical industries as an intermediate for the production
of pharmaceuticals and other useful chemicals for the
industrial uses.
4. Conclusions
The current study concluded that the biofield energy
treatment has a remarkable ability for altering the isotopic
abundance ratios in o- and m-nitrophenol. The gas
chromatography-mass spectrometric (GC-MS) analysis of the
both control and biofield energy treated samples indicated the
presence of the molecular ion peak at m/z 139 (calculated
139.03 for C6H5NO3+) along with major fragmented peaks at
m/z 122, 109, 93, 81, 65, and 39. Only, the relative peak
intensities of the fragmented ions in the biofield treated
samples were altered from the control samples. The isotopic
abundance ratio of biofield energy treated o-nitrophenol
exhibited that the isotopic abundance ratio of PM+1/PM at the
T2 and T3 was significantly increased by 14.48 and 86.49%,
respectively as compared to the control sample.
Subsequently, the isotopic abundance ratio of PM+2/PM in
biofield energy treated o-nitrophenol at T2 and T3 was
increased by 11.36 and 82.95%, respectively as compared to
the control sample. Similarly, the isotopic abundance ratio of
biofield treated m-nitrophenol revealed the isotopic
abundance ratio of PM+1/PM at T1, T3, and T4 was increased
by 5.82, 5.09, and 6.40%, respectively as compared to the
control sample. The isotopic abundance ratio of PM+2/PM in
the biofield energy treated m-nitrophenol at T1, T2, T3 and
T4 was increased by 6.33, 3.80, 16.46, and 16.46%,
respectively in comparison to the control sample. It was
observed that the isotopic abundance ratios of PM+1/PM and
PM+2/PM in the biofield treated samples were altered with
respect to the time. The biofield energy treated o- and m-
nitrophenol had increased isotopic abundance ratio, it might
have altered the physicochemical, thermal properties, and
could be more advantageous in pharmaceutical and chemical
industries as intermediates during the preparation of the fine
finished product.
Abbreviations
A: Element; GC-MS: Gas chromatography-mass
spectrometry; m/z: Mass-to-charge ratio; M: Mass of the
parent molecule; PM: the relative peak intensity of the parent
molecular ion [M+]; PM+1: the relative peak intensity of the
isotopic molecular ion [(M+1)+]; PM+2: the relative peak
intensity of the isotopic molecular ion [(M+2)+].
Acknowledgements
The authors would like to thank the Sophisticated
Instrumentation Centre for Applied Research and Testing
(SICART), Gujarat, India for providing the instrumental
facility. The authors are very grateful for the support from
Trivedi Science, Trivedi Master Wellness and Trivedi
Testimonials in this research work.
References
[1] Boehncke A, Koennecker G, Mangelsdorf I, Wibbertmann A (2000) Concise international chemical assessment document 20, Mononitrophenols. World Health Organization, Geneva.
[2] https://pubchem.ncbi.nlm.nih.gov/compound/2-nitrophenol.
[3] Ju KS, Parales RE (2010) Nitroaromatic compounds, from synthesis to biodegradation. Microbiol Mol Biol Rev 74: 250-272.
[4] Vernot EH, MacEwen JD, Haun CC, Kinkead ER (1977) Acute toxicity and skin corrosion data for some organic and inorganic compounds and aqueous solutions. Toxicol Appl Pharmacol 42: 417-423
[5] Vasilenko NM, Volodchenko VA, Baturina TS, Kolodub FA (1976) Toxicological peculiarities of mononitrophenols with regard for their isomeric form. Farmakol Toksikol (Moscow) 39: 718-721.
[6] Sunahara GI, Lotufo G, Kuperman RG, Hawari J (2009) Ecotoxicology of explosives. CRC Press, Boca Raton, FL.
[7] Padda RSC, Wang JB, Kutty HR, Bennett GN (2003) Mutagenicity of nitroaromatic degradation compounds. Environ Toxicol Chem 22: 2293-2297.
[8] https://pubchem.ncbi.nlm.nih.gov/compound/2-nitrophenol#datasheet=lcss§ion=Top.
[9] http://www.clayton.edu/portals/690/chemistry/inventory/MSDS%203%20nitrophenol.pdf
[10] Winderl C, Penning H, von Netzer F, Meckenstock RU, Lueders T (2010) DNA-SIP identifies sulfate-reducing Clostridia as important toluene degraders in tar-oil-contaminated aquifer sediment. The ISME Journal 4: 1314-1325.
[11] Muccio Z, Jackson GP (2009) Isotope ratio mass spectrometry. Analyst 134: 213-222.
[12] Ben-David M, Flaherty EA (2012) Stable isotopes in mammalian research: A beginner's guide. J Mammal 93: 312-328.
[13] Scott, KM, Fox, G, Girguis PR (2011) Measuring isotope fractionation by autotrophic microorganisms and enzymes. Methods Enzymol 494: 281-299.
[14] Morgan JLL, Skulan JL, Gordon GW, Romaniello SJ, Smith SM, Anbar AD (2012) Rapidly assessing changes in bone mineral balance using natural stable calcium isotopes. Proc Natl Acad Sci USA 109: 9989-9994.
[15] Robert R, Seal II (2006) Sulfur isotope geochemistry of sulfide minerals. Rev Mineral Geochem 61: 633-677.
[16] Trivedi MK, Branton A, Trivedi D, Nayak G, Saikia G, Jana S (2015) Evaluation of isotopic abundance ratio of naphthalene derivatives after biofield energy treatment using gas chromatography-mass spectrometry. American Journal of Applied Chemistry 3: 194-200.
[17] Trivedi MK, Branton A, Trivedi D, Nayak G, Saikia G, Jana S (2015) Isotopic abundance analysis of biofield treated benzene, toluene and p-xylene using gas chromatography-mass spectrometry (GC-MS). Mass Spectrom Open Access 1: 102.
American Journal of Chemical Engineering 2016; 4(3): 68-77 76
[18] Trivedi MK, Branton A, Trivedi D, Nayak G, Saikia G, Jana S (2015) Influence of biofield energy treatment on isotopic abundance ratio in aniline derivatives. Mod Chem appl 3: 168.
[19] Trivedi MK, Branton A, Trivedi D, Nayak G, Saikia G, Jana S (2015) Quantitative determination of isotopic abundance ratio of 13C, 2H, and 18O in biofield energy treated ortho and meta toluic acid isomers. American Journal of Applied Chemistry 3: 217-223.
[20] Trivedi MK, Branton A, Trivedi D, Nayak G, Saikia G, Jana S (2015) Determination of isotopic abundance of 2H, 13C, 18O, and 37Cl in biofield energy treated dichlorophenol isomers. Science Journal of Analytical Chemistry 4: 1-6.
[21] Hammerschlag R, Jain S, Baldwin AL, Gronowicz G, Lutgendor SK, Oschman JL, Yount GL (2012) Biofield research: A roundtable discussion of scientific and methodological issues. J Altern Complement Med 18: 1081-1086.
[22] Warber SL, Cornelio D, Straughn J, Kile G (2004) Biofield energy healing from the inside. J Altern Complement Med 10: 1107-1113.
[23] Rubik B (2002) The biofield hypothesis: Its biophysical basis and role in medicine. J Altern Complement Med 8: 703-717.
[24] Trivedi MK, Tallapragada RM, Branton A, Trivedi D, Nayak G, et al. (2015) Biofield treatment: an effective strategy for modulating the physical and thermal properties of o-nitrophenol, m-nitrophenol and p-tertiary butyl phenol. J Bioanal Biomed 7: 156-163.
[25] Trivedi MK, Branton A, Trivedi D, Nayak G, Saikia G, Jana S (2015) Characterization of physico-chemical and spectroscopic properties of biofield energy treated 4-bromoacetophenone. American Journal of Physical Chemistry 4: 30-37.
[26] Trivedi MK, Branton A, Trivedi D, Nayak G, Saikia G, Jana S (2015) Chromatographic, spectroscopic, and thermal characterization of biofield energy treated N, N-dimethylformamide. American Journal of Applied Chemistry 3: 188-193.
[27] Trivedi MK, Branton A, Trivedi D, Nayak G, Bairwa, K, Jana S (2015) Physicochemical and spectroscopic characteristics of biofield treated p-chlorobenzophenone. American Journal of Physical Chemistry 4: 48-57.
[28] Jana S, Trivedi MK, Branton A, Trivedi D, Nayak G, Saikia G. (2015) Physical and structural characterization of biofield energy treated carbazole. Pharm Anal Acta 6: 435.
[29] Trivedi MK, Branton A, Trivedi D, Nayak G, Saikia G, Jana S (2015) Physical and structural characterization of biofield treated imidazole derivatives. Nat Prod Chem Res 3: 187.
[30] Trivedi MK, Branton A, Trivedi D, Nayak G, Saikia G, Jana S (2015) Thermal, spectroscopic and chemical characterization of biofield energy treated anisole. Organic Chem Curr Res 4: 152.
[31] Trivedi MK, Branton A, Trivedi D, Nayak G, Bairwa K, Jana S (2015) Investigation of isotopic abundance ratio of biofield treated phenol derivatives using gas chromatography-mass spectrometry. J Chromatograph Separat Techniq S 6: 003.
[32] Trivedi MK, Branton A, Trivedi D, Nayak G, Gangwar M, Jana S (2015) Effect of biofield energy treatment on
chlorophyll content, pathological study, and molecular analysis of cashew plant (Anacardium occidentale L.). Journal of Plant Sciences 3: 372-382.
[33] Sances F, Flora E, Patil S, Spence A, Shinde V (2013) Impact of biofield treatment on ginseng and organic blueberry yield. Agrivita, J Agric Sci 35: 22-29.
[34] Trivedi MK, Branton A, Trivedi D, Nayak G, Mondal SC, Jana S (2015) Evaluation of plant growth, yield and yield attributes of biofield energy treated mustard (Brassica juncea) and chick pea (Cicer arietinum) seeds. Agriculture, Forestry and Fisheries. 4: 291-295.
[35] Trivedi MK, Branton A, Trivedi D, Nayak G, Mondal SC, Jana S (2015) Morphological characterization, quality, yield and DNA fingerprinting of biofield energy treated alphonso mango (Mangifera indica L.). Journal of Food and Nutrition Sciences 3: 245-250.
[36] Nayak G, Altekar N (2015) Effect of a biofield treatment on plant growth and adaptation. J Environ Health Sci 1: 1-9.
[37] Trivedi MK, Branton A, Trivedi D, Nayak G, Bairwa K, Jana S (2015) Physical, thermal, and spectroscopic characterization of biofield energy treated murashige and skoog plant cell culture media. Cell Biology 3: 50-57.
[38] Trivedi MK, Patil S, Shettigar H, Bairwa K, Jana S (2015) Effect of biofield treatment on spectral properties of paracetamol and piroxicam. Chem Sci J 6: 98.
[39] Trivedi MK, Branton A, Trivedi D, Shettigar H, Bairwa K, Jana S (2015) Fourier transform infrared and ultraviolet-visible spectroscopic characterization of biofield treated salicylic acid and sparfloxacin. Nat Prod Chem Res 3: 186.
[40] Trivedi MK, Patil S, Shettigar H, Singh R, Jana S (2015) An impact of biofield treatment on spectroscopic characterization of pharmaceutical compounds. Mod Chem Appl 3: 159.
[41] Trivedi MK, Patil S, Shettigar H, Mondal SC, Jana S (2015) The potential impact of biofield treatment on human brain tumor cells: A time-lapse video microscopy. J Integr Oncol 4: 141.
[42] Trivedi MK, Patil S, Shettigar H, Gangwar M, Jana S (2015) In vitro evaluation of biofield treatment on cancer biomarkers involved in endometrial and prostate cancer cell lines. J Cancer Sci Ther 7: 253-257.
[43] Weisel CP, Park S, Pyo H, Mohan K, Witz G (2003) Use of stable isotopically labeled benzene to evaluate environmental exposures. J Expo Anal Environ Epidemiol 13: 393-402.
[44] Rosman KJR, Taylor PDP (1998) Isotopic compositions of the elements 1997 (Technical Report). Pure Appl Chem 70: 217-235.
[45] Smith RM (2004) Understanding Mass Spectra: A Basic Approach, Second Edition, John Wiley & Sons, Inc.
[46] Jürgen H (2004) Gross Mass Spectrometry: A Textbook (2nd Edn) Springer: Berlin.
[47] http://webbook.nist.gov/cgi/cbook.cgi?ID=C88755&Mask=200#Mass-Spec.
[48] Sparkman DO, Penton Z, Kitson FG (2011) Gas Chromatography and Mass Spectrometry: A Practical Guide (2nd Edn) Elsevier Inc.
77 Mahendra Kumar Trivedi et al.: Evaluation of Isotopic Abundance Ratio in Biofield Energy Treated
Nitrophenol Derivatives Using Gas Chromatography-Mass Spectrometry
[49] http://webbook.nist.gov/cgi/cbook.cgi?ID=C554847&Mask=200.
[50] Gordon J (1998) Inside informatics, cambridgesoft.com Article ID: Isotopic Abundance.
[51] Johnstone RAW, Rose ME (1996) Mass Spectrometry for Chemists and Biochemists (2nd Edn) Cambridge university press.
[52] http://www.chemguide.co.uk/analysis/masspec/mplus2.html.
[53] http://www.chemguide.co.uk/analysis/masspec/mplus1.html.
[54] http://www.chem.uoa.gr/applets/AppletMS/Appl_Ms2.html.
[55] Wieser ME (2006) Atomic weights of the elements 2005. Pure Appl Chem 78: 2051-2066.
[56] Vanhaecke F, Kyser K (2012) Isotopic composition of the
elements In Isotopic Analysis: Fundamentals and applications using ICP-MS (1st Edn), Edited by Vanhaecke F, Degryse P. Wiley-VCH GmbH & Co. KGaA, Weinheim.
[57] Asperger S (2003) Chemical Kinetics and Inorganic Reaction Mechanisms Springer science + Business media, New York.
[58] http://www.eolss.net/sample-chapters/c06/e6-104-01-00.pdf.
[59] Lomas JS, Thorne MP (1982) Structure and isotope effects upon the thermal decomposition of carbamates of highly congested tertiary alcohols. J Chem Soc, Perkin Trans 2 221-226.
[60] www.nobelprize.org/nobel_prizes/physics/laureates/2015/advanced-physicsprize2015. pdf
[61] Balantekin AB (2013) Neutrinos and rare isotopes Journal of Physics: Conference Series 445 012022.