Embed Size (px)
Citation preview

Evaluation of Low-Cost Treatments on Rural Two-Lane CurvesFinal ReportJuly 2012
Sponsored byIowa Department of Transportation(InTrans Project 08-320)Iowa Highway Research Board(IHRB Project TR-579) Midwest Transportation Consortium

About the MTCThe Midwest Transportation Consortium (MTC) is a Tier 1 University Transportation Center (UTC) that includes Iowa State University, the University of Iowa, and the University of Northern Iowa. The mission of the UTC program is to advance U.S. technology and expertise in the many disciplines comprising transportation through the mechanisms of education, research, and technology transfer at university-based centers of excellence. Iowa State University, through its Institute for Transportation (InTrans), is the MTC’s lead institution.
About CTREThe mission of the Center for Transportation Research and Education (CTRE) at Iowa State University is to develop and implement innovative methods, materials, and technologies for improving transportation efficiency, safety, and reliability while improving the learning environment of students, faculty, and staff in transportation-related fields.
Disclaimer NoticeThe contents of this report reflect the views of the authors, who are responsible for the facts and the accuracy of the information presented herein. The opinions, findings and conclusions expressed in this publication are those of the authors and not necessarily those of the sponsors.
The sponsors assume no liability for the contents or use of the information contained in this document. This report does not constitute a standard, specification, or regulation.
The sponsors do not endorse products or manufacturers. Trademarks or manufacturers’ names appear in this report only because they are considered essential to the objective of the document.
Non-Discrimination Statement Iowa State University does not discriminate on the basis of race, color, age, religion, national origin, sexual orientation, gender identity, genetic information, sex, marital status, disability, or status as a U.S. veteran. Inquiries can be directed to the Director of Equal Opportunity and Compliance, 3280 Beardshear Hall, (515) 294-7612.
Iowa Department of Transportation Statements Federal and state laws prohibit employment and/or public accommodation discrimination on the basis of age, color, creed, disability, gender identity, national origin, pregnancy, race, religion, sex, sexual orientation or veteran’s status. If you believe you have been discriminated against, please contact the Iowa Civil Rights Commission at 800-457-4416 or Iowa Department of Transportation’s affirmative action officer. If you need accommodations because of a disability to access the Iowa Department of Transportation’s services, contact the agency’s affirmative action officer at 800-262-0003.
The preparation of this report was financed in part through funds provided by the Iowa Department of Transportation through its “Agreement for the Management of Research Conducted by Iowa State University for the Iowa Department of Transportation” and its amendments.
The opinions, findings, and conclusions expressed in this publication are those of the authors and not necessarily those of the Iowa Department of Transportation.

Technical Report Documentation Page
1. Report No. 2. Government Accession No. 3. Recipient’s Catalog No. IHRB Project TR-579 4. Title and Subtitle 5. Report Date Evaluation of Low-Cost Treatments on Rural Two-Lane Curves July 2012
6. Performing Organization Code
7. Author(s) 8. Performing Organization Report No. Shauna L. Hallmark, Neal Hawkins, and Omar Smadi InTrans Project 08-320 9. Performing Organization Name and Address 10. Work Unit No. (TRAIS) Center for Transportation Research and Education Iowa State University 2711 South Loop Drive, Suite 4700 Ames, IA 50010-8664
11. Contract or Grant No.
12. Sponsoring Organization Name and Address 13. Type of Report and Period Covered Midwest Transportation Consortium 2711 South Loop Drive, Suite 4700 Ames, IA 50010-8664
Iowa Department of Transportation and Iowa Highway Research Board 800 Lincoln Way Ames, IA 50010
Final Report 14. Sponsoring Agency Code
15. Supplementary Notes Color pdfs of this and other InTrans research reports are available at www.intrans.iastate.edu/.
16. Abstract The objective of this project was to evaluate low-cost measures to reduce speeds on high-crash horizontal curves.
The researchers evaluated two low-cost treatments in Iowa to determine their effectiveness in reducing speeds on rural two-lane roadways. This report summarizes how the research team selected sites and collected data, and the results.
The team selected six sites. Retroreflective post treatments were added to existing chevrons at four sites and on-pavement curve markings were added at two sites.
The researchers collected speed data before and after installation of the two treatments. The study compared several speed metrics to assess the effectiveness of the treatments. Overall, both were moderately effective in reducing speeds. The most significant impact of the treatments was in reducing the percentage of vehicles traveling over the posted or advisory speed by 5, 10, 15, or 20 or more mph. This result suggests that the treatments are most effective in reducing high-end speeds.
17. Key Words 18. Distribution Statement crash mitigation—curve speed safety—curve speed warnings—horizontal curves—low-cost improvements—on-pavement curve markings—post-mounted treatments—retroreflective treatments—rural road safety
No restrictions.
19. Security Classification (of this report) 20. Security Classification (of this page)
21. No. of Pages 22. Price
Unclassified. Unclassified. 42 NA
Form DOT F 1700.7 (8-72) Reproduction of completed page authorized


EVALUATION OF LOW-COST TREATMENTS ON RURAL TWO-LANE CURVES
Draft Final Report July 2012
Principal Investigator Shauna L. Hallmark, Transportation Engineer
Center for Transportation Research and Education, Iowa State University
Co-Principal Investigators Neal Hawkins, Director and Omar Smadi, Research Scientist
Center for Transportation Research and Education, Iowa State University
Authors Shauna L. Hallmark, Neal Hawkins, and Omar Smadi
Sponsored by Iowa Department of Transportation,
Iowa Highway Research Board, Midwest Transportation Consortium
(IHRB Project TR-579)
Preparation of this report was financed in part through funds provided by the Iowa Department of Transportation
through its research management agreement with the Institute for Transportation (InTrans Project 08-320)
A report from Institute for Transportation
Iowa State University 2711 South Loop Drive, Suite 4700
Ames, IA 50010-8664 Phone: 515-294-8103 Fax: 515-294-0467
www.intrans.iastate.edu


v
TABLE OF CONTENTS
ACKNOWLEDGMENTS ............................................................................................................ vii
1. EXECUTIVE SUMMARY .........................................................................................................1
2. INTRODUCTION .......................................................................................................................2
2.1 Background ....................................................................................................................2 2.2 Project Objectives ..........................................................................................................5
3. DESCRIPTION OF TREATMENTS ..........................................................................................6
3.1 On-Pavement Curve Markings ......................................................................................6 3.2 Retroreflective Post Treatments .....................................................................................7
4. DESCRIPTION OF SITES AND DATA COLLECTION ..........................................................9
4.1 Site Selection .................................................................................................................9 4.2 Description of Test Sites ................................................................................................9 4.3 Data Collection and Reduction ....................................................................................10
5. RESULTS ..................................................................................................................................11
5.1 US 52 Retroreflective Post Treatments........................................................................11 5.2 County Road Y52 Retroreflective Post Treatments.....................................................15 5.3 221st Street Retroreflective Post Treatments ...............................................................18 5.4 IA 141 Retroreflective Post Treatments ......................................................................21 5.5 DMC 99 On-Pavement Curve Markings .....................................................................24 5.6 County Road L20/Loess Hills Trail On-Pavement Curve Markings ...........................27
6. CONCLUSIONS........................................................................................................................30
REFERENCES ..............................................................................................................................33
vi
LIST OF FIGURES
Figure 3.1. On-pavement curve markings (Chrysler et al. 2006) ....................................................6 Figure 5.1. Initial post treatment for US 52 ...................................................................................11 Figure 5.2. US 52 retroreflective post treatment impact on vehicle speeds ..................................13 Figure 5.3. US 52 site location and percentage change exceeding advisory speed limit ..............14 Figure 5.4. CR Y52 retroreflective post treatment impact on vehicle speeds ...............................16 Figure 5.5. CR Y52 site location and percentage change exceeding advisory speed limit ...........17 Figure 5.6. 221st Street retroreflective post treatment impact on vehicle speeds ..........................19 Figure 5.7. 221st Street site location and percentage change exceeding advisory speed limit ......20 Figure 5.8. IA 141 retroreflective post treatment impact on vehicle speeds .................................22 Figure 5.9. IA 141 site location and percentage change exceeding advisory speed limit .............23 Figure 5.10. DMC 99 on-pavement curve marking impact on vehicle speeds ..............................25
Figure 5.11. DMC 99 site location and percentage change exceeding advisory speed limit ........26 Figure 5.13. CR L20/Loess Hills Trail on-pavement curve marking impact on vehicle speeds ...28 Figure 5.14. CR L20/Loess Hills Trail site location and percentage change exceeding
advisory speed limit ...........................................................................................................29
LIST OF TABLES
Table 4.1. Description of test sites .................................................................................................10
vii
ACKNOWLEDGMENTS
The team would like to thank the Iowa Department of Transportation (DOT) Office of Traffic and Safety, the Iowa Highway Research Board (IHRB), and the Midwest Transportation Consortium (MTC) for sponsoring this research. The authors would also like to thank the following agencies for their assistance and for participating in the study:
Iowa DOT District 3 Iowa DOT District 6 Des Moines County Harrison County Mills County Scott County

1
1. EXECUTIVE SUMMARY
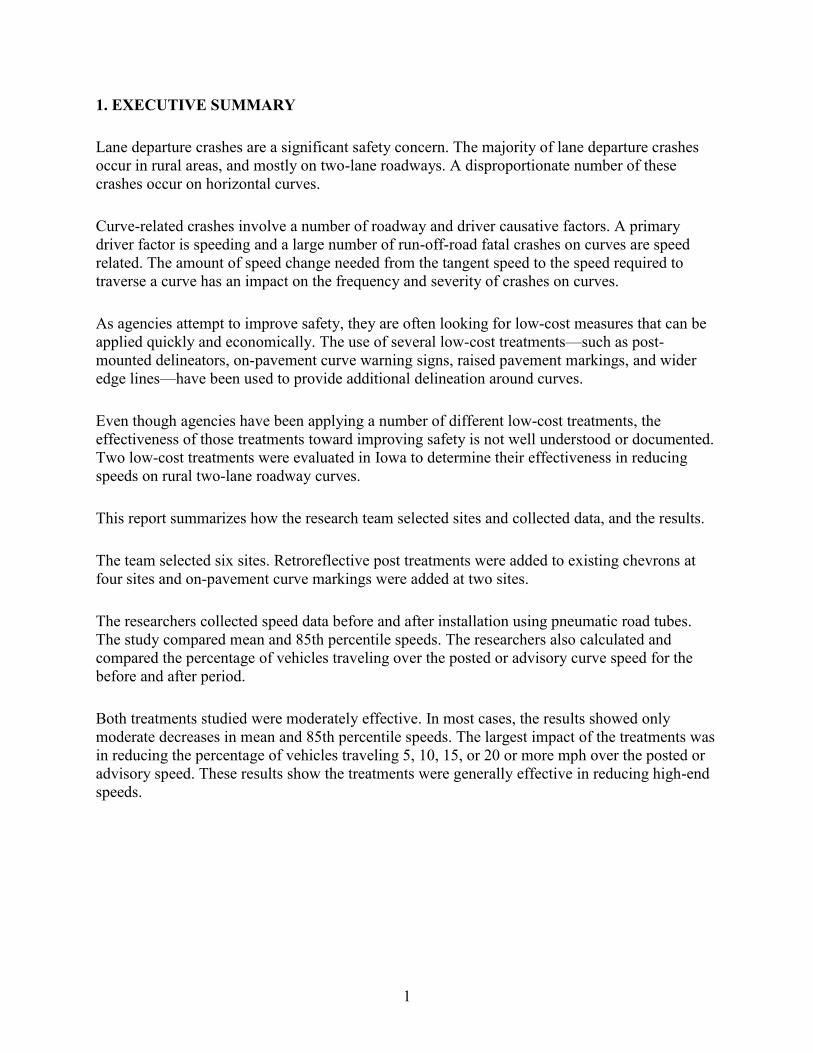
Lane departure crashes are a significant safety concern. The majority of lane departure crashes occur in rural areas, and mostly on two-lane roadways. A disproportionate number of these crashes occur on horizontal curves.
Curve-related crashes involve a number of roadway and driver causative factors. A primary driver factor is speeding and a large number of run-off-road fatal crashes on curves are speed related. The amount of speed change needed from the tangent speed to the speed required to traverse a curve has an impact on the frequency and severity of crashes on curves.
As agencies attempt to improve safety, they are often looking for low-cost measures that can be applied quickly and economically. The use of several low-cost treatments—such as post-mounted delineators, on-pavement curve warning signs, raised pavement markings, and wider edge lines—have been used to provide additional delineation around curves.
Even though agencies have been applying a number of different low-cost treatments, the effectiveness of those treatments toward improving safety is not well understood or documented. Two low-cost treatments were evaluated in Iowa to determine their effectiveness in reducing speeds on rural two-lane roadway curves.
This report summarizes how the research team selected sites and collected data, and the results.
The team selected six sites. Retroreflective post treatments were added to existing chevrons at four sites and on-pavement curve markings were added at two sites.
The researchers collected speed data before and after installation using pneumatic road tubes. The study compared mean and 85th percentile speeds. The researchers also calculated and compared the percentage of vehicles traveling over the posted or advisory curve speed for the before and after period.
Both treatments studied were moderately effective. In most cases, the results showed only moderate decreases in mean and 85th percentile speeds. The largest impact of the treatments was in reducing the percentage of vehicles traveling 5, 10, 15, or 20 or more mph over the posted or advisory speed. These results show the treatments were generally effective in reducing high-end speeds.
2
2. INTRODUCTION
2.1 Background
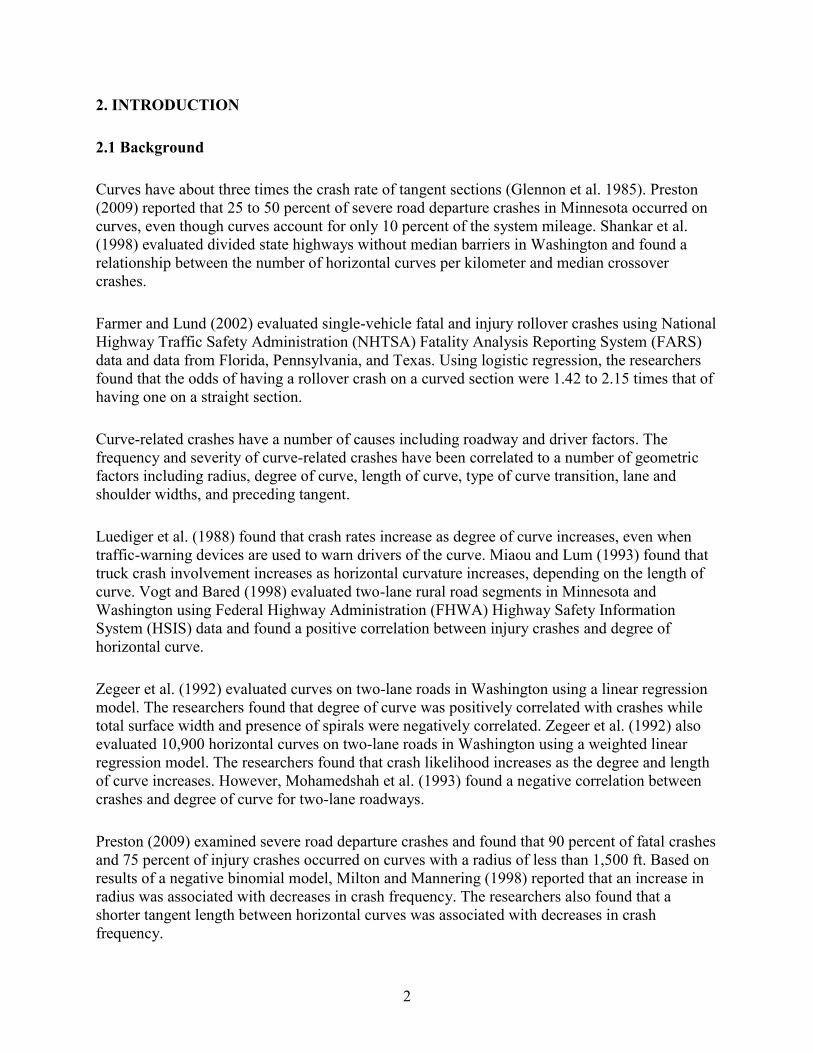
Curves have about three times the crash rate of tangent sections (Glennon et al. 1985). Preston (2009) reported that 25 to 50 percent of severe road departure crashes in Minnesota occurred on curves, even though curves account for only 10 percent of the system mileage. Shankar et al. (1998) evaluated divided state highways without median barriers in Washington and found a relationship between the number of horizontal curves per kilometer and median crossover crashes.
Farmer and Lund (2002) evaluated single-vehicle fatal and injury rollover crashes using National Highway Traffic Safety Administration (NHTSA) Fatality Analysis Reporting System (FARS) data and data from Florida, Pennsylvania, and Texas. Using logistic regression, the researchers found that the odds of having a rollover crash on a curved section were 1.42 to 2.15 times that of having one on a straight section.
Curve-related crashes have a number of causes including roadway and driver factors. The frequency and severity of curve-related crashes have been correlated to a number of geometric factors including radius, degree of curve, length of curve, type of curve transition, lane and shoulder widths, and preceding tangent.
Luediger et al. (1988) found that crash rates increase as degree of curve increases, even when traffic-warning devices are used to warn drivers of the curve. Miaou and Lum (1993) found that truck crash involvement increases as horizontal curvature increases, depending on the length of curve. Vogt and Bared (1998) evaluated two-lane rural road segments in Minnesota and Washington using Federal Highway Administration (FHWA) Highway Safety Information System (HSIS) data and found a positive correlation between injury crashes and degree of horizontal curve.
Zegeer et al. (1992) evaluated curves on two-lane roads in Washington using a linear regression model. The researchers found that degree of curve was positively correlated with crashes while total surface width and presence of spirals were negatively correlated. Zegeer et al. (1992) also evaluated 10,900 horizontal curves on two-lane roads in Washington using a weighted linear regression model. The researchers found that crash likelihood increases as the degree and length of curve increases. However, Mohamedshah et al. (1993) found a negative correlation between crashes and degree of curve for two-lane roadways.
Preston (2009) examined severe road departure crashes and found that 90 percent of fatal crashes and 75 percent of injury crashes occurred on curves with a radius of less than 1,500 ft. Based on results of a negative binomial model, Milton and Mannering (1998) reported that an increase in radius was associated with decreases in crash frequency. The researchers also found that a shorter tangent length between horizontal curves was associated with decreases in crash frequency.

3
Alternatively, Deng et al. (2006) evaluated head-on crashes on 729 segments of two-lane roads in Connecticut using an ordered probit model. The researchers included geometric characteristics in the analysis but did not find that the presence of horizontal or vertical curves was significant.
Taylor et al. (2002) evaluated the relationship between speed and crashes on rural single-carriageway roads in England (60 mph speed limit with a wide range of conditions). The researchers measured speed and flow at each site. The researchers found that crashes were more highly correlated with mean speed than any other speed metric. The researchers also found that crash frequency increased with mean speed. In general, a 10 percent increase in mean speed resulted in a 26 percent increase in the frequency of injury crashes. Results indicated that total crashes increased by 13 percent with each additional curve per kilometer. Single vehicle crashes increased by 34 percent per additional sharp curve per kilometer.
Although curve-related crashes are correlated to geometric factors, driver factors, such as speeding, also contribute to curve crash frequency and outcome. Driver factors include driver workload, driver expectancy, and speeding.
Speeding, defined by the FHWA as “exceeding the posted speed limit or driving too fast for conditions,” in general, is problematic. Council et al. (2005) evaluated FARS, NHTSA National Automotive Sampling System (NASS) General Estimates System (GES), and HSIS data to assess the impact of speeding on fatal crashes.
Using 2005 FARS data, the researchers found that 29.5 percent of fatal crashes were speed related. Speed related was defined as traveling over the posted speed limit or driving too fast for conditions.
The researchers conducted several different types of analyses and found that single-vehicle, run-off-road crashes are more likely to be speed related as compared to multi-vehicle crashes. Crashes on curves were more likely to be speed related than for tangent section, and nighttime crashes were more likely to be speed related. In addition, FARS data indicated that 54 percent of speed-related rollover/overturn, jackknife, or fixed object crashes were on curves (Council et al. 2005).
Turner and Tate (2009) collected data for 488 curves on sections of state highways in New Zealand in 2003and found that speed was a contributing factor in 35 percent of fatal and 28 percent of serious crashes on rural roads.
The FHWA estimates that approximately 56 percent of run-off-road fatal crashes on curves are speed related. The vehicle speed reduction from the tangent section required for traversing a curve has an impact on the frequency and severity of crashes on curves. Abrupt changes in operating speed resulting from changes in horizontal alignment are suggested to be a major cause of crashes on rural two-lane roadways (Luediger et al. 1988).
4
Anderson and Krammes (2000) developed a model comparing mean speed reduction and mean crash rate for 1,126 horizontal curves on rural two-lane roadways. The researchers report that the relationship between mean crash rate and required speed reduction to negotiate the curve is roughly linear. This finding is also supported by Fink and Krammes (1995), who indicate that curves requiring no speed reduction, did not have significantly different mean crash rates than their preceding roadway tangents.
Thompson and Perkins (1983) evaluated crash data for 3 years at 25 rural isolated curves. The researchers developed models using regression analysis and found that one of the strongest predictors was speed differential between posted and advisory speed.
Driver errors on horizontal curves are often due to the inappropriate selection of speed and the inability to maintain lane position. Driver speed selection at curves depends on both explicit attentional cues and implicit perceptual cues (Charlton 2007). Driver speed prior to entering a curve has a significant effect on ability to negotiate the curve successfully (Preston and Schoenecker 1999).
Inappropriate speed selection and lane positioning can be a result of a driver failing to notice an upcoming curve or misperceiving the roadway curvature. Driver workload plays important role in driver speed maintenance. Distracting tasks such as radio tuning or cell phone conversations can draw driver attention away from speed monitoring, detection of headway changes, lane keeping, and detection of potential hazards (Charlton 2007). Other factors include sight distance issues, fatigue, and complexity of the driving situation (Charlton and DePont 20007, Charlton 2007).
Preston and Shoenecker (1999) evaluated vehicle paths through a curve on a two-lane rural roadway as part of an evaluation of a dynamic curve message signs. The roadway had a posted speed limit of 55 mph and annual average daily traffic (AADT) of 3,250 vehicles per day (vpd). The researchers collected data over a four-day period and randomly selected and evaluated 589 vehicles.
A total of 340 of the vehicles (58 percent) were traveling over 55 mph and the remainder was traveling at or below the speed limit. The authors evaluated whether each vehicle successfully negotiated the curve. The authors defined vehicles that crossed a left or right lane line on one or more occasion as “not successfully navigating the curve.”
The authors developed a logistic regression model to determine the relationship between initial speed and the probability of a vehicle not successfully navigating the curve. The authors found there was a 20 percent better chance for vehicles that were traveling at or below the speed limit to navigate the curve successfully than for vehicles that were traveling over the speed limit, with the difference being statistically significant at 99 percent.
5
The authors found that 45 percent of vehicles traveling at or above 65 mph were unable to negotiate the curve compared to 30 percent for vehicles that were traveling under 65 mph, with the difference being statistically significant at the 90 percent confidence interval.
Turner and Tate (2009) evaluated driver behavior on six 20 km rural road sections with curves. Twelve male drivers, 17 to 24 years old, drove each section in a test vehicle with data logging equipment. The researchers found that the speed at which drivers chose to negotiate a curve was more closely related to the radius of curve than the design speed. In general, radius did not begin to affect negotiation speed until curve radius was less than 300 m. The researchers found that drivers did not lower their speeds from 100 km/hr until the curve radius fell below 200 m to 300 m.
Hassan and Easa (2003) found that driver misperception of curvature was greatest when vertical curvature was combined with horizontal curvature. This was particularly a problem when a crest vertical curve is superimposed on a severe horizontal curve or when a sag vertical curve is combined with a horizontal curve, causing the horizontal curve to appear less severe and resulting in drivers underestimating the curve.
2.2 Project Objectives
As agencies attempt to improve safety, they are often looking for low-cost measures that can be applied quickly and economically. Several low-cost treatments, including the use of post-mounted delineators, on-pavement curve warning signs, raised pavement markings, wider edge lines, and so forth, have been used to provide additional delineation around curves.
Even though agencies have been applying a number of different low-cost treatments, the effectiveness of those treatments in improving safety is not well understood or documented.
To address this deficiency, the Center for Transportation Research and Education (CTRE) at Iowa State University conducted this study to evaluate low-cost strategies to reduce speeds and crashes on curves.
The team reviewed low-cost treatments that have been used to improve safety on curves. The team then selected two low-cost treatments that show promise but have not been well studied. The two treatments are on-pavement curve advisory markings and retroreflective material on the posts of existing chevrons to provide additional curve delineation.
6
3. DESCRIPTION OF TREATMENTS
This chapter describes the two treatments that were selected for this study:
On-pavement curve signing Retroreflective post treatment
Both treatments have been applied in other areas and showed some promise, but are still considered experimental.
3.1 On-Pavement Curve Markings
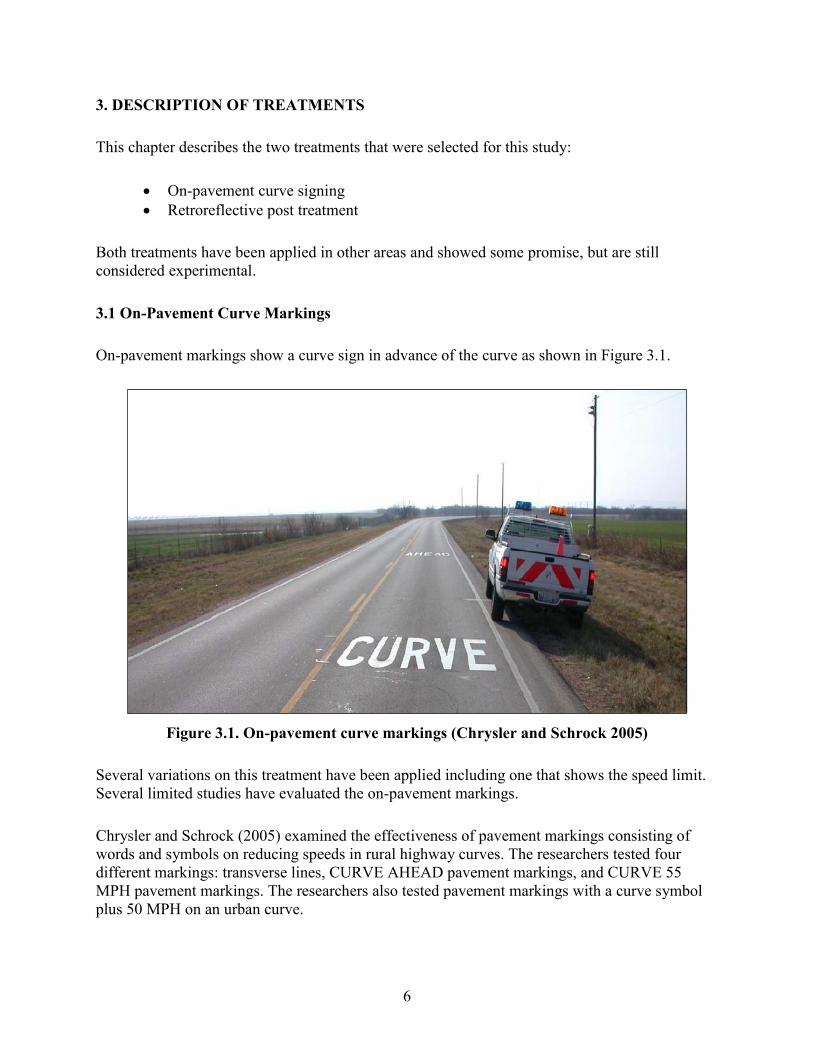
On-pavement markings show a curve sign in advance of the curve as shown in Figure 3.1.
Figure 3.1. On-pavement curve markings (Chrysler and Schrock 2005)
Several variations on this treatment have been applied including one that shows the speed limit. Several limited studies have evaluated the on-pavement markings.
Chrysler and Schrock (2005) examined the effectiveness of pavement markings consisting of words and symbols on reducing speeds in rural highway curves. The researchers tested four different markings: transverse lines, CURVE AHEAD pavement markings, and CURVE 55 MPH pavement markings. The researchers also tested pavement markings with a curve symbol plus 50 MPH on an urban curve.

7
Each of the markings was applied to the roadway with the majority applied 400 ft after the standard curve warning sign with text that was approximately 8 ft tall. The researchers measured change in speed from an upstream control point to the treatment.
No speed changes occurred with the CURVE AHEAD signing. Speeds were reduced by 4 mph for the CURVE 55 MPH markings, although an analysis of variance indicated that the difference was not statistically significant. A reduction of 7 mph was reported for the curve symbol plus 50 MPH markings at the urban location (on a divided four-lane highway).
Retting and Farmer (1998) studied the use of pavement markings in the tangent section leading up to a curve and their effects on speed. The researchers conducted this study on a suburban two-lane secondary road in Northern Virginia. The study site had a sharp left curve with a 15 mph advisory speed.
The researchers collected before and after data on both a test site and a control site. The researchers used 8 ft tall white letters spelling SLOW at the test site, along with two white lines perpendicular to the flow of traffic and a left curving arrow.
Results showed a daytime decrease in mean speed of 1.1 mph and a 5.6 percent decrease in the drivers exceeding the advisory speed by 5 or more mph. At night, a decrease in mean speed of 1.6 mph was observed and 6.1 percent decrease in vehicles traveling 5 mph over the advisory speed. Late night mean speed dropped 3.4 mph and drivers exceeding 40 mph dropped 16.9 percent.
3.2 Retroreflective Post Treatments
With this treatment, additional retroreflective material is added to existing chevron posts. Delineation is used to reinforce the presence of a curve to drivers and can be effective for several reasons. First, it draws attention to the curve so that drivers who did not receive other cues are able to detect the curve. Second, it can help drivers determine where lane boundaries are at night or periods of limited visibility, such as rain or snow events. Delineation can also help drivers gauge the sharpness of a curve so they can adjust their speed and lane position accordingly.
The addition of retroreflective sheeting material to existing chevron posts is one low-cost treatment that has been used to provide additional delineation. The treatment provides vertical delineation and is likely to be most effective at night when it is more visible to drivers.
Two studies discuss the effectiveness of adding retroreflective material to chevron posts.
Chrysler et al. (2009) assessed four types of vertical delineation in a closed-course nighttime driving test: regular post-mounted delineators (PMDs), which have a band of retroreflective material around the top, PMDs with retroreflective material fully covering the post, standard chevrons, and chevrons with full retroreflective posts.
8
The researchers asked 20 drivers to indicate when they could judge the sharpness of the curve. The drivers were able to assess the sharpness of the curve approximately 250 ft sooner for full PMD and approximately 240 ft sooner using the chevrons with retroreflective posts, compared to the baseline condition, which had only edge line markings.
Drivers were also shown photos of each treatment and asked to rank treatments by quality of delineation in defining sharpness of curve. The chevrons with retroreflective posts were ranked the highest with fully retroreflective PMD ranked second.
Drivers also watched video on a laptop to judge when they could perceive the sharpness of the curve. Average time to determine sharpness was shortest for the chevrons with retroreflective posts or fully retroreflective PMDs in all situations tested.
In a related study at the Texas Transportation Institute (TTI), Re et al. (2010) evaluated the field application of chevrons and chevrons with a full-post retroreflective treatment at two curves in Texas. Both sites had paved shoulders and a posted speed limit of 70 mph day and 65 mph at night. One site had an advisory speed of 45 mph while the second site had an advisory speed of 50 mph.
Each treatment was applied to each site and the researchers collected speed and lateral position data before and after application of the treatment using piezoelectric traffic classifiers. Average speeds were 1.4 mph lower with the chevrons in place and 2.2 mph lower with the full-post chevron treatment.
The 85th percentile speeds decreased by 1.3 mph for the scenario with just chevrons and 2.2 mph for the full-post chevrons. In most cases, the full-post chevrons reduced the percentage of vehicles exceeding 60, 65, and 70 mph. Centerline encroachments decreased by 88 to 93 percent for the chevron treatments.
9
4. DESCRIPTION OF SITES AND DATA COLLECTION
4.1 Site Selection
The team compiled a list of high-crash horizontal curves on rural two-lane paved roadways in Iowa. The team defined a high crash location as a curve having five or more crashes within a five-year period (2002 through 2006). The researchers identified these sites as potential locations for additional treatments.
The researchers displayed the potential sites on a geographic information system (GIS) map with aerial imagery. The team then identified sites where the curve was within a major intersection, railroad crossing, or other major access point and removed those sites from the list of potential sites.
The team made field visits to the remaining sites, where they noted information such as posted and advisory speed and other site characteristics. During the site visits, the team conducted an initial speed study using a radar gun to ensure that a speed problem existed. The researchers defined a speeding problem as a mean or 85th percentile speed that was 5 or more mph over the advisory curve speed, if present, or the posted limit, if no advisory speed was present.
After sites visits, the team reviewed each potential location and narrowed the list to those that met the following criteria:
Posted speed limit on tangent section of 50 mph or higher Demonstrated speeding problem (as defined above) No unusual features that would make certain types of treatment or speed data
collection difficult
The team consulted the roadway authority to verify that no major maintenance or safety improvements had occurred over the last three years and whether the authority had any major maintenance or safety improvements scheduled within the next three years. The team removed sites where major treatments had occurred or were anticipated from further consideration.
Of the remaining sites, the team selected four sites for the installation of the retroreflective treatments and two sites for the on-pavement curve signs.
4.2 Description of Test Sites
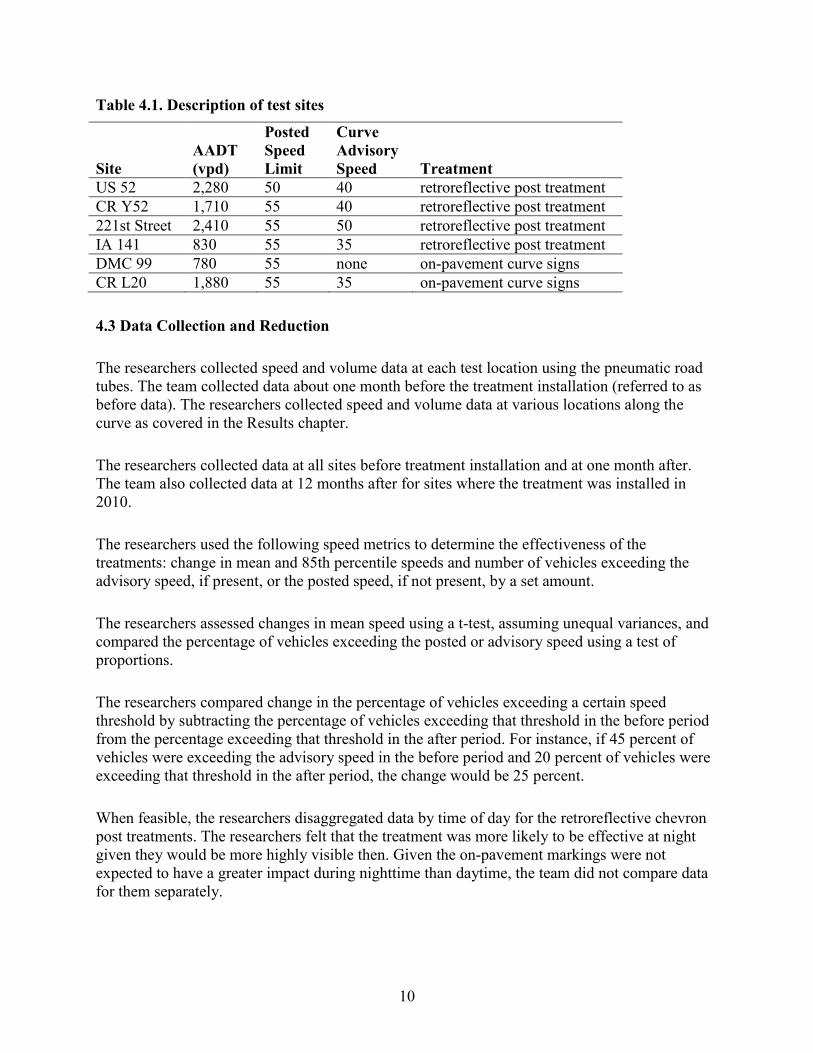
The information in Table 4.1 describes the six sites. All sites were on rural two-lane roadways. Retroreflective treatments were added to the existing chevron posts at the US 52, County Road (CR) Y52, 221st Street, and IA 141 sites. On-pavement curve signs were applied at the DMC 99 and CR L20/Loess Hills Trail sites.
10
Table 4.1. Description of test sites
Site AADT (vpd)
Posted Speed Limit
Curve Advisory Speed Treatment
US 52 2,280 50 40 retroreflective post treatment CR Y52 1,710 55 40 retroreflective post treatment 221st Street 2,410 55 50 retroreflective post treatment IA 141 830 55 35 retroreflective post treatment DMC 99 780 55 none on-pavement curve signs CR L20 1,880 55 35 on-pavement curve signs
4.3 Data Collection and Reduction
The researchers collected speed and volume data at each test location using the pneumatic road tubes. The team collected data about one month before the treatment installation (referred to as before data). The researchers collected speed and volume data at various locations along the curve as covered in the Results chapter.
The researchers collected data at all sites before treatment installation and at one month after. The team also collected data at 12 months after for sites where the treatment was installed in 2010.
The researchers used the following speed metrics to determine the effectiveness of the treatments: change in mean and 85th percentile speeds and number of vehicles exceeding the advisory speed, if present, or the posted speed, if not present, by a set amount.
The researchers assessed changes in mean speed using a t-test, assuming unequal variances, and compared the percentage of vehicles exceeding the posted or advisory speed using a test of proportions.
The researchers compared change in the percentage of vehicles exceeding a certain speed threshold by subtracting the percentage of vehicles exceeding that threshold in the before period from the percentage exceeding that threshold in the after period. For instance, if 45 percent of vehicles were exceeding the advisory speed in the before period and 20 percent of vehicles were exceeding that threshold in the after period, the change would be 25 percent.
When feasible, the researchers disaggregated data by time of day for the retroreflective chevron post treatments. The researchers felt that the treatment was more likely to be effective at night given they would be more highly visible then. Given the on-pavement markings were not expected to have a greater impact during nighttime than daytime, the team did not compare data for them separately.
11
5. RESULTS
The following sections present the study results by site. Each section begins with a brief description of the site.
5.1 US 52 Retroreflective Post Treatments
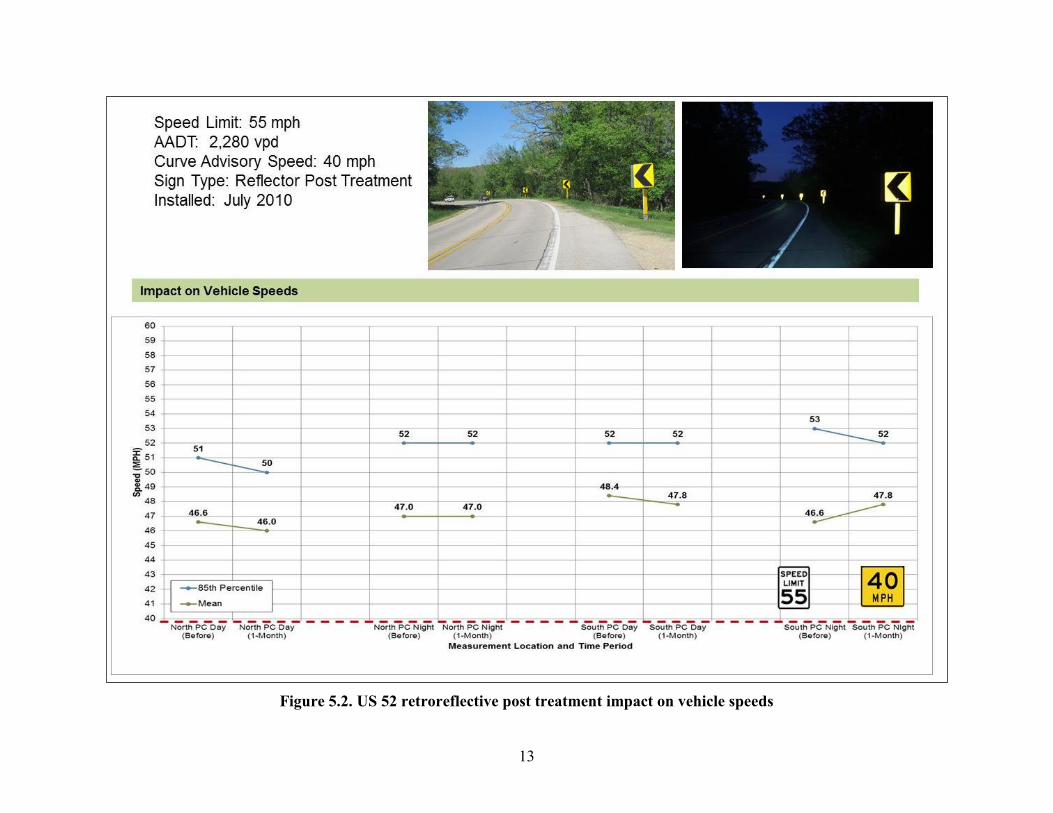
The existing chevrons are located on the south side of the road on US 52. The aerial image for the site suggested that the curve forms an S curve with a different curve to the north. In reality, the two curves are separated by a tangent section, which is about 300 ft long. As a result, the southern curve was treated separately.
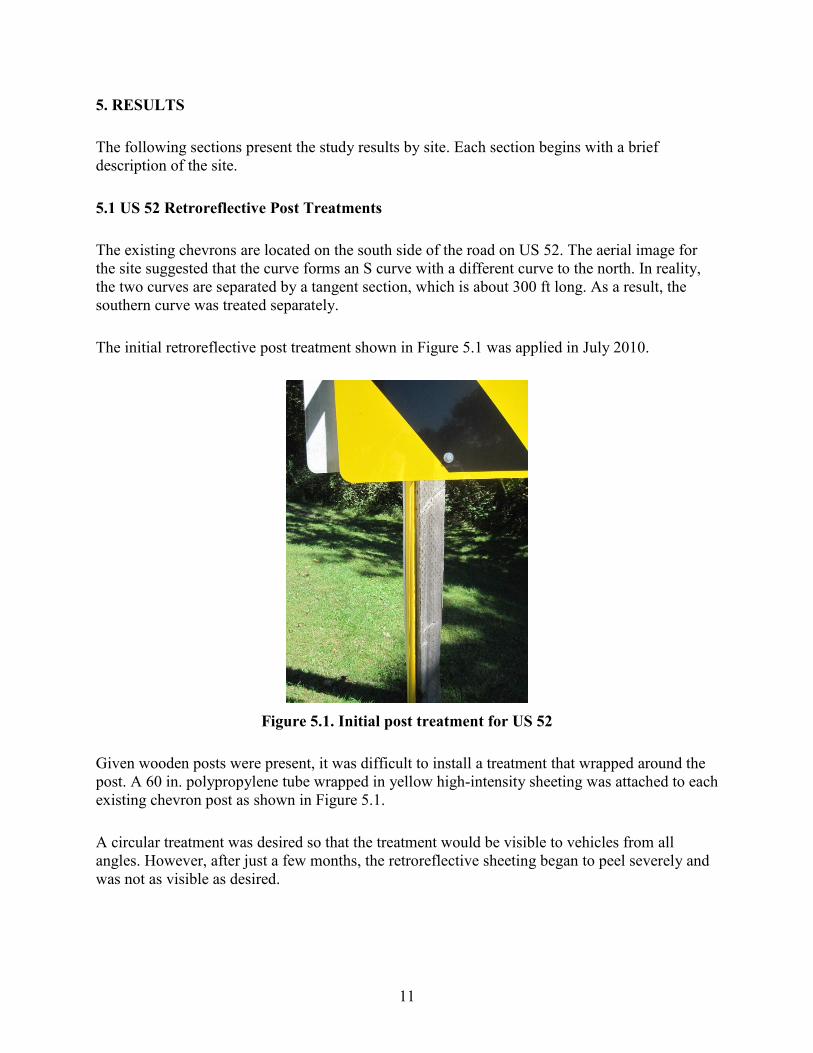
The initial retroreflective post treatment shown in Figure 5.1 was applied in July 2010.
Figure 5.1. Initial post treatment for US 52
Given wooden posts were present, it was difficult to install a treatment that wrapped around the post. A 60 in. polypropylene tube wrapped in yellow high-intensity sheeting was attached to each existing chevron post as shown in Figure 5.1.
A circular treatment was desired so that the treatment would be visible to vehicles from all angles. However, after just a few months, the retroreflective sheeting began to peel severely and was not as visible as desired.
12
The team removed the treatment completely for several months and then collected before data again. Then, the treatment was replaced in May 2011 with retroreflective strips affixed to the front and back of the wooden chevron posts as shown in Figure 5.2.
The team collected data at the north and south point of curvature (PC). The team had collected data at the center of the curve, but experienced issues with the counter, and, due to the significant distance to the site, didn’t find it feasible to recollect data.
The researchers reduced the data for the nighttime and daytime periods. Figures 5.2 and 5.3 show the results for the second installation of the retroreflective treatments. The figures present the results for vehicles traveling in the southbound (SB) direction for the north PC and in the northbound (NB) direction for the south PC. These two directions are for drivers traveling into the curve.
As shown in Figure 5.2, mean and 85th percentile speeds decreased by 1 mph for the north PC during the daytime. Speeds did not decrease for the north PC during the nighttime. Average speeds decreased by 0.6 mph for the south PC during the daytime while 85th percentile speeds remained constant. Mean speeds increased slightly for the south PC during the nighttime while the 85th percentile speed decreased by 1 mph.
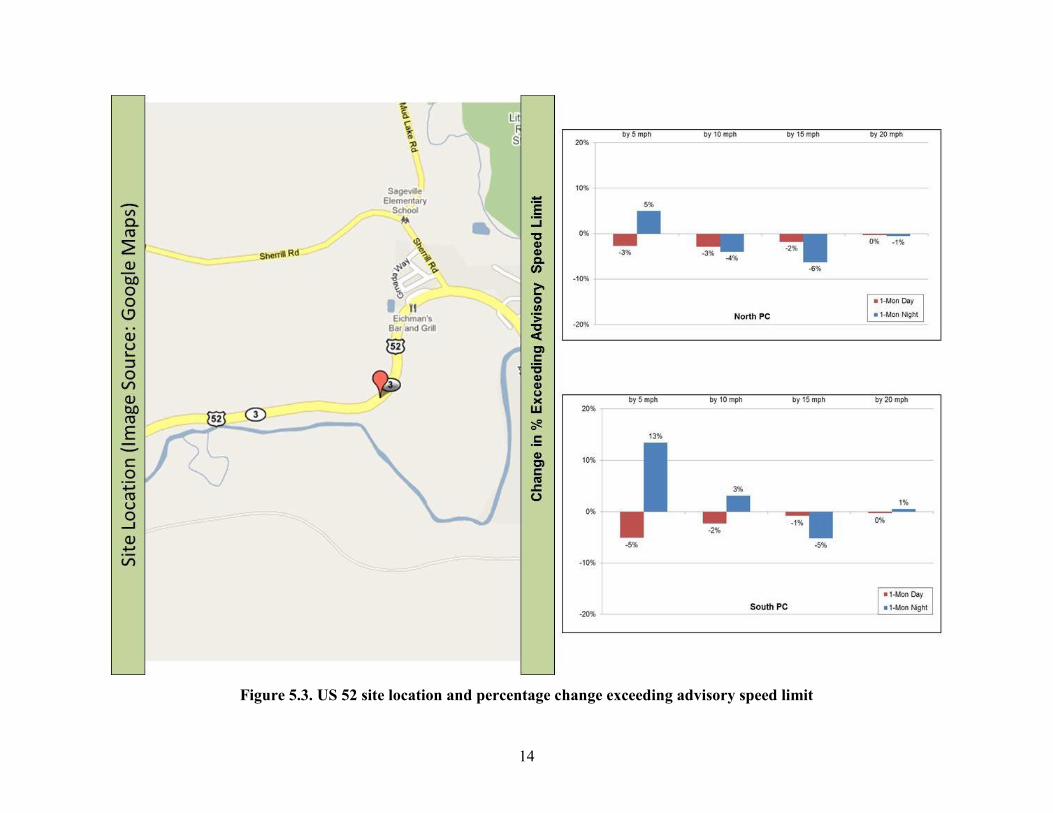
Figure 5.3 shows the changes in the percentage of vehicles exceeding the 40 mph advisory speed. The percentage of vehicles exceeding the advisory speed by 5 mph increased by 13 percent for the north PC and by 5 percent for the south PC for the nighttime period. The percentage of vehicles exceeding the advisory speed by 10 or more mph at nighttime also increased by 3 percent at the south PC.
Otherwise, the researchers noted decreases at night for vehicles traveling 15 or 20 mph over (up to 6 percent). Decreases occurred for the daytime period for both the north and south PC for all thresholds. The researchers noted decreases up to 6 percent.
13
Figure 5.2. US 52 retroreflective post treatment impact on vehicle speeds
14
Figure 5.3. US 52 site location and percentage change exceeding advisory speed limit
15
5.2 County Road Y52 Retroreflective Post Treatments
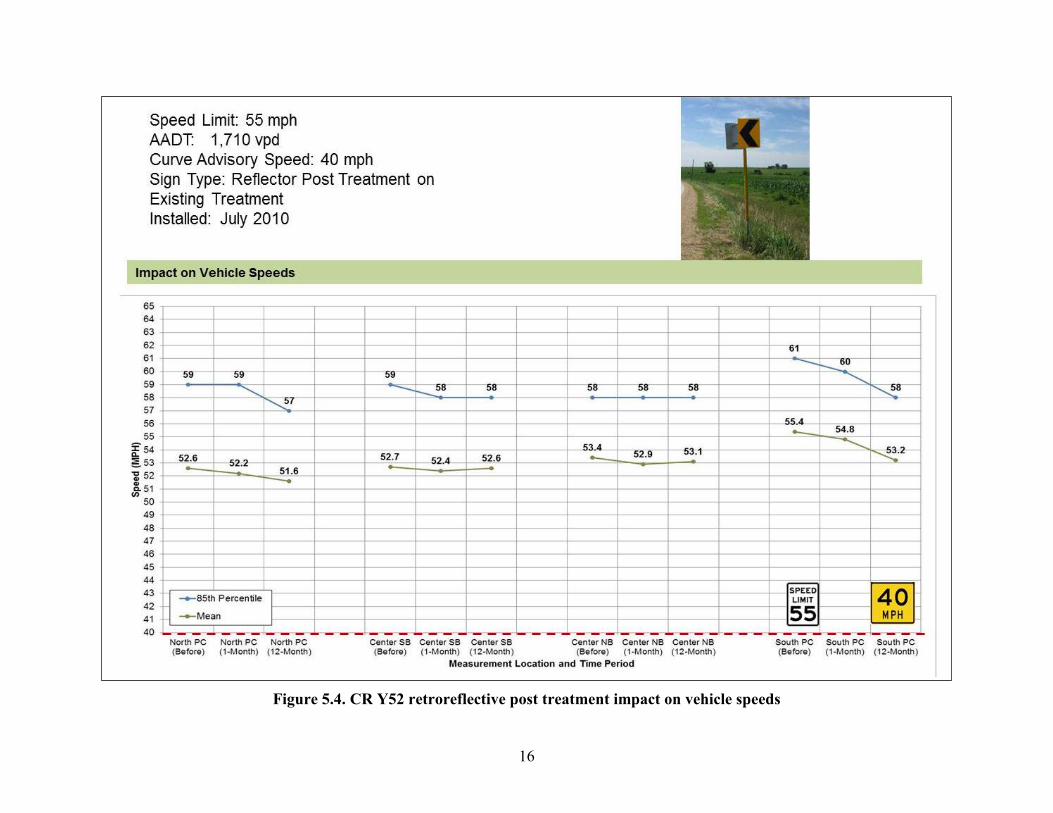
Retroreflective post treatments were applied to existing chevron posts on CR Y52 in July 2010. Figure 5.4 includes a schematic of the CR Y52 treatment site.
A 60 in. poly-propylene tube coated with yellow high-intensity sheeting was wrapped around the existing Telspar chevron post as shown in Figure 5.4. Unlike the US 52 application, no problems occurred with the treatment.
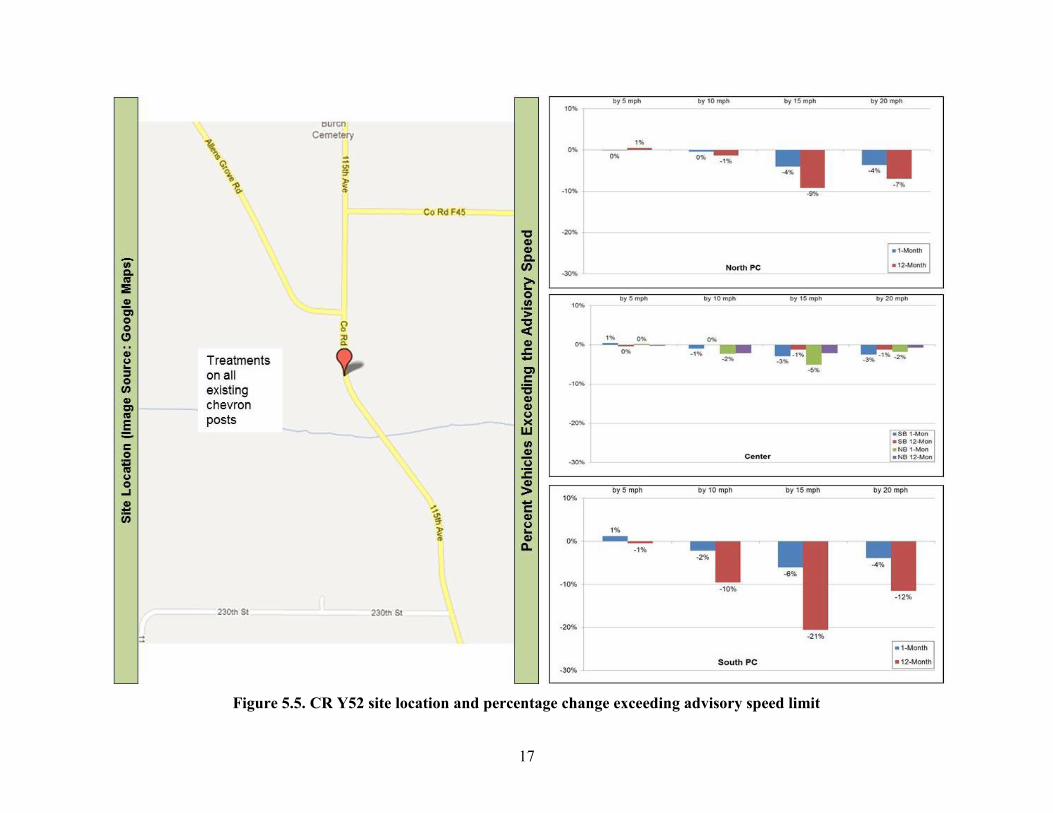
The researchers collected data at CR Y52 at the north PC, center of curve, and south PC. Figures show results for vehicles traveling SB for the north PC and NB for the south PC. The figures show data for both directions of travel at the center of curve, given the retroreflective treatment was visible for drivers in both directions. Results were similar for both day and nighttime, so the researchers combined the results and show them for both directions.
Figure 5.4 shows changes in mean and 85th percentile speeds for CR Y52. Mean speeds decreased at all locations. The researchers noted decreases up to 2.2 mph. The 85th percentile speeds stayed consistent for the 1 month after period at the north PC and for the 1 and 12 month after periods. Speeds decreased at all other locations by up to 3 mph.
Figure 5.5 shows changes in the percentage of vehicles exceeding the advisory speed of 40 mph. At the north PC, the results showed little change for either the 1 or 12 month after periods for vehicles traveling 5 or more mph or 10 mph over the advisory speed, while decreases up to 9 percent occurred for vehicles traveling 15 or 20 mph over.
At the center of the curve, little change occurred for 5 or more mph over the advisory speed. The researchers found moderate decreases for all time periods for both directions of travel for the center of curve.
At the south PC, little change occurred for vehicles traveling 5 or mph over the advisory speed. The results showed moderate decreases for vehicles traveling 10, 15, and 20 or more mph over the advisory speed for the 1 month after period, while significant decreases occurred for the 12 month after period (up to 21 percent).
16
Figure 5.4. CR Y52 retroreflective post treatment impact on vehicle speeds
17
Figure 5.5. CR Y52 site location and percentage change exceeding advisory speed limit
18
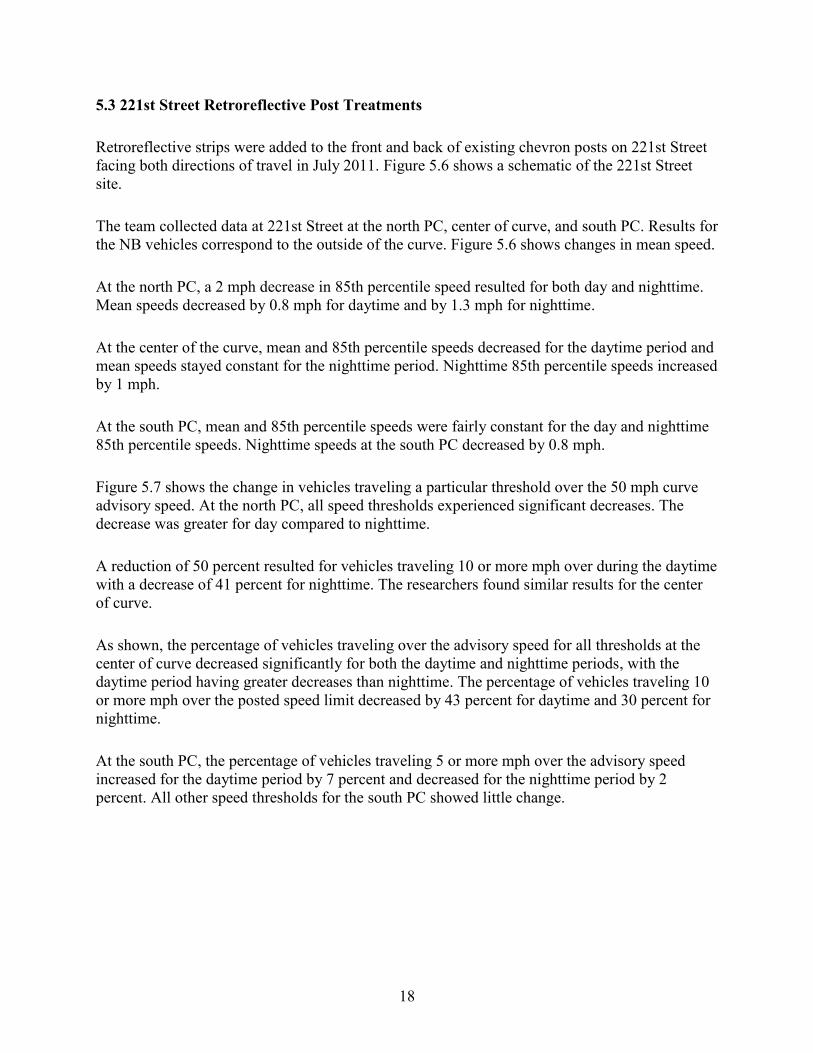
5.3 221st Street Retroreflective Post Treatments
Retroreflective strips were added to the front and back of existing chevron posts on 221st Street facing both directions of travel in July 2011. Figure 5.6 shows a schematic of the 221st Street site.
The team collected data at 221st Street at the north PC, center of curve, and south PC. Results for the NB vehicles correspond to the outside of the curve. Figure 5.6 shows changes in mean speed.
At the north PC, a 2 mph decrease in 85th percentile speed resulted for both day and nighttime. Mean speeds decreased by 0.8 mph for daytime and by 1.3 mph for nighttime.
At the center of the curve, mean and 85th percentile speeds decreased for the daytime period and mean speeds stayed constant for the nighttime period. Nighttime 85th percentile speeds increased by 1 mph.
At the south PC, mean and 85th percentile speeds were fairly constant for the day and nighttime 85th percentile speeds. Nighttime speeds at the south PC decreased by 0.8 mph.
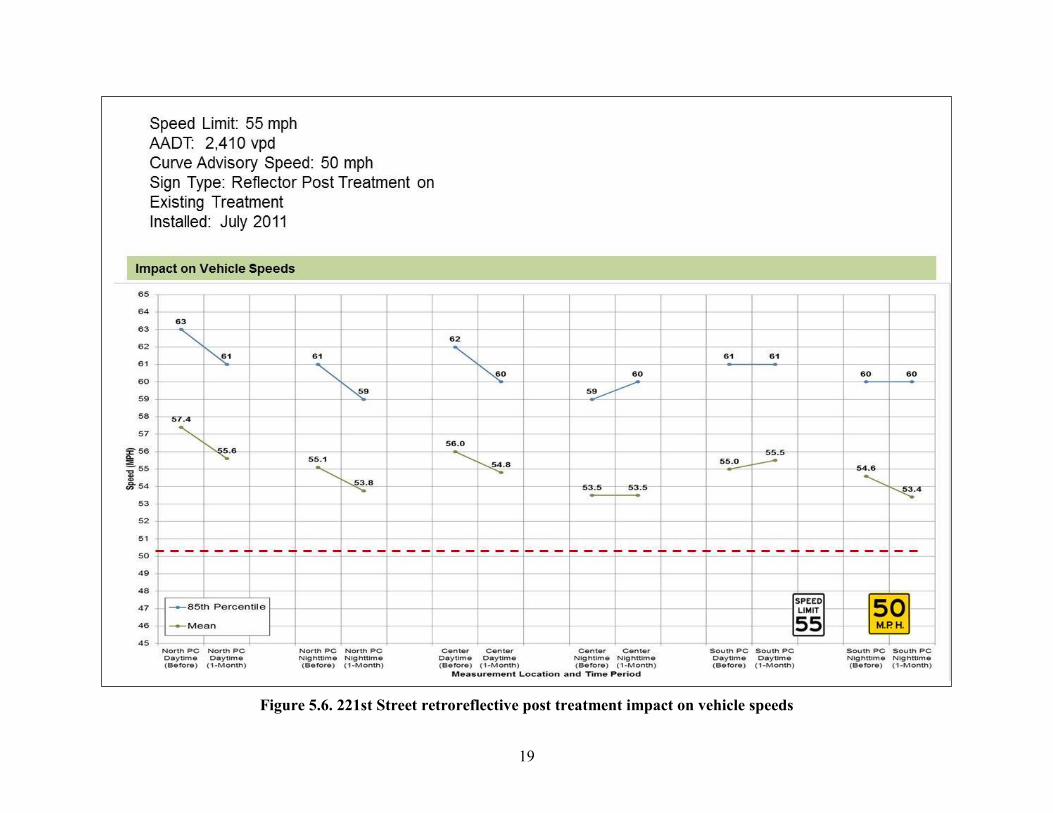
Figure 5.7 shows the change in vehicles traveling a particular threshold over the 50 mph curve advisory speed. At the north PC, all speed thresholds experienced significant decreases. The decrease was greater for day compared to nighttime.
A reduction of 50 percent resulted for vehicles traveling 10 or more mph over during the daytime with a decrease of 41 percent for nighttime. The researchers found similar results for the center of curve.
As shown, the percentage of vehicles traveling over the advisory speed for all thresholds at the center of curve decreased significantly for both the daytime and nighttime periods, with the daytime period having greater decreases than nighttime. The percentage of vehicles traveling 10 or more mph over the posted speed limit decreased by 43 percent for daytime and 30 percent for nighttime.
At the south PC, the percentage of vehicles traveling 5 or more mph over the advisory speed increased for the daytime period by 7 percent and decreased for the nighttime period by 2 percent. All other speed thresholds for the south PC showed little change.
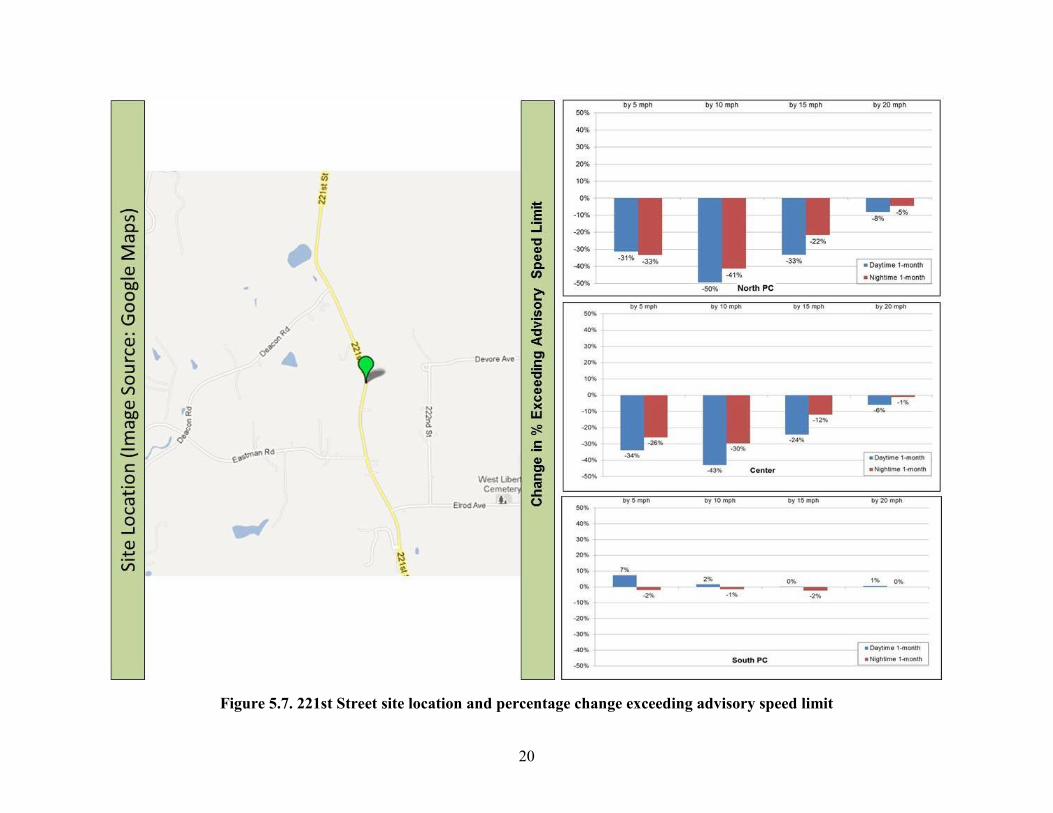
19
Figure 5.6. 221st Street retroreflective post treatment impact on vehicle speeds
20
Figure 5.7. 221st Street site location and percentage change exceeding advisory speed limit
21
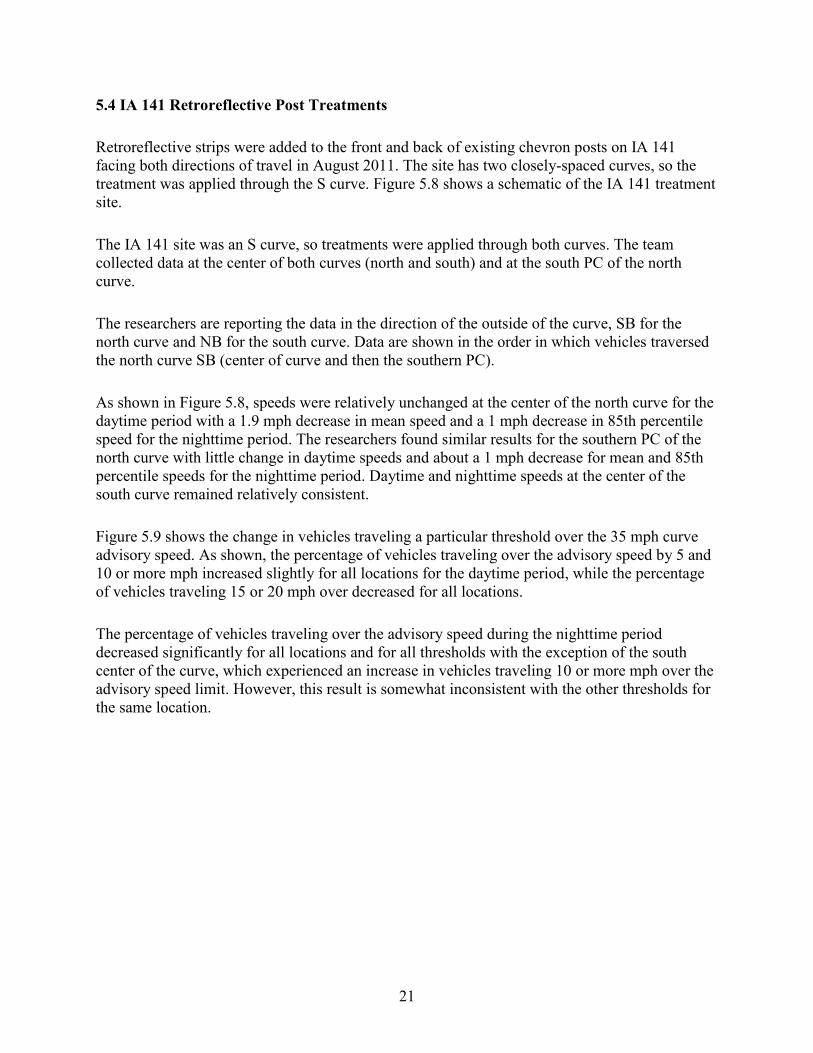
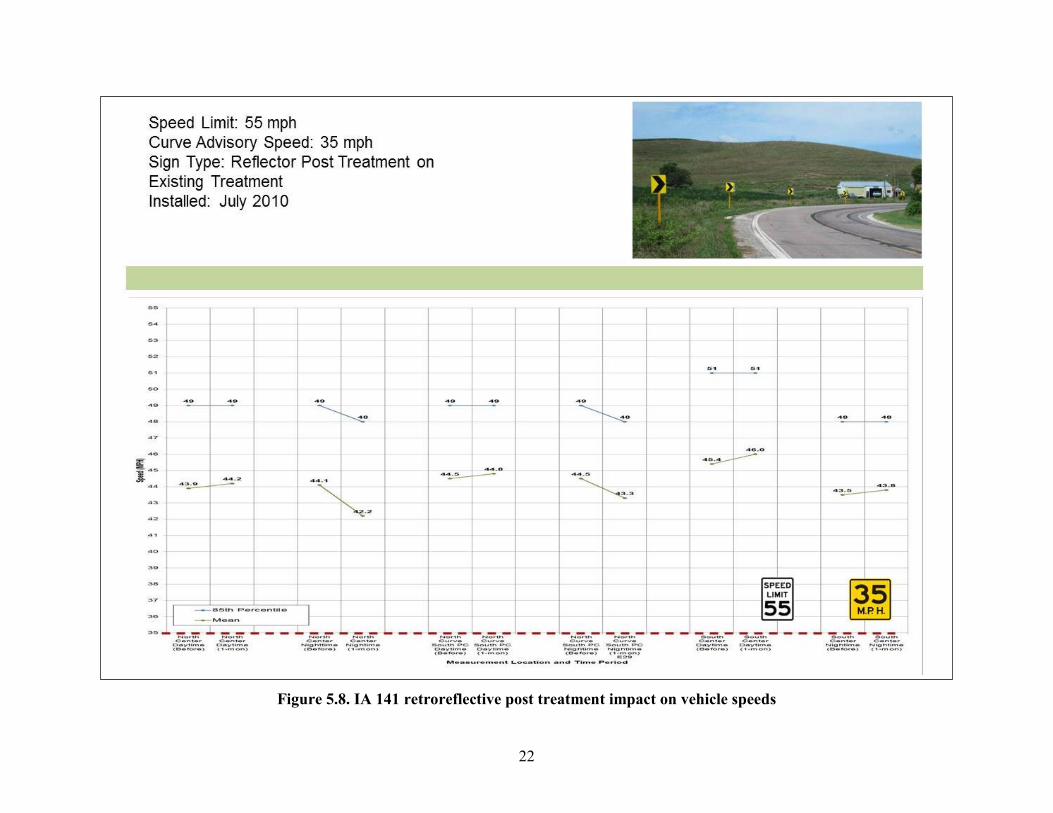
5.4 IA 141 Retroreflective Post Treatments
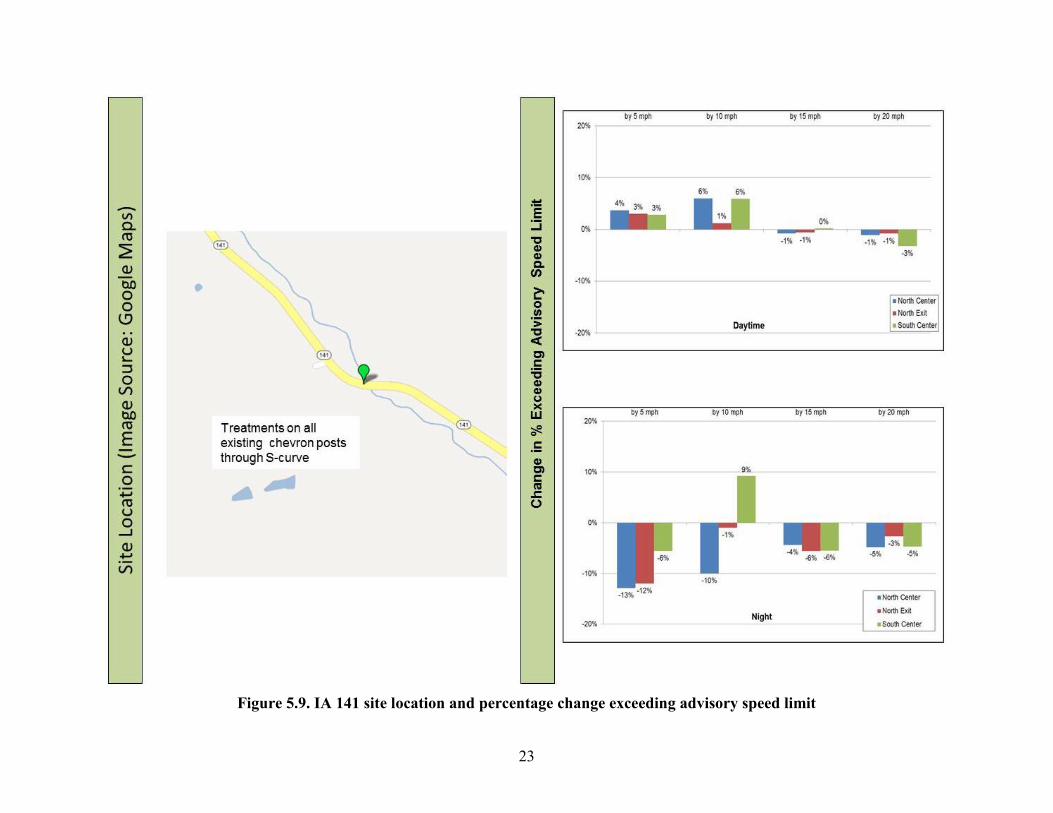
Retroreflective strips were added to the front and back of existing chevron posts on IA 141 facing both directions of travel in August 2011. The site has two closely-spaced curves, so the treatment was applied through the S curve. Figure 5.8 shows a schematic of the IA 141 treatment site.
The IA 141 site was an S curve, so treatments were applied through both curves. The team collected data at the center of both curves (north and south) and at the south PC of the north curve.
The researchers are reporting the data in the direction of the outside of the curve, SB for the north curve and NB for the south curve. Data are shown in the order in which vehicles traversed the north curve SB (center of curve and then the southern PC).
As shown in Figure 5.8, speeds were relatively unchanged at the center of the north curve for the daytime period with a 1.9 mph decrease in mean speed and a 1 mph decrease in 85th percentile speed for the nighttime period. The researchers found similar results for the southern PC of the north curve with little change in daytime speeds and about a 1 mph decrease for mean and 85th percentile speeds for the nighttime period. Daytime and nighttime speeds at the center of the south curve remained relatively consistent.
Figure 5.9 shows the change in vehicles traveling a particular threshold over the 35 mph curve advisory speed. As shown, the percentage of vehicles traveling over the advisory speed by 5 and 10 or more mph increased slightly for all locations for the daytime period, while the percentage of vehicles traveling 15 or 20 mph over decreased for all locations.
The percentage of vehicles traveling over the advisory speed during the nighttime period decreased significantly for all locations and for all thresholds with the exception of the south center of the curve, which experienced an increase in vehicles traveling 10 or more mph over the advisory speed limit. However, this result is somewhat inconsistent with the other thresholds for the same location.
22
Figure 5.8. IA 141 retroreflective post treatment impact on vehicle speeds
23
Figure 5.9. IA 141 site location and percentage change exceeding advisory speed limit

24
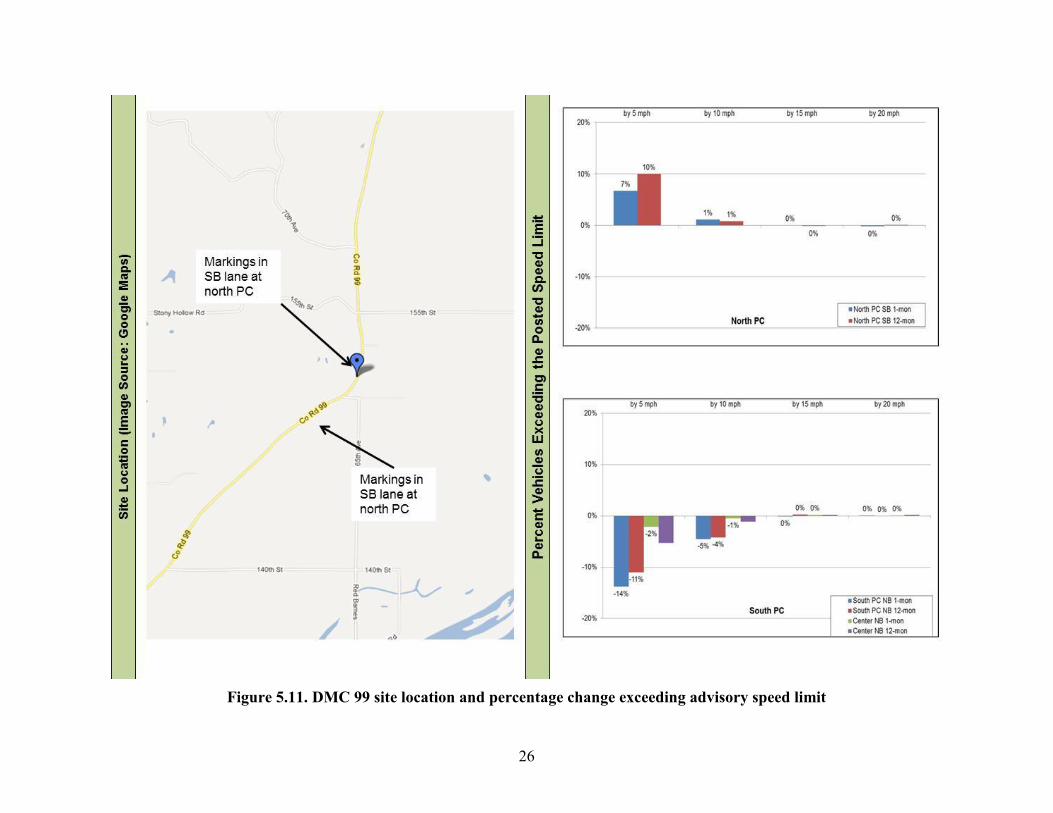
5.5 DMC 99 On-Pavement Curve Markings
Figure 5.10 provides a schematic of the DMC 99 treatment site. The treatment is a thermoplastic product that was placed at the site in July 2010 as shown in Figure 5.10.
On-pavement curve advisory signs were installed at the north PC for SB vehicles and at the south PC for NB vehicles. The team collected data at the north PC, center of the curve, and south PC. Given the treatment was installed in 2010, data were available for 1 and 12 month after periods.
Unlike the retroreflective post treatment, the on-pavement markings were not expected to be more visible at night and therefore a different impact at night was not expected. As a result, data are presented are for both day and nighttime together.
The researchers show data for the north PC and center of curve for vehicles traveling SB and at the south PC and center of curve for NB vehicles. Data are presented in the vehicle travel direction (i.e., figures show north PC SB, then center of curve SB, and south PC NB, then center of curve NB).
Figure 5.10 shows mean and 85th percentile speeds. For SB vehicles, mean speeds decreased slightly for both time periods at both locations while 85th percentile speeds increased by up to 2 mph. For NB vehicles, mean speeds decreased by up to 1.7 mph while 85th percentile speeds remained constant at the center of the curve and decreased by 1 mph at the south PC.
Figure 5.11 presents results for the percentage of vehicles exceeding a particular threshold. The percentage of vehicles traveling 5 or 10 or more mph over the posted speed limit for the north PC increased (by up to 10 percent for vehicles traveling 5 or more mph over and 1 percent for vehicles traveling 10 or more mph over). Results for 15 and 20 mph over showed little change for either the 1 month or 12 month after period.
Figure 5.11 also shows results for the south PC. Significant decreases resulted in the percentage of vehicles traveling 5 or more mph over the posted speed with decreases up to 14 percent. Moderate decreases resulted for 10 or more mph over and little change resulted for vehicles traveling 15 or 20 mph over.
.

25
Figure 5.10. DMC 99 on-pavement curve marking impact on vehicle speeds
26
Figure 5.11. DMC 99 site location and percentage change exceeding advisory speed limit

27
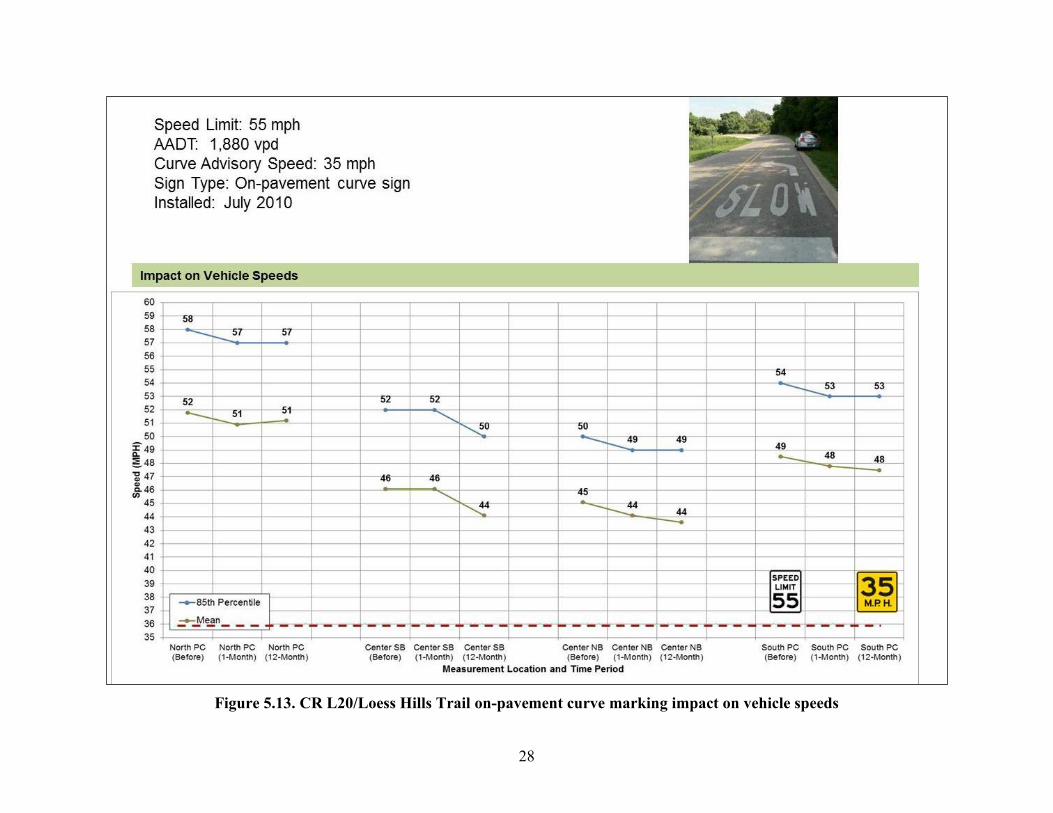
5.6 County Road L20/Loess Hills Trail On-Pavement Curve Markings
Figure 5.12 shows a schematic of the CR L20/Loess Hills Trail treatment. The treatment is a thermoplastic product that was placed at the site in August 2010.
On-pavement curve markings were installed at the north and south PC in the direction of travel. The researchers collected data at the north PC, center of the curve, and south PC. Given the treatment was installed in 2010, data were available for 1 and 12 months after installation.
Unlike the retroreflective treatment, the on-pavement signs were not expected to be more visible at night. As a result, data are presented for both day and nighttime together. Given the treatment is visible to drivers as they enter the PC, the researchers present these data for the north PC and center of curve for vehicles traveling SB that have crossed the north treatment for the south PC and center of curve for NB vehicles that have crossed the south treatment.
As shown in Figure 5.12, both mean and average speeds decreased at all locations. Speeds decreased in most cases by about 1 mph with a 2 mph decrease for the center of the curve for SB vehicles.
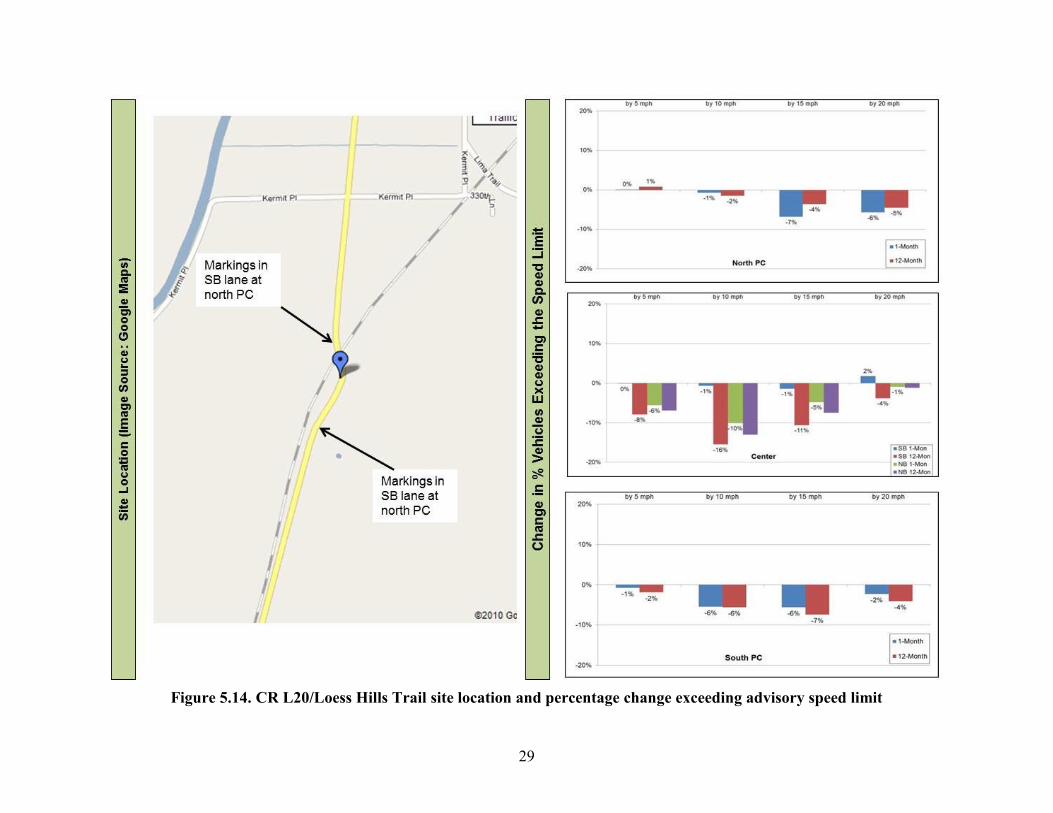
Figure 5.13 shows the change in the percentage of vehicles that exceeded the 35 mph advisory speed by a certain threshold. At the north PC, little change occurred for vehicles traveling 5 or 10 mph over the advisory speed while moderate decreases resulted for vehicles traveling 15 and 20 or more mph over.
At the center of the curve, significant decreases resulted for all speed thresholds except for SB vehicles at the 1 month after interval. Decreases up to 8 percent occurred for vehicles traveling 5 or more mph over and decreases up to 16 percent resulted for those traveling 10 or more mph over.
At the 15 or more mph over threshold, the researchers found decreases up to 11 percent and decreases up to 4 percent for vehicles traveling 20 or more mph over the advisory speed. At the south PC (NB vehicles), moderate decreases (up to 7 percent) resulted for all of the thresholds for both the 1 and 12 month after periods.
28
Figure 5.13. CR L20/Loess Hills Trail on-pavement curve marking impact on vehicle speeds
29
Figure 5.14. CR L20/Loess Hills Trail site location and percentage change exceeding advisory speed limit
30
6. CONCLUSIONS
A large number of rural crashes occur on curves. Some sources estimate crash rates on curves to be three times that of tangent sections.
Curve-related crashes involve a number of roadway and driver causative factors. Driver errors on horizontal curves are often due to inappropriate selection of speed and inability to maintain lane position. Factors that contribute to excessive speed include driver inexperience, workload, sobriety, distraction, fatigue, sight distance, misperception of degree of roadway curvature, and situational complexity.
As agencies attempt to improve safety, they are often looking for low-cost measures that they can apply quickly and economically. Several low-cost treatments—such as post-mounted delineators, on-pavement curve warning signs, raised pavement markings, and wider edge lines—have been used to provide additional delineation around curves.
Even though agencies have been applying a number of different low cost treatments, the effectiveness of those treatments toward improving safety is not well understood or documented. This report discussed the results of a study that evaluated two different low-cost curve treatments.
The first treatment involved adding retroreflective sheeting material to existing chevron posts in an attempt to provide additional curve delineation. The team evaluated the addition of retroreflective post treatments at four rural two-lane sites in Iowa. The second treatment involved adding on-pavement curve warning signs. The team evaluated the addition of on-pavement signs at two rural two-lane roadway sites in Iowa.
The researchers collected speed data before and 1 month after installation of the treatments at all sites. Treatments were installed in 2010 at some sites and in 2011 at others. When installed in 2010, the researchers also collected 12 month after data.
The team compared mean and 85th percentile speeds as well as the percentage of vehicles traveling 5, 10, 15, or 20 or more mph over the advisory speed, if present, or the posted speed limit, if no advisory speed was present.
Results for the retroreflective post treatments include the following:
At the CR Y52 site, up to 2 mph decreases resulted in mean and 85th percentile speeds with moderate decreases (up to 10 percent) in the percentage of vehicles traveling 5 or 10 or more mph over the advisory speed. Significant decreases resulted in the percent of vehicles traveling 15 or 20 or more mph over the advisory speed (up to 21 percent).
31
At the 221st Street site, decreases up to 2 mph in mean and 85th percentile speeds occurred. Significant decreases occurred at all levels for vehicles traveling 5, 10, 15, or 20 mph or more over the advisory speed (up to 50 percent) at two locations along the curve.
At the IA 141 site, mean and 85th percentile speeds experienced little change in most cases with reductions up to 1.9 mph in mean speed at one data collection location. The percentage of vehicles traveling a certain threshold over the advisory speed increased for the daytime period but decreased at night in most cases (with decreases up to 13 percent).
At the US 52 site, mean and 85th percentile speeds were relatively constant from the before to 1 month after period. Moderate decreases in the percent of vehicles traveling 5, 10, 15, or 20 or more mph over the advisory speed (up to 6 percent) occurred for the daytime period at both data collection locations. During the nighttime period, the percentage of vehicles traveling 5 or more mph over the advisory speed increased by up to 13 percent for both data collection locations and an increase of 3 percent occurred for the south PC. All other nighttime speed thresholds decreased at both locations (up to 6 percent).
Results for the on-pavement curve markings include the following:
At the DMC 99 site, change in mean and 85th percentile speeds showed mixed results. The percentage of vehicles traveling 5 or 10 or more mph over the posted speed limit increased by up to 10 percent at the north PC but decreased significantly at the center of the curve and at the south PC. Little change was noted for any location for vehicles traveling 15 or 20 mph over the posted speed limit.
At the CR L20 site, mean and 85th percentile speeds decreased by up to 2 mph. Moderate decreases in the percentage of vehicles exceeding the advisory speed by 5, 10, 15, or 20 or more mph resulted for the north and south PC (up to 7 percent), while significant decreases occurred at the center of the curve for all thresholds (up to 16 percent).
Overall, both treatments were moderately effective in reducing mean and 85th percentile speeds. The treatments had the greatest impact in decreasing the percent of vehicles traveling 5, 10, 15, or 20 mph or more over the posted or advisory speeds.
Given that the treatments are relatively low cost, they show promise in reducing speeds on rural two-lane curves. While reducing speeds on curves is assumed to result in a reduction in crashes, the relationship is not known.

33
REFERENCES
Anderson, I. B., and R. A. Krammes. “Speed Reduction as a Surrogate for Accident Experience at Horizontal Curves on Rural Two-Lane Highways.” Transportation Research Record:
Journal of the Transportation Research Record. Vol. 1701. Transportation Research Board of the National Academies, Washington, DC. 2000. pp. 86–94.
Charlton, S. G. “The Role of Attention in Horizontal Curves: A Comparison of Advance Warning, Delineation, and Road Marking Treatments.” Accident Analysis and
Prevention. Vol. 39. 2007. pp. 873–885. Charlton, S. G., and J. J. DePont. Curve Speed Management. Land Transport New Zealand
Research Report 323. July 2007. Chrysler, Susan T., Jon Re, Keith S. Knapp, Dillon S. Funkhouser, and Beverly T. Kuhn. Driver
Response to Delineation Treatments on Horizontal Curves on Two-Lane Roads. Texas Transportation Institute. FHWA/TX-09/-5772-1. May 2009.
Chrysler, Susan T. and Steven D. Schrock. Field Evaluation and Driver Comprehension Studies
of Horizontal Signing. FHWA/TX-05/0-4471-2. Texas Transportation Institute. February 2005.
Council, Forrest M., Raghavan Srinivasan, Scott Masten, Daniel Carter, and Martine Reurings. Development of a Speeding-Related Crash Typology: Summary Report. Federal Highway Administration. FHWA-HRT-10-039. 2005.
Deng, Zuxuan, John N. Ivan, and Per Garder. “Analysis of Factors Affecting the Severity of Head-On Crashes.” Transportation Research Record: Journal of the Transportation
Research Board. No. 1953. Transportation Research Board of the National Academies, Washington, DC. 2006. pp. 137–146.
Farmer, C. M., and A. K. Lund. “Rollover Risk of Cars and Light Trucks after Accounting for Driver and Environmental Factors.” Accident Analysis and Prevention. Vol. 34. 2002. pp. 163–173.
Fink, K. L., and R. A. Krammes. Tangent Length and Sight Distance Effects on Accident Rates at Horizontal Curves on Rural Two-Lane Highways. Transportation Research Record
1500, Transportation Research Board, 1995, pp. 162–168. Glennon, J. C., T. Neuman, and J. Leisch. Safety and Operational Considerations for Design of
Rural Highway curves. FHWA. FHWA/RD-86-035. December 1985. Hassan, Y. and S. M. Easa. “Effect of Vertical Alignment on Driver Perception of Horizontal
Curves.” Journal of Transportation Engineering. Vol. 129, No. 4. 2003. pp. 399-407. Luediger, L., E. M. Choueiri, J. C. Hayward, and A. Paluri. “Possible Design Procedure to
Promote Design Consistency in Highway Geometric Design on Two-Lane Rural Roads.” Transportation Research Record: Journal of the Transportation Research Record. Vol. 1195. Transportation Research Board of the National Academies, Washington, DC. 1988. pp. 111–122.
Mohamedshah, Y. M., F. F. Paniatie, and A. G. Hobeika. “Truck Accident Models for Interstates and Two-Lane Rural Roads.” Transportation Research Record: Journal of the Transportation Research Record. Vol. 1407. Transportation Research Board of the National Academies, Washington, DC. 1993. pp. 35–41.
Miaou, S., and H. Lum. “Statistical Evaluation of the Effects of Highway Geometric Design on Truck Accident Involvements.” Transportation Research Record: Journal of the Transportation Research Record. Vol. 1407. 1993. pp. 11–24.

34
Milton, John and Fred Mannering. “The Relationship among Highway Geometric, Traffic-Related Elements, and Motor-Vehicle Accident Frequencies.” Transportation. Vol. 25. 1998. pp. 395–413.
Preston, Howard. Low-Cost Treatments for Horizontal Curve Safety. PowerPoint presentation from FHWA webinar. 2009.
Preston, H., and T. Schoenecker. Potential Safety Effects of Dynamic Signing at Rural
Horizontal Curves. Minnesota Local Road Research Board. December 1999. Re, Jonathan M., H. Gene Hawkins, Jr., and Susan T. Chrysler. “Assessing Benefits of Chevrons
with Full Retroreflective Signposts on Rural Horizontal Curves.” Transportation
Research Record: Journal of the Transportation Research Board. No. 2149. Transportation Research Board of the National Academies, Washington, DC. 2010. pp. 30–36.
Retting, Richard A. and Charles M. Farmer. “Use of Pavement Markings to Reduce Excessive Traffic Speeds on Hazardous Curves.” ITE Journal. September 1998. pp. 30–36.
Shankar, V., R. B. Albin, J. C. Milton, and F. L. Mannering. “Evaluating Median Crossover Likelihoods with Clustered Accident Counts: An Empirical Inquiry Using the Random Effects Negative Binomial Model.” Transportation Research Record: Journal of the
Transportation Research Record. Vol. 1635. Transportation Research Board of the National Academies, Washington, DC. 1998. pp. 44–57.
Taylor, M. C., A. Baruya, and J. V. Kennedy. The Relationship Between Speed and Accidents on
Rural Single-Carriageway Roads. Road Safety Division, Department for Transport, Local Government and the Regions. TRL Report TRL511. 2002.
Thompson, Harold T., and David J. Perkins. Surrogate Measures for Accident Experience at
Rural Isolated Horizontal Curves. Notre Dame, Indiana. DOT-FH-11-9492. 1983. Turner, Shane, and Fergus Tate. Relationship between Road Geometry, Observed Travel Speed
and Rural Accidents. NZ Transport Agency Report 371. 2009. Vogt, A., and J. Bared. “Accident Models for Two-Lane Rural Segments and Intersections.”
Transportation Research Record: Journal of the Transportation Research Record. Vol. 1635. Transportation Research Board of the National Academies, Washington, DC. 1998. pp. 18–29.
Zegeer, C. V., R. Stewart, F. M. Council, D. W. Reinfurt, and E. Hamilton. “Safety Effects of Geometric Improvements on Horizontal Curves.” Transportation Research Record:
Journal of the Transportation Research Record. Vol. 1356. Transportation Research Board of the National Academies, Washington, DC. 1992. pp. 11–19.