Embed Size (px)
Citation preview
234
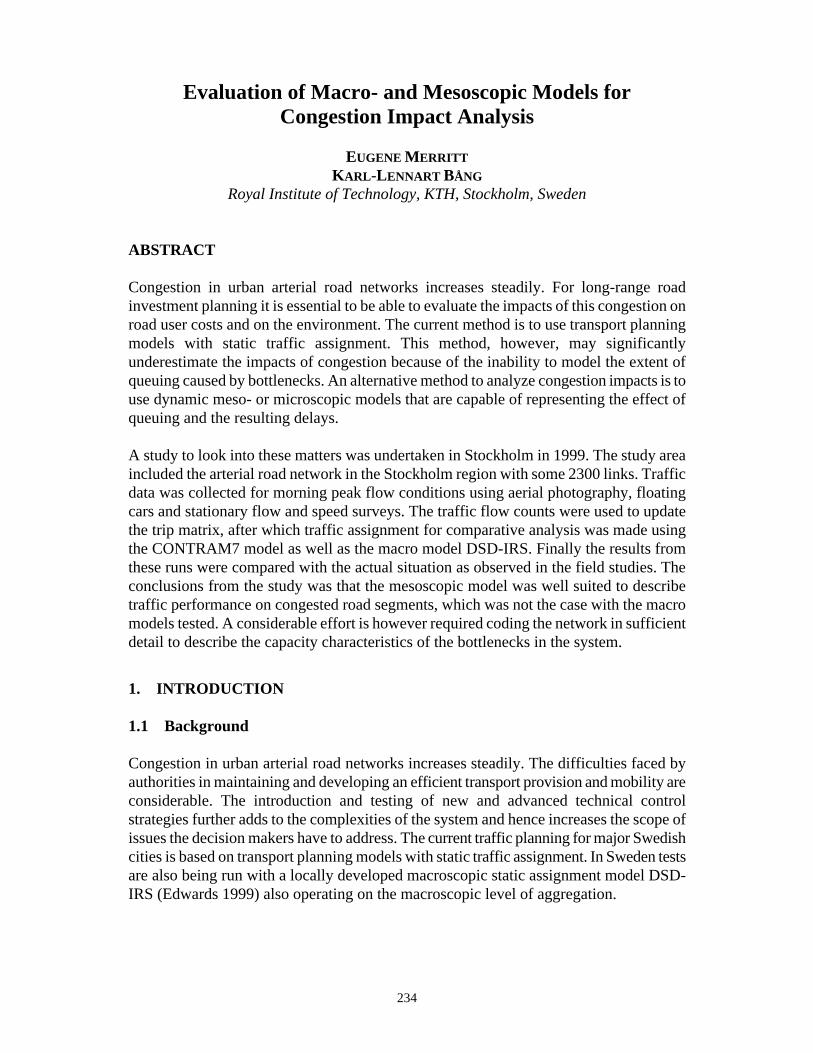
Evaluation of Macro- and Mesoscopic Models for Congestion Impact Analysis
EUGENE MERRITT KARL -LENNART BÅNG
Royal Institute of Technology, KTH, Stockholm, Sweden
ABSTRACT
Congestion in urban arterial road networks increases steadily. For long-range road investment planning it is essential to be able to evaluate the impacts of this congestion on road user costs and on the environment. The current method is to use transport planning models with static traffic assignment. This method, however, may significantly underestimate the impacts of congestion because of the inability to model the extent of queuing caused by bottlenecks. An alternative method to analyze congestion impacts is to use dynamic meso- or microscopic models that are capable of representing the effect of queuing and the resulting delays. A study to look into these matters was undertaken in Stockholm in 1999. The study area included the arterial road network in the Stockholm region with some 2300 links. Traffic data was collected for morning peak flow conditions using aerial photography, floating cars and stationary flow and speed surveys. The traffic flow counts were used to update the trip matrix, after which traffic assignment for comparative analysis was made using the CONTRAM7 model as well as the macro model DSD-IRS. Finally the results from these runs were compared with the actual situation as observed in the field studies. The conclusions from the study was that the mesoscopic model was well suited to describe traffic performance on congested road segments, which was not the case with the macro models tested. A considerable effort is however required coding the network in sufficient detail to describe the capacity characteristics of the bottlenecks in the system.
1. INTRODUCTION
1.1 Background
Congestion in urban arterial road networks increases steadily. The difficulties faced by authorities in maintaining and developing an efficient transport provision and mobility are considerable. The introduction and testing of new and advanced technical control strategies further adds to the complexities of the system and hence increases the scope of issues the decision makers have to address. The current traffic planning for major Swedish cities is based on transport planning models with static traffic assignment. In Sweden tests are also being run with a locally developed macroscopic static assignment model DSD-IRS (Edwards 1999) also operating on the macroscopic level of aggregation.
Merritt and Bång 235
The method of using static assignment in urban road networks containing traffic control features such as traffic signals, stop and yield signs together with motorway on- and off-ramps may significantly underestimate the impacts of congestion because of the inability to model the extent of queuing caused by bottlenecks. The macroscopic models tend to solve the congestion problem by assigning the excess traffic to other routes while maintaining a certain level of traffic service on the main routes. Furthermore, static assignment does not fully take into account the time variation in traffic conditions, particularly when demands temporarily exceeds capacity during peak periods. An alternative method to analyze congestion impacts is to use dynamic mesoscopic or models that are capable of representing the effect of queuing and the resulting delays.
1.2 Objectives and Scope of the Study
As a part of the regular national planning for the Swedish road infrastructure a study of the level of traffic performance in the city of Stockholm is undertaken every third year by the Swedish National Road Administration. In 1999 a research part of this study was added, with the purpose to examine if dynamic traffic modeling could give a better description of the traffic performance on congested routes than the static models currently used. The objectives of the study were as follows:
• to estimate the real level of performance of the arterial road network in Stockholm by means of an extensive field survey;
• to model the traffic performance for the same period of time using static as well as dynamic models, and to compare the results with observed conditions;
• to recommend how traffic performance studies should be carried out for major Swedish cities in the future.
1.3 Methodology
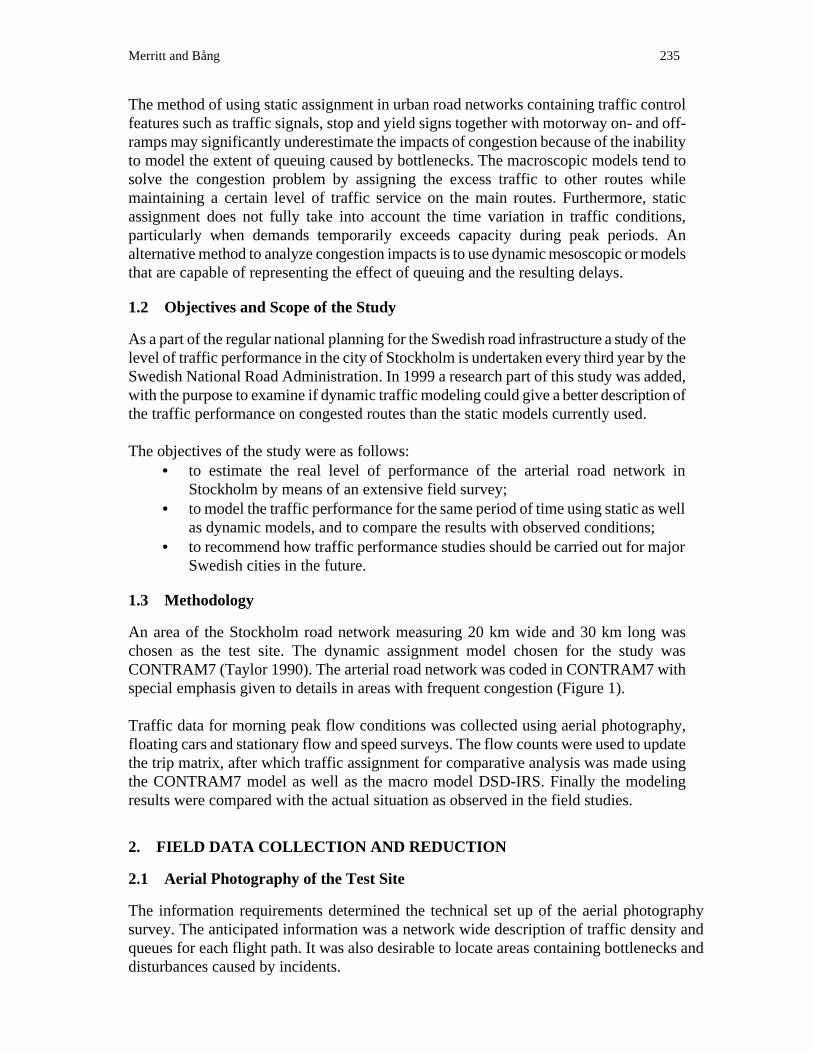
An area of the Stockholm road network measuring 20 km wide and 30 km long was chosen as the test site. The dynamic assignment model chosen for the study was CONTRAM7 (Taylor 1990). The arterial road network was coded in CONTRAM7 with special emphasis given to details in areas with frequent congestion (Figure 1). Traffic data for morning peak flow conditions was collected using aerial photography, floating cars and stationary flow and speed surveys. The flow counts were used to update the trip matrix, after which traffic assignment for comparative analysis was made using the CONTRAM7 model as well as the macro model DSD-IRS. Finally the modeling results were compared with the actual situation as observed in the field studies.
2. FIELD DATA COLLECTION AND REDUCTION
2.1 Aerial Photography of the Test Site
The information requirements determined the technical set up of the aerial photography survey. The anticipated information was a network wide description of traffic density and queues for each flight path. It was also desirable to locate areas containing bottlenecks and disturbances caused by incidents.
236 Transportation Research Circular E-C018: 4th International Symposium on Highway Capacity
FIGURE 1 The studied road network in Stockholm . (The colored dots represent
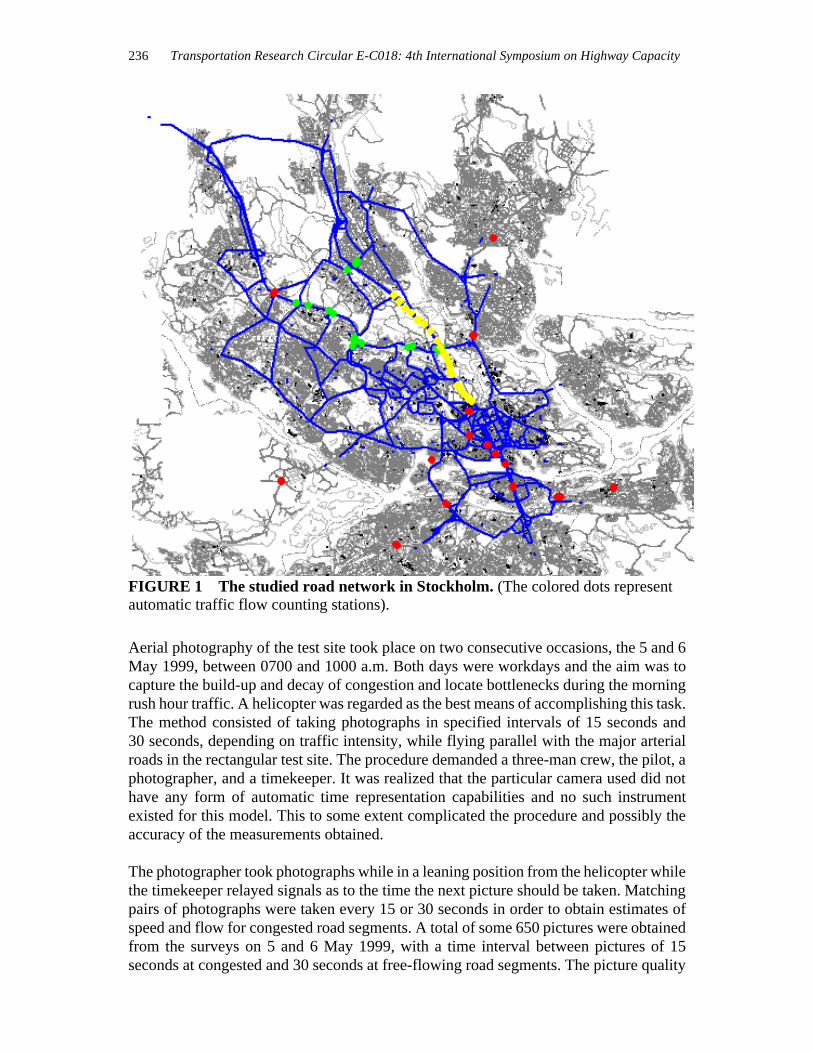
Aerial photography of the test site took place on two consecutive occasions, the 5 and 6 May 1999, between 0700 and 1000 a.m. Both days were workdays and the aim was to capture the build-up and decay of congestion and locate bottlenecks during the morning rush hour traffic. A helicopter was regarded as the best means of accomplishing this task. The method consisted of taking photographs in specified intervals of 15 seconds and 30 seconds, depending on traffic intensity, while flying parallel with the major arterial roads in the rectangular test site. The procedure demanded a three-man crew, the pilot, a photographer, and a timekeeper. It was realized that the particular camera used did not have any form of automatic time representation capabilities and no such instrument existed for this model. This to some extent complicated the procedure and possibly the accuracy of the measurements obtained. The photographer took photographs while in a leaning position from the helicopter while the timekeeper relayed signals as to the time the next picture should be taken. Matching pairs of photographs were taken every 15 or 30 seconds in order to obtain estimates of speed and flow for congested road segments. A total of some 650 pictures were obtained from the surveys on 5 and 6 May 1999, with a time interval between pictures of 15 seconds at congested and 30 seconds at free-flowing road segments. The picture quality
automatic traffic flow counting stations).
Merritt and Bång 237
was good due excellent weather, see example in Figure 2. During the subsequent data reduction it was nevertheless difficult to distinguish the identity of individual passenger vehicles on overlapping pairs of pictures, they looked too much alike (= many Volvos).
FIGURE 2 Essingeleden (Motorway E4) approaching Stockholm from the SW.
2.2 Floating Cars
The floating car survey (average car technique) was carried out in parallel with the aerial photography using 5 vehicles travelling back and forth on the main arterial roads leading to and from Stockholm. The cars had tachographs and video cameras for recording of the following data: • passage time at predetermined road sections dividing the studied routes in segments of
a number of kilometers (1–5); • time and position of vehicle queues in both direction of travel as well as information
regarding the time and position when queuing (defined as speed slower than 20 km/h) ceased;
• any incident or other event influencing the traffic performance on the studied arterial and/or the data collection.
238 Transportation Research Circular E-C018: 4th International Symposium on Highway Capacity
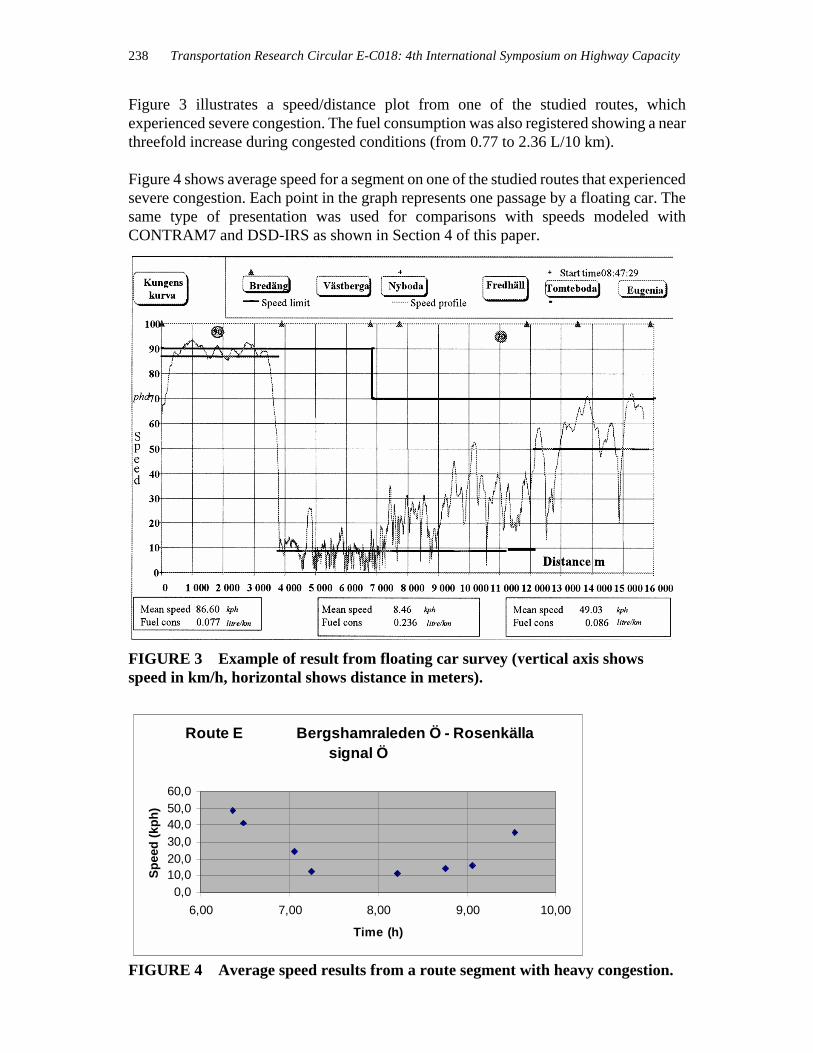
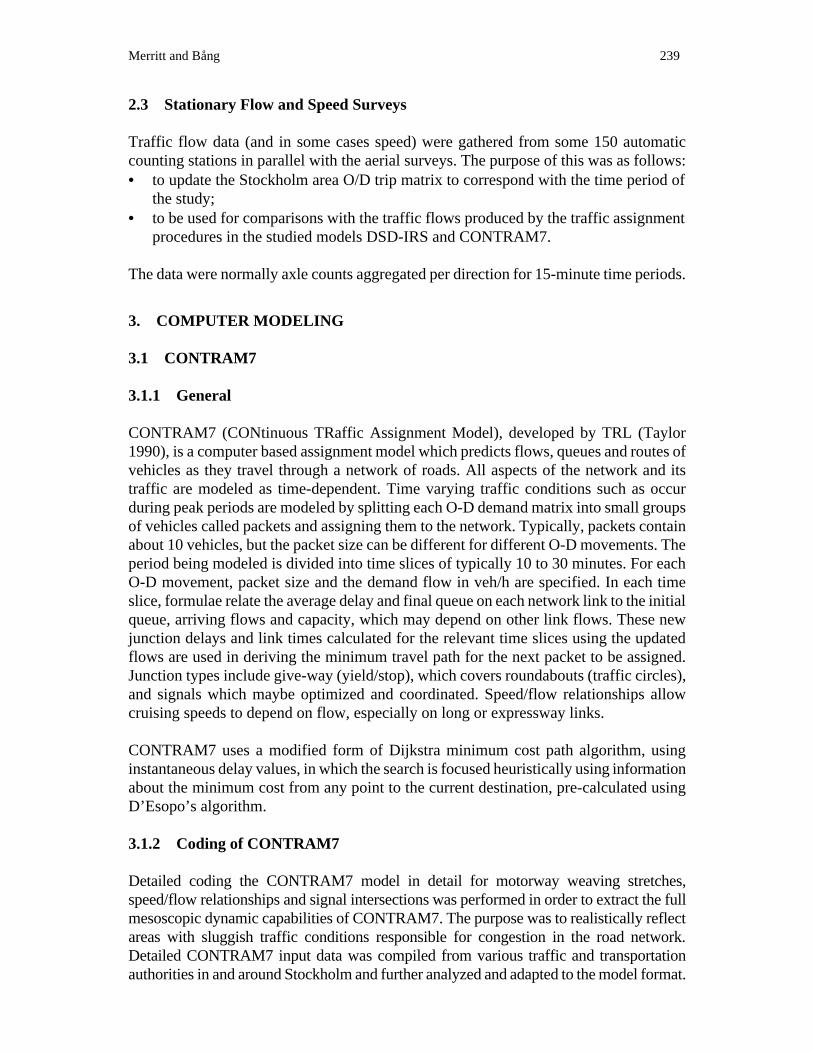
Figure 3 illustrates a speed/distance plot from one of the studied routes, which experienced severe congestion. The fuel consumption was also registered showing a near threefold increase during congested conditions (from 0.77 to 2.36 L/10 km). Figure 4 shows average speed for a segment on one of the studied routes that experienced severe congestion. Each point in the graph represents one passage by a floating car. The same type of presentation was used for comparisons with speeds modeled with CONTRAM7 and DSD-IRS as shown in Section 4 of this paper.
FIGURE 3 Example of result from floating car survey (vertical axis shows speed in km/h, horizontal shows distance in meters).
Route E Bergshamraleden Ö - Rosenkälla signal Ö
0,010,020,030,040,050,060,0
6,00 7,00 8,00 9,00 10,00
Time (h)
Spe
ed (
kph)
FIGURE 4 Average speed results from a route segment with heavy congestion.
Merritt and Bång 239
2.3 Stationary Flow and Speed Surveys
Traffic flow data (and in some cases speed) were gathered from some 150 automatic counting stations in parallel with the aerial surveys. The purpose of this was as follows: • to update the Stockholm area O/D trip matrix to correspond with the time period of
the study; • to be used for comparisons with the traffic flows produced by the traffic assignment
procedures in the studied models DSD-IRS and CONTRAM7. The data were normally axle counts aggregated per direction for 15-minute time periods.
3. COMPUTER MODELING
3.1 CONTRAM7
3.1.1 General
CONTRAM7 (CONtinuous TRaffic Assignment Model), developed by TRL (Taylor 1990), is a computer based assignment model which predicts flows, queues and routes of vehicles as they travel through a network of roads. All aspects of the network and its traffic are modeled as time-dependent. Time varying traffic conditions such as occur during peak periods are modeled by splitting each O-D demand matrix into small groups of vehicles called packets and assigning them to the network. Typically, packets contain about 10 vehicles, but the packet size can be different for different O-D movements. The period being modeled is divided into time slices of typically 10 to 30 minutes. For each O-D movement, packet size and the demand flow in veh/h are specified. In each time slice, formulae relate the average delay and final queue on each network link to the initial queue, arriving flows and capacity, which may depend on other link flows. These new junction delays and link times calculated for the relevant time slices using the updated flows are used in deriving the minimum travel path for the next packet to be assigned. Junction types include give-way (yield/stop), which covers roundabouts (traffic circles), and signals which maybe optimized and coordinated. Speed/flow relationships allow cruising speeds to depend on flow, especially on long or expressway links. CONTRAM7 uses a modified form of Dijkstra minimum cost path algorithm, using instantaneous delay values, in which the search is focused heuristically using information about the minimum cost from any point to the current destination, pre-calculated using D’Esopo’s algorithm.
3.1.2 Coding of CONTRAM7
Detailed coding the CONTRAM7 model in detail for motorway weaving stretches, speed/flow relationships and signal intersections was performed in order to extract the full mesoscopic dynamic capabilities of CONTRAM7. The purpose was to realistically reflect areas with sluggish traffic conditions responsible for congestion in the road network. Detailed CONTRAM7 input data was compiled from various traffic and transportation authorities in and around Stockholm and further analyzed and adapted to the model format.
240 Transportation Research Circular E-C018: 4th International Symposium on Highway Capacity
The speed-flow characteristics in the model have the shape of a downward sloping 3-segment linear approximation. The test area includes motorway sections, with speed limits of 70 km/h, 90 km/h and 110 km/h with connecting two-lane roads and neighboring surface streets. The parameters applied in CONTRAM7 for the purpose of this project were based on recent results from a recent major capacity modeling project undertaken in Stockholm (Carlsson and Cedersund 1998). The desired output should disclose the level of congestion through queuing, delay and journey time in Stockholm City while supplying matrix estimation data for traffic assignment models. Furthermore, it should constitute a basis for comparing results from DSD-IRS and CONTRAM7 while evaluating the level of accuracy in which they represent congested situations.
3.1.3 Updating of the O-D Matrices
The axle counts on 65 links were reduced to traffic flow per hour for the (7:00 – 8:00 a.m. peak hour, May 1999) and used to update the O-D matrix. The procedure used for CONTRAM7 was essentially manual through the use of a pivot table designed by TRL. The procedure was that for each link in CONTRAM7 a route file containing all the O-D pairs that contribute to the flow on that particular link was abstracted. This partial matrix was then factorized in accordance with the difference between the link flow predicted by the model and the measured flow. The factorized partial matrix was then replaced in the overall matrix and a new simulation performed. This procedure was carried out for the 65 axle counts used. The reason for this was that COMEST, the matrix estimation module in CONTRAM7 was dismantled during the upgrade to a WINDOWS platform, and not reinstalled as expected during the scope of this project. However, new time-dependent O-D matrix estimation software, using weighted maximum entropy, is being developed for CONTRAM7. Updating of the O-D matrix for DSD-IRS was carried out with the model’s embedded automatic procedure.
3.2 DSD-IRS
In the Disaggregate Simplicial Decomposition (DSD) method (Tatineni et al. 1997), at every iteration the algorithm moves towards the best solution by finding the optimal combination of several previously generated sub-problem solutions, requiring that the sub-problem solution be stored for each iteration. Unlike the Frank-Wolfe algorithm implemented in EMME/2 (INRO 1991), in which sub-problem solutions are generated and used with respect to link flows, the sub-problem solutions for DSD-IRS are generated and stored with respect to route flows. A further development of this model called DSD-IRS (Disaggregated Simplified Decomposition - Implicit Route Storage) was used in the project. DSD-IRS could also be run with special consideration of queuing resulting from congestion (Edwards 1999). The model DSD-IRS used in the study will be referred to as simply DSD for the remainder of the paper. The dynamic traffic assignment in CONTRAM7 differs from the static assignment of DSD in the following ways:
Merritt and Bång 241
• CONTRAM7 subdivides the O-D matrix into packets of vehicles called packets. • A modeled time period in CONTRAM7 can be divided into time slices, each with a
specified demand flow. • Assigned packets of vehicles in CONTRAM7, after completing a link journey, will
receive updated information of the travel times on all possible remaining links and thus can choose to use different links to complete their journey.
• Results will also be obtainable for each time slice defined. DSD use volume-delay functions for modeling the impact on speed of traffic interactions and congestion, and which could not be directly converted to the empirical speed-flow relationships used in CONTRAM7.
4. MODEL COMPARISON WITH FIELD DATA
The purpose of the project was to compare actual and modeled traffic conditions with particular emphasis on the following aspects:
• Traffic flow • Average speed • The existence of queues
The comparisons focused on links segments representing a range from good to congested traffic conditions corresponding to Level of Service (LoS) B-F (TRB 1994).
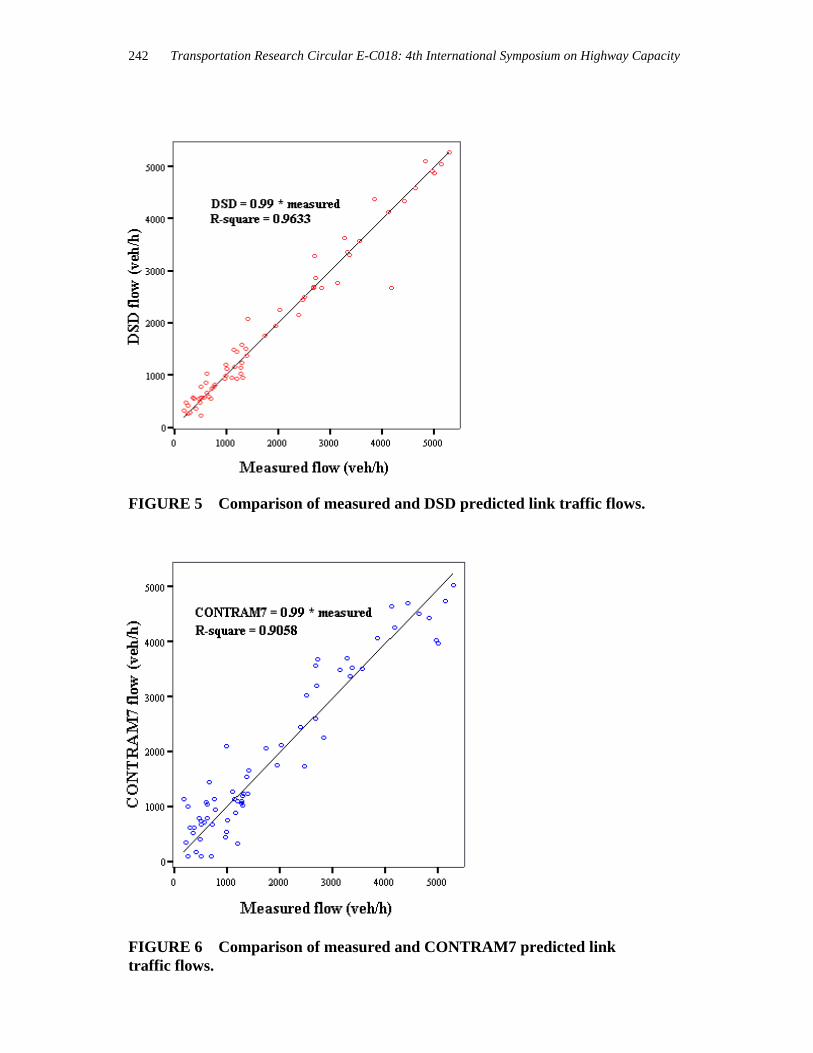
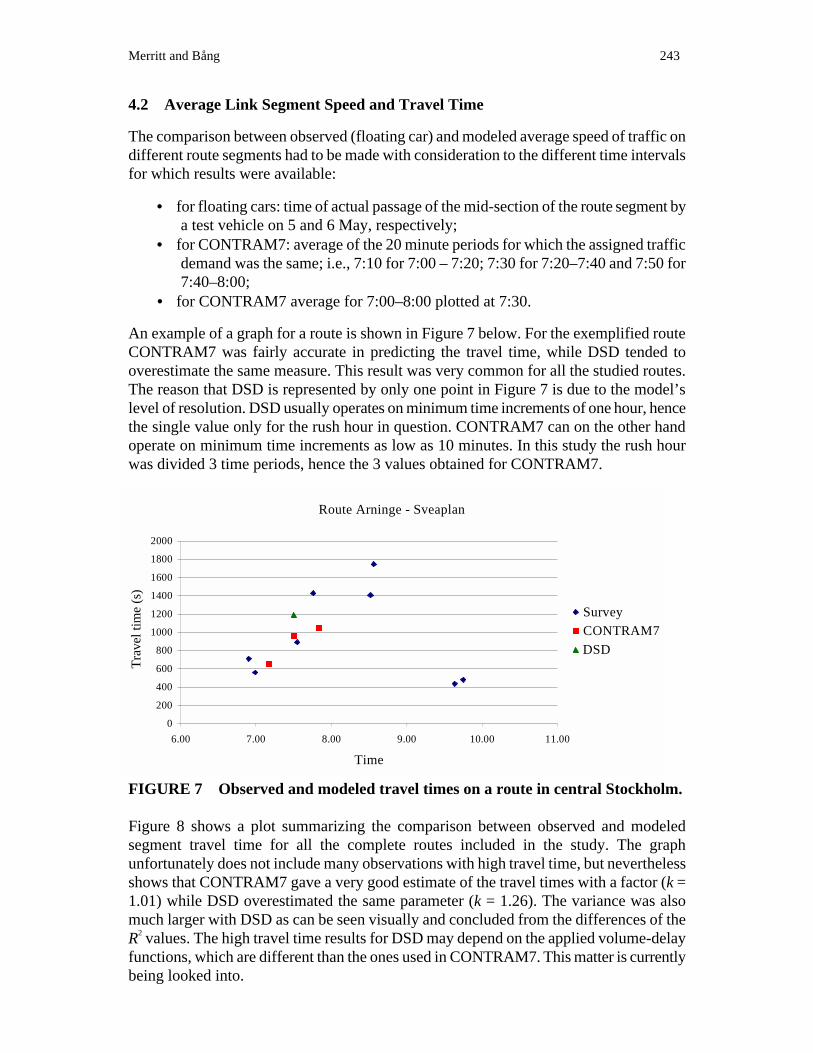
4.1 Traffic Flow
The process for updating of the O-D trip matrix to represent the traffic demand at the time of the traffic survey has been mentioned in Section 3.1.3 above. The revised matrix was then used to run CONTRAM7 as well as the DSD model for the studied situation (a.m. peak hour traffic 5–6 May 1999). The modeled link flows were then compared with the observed flows as shown in Figure 5 and Figure 6. The degree of resemblance between observed and modeled link flows is dependent upon the degree of detail in the network coding, which was very coarse for the urban street network carrying low flows. This explains the considerable scatter of the points in the graph at low flows. For high traffic flows the fit between observed and modeled flows were quite good with both CONTRAM7 and DSD for the studied case. According to the regression coefficients in Figure 5 and Figure 6. DSD and CONTRAM7 both produced flow estimates corresponding to 99% of the observed flows. With the above-achieved level of agreement between measured and predicted traffic flows, both DSD and CONTRAM7 are considered sufficiently well calibrated for practical applications.
242 Transportation Research Circular E-C018: 4th International Symposium on Highway Capacity
FIGURE 5 Comparison of measured and DSD predicted link traffic flows.
FIGURE 6 Comparison of measured and CONTRAM7 predicted link traffic flows.
Merritt and Bång 243
4.2 Average Link Segment Speed and Travel Time
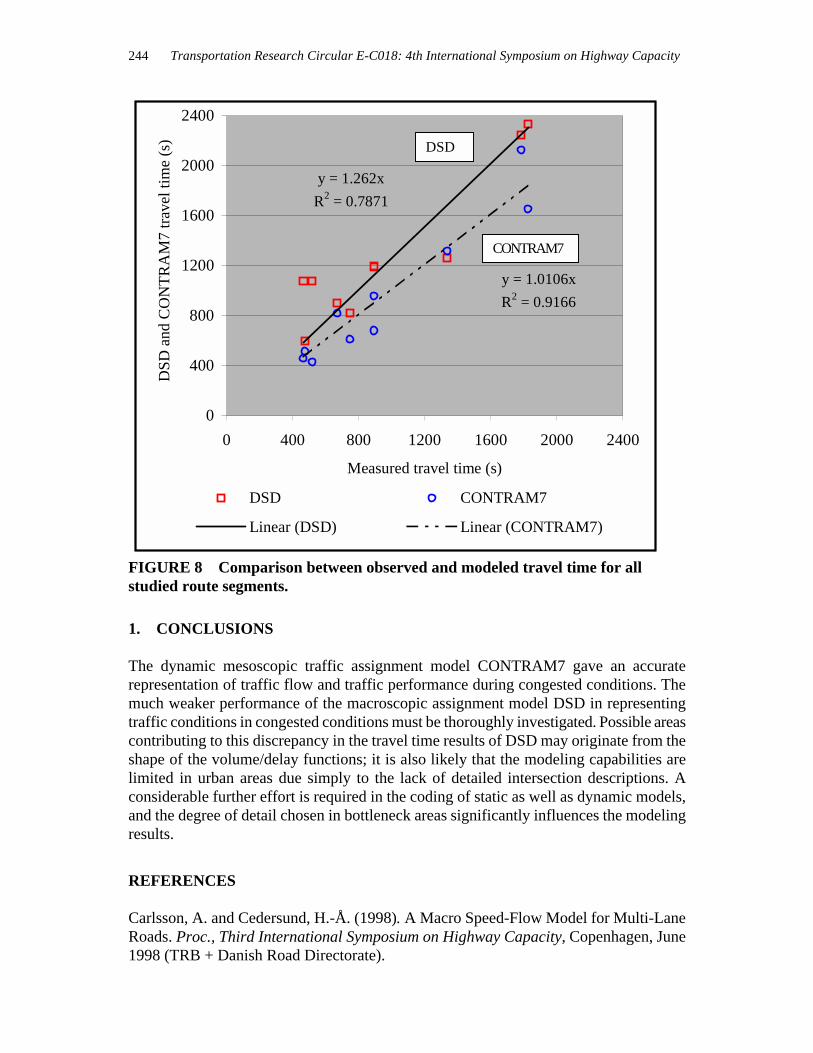
The comparison between observed (floating car) and modeled average speed of traffic on different route segments had to be made with consideration to the different time intervals for which results were available:
• for floating cars: time of actual passage of the mid-section of the route segment by a test vehicle on 5 and 6 May, respectively;
• for CONTRAM7: average of the 20 minute periods for which the assigned traffic demand was the same; i.e., 7:10 for 7:00 – 7:20; 7:30 for 7:20–7:40 and 7:50 for 7:40–8:00;
• for CONTRAM7 average for 7:00–8:00 plotted at 7:30.
An example of a graph for a route is shown in Figure 7 below. For the exemplified route CONTRAM7 was fairly accurate in predicting the travel time, while DSD tended to overestimate the same measure. This result was very common for all the studied routes. The reason that DSD is represented by only one point in Figure 7 is due to the model’s level of resolution. DSD usually operates on minimum time increments of one hour, hence the single value only for the rush hour in question. CONTRAM7 can on the other hand operate on minimum time increments as low as 10 minutes. In this study the rush hour was divided 3 time periods, hence the 3 values obtained for CONTRAM7.
Route Arninge - Sveaplan
0
200
400
600
800
1000
1200
1400
1600
1800
2000
6.00 7.00 8.00 9.00 10.00 11.00
Time
Tra
vel t
ime
(s)
SurveyCONTRAM7
DSD
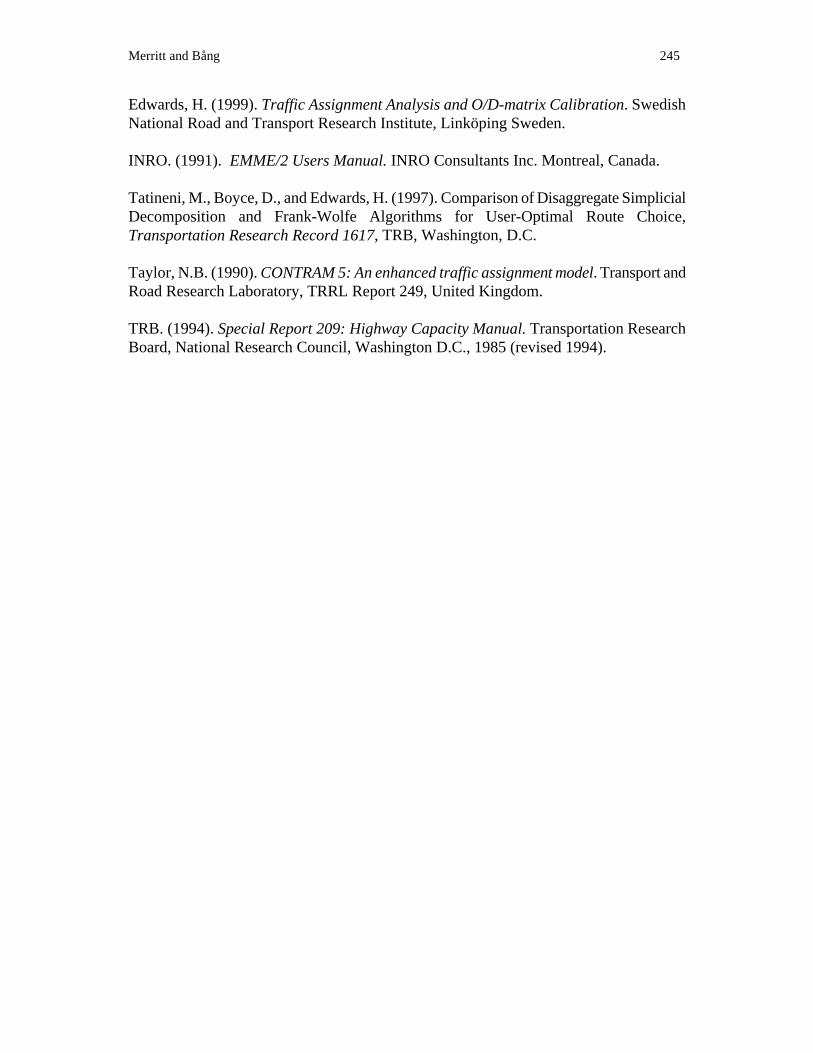
FIGURE 7 Observed and modeled travel times on a route in central Stockholm. Figure 8 shows a plot summarizing the comparison between observed and modeled segment travel time for all the complete routes included in the study. The graph unfortunately does not include many observations with high travel time, but nevertheless shows that CONTRAM7 gave a very good estimate of the travel times with a factor (k = 1.01) while DSD overestimated the same parameter (k = 1.26). The variance was also much larger with DSD as can be seen visually and concluded from the differences of the R2 values. The high travel time results for DSD may depend on the applied volume-delay functions, which are different than the ones used in CONTRAM7. This matter is currently being looked into.
244 Transportation Research Circular E-C018: 4th International Symposium on Highway Capacity
y = 1.262x
R2 = 0.7871
y = 1.0106x
R2 = 0.9166
0
400
800
1200
1600
2000
2400
0 400 800 1200 1600 2000 2400
Measured travel time (s)
DS
D a
nd C
ON
TR
AM
7 tr
avel
tim
e (s
)
DSD CONTRAM7
Linear (DSD) Linear (CONTRAM7)
FIGURE 8 Comparison between observed and modeled travel time for all studied route segments.
1. CONCLUSIONS
The dynamic mesoscopic traffic assignment model CONTRAM7 gave an accurate representation of traffic flow and traffic performance during congested conditions. The much weaker performance of the macroscopic assignment model DSD in representing traffic conditions in congested conditions must be thoroughly investigated. Possible areas contributing to this discrepancy in the travel time results of DSD may originate from the shape of the volume/delay functions; it is also likely that the modeling capabilities are limited in urban areas due simply to the lack of detailed intersection descriptions. A considerable further effort is required in the coding of static as well as dynamic models, and the degree of detail chosen in bottleneck areas significantly influences the modeling results.
REFERENCES
Carlsson, A. and Cedersund, H.-Å. (1998). A Macro Speed-Flow Model for Multi-Lane Roads. Proc., Third International Symposium on Highway Capacity, Copenhagen, June 1998 (TRB + Danish Road Directorate).
DSD
CONTRAM7
Merritt and Bång 245
Edwards, H. (1999). Traffic Assignment Analysis and O/D-matrix Calibration. Swedish National Road and Transport Research Institute, Linköping Sweden. INRO. (1991). EMME/2 Users Manual. INRO Consultants Inc. Montreal, Canada. Tatineni, M., Boyce, D., and Edwards, H. (1997). Comparison of Disaggregate Simplicial Decomposition and Frank-Wolfe Algorithms for User-Optimal Route Choice, Transportation Research Record 1617, TRB, Washington, D.C. Taylor, N.B. (1990). CONTRAM 5: An enhanced traffic assignment model. Transport and Road Research Laboratory, TRRL Report 249, United Kingdom. TRB. (1994). Special Report 209: Highway Capacity Manual. Transportation Research Board, National Research Council, Washington D.C., 1985 (revised 1994).