Embed Size (px)
Citation preview
Evaluation of micro-mechanical properties of nonlinear cementitiouscomposite using large-displacement transient nanoindentation analysis
B S SINDU*, SAPTARSHI SASMAL and B SARAVANAN
CSIR-Structural Engineering Research Centre, CSIR Campus, Taramani, Chennai 600113, India
e-mail: [email protected]; [email protected]
MS received 20 September 2016; revised 19 June 2017; accepted 14 July 2017; published online 10 March 2018
Abstract. Nanoindentation technique is employed for evaluation of mechanical properties of homogeneous
materials at micro-level. Many engineering materials, especially cement and concrete composites, which are
extensively used as building materials, exhibit phase heterogeneity and are highly porous. The presence of pores
highly influences the response obtained from nanoindentation tests. In this study, mechanical properties of
Calcium-Silicate-Hydrate (C-S-H), the primary binding agent in cementitious composites, are investigated using
a simulated nanoindentation technique. The influence of presence of pores and its geometrical distribution on the
non-linear response of C-S-H phases and the stress distribution are critically analysed.
Keywords. Nanoindentation; Calcium-Silicate-Hydrate; finite-element simulations; pores; mechanical
properties.
1. Introduction
Indentation is a simple and commonly applied method to
evaluate the mechanical properties of materials. Nanoin-
dentation is a particular type of indentation that is per-
formed to find out the material properties, especially
hardness and elastic modulus, at micro- and nano-level. The
technique originated from Mohs scale of mineral hardness
introduced in 1812 [1]. The concept of nanoindentation test
is based on contact mechanics. The analysis of the stress at
the contact of two elastic solids was first developed by
Hertz. The assumptions made in Hertz’s theory are the
following: (i) the surfaces are continuous and non-con-
forming, i.e., a \\ R where a is the dimension of the
contact area and R is the relative radius of curvature of the
two bodies, (ii) the strains are small, (iii) solids can be
considered as elastic half-space, i.e., a\\R1, a\\R2, and
a\\ l, where R1 and R2 are the radius of curvature of the
bodies and l is the significant dimension of the bodies and
(iv) surfaces are frictionless.
Nanoindentation tests for determining the mechanical
properties of homogeneous materials like metals, glass and
ceramics are well established and are being widely used.
However, application of nanoindentation technique for
heterogeneous and porous materials such as cementitious
composites, where it could be helpful to disclose the
micromechanical properties of individual cement compo-
nents, interfacial zones, fibres, aggregate, etc., is not very
well established [2].
C-S-H is the primary binding agent in Portland
cement. It forms the major hydration product in the
hardened cement paste. Though cementitious materials
are heterogeneous and the amount of presence of low
density (LD) and high density (HD) C-S-H varies based
on the mix proportions, the mechanical properties of both
the phases remain constant because they are the intrinsic
properties of the matrix. However, since cementitious
materials are highly porous, there is a huge possibility
that the nanoindentation is performed in the vicinity of
pore. Due to the presence of pore, the mechanical
response will be considerably altered. In recent years, a
few attempts have been made by various researchers to
apply the nanoindentation technique for evaluation of the
mechanical properties of cementitious materials in form
of hardened cement paste/mortar/concrete specimens.
Velez et al [3] determined the elastic modulus and
hardness of cement clinkers, viz., C3S, C2S, C3A and
C4AF, by the nanoindentation technique. From their
studies, it was found that the elastic modulus of these
phases is between 125 and 145 GPa. It was also reported
that the hardness of C3A is around 10 GPa and that of
silicates around 8–9 GPa. Constantinides et al [4] carried
out nanoindentation tests on intact and calcium-leached
cementitious material and confirmed the presence of two
forms of C-S-H, i.e., LD and HD forms. Role of the HD
and LD C-S-H on elastic stiffness and hardness of
cement-based materials was also identified. Mondal et al
[5] used the nanoindentation technique to determine
nanoscale mechanical properties of interfacial transition
zone (ITZ) in concrete. It was brought out that the ITZ in*For correspondence
1
Sådhanå (2018) 43:29 � Indian Academy of Sciences
https://doi.org/10.1007/s12046-018-0787-0Sadhana(0123456789().,-volV)FT3](0123456789().,-volV)
concrete is highly heterogeneous and the average mod-
ulus of ITZ is up to 70–85% of that of the matrix. Jones
and Grasley [6] carried out nanoindentation tests on
hardened cement pastes to determine the time-dependent
mechanical properties of C-S-H phases. Taha et al [7]
proposed a new technique in which the energy absorbed
by the cracks propagating from the nanoindentation
imprints was used to determine the nanoscale fracture
toughness of the hardened cement paste. Aquino et al [8]
used nanoindentation technique to develop a two-di-
mensional map of elastic modulus and density of cement
paste, which closely resembled the BSE image obtained
through SEM.
It can be found from this discussion that nanoinden-
tation has proven to be an efficient technique to deter-
mine the nano-mechanical properties of various
components of cementitious materials [9–12]. However,
carrying out nanoindentation tests (experimental) on
heterogeneous and porous cementitious materials is
extremely sensitive to workmanship and expertise, and
involves many ambiguities and complexities. Hence, a
validated numerical technique for simulating nanoin-
dentation is an excellent way to evaluate the nano-me-
chanical properties of heterogeneous materials. Further,
pores (capillary and gel) are developed in hydrated
cement paste at different stages of hydration. The
presence of these pores plays a vital role in the
mechanical- and transport-properties of the hardened
cement paste. If the nanoindentation is carried out in the
vicinity of these pores, mechanical properties are under-
predicted, and hence the whole properties of the matrix
itself may be wrongly interpreted. Hence, a thorough
study needs to be carried out to highlight the influence
of pores on the nano-mechanical properties of cemen-
titious materials evaluated using nanoindentation
technique.
With the rapid development of finite elements (FE)
analysis programs, it becomes comparatively easy to sim-
ulate the nanoindentation tests and investigate the influence
of various parameters, which cannot be investigated
through very expensive and complicated experiments.
Sharma et al [13] simulated nanoindentation tests using FE
to determine the mechanical properties of metals. Pelegri
and Huang [14] used FE-simulated nanoindentation tech-
nique to determine the mechanical properties of two dif-
ferent film–substrate systems, i.e., soft film–hard substrate
and hard film–soft substrate material systems and investi-
gated its effect on pile-up and sink-in phenomena. Yan et al
[15] investigated the numerically simulated nanoindenta-
tion technique to determine the conditions under which the
Oliver–Pharr method is applicable. Sarris and Constan-
tinides [16] used FE method to simulate the nanoindenta-
tion of Calcium-Silicate-Hydrate (C-S-H) phases. The
influence of material properties (E, c and u) and contact
friction on the elastic stiffness and hardness of C-S-H
phases was investigated. Also, the parameters influencing
the pile-up phenomenon were also identified. Asroun and
Asroun [17] simulated nanoindentation test on cement paste
using a visco-elastic–plastic material model. The proposed
model was validated with the results obtained from
experiments where load level, indentation magnitude and
time of creep are the parameters. From this discussion, it
can be observed that simulated nanoindentation tests on
cement phases can help in understanding the mechanical
behaviour of these phases better and identifying the influ-
encing parameters of the same.
In the present study, nanoindentation test is numeri-
cally simulated in order to predict the mechanical prop-
erties of C-S-H phases. The influence of parameters like
friction coefficient, the location of the pore and distri-
bution of pores on the mechanical properties like
Young’s modulus, hardness and peak load has been
thoroughly investigated. The present study emphasizes on
the non-linear response of the C-S-H phases and stress
distribution during the indentation process. Further,
influence of presence of pores on load–deformation
response, force-transfer mechanism and other mechanical
behaviour parameters is studied. The location of pores
from the indentation zone is considered as a parameter.
Based on this, contours have been developed to depict the
zones with expected amount of reduction of mechanical
response of cement matrix due to the presence of pores.
Also, the influence of the distribution of pores in the
matrix on the predicted response has also been analysed.
In order to simulate the distribution of pores in a more
realistic way, a cement hydration model has been used to
develop the microstructure of cement matrix including
pores. Further, a discretization algorithm is developed to
import the microstructures for computational nanoin-
dentation using FE analysis.
2. Theoretical background
Though nanoindentation test is well established, a brief on
the theoretical aspects related to the nanoindentation fol-
lowed by the specific information as used in the present
study is given here for ready reference. In an indentation
test, a hard tip whose mechanical properties are known
(generally made of a very hard material like diamond) is
indented into a sample whose properties are unknown. In
this procedure, load is successively applied on the indenter
tip until it reaches the desired level. After performing
indentation, the residual imprints in the indented material
can be visualized using an Atomic Force Microscope
(AFM) and the area of the indenter can be measured.
Generally, indentation is done in two phases, namely the
loading and unloading phases. The load–displacement
characteristics obtained from the nanoindentation experi-
ment are used to evaluate the intrinsic mechanical proper-
ties such as hardness and Young’s modulus of the indented
matrix.
29 Page 2 of 15 Sådhanå (2018) 43:29

A schematic representation of a typical load–displace-
ment plot of nanoindentation test is shown in figure 1,
where the parameter P denotes the load applied by the
indenter and h is the displacement relative to the initial
undeformed surface or the indentation depth. Figure 2
presents the geometry related to indentation test [18].
The contact problem with spherical indenter indenting a
flat specimen was first studied by Hertz [19]. From this
problem, the radius of the circle of contact is given as
a3 ¼ 3
4
PR
E� ð1Þ
where E* is the combined elastic modulus of the indenter
and specimen, expressed as follows:
1
E� ¼1� m2ð ÞE
þ 1� m02ð ÞE0 ð2Þ
where E and m are the elastic modulus and Poisson’s ratio of
the indenter material, respectively, while E0 and m0 denotethe elastic modulus and Poisson’s ratio of the specimen,
P is the indentation load and R is the radius.
Oliver and Pharr [18] proposed a method of analysis of
nanoindentation based on analytical solutions. The load–
displacement response of nanoindentation test consists of
an elastic–plastic loading followed by an elastic unloading.
They used the elastic equations of contact with the
unloading data to determine the elastic modulus and hard-
ness of the specimen material. At any time during loading,
the total displacement h is written as
h ¼ hc þ hs ð3Þ
where hc is the contact depth and hs is the displacement of
the surface at the perimeter of the contact as shown in
figure 2. At the peak load, Pmax, displacement is hmax and
the radius of contact circle is a. The projected contact area,
A, is determined as a function of contact depth, hc. For
a conical or Berkovich indenter, the contact depth is given
by
hc ¼ hmax � ePmax
Sð4Þ
where S (= dP/dh) is the slope of the unloading curve and eis a factor that depends on indenter geometry. The com-
bined elastic modulus is given by
E� ¼ 1
2
dP
dh
ffiffiffi
ppffiffiffi
Ap : ð5Þ
Thus, the elastic modulus of the specimen can be found
from Eq. (2) using the combined elastic modulus calculated
from Eq. (5). Hardness of the material can be calculated by
dividing the maximum load (Pmax) by the projected contact
area (A). For a Berkovich indenter (used in the present
work), A= 24.5hc2 as given by Oliver and Pharr [18].
Specific details are provided while explaining the simula-
tion studies as given in section 3.
3. Simulated indentation on nonlinearcementitious composite
Indentation is a highly non-linear contact problem. In
order to handle this complex problem, commercially
available FE package ANSYS is used. Large-displace-
ment transient analysis in 2D FEM is carried out to solve
the problem. In this study, three types of elements are
used in the modelling, i.e., (a) PLANE 182, (b) CONTA
172 and (c) TARGE 169. 2D 4-node planar element
PLANE 182 is used to model all the areas of indenter and
matrix material. This element type is so chosen to
accommodate the axisymmetric modelling function. It is
capable of being used in cases of large deflection and
large strain as well. The bottom surface of the indenter
and the top surface of the matrix material form a contact
pair in these models. It should be mentioned that PLANE
182 can be coupled with CONTA171 and TARGE169
elements to define a contact pair. CONTA 172 and
TARGE 169 are known as contact pair elements.
CONTA 172 is defined at material top surface, where the
Figure 1. Typical load versus indentation depth plot from
nanoindentation.
Figure 2. Geometry of an indentation test.
Sådhanå (2018) 43:29 Page 3 of 15 29
indenter will be in contact, and the TARGE 169 is
defined at indenter bottom surface, where it will be in
contact with material.
3.1 Geometry of the model
The matrix dimension is assumed to be 25000 9
25000 nm2, which is large enough to remove the boundary
effects. A conical indenter of tip radius 1800 nm and apex
angle of 70.3� is modelled since it will have the same
projected area as that of a Berkovich indenter. One half
model of the matrix and the indenter are modelled for
computational efficiency. Symmetric boundary conditions
are applied to represent the full model. In order to acquire
localized deformation of the material, the mesh density
needs to be very high. However, to improve computational
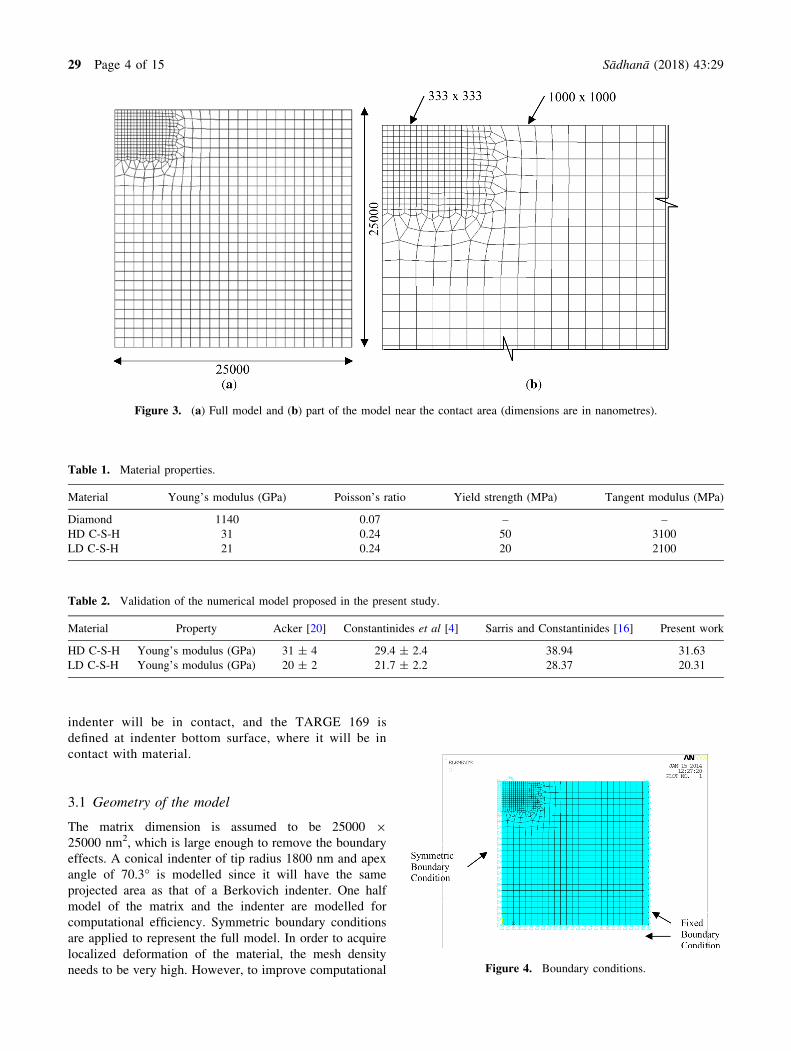
Figure 3. (a) Full model and (b) part of the model near the contact area (dimensions are in nanometres).
Table 1. Material properties.
Material Young’s modulus (GPa) Poisson’s ratio Yield strength (MPa) Tangent modulus (MPa)
Diamond 1140 0.07 – –
HD C-S-H 31 0.24 50 3100
LD C-S-H 21 0.24 20 2100
Table 2. Validation of the numerical model proposed in the present study.
Material Property Acker [20] Constantinides et al [4] Sarris and Constantinides [16] Present work
HD C-S-H Young’s modulus (GPa) 31 ± 4 29.4 ± 2.4 38.94 31.63
LD C-S-H Young’s modulus (GPa) 20 ± 2 21.7 ± 2.2 28.37 20.31
Figure 4. Boundary conditions.
29 Page 4 of 15 Sådhanå (2018) 43:29
efficiency, two different sizes of meshes are used. The mesh
near the contact area is made denser and that away from it
is made less dense. The mesh size near the contact area is
333 9 333 nm2 and away from it is 1000 9 1000 nm2 as
shown in figure 3.
3.2 Material properties
Diamond, which is used as the indenter, is modelled with
linear elastic isotropic property. The HD and LD C-S-H are
modelled using non-linear inelastic bilinear property. The
material properties used in this model are presented in
table 1.
The Young’s modulus and Poisson’s ratio are
obtained from the experimental data reported by Acker
[20] and Constantinides et al [4]. The yield strength of
C-S-H varies from 0.9% to 2% of elastic modulus and
the tangent modulus varies from 10% to 15% of elastic
modulus. The value of yield stress and tangent modulus
was varied between these ranges by trial and error
method to match the experimental results shown in
table 2.
3.3 Boundary conditions and loading
Symmetric boundary condition is applied around the axis
of symmetry, i.e., it is restricted from moving along the
lateral direction and allowed to move only in the vertical
direction. The nodes in the base of the matrix are com-
pletely fixed, i.e., they cannot move in any direction as
shown in figure 4. The test is carried out in displacement
control mode. It is applied in two stages: loading and
unloading. During the loading stage, the indenter is
indented into the specimen and during unloading stage, it
is brought back to its initial position. In both stages, the
displacement is applied in small steps at the rate of
loading of ±20 nm/s. The maximum depth of indentation
is 200 nm.
4. Results and discussion
The influence of the parameters like friction coefficient,
presence of pores at different locations and their distribu-
tion on the mechanical properties of HD and LD C-S-H has
been investigated.
4.1 Contact friction
The effect of contact friction between the material and the
indenter on the load–displacement behaviour of HD and LD
C-S-H has been investigated. Isotropic, Coulomb’s friction
model is used to model the contact friction in which the two
contacting surfaces can carry shear stress. According to this
model
s ¼ lP ð6Þ
where s is the shear stress, l is the coefficient of friction
and P is the contact normal pressure. The friction
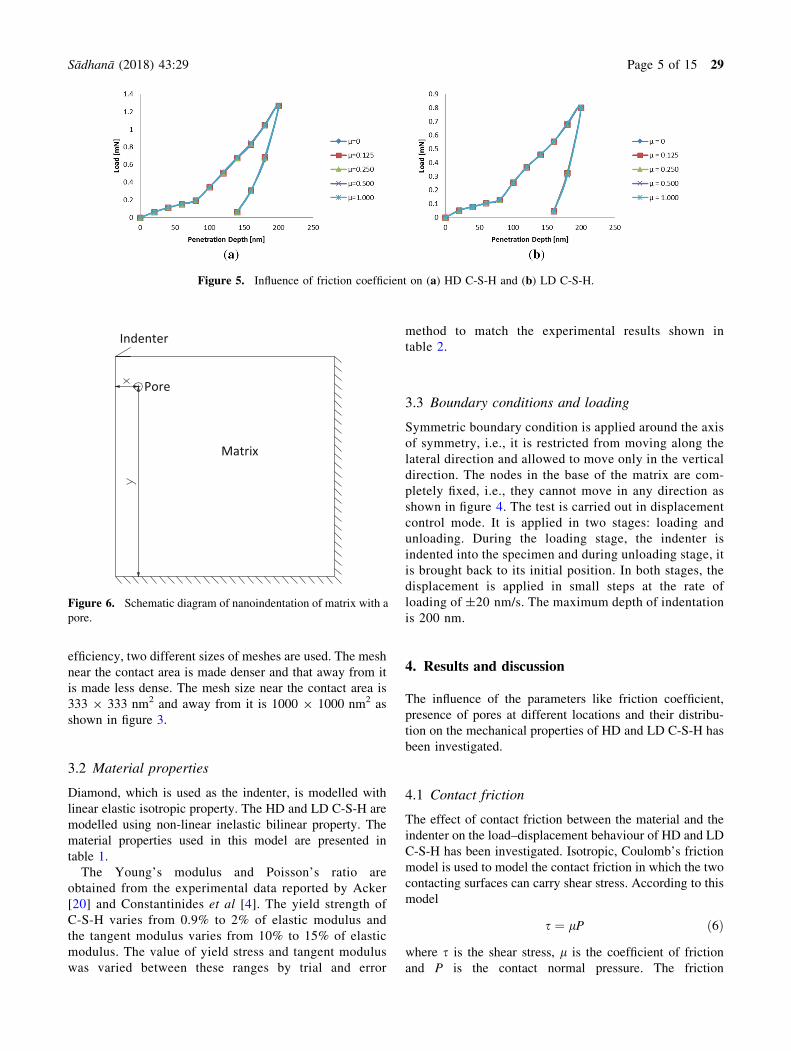
Figure 5. Influence of friction coefficient on (a) HD C-S-H and (b) LD C-S-H.
Indenter
Matrix
Pore
Figure 6. Schematic diagram of nanoindentation of matrix with a
pore.
Sådhanå (2018) 43:29 Page 5 of 15 29

coefficient is varied from 0 to 1 in both HD and LD C-S-H
and its effect on the load–displacement behaviour is
investigated. Figure 5a and b shows the influence of friction
coefficient on HD and LD C-S-H, respectively.
It can be found from the plots that the friction coefficient
does not play any significant role in the load–displacement
response of both LD and HD C-S-H. The mechanical
properties such as elastic modulus and hardness are derived
from the load–displacement response and are found to be
similar with different friction coefficients. Hence, in the
forthcoming studies, the coefficient of friction l = 0 is used
while defining the contact surfaces.
4.2 Presence of pores
The two major types of pores present in cement matrix are
the gel pores and capillary pores. The gel pores are of size
varying from 0.5 to 10 nm and they influence the creep and
shrinkage properties of the cement paste. The capillary
pores are of size varying from 5 to 5000 nm and influence
the strength and elasticity of cement paste [21]. In this
study, the influence of capillary pores on the mechanical
properties of C-S-H is investigated. The size of the pore is
assumed to be 500 nm (average size of capillary pore). A
single pore of this size is placed at different locations in LD
and HD C-S-H matrix. Though, in reality, pores exist
randomly in number and position, a single pore with con-
stant diameter is considered first in order to avoid any
interference effect between the pores and to omit the
superposed influence of various parameters such as distri-
bution and size of pores. Since, the computational model
was considered as a symmetric model, a pore located
exactly at the middle (centre of pore coinciding with the
indenter tip) is not considered in this study, as it over-
predicts the response on account of having only half the
pore in the simulation region. However, a case has been
considered where the edge of pore coincides with the
Figure 7. Contour plots of vertical deformation (all units in nm).
29 Page 6 of 15 Sådhanå (2018) 43:29

indenter tip. This case has been mentioned as ‘‘below
indenter’’ in the further sections. The pore is modelled by
removing the matrix material and assigning no material
properties. Figure 6 shows a schematic diagram of
nanoindentation being carried out on a matrix with pore.
The distance of the centre of pore from the centre of the
matrix is denoted as x and its distance from the bottom of
the matrix is denoted as y. Thus, the location of the pore is
represented in the coordinate system of (x,y). The influence
of location of pores on the mechanical properties of LD and
HD C-S-H is investigated. This notation is used throughout
the paper while mentioning the location of the pore.
To get a clear picture of the influence of pore on the
deformation pattern and stress-flow behaviour, contour
plots of deformation along vertical direction, variation of
stress along vertical direction and von Mises stress in LD
and HD C-S-H under maximum indentation position are
shown in figures 7, 8 and 9, respectively, for with pore and
without pore cases.
The influence of pores on the vertical deformation can be
observed from figure 7. It is found that there is no influence
on vertical spread of deformation zone due to the presence
of pores in both LD and HD C-S-H. Further, the horizontal
spread of deformation zone is increased by 37% in both
cases.
It can be seen from figure 8 that the vertical stress
distribution is affected due to the presence of pore. The
vertical stress zone is decreased up to 10.5% in vertical
direction and increased up to 21.5% in horizontal direc-
tion due to the presence of pore in LD C-S-H. However,
it is decreased up to 9.5% in vertical direction and
increased up to 34.7% in horizontal direction in HD C-S-
H. From these results it can be concluded that the vertical
spread is affected more in LD C-S-H whereas the hori-
zontal spread is affected more in HD C-S-H due to the
presence of pore.
The influence of pore on von Mises stress distribution
can be observed from figure 9. The presence of pore leads
Figure 8. Contour plots of vertical stress distribution (all units in GPa).
Sådhanå (2018) 43:29 Page 7 of 15 29

to under-prediction of the stress zone up to 11.5% in ver-
tical direction and 12.4% in horizontal direction in HD C-S-
H. In LD C-S-H, the presence of pore leads to under-pre-
diction of the stress zone by 13% in the vertical direction
and 18% in the horizontal direction. Unlike the vertical
stress distribution, the influence of pore on von Mises stress
zone is monotonic in both directions and more in LD C-S-
H. The load–displacement plots of HD and LD C-S-H with
pores at two different locations are shown in figures 10–13.
Table 3 shows the peak load, Young’s modulus and
hardness of HD C-S-H with pores at different locations and
the percentage difference of these properties with respect to
HD C-S-H without pore.
It can be observed from figures 10 and 11 and table 3
that there is a huge positional dependence of pores on
the mechanical properties like peak load, Young’s
modulus and hardness of HD C-S-H. For a pore with
rp/ri = 0.28 (radius of pore by radius of indenter)
located at d/D = 0.0464 (distance of pore from the
surface of the matrix to the depth of the matrix), the
mechanical properties are under-predicted by 35%.
Further, when d/D is increased to 0.072, the results are
Figure 9. Contour plots of von Mises stress distribution (all units in GPa).
Figure 10. Load–displacement curve of HD C-S-H with pore at
23200 level (in legend, initial digit shows the horizontal coordinate
of the pore).
29 Page 8 of 15 Sådhanå (2018) 43:29

Table
3.
Mechanical
properties
ofHD
C-S-H
withporesat
differentlocations.
Horizontaldistance
from
thecentreof
thematrix(nm)
Verticaldistance
from
thebottom
of
thematrix(nm)
Peakload
(mN)
Per.diff.w.r.t.no
pore
(%)
Young’s
modulus(G
Pa)
Per.diff.w.r.t.no
pore
(%)
Hardness
(MPa)
Per.diff.w.r.t.no
pore
(%)
1000
23200
0.596
14.98
27.12
14.27
716.66
15.12
1400
23200
0.623
11.12
27.84
11.99
751.91
10.95
1550
23200
0.638
9.02
29.01
8.27
766.97
9.16
600
23400
0.545
22.26
24.24
23.35
658.17
22.05
1000
23400
0.558
20.39
25.57
19.17
670.21
20.62
1200
23400
0.582
16.94
26.80
15.28
698.67
17.25
1300
23400
0.592
15.54
26.88
15.02
712.27
15.64
1400
23400
0.608
13.23
26.58
15.96
737.27
12.68
1600
23400
0.624
11.00
29.38
7.10
745.40
11.72
1650
23400
0.629
10.23
29.15
7.84
754.17
10.68
1000
23600
0.519
26.01
22.82
27.86
627.78
25.65
1200
23600
0.549
21.68
24.01
24.08
665.38
21.19
1300
23600
0.565
19.39
25.27
20.09
681.74
19.26
1400
23600
0.586
16.38
25.75
18.60
709.74
15.94
1500
23600
0.601
14.23
26.37
16.63
728.26
13.75
1600
23600
0.613
12.57
26.74
15.46
743.07
11.99
1700
23600
0.632
9.86
28.33
10.42
761.99
9.75
1000
23840
0.447
36.19
21.72
31.33
531.56
37.04
1300
23840
0.543
22.54
23.24
26.51
660.88
21.73
1400
23840
0.568
18.89
24.85
21.42
689.09
18.38
1500
23840
0.594
15.20
25.91
18.10
720.94
14.61
1600
23840
0.623
11.16
26.87
15.05
756.80
10.37
1800
23840
0.626
10.70
27.87
11.90
755.94
10.47
1850
23840
0.635
9.43
29.48
6.79
760.53
9.92
Sådhanå (2018) 43:29 Page 9 of 15 29

under-predicted only by 15%. A similar influence is
observed when a pore is located at a constant d/D but
varying horizontal distance. This shows that the position
of pore has a significant influence on the mechanical
properties of HD C-S-H.
The load–displacement plots of LD C-S-H with pores at
different locations are shown in figures 12 and 13. It can
also be observed from these plots that as the pore comes
closer to the indenter, the mechanical properties are
affected more, the same as in HD C-S-H, but the region of
influence is lesser in LD C-S-H compared with that of HD
C-S-H.
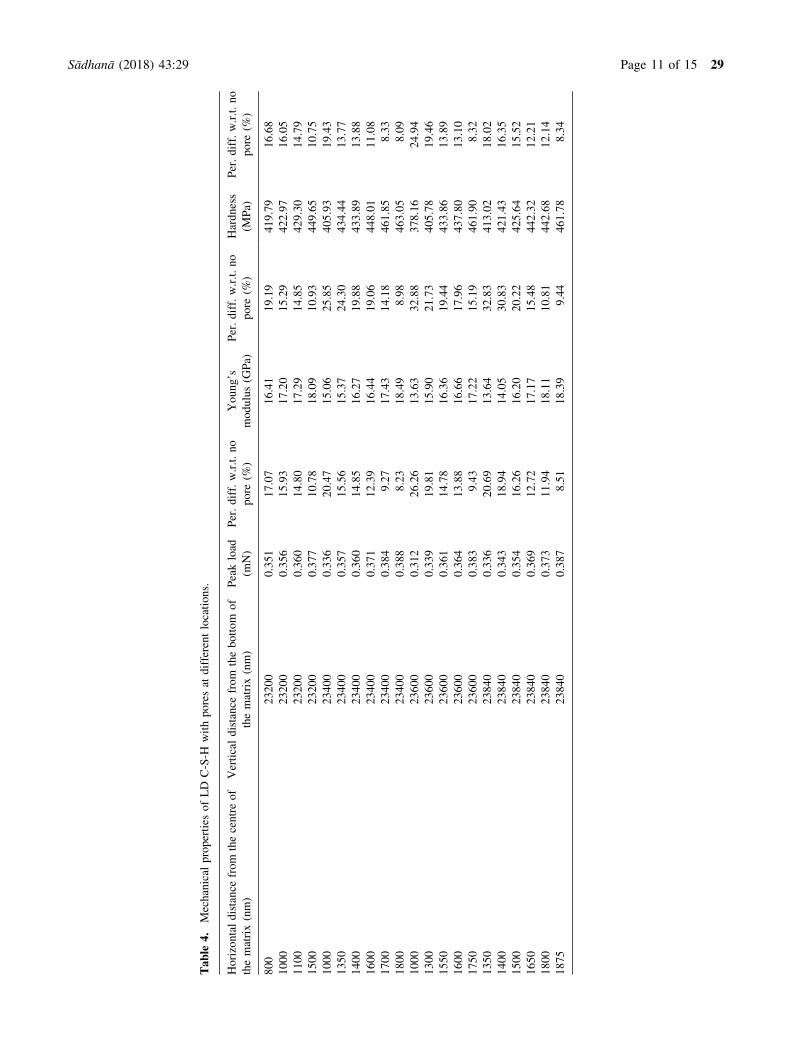
In order to understand the influence better, a
table (table 4) has been presented to show the percentage
difference in peak load, Young’s modulus and hardness of
LD C-S-H with pores at different locations with respect to
LD C-S-H without pore.
It can be observed from figures 12 and 13 and table 4
that the positional influence of pore on the mechanical
properties of LD C-S-H is of a similar extent as in HD C-S-
H.
From these investigations, it is evident that though
nanoindentation technique can capture the micro-mechan-
ical response of key phases of cement matrix very well, the
accuracy significantly depends on the substrate condition,
specifically, presence of pores. It is found that the presence
of pores in the stress influence zone considerably alters the
stress flow pattern. Smooth distribution of stress is replaced
by partial stress concentration due to the presence of pores.
Since nanoindentation is a highly sophisticated and sensi-
tive technique for mechanical characterization at lower
scales, it is required to understand the influence zones of
pores in heterogeneous cementitious matrix so that the
results obtained from such techniques can be used with a
calculated scattering in results.
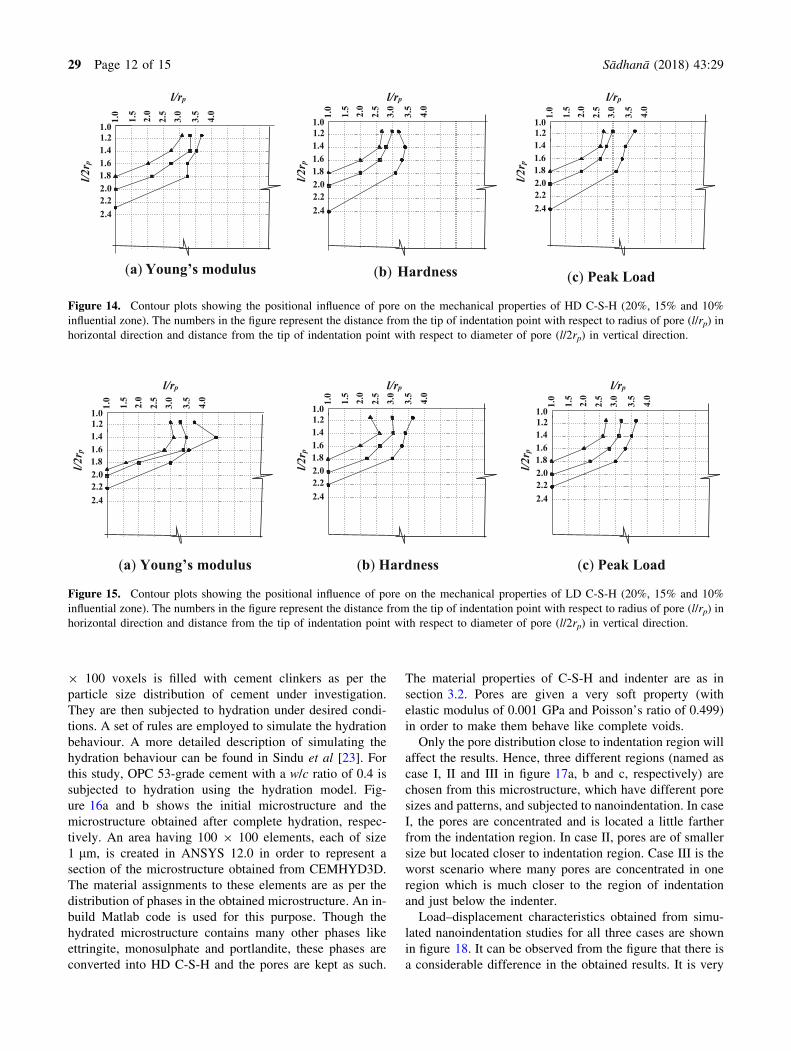
To meet this need, zones have been identified where the
presence of pores leads to under-prediction of the
mechanical characteristics and are termed as ‘‘influential
zones’’. Contour plots are presented showing the 20%, 15%
and 10% deviation in various mechanical responses such as
Young’s modulus, hardness and peak load in both LD and
HD C-S-H. Figures 14 and 15 show the contour plots
drawn at the top of the specimen, which is very close to the
indentation region. The numbers in the figure represent the
distance from the tip of indentation point with respect to
radius of pore in horizontal direction and distance from the
tip of indentation point with respect to diameter of pore in
vertical direction. It is clear from the figure that the pres-
ence of pore in the stress bulb region produced during
indentation causes very high influence in the response and
in all cases, viz., Young’s modulus, hardness and strength
(peak load), the influence of pore is qualitatively similar.
4.3 Distribution of pores
Though a single pore of spherical shape has been consid-
ered in the previous section for better understanding and to
prevent interference effect, this is a more idealistic sce-
nario. In order to understand the influence of pores in a
more realistic way, C-S-H matrix with pores is modelled
using a cement hydration model, CEMHYD3D [22]. In
CEMHYD3D, a computational volume of size 100 9 100
Figure 11. Load–displacement curve of HD C-S-H with pore at
23840 level (in legend, initial digit shows the horizontal coordinate
of the pore).
Figure 12. Load–displacement curve of LD C-S-H with pore at
23200 level (in legend, initial digit shows the horizontal coordinate
of the pore).
Figure 13. Load–displacement curve of LD C-S-H with pore at
23840 level (in legend, initial digit shows the horizontal coordinate
of the pore).
29 Page 10 of 15 Sådhanå (2018) 43:29
Table
4.
Mechanical
properties
ofLD
C-S-H
withporesat
differentlocations.
Horizontaldistance
from
thecentreof
thematrix(nm)
Verticaldistance
from
thebottom
of
thematrix(nm)
Peakload
(mN)
Per.diff.w.r.t.no
pore
(%)
Young’s
modulus(G
Pa)
Per.diff.w.r.t.no
pore
(%)
Hardness
(MPa)
Per.diff.w.r.t.no
pore
(%)
800
23200
0.351
17.07
16.41
19.19
419.79
16.68
1000
23200
0.356
15.93
17.20
15.29
422.97
16.05
1100
23200
0.360
14.80
17.29
14.85
429.30
14.79
1500
23200
0.377
10.78
18.09
10.93
449.65
10.75
1000
23400
0.336
20.47
15.06
25.85
405.93
19.43
1350
23400
0.357
15.56
15.37
24.30
434.44
13.77
1400
23400
0.360
14.85
16.27
19.88
433.89
13.88
1600
23400
0.371
12.39
16.44
19.06
448.01
11.08
1700
23400
0.384
9.27
17.43
14.18
461.85
8.33
1800
23400
0.388
8.23
18.49
8.98
463.05
8.09
1000
23600
0.312
26.26
13.63
32.88
378.16
24.94
1300
23600
0.339
19.81
15.90
21.73
405.78
19.46
1550
23600
0.361
14.78
16.36
19.44
433.86
13.89
1600
23600
0.364
13.88
16.66
17.96
437.80
13.10
1750
23600
0.383
9.43
17.22
15.19
461.90
8.32
1350
23840
0.336
20.69
13.64
32.83
413.02
18.02
1400
23840
0.343
18.94
14.05
30.83
421.43
16.35
1500
23840
0.354
16.26
16.20
20.22
425.64
15.52
1650
23840
0.369
12.72
17.17
15.48
442.32
12.21
1800
23840
0.373
11.94
18.11
10.81
442.68
12.14
1875
23840
0.387
8.51
18.39
9.44
461.78
8.34
Sådhanå (2018) 43:29 Page 11 of 15 29
9 100 voxels is filled with cement clinkers as per the
particle size distribution of cement under investigation.
They are then subjected to hydration under desired condi-
tions. A set of rules are employed to simulate the hydration
behaviour. A more detailed description of simulating the
hydration behaviour can be found in Sindu et al [23]. For
this study, OPC 53-grade cement with a w/c ratio of 0.4 is
subjected to hydration using the hydration model. Fig-
ure 16a and b shows the initial microstructure and the
microstructure obtained after complete hydration, respec-
tively. An area having 100 9 100 elements, each of size
1 lm, is created in ANSYS 12.0 in order to represent a
section of the microstructure obtained from CEMHYD3D.
The material assignments to these elements are as per the
distribution of phases in the obtained microstructure. An in-
build Matlab code is used for this purpose. Though the
hydrated microstructure contains many other phases like
ettringite, monosulphate and portlandite, these phases are
converted into HD C-S-H and the pores are kept as such.
The material properties of C-S-H and indenter are as in
section 3.2. Pores are given a very soft property (with
elastic modulus of 0.001 GPa and Poisson’s ratio of 0.499)
in order to make them behave like complete voids.
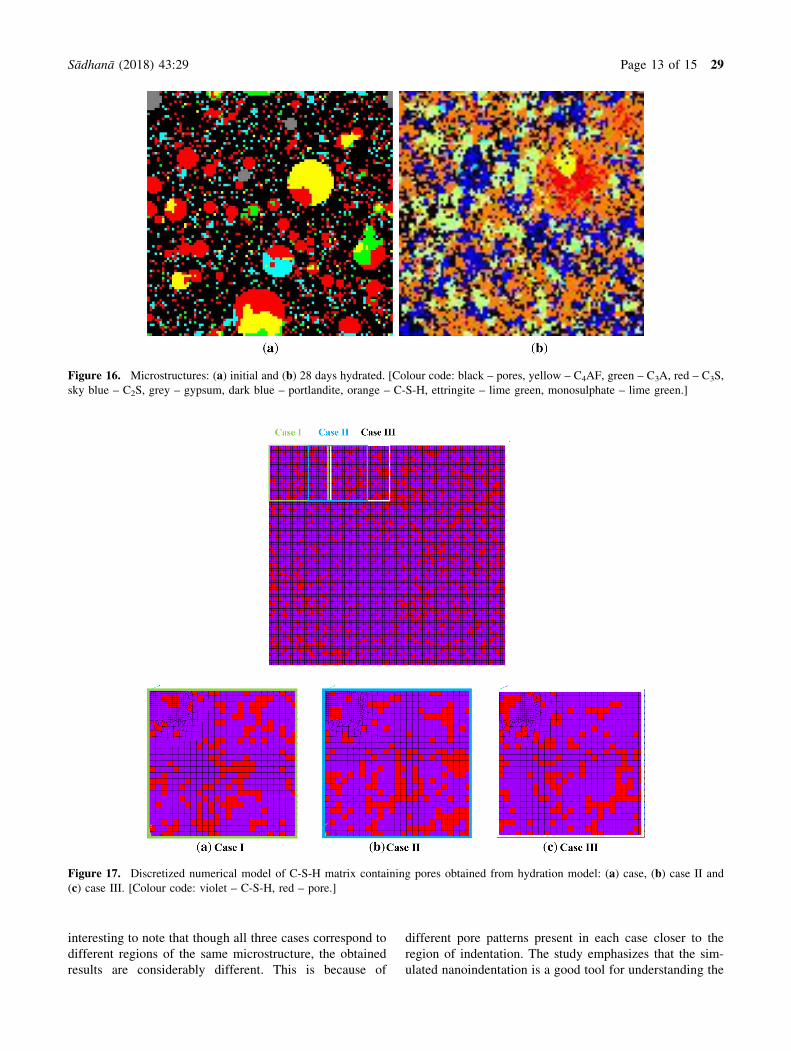
Only the pore distribution close to indentation region will
affect the results. Hence, three different regions (named as
case I, II and III in figure 17a, b and c, respectively) are
chosen from this microstructure, which have different pore
sizes and patterns, and subjected to nanoindentation. In case
I, the pores are concentrated and is located a little farther
from the indentation region. In case II, pores are of smaller
size but located closer to indentation region. Case III is the
worst scenario where many pores are concentrated in one
region which is much closer to the region of indentation
and just below the indenter.
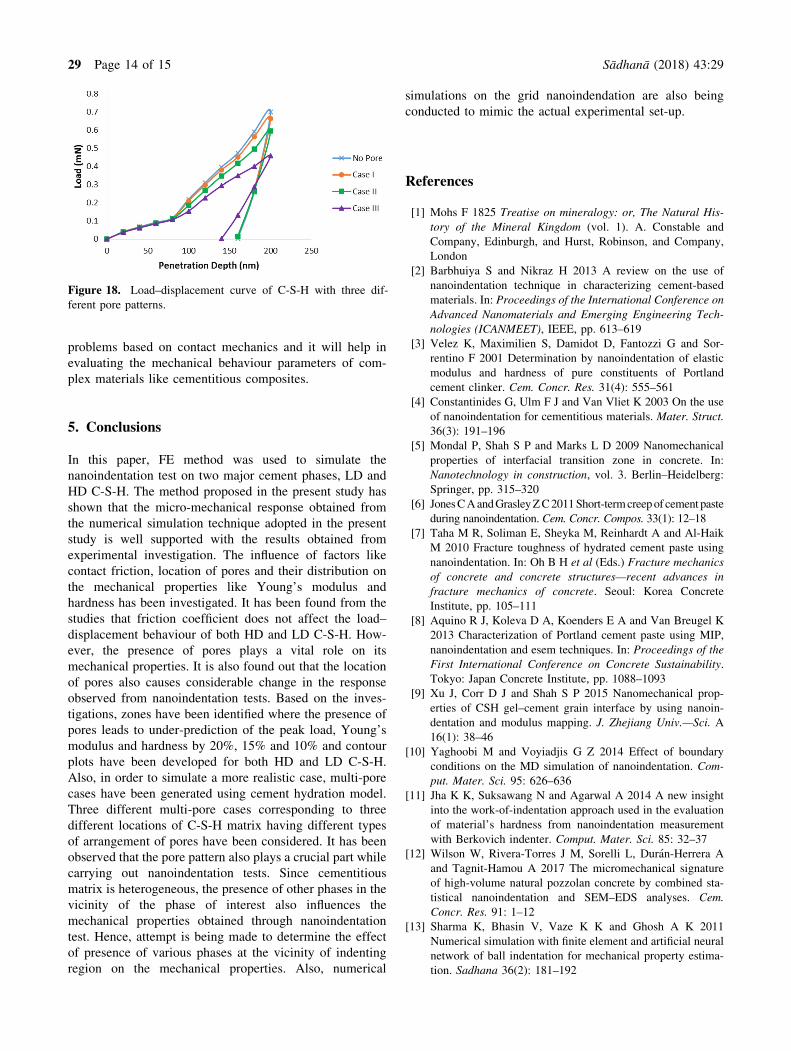
Load–displacement characteristics obtained from simu-
lated nanoindentation studies for all three cases are shown
in figure 18. It can be observed from the figure that there is
a considerable difference in the obtained results. It is very
(a) Young’s modulus (b) Hardness (c) Peak Load
l/rp
1.01.21.41.61.82.02.22.4
1.0
1.5
2.0
2.5
3.0
3.5
4.0
l/2r p
l/rp
l/2r p
1.01.21.41.61.82.02.22.4
1.0
1.5
2.0
2.5
3.0
3.5
4.0
1.01.21.41.61.82.02.22.4
1.0
1.5
2.0
2.5
3.0
3.5
4.0
l/rp
l/2r p
Figure 14. Contour plots showing the positional influence of pore on the mechanical properties of HD C-S-H (20%, 15% and 10%
influential zone). The numbers in the figure represent the distance from the tip of indentation point with respect to radius of pore (l/rp) in
horizontal direction and distance from the tip of indentation point with respect to diameter of pore (l/2rp) in vertical direction.
(a) Young’s modulus (b) Hardness (c) Peak Load
1.01.21.41.61.82.02.22.4
1.0
1.5
2.0
2.5
3.0
3.5
4.0
l/rp
l/2r p
l/rp
l/2r p
1.01.21.41.61.82.02.22.4
1.0
1.5
2.0
2.5
3.0
3.5
4.0
l/rp
l/2r p
1.01.21.41.61.82.02.22.4
1.0
1.5
2.0
2.5
3.0
3.5
4.0
Figure 15. Contour plots showing the positional influence of pore on the mechanical properties of LD C-S-H (20%, 15% and 10%
influential zone). The numbers in the figure represent the distance from the tip of indentation point with respect to radius of pore (l/rp) in
horizontal direction and distance from the tip of indentation point with respect to diameter of pore (l/2rp) in vertical direction.
29 Page 12 of 15 Sådhanå (2018) 43:29
interesting to note that though all three cases correspond to
different regions of the same microstructure, the obtained
results are considerably different. This is because of
different pore patterns present in each case closer to the
region of indentation. The study emphasizes that the sim-
ulated nanoindentation is a good tool for understanding the
Figure 16. Microstructures: (a) initial and (b) 28 days hydrated. [Colour code: black – pores, yellow – C4AF, green – C3A, red – C3S,
sky blue – C2S, grey – gypsum, dark blue – portlandite, orange – C-S-H, ettringite – lime green, monosulphate – lime green.]
Figure 17. Discretized numerical model of C-S-H matrix containing pores obtained from hydration model: (a) case, (b) case II and
(c) case III. [Colour code: violet – C-S-H, red – pore.]
Sådhanå (2018) 43:29 Page 13 of 15 29
problems based on contact mechanics and it will help in
evaluating the mechanical behaviour parameters of com-
plex materials like cementitious composites.
5. Conclusions
In this paper, FE method was used to simulate the
nanoindentation test on two major cement phases, LD and
HD C-S-H. The method proposed in the present study has
shown that the micro-mechanical response obtained from
the numerical simulation technique adopted in the present
study is well supported with the results obtained from
experimental investigation. The influence of factors like
contact friction, location of pores and their distribution on
the mechanical properties like Young’s modulus and
hardness has been investigated. It has been found from the
studies that friction coefficient does not affect the load–
displacement behaviour of both HD and LD C-S-H. How-
ever, the presence of pores plays a vital role on its
mechanical properties. It is also found out that the location
of pores also causes considerable change in the response
observed from nanoindentation tests. Based on the inves-
tigations, zones have been identified where the presence of
pores leads to under-prediction of the peak load, Young’s
modulus and hardness by 20%, 15% and 10% and contour
plots have been developed for both HD and LD C-S-H.
Also, in order to simulate a more realistic case, multi-pore
cases have been generated using cement hydration model.
Three different multi-pore cases corresponding to three
different locations of C-S-H matrix having different types
of arrangement of pores have been considered. It has been
observed that the pore pattern also plays a crucial part while
carrying out nanoindentation tests. Since cementitious
matrix is heterogeneous, the presence of other phases in the
vicinity of the phase of interest also influences the
mechanical properties obtained through nanoindentation
test. Hence, attempt is being made to determine the effect
of presence of various phases at the vicinity of indenting
region on the mechanical properties. Also, numerical
simulations on the grid nanoindendation are also being
conducted to mimic the actual experimental set-up.
References
[1] Mohs F 1825 Treatise on mineralogy: or, The Natural His-
tory of the Mineral Kingdom (vol. 1). A. Constable and
Company, Edinburgh, and Hurst, Robinson, and Company,
London
[2] Barbhuiya S and Nikraz H 2013 A review on the use of
nanoindentation technique in characterizing cement-based
materials. In: Proceedings of the International Conference on
Advanced Nanomaterials and Emerging Engineering Tech-
nologies (ICANMEET), IEEE, pp. 613–619
[3] Velez K, Maximilien S, Damidot D, Fantozzi G and Sor-
rentino F 2001 Determination by nanoindentation of elastic
modulus and hardness of pure constituents of Portland
cement clinker. Cem. Concr. Res. 31(4): 555–561
[4] Constantinides G, Ulm F J and Van Vliet K 2003 On the use
of nanoindentation for cementitious materials. Mater. Struct.
36(3): 191–196
[5] Mondal P, Shah S P and Marks L D 2009 Nanomechanical
properties of interfacial transition zone in concrete. In:
Nanotechnology in construction, vol. 3. Berlin–Heidelberg:
Springer, pp. 315–320
[6] JonesCAandGrasleyZC2011Short-termcreepof cement paste
during nanoindentation. Cem. Concr. Compos. 33(1): 12–18
[7] Taha M R, Soliman E, Sheyka M, Reinhardt A and Al-Haik
M 2010 Fracture toughness of hydrated cement paste using
nanoindentation. In: Oh B H et al (Eds.) Fracture mechanics
of concrete and concrete structures—recent advances in
fracture mechanics of concrete. Seoul: Korea Concrete
Institute, pp. 105–111
[8] Aquino R J, Koleva D A, Koenders E A and Van Breugel K
2013 Characterization of Portland cement paste using MIP,
nanoindentation and esem techniques. In: Proceedings of the
First International Conference on Concrete Sustainability.
Tokyo: Japan Concrete Institute, pp. 1088–1093
[9] Xu J, Corr D J and Shah S P 2015 Nanomechanical prop-
erties of CSH gel–cement grain interface by using nanoin-
dentation and modulus mapping. J. Zhejiang Univ.—Sci. A
16(1): 38–46
[10] Yaghoobi M and Voyiadjis G Z 2014 Effect of boundary
conditions on the MD simulation of nanoindentation. Com-
put. Mater. Sci. 95: 626–636
[11] Jha K K, Suksawang N and Agarwal A 2014 A new insight
into the work-of-indentation approach used in the evaluation
of material’s hardness from nanoindentation measurement
with Berkovich indenter. Comput. Mater. Sci. 85: 32–37
[12] Wilson W, Rivera-Torres J M, Sorelli L, Duran-Herrera A
and Tagnit-Hamou A 2017 The micromechanical signature
of high-volume natural pozzolan concrete by combined sta-
tistical nanoindentation and SEM–EDS analyses. Cem.
Concr. Res. 91: 1–12
[13] Sharma K, Bhasin V, Vaze K K and Ghosh A K 2011
Numerical simulation with finite element and artificial neural
network of ball indentation for mechanical property estima-
tion. Sadhana 36(2): 181–192
Figure 18. Load–displacement curve of C-S-H with three dif-
ferent pore patterns.
29 Page 14 of 15 Sådhanå (2018) 43:29

[14] Pelegri A A and Huang X 2008 Nanoindentation on soft
film–hard substrate and hard film–soft substrate material
systems with finite element analysis. Compos. Sci. Technol.
68(1): 147–155
[15] Yan W, Pun C L and Simon G P 2012 Conditions of applying
Oliver–Pharr method to the nanoindentation of particles in
composites. Compos. Sci. Technol. 72(10): 1147–1152
[16] Sarris E and Constantinides G 2012 Finite element modeling
of nanoindentation on C-S-H: effect of pile-up and contact
friction. Cem. Concr. Compos. 36: 78–84
[17] Asroun N and Asroun A 2013 The visco-elastic–plastic
behavior of cement paste at nanoscale. Int. J. Eng. Res.
Technol. 2(6): 1399–1405
[18] Oliver W C and Pharr G M 1992 An improved technique for
determining hardness and elastic modulus using load and
displacement sensing indentation experiments. J. Mater. Res.
7(6): 1564–1583
[19] Hertz H 1881 On the contact of elastic solids. J. Reine
Angew. Math. 92: 156–171, translated and reprinted in
English (1896) in Hertz’s miscellaneous papers, London:
Macmillan & Co, chapter 6
[20] Acker P 2001 Micromechanical analysis of creep and
shrinkage mechanisms. In: Ulm F J, Bazant Z P and Witt-
mann F H (Eds.) Creep, shrinkage and durability mechanics
of concrete and other quasi-brittle materials. Cambridge:
Elsevier
[21] Kumar R and Bhattacharjee B 2003 Porosity, pore size dis-
tribution and in situ strength of concrete. Cem. Concr. Res.
33(1): 155–164
[22] Bentz D P 1997 Three dimensional computer simulation of
Portland cement hydration and microstructure development.
J. Am. Ceram. Soc. 80(1): 3–21
[23] Sindu B S, Radha M and Saptarshi Sasmal 2016 Computa-
tional modelling of cement hydration to evaluate the
mechanical and transport properties. In: Proceedings of the
Structural Engineering Convention (SEC-2016), CSIR-
SERC, Chennai, 21st–23rd December, pp. 568–573
Sådhanå (2018) 43:29 Page 15 of 15 29