Embed Size (px)
Citation preview

Evaluation of New Home Energy EfficiencyAn assessment of the 1996 Fort Collins residential energy code and benchmark study of design, construction and performance
for homes built between 1994 and 1999.
Summary ReportJune 2002
City of Fort CollinsP.O. Box 580
Fort Collins, CO 80522
Fort Collins Utilities: www.fcgov.com/utilitiesFort Collins Building and Zoning: www.fcgov.com/building
City of Fort CollinsUtilities
The City of Fort Collins will make reasonable accommodations for access to City services, programs and activities, and will make special communication arrangements for persons with disabilities. Please call 221–6700 or TDD 224–6003 for assistance.
Acknowledgements
This study and report are the result of a team effort. Many thanks to all who contributed!
• Study participants
− Homeowners who participated in market research interviews and volunteered their homes for energy inspections and performance testing
− Builders who participated in market research interviews
• Funding
− Colorado Governor’s Office of Energy Management and Conservation− Fort Collins Utilities− Western Area Power Administration
• Contractors
− ENERGY SCORE raters: Jim Evenson, Dick Anderson, and Don Richmond (on-site energy efficiency inspections and home energy ratings)
− Boulder Design Alliance: Rob deKieffer (new construction inspections and completed home performance testing)
− Heschong-Mahone Group: Jon McHugh and Cathy Chappell (energy savings analysis)− RLW Associates: Ed Erickson and Ramona Peet (market research)
• City of Fort Collins staff
− Utilities: Doug Swartz (project manager and primary author); Shannon Turner, Holly Pierce and Josh Pluger (graphic design and production); Joan Gregerson, David Bullen and Eric Ruffel (data management and analysis)
− Building & Zoning: Felix Lee, Mike Gebo and Delynn Coldiron
• Report reviewers
− Steve Andrews, E-Star Colorado
− Patty Bigner, Fort Collins Utilities− Steve Byers, Energysmiths, Inc.− Greg Byrne, City of Fort Collins Community Planning and Environmental Services− Lori Clements-Grote, Fort Collins Utilities− Rob deKieffer, Boulder Design Alliance
− Megan Edmunds, E-Star Colorado
− Felix Lee, City of Fort Collins Building & Zoning− Gary Schroeder, Fort Collins Utilities− Lucinda Smith, City of Fort Collins Natural Resources Department− Wendy Williams, Fort Collins Utilities

Contents
Executive Summary ...................................................................................... 1
1 Introduction.................................................................................................... 5 1.1 Background....................................................................................................................5 1.2 Scope ...............................................................................................................................7 1.3 Methodology..................................................................................................................8 1.4 Data, Observations, Analysis ....................................................................................11 1.4.1 Data and Observations ....................................................................................11 1.4.2 Analysis..............................................................................................................12 1.4.3 Precision.............................................................................................................13 1.5 Reports..........................................................................................................................13 1.6 Perspectives .................................................................................................................14
2 Energy Code ................................................................................................. 15
2.1 Compliance Path Choices ..........................................................................................15 2.2 Compliance Rates........................................................................................................16 2.3 Construction Practices................................................................................................21 2.4 Implementation ...........................................................................................................22 2.5 Costs and Savings .......................................................................................................24
3 Design, Construction, Performance......................................................... 27 3.1 Design ...........................................................................................................................27 3.1.1 Solar Effects .......................................................................................................27 3.1.2 Architectural Features .....................................................................................29 3.2 Construction Practices and Quality Control ...........................................................31 3.3 Thermal Envelope.......................................................................................................34 3.3.1 Insulation and Air Sealing...............................................................................34 Insulation ...........................................................................................................34 Air Sealing..........................................................................................................36 Thermal Bypasses .............................................................................................38 3.3.2 Foundations.......................................................................................................42 Basements ..........................................................................................................42 Crawl Spaces .....................................................................................................44 Slabs-on-Grade..................................................................................................45 3.3.3 Framed Components .......................................................................................46 Floors ..................................................................................................................46 Frame Walls .......................................................................................................48 Attics and Cathedral Ceilings .........................................................................52 3.3.4 Windows and Skylights...................................................................................55
i

3.4 Mechanical Systems....................................................................................................59 3.4.1 Fireplaces ...........................................................................................................59 3.4.2 Water Heaters.....................................................................................................60 3.4.3 Forced-Air Heating and Cooling ...................................................................61 Control................................................................................................................62 Equipment .........................................................................................................63 Ductwork ...........................................................................................................67 3.5 Combustion Safety......................................................................................................76 3.6 Indoor Air Quality and Ventilation ..........................................................................80 3.7 Comfort.........................................................................................................................83 3.8 Energy Use and Cost ..................................................................................................88
4 Cooling .......................................................................................................... 91
4.1 Cooling Strategies .......................................................................................................91 4.2 Air Conditioning .........................................................................................................92 4.2.1 Market Issues ....................................................................................................92 4.2.2 Equipment, Design and Installation..............................................................92 4.2.3 Power Quality ...................................................................................................93 4.2.4 Operation...........................................................................................................93 4.2.5 Comfort..............................................................................................................93 4.2.6 Cost of Air Conditioning.................................................................................93 4.3 Electric Utility Impacts...............................................................................................94 4.3.1 Load Growth .....................................................................................................94 4.3.2 Summer Peak Timing.......................................................................................95 4.3.3 Revenue Shortfall .............................................................................................95 4.3.4 Transformer Overloads and System Sizing ..................................................96
5 Discussion..................................................................................................... 99 5.1 Is It There? . . . Does It Work? ....................................................................................99 5.1.1 Energy Code......................................................................................................99 5.1.2 Design, Construction and Performance ......................................................100 5.1.3 Themes ............................................................................................................101 5.1.4 Changing Practices .........................................................................................104 5.2 Root Causes................................................................................................................106 5.3 Energy Code Insights ...............................................................................................108 5.4 Significance ................................................................................................................109 5.5 Opportunities ............................................................................................................110 5.6 What’s Next?..............................................................................................................113 5.6.1 General Considerations .................................................................................113 5.6.2 Energy Code ....................................................................................................114 5.6.3 Other Regulatory Steps..................................................................................115
ii

5.6.4 Non-Regulatory Steps.................................................................................... 115 Building Awareness ....................................................................................... 115 Training............................................................................................................ 115 Tools for Builders............................................................................................ 116 Building Industry Services............................................................................ 116 Marketing Support ......................................................................................... 116 Air Conditioning Antidotes .......................................................................... 117 Home Energy Ratings.................................................................................... 117 New Home Certification Program............................................................... 118 Central Data Archive .....................................................................................123 Existing Homes...............................................................................................123 5.6.5 Further Research .............................................................................................123
Glossary........................................................................................................125
iii

Executive SummaryThis report summarizes the findings of the City of Fort Collins study of homes built between 1994 and 1999. The study was conducted to evaluate the City’s 1996 energy code (implementation experience, compliance rates and energy-saving results), provide benchmark data about new home design, construction and performance, and to learn more about residential air conditioning practices and impacts. The focus of the study was energy efficiency. However, because homes operate as systems, the study also addressed related aspects of health and safety, comfort and durability.
Methodology
The major components of the study were inspections of 20 homes under construction; market research interviews with 20 builders and 150 homeowners; energy inspections, energy modeling and utility bill analysis for 80 completed homes; and performance testing of 40 completed homes. Samples were randomly selected, representing single-family homes built both before and after the code change.
Energy Code
Most builders chose to use the traditional, fully prescriptive compliance path to meet the 1996 code. However, growing numbers of builders have made use of a blower-door testing option to document air sealing compliance or have used the systems analysis path to document code compliance.
Code compliance rates varied widely for individual component requirements, from a high of 92% for basement wall insulation to a low of zero for “substantially airtight” ductwork. The most significant code-driven changes in construction practices were insulated basements, “warm” crawl space designs, and improvements in air sealing and insulation practices.
Implementation issues included positive builder response to City support efforts in the period following the code change, but concern that ongoing training was not offered after 1997; inconsistent code enforcement during the period in which the post-group study homes were built; questions about documentation that builders were required to submit; systems analysis path details; and experience with performance testing based on blower-door tests. The most challenging areas of the code revisions for builders and the City’s Building and Zoning Department alike appeared to be air sealing, insulation installation and “wall assembly” requirements.
Measured annual energy savings resulting from the 1996 code changes averaged 175 therms of natural gas per home, about half of what had been estimated before the code changed. The corresponding dollar value of the savings ranged from $77 to $158 per year, based on the extremes of the volatile natural gas rate from 1999 through 2001. Code-related increases in sales price for typical new homes were estimated at $1,000 to $1,500. The benefit-to-cost comparison is very sensitive to assumptions, with breakeven points for buyers ranging from about one year to 30 years.
Executive Summary
1

Design, Construction, Performance
Data and observations about design and construction practices, and resulting performance, were broad-ranging. Key points include:
• Architectural design. The study made observations in two areas of architectural design. The first related to the sun; it appeared that solar effects were not considered in new home design. Second, certain architectural features were noted to require special attention in order to avoid construction flaws, comfort problems and customer complaints. These features were present in many study homes and were associated with numerous problems.
• Construction practices and quality control. Construction practices varied widely, particularly in the details. The number of recurring construction flaws and performance problems that were observed in many homes, along with a small number of more significant flaws, raised questions about the effectiveness of quality control procedures.
• Insulation and air sealing. Insulation meeting code R-value requirements was typically present. Installation practices varied widely, with predictable problem areas. Study homes were moderately tight, with measured air leakage averaging 5.1 ACH50. Post-group homes were somewhat tighter than pre-group homes. Tightness of the full sample varied by a factor of more than four. Many leakage areas were observed, including thermal bypasses that compromised insulation performance.
• Basements. Basements were the dominant foundation type in the study homes. As a result of the code change, almost all post-group basements were insulated, typically with R-11, vinyl-faced fiberglass blankets fastened to the interior side of the basement wall. Insulated basements were four degrees Fahrenheit warmer, on average, than uninsulated basements. Homeowners typically felt that insulation increased basement comfort, saved energy and was a good investment. Some builders were skeptical that the energy savings justified the added cost.
• Crawl spaces. Crawl spaces in post-group homes were universally “warm” or “heated” design, and zonal pressure testing illustrated that these were the only practical design alternatives. The most significant crawl space issue involved problems with insulation; about 25% of post-group crawl spaces did not meet code R-value requirements and 50% had serious insulation installation flaws.
• Slabs-on-grade. Though none of the study homes had a full slab-on-grade foundation, 12% had walkout basements, meaning part of the slab was on-grade. None of the on-grade slab edges was insulated, a code violation in post-group homes.
• Floors. Cantilevered floors and floors above garages were both predictable problem areas, with poorly-defined air barriers, insulation installation flaws and thermal bypasses.
• Frame walls. Almost all frame walls were conventionally framed, 2x4 walls. Post-group homes exhibited increasing use of selected advanced framing details. Wall cavities were almost always filled with R-13 batt insulation; about 70% of the also homes incorporated some foam sheathing, for which coverage varied widely. Knee walls to attic space were rarely sheathed.
• Attics and cathedral ceilings. About 25% of attics fell somewhat short of code R-value requirements. A variety of insulation installation details were often not executed according to the code requirements. In many homes, significant air leakage connections existed between the conditioned space and the attic.
Executive Summary
2

• Windows and skylights. The average study home had about 10% window area compared with floor area. Almost all homes used conventional, uncoated double glazing; two of 80 completed homes used low-e windows. On the main levels, all windows had either wood or vinyl frames. In the basement, most homes used metal-framed windows. The use of vinyl frames increased on all levels from pre- to post-group. Windows were the source of a number of problems reported by homeowners, including zonal comfort complaints, glare, condensation and fabric fading.
• Fireplaces. Fireplaces, found in 83% of the study homes, were all natural-gas fired. About two-thirds of fireplaces were direct-vent design, taking combustion air directly from outdoors; the rest were atmospherically vented, relying on indoor air for combustion. Fireplace use varied widely. About one-quarter of homeowners complained about winter discomfort in the vicinity of the fireplace.
• Water heaters. Almost all study homes used conventional, atmospherically vented, gas-fired storage tank water heaters. Though most units were at or just above the minimum efficiency permitted by federal standards, there was a trend of increasing efficiency from pre- to post-group. About 80% of post-group homes did not incorporate code-prescribed provisions to control standby heat loss from piping in the vicinity of the water heater.
• Heating and cooling systems. Almost all study homes used forced-air gas heating; half had a central air conditioner sharing the furnace air handler, ductwork and furnace. Homeowners reported a number of problems related to heating and cooling systems, particularly with regard to comfort.
• Heating and cooling control. All but two of 80 study homes used single-zone control. This simple control strategy had inherent problems meeting comfort needs in the many homes that behaved more like multiple zones.
• Heating and cooling equipment. Equipment exceeding federal minimum efficiency standards was present in only a few study homes. Excessive oversizing was observed for 70% of study home furnaces and every study home air conditioner. One-quarter to one-half of the equipment was operating out of specification for external static pressure, furnace heat rise or air flow.
• Heating and cooling ductwork. Supply ductwork consisted of sheet metal plenums and branch runs, while return ductwork relied on a combination of sheet metal and building cavities. Supply registers were not distributed proportionally to loads on different levels. Constrictions and duct leaks were observed. In almost all study homes, duct sealing was limited to cloth duct tape on a subset of the supply joints; the return side was unsealed. Measured duct leakage was very high in comparison to any standards. There was no relationship between heating and cooling loads in different rooms and air flow to or from those rooms. Return flows from upper level rooms in many two-story homes were very small.
• Combustion safety. Carbon monoxide measurements found few problems, with the exception of one furnace and all of the gas ovens. Almost all homes had at least one gas appliance that was atmospherically vented and therefore susceptible to backdrafting in a negative pressure environment. Under test conditions, about one-third of the basements were depressurized to levels that raised concerns about safe combustion appliance operation. Code-required combustion air ducts had little effect on basement pressure. Two water heaters and four fireplaces were observed to spill combustion products into the home; in all these cases, problems appeared to be due to appliance design and venting problems rather than to depressurization. A summary observation was that typical design and construction practices did not provide confidence about combustion safety.
Executive Summary
3
1.1 Background
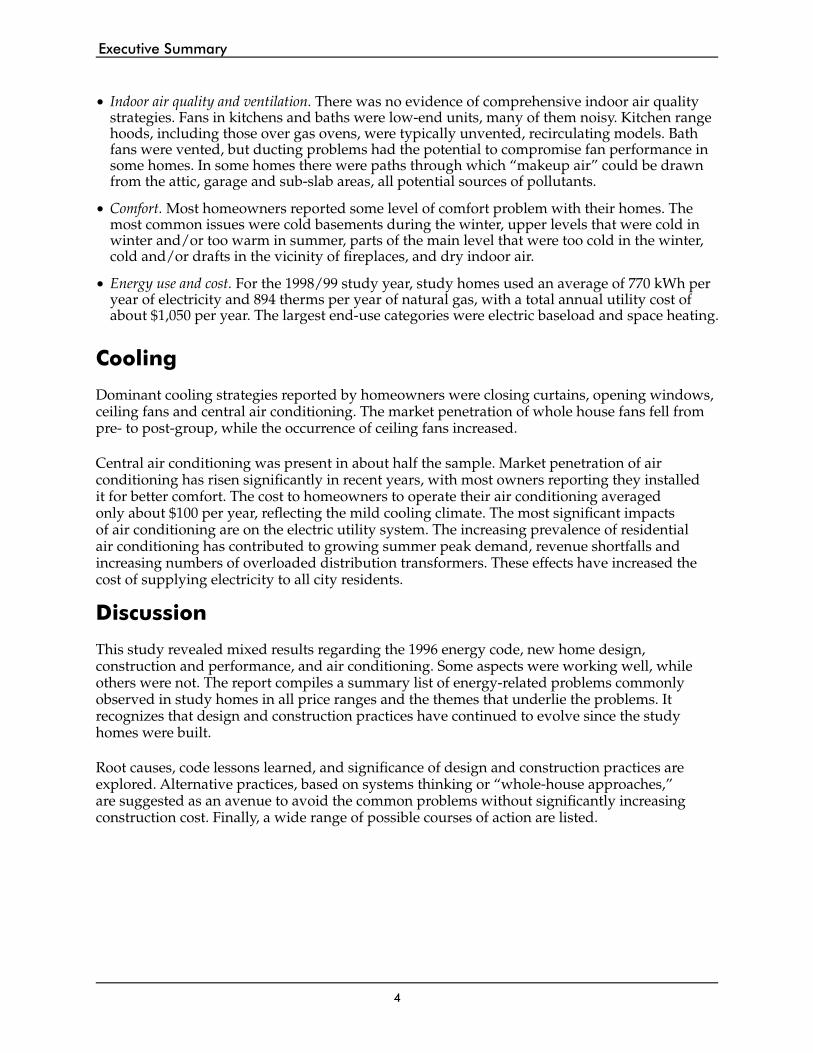
• Indoor air quality and ventilation. There was no evidence of comprehensive indoor air quality strategies. Fans in kitchens and baths were low-end units, many of them noisy. Kitchen range hoods, including those over gas ovens, were typically unvented, recirculating models. Bath fans were vented, but ducting problems had the potential to compromise fan performance in some homes. In some homes there were paths through which “makeup air” could be drawn from the attic, garage and sub-slab areas, all potential sources of pollutants.
• Comfort. Most homeowners reported some level of comfort problem with their homes. The most common issues were cold basements during the winter, upper levels that were cold in winter and/or too warm in summer, parts of the main level that were too cold in the winter, cold and/or drafts in the vicinity of fireplaces, and dry indoor air.
• Energy use and cost. For the 1998/99 study year, study homes used an average of 770 kWh per year of electricity and 894 therms per year of natural gas, with a total annual utility cost of about $1,050 per year. The largest end-use categories were electric baseload and space heating.
Cooling
Dominant cooling strategies reported by homeowners were closing curtains, opening windows, ceiling fans and central air conditioning. The market penetration of whole house fans fell from pre- to post-group, while the occurrence of ceiling fans increased.
Central air conditioning was present in about half the sample. Market penetration of air conditioning has risen significantly in recent years, with most owners reporting they installed it for better comfort. The cost to homeowners to operate their air conditioning averaged only about $100 per year, reflecting the mild cooling climate. The most significant impacts of air conditioning are on the electric utility system. The increasing prevalence of residential air conditioning has contributed to growing summer peak demand, revenue shortfalls and increasing numbers of overloaded distribution transformers. These effects have increased the cost of supplying electricity to all city residents.
Discussion
This study revealed mixed results regarding the 1996 energy code, new home design, construction and performance, and air conditioning. Some aspects were working well, while others were not. The report compiles a summary list of energy-related problems commonly observed in study homes in all price ranges and the themes that underlie the problems. It recognizes that design and construction practices have continued to evolve since the study homes were built.
Root causes, code lessons learned, and significance of design and construction practices are explored. Alternative practices, based on systems thinking or “whole-house approaches,” are suggested as an avenue to avoid the common problems without significantly increasing construction cost. Finally, a wide range of possible courses of action are listed.
Executive Summary
4
1.1 Background
1 IntroductionA home is the biggest investment most people make. Should a new home be:
• Energy efficient?
• Safe and healthy for occupants?
• Comfortable?
• Durable?
Ask any audience and the response will likely be “Yes” on all counts.
Do new Fort Collins homes meet these criteria? What role does the City of Fort Collins’ energy code play in this regard? These key questions are addressed in this study.
1.1 Background
In mid-1996, City of Fort Collins implemented a new energy code for buildings. For the first time, the code provided entirely separate regulations for residential and non-residential buildings. The residential energy code is based on the 1995 edition of the national Model Energy Code (published by the Council of American Building Officials), with a number of local amendments. See page 6 for notable features of the 1996 code. Passage of the new code was accompanied by a commitment from City staff to complete three related pieces: (1) a “builder’s guide” that illustrated the code requirements and recommended practices for energy-efficient construction; (2) builder and subcontractor training on these same topics; and (3) a comprehensive evaluation of new homes built before and after the implementation of the 1996 energy code.
The Builder’s Guide to Energy Efficient Home Construction was published in 1997 and adapted to the World Wide Web in 1998. Extensive training was offered for the building industry in 1996 and 1997. The City sponsored two series of six workshops, two hours to a full day each, with time spent in the classroom, on construction sites and in completed homes. Evaluation data was collected in 1999, and this report summarizes the results.
These tasks were managed by staff from two City departments: Utilities and Building and Zoning (B&Z). Funding for the new home study was provided by the Colorado Governor’s Office of Energy Management and Conservation, Fort Collins Utilities, and Western Area Power Administration.
The Fort Collins Builder’s Guide was developed to illustrate 1996 code requirements and recommended building practices. It is available both in hard copy and on the Web.
Introduction
5

7
Introduction
1996 Residential Energy Code Changes
The significant changes from typical building practice of the early 1990s to the 1996 code requirements were:
• Basement wall insulation;
• Perimeter insulation for slab-on-grade floors;
• New approaches to crawl space design;
• A “wall assembly” requirement that could be met through many combinations of wall insulation, window and door areas and U-values;
• Increased emphasis on careful insulation installation, with details spelled out in the Insulation Guidelines;
• More specific air sealing requirements, met either by following a detailed prescriptive Air Sealing Checklist or by demonstrating air tightness through a “blower-door test” on the completed home;
• “Disclosure forms” that provide documentation of products and construction practices in the areas of air sealing, insulation and mechanical systems, and certification that work was performed according to code.
Other local amendments to the 1995 Model Energy Code included:
• More stringent requirements for certain components in electric-heated homes than in natural gas-heated homes;
• Less stringent requirements for certain components:
− The wall assembly thermal requirement for gas-heated homes was relaxed by 10%;− Cathedral ceiling thermal requirements were relaxed by about 20%;− The requirement to seal all ductwork with mastic was relaxed to apply only to
ductwork passing through unconditioned spaces, and− Skylights were allowed without a corresponding increase in roof/ceiling insulation.
Builders could choose to comply with the new code via either a traditional “prescriptive” path (requiring that each component meet a minimum standard) or a “systems analysis” path (requiring that the house as a whole meet a standard, as documented by an energy rating).
1.1 Background 6
Introduction

7
Introduction
1.2 Scope
The scope of this study included:
• Energy code. Documentation of implementation experience related to the 1996 code, compliance rates, cost changes and measured energy savings. This information provides direct feedback on the code change and may suggest ways to make the code more effective in the future.
• Benchmark data. Documentation of new home design, construction and performance. When the last round of energy code changes was developed in the early 1990s, very little local data existed on many residential energy-related issues. Data from other climate zones and limited Colorado data sometimes did not provide a sufficient basis to make decisions. The comprehensive data from this study provides a springboard for the future, enabling more informed decisions and a benchmark against which to measure future changes.
• Air conditioning. Initial characterization of residential air conditioning market penetration and impacts. Residential air conditioning has been on the rise in Fort Collins, but few details were known about it. The study provided an opportunity to gather a limited data set and increase understanding, enabling the municipal electric utility to consider the impact of residential air conditioning on utility planning, operation and revenues.
The focus of the study was energy efficiency. However, because houses operate as systems, the study also addressed related aspects of health and safety, comfort and durability.
Homes are complex systems of individual components that together determine performance. Design and construction practices affecting energy efficiency often impact health and safety, comfort and building durability as well.
1.2 Scope

9
Introduction
1.3 Methodology
As the figure on page 9 illustrates, a multi-pronged approach was used to try to understand the issues from a variety of perspectives.
The major components of the study were:
1. Homes under construction. Twenty homes were inspected at a single phase of construction, just prior to or just after insulation was installed. Inspections were conducted by a private, third-party inspector with specialized expertise in energy performance. Each inspection lasted about one hour. This allowed data to be gathered on framing, windows, air sealing, insulation, ductwork and exhaust fan venting practices. These inspections were performed in January and February 1999. Homes were selected from B&Z’s regular inspection list on the days when the study inspector was available, with a conscious attempt to gather data on a representative range of housing stock. The 20 homes on which specific data were recorded represented 13 builders, most of whom would be characterized as medium- to high-volume builders. The study inspector also informally surveyed another 15 homes under construction, to confirm that the formal sample was representative.
Two Questions
This evaluation centered on two questions:
Q #1: “Is it there?”This is the question that has traditionally been asked regarding home energy efficiency. It represents the prescriptive, component-based approach reflected in most building codes.
Examples:
• Have sealants been applied at all required locations?
• Is the furnace efficiency rated at 78%?
• Does the house meet code?
Q #2: “Does it work?” This question has been asked less often. It focuses on actual installed performance (versus rated performance) and results. It can be asked about components, subsystems, and the house as a whole system. Examples:
• How tight is the house?
• Has the furnace been installed, tested and adjusted so that it operates at rated efficiency?
• Does the house perform well? Is it energy-efficient, comfortable, safe and durable?
Is it there? The average new Fort Collins home has 18 heating/cooling supply registers.
Does it work? Do these registers supply appropriate amounts of conditioned air to keep the house comfortable?
Introduction
81.3 Methodology

9
Introduction
2. Builder interviews. Phone interviews were conducted with 20 general contractors building in Fort Collins. These qualitative interviews, conducted in January 1999, were based on an open-ended set of questions, encouraged dialogue between the interviewer and the builder, and were designed to last about 30 minutes. Topic areas included compliance path choices, perceptions about energy code information and support provided by the City, changes in building materials and practices in response to the energy code change, cooling strategies and air conditioning, and customer interest in energy efficiency. The sample of builders selected for these interviews was stratified based on the volume of homes produced, so that small-, medium- and large-volume builders were all represented.
3. Homeowner interviews. Phone interviews were conducted with 150 owners of recently built homes. (See information below regarding sample selection.) These quantitative interviews, conducted in January 1999, lasted about 15 minutes. All homeowners were asked the same structured set of questions. Major topic areas included the role that energy efficiency played in the home purchase process, energy features in the home, comfort, problems experienced in the home, basement insulation and cooling strategies.
4. Completed home inspection and modeling. Evaluation of 80 completed homes included on-site energy ratings, utility billing analysis, and detailed energy modeling of code-related savings. (See information below regarding sample selection.) These tasks began with site visits by ENERGY SCORE raters that lasted two to three hours, conducted from February through June 1999 (most inspections took place February through April). In addition to basic energy rating data, the raters collected information on changes to the house since it was initially built, window shading, insulation installation practices (in places where insulation was visible), moisture sources and signs, combustion air ducts, ventilation equipment, locations of heating and cooling registers, appliances, thermostat schedules, interior temperatures and humidities, and customer perceptions of comfort. They also conducted a blower-door test to quantify air leakage. Electric and natural gas billing histories for these homes was collected for a 12-month period, from May 1998 through April 1999. Detailed descriptions of the homes and their utility consumption history were used to evaluate the savings resulting from the code change.
SF-1
Homes underconstruction
Inspection20
Phoneinterviews
20
2
Builders
Homeowner phoneinterviews
150
1
3
4
Inspect +utility analysis
80
5
Performancetest40
Completedhomes
Pre-group = builtbefore code change
Post-group = builtafter code change
Study Samples and Components
A multi-pronged approach was used to try to understand the issues from a variety of perspectives.
1.3 Methodology

10
Introduction
5. Completed home performance testing. On-site performance testing was conducted in 40 completed homes. See information below regarding sample selection. This work was conducted from March through June 1999 (most testing took place in March and April). The testing contractor spent about half a day at each home, collecting data and making observations regarding air leakage, heating and cooling equipment performance, duct leakage and flow, zonal pressure balance, and combustion safety. The testing contractor often heard from owners about concerns with their homes.
The 150-home homeowner interview sample, for step #3 above, was randomly selected based on B&Z records of issue dates for building permits and Certificates of Occupancy. The sample was split evenly between a “pre-group” built before the code change (homes completed May 1995 to May 1996) and a “post-group” built after the code change (homes completed March 1997 to March 1998). The range of dates set for the post-group balanced two needs: first, early enough so that a full year of utility billing history would be available for analysis by mid-1999; second, late enough to avoid the earliest learning curve with the new code.
The 150 homeowners interviewed during the market research phase were asked whether they would volunteer their homes for the on-site inspections and performance testing in steps #4 and #5 above; 128 owners agreed. The 80-home completed home sample was randomly selected from that group, again split evenly between pre- and post-group homes. This sample included homes built by 41 different builders.
The 40-home performance testing sample was selected as a subset of the 80-home sample, again split evenly between pre- and post-group homes. The only criterion for this sample that was not random was that all homes had air conditioning. This sample included homes built by 27 different builders.
The study evaluated single-family housing. The 80-home sample included both detached housing (about 90% of the sample) and attached townhome units (about 10%). All were heated with natural gas. Conditioned floor areas of sample homes (including the basement) varied from 1108 to 8801 square feet, averaging 3060 square feet. They represented a wide range of sales prices. Both production and custom housing were included. The project team felt that the study homes were a good representation of Fort Collins housing being built during the sample time periods.
The samples did not include any homes built using non-mainstream building systems (such as insulated concrete forms or structural-insulated-panel construction) or any intentionally designed solar homes. These exclusions were not by design; they were a result of the random sampling process.
No homes in any of the samples were chosen based on any advance knowledge of problems or homeowner complaints.
The major data collection tasks and some of the analysis were performed by technicians and consultants under contract to the City. The remaining analysis and synthesis work was completed by City staff.
1.3 Methodology

10
Introduction
1.4 Data, Observations, Analysis
This study examined many components and systems from several different perspectives. Some comments are in order about the quantity and reliability of the data and observations.
1.4.1 Data and Observations
Different depths of data were collected for different subsets of homes because, as noted in the previous section, the size of the samples varied for different parts of the study. For example, in the nested sample of completed homes, all 150 homes yielded market research data. In 80 homes, the market research data was supplemented with an inspection by an energy rater. The 40 performance-tested homes provided a third level of data.
These increasing depths of data sometimes led to different conclusions. An example is the comfort issues reported by homeowners. As part of the phone interview, market researchers asked homeowners a structured set of questions about comfort. Based on that information, energy raters visiting the house had the opportunity to ask more focused questions about the market research comfort responses. The homeowner sometimes raised additional issues that hadn’t been mentioned in the phone interview. The testing contractor, during the site visit, sometimes heard about additional comfort issues that hadn’t been previously discussed with either the market research interviewer or the energy rater. It became clear that the extent of comfort issues identified during the phone interview was under-reported.
Even in a given sample, it was not always possible to collect a complete data set in every home. This was due to a variety of reasons. Examples:
• Homes under construction
− Building sites were visited at a variety of stages of construction. In some homes, particular items had either not been completed or had been covered by building materials by the time the inspector visited.
− Not every feature the study examined was present in every home (e.g. cantilever floors, cathedral ceilings, fireplaces on exterior walls).
• Completed homes
− Resource constraints limited each performance testing visit to about half a day. Detailed data could not be collected on every item in this amount of time. For example, it was not possible to do a complete inventory of individual air leaks; the testing contractor had time to do a quick survey and note some of the most obvious leaks.
− The scope of work for testing did not include measurements of air flow at every supply and return register in every home. The testing contractor typically measured flows at a few registers, focusing on parts of the home in which the homeowner had reported comfort problems. Flows at every register were measured in about a quarter of the performance-tested homes.
− Weather sometimes limited the data that could be collected. Infrared scanning could only be performed when outdoor temperatures were 40 degrees Fahrenheit or below. High wind conditions made it impossible to collect zonal pressure data in some homes (used to evaluate coupling between the house and buffer spaces, duct leakage to outdoors and combustion zone pressures).
1.4 Data, Observations, Analysis11
Introduction

12
Introduction
13
Introduction
− Not every feature was present in every home (e.g. gas stoves, skylights, crawl spaces).− It was not possible to directly examine every feature of interest due to finish materials. For
example, energy raters had to make their best estimate of insulation R-values in closed cavities such as walls and floors above garages. Sometimes insulation certificates left by the contractor or specifications on a set of building plans were available. Some cantilevers were blocked, obscuring a view of the insulation; others were not. It was not possible to do a visual inspection of the air barrier and insulation in the cavity surrounding a fireplace.
Certain types of data are inherently more difficult to quantify than others. Examples of challenges include:
• Insulation installation practices. The energy code’s Insulation Guidelines are quite specific and rigorous. Had insulation practices been judged based on the letter of the guidelines, insulation in most components in most homes would have failed to comply. The attempt was made instead to judge insulation practices based on the intent of the guidelines; i.e. was insulation installed in a way that it would deliver its rated performance? In a particular home this assessment was often complicated by varying installation practices in different parts of the home.
• Comfort. This study did not use a rigorous set of criteria to determine whether or not a particular comfort problem existed. Instead, it relied on customer perceptions of comfort.
• Infrared scanning. Infrared scanning detects differences in surface temperatures. Understanding the images requires knowledge of construction practices and interpretation of how those practices manifest themselves in the infrared signal.
• Homeowner input. People differ in their knowledge and perceptions and how they communicate that information to others. In this study, three energy raters and a testing contractor interacted with at least 100 homeowners. In a few homes, the owner left the home while the inspector completed their job, providing little or no supplemental information. In many homes, an owner was home while data was collected and would respond to questions asked by the inspector. In other homes, the owner would accompany the inspector for the duration of the work, providing much more information about what they knew about energy features in the house, how they operated their home and their perceptions of comfort. Sometimes different occupants in a given home provided different information. Different inspectors asked more or fewer questions of homeowners, asked questions in different ways, and interpreted responses differently.
1.4.2 Analysis
While the data set contained gaps, uncertainties and differences in interpretation, information from several perspectives often could be brought to bear on a particular issue. Examples:
• Ductwork performance. Ductwork layout and construction practices could be observed in homes under construction, and some aspects could be observed in completed homes as well. Ductwork performance characteristics could be measured in completed homes (including pressures, air flow at the air handler and at individual registers, total leakage and supply versus return leakage).
1.4 Data, Observations, Analysis

12
Introduction
13
Introduction
• Comfort. Comfort issues identified by homeowners (in conversations with market research interviewers, energy raters and the testing contractor) could be compared with data and observations on framing practices, insulation, air leakage, windows, and distribution of conditioned air (data collected both in homes under construction and completed homes, based on visual inspection, infrared scanning and direct measurements).
• Basement depressurization. Measured basement depressurization was corroborated with other measurements and observations of causes: air leaks to the attic and through atmospheric fireplace flues, the ratio of return and supply duct leakage, and the presence of exhaust fans.
The challenge in analyzing the data and writing the reports was to present an accurate picture by putting together the pieces of the puzzle from this diverse array of information. The data set was internally consistent. Other professionals active in residential performance testing and diagnostics in Colorado have confirmed that the data and observations are consistent with their experience.
1.4.3 PrecisionData and results are presented in this report in varying degrees of precision. This reflects the varying depths of data, missing pieces of data and the fact that some data is more readily quantified than others.
Where possible, specific numeric percentages are reported (e.g. the proportion of study homes with direct-vent fireplaces). In other cases, the descriptive terms listed in the accompanying table are used to describe the frequency of occurrence.
1.5 Reports
Results of this study are available in two reports with different levels of detail. This Summary Report presents key data and observations as well as City perspectives. It is structured as follows:
• Chapter 2 focuses on energy code compliance, implementation and energy-saving results.
• Chapter 3 provides a broader set of data and observations on new home design, construction and performance.
• Chapter 4 presents information on cooling practices, focusing on central air conditioning.
Frequency of Occurrence Terminology Used in this ReportTerms Range of Occurrence
Few, occasionally, rarely Less than 10%Some, sometimes 10% to 25%
Many, often 25% to 50%Most, common, frequently 50% to 75%
Typical, generally, routinely, consistently 75% to 90%Almost all Greater than 90%
1.5 Reports

14
Introduction
1.6 Perspectives 2.1 Compliance Path Choices
Energy Code
15
• Chapter 5 synthesizes and discusses the findings from the City’s perspective and lists many possible steps that could be taken in response to study findings.
• The Glossary defines technical terms.
• Appendix A provides color renditions of the infrared photographs that are reproduced as black and white images in Chapter 3.
Graphs and tables help to convey the data. Photographs illustrate construction practices and the results of some of those practices. Case studies tell stories exemplifying the issues and opportunities described in the report. (Some case studies are based on specific study homes; others are based on related new construction experience).
For readers who want to learn more, the Project Report will provide more background information, more detail on the methodology and findings, expanded discussion and recommendations for each major section, as well as a list of related resources. It will be supported with additional graphs, photos, figures and case studies. The Project Report is intended to be used as a reference, a resource for further discussion of the issues addressed by this study and as a source for training materials. Contact Fort Collins Utilities regarding Project Report availability.
1.6 Perspectives
It is important to put this study and the reports in perspective:
• Balance. This report focuses on specific elements of home design, construction and performance. It is not intended to address all aspects of design, construction and performance. Certainly, many current new home practices are working well, delivering needed housing to Fort Collins consumers.
• Opportunities. Observations reported here suggest many opportunities to build homes that deliver better performance. Some changes represent little change in cost, while others may have substantial cost implications. Chapter 5, Discussion, notes some of the opportunities.
• Few surprises. Most of the issues addressed in this report have been discussed on a national basis. Most have also been raised locally through training and publications over the past decade. This study, however, provides more complete and careful documentation of Fort Collins building practices and their consequences.
• Regional issues. Although this study calls attention to concerns in new Fort Collins homes, limited data collected in other parts of Colorado corroborate many of the findings reported here.
• Changing practices. Building practice evolves in response to new products, increased understanding and changing consumer demands. An outcome of this study is better understanding to support continuing improvement of building practice.
• Today’s homes. In the time period between the building of the study homes and the publication of this report, a number of changes have already occurred in the way in which new Fort Collins homes are designed and built. These are noted in Chapter 5, Discussion.

14
Introduction
1.6 Perspectives 2.1 Compliance Path Choices
Energy Code
15
2 Energy CodeThis chapter summarizes implementation experience with the 1996 energy code and the results of the code change.
2.1 Compliance Path Choices
Most builders chose to follow the traditional, fully prescriptive code compliance path. But a growing proportion made use of other options. B&Z staff estimated the proportion of homes using the blower-door testing option to document air sealing compliance grew from about 15% in 1997/98 to 30% in 1999/2000. A small portion of homes complied with the energy code via the systems analysis path; the number is estimated to have increased from about 10% in 1997/98 to 15% in 1999/2000.
In the 40-home post-group sample, four homes (10%) had either ENERGY SCORE or E-Star Colorado energy ratings performed outside of this study. It is presumed that they complied with code using the systems analysis path. These four homes were therefore removed from any analysis of prescriptive compliance rates.
Blower door testing has been increasingly used to document compliance with the code’s air sealing requirements.
Building Permit

16
Energy Code Energy Code
17 2.2 Compliance Rates
2.2 Compliance RatesAmong the post-group homes, compliance with the code’s prescriptive measures was very mixed. Frequency and severity of non-compliance varied widely from one component to another, as illustrated by the examples in the accompanying tables and photos. The ranges of compliance used for categories in the tables—“high,” “moderate” and “low”—are arbitrarily defined.
Examples of Measures with High* Code Compliance Rates Component Code Requirement Data and Observations
Basement wall insulation
Wall insulation required. Interior application: R-11Exterior application: R-10
92% of homes had insulated basement walls that met the R-value requirements.
Air sealing at can-style recessed lighting fixtures
All fixtures in insulated ceilings must meet air leakage standard ASTM E-283 or be boxed in and sealed.
Almost all recessed cans were “airtight” or “airtight-ready” fixtures meeting the tightness standard (in a few instances in completed homes, it was noted that the required gaskets needed to complete the seal on “airtight-ready” fixtures had not been used).
Air sealing at window and door frames
Frames must be sealed to rough openings. Fiberglass “chinking” alone is not acceptable.
Frames were generally sealed to rough openings using foam or backer rod.
Air sealing at bottom plates of exterior walls
Bottom plates of exterior walls must be sealed to the subfloor.
In almost all homes, foam or caulk was used in this joint (it was noted that the result was not always airtight, but was a big improvement over no sealant).
Furnace and water heater efficiency
Equipment must meet federal minimum efficiency standards.
All equipment met the required standards.
* higher than 75%
2.2 Compliance Rates

16
Energy Code Energy Code
17 2.2 Compliance Rates
Examples of Measures with Moderate* Code Compliance RatesComponent Code Requirement Data and Observations
Wall assembly (exterior walls, windows, doors)
For gas-heated homes, the wall assembly U-value must not exceed 0.132 Btu/hr*sf*F.
About half of homes had wall assembly values meeting the requirement. About 30% of homes were out of compliance by more than 10%.
Corners on exterior walls and partition wall intersections with exterior walls
Prior to exterior sheathing being installed, all wall cavities that will be inaccessible for insulation from the interior must be insulated.
About one-quarter of the exterior corners were framed to be insulatable from the interior.
Ladder blocking was used in about half of partition wall intersections with exterior walls, creating cavities that could be insulated from the interior.
Conventionally framed corners and intersections, insulatable only from the exterior, were rarely insulated.
Cavities on exterior walls (e.g. fireplace enclosures, cavities behind bathtubs and shower stalls)
Cavities built at exterior walls must be insulated and an air barrier must be installed prior to framing the cavity or installing the device creating the cavity. The air barrier must follow the insulated surface.
Compliance rates varied depending on the specific application. Examples:
In about half the homes, there was no air barrier behind tubs or shower stalls. In a few homes, an air barrier was observed on one exterior wall segment but not on another.
Fireplace enclosure insulation and air sealing approaches varied widely. In some instances, the enclosure was fully insulated and sealed at the exterior wall and/or ceiling. In many cases, the air barrier was poorly defined and/or remote from the insulation.
Combustion air duct labels
All combustion air openings or ducts must be labeled to warn occupants against tampering with them. Labels are supplied by B&Z.
Combustion air warning labels were observed in about one-third of homes.
* 25% to 75%

18
Energy Code Energy Code
19 2.2 Compliance Rates
The code requires that batt insulation be cut to the correct length and installed with no voids at any edges. It also requires that the insulation must attain specified loft across the entire batt.
One-inch void at top of wall cavity
Insulation InstallationInsulation installation practices, regulated by the code’s Insulation Guidelines, varied widely.
This is an example of effectively installed insulation that met code requirements. Batts filled the cavities, attained full loft, and will be in substantial contact with the wallboard.
The code requires insulation to be in substantial contact with the wallboard and a vapor barrier to be installed on the warm side of the insulation. At this skylight well, insulation was held several inches back from the wallboard by framing. The vapor barrier was on the cold side of the insulation, a potential moisture trap.
The code requires that insulation be cut to fit, without compression, around electrical and other obstructions in the insulated bay. In this case, insulation was compressed behind the box rather than cut to fit around it.
Standard-width batt installed correctly in standard-width cavity
Batt folded rather than cut to width in non-standard-width cavity. This compressed the batt and caused air gaps
2.2 Compliance Rates

18
Energy Code Energy Code
19 2.2 Compliance Rates
Examples of Measures with Low* Code Compliance RatesComponent Code Requirement Data and Observations
Forced-air distribution ductwork
Joints of duct systems must be made “substantially airtight.”
Ducts in unconditioned spaces must be sealed with mastic and mesh.
The sealing approach typically observed was cloth duct tape applied to only the round-to-round joints on supply duct runs. Foil tape was noted in about 5% of homes. Mastic was used as a sealant in about 10% of homes.
Testing showed ducts to be very leaky in every home (as compared with a variety of standards for tight ducts).
Slab-on-grade insulation
Insulation is required on the perimeter edge of all slabs-on-grade (defined as zero to 12 inches below grade).
No insulation was observed at the perimeter edge of any slab-on-grade.
House/garage connection
All penetrations must be sealed between an attached garage and adjoiningliving space.
Leakage paths were routinely observed between the garage and house, via floor joist cavities, the wall between house and garage, cantilevered floors extending into the garage, and leaky ductwork in the wall adjoining the garage or floor above the garage.
Water heater standby loss
One of two measures is required on both cold and hot water piping connections to the water heater: heat traps or pipe insulation on the first eight feet of piping.
Heat traps were observed at 15% of water heaters, pipe insulation at 5% of water heaters. The other 80% of water heaters had no standby heat loss measures.
The Uniform Mechanical Code requires ductwork to be “substantially airtight.” However, numerous leaks were observed and testing showed all ducts in the performance-tested homes to be very leaky.
Typical leakage locations in return ductwork
* less than 25%

20
Energy Code Energy Code
21 2.3 Construction Practices
Air Barrier/Insulation AlignmentThe code’s Air Sealing Checklist requires fireplace cavities on exterior walls to be insulated and an air barrier to be installed prior to framing the cavity and installing the fireplace unit. The air barrier must follow the insulated surface.
In this example, there was no air barrier at the exterior wall. This will allow outdoor air to move from the wall into the cavity around the fireplace unit and then, through cracks and holes, into the living space.
In this example, the insulation and air barrier, aligned at the exterior wall, were installed before over-framing was built and before the fireplace unit was installed. This approach will stop drafts and help the insulation perform effectively.
Over-framing forms the finished interior wall.
Exterior wall:insulation but no air barrier
Fireplace vent
Fireplace unit
Insulation extends behind fireplace cavity at exterior wall
Air barrier, on exterior wall, aligned with insulation
Over-framing
2.2 Compliance Rates

20
Energy Code Energy Code
21 2.3 Construction Practices
2.3 Construction PracticesThe most significant code-driven changes in construction practice were observed in two areas:
• Basement insulation. As noted in the previous section, all but 8% of post-group study homes with basements were insulated at time of construction.
• Crawl space design. “Warm” or “heated” designs were universally used for all crawl spaces in post-group homes.
Progress was also observed, on average, in air sealing and insulation installation practices. But there were many exceptions, as illustrated in the previous section and in Chapter 3. In some cases, a required air sealing or insulation measure was implemented exactly as intended, in some homes partially implemented, in others not at all.
Otherwise, few changes were observed between pre- and post-group construction practices.
Code-Driven ChangesThese changes in construction practices were consistently
observed in homes built after the 1996 code change.
“Airtight” cans for recessed lighting reduced air leakage through insulated ceilings.
Basement wall insulation addressed one of the biggest remaining heat loss paths. The typical approach was a vinyl-faced fiberglass blanket on the interior of the concrete foundation.
Sealing the baseplate-to-subfloor joint cut off a significant air leakage path.

22
Energy Code Energy Code
23 2.3 Construction Practices
2.4 Implementation
Summary findings regarding code implementation include:
• Support. City-sponsored support efforts in 1996/97 (the Builder’s Guide and code-related training) were well received by builders who took advantage of them. Builder comments and compliance rates suggested, however, that the lack of ongoing code-related training since 1997 has been a weakness. Concerns were also expressed about whether changes in the code details that B&Z accepted and enforced had been adequately communicated.
• Enforcement. Builder comments, coupled with compliance rates observed in the field, indicated that the energy code was inconsistently enforced during the period represented by the post-group homes.
• Builder-required documentation. For the study homes, the energy-related documentation that builders were required to submit to the City as a prerequisite for building permits and Certificates of Occupancy could not be assessed, because none had been archived. According to B&Z staff, the requirement to turn in disclosure forms was not strictly enforced during the period represented by the post-group homes, and it was likely that many were never turned in to B&Z. Though B&Z has become more rigorous since then in enforcing the disclosure form requirement, informal spot checking suggests there can be significant discrepancies between signed disclosure forms and what has actually been built.
• Systems analysis. Several outstanding issues exist regarding the systems analysis compliance path, including the division of inspection responsibilities between B&Z staff and the energy raters, assurance that site ratings are completed for all homes, and a variety of technical details.
• Performance testing. The building industry and B&Z both gained experience with performance testing through the optional blower-door test for air sealing compliance.
City building inspectors spot-checked compliance with energy code requirements.
Builder PerspectivesIn study interviews (conducted two-and-a-half years after the code change), builders routinely expressed frustration about inconsistencies in documentation, interpretation and enforcement of the code. They reported this particularly in the time period shortly after the new code had been implemented. However, many builders noted improvements since then, as builders and B&Z staff learned together.
About 50% of builders felt the energy code was reasonable and that it helped “level the playing field,” requiring builders who would otherwise not pay attention to energy efficiency to meet minimum standards. About 25% saw some value in the code but felt it pushed efficiency requirements too far. About 25% of builders saw no value in the energy code whatsoever. (The market research consultant stated this latter percentage is consistent with what was seen in other studies.)
2.3 Construction Practices

22
Energy Code Energy Code
23 2.3 Construction Practices
A
This form shows a wide variety of wall construction and window U-value and area ratios that meet the energy code "wall ssembly" U-value requirements.Use it to document the compliance of the home being submitted for a building permit, assuming the average door U-value is 0.33 or less.There are many other combinations of components that will satisfy code requirements. To use combinations other than those show n here, complete the "Wall assembly worksheet."
1. Indicate the type of wall you plan to build in Table 1.Circle the appropriate choices on each line and fill in material and thickness for cavity insulation and exterior insulating sh eathing.
2. In the matching column below in Tables 2G or 2E, for gas or electric heat, circle the entry matching the U-values of the wind ows you plan to install.This percentage is the maximum glass/wall ratio permitted by code. Interpolate between the values shown if necessary. Provid e window schedule to document U-values selected.
3 The "Maximum allowable glass area" section provides a correction for large door area and calculates the maximum glass area per mitted.
CavityFrame depth 2x4 2x4 2x4 2x6 2x6
Framing technique Standard Standard Standard Standard Advanced
Insulation material + thicknessCavity insulation R-value 13 13 15 19 (18) 19 (18)
iMaterial and thicknessR -value 3 6 3 3 3
Coverage of total exterior wall 0-50% 50-100% 0-50% 50-100% 0-50% 50-100% 0-50% 50-100% 0-50% 50-100%
0.60 9% 10% 9% 11% 10% 11% 12% 13% 12% 13%
0.52 (double / wd or vinyl frame) 10% 12% 10% 13% 11% 13% 14% 15% 15% 15%
0.46 12% 14% 12% 15% 13% 15% 16% 17% 17% 18%
0.41 (Default double / low-e) 14% 16% 14% 17% 15% 17% 18% 20% 19% 20%
0.37( double / low-e / argon) 16% 18% 16% 20% 17% 19% 21% 22% 22% 23%
0.60 6% 8% 6% 9% 7% 9% 10% 11% 10% 11%
0.52 (double / wd or vinyl frame) 8% 9% 8% 11% 9% 10% 12% 12% 12% 13%
0.46 9% 11% 9% 12% 10% 12% 13% 14% 14% 15%
0.41 (Default double / low-e) 10% 12% 10% 14% 12% 14% 15% 16% 16% 17%
0.37 (double / low-e / argon) 12% 14% 12% 16% 13% 15% 17% 18% 18% 19%
* "Average window U-value" refers to an area-weighted average when more than one type of window with different U-values are used . Attach a window schedule showing the individual areas, U-values, and calculation of the average window U-value
A. Gross exterior wall area (sq. ft. -- see MEC definition for components to include)
B. Total opaque area of all doors to the exterior or garage
C. Door/wall ratio -- round to nearest percentage ( B / A )
D. Door correction ( C - 2%) -- If C is less than 2%, enter "0"
(The tables of maximum window/wall ratios assume 2% or less door/wall ratio.)
E. Maximum glass/wall ratio from table above
F. Corrected maximum glass/wall ratio ( E - D )
G. M (Sash area)
H. Maximum rough opening area (Multiply G x 1.09)
I. Proposed total glass area from plans (
Note: this is only valid for average door U-value of 0.33 or less (R-value = 3.0 or greater)
Builders complained about paperwork requirements like this form used to document compliance with the code’s “wall assembly” requirement.
The most challenging areas in the new code for builders and B&Z staff alike appeared to be:
• Air sealing. Many builders were concerned that the code’s air sealing requirements went too far, resulting in homes that were “too tight” and would therefore experience more indoor air quality problems. Some builders and some B&Z staff agreed that the prescriptive checklist approach demanded too much sealing and was impractical. Many homes met the code’s blower-door performance benchmark with large holes that had not been sealed, indicating the blower-door approach was less rigorous than the prescriptive checklist. Even several years after the code change, City staff have had conversations with a few builders and air sealing contractors who were unaware of the code’s specific air sealing requirements and the performance implications of large holes in the air barrier or misalignment of the air barrier and the insulation boundary.
• Insulation installation. The examples of noncompliance witnessed in this study, other observations from more recent informal site visits, and comments both from builders and B&Z staff suggest that a few builders and insulation contractors were unfamiliar with the code’s Insulation Guidelines for insulation installation, that enforcement of the guidelines was inconsistent, and that some felt the guidelines were too detailed to be practical to enforce as a code requirement. (Note: due to the low number of City building inspectors compared with the workload, the insulation inspection was dropped altogether for about six months in early 1999.)
• Wall assembly. Due to a lack of archived records for the study homes, it was impossible to directly check approved wall assembly submittals versus what was actually built. However, the 50% non-compliance rate, determined by calculations using as-built post-group home data, illustrated that this code provision was not functioning effectively.

24
Energy Code Energy Code
25
2.5 Costs and Savings
Based on builder interview information and cost data associated with the changes in construction practice consistently seen in response to the code change, it was estimated that the 1996 code changes raised the price of a typical new home by $1,000 to $1,500 (including a 30% builder markup). The biggest single factor contributing to the cost increase was the new basement insulation requirement.
Detailed energy analysis showed that annual natural gas requirements for the average study home decreased 16% as the result of the code change (175 therms per home on average). Greenhouse gas emissions fell accordingly. Electrical savings were negligible, as expected (the 1996 code changes included little that would change cooling requirements; space heating and water heating in study homes were provided by natural gas appliances). Converting average gas savings to dollars, the value of the savings varied from $77 to $158 per year based on the extremes of the volatile natural gas rate from 1999 through 2001.
G-110Natural gas marginal rate ($$/therm)
Ann
ual s
avin
gs (
$$
/yr)
Average Energy Bill Savings Due to the Code Change
G-110bw.eps Graph #2 4/19/02
$74 $70$77 $82
$100
$0
$50
$100
$150
$200
$0.42 $0.40 $0.44 $0.47 $0.57
(Jan 1997) (Oct 1997) (Oct 1999) (Jul 2000)(Oct 1995)
$0.62 $0.90 $0.48
(Oct 2000) (Jan 2001) (Oct 2001)
$109$158
$84
The measured energy savings due to the code change averaged 16% of natural gas use. The corresponding dollar savings depended upon the natural gas rate, which has been volatile since 1999.G-109
Group
Tota
l gas
use
(th
erm
s/yr
)
Average Annual Natural Gas Use(pre-group versus post-group)
G-109bw.eps Graph #1 5/13/02
886
1061
0
400
800
1200
Pre Post
Averagesavings =
175 therms/yr
Includes pre- and post-group homes
2.5 Costs and Savings

24
Energy Code Energy Code
25
Measured energy savings due to the code change were slightly less than half of the anticipated savings (modeled in the energy/economic analysis performed as the code change was being considered in 1995). Factors contributing to this discrepancy included:
• Thermostat setpoint. The effective heating thermostat setpoint was about one-and-a-half degrees Fahrenheit lower on average than modeled;
• Basement temperature. Uninsulated basements were five degrees Fahrenheit cooler than modeled; insulated basements were one degree Fahrenheit cooler than modeled;
• Internal gains. Internal gains from people and appliances were about 5% higher on average than modeled;
• Pre-group assumptions. Some pre-group building practices were more energy-efficient than modeled (e.g. the pre-group homes were tighter than assumed);
• Post-group assumptions. As noted in this chapter, some aspects of post-group homes did not comply with code requirements (the modeling assured full code compliance).
The comparison of benefits and costs has a variety of outcomes depending upon the way in which the house is financed—cash purchase or mortgage—and other assumptions. Key assumptions include the mortgage interest rate, the amount of cost increase associated with the code change, and the natural gas rate (which is difficult to predict, especially over the life of the home). The sidebar on the following page includes three examples that illustrate a range of outcomes based on a range of assumptions.
2.5 Costs and Savings
26
Energy Code
27
Design, Construction, Performance
3.1 Design
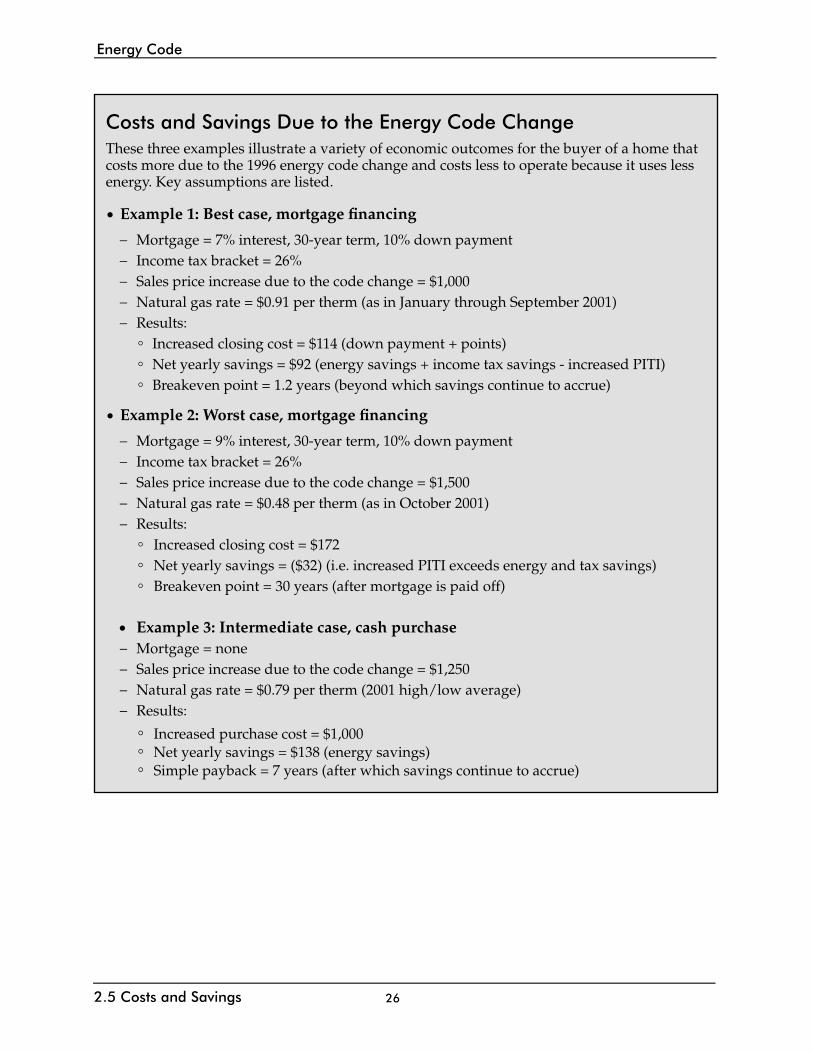
Costs and Savings Due to the Energy Code ChangeThese three examples illustrate a variety of economic outcomes for the buyer of a home that costs more due to the 1996 energy code change and costs less to operate because it uses less energy. Key assumptions are listed.
• Example 1: Best case, mortgage financing
− Mortgage = 7% interest, 30-year term, 10% down payment− Income tax bracket = 26%− Sales price increase due to the code change = $1,000− Natural gas rate = $0.91 per therm (as in January through September 2001)− Results:
° Increased closing cost = $114 (down payment + points)
° Net yearly savings = $92 (energy savings + income tax savings - increased PITI)
° Breakeven point = 1.2 years (beyond which savings continue to accrue)
• Example 2: Worst case, mortgage financing
− Mortgage = 9% interest, 30-year term, 10% down payment− Income tax bracket = 26%− Sales price increase due to the code change = $1,500− Natural gas rate = $0.48 per therm (as in October 2001)− Results:
° Increased closing cost = $172
° Net yearly savings = ($32) (i.e. increased PITI exceeds energy and tax savings)
° Breakeven point = 30 years (after mortgage is paid off)
• Example 3: Intermediate case, cash purchase− Mortgage = none− Sales price increase due to the code change = $1,250− Natural gas rate = $0.79 per therm (2001 high/low average)− Results:
° Increased purchase cost = $1,000° Net yearly savings = $138 (energy savings)° Simple payback = 7 years (after which savings continue to accrue)
2.5 Costs and Savings

26
Energy Code
27
Design, Construction, Performance
3.1 Design
3 Design, Construction, PerformanceThis chapter summarizes data and observations about study home design, construction and performance. It addresses individual components and how those components work together as part of the “house-as-a-system.” This chapter goes beyond the code assessment of Chapter 2 and focuses more heavily on the second question raised in the Introduction: “Does it work?”
Though energy code compliance issues are not the focus of this chapter, mention is sometimes made of code compliance and “pre-group” and “post-group” homes. The code serves as a useful benchmark, and references to code help illustrate trends in building practice.
3.1 DesignThe study made observations about two aspects of basic house design: how homes related to the sun and architectural features that require special attention to perform well.
3.1.1 Solar Effects
The sun is powerful. A year-round abundance of sunlight is one reason people choose to live in Fort Collins. Depending on how a home is designed, the sun can be either a benefit or a liability.
It appeared that the sun’s power and its path through the sky were not considered in new home design. Although most homeowners claimed that orientation relative to the sun was an important consideration when they selected their home, building orientation in the study sample did not show strong preference for any particular direction. Glass was used
Infrared PhotosSome of the photos in this chapter are “infrared” images. Taken with a camera that is sensitive to radiant heat rather than visible light, these photos document surface temperatures. They are very helpful in understanding what’s going on behind the finish materials.
The infrared photos were all taken under wintertime conditions; i.e. colder outside than inside. Conventional photos, paired with the infrared images, provide context. A color key accompanies each infrared photo. During the winter, a uniformly insulated home would appear uniformly dark (cold) in an exterior photo, and uniformly light (warm) in a photo taken from the interior.
Some of the infrared photos were taken with a blower door operating to depressurize the house. This emphasized air leakage paths.
Predominant Window Orientation
S+SE(28%)
W+SW(20%)
E+NE(25%)
N+NW(27%)
G-099c
G-099cbw.eps Graph #3 6/20/02
Includes pre- and post-group homes
Window orientations in study homes showed no strong preference for any particular direction.

28
Design, Construction, Performance
3.1 Design 29
Design, Construction, Performance
3.1 Design
Solar EffectsThe sun did not appear to be a factor in the way homes were sited or in the way windows were placed, sized or shaded.
extensively as an architectural element, but there was no evidence that design attention was paid to how glass properties, placement or shading would affect occupant comfort and utility bills. Conventional double-paned windows were used in almost all study homes, regardless of orientation. Shading that did occur was a consequence of architectural detailing rather than a conscious design element. Solar gain through windows was commonly the biggest contributor to a home’s need for cooling.
In turn, homeowners complained about summer overheating, glare and temperature variations throughout the house both summer and winter, and fabric fading. The testing contractor noted that some homeowners kept window coverings closed during daylight hours in an attempt to improve comfort.
Large expanses of glass faced in all directions.
Some study homes had a lot of south-facing glass area, offering the potential for great passive solar performance. However none were designed to take advantage of the solar heat during the winter (by storing the heat) or to avoid the sun during the summer (with exterior shading). During the winter, these homes tended to have large temperature variations from one part of the house to another.
The testing contractor noted that some homeowners kept window coverings closed to ward off too much heat and glare.

28
Design, Construction, Performance
3.1 Design 29
Design, Construction, Performance
3.1 Design
Bump-outs Two-story design
Secondary roofs adjoiningconditioned space
Complex ceilings
Living space extendingover garage
Attached garage
This house provides examples of many common architectural features that were associated with problems in the study homes.
Cantilevered floors
3.1.2 Architectural Features Certain architectural features are more likely to be sources of problems than others. These are usually places where some combination of factors exist: more complex framing, unusually high heating or cooling loads, more difficult locations to supply heating and cooling. During design and construction, special attention to the details is required in these areas to avoid predictable insulation or air leakage flaws, comfort problems and customer complaints.
Features in this category, present in many study homes, included:
• Multiple stories. More levels mean more variation in zonal heating and cooling requirements and more potential for air delivery problems.
• Attached garages. These offer the potential for pollutants to move from the garage into the house.
• Living spaces over garages. A variety of factors can contribute to comfort problems in rooms above garages.
• Complex ceilings. Vaults, split-levels, coffered ceilings, interior soffits, and the kneewalls associated with many of these are more challenging to insulate and air seal than flat ceilings.
• “Bump-outs.” Features that project past the main plane of the exterior walls—such as bay windows, dormers, porch roofs and cantilevered floors—also pose air sealing and insulation challenges.
Numerous problems were observed to be associated with features like these. The testing contractor noted that, as a rule, compact, one-story homes had fewer performance issues.

30
Design, Construction, Performance
31
Design, Construction, Performance
The upper level dormers and cantilever floor in the house shown above posed air sealing and insulation challenges. From the interior (conventional photo lower left, infrared photo lower right), thermal flaws showed up as cold spots (dark). These can cause discomfort and provide opportunities for moisture condensation, mildew and mold growth. The owners of this house complained that the dormers were so cold that they could not use these areas during the winter.
Upper level floorcantilevered over front porch
Dormer
Warm
Cool
3.1 Design

30
Design, Construction, Performance
31
Design, Construction, Performance
3.2 Construction Practices and Quality Control
Effective construction practices and quality control are critical components for acceptable home performance. Building codes set minimum standards. The 1996 energy code took some steps to encourage more attention to detail and uniformity, through measures such as the Insulation Guidelines, Air Sealing Checklist, blower-door testing option, and disclosure forms.
For the kinds of factors examined in this study, construction practices varied widely from one home to another, particularly in the details. Recurring examples of construction flaws or performance problems included:
• Insulation installation defects;
• Major air leakage paths left unsealed;
• Unreliable exhaust fan ducting;
• Furnaces with low air flow and high heat rise;
• Extremely leaky heating and cooling ductwork;
• Insufficient air flow through upper level return registers, and
• Depressurized basements (with the potential for combustion safety problems).
Details Missed Flaws like these were signs of ineffective construction practices and quality control.
The duct venting this bath fan outdoors was only tenuously attached by tape to the fan housing. After wallboard was installed, there was no way to check or fix this connection.
About one-quarter of study home furnaces operated near or outside of manufacturers’ limits for pressure and heat rise.
Uninsulated components, such as this skylight well, were occasionally observed.
Uninsulated skylight well
Insulated ceiling
3.2 Construction Practices

32
Design, Construction, Performance
33
Design, Construction, Performance
Case Study: Attic Ambush
A new Fort Collins home, built by a large production builder, was completed in mid-summer 1999. It was a simple design: a compact ranch with a finished basement, totaling 1900 square feet. The home was purchased by the parents of a CSU student as an investment and place for their daughter and her college roommates to live.
The occupants moved into their new home in August and immediately noticed major comfort problems. All main floor rooms consistently ran too warm—78 degrees Fahrenheit with the air conditioner running virtually full time. Meanwhile, the basement bedroom was consistently too cold—63 degrees even with some supply registers closed. In response to complaints, the builder sent their heating contractor back twice to solve the problem. Some limited duct sealing and minor adjustments to the air conditioning system improved comfort only marginally. The occupants concluded, “Oh well, that must be the way new homes are” and decided to live with the problems. But in October they were puzzled that the air conditioner would run during the day, then the furnace would run at night. By December, they had the builder back to check on their furnace, because the main level was never really comfortable (even when the air temperature registered 68 degrees), while the basement was too hot (75 degrees). The problem, quickly discovered in a January 2000 site visit by City staff: no attic insulation. Yet the code-required Insulation Disclosure form, on file at B&Z, signed by the insulation contractor, documented 12 inches of an unidentified insulation material, rated R-38, in the attic. Once the builder was notified of the problem, insulation was installed within 48 hours. The comfort of the home improved dramatically with this change.
The missing insulation was clearly an oversight, never caught by quality control. Apparently neither the insulation contractor, the builder, nor the City’s inspectors ever looked in the attic. There was also clearly a major failure in the builder’s callback response; the problem was not identified in at least three return trips to the house. As a result, the owners paid an estimated $150 more than necessary to heat and cool the home. The occupants put up with miserable comfort for six months and were generally jaded about new homes. The builder’s site
A few study homes had more significant flaws that weren’t detected before the homes were sold. Some of these are noted in subsequent sections and the accompanying case study.
The number of problems documented in the study homes raised questions about the effectiveness of quality control procedures.
3.2 Construction Practices
Several months after occupancy: no insulation in the attic.

32
Design, Construction, Performance
33
Design, Construction, Performance
This information was submitted by the builder to the City of Fort Collins Building and Zoning Department as part of the requirements to obtain a Certificate of Occupancy for the completed home. It was signed by the insulation contractor.
superintendent wasted time on the phone dealing with callbacks, and the heating contractor spent unproductive time visiting and trying to fix problems. The builder had already paid the insulator for a job never performed.
The missing attic insulation was the biggest single problem in this home – one that fortunately was easy to remedy. Yet City staff (using a blower door, infrared camera, pressure gauge and smoke source) compiled a list of other problems:
• Whole house air leakage. A blower-door test showed that the house was about one-third leakier than the average Fort Collins new home. Numerous leaks to the attic were observed, including connections between the attic and return air duct system.
• Thermal bypasses. One wall, framed 12” thick to avoid building a ledge at the top of the foundation, provided air space for thermal convection and leakage connections to the attic; this reduced the effective R-value of the wall insulation. A decorative archway in an interior partition wall created a framing cavity totally open to the attic; cold attic air drops into this space during the winter, bypassing the attic insulation.
• Exposed fiberglass. The basement walls were finished by framing out a 2x4 wall and insulating with unfaced fiberglass batts. Most of the space was finished with drywall, however the mechanical room had no wallboard or other protective cover to contain the insulation’s glass fibers. This was a health and safety concern and violation of the code’s Insulation Guidelines.
• Duct design. The home’s supply ductwork system was not effectively designed; by placing a supply takeoff immediately above the supply riser, the basement bedroom received far more supply air than it needed to be comfortable; as a result, it ran too warm when the furnace operated and too cold when the air conditioning was on.
• Combustion safety. The furnace and water heater were isolated in a mechanical room. Within the room were two major sources of depressurization that could potentially backdraft the combustion equipment: a missing section of panning on a floor joist cavity that served as part of the return air system; and a combustion air duct that ran vertically from the basement to a termination above the roof (and acted like a chimney).
• Bath fan. The typical low-end bath fan was rendered even less effective by the ductwork that was used to vent it. The duct had a 180-degree bend at the fan outlet (reducing flow significantly) and was very tenuously attached to the fan outlet with tape alone.
3.2 Construction Practices
34
Design, Construction, Performance
35
Design, Construction, Performance
3.3 Thermal Envelope
The “thermal envelope” of a home separates the indoors from the outdoors. A quality thermal envelope is a prerequisite for a comfortable, energy-efficient home. This entails:
• A continuous insulation boundary, with insulation effectively installed (such that it delivers its rated R-value);
• A continuous air barrier;
• Insulation boundary and air barrier everywhere aligned, and
• Energy-efficient windows.
This section summarizes data and observations about thermal envelope components.
3.3.1 Insulation and Air Sealing
To be effective, insulation and air sealing must work together. Where they don’t perform well, individually or together, symptoms may show up as energy losses, discomfort, or contributors to health and safety problems.
Insulation
With some exceptions, insulation with code-required R-values was present in the study homes. Fiberglass was the primary insulation material, observed in every study home (blown fiberglass was used in most attics, fiberglass batts for other components). The only other insulation material observed was rigid foam insulation board, used in some homes for exterior sheathing or exterior basement wall insulation.
Insulation installation practices varied. On average, some progress in effective installation practices was observed from pre- to post-group homes, yet the range of practice was wide and problems persisted. Predictable problem areas included crawl space perimeter walls, cathedral and vaulted ceilings insulated with batts, skylight wells, rim joists, cantilevered floors, floors over garages, and knee walls to attic space. Factors noted to contribute to problems included non-standard dimension cavities, obstructions in the cavities (plumbing, ductwork, electrical wiring, framing), and areas where access was difficult for insulation installers.
3.3 Thermal Envelope

34
Design, Construction, Performance
35
Design, Construction, Performance
Installation ExamplesThough insulation materials with code-required R-values were generally used, installation practices sometimes compromised performance.
Typically-installed, unfaced fiberglass batts in a frame wall will offer reasonable performance. Note some compression of the batts in the full- width stud bays and more severe problems where a batt had to be cut to fit in a narrow cavity.
Compression of the insulation batts, voids, and the lack of contact with the subfloor above this cantilever all reduce the effective R-value of this insulation.
Fiberglass batts were often improperly fit around obstructions like this electrical box, creating cold spots. (This is the back of the box; code requires a minimum of R-5 insulation behind such obstructions.)
Code requires minimum R-19 insulation in floors above garages. The insulation must be in substantial contact with the subfloor above, permanently supported using one of several approved means. In this example, 6-inch thick R-19 fiberglass batts, installed in 9.25-inch joist cavities, were held in place only with staples—not an approved method. Some of the staples had failed prior to wallboard installation.
In floors over garages, R-30 batts exceeded code R-value requirements but were easier to install effectively because they were thick enough to fill the floor joist cavity completely.
3.3 Thermal Envelope

36
Design, Construction, Performance
37
Design, Construction, Performance
Air Sealing
Study homes, on average, were moderately tight. The average air leakage rate for the sample as a whole was 5.1 air changes per hour at the standard test pressure of 50 Pascals (ACH50). Although half of the sample homes were built before the 1996 code change (when specific air sealing requirements were not individually prescribed), and most post-group homes complied with the code’s air sealing requirements via the prescriptive approach, this full-sample average was very close to the code’s performance testing threshold of 5.0 ACH50 or below. Post-group homes were somewhat tighter on average than pre-group homes—6% to 16% tighter depending upon the metric used. The average post-group home was a little tighter than the code’s performance testing threshold.
Though the average leakage rate was moderate, there was a more than four-fold variation in tightness among study homes. The range was 2.6 ACH50 (relatively tight) to 11.4 ACH50 (very leaky).
G-006
Individual houses
AC
H50 (
1/h
r)
Whole House Air Leakage Rates(standard test conditions)
G-006bw.eps Graph #4 5/2/02
Includes pre- and post-group homes
0
2
4
6
8
10
12
5.0 ACH50 = 1995 code performance threshold
5.1 ACH50 = Average
G-007
Pre PostGroup
AC
H5
0(1
/hr)
Average Air Leakage Rates(pre-group versus post-group)
G-007bw.eps Graph #5 4/17/02
5.0 ACH50 = 1995 code performance threshold
0
2
4
6
8
5.6
4.7
On average, study homes were moderately tight, with an average measured leakage rate close to the code’s performance threshold. However, tightness of individual homes varied by more than a factor of four.
Homes built after the code change were tighter on average.
3.3 Thermal Envelope

36
Design, Construction, Performance
37
Design, Construction, Performance
Pre- to post-group tightening improvements were consistently noted in three areas: exterior wall sole plate-to-subfloor joints, recessed light fixtures (“airtight” cans in insulated ceilings), and crawl spaces (by eliminating venting as part of the “warm” crawl space design approach). Apart from that progress, air sealing practices varied widely. Many leaks were observed.
Study inspectors noted that sealing was sometimes not as effective as it might be. For example, code requires the mud sill to be sealed to the foundation using closed cell foam “sill seal,” supplemented as necessary with caulk and foam. In almost all post-group homes, closed cell foam sill seal was used in this application. Supplemental sealants were rarely observed, however, leaving isolated leaks on horizontal sections of the joint. A predictable leakage area, not explicitly required to be sealed in the Air Sealing Checklist, was the vertical joint between concrete and framing on a stepped foundation.
When air is drawn through an unsealed sump cover, it might bring with it radon, other soil gases or moisture.
Horizontal joints between the foundation and mudsill were usually effectively sealed, but the vertical sections on a stepped foundation rarely were. In an unfinished basement, such a joint leaks directly to the outdoors.
Uncontrolled Air Leakage Even in moderately tight homes there were many remaining holes—some smaller, some larger.
The flue, draft hood and outdoor airsupply all contributed to leakage through atmospherically vented fireplaces.
Open hole
No sealing at perimeter of cover
No sealant
“Sill seal”
3.3 Thermal Envelope

38
Design, Construction, Performance
39
Design, Construction, Performance
Code-required combustion air ducts, such as the one shown above, are direct openings to outside. An infrared photo of the same area (above right) demonstrates a typical winter problem: cold air is continually drawn in to replace air lost through other cracks and holes high in the house. This phenomenon contributed to cold basements and crawl spaces. In response, it was not unusual to see combustion air ducts plugged by homeowners—despite prominent labels warning against tampering with these safety devices.
Plug inserted by homeowner to stop cold draft
Thermal Bypasses
“Thermal bypasses” were often observed where the air barrier was incomplete or wasn’t aligned with the insulation boundary. This meant that air could leak around or through insulation materials, effectively derating the insulation. The accompanying photos illustrate these kinds of problems.
3.3 Thermal Envelope
Warm
Cool

38
Design, Construction, Performance
39
Design, Construction, Performance
The infrared photo above shows the symptom of a missing air barrier: a cold tub. This bathtub sat against two exterior walls and over a garage. Cold outdoor air moved through or around the insulation to cool the tub. (Infrared photo taken with blower door operating.)
This bathtub had more than enough insulation at the exterior wall. But there was no air barrier to stop air from the outside wall from flowing through the insulation and circulating beneath the tub. From there, connections through partition walls and holes around the plumbing connected this leak to the rest of the house. The solution is easy and inexpensive, but
requires a change in construction sequence. The air barrier behind this tub was installed before the tub was set in place. This was observed in about half of the homes under construction.
Tubs on Exterior Walls To avoid leaving a large thermal bypass behind a tub, both insulation
and an air barrier must be aligned at the exterior wall.
An air barrier behind the tub will block air flow.
3.3 Thermal Envelope
Warm
Cool

40
Design, Construction, Performance
41
Design, Construction, Performance
In the house shown at right, a portion of the air barrier that should isolate interior space from the porch roof was missing. As seen from the interior (conventional photo lower left, infrared photo lower right), cold air could enter the house through the joist cavity between main and upper levels. Cooling effects of this leak extended into interior partition walls at the core of the house. (Infrared photo taken with blower door operating.)
3.3 Thermal Envelope
Location for interiorphotos below
Warm
Cool

40
Design, Construction, Performance
41
Design, Construction, Performance
In this example of a vertical duct chase on an exterior wall, the insulation boundary and air barrier were properly aligned and installed with attention to detail. This eliminates thermal bypasses.
Kraft-facing is face-stapled to stud; insulation will be in substantial contact with wallboard.
Batts snugly fitted at tops and bottoms
Insulation carefully cut to fit around electrical box
Exterior wall baseplate sealed to subfloor
Over-framing
Careful sealing to complete the air barrier
Insulated supply duct
Insulation and air barrier were installed at the exterior wall before the heating duct and over-framing were installed.
3.3 Thermal Envelope

42
Design, Construction, Performance
43
Design, Construction, Performance
3.3.2 Foundations
Basements were the dominant foundation type; 92% of study homes had full or partial basements. Crawl spaces were found in 20% of the study homes, often in combination with basements; only 8% of study homes had full crawl spaces. No slabs-on-grade were observed, with the exception of the on-grade edges of walkout basement slabs.
BasementsAs noted in Chapter 2, basement insulation practices changed significantly in response to the 1996 code change requiring basement wall insulation. In the pre-group homes, only about 15% of basement walls were insulated at time of construction. This was driven entirely by basement finishing (insulation and finish extent ranged from a small part of the basement to the entire space). By the time inspections were done for this study, another 20% of pre-group homeowners had insulated and finished all or part of the basement after construction. In contrast, basement wall insulation was installed at time of construction in more than 90% of post-group homes.
In the pre-group homes, almost all insulated basements were insulated with fiberglass batts in an interior frame wall as part of the finish process. In almost all post-group homes with insulated, unfinished basements, the insulation approach was a vinyl-faced fiberglass blanket fastened to the interior face of the concrete foundation wall. Post-group homes with finished basements used the same approaches as pre-group homes. Exterior foam insulation was used in three post-group homes, in all cases supplementing interior insulation.
Four of five homeowners reported their basements were cooler in winter than the main level, with the proportion significantly higher for those with uninsulated basements. Temperature data bore this out. Uninsulated basements averaged 63 degrees Fahrenheit in the winter. Insulated basements averaged four degrees warmer. They also had higher interior wall surface temperatures (meaning better radiant comfort). Basement comfort continued to be compromised, though, by air leakage (including through code-required combustion
3.3 Thermal Envelope
G-011c
17%14%
0%
91%
69%
9%
0%
25%
50%
75%
100%
Uninsulated Partly insulated Fully insulated
Insulation extent
Occ
urr
ence
(%)
Basement Insulation Extent(pre-group versus post-group)
Pre-groupPost-group
G-011cbw.eps Graph #6 4/10/02
G-013
No insulation Some insulation Most / full insulation
Basement wall insulation extent
Tem
pera
ture
(de
gree
s F)
Basement Winter Temperature Versus Insulation Extent
G-013bw.eps Graph #7 5/2/02
Includes pre- and post-group homes
55
60
65
70
75Average temperature and range shown
63.064.3
66.8
Average winterthermostat
setpoint = 67.9 F
The code change stimulated a large increase in the number of basements insulated at time of construction.
Insulated basements averaged about four degrees Fahrenheit warmer than uninsulated basements.

42
Design, Construction, Performance
43
Design, Construction, Performance
Uninsulated. Strips of concrete exposed above grade in this stepped foundation stood out as hot spots compared with the insulated frame wall and earth. Eight inches of concrete provide only about R-1 resistance to heat flow.
Which Basement is Insulated? Infrared photos (right) illustrate differences in heat loss.
Insulated. In this house, the exposed portion of the foundation was not significantly warmer than the adjoining wall and earth.
air ducts and the draft hoods of atmospherically vented water heaters), lower-quality windows, and poor control over heating and cooling delivery.
Not all those reporting a cold basement viewed it as a comfort problem, presumably because many weren’t using their basement as primary living space.
Homeowners typically felt that basement insulation increased basement comfort, saved energy and was a good investment. In contrast, some builders did not believe the savings from insulating a basement justified the added cost passed on to their buyers.
Basements with Structural SubfloorsA growing trend in new Fort Collins construction has been the use of structural wood basement subfloors in areas where expansive soils are present. This trend presents new design challenges that haven’t been fully resolved. Studies in the metro Denver area have identified the crawl space areas beneath the structural floors as being vulnerable to high humidity and mold growth. Only one study home had such a basement design, the result of a very expensive retrofit to address the heaving of the slab floor in a conventional basement.
3.3 Thermal Envelope
Warm
Cool

44
Design, Construction, Performance
45
Design, Construction, Performance
Crawl Spaces
Conventional building practice for several decades, reinforced by code requirements, included venting all crawl spaces for moisture control reasons. In the 1980s and early 1990s, the common practice in Fort Collins was to insulate the perimeter walls yet vent the crawl space—a clear example of a thermal bypass. The 1996 energy code eliminated this “hybrid” design option. Reflecting better understanding of how air and moisture move in crawl spaces, the code for the first time allowed “warm” crawl spaces to be built. These crawl spaces are insulated and sealed at the perimeter and not vented (like a short basement). The code also allowed a “cold” crawl space design, with insulation and air sealing at the floor above the crawl space. In all options, a moisture barrier was required on the floor of the crawl space.
No cold crawl spaces were observed. Pre-group crawl spaces were hybrid or warm design (note that code did not sanction the latter approach at the time). Post-group crawl spaces were all either warm or “heated” designs (a “heated” crawl space is simply a “warm” crawl space without any physical separation from an adjoining basement). Zonal pressure testing clearly showed that warm or heated crawl spaces were the only practical design alternatives.
Crawl Space Insulation Insulation installation problems were common in crawl spaces.
Although the code-required R-19 perimeter insulation was present in this crawl space, the rated R-value was compromised by installation flaws.
In this crawl space, insulation was effectively installed. This should ensure that the rated R-value will be delivered.
The batts hung away from the foundation by as much as 6 inches, allowing warm crawl space air to bypass the insulation.
3.3 Thermal Envelope
Insulation was compressed where it attached to the rim joist.
Batts hung 18 to 24 inches short of the interior grade.

44
Design, Construction, Performance
45
Design, Construction, Performance
Crawl spaces were predictable places to find insulation problems. In post-group homes, 25% of the crawl spaces did not meet prescriptive code R-value requirements. Serious installation flaws were observed in two-thirds of the pre-group crawl spaces and half of the post-group crawl spaces.
Moisture barriers were present on the floors of all crawl spaces in both the pre- and post-groups. They were almost always effectively installed. Dampness was noted under the moisture barrier in three crawl spaces; the sources of moisture were not investigated as part of this study.
Slabs-on-Grade
No homes in the study sample were full slab-on-grade construction; however 12% of the completed homes had walkout basements with one slab edge at grade. None of the on-grade slab edges were insulated (for post-group homes, a code violation).
The on-grade slab edge of this walkout basement had no perimeter insulation. As can be seen in the infrared photo (right), the temperature of the slab dropped toward the edge. This translated into heat loss, cold floors and the potential for condensation.
3.3 Thermal Envelope
Warm
Cool

46
Design, Construction, Performance
47
Design, Construction, Performance
3.3.3 Framed Components
All homes in the 80-home study sample were built using conventional wood-frame construction.
Floors
The two floor types inspected in this study were cantilevered floors exposed to the outdoors and floors of living spaces above garages.
A cantilevered floor is one that extends living space beyond the plane of the structural member that supports it. Three-quarters of the 80-home sample had some cantilevered floor area (the total is close to 100% if small bump-outs for fireplaces are counted). Most cantilevers extended one to two feet.
Cantilevered floors were prone to insulation and air sealing flaws. Although some progress was observed from pre- to post-group construction, an estimated 70% of post-group homes had cantilever insulation and/or air sealing problems. The level of attention to detail varied widely.
Customer complaints about cold and drafts around fireplaces and built-in entertainment centers sometimes stemmed from problems with cantilever floors on which they were located.
Floors over garages also were common study home features; they ranged from a few square feet to more than 700 square feet. They were predictable problem areas from the standpoints of air sealing and insulation installation. The location of the air barrier was often poorly defined. Code-required R-19 insulation was never adequately supported and often drooped away from the subfloor above, providing a space on the warm side of the insulation through which air could move. R-30 insulation, observed in most post-group homes, was more likely to fill the joist cavities completely, eliminating the air space. Plumbing, electrical and duct runs through joist cavities made it difficult to execute insulation and air sealing details correctly.
3.3 Thermal Envelope
As the infrared photo (right) shows, this dining room cantilever was cold due to ineffective insulation and air leakage. (Infrared photo taken with blower door operating.)
Exterior soffit appeared to be tightly fit
Residual warmth from heat run
Cantilever boundary clearly visible
Warm
Cool

46
Design, Construction, Performance
47
Design, Construction, Performance
Cantilever Challenges Insulation and air sealing flaws were common at cantilevers.
Interior view of some cantilever problems. It is not clear whether the air barrier was intended to be at the interior blocking or at the exterior soffit. Main level cantilevers posed access
challenges because they were so close to grade. There was no soffit on this one. The construction superintendent was aware of the problem and planned to dig a hole to be able to install it.
Blower door tests often revealed large amounts of air leaking through recessed lighting located in floors with heated space above and below. This could be a symptom of leaks in the air barrier at an exterior cantilever; air moved through the floor joist cavities to exit at the light cans.
Insulation only filled part of the cavity.
Blocking was removed where the heating duct penetrated the cantilever.
Rectangular blocking coupled with engineered “I-beam” joists left large gaps at the edges.
Smoke source made air movement visible.
3.3 Thermal Envelope
This photo illustrates an effective sealing job. Easily cut material, sealed at the edges, blocks air movement through the cantilever.

48
Design, Construction, Performance Design, Construction, Performance
Frame Walls
Almost all study home frame walls used 2x4 construction, 16” on center, with R-13 batt cavity insulation. R-15 batts were occasionally observed. Walls in seven homes in the 80-home sample (four pre-group and three post-group) and one home in the 20-home under-construction sample were fully framed using 2x6 lumber, 16” on center, insulated with R-19 batts. R-3 exterior foam sheathing covered a portion of the exterior walls in about 70% of the homes under construction; when it was present, area coverage varied from 5% to 100%, with an average of about 60%. Few knee walls to attic space were sheathed; in the unsheathed walls, insulation was directly exposed to unconditioned attic air.
“Advanced framing” practices—that use less wood and provide more room for insulation—were encouraged in the 1996 code, the 1996/97 training sessions, and the Builder’s Guide. Some movement in this direction was observed from pre- to post-group homes. The most consistent differences were intersections between interior partition walls and exterior walls (about half were framed with ladder blocking, leaving cavities that could be insulated from the interior) and corners in exterior walls (about 25% were advanced framed, three-stud corners, insulatable from the interior).
Some improvements from pre- to post-group also were observed in frame wall air sealing and insulation installation practices. Predictable problems remained, though, as illustrated in the photos.
The coverage of insulating foam sheathing on study homes ranged from zero to 100%. When it was present, coverage averaged about 60%. The typical foam sheathing was nominal 1/2-inch extruded polystyrene, rated at R-3.
3.3 Thermal Envelope

48
Design, Construction, Performance Design, Construction, Performance
The infrared image below illustrates the large amount of wood framing in conventionally framed walls. The framing was cooler than the adjacent insulated cavities, warmer than the conventional double-pane window (about R-2) and the fireplace.
Top plate
Residual warmth from heat run
Heat loss higher at corners because of more wood, less insulation and heat loss in two directions
Pony-wall studs
Window header
Studs
Warm
Cool
3.3 Thermal Envelope
Conventional and advanced framing were used about equally at partition wall intersections in post-group homes. Conventional channel-stud framing (left) created cavities that could only be insulated from the exterior before the house was sheathed. In practice, they were rarely insulated. Ladder blocking (right), an example of advanced framing, left accessible cavities that could be insulated from the interior at the same time the rest of the wall was insulated.
49

Design, Construction, Performance
51
Design, Construction, Performance
3.3 Thermal Envelope
Rim Joists Rim joists often posed challenges for insulation and air sealing.
When the first floor joist was framed tight to the foundation, it left little space to insulate the rim joist. Plumbing and wiring complicated the job in this example.
Many obstructions—such as the plumbing and ductwork shown here—made it harder to insulate rim joists effectively. Even where nothing was in the way, insulation was sometimes placed in cavities with insufficient attention to detail. Also note there was no vapor barrier to prevent moisture from reaching the rim joist.
First floor joist
Rim joist
The infrared photo (right) shows the symptoms of compressed insulation and air leakage at the rim joist.
Warm
Cool
50

Design, Construction, Performance
51
Design, Construction, Performance
3.3 Thermal Envelope
Knee walls were commonly insulated as shown in the photo on the left. Insulation batts were installed on the attic side of the framing, leaving a significant air space between insulation and wallboard. Attic air could move through this gap. The photo on the right shows knee wall insulation that was effectively installed between the framing. These batts will be in substantial contact with the wallboard as required by the code.
(a) (c)
(b) (d)
This group of photos illustrates kneewall practices and performance. Photos (a) and (b) show two views of the same kneewall. From the attic (b), the knee wall insulation appeared to be installed well. But there was a large air gap between the insulation batt and wallboard. There was also no sheathing on the attic side. There was nothing to prevent attic air from circulating and pulling heat from the gap between the insulation and wallboard. Infrared photo (c) shows an irregular temperature pattern reflecting the inconsistent thermal performance of the knee wall insulation. Note the framing was warmer than the cavities. For comparison, photo (d) shows an exterior wall in the same room. It displayed the more uniform temperature pattern of a well-insulated wall; framing was cooler than the insulated cavities.
Knee wall to attic space
Partition wall to another heated space Warm
Cool

52
Design, Construction, Performance
53
Design, Construction, Performance
3.3 Thermal Envelope
Attics and Cathedral Ceilings
Attics have traditionally received the highest insulation R-values in the house, because there is ample room to insulate, relatively easy access and the material can be economically installed. All attics over flat ceilings and most of the attics over gently sloping vaulted ceilings were insulated with loose-fill fiberglass. Batts were used on steeper pitches and cathedral ceilings. Based on measurements of insulation thickness, about 25% of attics fell somewhat short of meeting code R-value requirements. Occasionally, as an oversight, attics were left uninsulated in part or in full. A variety of insulation installation details often were not executed according to code requirements (for example, 12 inch high attic access curbs weren’t tall enough for the 15 to 16 inches of loose fill fiberglass insulation required to achieve R-38; eave areas often didn’t meet the code’s requirement of R-15 to the exterior edge of the wall top plate; batts in cathedral and vaulted ceilings were sometimes ineffectively installed).
Significant air leakage connections between the conditioned space and attic existed in many homes, through many different paths. These leaks had implications for health and safety, comfort, building durability and energy use.
Vaulted and cathedral ceilings tended to have more insulation installation problems than flat ceilings.
On the flat section, insulation will generally be in “substantial contact” with the wallboard (as code requires), despite small channels along the edges of each joist bay where the batts were inset stapled to the joists.
In some areas, the insulation was held back much further. This will leave gaps in which attic air can circulate between insulation and wallboard.

52
Design, Construction, Performance
53
Design, Construction, Performance
Leaks to the AtticThough many penetrations were sealed, there were often many remaining opportunities for air to move between conditioned spaces and attics.
The chase surrounding this combustion air duct was partially sealed. The sheet metal collar was reasonably well done, but the rest of the job was never completed.
Air leaked around electrical boxes and through wiring penetrations.
Whole house fan louvers were quite leaky even when closed. Code-required winter covers were provided to owners of two of the five post-group homes with whole house fans.
Tape is a temporary seal that will probably fail in a few years.
Significant gap where access to seal was difficult
These joints should have been fully sealed with long-lasting caulk.
3.3 Thermal Envelope

54
Design, Construction, Performance
55
Design, Construction, Performance
Leaks to the Attic (continued)The infrared photo (right) reveals hidden leaks to the attic via a partition wall. During the winter, warm house air constantly pushes upward, escaping to the attic through holes and cracks like these. (This infrared photo was taken with the blower door operating, so that the air flow was reversed and cold attic air was drawn through leaks into the house.)
Air leaks through gaps between wallboard and framing. These gaps are skinny (1/16” to 1/8” typical) but extend many lineal feet.
Blocking above return grille and wall cavity return was very leaky
3.3 Thermal Envelope
Warm
Cool

54
Design, Construction, Performance
55
Design, Construction, Performance
3.3.4 Windows and Skylights
Windows perform many important functions. However, they are weak spots in the thermal envelope for heat transfer driven both by indoor/outdoor temperature differences and solar gains. “High performance,” low-e coated glass, first developed in the early 1980s, offers one way to improve thermal performance with a straightforward product substitution. For any window with two or more panes, frame choice is also important to the overall thermal performance of the window.
Window U-values and R-valuesNew window choices have evolved over the past 30 years, with multiple panes of glass, a variety of frame types, glass coatings, and gas fills between the panes. One of the major differences between these choices is their ability to transfer heat, as denoted by the window’s rated “U-value.” The U-value is the inverse of the more familiar R-value, or resistance to heat transfer. The table lists representative values for these properties for some of the major product types.
Representative Window U-values and R-valuesGlass/Frame Type U-value* R-value*
Single, uncoated/any frame 1.0 1.0Double, uncoated/aluminum frame 0.87 1.1Double, uncoated/wood or vinyl frame 0.50 2.0Double, low-e coated/wood or vinyl frame 0.38 2.6
* These numbers represent whole-window properties, including the effects of glass, frames and edge spacers.
Lower U-value ratings mean lower heating and cooling bills, better comfort, and greater resistance to condensation. Low-e coatings also reduce solar heat gain and fabric fading; windows with low “Solar Heat Gain Coefficient” ratings are most effective in this regard.
Warm
Cool
Conventional double-paned windows with wood or vinyl frames have an insulating value of about R-2, compared with a 2x4 framed wall insulated with R-13. In the infrared photo (right), windows showed up as thermal “holes” in the shell of the home.
3.3 Thermal Envelope

56
Design, Construction, Performance
57
Design, Construction, Performance
The average study home had a total window area of almost 350 square feet. About one-third of study homes had skylights; in all cases, skylight areas were small. There were no significant changes in the ratios of average window-to-wall area or window-to-floor area from pre- to post-group homes; variation across the sample was large in both groups.
G-084
Individual houses
Win
dow
/wal
l rat
io
Ratio of Window Area to Floor Area(pre-group versus post-group)
G-084bw.eps Graph #9 4/15/02
0%
5%
10%
15%
20%
25%
Pre-groupPost-group
10.0% = Pre-group average 9.5% = Post-group average
3.3 Thermal Envelope
G-083
Individual houses
Win
dow
/wal
l rat
io
Ratio of Window Area to Wall Area(pre-group versus post-group)
G-083bw.eps Graph #8 4/17/02
0%
5%
10%
15%
20%
25%
11.5% = Pre-group average 11.6% = Post-group average
Pre-groupPost-group
Ratios of window area to either wall area or floor area varied widely across the sample. Similar averages and ranges were observed for both pre- and post-group homes.

56
Design, Construction, Performance
57
Design, Construction, Performance
Window Glazing Type
Uncoated(97%)
Low-E(3%)
G-004a
G-004abw.eps Graph #10 4/15/02
Includes pre- and post-group homes
Almost all of the study homes used uncoated double-glazed windows; low-e coated windows were found in only two of 80 homes.
On the main living levels, window frames in every study home were either wood or vinyl, a good match with a double-pane window. The market penetration of vinyl frames increased from less than half in the pre-group to almost two-thirds in post-group homes.
Windows in basement masonry walls commonly used metal frames with much poorer thermal performance. However, the use of vinyl-framed basement windows rose significantly from pre- to post-group homes.
Only two of 80 study homes used high performance, low-e coated windows.
G-005e
Occ
urr
ence
(%)
Basement Window Frame Type(pre-group versus post-group)
Pre-groupPost-group
3%13%
31%
9%
84%
60%
0%
25%
50%
75%
100%
Metal Vinyl Wood
Frame material
G-005ebw.eps Graph #11 4/10/02
An aluminum frame with no thermal break, set into a steel buck poured in place with the concrete foundation (above left), offered the lowest up-front cost, yet delivered the poorest thermal performance. The use of a vinyl frame, also set into a steel buck (left), offered one step better performance.
The majority of study home basement windows used metal frames. However, there was a significant increase in the use of vinyl-framed windows in post-group homes.
3.3 Thermal Envelope
Basement WindowsA variety of frame types were used for basement windows.

58
Design, Construction, Performance
59
Design, Construction, Performance
Windows were the source of a number of problems reported by homeowners, including winter cold spots, summer overheating, temperature variations from one part of the house to another, glare, condensation and fabric fading. Homeowner discomfort occasionally led to expensive retrofits. In other instances, homeowners kept window coverings closed much of the time in an attempt to mitigate problems.
Case Study: Cooking with Sunlight
The family room in one recently built home had a tall ceiling and was flanked on two sides by two-story window walls: most on the southwest, some on the northwest. This abundance of unprotected glass, all standard double-glazed, created severe glare and year-round over-heating. On sunny winter days, the family room temperature often approached 80 degrees Fahrenheit. On late summer afternoons, the temperature hit 85 to 90 degrees in this space, even with the four-ton air conditioner running full bore. In addition to discomfort, the owners also were concerned about furniture fading in the sun. To mitigate the problems, the homeowners had window film installed on all of the southwest-facing windows in this 4,100 square foot home. Cost: about $1,250 for 320 square feet of window area. The window film has helped, but the space still runs very warm.
Two changes in design could have avoided these problems. The first would have been “sun-conscious design;” i.e. thinking about the sun path, orienting the home more carefully, and placing and sizing windows accordingly, with appropriate shading. Without increasing the cost of the home appreciably, this could have provided solar benefits without the liabilities.
The second change would have been to specify high-performance, low-e windows with a low Solar Heat Gain Coefficient. These windows cost more. The cost to a builder to upgrade from uncoated to low-e windows runs between $1 and $1.50 per square foot of window area, depending on the quality and characteristics of the coating selected. But they’re a bargain compared with the window film, which cost about $4 per square foot, installed. So in this case, if the builder had increased his buyer’s cost for the window package by $600, both he and the homeowner would have benefited. The homeowner would have been more comfortable, and the builder would have pocketed the increased window markup as well as benefited from a more satisfied customer.
3.3 Thermal Envelope
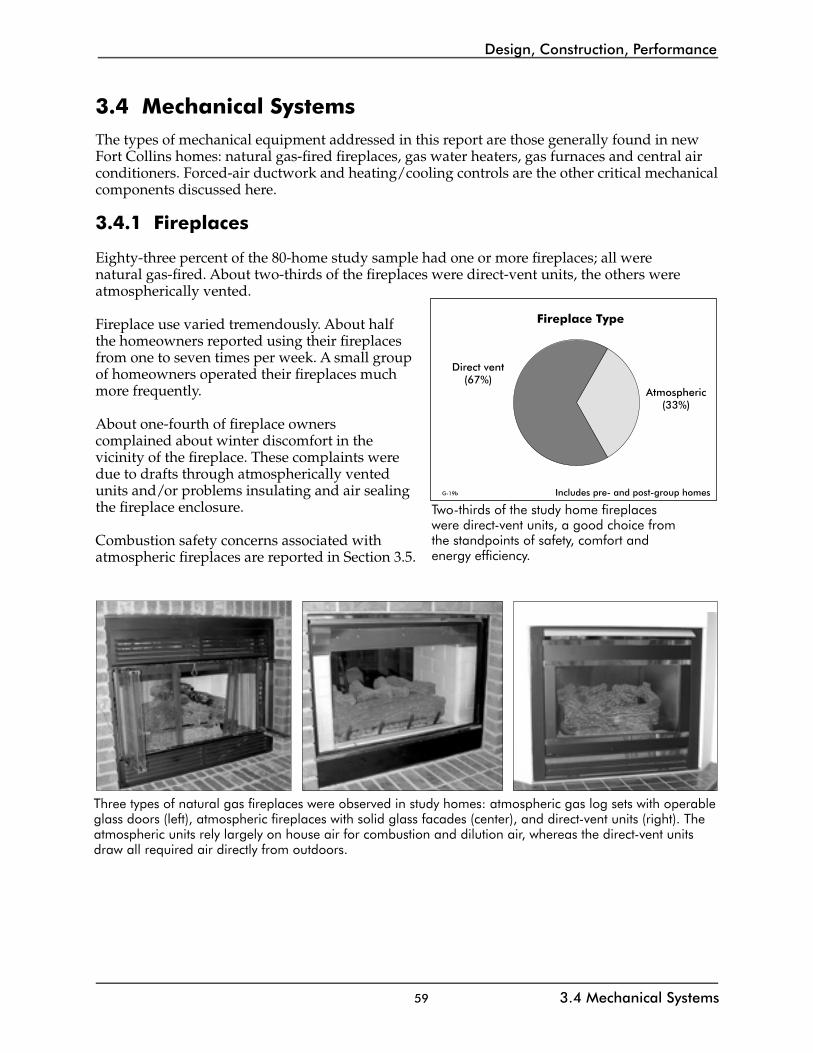
58
Design, Construction, Performance
59
Design, Construction, Performance
3.4 Mechanical SystemsThe types of mechanical equipment addressed in this report are those generally found in new Fort Collins homes: natural gas-fired fireplaces, gas water heaters, gas furnaces and central air conditioners. Forced-air ductwork and heating/cooling controls are the other critical mechanical components discussed here.
3.4.1 Fireplaces
Eighty-three percent of the 80-home study sample had one or more fireplaces; all were natural gas-fired. About two-thirds of the fireplaces were direct-vent units, the others were atmospherically vented.
Fireplace use varied tremendously. About half the homeowners reported using their fireplaces from one to seven times per week. A small group of homeowners operated their fireplaces much more frequently.
About one-fourth of fireplace owners complained about winter discomfort in the vicinity of the fireplace. These complaints were due to drafts through atmospherically vented units and/or problems insulating and air sealing the fireplace enclosure.
Combustion safety concerns associated with atmospheric fireplaces are reported in Section 3.5.
3.4 Mechanical Systems
Fireplace Type
Direct vent(67%)
Atmospheric(33%)
G-19b
G-019bbw.eps Graph #12 4/19/02
Includes pre- and post-group homes
Fireplace Type
Two-thirds of the study home fireplaces were direct-vent units, a good choice from the standpoints of safety, comfort and energy efficiency.
Three types of natural gas fireplaces were observed in study homes: atmospheric gas log sets with operable glass doors (left), atmospheric fireplaces with solid glass facades (center), and direct-vent units (right). The atmospheric units rely largely on house air for combustion and dilution air, whereas the direct-vent units draw all required air directly from outdoors.

60
Design, Construction, Performance
61
Design, Construction, Performance
3.4.2 Water Heaters
Almost all study home water heaters were atmospherically vented, natural gas-fired storage tank units. Associated combustion safety concerns are reported in Section 3.5.
There was a trend toward increasing water heater efficiency from pre- to post- group homes.
About 80% of post-group homes had no provisions to control standby heat losses from the piping in the vicinity of the water heater. This was a code violation.
Gas atmospheric
(97%)
Electric(1%)
Gas power vent(1%)
G-21
Gas sealedcombustion
(1%)
Water Heater Type
Includes pre- and post-group homes
Gas-fired, atmospheric water heaters were the norm, raising concerns about combustion safety.
Atmospheric gas water heater
G-022c
0%
25%
50%
75%
100%
Energy Factor range
Occ
urr
ence
(%)
Gas-fired Water Heater Rated Efficiency(pre-group versus post-group)
3% 5% 3%13%
18%
0%
90%
69%
0.54 to 0.57 0.58 to 0.61 0.62 to 0.65 Greater than0.65
Pre-groupPost-group
G-022cbw.eps Graph #14 4/19/02The seasonal efficiency of a water heater is rated as an “Energy Factor” from zero to 1.0 (0% to 100%). The majority of study home water heaters had Energy Factors at or just above the federal minimum standards referenced in the energy code. However, the trend from pre- to post-group homes showed an increase in the use of higher efficiency units.
3.4 Mechanical Systems

60
Design, Construction, Performance
61
Design, Construction, Performance
3.4.3 Forced-Air Heating and Cooling
All but one of the 80 study homes were heated with a natural-gas fired, forced-air furnace and ductwork; the single exception used a boiler. About half of the study homes also had a central air conditioner that shared the furnace air handler, ductwork and thermostat. (Note: as discussed in Chapter 4, about half of the study home air conditioners were installed at time of construction, the other half were retrofit installations.)
Some homeowners reported problems related to their heating and cooling systems, including inadequate control, poor comfort, noise, and lights dimming when air conditioners turned on. Zonal comfort problems were particularly common, as discussed in Section 3.7.
A potentially dangerous side effect of forced-air heating and cooling system practices was combustion safety problems, described in Section 3.5.
3.4 Mechanical Systems
Appliance Types
The many different options for natural-gas fired fireplaces, water heaters, furnaces and kitchen stoves can be grouped into several categories with regard to air requirements and venting.
• Unvented. Vent-free appliances use house air for combustion and exhaust all combustion products into the home. The only unvented combustion appliance allowed under the City’s building code is a gas kitchen stove.
• Atmospherically vented. These appliances use house air for combustion and rely on the buoyancy of the hot exhaust gases to vent through a dedicated flue. A draft hood draws dilution air (from the house) and decouples the appliance from sudden pressure changes at the exterior end of the flue. Typical residential water heaters are atmospherically vented.
• Induced-draft. Induced-draft appliances use a small fan to draw house air through the combustion chamber and heat exchanger. Venting is accomplished through buoyancy but there is no draft hood or dilution air. Most mid-efficiency furnaces are induced- draft design.
• Power-vented. In these appliances, which also rely on house air for combustion, a fan forcibly blows combustion products out of the house. Dilution air is used to cool combustion products. Most manufacturers offer at least one model of power-vented water heater.
• Sealed-combustion or direct-vent. These appliances differ from the other types in that they use 100% outdoor air for combustion, with a complete barrier between the combustion process and house air. Water heaters, fireplaces and furnaces are all available in these configurations.
The choice of appliance type affects how the appliance is vented, where it can be located, combustion air opening requirements, combustion safety, air leakage, efficiency and cost.
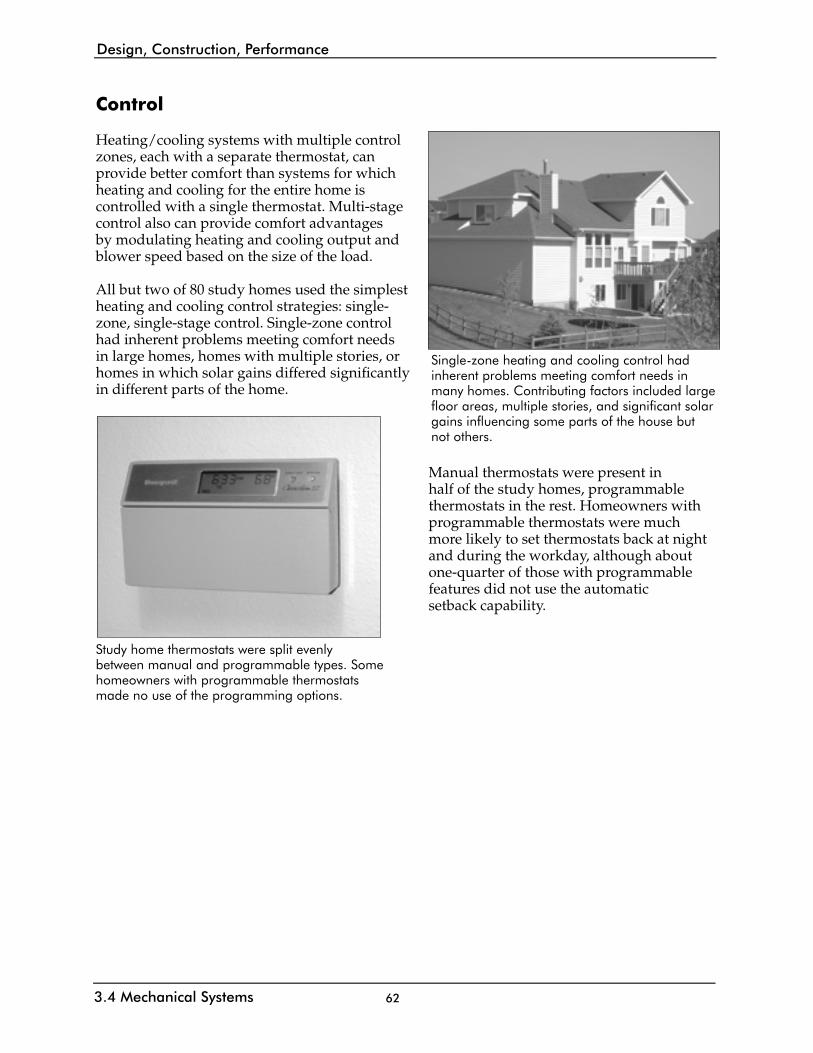
62
Design, Construction, Performance
63
Design, Construction, Performance
Control
Heating/cooling systems with multiple control zones, each with a separate thermostat, can provide better comfort than systems for which heating and cooling for the entire home is controlled with a single thermostat. Multi-stage control also can provide comfort advantages by modulating heating and cooling output and blower speed based on the size of the load.
All but two of 80 study homes used the simplest heating and cooling control strategies: single-zone, single-stage control. Single-zone control had inherent problems meeting comfort needs in large homes, homes with multiple stories, or homes in which solar gains differed significantly in different parts of the home.
Manual thermostats were present in half of the study homes, programmable thermostats in the rest. Homeowners with programmable thermostats were much more likely to set thermostats back at night and during the workday, although about one-quarter of those with programmable features did not use the automatic setback capability.
Single-zone heating and cooling control had inherent problems meeting comfort needs in many homes. Contributing factors included large floor areas, multiple stories, and significant solar gains influencing some parts of the house but not others.
Study home thermostats were split evenly between manual and programmable types. Some homeowners with programmable thermostats made no use of the programming options.
3.4 Mechanical Systems

62
Design, Construction, Performance
63
Design, Construction, Performance
Equipment
Almost all heating and cooling equipment present in the study homes had rated efficiencies at, or marginally above, the minimums set by federal law and reflected in the energy code. Higher efficiency equipment was present in only a few study homes.
SEER 10 to 10.9(93%)
SEER 11 or higher(7%)
G-32
Central Air Conditioner Rated Efficiency
Includes pre- and post-group homes
Most heating and cooling equipment was rated at or slightly above the federal minimum efficiency standards referenced by the energy code. Almost all furnaces were rated at 80% AFUE, versus a minimum standard at 78% AFUE (Annual Fuel Utilization Efficiency, the seasonal efficiency rating). Almost all air conditioning units were rated between 10.0 and 10.9 SEER, versus a minimum standard of 10.0 SEER (Seasonal Energy Efficiency Rating).
Integrated space/water
heating 90+% AFUE
(1%)
G-31
Induced draftfurnace
80% AFUE(92%)
Boiler90+% AFUE
(1%)
Note: All systems gas-fired
Heating Equipment Rated Efficiency
Includes pre- and post-group homes
Sealedcombustion
furnace90+% AFUE
(6%)
G-031bw.eps Graph #15 5/2/02
3.4 Mechanical Systems
About half the study homes had central air conditioning. The compressor and condensor were located in an outdoor unit like this, with the expansion valve and evaporator coil located in the supply plenum at the furnace.
Induced-draft furnaces supplied space heating in almost all study homes.

64
Design, Construction, Performance
65
Design, Construction, Performance
Properly sized equipment will run nearly continuously on the coldest and hottest days of the year. Oversized equipment runs for shorter periods at higher intensity, compromising comfort, performance and equipment lifetime. It costs more up front. Higher capacity equipment also requires higher air flow, meaning larger ductwork and larger blowers.
Excessive oversizing was observed for 70% of study home furnaces and every study home air conditioner. Furnaces were sized an average of 158% of the minimum required size (maximum 238%) versus an industry recommended maximum of 140%. Furnace sizing practices did not appear to reflect the reduced heating loads due to insulated basements. Air conditioners were even more oversized, at an average of 208% of the minimum required size (maximum 322%) versus an industry recommended maximum of 115%. These data raised questions about sizing procedures and excessive safety margins.
With filters removed for testing, about one-quarter of study home furnaces operated near the limits or outside of manufacturer’s specifications for external static pressure and/or heat rise. In about half of the homes with air conditioning, air flows across indoor coils deviated considerably from the typical specification of 400 cfm/ton. Fourteen percent of air conditioners had air flows below 350 cfm/ton, while a third of the sample had flows exceeding 500 cfm/ton. (With filters in place, external static pressure would increase somewhat, in turn decreasing air flows and increasing furnace heat rise).
G-33
0%
50%
100%
150%
200%
250%
Individual houses
Furn
ace
outp
ut c
apac
ity /
des
ign
load
140% = Maximum recommended ratio
158% = Average ratio
Ratio of Installed Furnace Capacity to Design Heating Load
Includes pre- and post-group homes
G-033bw.eps Graph #17 4/19/02
Oversized equipment was found in many study homes. Almost half of the furnaces exceeded the maximum recommended size. All of the air conditioners were excessively sized; the average unit was about twice as large as needed.
0%
100%
200%
300%
Individual houses
AC
cap
acity
/ d
esig
n lo
ad
G-34
115% = Maximum recommended ratio
208% = Average ratio
Includes pre- and post-group homes
Ratio of Installed Air Conditioner Capacity to Design Cooling Load
G-034bw.eps Graph #18 4/19/02
3.4 Mechanical Systems

64
Design, Construction, Performance
65
Design, Construction, Performance
G-42
0%
50%
100%
150%
Individual houses
Hea
t ri
se v
s. r
ange
90% = Maximum recommended operating point
Note: filter removed for test
Includes pre- and post-group homes
Furnace Heat Rise Versus Manufacturer's Specified Range
73% = Average
G-042bw.eps Graph #19 5/2/02
G-43
0
100
200
300
400
500
600
700
Individual houses
Air
flo
w (
cfm
/ton
)
400 cfm/ton = Typical manufacturer specification
452 cfm/ton = Average
Includes pre- and post-group homes
Ratio of Cooling Air Flow to Air Conditioner Capacity
Note: filter removed for test and indoor coil was dry
G-043bw.eps Graph #20 5/2/02
Installed Equipment PerformanceHeat rise across the furnace and air flow across the indoor air conditioning coil
reflected how the equipment operated in tandem with the ductwork.
About one-quarter of the furnaces operated at or outside manufacturer limits for “heat rise.” High heat rise indicates low air flow or overfiring. It reduces efficiency and reduces equipment lifetime by putting more thermal stress on the heat exchanger. Low heat rise may mean the air delivered to the house is too cool for comfort.
In about half of the air conditioning units, measured air flow across the indoor coil deviated considerably from manufacturer specifications. Low air flows reduce equipment efficiency and capacity. Excessively high flows use more fan energy than necessary for design performance.
3.4 Mechanical Systems

66
Design, Construction, Performance
67
Design, Construction, Performance
Uncomfortable Upper Levels
Data presented in this report suggests that the high incidence of comfort problems on the upper levels of two-story homes—cold in winter, warm in summer—was predictable. The first four factors listed here affected comfort year-round; the fifth came into play during the summer.
1. Because they sit beneath an unconditioned attic or cathedral ceiling, upper levels have higher heating and cooling loads per unit of floor area than the main level or a basement. Yet upper level rooms typically had fewer supply registers per unit floor area than the main level.
2. Upper level registers had less air flow on average than main level or basement registers, as a result of higher pressure drop and more duct leakage through longer runs.
3. The single thermostat was always located on the main level. It could not directly sense the greater load variation on the upper level.
4. Oversized heating and cooling equipment meant shorter run times, hence less time that the air handler fan circulated air between rooms and levels, helping to equalize temperatures.
5. During the winter, some problems were mitigated by the fact that an excess of warm air on the main level could rise up the stairwell to help heat the upper level. In summer, the effect of buoyancy was the opposite: cool air pooled on the main level and in the basement; the only cooling that reached the upper level was via the supply registers.
Data and observations suggested that not all manufacturers’ equipment installation instructions were carefully followed, that insufficient attention was paid to the interface between equipment and ductwork, and that these aspects of equipment operation were never tested or adjusted after installation.
3.4 Mechanical Systems
The only way to know whether a furnace is operating within the manufacturer-specified heat rise range is to measure heat rise. This test requires minimal tools and time. The testing contractor saw no evidence that heat rise had been measured on study home furnaces.

66
Design, Construction, Performance
67
Design, Construction, Performance
The photo below shows a basement view of duct system components in a typical study home. Residential duct systems were rarely fully specified on a set of plans; instead, the installer laid out and constructed the ductwork on site after the homes were framed. This often presented challenges to installers who had to establish paths for air flow between the air handler and every room in the house. Supply ducts were constructed of sheet metal components. Floor joist cavities and wall stud cavities often comprised a large portion of the return air ducts, coupling with sheet metal plenums near the air handler.
There were a large number of ducts and registers in the study homes: an average of 18 supply registers and six return grilles. However, as shown in the graph, they were not always distributed proportionally to heating and cooling loads.
This photo shows typical duct construction as seen from the basement. Supply air is delivered through sheet metal plenums and branch ducts. In contrast, much of the return air is pulled through wall and floor joist cavities, connected to the air handler through sheet metal plenums.
Supply plenum
Cutouts in the subfloor above a joist cavity return pull return air from wall cavities on the main level. Main level wall cavities, in turn, may connect to upper level floor and wall cavity returns.
Floor joists and end cap form part of the return air path.
Supply run to perimeter register
Return plenum
3.4 Mechanical Systems
0
2
4
6
8
10
Basement Main Upper # r
egis
ters
/ 1
00
0 s
f flo
or a
rea
G-49
2.8
8.2
6.6
Floor level
Supply Register Countsby Floor Level, for Two-story Homes
Includes pre- and post-group homes
G-049bw.eps Graph #21 4/22/02
Upper levels had fewer supply registers per square foot than main levels, presumably because of the challenges of running ducts to upper level rooms. The paradox: upper level rooms had higher heating and cooling loads per square foot than main level rooms. (Basements typically had the smallest number of registers because many study home basements were unfinished and not intentionally conditioned).
Ductwork

68
Design, Construction, Performance
69
Design, Construction, Performance
Air flow was sometimes reduced by constrictions or “choke points” at certain places in the ductwork. In the left photo, three elbows were needed to get a supply run past a structural member that could not be breached. Each elbow was equivalent to several feet of straight ductwork. The connection was made, but air flow was compromised due to large pressure drop. In the right photo, the cutout in the subfloor—that provides a path for return air back to the air handler—was much smaller than the register cutout on the wall.
3.4 Mechanical Systems
Duct Leaks Leaks of all sizes were observed in study home ductwork.
This supply duct was never connected to anything on the top end. Carpet was laid over the subfloor cutout, and the register was never installed.
This joint between a takeoff fitting and a plenum is an example of small supply duct leaks. Some takeoffs were much leakier.
Supply takeoffSupply plenumLeaks at corners
The photos illustrate construction practices that compromised duct system air flow performance. Significant flow constrictions were observed in some homes. As the duct leakage data indicates, duct leakage was an issue in every study home.
Subfloorcutout

68
Design, Construction, Performance
69
Design, Construction, Performance
Duct Leaks (continued)
Many things compromised the tightness of building cavities used as part of the return air system.
The cavity will leak everywhere there is a joint between wallboard and framing.
Return leaks involved both sheet metal and building cavity portions of the ductwork.
Leaky joints between sheet metal plenums and floor cavity returns
Sometimes individual leaks were large. This sheet metal return plenum was cut open to pull air from the floor joist cavity. The return run was then moved to an adjoining cavity, but this 12” x 15” cutout was never sealed.
Large, unused cutout
Wiring penetrations will be small leaks.
These wall studs formed two sides of a return duct. Wallboard will complete the other two sides.
Return air will be drawn through this cutout on its way back to the air handler.
Return air was pulled through this joist cavity.
Panning did not seal to the framing.
Floor joist
Return plenum
Supply plenum
3.4 Mechanical Systems

70
Design, Construction, Performance
71
Design, Construction, Performance
In almost all study homes, cloth duct tape was used to seal portions of the supply ductwork; in a small number of post-group homes, foil tape and/or duct mastic were used instead. In almost all homes, no sealing was observed in the rest of the system, either on the supply side or return side. The return portions of duct systems were inherently difficult to seal because of the extensive reliance on building cavities rather than dedicated sheet-metal ductwork.
The Uniform Mechanical Code requires all ductwork to be “substantially airtight” but doesn’t provide a quantitative standard against which to compare. The next page provides information on standards that have been established in recent years as the implications of duct leakage have become better understood.
3.4 Mechanical Systems
The left photo shows the typical duct sealing approach: cloth duct tape on round branch supply duct joints, nothing on other supply duct joints or return ductwork. In the right photo, duct mastic was used as a sealant. It is designed for strong adhesion and durability in this application and should last the life of the ductwork.
Typical return leaks like these were rarely sealed.
Cloth duct tape has a short life expectancy. Mastic

70
Design, Construction, Performance
71
Design, Construction, Performance
3.4 Mechanical Systems
Duct Leakage Standards
Duct leakage in homes began receiving increasing attention during the late 1980s in some parts of the country—particularly in areas where cooling was a big need, electricity was expensive, and/or typical construction practice placed most ductwork in vented attics or crawl spaces. As more has been learned about “house-as-a-system” effects, the interest in providing tight, well-balanced ductwork has been increasing nationwide.
The building code, through its reference to the Uniform Mechanical Code, sets a standard of “substantially airtight” ductwork, but does not quantify that criterion. Over the last decade, though, various entities around the United States have set numerical standards (typically in support of energy-efficiency certification programs). The tables below list several standards for duct tightness in new construction. Note three different units, all based on measured duct leakage under test conditions at 25 Pascals pressure: absolute leakage (CFM25), leakage compared with the conditioned square footage of the home (CFM25/sf) or leakage as a percentage of “system flow” (air flow through the air handler). The latter two approaches are used to compare the tightness of ductwork in different sized homes.
Duct Leakage Standards for New Construction
Organization or ProgramMaximum Duct Leakage forEnergy-Efficient Construction
Duke Power and North Carolina Power 0.03 CFM25/sfCarolina Power and Light 0.05 CFM25/sfWisconsin Energy Star Homes 0.10 CFM25/sfEnergy and Environmental Building Association 10% of system flow
California Energy Commission 6% of system flowEngineered for Life 5% of system flow for top ratingConsortium for Energy Efficiency 6% of system flow
Building America
5% of system flow when ductwork is outside the conditioned space10% of system flow when ductwork is inside the conditioned space
A National Association of Home Builders Research Center publication, A Builder’s Guide to Residential HVAC Systems (1997), set out numeric references against which to compare absolute duct leakage test results. These are as follows:
Leakage LevelLeakage to Exterior
(CFM25)Total Leakage
(CFM25)
Very Tight Less than 30 Less than 130Tight 30 to 100 130 to 250
Average or Typical 100 to 150 250 to 500Loose Greater than 150 Greater than 500

72
Design, Construction, Performance
73
Design, Construction, Performance
3.4 Mechanical Systems
G-98
Duct Leakage Compared to System Flow
0%
50%
100%
150%
200%
250%
300%
Individual houses
Duc
t le
akag
e at
25
Pa
(% o
f sy
stem
flo
w) 129% = Average
5 to 10% = Typical standard
ReturnSupply
Includes pre- and post-group homes
G-098bw.eps Graph #24 4/19/02
Measured duct leakage was very large in every tested home. The graphs present leakage results using three different units and compare leakage against representative standards (see sidebar on previous page). Depending on the specific unit and standard chosen, the average study home ductwork was six to 25 times leakier than the standards.
Based on a variety of information about duct testing results from other parts of the country, it appears that the average study home duct leakage ranks among the highest measured. Absolute duct leakage testing results from other recently built Colorado homes (collected between 1995 and 2001 by E-Star Colorado; not a random sample), averaged about a third lower than these study results—still very leaky.
G-52
Duct Leakage Compared to Conditioned Floor Area
0.00
0.20
0.40
0.60
0.80
1.00
1.20
Individual houses
0.58 CFM25/sf = Average
0.03 to 0.10 CFM25/sf = Typical standard
Includes pre- and post-group homes
Duc
t le
akag
e at
25
Pa
(CFM
25
/sf)
ReturnSupply
G-052bw.eps Graph #23 4/19/02
G-53
0
1,000
2,000
3,000
4,000
Individual houses
ReturnSupply
Absolute Duct Leakage(standard test conditions)
Includes pre- and post-group homes
250 CFM25 = Tight*
500 CFM25 = Loose*
1851 CFM25 = Average
Duc
t le
akag
e at
25
Pa
(CFM
25)
* Leakage descriptions by NAHB-RC (see sidebar)
G-053bw.eps Graph #22 4/19/02
These graphs show measured duct leakage in absolute units (top), leakage compared to the size of the house (middle) and leakage compared with system air flow (bottom). Standards used elsewhere are shown for reference.

72
Design, Construction, Performance
73
Design, Construction, Performance
Comparison of air flows at registers versus the flow through the air handler provided further evidence of the magnitude of duct leakage.
Almost all of the ductwork in the study homes was nominally located inside conditioned space. Yet duct leakage to outdoors could be measured in almost all homes, through indirect leakage via the shell of the home. Duct leakage to the exterior averaged 141 CFM25, about 8% of total leakage.
There was no relationship between heating and cooling loads in different rooms and air flow to/from these rooms. The obvious patterns were that registers closer to the furnace typically had more air flow and those further from the furnace had less flow. This was particularly apparent with the return ductwork in many two-story homes, in which measured flows through upper level registers were very small. These observations were consistent with ductwork constrictions and leaks.
Effective provisions for balancing air flows and pressures in the ductwork were not observed in any study home. Because of excessive leakage, homeowners had little success when they attempted to re-direct air to under-conditioned zones by adjusting supply register dampers.
G-57
Individual houses
Frac
tion
of a
ir h
andl
er f
low
0%
25%
50%
75%
100%
125%100% = Ideal, no leakage
81% = Measured average
Measurement error
Leakage flowsRegister flows
Total Air Flow at Supply Registers Versus Air Flow at Air Handler
Includes pre- and post-group homes
G-057bw.eps Graph #25 4/19/02Total Air Flow at Return Registers Versus Air Flow at Air Handler
G-58
Frac
tion
of a
ir h
andl
er f
low
0%
25%
50%
75%
100%
125% 100% = Ideal, no leakage 36% = Measured average
Includes pre- and post-group homes
Individual houses
Leakage flowsRegister flows
G-058bw.eps Graph #26 4/19/02
In a subset of homes, air flows were measured at each register. The total of the individual register flows was compared with the measured flow through the air handler. On average, about 80% of the flow through the air handler reached supply registers, while only about one-third of the air handler flow was drawn from return registers (the balances were made up via leakage).
3.4 Mechanical Systems
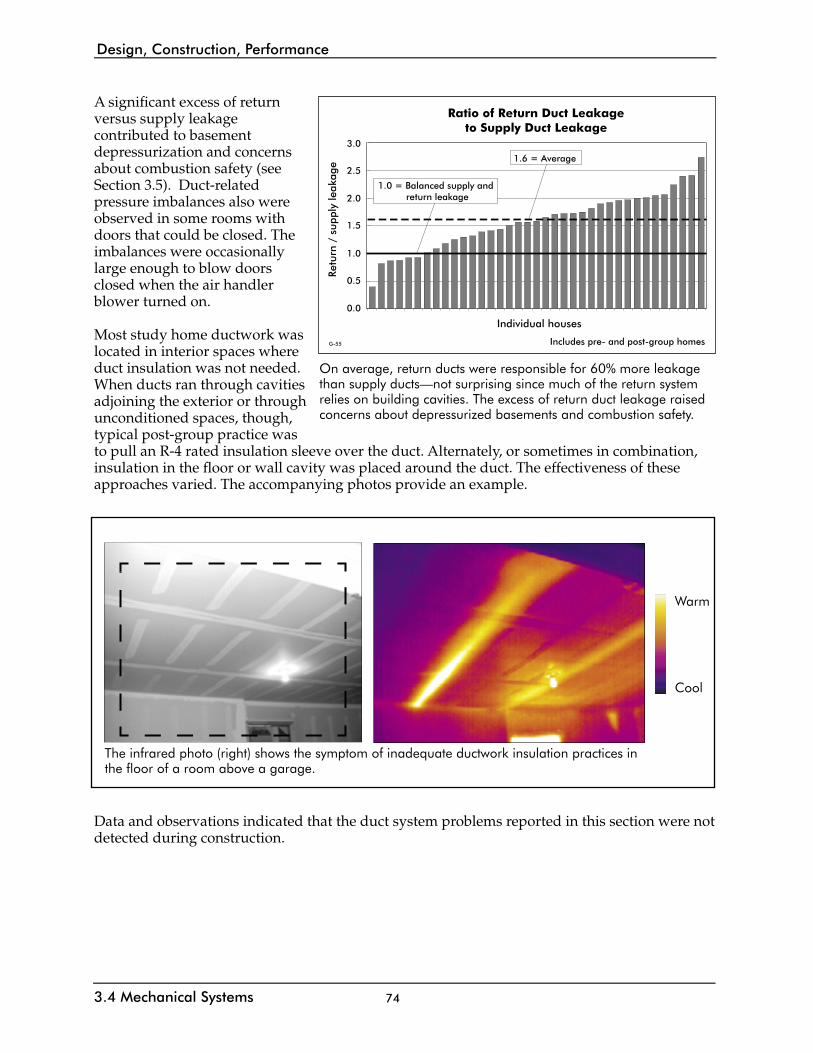
74
Design, Construction, Performance
75
Design, Construction, Performance
A significant excess of return versus supply leakage contributed to basement depressurization and concerns about combustion safety (see Section 3.5). Duct-related pressure imbalances also were observed in some rooms with doors that could be closed. The imbalances were occasionally large enough to blow doors closed when the air handler blower turned on.
Most study home ductwork was located in interior spaces where duct insulation was not needed. When ducts ran through cavities adjoining the exterior or through unconditioned spaces, though, typical post-group practice was to pull an R-4 rated insulation sleeve over the duct. Alternately, or sometimes in combination, insulation in the floor or wall cavity was placed around the duct. The effectiveness of these approaches varied. The accompanying photos provide an example.
Data and observations indicated that the duct system problems reported in this section were not detected during construction.
0.0
0.5
1.0
1.5
2.0
2.5
3.0
Individual housesRe
turn
/ s
uppl
y le
akag
eG-55 Includes pre- and post-group homes
1.6 = Average
1.0 = Balanced supply and return leakage
Ratio of Return Duct Leakageto Supply Duct Leakage
G-055bw.eps Graph #27 5/2/02On average, return ducts were responsible for 60% more leakage than supply ducts—not surprising since much of the return system relies on building cavities. The excess of return duct leakage raised concerns about depressurized basements and combustion safety.
3.4 Mechanical Systems
The infrared photo (right) shows the symptom of inadequate ductwork insulation practices in the floor of a room above a garage.
Warm
Cool

74
Design, Construction, Performance
75
Design, Construction, Performance
Case Study: Ductwork that Doesn’t Deliver
The discomfort experienced by the owners of one study home was caused by a combination of uneven heating by the sun and ductwork problems.
The rear elevation of this 4,700 square foot, two-story home faced south. Most of the glass on that elevation was on the main level, delivering a significant amount of uncontrolled solar gain and keeping that zone overly warm on sunny winter days. The main-level thermostat rarely called for heat in that situation.
The insulated, garden-level basement had a moderate amount of south-facing glass. It stayed warm; in fact, a complaint was that it was also too warm in the winter. In addition to solar gain, it received a lot of unintentional heat from duct leakage. This home’s ductwork was the second leakiest of the 40-home testing subsample (3,541 CFM25). Duct leakage is often greatest in the basement because duct pressures are highest there.
Meanwhile, the upper level stayed cool; the homeowners complained in particular that the master bedroom in the northwest corner ran cold. To compensate for this, the homeowner had closed all the basement and main-level supply registers—at the advice of the builder—in an attempt to drive more conditioned air to the upper level. That strategy wasn’t working. In the home’s upstairs master bedroom, located farthest from the furnace, supply ducts were providing reasonable flow, but the upstairs return ducts weren’t drawing measurable air flow.
The testing contractor for this study coined a phrase to describe similar situations he had observed in other Colorado homes built in the early 1990s. “Random conditioning” indicates that the occupants have poor control over heating and cooling, and conditioned air is not delivered where it’s needed.
Solutions would need to involve more thought toward the sun and window specifications, more careful design and installation of the duct system, and duct sealing. A controller that intermittently cycles the air handler blower, to help circulate air between zones, might also be a good choice to help overcome the limitations of single-zone control in this large, solar-driven home.
3.4 Mechanical Systems

76
Design, Construction, Performance
77
Design, Construction, Performance
3.5 Combustion Safety
Safe combustion means a clean burning process (including minimal carbon monoxide production) and 100% of the combustion products vented to outside 100% of the time.
Overt combustion safety problems were rare in the 40-home testing sample. However, study home design and construction practices did not provide confidence about combustion safety.
A few natural gas-fired combustion appliances in the testing sample produced unsafe levels of carbon monoxide. One furnace pegged the meter at greater than 2,000 parts per million of carbon monoxide in the flue gases. Gas kitchen ovens generally produced the highest measured levels of carbon monoxide, particularly in the first few minutes of operation.
3.5 Combustion Safety
Individual houses
Includes pre- and post-group homes
0
20
40
60
80
100
120
CO
in f
lue
gas
(ppm
)
G-62
Carbon Monoxide Productionby Gas-fired Water Heaters
100 ppm = Weatherization agency action level
G-062bw.eps Graph #28 5/2/02
Includes pre- and post-group homesG-63
> 2000 ppm
0
20
40
60
80
100
120
Individual houses
CO
in f
lue
gas
(ppm
)
100 ppm = Weatherization agency action level
Carbon Monoxide Productionby Gas-fired Furnaces
G-063bw.eps Graph #29 5/2/02
Includes pre- and post-group homesG-64
0
20
40
60
80
100
120
Individual houses
CO
in f
lue
gas
(ppm
)
100 ppm = Weatherization agency action level
Carbon Monoxide Productionby Gas-fired Fireplaces
Atmospheric fireplacesDirect vent fireplaces
G-064bw.eps Graph #30 5/2/02
Under normal operating conditions, carbon monoxide production by most water heaters, furnaces and fireplaces was well below levels of concern. A few units stood out with higher carbon monoxide levels. Note that water heaters, furnaces and fireplaces are all vented to outdoors.

76
Design, Construction, Performance
77
Design, Construction, Performance
All but two of 80 study homes used atmospheric gas water heaters that are susceptible to spillage and backdrafting at very small pressure differences. Induced-draft furnaces (present in 94% of study homes) and atmospheric fireplaces (in 28% of study homes) also are vulnerable. By design, gas kitchen stoves (in 13% of study homes) are unvented, exhausting 100% of their combustion products into the living space. Only one of 11 gas stoves was paired with a hood vented to outdoors; the rest of the homes used recirculating hoods.
Basement pressures were measured because the furnaces and water heaters were generally located there, and even small negative pressures in the basement could potentially reverse the flow of combustion products. Under test conditions designed to induce depressurization (that approached worst-case operating conditions), all basements were indeed depressurized. This was due to a combination of air leaks high in the house (the flue of an atmospheric fireplace appeared to be a significant contributor), inside/outside temperature differences, wind effects,
Includes pre- and post-group homes
100 ppm = Weatherization agency action level
0
200
400
600
800
1,000
1,200
Individual houses
Car
bon
mon
oxid
e in
flu
e ga
s (p
pm)
G-65
Carbon Monoxide Productionby Gas-fired Kitchen Ovens
5 min10 min
G-065bw.eps Graph #31 5/2/02
Carbon monoxide production by gas ovens was highest in the first few minutes of operation. After the burner had been on for 10 minutes, carbon monoxide levels had dropped significantly yet remained high enough to be a concern in three of four units. Note that all combustion products from gas ovens were exhausted into the houses and that only one in 11 study homes with gas ovens had a vented range hood.
Includes pre- and post-group homesG-77
-30
-25
-20
-15
-10
-5
0
Individual houses
Dra
ft p
ress
ure
(Pas
cal)
Water Heater Draft Pressures
G-077bw.eps Graph #32 4/22/02
The buoyant force that pullscombustion products out of the house via the flue is called the “draft pressure.” Measured draft pressures in water heater and furnace flues were very small; the 0-to-10 Pascal range was typical.
3.5 Combustion Safety

78
Design, Construction, Performance
79
Design, Construction, Performance
exhaust fan operation (bath fans, kitchen range hoods, clothes dryers), and an excess of return duct leakage when the furnace or air conditioner operated. Depressurization under these conditions was severe enough to put atmospheric combustion appliances at risk of backdrafting in more than one-third of the tested homes.
Code-required combustion air ducts (open ducts connecting the area around the combustion appliances to the outdoors) appeared to be generally ineffective as a means to mitigate depressurization. Raising additional concerns about their function, in 6% of the study homes, homeowners had plugged combustion air ducts in attempts to eliminate cold drafts.
The Uniform Mechanical Code includes provisions intended to reduce depressurization in the vicinity of the combustion equipment. It states that the effects of appliances that exhaust air from the house (bath fans, kitchen ventilation, clothes dryers, atmospheric fireplaces) must be considered in determining combustion air requirements, and that return air must not be taken from areas in which combustion appliances are located. Data and observations indicated these requirements were not reflected in design or construction practice. Though return air registers were rarely located in the same room as the furnace, large return duct leakage was a significant contributing factor to basement depressurization in some homes.
Two water heaters and four fireplaces were observed to spill combustion products into the home. These were not investigated in detail, but appeared to be related more to appliance design and venting problems than to their location in negatively pressurized zones. The lack of backdrafting or spillage by atmospherically vented appliances located in depressurized zones was somewhat surprising, but should not be construed as a guarantee that these problems would not occur under other combinations of weather and operating conditions. The case study provides an illustration of what can
Includes pre- and post-group homes
-12
-10
-8
-6
-4
-2
0
Individual houses
Pres
sure
wrt
out
side
(Pa
scal
)
G-67
-5 Pa and below = Zone of concern for atmospherically-vented combustion appliances
Maximum Basement Depressurization(measured under test conditions)
-3 Pa = Preferred maximum depressurization for pressure-balanced house
-27 Pa
G-067bw.eps Graph #33 5/2/02
Under test conditions, all basements were depressurized with respect to outdoors. These negative pressures were of the same order of magnitude as the measured draft pressures in water heater and furnace flues, raising concerns about the abilities of these appliances to successfully remove combustion products from the house.
To help maintain a safe combustion environment, code requires large combustion air openings in the vicinity of atmospherically coupled combustion appliances. Testing showed that these ducts had very small beneficial effects on basement depressurization. In fact, when the wind blows in certain directions or when the exterior end terminates in an attic, ducts like these can drive the basement pressure more negative.
3.5 Combustion Safety

78
Design, Construction, Performance
79
Design, Construction, Performance
happen. E-Star Colorado performance testing has documented backdrafting water heaters in a number of Front Range homes built in the same time periods as the study homes, using similar construction techniques.
Carbon monoxide alarms were present in about one-quarter of the study homes.
Data and observations suggested that the combustion safety issues reported in this section were not checked or detected in the normal course of construction.
Case Study: Negative Pressure Nightmare
A technician working in a new 200-unit Fort Collins apartment project encountered heat spilling into one apartment from its water heater flue. Fortunately, he had recently attended City-sponsored training on combustion safety problems. Yet he was a self-proclaimed “non-believer” who felt the trainers had exaggerated potential health and safety problems. Nonetheless, when he encountered this problem, he hired one of the trainers for a site visit. The diagnosis: a major combustion safety hazard.
The apartments were stacked: the ground-floor units were built over vented crawl spaces; the upper units had vented attics above. Furnaces were located in closets in the apartments. Leaky supply ducts running through the crawl spaces and attics were the root cause of the problem. The heating distribution system was no longer a closed loop. Each time the furnace came on, some warm air delivered through supply ducts was blown into the crawl space or the attic. This meant the single return, located right at the furnace, was trying to draw more air from the apartment than the supply ducts delivered; as a result, the apartment became depressurized. Whenever any one of the seven supply registers was closed by occupants, negative pressure within the home grew even stronger, strong enough to overpower the water heater’s draft and continuously backdraft all combustion byproducts. Once re-burned by the water heater, those byproducts can create carbon monoxide, which can then be drawn into the furnace and recirculated within the living space.
Health complaints by residents in other apartments suggested this problem was likely present in other units as well.
Possible fixes, some addressing only the symptoms, others going after the root causes:
• Seal all crawl space and attic ductwork with mastic to reduce supply leakage; then test the resulting pressure balance.
• Install a carbon monoxide detector in every unit.
• Install a spillage sensor on each water heater to shut off operation whenever spillage occurs.
• Remodel all crawl spaces to be “warm” (unvented) designs and remove attic venting, so that any air leaks from supply ducts stay within the home.
• Replace all atmospherically vented water heaters with sealed-combustion models.
Within 48 hours of the tests, management began the process of installing a carbon monoxide detector in each apartment unit.
3.5 Combustion Safety

80
Design, Construction, Performance
81
Design, Construction, Performance
3.6 Indoor Air Quality and Ventilation
Good indoor air quality can only be assured through a comprehensive strategy that minimizes pollutant sources within the house and includes ventilation to exhaust stale air and replace it with clean air. Other components may include house-tightening, air filtration and moisture control.
Combustion safety, a critical indoor air quality element, is addressed in Section 3.5. Although a comprehensive assessment of other aspects of indoor air quality was beyond the scope of this evaluation, some observations can be made based on the limited data that was collected.
There was no evidence of comprehensive indoor air quality strategies. Limited source control was observed, in the homes that used sealed-combustion or direct-vent combustion equipment (that don’t allow combustion products to enter the home even in a negative pressure environment) or employed sub-slab radon control systems installed as the house was built.
Manually controlled fans were present in almost all kitchens and bathrooms. Almost all of these fans were at the low end of the quality spectrum and many were noisy, limiting their use.
Kitchen hoods were generally unvented, recirculating models that filtered polluted air rather than exhausting it from the home. Only one of 11 homes with a gas oven had a vented hood.
Includes pre- and post-group homesG-100b
None(1%)
Vented(10%)
Recirculating(89%)
Kitchen Hood Type
G-100bbw.eps Graph #34 4/22/02Few homes had vented hoods, even when gas ovens were present. A recirculating range hood coupled with an over-the-stove microwave oven was typical. This type of hood provided some degree of filtration but did not exhaust pollutants outdoors.
3.6 Indoor Air Quality

80
Design, Construction, Performance
81
Design, Construction, Performance
All bath fans were vented to outdoors. Design and installation problems were observed in the ductwork connected to some bath fans, meaning the fans were unlikely to move their rated air flow and/or ductwork might fail prematurely.
The tape that connected the duct to the fan housing had almost completely failed even before the attic was insulated.
One of the few indoor air quality components installed in all study home was bath fans, intended to remove moisture and odors. In the top photo, the grille on the ceiling gave no indication about how well the fan would do its job. The attic perspective in the bottom photo illustrates some of the installation details that compromised performance.
The fans were all low-cost units that garnered many noise complaints.
This metal flex duct material is easily crushed. Long 3” duct runs may constrict flow below rated performance.
A sharp turn at the fan’s outlet serves as a large pressure drop that reduces flow.
3.6 Indoor Air Quality
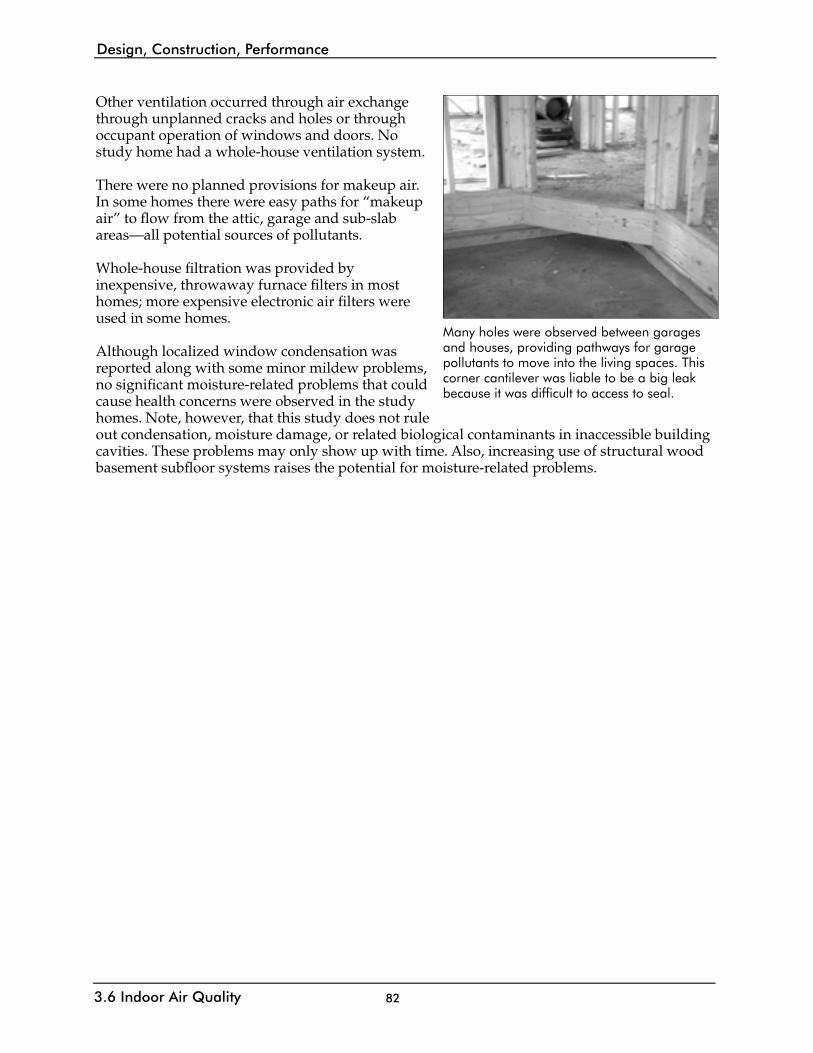
82
Design, Construction, Performance
83
Design, Construction, Performance
Other ventilation occurred through air exchange through unplanned cracks and holes or through occupant operation of windows and doors. No study home had a whole-house ventilation system.
There were no planned provisions for makeup air. In some homes there were easy paths for “makeup air” to flow from the attic, garage and sub-slab areas—all potential sources of pollutants.
Whole-house filtration was provided by inexpensive, throwaway furnace filters in most homes; more expensive electronic air filters were used in some homes.
Although localized window condensation was reported along with some minor mildew problems, no significant moisture-related problems that could cause health concerns were observed in the study homes. Note, however, that this study does not rule out condensation, moisture damage, or related biological contaminants in inaccessible building cavities. These problems may only show up with time. Also, increasing use of structural wood basement subfloor systems raises the potential for moisture-related problems.
Many holes were observed between garages and houses, providing pathways for garage pollutants to move into the living spaces. This corner cantilever was liable to be a big leak because it was difficult to access to seal.
3.6 Indoor Air Quality

82
Design, Construction, Performance
83
Design, Construction, Performance
Includes pre- and post-group homes
Few
Some
Many
Most
Almostall
Typical
Wint
er / c
old
Wint
er / w
arm
Wint
er / d
rafty
Wint
er / c
old
Wint
er / w
arm
Wint
er / d
rafty
Sum
mer
/ war
m
Sum
mer
/ coo
l
Wint
er / c
old
Wint
er / w
arm
Wint
er / d
rafty
Sum
mer
/ war
m
Sum
mer
/ coo
l
Occ
urre
nce
Basement Main level Upper level
G-14
Zonal Comfort
Wint
er / d
rafty
Fireplace
G-014bw.eps Graph #35 6/17 /02Comfort problems were reported on all levels of the study homes and in the vicinity of fireplaces.
3.7 Comfort
Most homeowners in the study sample reported some level of comfort problems with their homes. Note: due to the qualitative, subjective nature of the comfort data, numbers presented in this section should be viewed from an order-of-magnitude perspective.
Most comfort complaints were in two categories: (1) thermal comfort problems in particular parts of the home, and (2) dry air.
Zones that stood out from the standpoints of discomfort included basements that were cold and/or drafty in winter and upper level rooms that were cold in winter and/or too warm in summer—all reported by about three out of four homeowners. More than 40% of owners reported that some part of the main level of their home was uncomfortably cold during the winter. About one-quarter of homeowners with fireplaces noted winter comfort problems—cold and/or drafts—associated with them.
Although central air conditioning provided excellent summer comfort in some homes, even many homeowners with air conditioning reported that a portion of their home was too warm during the summer.
Rooms on the upper levels of two-story homes were often reported to be cool in winter and/or too warm in summer (even in air-conditioned homes).
3.7 Comfort

84
Design, Construction, Performance
85
Design, Construction, Performance
3.7 Comfort
Cold FireplacesAbout one-quarter of owners with fireplaces reported
cold drafts in the vicinity of the fireplace.
The owners of this house complained about drafts that made their living room uncomfortably cold. The infrared photo (right) shows the cold air that leaked around the fireplace unit. (This was a direct-vent fireplace, so there were no leaks between the room and the vent; all leakage was due to an incomplete air barrier in the cavity enclosing the unit.)
The owners of this house made a removable, fabric-coated foam insert to block drafts through the fireplace and make their living room more comfortable.
Warm
Cool

84
Design, Construction, Performance
85
Design, Construction, Performance
Living Spaces Over Garages
More than half of the study homes included living space above tuck-under garages, with an average floor area of 235 square feet. Living spaces over garages are areas where several of the individual problems described in earlier sections can converge.
Discomfort was the biggest issue reported in these areas. About half of homeowners reported these spaces were cold in winter; one-third complained about them being too warm in summer. A few homeowners singled them out as having the most extreme comfort problems of any area in the house.
Living spaces extended over garages in half of the study homes.
Flaws in floors built over garages contributed to poor comfort in living spaces above.
No insulation at return duct
Insulation difficult to install effectively around ductwork
Six-inch thick, R-19 insulation supported insecurely against the subfloor in a deeper cavity
Contributing factors included:
• Proportionately larger heating and cooling loads than other zones of the house. These were due to many exposed heat loss surfaces, often including three walls, ceiling and floor.
• Ineffectively installed insulation in the floor system. Code-required R-19 insulation (a 6” thick fiberglass batt), installed in a deeper joist cavity, was never adequately supported. If the batt drooped away from the subfloor to rest on the wallboard on the garage ceiling, the resulting gap allowed air to move between the insulation and subfloor. Other installation problems involved obstacles such as ductwork, plumbing and electrical wiring.
• An incomplete air barrier at the floor above the garage. This had implications for discomfort as well as energy losses and pollutant transfer from the garage to the house.
• Inadequate conditioning. Long duct runs meant more opportunity for constrictions and leaks, resulting in compromised heating and cooling delivery.
Insulation has drooped away from floor above, leaving air space between them.
3.7 Comfort

86
Design, Construction, Performance
87
Design, Construction, Performance
Overly dry winter air was reported by more than two-thirds of study homeowners. Measured humidity levels bore out this complaint. The range for human comfort is 30% to 70% relative humidity (RH); 40% RH is often cited as an optimum that balances comfort versus the potential for other problems associated with higher moisture levels. Almost half the study homes had wintertime relative humidity below 30%—very dry. Another third had RH from 30% to 35%, just above the lower limits of comfort. No humidities above 45% were measured. Even in the two-thirds of homes equipped with humidifiers, dry air was a common complaint, with no apparent correlation between RH and the presence or absence of a humidifier.
Other comfort issues reported by homeowners included:
• Comfort problems associated with windows (cold, drafts, condensation);
• Poor control of heating and air conditioning;
• Noisy bath fans;
• Noisy kitchen range hoods;
• Exhaust fans that didn’t remove moisture or odors effectively;
• Noisy ductwork, and
• Whole house fan louvers that rattled or flapped when the wind blew.
Homeowner comments suggested that some have learned to “put up with” the comfort problems in their homes. Some owners expressed frustration about their builders’ unwillingness or inability to fix problems. Still others attempted to deal with the symptoms of comfort problems by installing a space heater, humidifier or air conditioner, or by adjusting register dampers to try to force more conditioned air to an uncomfortable part of the home.
Humidifiers were present in 64% of the study homes. Most of these were central units located at the furnace, some were central, freestanding units, while others were smaller room units. Even in homes with humidifiers, dry winter air was a common complaint.
3.7 Comfort
Includes pre- and post-group homesG-60
NoComplaint
(30%)Air too dry
(70%)
Homeowner Perception of Winter Indoor Moisture Levels
G-060bw.eps Graph #36 4/22/02
Includes pre- and post-group homesG-1
RH greater than 35%(15%)
RH = 30 to 35%(39%)
RH less than 30%(46%)
Measured Winter Indoor Relative Humidity
G-065bw.eps Graph #37 4/22/02Dry indoor air during the winter was a common comfort complaint, borne out by humidity measurements.

86
Design, Construction, Performance
87
Design, Construction, Performance
Case Study: “We Just Figured that’s the Way New Homes Were”The owners of one post-group study home told the testing contractor, “we just figured that’s the way new homes were” as a summary lament about comfort problems in their modestly sized two-story home. But these homeowners were unhappy. During the market research interview and site visit, they reeled off a lengthy list of complaints. On-site observations and results from diagnostic testing identified contributing factors.The problems:• General discomfort. When the home was built, the panning beneath main-level floor joists,
intended to carry return air from upstairs down to the furnace, was never installed. There was little or no return air flow through intended channels. This code violation was discovered by the contractor hired to install after-market air conditioning. The owners called the builder, who returned to install the panning; comfort improved immediately. (The bigger concern with this oversight was the danger of backdrafting the furnace or water heater in the basement.)
• Difficulty controlling heating and cooling system. Equipment oversizing was significant; the furnace and air conditioner were sized at 188% and 225% of design requirements, respectively. Oversizing leads to short-cycling, a contributor to discomfort. In addition, ductwork was very leaky, and the return air registers on the upper floor together moved only 100 CFM of air (seven percent of the total air flow). The builder was aware of some compromises with the return system design, but told the homeowner that was the only way that it could be done.
• Master bedroom above garage “freezing” in the winter. For many reasons, living space over a garage has high potential for comfort problems. Though not all factors were checked in this house, two specifics were noted. The insulation on the knee wall on the end of the master bedroom vaulted ceiling was poorly installed, with significant gaps between adjoining batts. The measured supply and return air flows serving the master bedroom were very low. Based on observations in homes under construction, one can also speculate that the insulation in the floor above the garage may have been compromised by installation flaws.
• Basement “pretty chilly” during the winter. The husband had a basement office where he worked part time; he estimated the winter temperature ran about 5 oF colder than the main level. The home had a single thermostat and a reasonable amount of south-facing window area. So the main level heated up nicely on cold but sunny winter days, while the basement slowly grew colder due to lack of south windows and no mixing of air between levels during extended non-heating periods. Also, the blower-door test indicated a considerable amount of air leakage coming into the finished basement—much of it through a 10-inch diameter combustion air duct.
• Entertainment center cold during the winter. Large air leaks were noted around the entertainment center during the blower-door test. The entertainment center sat on a cantilever extending out from the back wall of the house; typical cantilever insulation and air leakage problems likely contributed.
• Upstairs bathroom hot during the summer. A primary contributing factor for this problem was a skylight above the bathroom ceiling, with a shaft that was never insulated.
This is not what this young couple expected when they bought their new home. Unfortunately, there is no one step the builder could take to solve this broad range of comfort problems. To successfully prevent these situations requires a systems approach: better detailing of the home’s air barrier, closer supervision of insulation installation, improved ductwork design, sealed ductwork and more.
3.7 Comfort

88
Design, Construction, Performance
89
Design, Construction, Performance
3.8 Energy Use and Cost
3.8 Energy Use and Cost
Energy efficiency was the driving force for the 1996 code changes and for this study. Average energy savings due to the code change are reported in Chapter 2. This section reports actual electricity and natural gas use and costs for the study year (May 1998 to April 1999), both in total and disaggregated by major end uses.
Note that the numbers presented in this section should be viewed as order-of-magnitude estimates, for several reasons:
• Weather. The weather varies from year to year; the study year weather was characterized by a somewhat milder winter and somewhat more severe summer than typical for Fort Collins.
• Utility rates. Rates change over time.
• Disaggregation challenges. Separating total metered energy use into components involves assumptions and uncertainties.
• Individual home differences. There are numerous factors that affect energy use in a particular home; examples include orientation, design, number of occupants, thermostat settings, and numbers and types of appliances. Variations in a given metric were large for individual homes. Ten-fold differences were typical for absolute metrics (such as total annual energy cost), five-fold variations were characteristic when the absolute values were normalized to the size of the home (such as annual energy cost per square foot).
Study homes used an annual average of 9,241 kWh per year of electricity and 894 therms per year of natural gas, equating to 3.1 kWh per square-foot per year and 30.1 kBtu per square-foot per year, respectively, when normalized by the conditioned floor area of the home.
Annual energy costs in study homes averaged $569 per year for electricity and $487 per year for natural gas, equating to area-normalized values of $0.19 per square-foot per year and $0.17 per square-foot per year, respectively.
G-130
Annual Total Energy Cost
$0
$1,000
$2,000
$3,000
Individual houses
Cost
($$
/yr)
$1,055/yr = Average
$4,764/yrNatural gasElectricity
G-130bw.eps Graph #38 7/12/02
Includes pre- and post-group homes
Study home annual energy costs varied widely, from about $600 to $4,800 (the average monthly cost was about $90). On average, gas costs were slightly less than half the total.

88
Design, Construction, Performance
89
Design, Construction, Performance
3.8 Energy Use and Cost
Few homeowners voiced complaints about their electric or gas bills. This was not surprising, given that average utility bills were less than 10% of typical mortgage (PITI) payments.
Disaggregated energy use and cost, on a per-square-foot basis, are shown in the accompanying graphs. In the average home, the largest cost components were electric baseload and space heating, followed by fixed costs, gas baseload and cooling.
G-136
All study homesEn
ergy
use
(kB
tu/s
f/yr
)
Average Annual Natural Gas Usage Components(on a per-square-foot basis)
Space heatingBaseload
9.6
20.5
0
5
10
15
20
25
30
35
G-136bw.eps Graph #39 4/29/02
Includes pre- and post-group homes
G-138b
Ener
gy u
se (k
Wh/s
f/yr
)
Average Annual Electric Usage Components(on a per-square-foot basis)
2.53
0.14
0.11
0.55
0
1
2
3
4
Homes withoutcentral air
conditioningcentral air
conditioning
Homes with
Baseload
CoolingSpace heatingblower motor
Baseload and blower motor usage numbersrepresent the averages for the full sample.
G-138bbw.eps Graph #40 4/29/02
Includes pre- and post-group homes
G-141b
Ener
gy c
ost (
$$
/sf/
yr)
Average Annual Utility Bill Components(on a per-square-foot basis)
$0.049
$0.144
$0.041
$0.098
$0.031$0.006
$0.00
$0.10
$0.20
$0.30
$0.40
Homes withoutcentral air
conditioning
Homes withcentral air
conditioning
Cooling (E)
Space heating (G+E)
Baseload gas (G)
Baseload electric (E)
Fixed cost (G+E)
G-141bbw.eps Graph #41 4/29/02
Includes pre- and post-group homes
All bill components except cooling represent the averages for the full sample.
About two-thirds of the natural gas consumption in the average home was used for space heating. The other third was used for baseload needs, primarily water heating.
Electrical consumption in the average home was dominated by baseload uses. A small part of the total was energy used to operate the air handler blower motor for space heating. Cooling represented about 17% of the total in homes with air conditioning and a much smaller proportion in homes without air conditioning.
The two largest components of energy cost were electric baseload and gas space heating, together totaling almost 70% of the annual total utility bill. Even in homes with central air conditioning, cooling averaged less than 10% of the total cost.

90
Design, Construction, Performance
913.8 Energy Use and Cost
Study year electric and natural gas rates in Fort Collins were among the lowest in the nation. Since then, electric rates have increased only slightly. In contrast, natural gas rates have been volatile. They virtually doubled in 2000 and early 2001, increasing total utility costs and changing the proportional split of cost components. A natural gas rate decrease in the last quarter of 2001 offset much of the increase.
G-127
Annual
gas
bill
($$
/yr)
Gas Bill Fluctuations with Changing Gas Rates, 1997-2001
G-127bbw.eps Graph #42 4/29/02
Dates when gas rate changed
$0
$500
$1,000
$1,500
Jan-97 Oct-97 Oct-98 Jun-99 Oct-99 Jul-00 Aug-00 Oct-00 Jan-01 Mar-01 Oct-01
$930 = High
$452 = Low
This graph illustrates how the annual average study home bill would have varied as gas rates changed over the five-year period from 1997 to 2001.

90
Design, Construction, Performance
91
G-013b
Prop
ortio
n of
res
pond
ents
Cooling Strategies
0%
25%
50%
75%
100%
Exte
rior s
hade
Land
scap
ing
Close
curta
ins
Shad
e sc
reen
s
Ope
n wind
ows
Ceiling
fans
Wind
ow fa
ns
Who
le ho
use
fan
Evap
orat
ive co
oler
Room
AC
Centra
l AC
G-113bbw.eps Graph #43 4/29/02
Includes pre- and post-group homes
Most study homeowners tried to keep their homes cool by operating curtains and windows, ceiling fans and central air conditioning.
4 CoolingThis chapter addresses how study homeowners kept their houses cool during the summer and the impacts when those choices included central air conditioning.
Cooling issues are addressed separately from issues discussed in the previous chapter for two reasons. First, cooling equipment is often installed as a retrofit measure rather than when the house is built. Second, unlike many of the other design/construction/performance issues, residential air conditioning may have significant impacts on the municipal electric utility’s planning, operation and revenues.
4.1 Cooling Strategies
There are many ways to keep a home cool, including strategies to keep the heat out in the first place and a variety of options to remove heat from the house once it’s there. The graph shows the usage of cooling strategies reported by homeowners during market research interviews.
The dominant approaches were closing curtains, opening windows, using ceiling fans and using central air conditioning. The only statistically significant trend from pre- to post-group was a 50% decrease in the use of whole- house fans.
Data collected in the field from the 80-home sample was in good general agreement with the market research. It showed an even larger drop in the numbers of whole-house fans from pre- to post-group homes, though, as well as a large increase in the occurrence of ceiling fans.
Other cooling strategies reported to market researchers by small numbers of owners included adding a porch for shade, being sure that windows were closed during the day, adding window film, using a powered attic ventilator, using portable fans and trying not to use heat-generating appliances like the kitchen stove or clothes dryer during the day.
As noted in Chapter 3, the power of the sun was overlooked; glass areas were oriented randomly with little architectural shading, and there was very little use of high-performance windows that could block unwanted solar heat.
4.1 Cooling Strategies
Cooling

92 93
4.2 Air ConditioningThis section summarizes data and observations about central air conditioning (AC).
4.2.1 Market Issues
Reliable data on past Fort Collins residential AC market penetration is not readily available. Anecdotal information suggests, though, that penetration more than doubled from 1990 to 2000. As the graph shows, central AC was present in about half of the study homes. At the time of the survey, approximately as many systems had been added by homeowners as retrofits as had been installed by the builder at time of construction. Market penetration continues to grow. Of the homeowners without AC, about half expressed the intent to add it in the future.
The primary driver for the decision to install AC was comfort, reported by more than 80% of those with AC systems. Secondary factors included allergies, experience from other parts of the country where AC is standard, and resale value—all of which ranked much lower than comfort. The most common reasons cited for not installing AC were that the home was comfortable enough without it and that Fort Collins summers are too mild to need AC.
4.2.2 Equipment, Design and Installation
Information on AC equipment efficiency and sizing, cooling system design and installation is presented in Section 3.4.3. Key points, in brief:
• Rated efficiency. The federal minimum efficiency standard (SEER = 10.0) served as the baseline for rated AC efficiency in the study homes; 7% of systems had a SEER rating of 11.0 or greater.
• Sizing. All AC units were oversized, often by large margins, with potential negative consequences.
• Installation and testing. Data and observations suggested that not all manufacturer’s equipment installation instructions were carefully followed, that insufficient attention was paid to the interface between equipment and ductwork, and that these aspects of equipment operation were never tested or adjusted after installation.
AC Market Penetration and Timing
G-117c
G-117cbw.eps Graph #44 4/22/02
Includes pre- and post-group homes
Added by homeowner
(25%)
No AC(52%)
Installed at time of
construction(23%)
The market penetration of central air conditioning has grown significantly in the last decade. About 25% of the study homes had AC installed when the home was built, another 25% had AC installed as a retrofit, and another 25% of owners said they planned to install it in the future.
Outdoor air conditioning unit
4.2 Air Conditioning
Cooling

92 93
4.2.3 Power Quality
Fourteen percent of study homeowners with AC reported that lights dimmed in their homes when their AC units turned on. This was the result of large AC compressor starting currents (50 to 175 Amps depending on the size of the AC unit) that momentarily dropped the voltage serving the house.
4.2.4 Operation
Eighty-five percent of study homeowners with AC reported they started using their cooling systems when the outside temperature reached 80 degrees Fahrenheit or higher; 20% waited until the temperature reached 90 degrees or higher. Only about 15% of AC owners left their thermostat set at a constant value; the rest adjusted thermostat settings during the day using either manual or programmable thermostats.
For the summer for which utility costs were analyzed (1998—a fairly severe cooling season relative to the average Fort Collins climate), study home AC systems were estimated to operate between 25 and 900 hours total. The average total run time was about 360 hours.
4.2.5 Comfort
Not surprisingly, homeowners with AC were less likely to report summer comfort problems than those without it. Nonetheless, though the summer comfort level was better in general in homes with AC, many owners still experienced areas of their homes that were too warm. This was particularly notable for upper level rooms in two-story homes; as explained in Section 3.4.3, several factors contributed to this predictable problem.
4.2.6 Cost of Air Conditioning
The most significant AC-related cost for homeowners was first cost. Based on anecdotal information, the cost to have central AC installed in recently built homes with forced-air heating systems typically ranged from $2,000 to $4,000. Increasing the size of the electrical service to accommodate the additional load of a large AC unit might have added another $1,000 or more. In contrast, for the average home, AC operating costs were quite low, averaging only about $100 for the study year (the range was $6 to $300).
Maintenance and replacement costs are also part of the total cost of cooling; however, no information on these aspects were collected in this study.
4.2 Air Conditioning
Cooling

94 95
4.3 Electric Utility Impacts
This section summarizes the effects of residential AC on the electric utility system. Information in this section is based largely on circumstantial evidence rather than direct measurement.
Fort Collins residents and businesses are served electricity at the retail level by Fort Collins Utilities, the municipally owned utility. In turn, all of the wholesale electricity distributed by Fort Collins Utilities is purchased from Platte River Power Authority, a generation and transmission agency owned by the cities of Fort Collins, Loveland, Longmont and Estes Park.
4.3.1 Load Growth
The magnitude of the AC power draw for a single house includes the electrical needs of both the AC unit and the blower motor in the air handler. As shown in the graph, the rated power draws for study home AC units ranged from about 2 to 6 kW, varying linearly with the size of the unit. Blower motor rated power draws ranged from about 0.3 to 0.8 kW. The total AC-related power draw ranks among the highest electrical demands for home appliances (compare for example with electric water heaters at 4.5 kW, clothes dryers at 5.6 kW, electric stoves at 1 to 3 kW). Ongoing growth in northern Colorado has rapidly increased the electrical demands that Fort Collins Utilities must meet. As the graph illustrates, in the last decade the utility has also made the transition from a winter-peaking to summer-peaking load. This has been due, in part, to increasing use of AC by city residents in homes, businesses and institutions. Additional generation capacity designed specifically to meet summer peaking needs is being added to Platte River resources.
G-119b
AC unit size (tons)
Pow
er d
raw
(kW
)
Rated Air Conditioner Power Draw
G-119bbw.eps Graph #45 4/29/02
Includes pre- and post-group homes
0
1
2
3
4
5
6
7
1 2 3 4 5 6
NOTES:
1. Power draw at ARI rating conditions. 2. These ratings do NOT include air handler blower motor power draw (typically 0.3 to 0.8 kW).
The power required by residential AC units was large compared with other household appliances and varied linearly with the size of the unit.
Peak electrical demands on the Fort Collins Utilities system have grown steadily as the city has grown. Summer peaks have grown more rapidly than winter peaks, in part due to increasing residential air conditioning.
4.3 Electric Utility Impacts
G-123
Peak
ele
ctric
al d
eman
d (M
W)
Fort Collins Utilities Seasonal Peak Demands, 1980-2001
Winter PeakSummer Peak
G-123bw.eps Graph #46 5/2/02
0
100
200
300
Year
Summer peakWinter peak
80 82 84 86 88 90 92 94 96 98 00
Cooling

94 95
4.3.2 Summer Peak Timing
Over the past decade, there has been a gradual trend in both Fort Collins Utilities and Platte River summer peak load profiles. Ten years ago, the summer peak tended to occur broadly throughout the mid to late afternoon. Since then, peaks have tended to shift later in the afternoon to early evening. It is likely that the increased residential AC market penetration and typical patterns of AC use have contributed to this change.
4.3.3 Revenue Shortfall
AC loads have the potential to be revenue losers for the electric utility. This is because AC is not used many hours on average, yet is very likely to operate at times of electric system summer peak demand (the hottest days of the summer, late in the afternoon). This disparity should be greatest in years with moderate summers but a few very hot days, least in years with summers that are consistently hot.
For summer 1998 (the summer for which electric utility billing histories were analyzed—relatively severe), the financial impact of residential AC on the electric utility was examined for study homes with AC. Marginal utility revenues for AC were compared against marginal utility costs to supply power to operate AC units.
Additional generation is being added at the Platte River Power Authority’s Rawhide Energy Station. Natural gas combustion turbines will be ready to meet growing summer peaking needs in 2002.
NoonMidnight Midnight
G-124c
Hour ending
Elec
tric
al d
eman
d (M
W)
Electric System Load Curve For Summer Peak Day
G-124cbw.eps Graph #47 4/29/02
0
100
200
300
Peak demand
Summer peak demand often occurs late afternoon
6a.m. 6p.m.
Summer peak electrical demands appear to have been moving from mid to late afternoon over the past several years. The increasing penetration of residential AC may be partly responsible.
4.3 Electric Utility Impacts
Cooling

96 97
The typical “coincidence factor” between AC operation and Fort Collins Utilities summer peak demand timing is not well known. Therefore, the economic analysis was run using three scenarios: 60%, 80% and 100% likelihood that the average AC unit was operating during the utility’s peak demand during three summer months. Rated power draws were assumed to be accurate. The table summarizes the results.
Utility Economics for Residential Air Conditioning*AC load
Peak power draw 4.1 kWEnergy consumption 1,741 kWh/yr
Revenue offsetting purchase power cost $65/yrWholesale purchase power cost related to AC
(1) If 60% coincident on-peak for three months $120/yr(2) If 80% coincident on-peak for three months $150/yr(3) If 100% coincident on-peak for three months $181/yr
Net revenue loss for electric utility
(1) If 60% coincident on-peak for three months $54/yr(2) If 80% coincident on-peak for three months $85/yr(3) If 100% coincident on-peak for three months $115/yr
With the wholesale and retail electric rate structures in effect in summer 1998 (little different than rates in effect as this report is published), residential AC loads represented net revenue loss for every study home with AC.
4.3.4 Transformer Overloads and System Sizing
To operate at high electrical and financial efficiency, Fort Collins Utilities’ sizing criteria for residential transformers does not include large oversizing margins. However, past sizing practices have proven to be inadequate in the face of the rapid growth in AC market penetration and the large AC units being installed.
The graph shows the number of Fort Collins Utilities residential distribution transformers replaced each summer, beginning in 1995, due to overloading. Prior to 1998, a few transformers failed every summer, but the number was so small that it was not viewed as a significant issue. In the relatively hot summer of 1998, though, more than 60 transformers failed. Since then, the number
G-108dYear
Num
ber
of t
rans
form
ers
repl
aced
(#
/yr)
Annual Residential Transformer Replacements,1995-2000
G-108dbw.eps Graph #48 4/29/02
0
30
60
90
120
1995 1996 1997 1998 1999 2000
Larger homes and the increasing prevalence of residential air conditioning have caused the need to replace many distribution transformers since 1998. In response, Fort Collins Utilities increased transformer sizing criteria in 2001.
* This analysis reflects the marginal economics for cooling for the average air-conditioned study home.
4.3 Electric Utility Impacts
Cooling

96 97
of failed transformers has remained high, varying in response to climate extremes. Fort Collins Utilities staff responsible for planning and maintaining the electric distribution system attribute the increase in number of transformer replacements to a combination of larger homes with more electrical loads and the increasing prevalence of central AC. They believe—and the correlation with temperature supports—that AC is the largest factor.
In response to this trend, Fort Collins Utilities made two changes in 2001. First, the size of transformers serving new residential neighborhoods was doubled. Second, a program was established to preemptively replace transformers in neighborhoods with large AC loads with larger transformers, if loading indicators suggest the existing transformers are at risk of failure. Both changes have increased the cost of delivering power.
Fort Collins Utilities crew members change out a transformer that was overloaded under peak summer demand conditions.
4.3 Electric Utility Impacts
Cooling

98 99
Cooling
98 99
5 DiscussionThis chapter synthesizes and discusses the data and observations presented in the previous three chapters. It explores themes and root causes that underlie new home design and construction practices. This chapter also identifies opportunities to build homes that perform better. A variety of steps are listed that could be taken to tackle issues identified in this report. Like the study as a whole, this chapter addresses an arena broader than energy code alone.
This chapter includes perceptions and opinions on the part of the City of Fort Collins. These are offered to stimulate discussion of issues that have previously received little local attention. The City’s assessment is based upon data and observations from this study as well as long-term experience with energy efficiency in the housing market. Participation in a state-level stakeholder group discussing residential energy efficiency and energy code (convened by E-Star Colorado in 2000) contributed to these perceptions as well.
5.1 Is It There? . . . Does It Work?
As noted in the introduction, two questions—“Is it there?” and “Does it work?”—were central themes in this study. Both questions were asked more specifically in regard to the 1996 energy code and more broadly in regard to design, construction and performance.
5.1.1 Energy Code
How well has the 1996 energy code worked in practice? Were support efforts effective? How have code-related costs and benefits balanced? The assessment of the code and related implementation and support efforts revealed mixed results.
On the positive side, the code change prompted more sensibly designed crawl spaces, insulated basements and some progress in air sealing and insulation installation practices. These changes were responsible for reducing annual natural gas use by 16% on average. The blower-door option for meeting the code’s air sealing requirements introduced both the building industry and B&Z staff to performance testing. The Builder’s Guide and training series received good reviews from builders.
On the other hand, some aspects of City support and enforcement of the new code were characterized as insufficient or inconsistent. Compliance rates varied widely for different components. In some instances, a required component was present yet had been installed without sufficient attention to detail to ensure that it would deliver rated performance. Evidence from the field raised questions about the reliability of code-required documentation. Energy-saving benefits of the code change were only about half of what had been anticipated. Builders expressed frustration over the inconsistencies and additional paperwork associated with the code change—though many agreed that the situation had improved markedly over time as they and City staff got used to the new system.
Since data for this study was collected in 1999, the City has added staff and worked to improve the consistency of code interpretation and enforcement.
Discussion
5.1 Is it There? Does it Work?
100 101
5.1.2 Design, Construction and Performance
Were the study homes energy efficient? Healthy and safe? Comfortable? Durable? Did design and construction practices produce homes that performed well?
Fort Collins homes built during the study periods were attractive and sold well—on the order of about 1,000 single-family homes per year for much of the last decade. From many perspectives, the homes appeared to perform well. Market research interview responses indicated that owners were generally satisfied with their purchase decisions. For the average study homeowner interviewed in 1999, energy bills were not a big concern.
However, this study raises a number of concerns about building performance. Comfort complaints were common, the potential for serious indoor air quality problems existed in some homes, and there were durability concerns about some components. As experience in 2001 illustrated, volatile energy rates can expose homeowners to high bills. The municipal electric utility is increasingly strained to meet summertime peak demands, in part the result of current residential design and construction practices.
The article below summarizes the most common energy-related problems observed in study home design, construction and performance.
Common Energy-Related Problems in Study Homes
This list summarizes the key problems that surfaced in this study, for homes built from the mid- to late-1990s. Although not every home exhibited every problem, every problem was commonly observed in homes in all price ranges. The list is not prioritized.
• Comfort. Most owners reported thermal comfort problems in some part of their home. The most common issues were upper levels that were too cold in the winter or too warm in the summer, cold basements during the winter and wintertime drafts and/or cold in the vicinity of the fireplace. Despite a high occurrence of humidifiers, most owners also complained about winter air being too dry inside their homes.
• Indoor air quality. Study homes lacked comprehensive strategies to ensure good quality indoor air. Source control of pollutants was limited. Spot ventilation and filtration in kitchens and baths had questionable effectiveness, and no whole-house ventilation systems were observed. Air leakage raised concerns about the origin of makeup air. Combustion safety was a particular concern that was not effectively addressed.
• Solar effects. It appeared that the power of the sun was not considered as houses were sited (oriented with regard to the sun’s path) or designed (window type, placement, sizing, shading). This resulted in temperature control problems, overheating and glare complaints, and helped drive the growth in air conditioning.
• Architectural features. Certain architectural features—such as cantilevered floors, complex ceilings and living spaces over garages—were prone to problems with air sealing, insulation, or heating and cooling delivery. These areas, common in the study homes, did not receive sufficient attention to design and construction details to ensure they performed well.
5.1 Is it There? Does it Work?
Discussion

100 101
• Air sealing and insulation. Leaks in the air barrier allowed air and moisture to move through the thermal shell of the home. Although rated insulation R-values generally met code requirements, insulation and air sealing practices sometimes compromised the performance of installed insulation. Defects like these might be manifested as discomfort, higher energy bills, long-term building durability problems, or health and safety problems.
• Windows. Very few study homes used low-e coated, high performance windows. Instead, typical practice was to use conventional double-glazed windows, with wood or vinyl frames, in frame walls, and to use metal-framed windows (with higher heat loss) in basements. These window choices contributed to poorer comfort and higher heating and cooling loads than necessary.
• Heating and cooling equipment. Furnaces and air conditioners were commonly oversized by large margins. Some equipment operated outside manufacturer specifications for pressure drop, air flow or related parameters. These factors reduced comfort and efficiency while shortening equipment lifetime. Oversized equipment also increased first cost.
• Ductwork. Constrictions, duct leaks and pressure imbalances compromised forced-air heating and cooling performance. Even in homes with all the ductwork nominally inside conditioned space, these flaws caused comfort problems and raised concerns about building durability and health and safety. Duct leaks to the exterior also wasted energy.
• Testing. When buyers moved in, there was no assurance that key systems were working as they were assumed to be. For example, though it was known that the heating and cooling systems would turn on when the thermostat called for them, no tests had been performed to determine whether the systems provided acceptable comfort, whether equipment operated within manufacturer specifications, or whether the gas-fired appliances would vent combustion products safely under all conditions.
• Air conditioning. The market penetration of central air conditioning increased dramatically in Fort Collins during the last decade. For the homebuyer, this represented a significant first cost increase plus higher ongoing operating and maintenance costs. Sometimes power quality inside the home also was affected by large starting currents when the air conditioner turned on. Air conditioning impacts extended off-site as well, affecting the community electric power system.
5.1.3 Themes
The box above lists problems commonly observed in the study homes. A number of themes linked these problems. Note that these themes are discussed here specifically in reference to the “behind-the-wallboard” areas that were the focus of this study. There is no intent to infer that these themes apply to other aspects of new home design, construction and performance.
• Design. Data and observations suggest that the aspects of comfort, energy costs, health and safety, and building durability examined in this study did not receive sufficient design attention. There was no evidence of energy analysis (beyond the use of an energy rating to document code compliance in 5% of the study homes), design load calculations or duct design. Effects of large glass areas and their orientation did not appear to receive much
5.1 Is it There? Does it Work?
Discussion

102 103
consideration. Construction details for complex areas did not reflect key air barrier and insulation installation details. Instead, it appeared that plans and specifications affecting these aspects were based largely upon conventional building practice, rules of thumb and code requirements for individual components.
• Minimums as maximums. Building code sets minimum standards. It is not intended to define the best way to build a house. For many energy-related components, though, it was observed that the code minimum standard became the default maximum for typical practice. Even in the more expensive study homes, energy-related components—including windows, insulation and mechanical equipment—rarely exceeded code minimum requirements.
• Construction practices and quality control. Construction practices for energy-related components varied widely from one study home to another, sometimes even within a single home. Observations in some homes suggested that for work that occurred “behind the wallboard,” speed sometimes took priority over the details that contribute to better performance. In some homes, problems that were obvious to experienced energy inspectors collecting data for this study were apparently never noticed as part of the normal construction and quality control processes.
• Predictable problems. The study was designed to collect data on components and systems in which problems had been observed in the past. The same problem areas showed up repeatedly in the study homes. Examples included significant insulation installation problems in at least half the crawl spaces, very leaky ductwork in every home, at least one-third of basements that could be depressurized to levels sufficient to raise combustion safety concerns, and upper level comfort problems in most two-story homes.
Discussion
Behind the Wallboard The phrase, “behind the wallboard,” serves as a useful way to visualize two different realms in a house: the aspects most consumers take into consideration when they make new home purchase decisions, versus the aspects few customers think about.
Wallboard represents the separation between the finish materials and the components and systems that determine how the house performs.
5.1 Is it There? Does it Work?

102 103
Many things are literally invisible behind the wallboard in a finished home: most of the framing, air sealing, wiring, plumbing, ductwork and insulation. For example, there is no way to see whether the insulation and air barrier were properly installed behind the fireplace or whether the bath fans were effectively vented.
Many other aspects that are not hidden also receive little consideration in the purchase process. For example, little thought goes toward the type or solar orientation of windows, architectural features that need special attention, the efficiency or combustion safety of the water heater, or the impacts of design and construction decisions on the region’s power supply needs.
Discussion
5.1 Is it There? Does it Work?

104 105
5.1.4 Changing Practices
Data and findings for this study reflect design, construction and performance for homes built in Fort Collins from 1994 through 1999. An obvious question is whether this information accurately characterizes Fort Collins homes built since then. Certainly there have been changes in design and construction practices and in the way in which the energy code has been enforced.
Though a comparable data set has not been collected since 1999, a variety of information sheds some light on the answer:
• Windows. There has undoubtedly been an increase in the use of low-e coated, high-performance windows. Informal discussions with Fort Collins window distributors in late 2000 suggested that the market penetration of high-performance windows in new construction might be as high as 40% versus the very low market penetration observed in this study. Energy ratings of new homes for code compliance (not a random sample) indicate an increase in market penetration of low-e windows. Increased use of high-performance windows would provide several benefits.
• Air sealing. In response to preliminary findings from this study and a variety of other changes, B&Z staff report that enforcement of code-required air sealing has been stepped up since 1999, as has the use of the blower-door option for air sealing compliance. These changes may have reduced new home air leakage rates compared with the study homes. Decreased air leakage could have positive or negative ramifications depending on other house-as-a-system factors.
• Insulation. There have been anecdotal reports of increasing use of blown fiberglass, wet-spray cellulose, and dry-blown cellulose insulation in building components that were insulated with fiberglass batts in the study homes. Use of different insulation materials and techniques may help to address some of the air leakage and insulation installation issues observed in this study.
• Fireplaces. Anecdotal information suggests decreasing use of atmospherically vented fireplaces. This would have positive impacts on air leakage, comfort, pressure imbalances and combustion safety.
• Attic furnaces. Some homes in two recent Fort Collins subdivisions are being built with furnaces located in the attic, in contrast to the typical study home practice of placing equipment in the basement. Flexible ducts are used in the attic, connecting to more conventional duct construction in the rest of the home. This change may increase duct losses to the exterior of the home, with a corresponding increase in energy use. In two-story homes, delivery of conditioned air to the upper level may be improved, reducing comfort problems.
• Sealed-combustion furnaces. At least one medium-volume builder in Fort Collins has reportedly made sealed-combustion furnaces a standard feature. This change offers increased efficiency and increased resistance to backdrafting as well as a reduction in air leakage and in problems associated with large combustion air ducts.
• Duct sealing. Anecdotal reports indicate a small increase in the number of homes in which mastic, rather than duct tape, has been used to seal ductwork throughout the home. This would be expected to reduce duct leakage compared with study home results, particularly over the long term due to the better durability of duct mastic. Lower duct leakage can offer several important benefits. Care must be taken with duct sealing, though, because house-as-a-system interactions may increase the effects of remaining duct leakage on combustion safety.
Discussion
5.1 Is it There? Does it Work?

104 105
• Systems approaches. At least two large production builders, which either build in Fort Collins or are just beginning to, have been making significant changes in their overall approach to energy-efficient construction. They are focusing more on systems performance solutions. These builders are testing their homes to check performance and provide feedback. These changes have the potential to address many of the issues discussed in this report.
Many of these changes are promising. However, to date there are insufficient data to quantify the extent of these changes or their effects on energy use, comfort, health and safety, or building durability.
Discussion
5.1 Is it There? Does it Work?

106 107
5.2 Root Causes
Many interrelated factors could be considered root causes that contributed to the problem areas documented in this report.
• Awareness and assumptions. Awareness of the kinds of issues described in this report was not widespread among participants in the housing market. Buyers have largely proceeded on the basis of assumptions that their builder and the building code were taking care of quality, energy efficiency, comfort, durability, and health and safety. They rarely asked about these things. Only a small proportion of the building industry had been exposed to the problems and solutions addressed in City-sponsored training and the Builder’s Guide or through other programs at the state and national level. Building inspectors, lenders, appraisers, real estate agents and insurers have largely been uninformed about these issues as well.
• Short-term perspective. Many buyers purchased homes with the expectation of staying there only a few years. Size, amenities, first cost and other traditional real estate factors were more important criteria when choosing a home than long-term operating and maintenance costs.
• Inexpensive energy. In Fort Collins, energy prices had been declining, in real dollars, since the early 1980s. In response, energy concerns dropped lower on everyone’s priority list.
• No way to differentiate. There were no readily available ways for homebuyers or builders to identify homes that performed better. There were no common metrics for comfort, building durability, or health and safety. Home energy rating systems have been a good start at differentiating homes based on energy efficiency potential, based on plans and specifications. However, these have not adequately captured as-built performance differences; some of the study homes that earned high energy rating scores exhibited many of the performance problems described in this report.
• No higher target. Buyers apparently were satisfied to hear from builders and salespeople that the new homes they bought “met code.” The value of a home built to exceed code minimums had not been established.
• Component thinking. An understanding of how the house performs as a system shows that focusing on individual components may miss important consequences. For example, design decisions and construction practices regarding the height of the house, air sealing, ventilation equipment, fireplace, ductwork and water heater all affect whether the water heater will vent combustion products safely out of the home. The energy code is largely based on a prescriptive, component-based approach that does not adequately address such systems-level complexities. Likewise, the building industry delegated a lot of responsibility to individual subcontractors, each of whom knew a lot about their own area of expertise but none of whom had the whole-house picture. In this environment, important systems aspects could be overlooked.
• Few consequences. When problems occurred, there were few overt consequences. Many code violations were not detected by City inspectors. With Fort Collins’ moderate climate, many problems surfaced as moderate annoyances rather than as severe concerns that demanded immediate attention. Homeowners who asked their builders to fix problems were sometimes confronted with the reality that many problems were not feasible to address in a completed home. Though builders may have made good-faith attempts to solve problems, sooner or later many owners learned to live with less than satisfactory performance.
5.2 Root Causes
Discussion

106 107
• Booming market. The very active Fort Collins housing market compounded the situation. The labor pool was tight, meaning it was harder to find and retain skilled workers. Important construction details may have been shortchanged in response to pressures to build homes quickly and at a competitive sales price. Training and quality control may have become extras rather than basics. In 1996, when the new energy code was implemented, the unanticipated level of demand for building permits and inspections forced B&Z to focus on traditional areas (structural, electrical and plumbing). Little time could be devoted to energy details.
• Status quo. Status quo is a powerful force. The size and complexity of the housing market meant that it changed slowly. The building industry could be most profitable working with known products and building techniques; anything outside the normal commodity realm could represent a special order and significant cost increase. Learning curves could be challenging.
The market has been working. New homes have sold well. Designers and builders have been making decisions in response to the questions buyers ask. There have been few incentives to focus more heavily on “behind-the-wallboard” details, systems interactions and whole-house performance. Buyers have likely been getting what they paid for, though perhaps not what they assumed they were getting. Neither regulatory nor market forces have provided sufficient incentive for significant changes in the way homes have been designed or built.
Discussion
5.2 Root Causes
108 109
5.3 Energy Code InsightsExperience with the 1996 Fort Collins energy code provides insights about moving toward better-performing, energy-efficient housing.
• Code design. While the 1996 energy code remains a potentially effective tool for energy savings, it has been viewed by some as too sweeping and complex in practice. To obtain a high degree of compliance, B&Z staff report that this single aspect of new home construction required more enforcement effort than any other. This suggests that simplicity should be a more highly ranked criterion in future code re-designs.
• Is it there? Does it work? The traditional code focus has been prescriptive, heavily weighted toward Question #1: “Is it there?” The 1996 code changes took several steps toward Question #2: “Does it work?” More attention was focused on installation details via the Air Sealing Checklist and Insulation Guidelines. The blower-door test option for air sealing compliance offered a direct way to evaluate air sealing effectiveness. Disclosure forms encouraged a closer look at air sealing, insulation and mechanical equipment practices. These code changes were intended to address recurring problem areas and to increase the likelihood that components would be installed such that they would deliver rated performance. The general experience was some progress in installation practices but many details still slipping through the cracks. This raises questions about the energy code’s limits in addressing details and performance.
• Code implementation and resources. The 1996 code change represented a significant increase in workload for B&Z staff. New compliance materials and inspection procedures had to be developed. Staff needed training in using them. Additional time was needed for plan review and inspection. At the time, the B&Z department was already stretched beyond its limits due to the surge in Fort Collins building volumes. As a result, new code instructions and compliance forms had rough edges. B&Z front-line staff received too little training before being put in the position of enforcing the new code. Insufficient staff time was available to carefully review plans and inspect each home. These were critical missing pieces that led to confusion and inconsistent enforcement and compliance. Over time, B&Z received increasing resources to better match its workload, but the early deficiencies have had lasting effects. This suggests that future code changes be implemented only when there are sufficient resources available to effectively support the changes.
• Code support. A grant to the City from the Colorado Governor’s Office of Energy Management and Conservation funded early support efforts for the building industry after the code changed. This money enabled the City to develop the Builder’s Guide and offer training. These were a good start, but could not be adequately sustained with available City resources. For builders and subcontractors who attended training, there was little reinforcement for what they had learned once they returned to the jobsite. No building industry training has been offered by the City since mid-1997; with turnover in the industry, this has left many without a firm understanding of the code requirements. This experience suggests that when significant code changes take place, an ongoing support strategy may be needed, with sufficient resources to make it happen.
• Code versus market forces. There may have been too much reliance on energy code alone to make progress on addressing the kinds of problems reported in this study. Both the training series in 1996/97 and Builder’s Guide included many recommended practices to encourage builders to move beyond code and address these problems. However, as noted in Section 5.2, market forces have not been strong enough to give builders the incentive to do so. This suggests a more balanced approach might be more successful, with an increased focus on consumer education to create more market demand.
Discussion
5.3 Energy Code Insights

108 109
5.4 Significance
A key aspect about new construction is that it offers many one-time chances to economically avoid problems. Issues that are not addressed at time of construction may become “lost opportunities” that are very expensive to address in a completed home; in fact, they may be so expensive that they may persist for the life of the home. Therefore, new home design decisions and construction practices have significance at many levels.
• Homeowners. Homeowners are directly affected by issues documented in this report. These effects range from minor annoyances to significant problems. Case studies show people living in recently built homes who didn’t use certain parts of their home because they were too cold in the winter, people who spent hundreds of dollars on retrofit measures to try to make their home more comfortable, and people who were exposed to carbon monoxide and other unhealthy combustion products. Though few study homeowners complained about energy costs, a small part of their total housing expenses, their perspectives may change as energy prices change over the life of the home.
• Builders. When new homeowners contact their builders about problems, the only option in many cases is to treat the symptoms. About 40% of the homeowners interviewed for this study reported they had called their builder to fix a problem related to comfort, safety or energy use. Of those, 60% felt that the builder correctly identified the cause of the problem and half reported the builder was able to fix the problem. The flip side: about 40% said the builder did not correctly identify the problem, and half said the builder did not fix the problem. Callbacks are expensive for builders, cutting into profit margins. Unsolved problems can lead to unhappy customers.
• Community. The community is indirectly affected as well. Air conditioning has the most quantifiable community impacts. As discussed in Chapter 4, the many new home decisions that determine a home’s design cooling load and annual cooling needs can contribute to the municipal electric utility’s growing summer peak electrical demand. This in turn contributes to revenue shortfalls (with existing rates), overloaded transformers and an accelerated need for new power generation. These effects increase the price of electricity for all Fort Collins residents and businesses.
Front-end decisions made by the designer, the builder and the first homebuyer have long-term effects. The underlying expectation is that a home’s lifetime is 100 years or more, far beyond the period during which any of the original decisionmakers are involved with the home.
Discussion
5.4 Significance

110 111
5.5 Opportunities
The extent and significance of the problems identified in this report can be debated at length. The good news is that technical solutions exist for all of them. Innovative builders have demonstrated that solutions can be implemented at moderate cost. The box below outlines promising changes in design and construction.
The “Whole-House” ApproachA “whole-house” or “systems” approach to design and construction can provide better performance without a proportionate increase in costs. This is done by allocating more resources to certain areas (e.g. thermal envelope components such as windows and insulation) that allows costs to be reduced in other areas (e.g. heating and cooling systems). Experience of builders who have used this approach suggests that the kinds of changes described below may increase the cost of building a home by 1% to 2%, while providing significantly better comfort, energy efficiency, durability and indoor air quality. In some cases, it has been possible to make changes like these with no net increase in cost.
Builders can take advantage of the following steps to better performance:
• Goals and standards. Define the performance goals and the measurable standards needed to achieve those goals. Clearly communicate goals and standards to all members of the design and construction team.
• Analysis. Rather than relying too heavily on conventional rules of thumb, have a whole-house energy analysis performed on a current set of plans to identify the best targets for reduced energy use. Make changes in plans and specifications accordingly and run the model again. Calculate design heating and cooling loads based on the plans and specifications for the house being built and as oriented to the sun.
• Sun-conscious design. Design with the sun, taking advantage of daylighting and wintertime heating benefits while minimizing solar gains during the summer and glare year-round. Reduce or eliminate the need for and cost of air conditioning by reducing cooling loads. Pay close attention to orientation of the home and placement, sizing and shading of windows. At a minimum, choose windows carefully, specifying low-solar-gain units where necessary to avoid too much solar heat. If the house will get a significant amount of winter sun, follow through with passive solar design details.
• Efficient shell. Build a thermally efficient shell to improve comfort and allow heating and cooling equipment to be downsized. If framing with wood, use advanced framing techniques to reduce the use of a valuable resource and provide more room for insulation. Increase insulation values as appropriate for a whole-house approach. Build a tight shell with a continuous air barrier that is fully aligned with the insulation boundary. Consider the use of alternative insulation products and/or building systems. Specify high-performance windows and skylights.
• Indoor air quality. Develop a comprehensive indoor air quality strategy that starts with source control. Use sealed-combustion equipment (see Sealed-combustion appliances on next page). Discourage gas ovens—at minimum, install vented, quality kitchen hoods over all gas stoves. Build a tight house so that ventilation can be controlled and paths for
Discussion
5.5 Opportunities

110 111
pollutant transfer from the earth, garage and attic are eliminated. Provide quality, quiet equipment and controls for both spot- and whole-house ventilation. Install detectors as needed for specific pollutants.
• Sealed-combustion appliances. For the most fail-safe way to reduce combustion safety liabilities, install equipment that can’t backdraft. Specify sealed-combustion or direct-vent furnaces, water heaters and fireplaces. These appliances don’t require open “combustion air” ducts to be installed, a significant comfort benefit. Some sealed combustion or direct-vent appliances also provide higher efficiency as a fringe benefit.
• Heating and cooling systems. Save money by correctly sizing the equipment based on calculated design loads. Smaller heating and cooling loads, resulting from recommendations above, may allow less expensive equipment options. The cooling load may be so small that central air conditioning is not needed. Install equipment and distribution systems carefully. If using forced-air ductwork, consider a smaller and less complex duct system, pay attention to pressure drop, make the ducts airtight with permanent sealants, and install balancing dampers.
• High construction standards. Establish an expectation for high standards and minimal callbacks. Set a goal that quality “behind the wallboard” will equal or exceed the quality in finish materials that the customer will see.
• Quality control. Establish systematic procedures to ensure that specified components have been installed, that they meet the requisite construction standards, and that they work well as part of the whole house system. Test performance and compare against the standards set earlier. Use the feedback to fix problems and improve the next house built.
• Builder responsibility. Take full responsibility for construction standards and quality control; it’s the general contractor’s job to deliver a house that works. Do not assume that subcontractors or City inspectors will do the job.
Many benefits can result from an approach such as this: a healthier indoor environment, better comfort, lower operation and maintenance costs, homes that are more durable, happier new home owners, fewer callbacks and greater profits for builders, and a reduced rate of load growth on the electric utility system. Case studies in this chapter (on the next page and page 119) provide examples in which these kinds of changes are paying off. As noted above, a handful of Colorado production builders are moving toward systems approaches. Their motivation is the bottom line.
Some opportunities can be realized with less extensive changes that address individual components. For example, the switch to high-performance windows is a simple product substitution that provides several benefits. There are two cautions, though, about component changes. First, the benefit-to-cost comparison often won’t be as favorable for component changes as for systems-level changes. Second, component changes may have unintended house-as-a-system consequences. For example, more extensive duct sealing may push heating and cooling equipment operation further out of manufacturer specifications and may increase combustion safety concerns.
5.5 Opportunities
Discussion

112 113
Case Study: Affordable EfficiencyHabitat for Humanity International’s goal is to “build simple, decent, affordable houses in partnership with those in need of adequate shelter.” Habitat is reportedly the world’s largest homebuilder. Since 1976, they have built almost 100,000 homes worldwide, including some 30,000 in the United States. Most homes built by Habitat’s U.S. affiliates are three- and four-bedroom models ranging between 1,000 and 1,200 square feet.
During the mid-1990s, Habitat’s central office, based in Americus, Georgia, began examining the organization’s energy efficiency and “green building” practices. They gathered advice from building scientists at the Florida Solar Energy Center, the Energy and Environmental Building Association (Minneapolis), the Southface Institute (Atlanta), and Building Science Corporation (Massachusetts). Thereafter, Habitat began recommending a new performance benchmark for its homes: EPA’s Energy Star threshold—30% more efficient than a home built to CABO’s 1995 Model Energy Code.
Habitat’s central office doesn’t prescribe minimum efficiency standards for homes built by affiliates. “We strongly promote energy efficiency,” said Nevil Eastwood, in charge of construction and environmental resources for Habitat International. “We are aware of construction costs we add that increase the first cost of buying the home. However, we take the long-term view of ‘affordability,’ which means a home must be affordable to live in, not just buy. In fact, building to the 5-Star level has actually increased the number of people who can qualify for one of our homes; since their monthly energy bills will be lower, their income doesn’t have to be as high. So we encourage all our affiliates to meet the Energy Star level, but ultimately we leave that decision up to those affiliates.” Habitat set up a “Green Team” to train personnel from affiliates interested in upgrading their energy efficiency and resource efficiency (use of materials). Several key energy features they strongly recommend include solar-friendly building orientation, low-e windows, air sealing, ductwork sealed with mastic, and good ventilation. The latter consists of vented kitchen fans, quiet and durable bath fans, and fresh air brought in through a duct from the outdoors whenever the air handler fan operates for heating or cooling purposes. Habitat frequently tests home tightness with a blower door.
One of the first homes to incorporate these standards was the Denver Habitat affiliate’s 1997 “Earth Smart home.” The National Renewable Energy Laboratory provided both pre-construction modeling of the savings projected by the upgraded energy measures, plus on-site monitoring of energy performance and consumption. Bottom line savings: the Earth Smart home required 60% less heating energy than the comparison home built to the CABO Model Energy Code. Actual total utility bills (electric and gas) range from about $25 per month (summer) to about $50 per month (winter); that represents a huge savings compared to the same family’s utility bills in their previous inefficient apartment ($70 summer to $175 winter).
Discussion
5.5 Opportunities
112 113
5.6 What’s Next?
This new home study identified many issues. The previous section suggests opportunities. An obvious question is, “What’s next?” This section lists a variety of courses of action that could be discussed if there is a will to make changes. Next steps could include many combinations of education, incentives, policy and regulation. They could be pursued through the public or the private sectors or a combination of the two.
To be clear, the purpose of this section is to put a laundry list of ideas on the table for discussion, not to pre-determine any particular course of action. The ideas are not prioritized.
5.6.1 General Considerations
There are important “big-picture” issues to be considered as potential changes are discussed:
• Sustained effort. Short-term thinking was identified as one of the root causes of the problems with current practices. In the same vein, quick fixes are unlikely to be successful. It will take a sustained effort and corresponding commitment of time and money to affect the way the market works. Immediate results should not be expected.
• Simplicity. Simplicity should be a key consideration for all participants. Buyers shouldn’t have to become experts in what goes on “behind the wallboard” to know how a home will perform. Attempts should be made to keep requirements and procedures simple for the building industry as well. The balance, however, is not to become too simplistic, overlooking important house-as-a-system issues.
• Funding. Since it can be very expensive to fix problems in completed homes, it makes sense to commit financial resources toward the outcome of building better-performing homes with lower operating and maintenance costs. Most of the options listed in this section will cost money. However, the cost of change can be kept in perspective by considering the overall annual investment in the Fort Collins new home market over the past few years. The average price of a new Fort Collins single-family home in 2000 was about $250,000. Approximately 1,000 homes have been built in city limits every year for the past few years, for a total annual investment on the order of $250 million. On the energy side of the picture, the average annual energy cost for a study home was about $1,000 in the 1998/99 study year and rose to more than $1,500 in early 2001. Additionally, the growing impact of residential air conditioning on the electric utility system is increasing the cost of supplying electricity. The costs of continuing on the current path are very large.
• Collaboration. Available information suggests that the problems identified in this work are applicable to a broad geographic region. Likewise, solutions may be more effective if pursued on a larger scale than just a single city and more could probably be accomplished with a smaller investment of City resources. It may be possible to build solutions based on existing efforts elsewhere. There are numerous potential collaborators in both the private and public sectors. Tradeoffs to collaboration will need to be considered as well. Larger-scale programs with more participants may also bring more overhead and be less responsive to local needs.
• Does it work? When crafting the next steps and evaluating their results, it will be important to continue to ask Question #2, “Does it work?” Funding must be available for this purpose as well.
Discussion
5.6 What’s Next

114 115
5.6.2 Energy Code
There are many changes that could be pursued in code design, implementation and enforcement. B&Z has already responded to some of the code-related concerns identified in this study with increased staffing levels and more emphasis on key code provisions.
• Code design. The code should be reviewed from a perspective of how to resolve existing problems and simplify the code where possible so that it is easier to understand and enforce. Specific areas of the code that should be reviewed include:
− Cooling. Should the code take a more aggressive approach to reduce cooling loads?
− Air sealing. Can the prescriptive Air Sealing Checklist be simplified? How can the prescriptive and blower-door compliance options be better matched? Should there be a subset of the prescriptive list that must be completed even if the blower-door approach is chosen?
− Insulation. Are the Insulation Guidelines appropriate? Will they be enforced? Should they be strengthened? Simplified?
− Wall assembly. Should each element of the wall assembly (opaque walls, windows, doors) have separate requirements rather than being regulated as a whole? Should solar gains be factored into the wall assembly requirements?
− Basement insulation. Based on several years of experience, is the requirement for basement wall insulation on track? Do the benefits justify the costs?
− Heating and cooling systems. Can code be designed more effectively to improve the installed performance of these systems?
− Indoor air quality. Should the energy code take a more active stance on indoor air quality? How can combustion safety be handled in a way that provides more assurance that new homes will be safe for occupants?
− Systems analysis. Are the systems analysis methods sufficiently well matched with the prescriptive approach? Should the list of prescriptive measures required for homes that comply under the systems analysis path be modified?
− Performance testing. Should testing play a larger role in the code, either as a mandatory element or as an optional compliance path?
• Boundaries. What are the appropriate minimum standards that code should set, versus optimum construction practices that can be encouraged through other means? Can code incorporate more of a systems thinking, “Does it work?” perspective or is it by nature limited to a component-based, “Is it there?” viewpoint? Should energy code focus solely on health and safety elements, or should it also consider criteria of energy use, comfort and building durability?
• Implementation and enforcement. Areas that deserve discussion include:
− Compliance guide. How can code compliance instructions for builders be clarified? Could documents such as the Insulation Guidelines, Air Sealing Checklist and Builder’s Guide be more effectively integrated?
− Systems analysis. How can home energy rating system providers and B&Z coordinate efforts more effectively to ensure that all homes following the systems analysis path meet code requirements? Are responsibilities clearly delineated?
Discussion
5.6 What’s Next
114 115
− Documentation. Are forms user-friendly for builders to complete and for City staff to check? Are some documentation requirements superfluous? Is there additional information that should be collected? Should computer-based compliance forms play a bigger role? What information needs to be archived, either short-term or long-term?
− Enforcement. Do City staff have adequate training to consistently enforce code? Have inspection standards and protocols been clearly defined? Are changes needed to ensure that required forms are submitted at the proper time with accurate information?
− Quality control. Should City procedures be audited on a regular basis to ensure that both plan review and field enforcement aspects of the code are being performed correctly and consistently?
Enforcement plans and resource needs could be developed simultaneously with any code redesign, so that the final product is enforceable with the level of available resources.
5.6.3 Other Regulatory StepsSeveral issues regarding oversight of trades might be discussed: more rigorous contractor licensing or certification requirements, some level of mandatory energy-related training to acquire or maintain licensing or certification, and development of standards and protocols for performance testing.
5.6.4 Non-Regulatory StepsThere are many non-regulatory approaches that could be employed as an adjunct to energy code.
Building AwarenessIncreasing awareness of the problems documented in this study and of opportunities to build better-performing homes appears to be a very important step. There are many ways this could be done. Examples include disseminating the results of this study to all of the key stakeholders, building awareness of the value of a target higher than code minimum standards, helping buyers get a more balanced picture of “affordability,” publicizing success stories, holding open houses in homes under construction (where buyers can see differences “behind the wallboard”) and sponsoring homebuyer workshops that give buyers tools to help them differentiate quality.
TrainingSeveral stakeholder groups would likely benefit from ongoing training opportunities, customized to serve the needs of each audience.
• Builders and subcontractors. Training could cover general topics (e.g. systems approaches to design, indoor air quality, relationships between callbacks and profitability, quality control systems, marketing strategies) and specific techniques (e.g. advanced framing, insulation installation details, heating and cooling load calculations, duct leakage testing). Job site and hands-on training approaches could be considered. Detailed case studies could be developed to illustrate how other successful builders have changed the way they do business.
• B&Z staff. Plan checkers and inspectors need to have a solid understanding of code requirements, plan review and inspection techniques. Techniques to train for better consistency among inspectors could be explored.
Discussion
5.6 What’s Next

116 117
• Real estate agents, lenders and appraisers. These audiences could be exposed to the same kind of information available to consumers as well as to a subset of what builders are learning. They could also receive specific training on the value of energy-efficient housing, financial incentives available for energy-efficient homes, and the risks of ignoring current problems.
Means of reinforcing what’s been covered in training, after the classes are over, could also be explored.
Tools for BuildersNew or improved “tools” might make it easier for builders and subcontractors to successfully implement practices required by code or recommended in training.
• Builder’s Guide. The existing Builder’s Guide could be improved based on builder experience using it, findings of this study and the extensive photos and figures developed for the Project Report.
• Model documents. As a starting point for builders, several types of model documents could be developed and provided electronically: specifications, building details (e.g. one-page, laminated figures that could be posted on site) and inspection checklists.
• Homeowner’s manual. A homeowner’s manual, based on an electronic template, could be developed for customization by individual builders. In addition to information builders are already providing to new owners, topics for such a manual could include home energy rating and heating/cooling load calculation results; specifications and testing results for insulation, windows, air leakage, mechanical equipment, duct leakage and flow; operation and maintenance instructions regarding indoor air quality and combustion safety, and summer cooling strategies.
Building Industry ServicesServices that have not been readily available to local builders could be encouraged, such as:
• Load calculations. Accurate design load calculations are a prerequisite for correctly sizing heating and cooling equipment. Because they require much of the same data, load calculations could potentially be generated by a home energy rating system.
• Inspection. Given the problems with quality control observed in the study, and the inability of the energy code to play a significant role in that regard, third-party inspection services that focus on energy-related issues may have a role.
• Performance testing. More trained providers may be needed to offer such services as blower-door testing, duct performance testing, heating/cooling equipment performance testing, combustion safety testing, pressure balancing and infrared scanning. Services could be offered independently or as part of a more comprehensive “commissioning” service.
Marketing SupportShared resources could be used to provide marketing support and encouragement to the building industry. Market research could be conducted to evaluate public interest in higher quality, better-performing homes and willingness to pay more for a better product. This could help builders evaluate the niche, as well as help the City and other players evaluate the feasibility of some of the possible courses of action listed in this section. In addition, builders who take steps to meet higher performance thresholds could receive marketing support.
Discussion
5.6 What’s Next
116 117
Air Conditioning Antidotes
There are several possible ways to deal with the rapid increase in residential air conditioning and its impact on the electric system. These fall into two general categories.
• Symptomatic approaches. Approaches dealing primarily with symptoms include:
− Air conditioner cycling or thermostat control. Like the longstanding Fort Collins HOT SHOT water heater load control program, the electric utility could send a signal to participating customers’ homes to reduce air conditioner operation during utility summer peak demand periods.
− Electric rate re-design. The goal could be to send a more accurate cost signal to customers, meaning higher bills for customers with air conditioning that operates during the utility’s summer peak demand periods.
− Incentives for cooling systems that put less strain on the electric system. Qualifying systems might include whole-house fans or higher efficiency air conditioning equipment (qualification criteria might include important details such as correct refrigerant charge and proper air flow).
• Systems approaches. Cooling loads could be cut significantly by using a systems approach to design, including close attention to the sun. In this moderate cooling climate, it is very feasible to build homes that are comfortable during the summer without air conditioning.
Home Energy Ratings
Two home energy rating systems operate in Fort Collins: the statewide E-Star Colorado system and the City’s ENERGY SCORE program. Both offer builders, buyers and others a tool to help differentiate energy efficiency from one home to the next. Some possible changes to consider include:
• Rating versus reality. Do the current rating approaches provide the appropriate signals to buyers and other users? Are ratings correlated well, on average, with actual energy use? Should a different metric be developed to better differentiate a house that performs well versus one that doesn’t (i.e. a metric that also reflects health and safety, durability and comfort)?
• Expanded menu of services. A home energy rating program could serve as a platform through which to offer some of the building industry services listed above. These could be provided as options in addition to the basic energy rating.
• Alliances. Given that ENERGY SCORE is now more than 10 years old and in need of updates, and that E-Star Colorado has had time to get past start-up challenges, it may make sense to join forces and put City resources into the statewide venture rather than continue to operate an independent local program.
Discussion
5.6 What’s Next

118 119
New Home Certification Program
A comprehensive program could be developed to certify new homes that meet pre-defined standards. To be meaningful in the context of the findings of this study, such a program would be designed based on building science principles, using a whole-house approach that focuses on as-built performance (comfort, energy-efficiency, health and safety, building durability). Elements of a certification program could include:
• Standards. These could set benchmarks for whole-house attributes such as comfort, energy efficiency and combustion safety, as well as more detailed standards for components or subsystems such as window specifications, house tightness and ductwork pressure drop and leakage. Standards could be extended to include lighting, appliances and other elements of “sustainable design” or “green building.”
• Design assistance. Plans could be reviewed and discussed with the designer. Energy modeling could be performed for feedback about whole-house energy use and to identify areas in which to look for improvements. Load calculations, equipment and duct sizing services could be provided as well.
• Model specifications and building details. These could be developed to be used as training materials, referenced in subcontractor contracts, and/or posted on the jobsite.
• Construction inspections. Third-party inspections, more comprehensive than existing code inspections, could augment builder quality control programs. These could be conducted at several critical stages, identifying problems before it is too late to fix them.
• Performance testing. Testing before the house is delivered to a buyer could assure that participating homes meet program standards and that systems are working well. This could help minimize the need for expensive callbacks (and provide feedback to enable the builder to make the next home perform even better).
• Contractor signoff. Because the general contractor is ultimately responsible for the final product, the contractor could be required to certify that all systems are working properly.
• Marketing support. This could include general buyer education about the benefits of new home certification, development of marketing materials and Web sites, open houses and co-op advertising with participating builders.
• Guarantees. If many of the above steps are followed, it would be a low risk to guarantee that heating and cooling energy use on a particular home would not exceed a certain amount. Comfort guarantees are also a possibility. These could be effective at capturing buyer attention.
Such a new home certification program could serve as the umbrella for many of the other possible “next steps” noted in this section. It could be sponsored by a homebuilders association, a governmental entity, a utility, a non-profit entity, a product manufacturer or some partnership.
Two elements may be very important in ensuring the credibility of such a program. First, program standards that ensure that certified homes perform substantively better than conventional new housing stock, with consistently high levels of occupant satisfaction. Second, quality control that is sufficiently stringent so that only homes that meet all standards receive certification and other support.
Discussion
5.6 What’s Next

118 119
Several programs developed elsewhere in the last few years provide useful models of new home certification programs. In these programs, homes built by production builders have typically achieved 25% to 50% energy savings compared with homes built to the Model Energy Code, while delivering other benefits described above.
Case Study: Plowing New GroundThis case study was written by Steve Andrews, on behalf of E-Star Colorado, and was first published in The Homebuilder, the magazine of the Homebuilders Association of Metro Denver. It is reproduced here with the author’s permission.
Artistic Homes is New Mexico’s largest builder. In 2000 they sold 689 homes, priced between $80,000 and $115,000, to first-time buyers. Despite a down market, plus a major slow-down to completely change their building system at the start of the year, they sold about 850 homes in 2001.
A 25% increase? During a bad year? Why?
Until last year, Artistic Homes’ sales represented the largest chunk of builder participation in New Mexico’s Green Builder program. But after a year of rethinking the issues, plus some travel and new study, Artistic Homes’ president Jerry Wade decided to go in a different direction. Soon thereafter, the Central New Mexico’s Home Builders Association joined him. Today, every home that Artistic Homes sells meets the rigorous Building America program standard. That new standard is now the minimum entry threshold for Central New Mexico HBA builders who participate in what used to be their Green Builder program. And every home gets tested and certified.
Why They Changed
“We were the only production builder in the Green Builder program, so it wasn’t really going anywhere,” said Wade. “We mentioned to the HBA Board of Directors that we were looking around the country, trying to find a better standard to build to. We thought our program had too much window dressing and not enough buyer benefits. The HBA board decided to upgrade the program, reach more builders and establish more credibility in the marketplace.” “We looked closely at Tucson’s program, but it didn’t quite fit for us. Then we heard about the Department of Energy’s Building America program. Their consultants could take our plans and tell us what changes we needed to make to build the best house on the market that would still be affordable to the first-time home buyer.”
Wade liked the idea, so Artistic Homes built some test houses. “We liked the results even more. The homes were super comfortable and energy efficient. So we made the commitment to build all our houses to the new standard. Now it’s helping us capture more of the market, because there is nothing better being built out there. “We took the Building America program to the Central New Mexico Home Builders’ Association and said they ought to switch from the green program to this,” said Wade. “Building America agreed to sit down with the HBA and come up with some guidelines
Discussion
5.6 What’s Next

120 121
and provide training for builders and consumers. We insisted that their system couldn’t be watered down. A number of builders wanted to ride this wave but not do every house this way. We were dead set against having different levels, or that builders would build some homes this way but not all of them.”
Learning Curve “Nobody wants to say we’ve been doing it wrong all these years, and yet we have,” said Wade. “We have succeeded in building houses that are unhealthy.”
With what he has learned during the past year, Wade is concerned that a few builders might adopt some of the Building America measures without a systems-like understanding of the possible implications. “If you seal up a house like we do now, without an exhaust fan but with a standard water heater and furnace, people could get sick and even die [of carbon monoxide poisoning]. Tightening up does save energy, but if you kill somebody, that’s not good. So either do it right, or don’t do it at all.” “The Building America standard is the biggest change in the construction industry since 1965 when I started building,” said Wade. “This isn’t easy. In fact, it’s a total pain in the ass. There’s a big learning curve that goes along with it. It’s been tough on our subs. You have to retrain your framers, plumbers, electricians, everyone. And all along the way there is resistance to these changes, because we’re creatures of habit. We all say ‘it’s been good enough for decades; why change now?’” “It takes a while to grasp the concepts. For people who know construction, 85% of them will look at the idea and say ‘we can do that.’ But it won’t be that easy because there are too many people involved. In my mind, we’ll still be a baby at this for another year. We’ll need the consultants’ help during that time. Then we can be weaned.”
HVAC Barrier
Max Wade, Jerry’s son, has been the primary carrier of the Building America torch within Artistic Homes. During their evolutionary process, the toughest single challenge he faced was getting his HVAC team to completely change their design and installation practices.
“We really had to work on our HVAC contractor, because now he does the opposite of virtually everything he used to do,” said Max. “Now it’s no ducts in the attic, tight ductwork, transfer grilles instead of a return-air duct in every room and air-conditioning instead of evaporative cooling.”
“We took him to visit Building America homes and talk with their contractors in Tucson and Las Vegas. Those HVAC contractors told our guys that downsized systems really worked in tight, energy-efficient homes. They told him, ‘we’ve been doing it this way for three years, and haven’t had any callbacks’. But even visiting with those guys didn’t change his mind. He simply didn’t want to do it or to believe you could cool houses with one ton of cooling per 1,000 square feet of floor area. When he got back he finally said, ‘Look, I’ll build a few of those systems just to prove to you that they can’t work.’ Now he’s our biggest advocate. We haven’t had a house where we had to go back and modify anything about the HVAC system. It’s working.”
Discussion
5.6 What’s Next

120 121
Don’t Codify
Jerry Wade wouldn’t want to see the Building America standard made code. “There are only so many people in this nation who have the knowledge to teach others how to build this way. If the government said this is code, it would shut us down because there aren’t enough people who know how to do it right. So it wouldn’t be done right and inspectors wouldn’t know. “In fact, we’ve had inspectors say ‘no way any of this will work.’ But they have faith in us as builders, so they have gone along with it. We have one inspector who is planning to build his own house, and he attended Building America’s monthly seminar. Well, last night he said ‘now I know what you’ve been talking about. Now that I know better, I’m sold.’”
Getting the Word Out
“We’ve had to retrain our sales people too,” said Jerry Wade. “We have some going through every seminar. If sales people don’t know about it, they can’t use it. Our sales people now have a list of 20-some items that are a standard part of this new building process; we tell potential buyers to use it when shopping the competition, and they do.
“By now, the word has gotten around. During the last four or five months, over 1,000 consumers have come to one of the monthly seminars Building America puts on. Because our competition is getting hammered by customers and their questions, more builders are showing up every time Building America sponsors one of their seminars for builders. We had about 50 builders attend last night, and we have eight or nine signed up for the program. This information is sinking in. So any builder with anything between the ears, he knows lawyers are going to take everything he’s got if he fiddles around and keeps doing the same thing, especially if he builds a little tighter but doesn’t change other things.”
New Features
“It’s been our goal to make an improvement every year, and this is our biggest improvement ever,” said Jerry Wade. “It starts out with drawing. We’ve had to do some redesign on every one of our 16 sets of plans. And from this, we’ve learned that there aren’t too many who really know how to draw a correct set of plans.” The list of Artistic’s new features is lengthy. It starts with advanced framing: 2x6s at 24-inch centers, with cavities blown full of fiberglass insulation. Advanced low-e vinyl windows cut down the heating and cooling loads. Construction gets tested to make sure all the tightness features were properly installed. Space heating is provided by water heaters. All ductwork, carefully sealed, is hooked up to an air-to-air heat exchanger that does triple duty: it circulates fresh air, heated air and cooled air. “It takes a lot more precision—you have to do everything right,” said Wade. “With all that, it costs us between $2,500 and $3,000 per house. The biggest cost is having to switch from swamp coolers to refrigerated air. But now, after some experience building this new way, some costs are coming down.” By early 2002, the extra costs had been trimmed to $1,500 per house. Yet even with those extra costs, Max Wade shrugs when he says, “We can’t build them fast enough.”
Discussion
5.6 What’s Next

122 123
Wade’s Bottom Line “We’re tickled to death about this program,” said Jerry Wade. “We’re getting great support. Now I’m building the best house I know how to build. Our buyers are moving into $80,000 houses that are more comfortable and have cleaner air than the $400,000 home I live in today. This is benefiting consumers. I feel good about that.” “Our sales are way up this year over last. I’d be in a world of hurt if my three sons Tom, Roy and Max weren’t out there getting the new changes in place that make all these innovations possible.” Confirmation Is Wade way out on a limb here? Not according to Jim Folkman, executive director of the Central New Mexico HBA. “We started our green building program about three years ago,” said Folkman. “We borrowed the best ideas we could from existing programs like Austin’s and yours up in Denver. Last year, we came to realize we were risking a little green-washing. We decided we needed to add more substance.” “What Jerry’s doing is a remarkable story. This is a very rigorous new approach. We require that every house is tested, then certified. Jerry is even guaranteeing utility bills. He has a lot at risk.”
“A lot of people are starting to understand that this is a huge paradigm shift,” Folkman explained. “The systemic whole here is greater than the sum of its parts. All parts have to work together. You have to do certain prescriptive things, but it’s primarily a performance-driven program.” The transition from CNMHBA’s past program to adoption of the current program hasn’t been easy. Folkman acknowledges a rift in the membership between production and custom builders. “Some say the new program is unfair and too expensive. A number of custom builders say ‘Jerry just has to figure out the new details for his plans one time, but once he figures it out he can do it repeatedly. We have to figure it out every time from scratch.’ These builders understand the criteria, but realize that knowing the standard and implementing the details is another thing. It remains to be seen how fast this will move forward with other builder members.” Folkman acknowledges that while the HBA developed the criteria, the entire program has relied heavily on the training provided to builders and consumers by the Building America consultants. He estimates the related costs in the neighborhood of $100,000. Wade hopes their training budgets don’t get cut until Albuquerque builders and trade contractors are better trained and more consumers are informed about the new program’s benefits.
Discussion
5.6 What’s Next

122 123
Central Data Archive
One of the values of this study is that it has produced a data set characterizing components and performance results of homes built in Fort Collins in the mid- to late-1990s. This data set could become the starting point for a centralized database, allowing contributions and access by others interested in homes built along Colorado’s Front Range or further afield. This could prove very useful for purposes such as benchmarking, evaluation and diagnosis.
Existing Homes
Education strategies suggested above will raise the awareness of those who live in existing homes, too. As noted above, many of the problems discussed in this report are difficult and expensive to fix in a completed home. The following ideas might be considered as steps to address this dilemma:
• Demonstration projects. A group of homes could be selected as places to experiment with diagnosis and repair techniques, with a goal of developing standardized approaches to common problems in existing homes. Examples include air sealing fireplace and entertainment center cavities, improving insulation performance in floors over garages, duct improvements to reduce basement depressurization while increasing flow and comfort, and fixing flaws in crawl space insulation. Measurements could be taken before and after the repair to help evaluate the results.
• Training. Training could be provided to build expertise in whole-house diagnosis and repair techniques (many of the same skills needed for better-performing new homes).
• Loans. The City’s zero-interest loan program (ZILCH) could be expanded to cover a menu of typical fixes for existing homes, even if these fixes were not cost-effective from an energy savings standpoint.
5.6.5 Further Research
Inevitably, a study like this raises other questions and suggests ways to refine the study design. Areas that might be explored in more detail in the future include comfort, indoor air quality, basement heat loss, and basement structural subfloor issues. Parallels to this evaluation of single-family housing could also be conducted on homes built to higher standards, multi-family housing or non-residential buildings regulated under a different section of the energy code.
Discussion
5.6 What’s Next

124 125
Discussion

124 125
Glossary
The following terms are defined in the context of how they are used in this report.
• ACH50. Air changes per hour at 50 Pascals, a measure that quantifies whole-house air leakage test results. ACH50 is the number of times in one hour that the entire volume of air in a house is replaced by outdoor air, when a 50 Pascal pressure difference is maintained between inside and outside.
• AFUE. Annual Fuel Utilization Efficiency, a number expressing the seasonal efficiency of a heating appliance. AFUE is calculated using a specific test protocol defined by the U.S. Department of Energy. AFUE ratings for modern gas-fired heating equipment range between 78% and 95%.
• Air barrier. A barrier in the thermal envelope of a home that stops uncontrolled air movement between indoors and outdoors. The air barrier typically consists of building components such as wallboard, concrete and windows, supplemented with sealing materials such as caulk and spray foam.
• Air handler. The component in a forced air heating/cooling system that contains the blower. The air handler circulates house air through heat exchangers and/or cooling coils to condition the air delivered to the house. In most new Fort Collins homes, the furnace serves as the air handler.
• Backdrafting. A condition in which the flow of air in a combustion vent reverses, causing combustion products to be exhausted into the living space rather than outdoors.
• Baseload energy use. Uses of gas or electricity for needs other than space heating or cooling.
• Blower door. A portable testing device used to measure house air leakage and locate leakage areas. A blower door consists of an adjustable speed fan, a frame and panel, a calibrated orifice and pressure gauges. It is temporarily installed in an exterior doorway to induce a pressure difference between the inside of the house and outdoors.
• Btu. British thermal unit, a quantity of energy equal to the amount of heat required to raise the temperature of one pound of water by one degree Fahrenheit.
• Btuh. A commonly used abbreviation representing “Btus per hour,” a unit often used to quantify heating and cooling loads and equipment capacity. (A more precise abbreviation is Btu/h).
• Capacity. The power delivered to a piece of mechanical equipment (“input capacity”) or delivered by the equipment (“output capacity”). For example, the output capacity of a furnace is a measure of the rate at which the furnace delivers heat. Units of capacity used in this report are thousands of Btus per hour (kBtuh) and tons of air conditioning.
• CFM. Cubic feet per minute, a measure of air flow rate.
• CFM25. Cubic feet per minute at 25 Pascals, a measure that quantifies duct leakage test results. This is the rate at which air leaks out of a duct system that is pressurized to 25 Pascals with respect to its surroundings and in which all intentional openings have been sealed.
• Cold crawl space. A crawl space design approach in which the insulation boundary and air barrier are located at the floor above the crawl space and at any other components that separate the crawl space from conditioned living space (such as a dividing wall between basement and crawl space).
Glossary

126 127
• Cooling Load. See “Load.”
• Design load. The rate at which a house requires heating and cooling under almost worst-case (cold or hot) conditions for the climate in which the house is located.
• Draft pressure. The pressure difference between a combustion vent and the zone in which the combustion appliance is located. This pressure difference draws combustion products into the vent.
• Efficiency. A ratio of the useful power available at the output of a device to the power that is delivered to the input of the device. For most devices, efficiency is measured as a percentage between zero and 100%. (For air conditioners, the analogous measure is “Coefficient of Performance.”)
• Electrical demand. The maximum rate at which power is used. Electrical demand determines the size of the electrical generation and distribution equipment required to deliver electricity to an appliance, a house or a city.
• Energy. A quantity of heat or work. The units of energy used in this report are Btu, kWh and therm.
• Energy Factor. A number between zero and one that expresses the seasonal efficiency of a water heater. The Energy Factor (EF) is calculated using a specific test protocol defined by the U.S. Department of Energy. Energy Factor ratings for modern gas-fired water heaters range from about 0.50 to 0.95 (50% to 95%).
• External static pressure. The pressure difference between the outlet and inlet of the air handler when the blower operates. ESP is a result of the friction developed as air moves through ductwork, filters and heating and cooling coils. The higher the ESP, the lower the air flow rate.
• Heat rise. The steady-state temperature increase between the inlet and outlet of an operating furnace. The heat rise reflects the capacity of the furnace, the combustion efficiency of the furnace, and the rate of air flow through the furnace.
• Heated crawl space. A crawl space design approach in which the insulation boundary and air barrier are located at the perimeter of the crawl space, with no venting, and either (1) there is no thermal separation from an adjoining basement or (2) conditioning is explicitly delivered to the crawl space.
• Heating load. See “Load.”
• Home energy rating. A representation of home energy efficiency designed to help consumers easily compare energy performance between different homes. Home energy ratings are based on house design, energy specifications, limited performance testing results and standardized assumptions about how the house is operated. The result is usually expressed as a score between zero and 100 and/or a multiple “star” rating. Home energy ratings are offered in Colorado by the City of Fort Collins (ENERGY SCORE) and E-Star Colorado.
• Hybrid crawl space. A crawl space design approach in which the insulation boundary is located at the perimeter of the crawl space, yet the crawl space is intentionally vented to the outdoors.
• Internal gain. Heat added to a house by people and appliances. Internal gains reduce space heating needs and increase space cooling requirements.
• KBtuh. One thousand Btuh.
Glossary

126 127
• Kneewall. A frame wall separating living space from attic space. Knee walls are typically short walls associated with changes in ceiling height.
• kW. Kilowatt, a unit of power commonly used to measure electrical power. One kW is equal to 1,000 Watts or 3,413 Btuh.
• kWh. Kilowatt-hour, a unit of energy commonly used to express electrical energy use. One kWh is equal to 3,413 Btu.
• Load. The rate at which a house—or portion of a house—requires heating or cooling under specified indoor and outdoor conditions. For example, a house might require 55 kBtuh to maintain a temperature of 68 degrees Fahrenheit when the outdoor temperature is 10 degrees and the sun is not shining.
• Low-e coating. A microscopically thin, low emissivity coating applied to glass that reduces the ability of the glass to transfer heat by thermal radiation. A low-e coating is one way to increase the R-value of windows. Most low-e coatings also reduce solar gain through windows.
• Pascal. A metric unit of pressure commonly used to measure pressure differences in house systems. One inch of water column equals about 250 Pascals.
• Power. The rate at which energy is used. Units of power used in this report are Btuh, kW, horsepower and tons of air conditioning.
• Prescriptive compliance path. A method to comply with the energy code in which requirements for individual components are specifically defined. For example, ceilings with attics must be insulated to R-38. This path offers users few choices.
• R-value. A measure of resistance to heat transfer by a material or assembly of given specifications. R-value is the reciprocal of U-value. R-values are expressed in units of hr*sf*F/Btu.
• Return air. Air that circulates from the house back to the air handler.
• Rim joist. The outermost joist around the perimeter of the floor framing.
• SEER. Seasonal Energy Efficiency Factor, a number expressing the seasonal efficiency of an air conditioner. SEER is calculated using a specific test protocol defined by the U.S. Department of Energy. SEER is computed as the ratio of the equipment’s cooling capacity, in Btuh, and its input power, in Watts. SEER ratings for modern air conditioners range from about 10.0 to 16.0.
• Solar gain. Heat from the sun absorbed by a house.
• Solar Heat Gain Coefficient. The fraction of solar radiation incident on a window that passes through the window into the house. SHGC is expressed as a number between zero and one. The lower a window’s SHGC, the less solar heat it allows into the house.
• Supply air. Air that has been heated or cooled and delivered to the home by the air handler.
• Systems analysis compliance path. A method to comply with the energy code in which few requirements for individual components are specifically defined. Instead, compliance is achieved by demonstrating that the house as a whole will have energy requirements that are no greater than a comparable house built under the prescriptive compliance path. Computer-based energy modeling is used to project energy use. This path offers users many choices.
• Therm. A measure of energy equal to 100,000 Btu, commonly used to express gas energy use.
Glossary

128 129
Glossary
• Thermal bypass. Places in which air can flow through or around insulation, reducing its effectiveness.
• Thermal envelope. The shell of the home that separates indoors from outdoors.
• Ton of air conditioning. A unit used to quantify the output capacity of cooling equipment. One ton equals 12,000 Btuh. (12,000 Btu is the amount of energy required to melt one ton of ice.)
• U-value. A measure of the capability to transfer heat by a material or assembly of given specifications. U-value is the reciprocal of R-value. U-values are expressed in units of Btu/hr*sf*F.
• Wall assembly. A term used in the energy code to denote the composite assembly of exterior walls, windows and doors.
• Warm crawl space. A crawl space design approach in which the insulation boundary and air barrier are located at the perimeter of the crawl space, with no venting. Warm crawl spaces are not intentionally conditioned and there is some thermal separation between the crawl space and adjoining conditioned spaces.
• Watt. A measure of power commonly used to express electrical power. One watt equals 3.41 Btuh.
• Zone. A portion of a house in which temperature is controlled with a single thermostat.