Embed Size (px)
Citation preview

U.S. GEOLOGICAL SURVEY Open-File Report 96-66IA
EVALUATION OF NONPOINT-SOURCE CONTAMINATION, WISCONSIN: FOR WATER YEAR 1995
Prepared in cooperation with the WISCONSIN DEPARTMENTOFNATURAL RESOURCES


EVALUATION OF NONPOINT-SOURCE CONTAMINATION, WISCONSIN: SELECTED TOPICS FOR WATER YEAR 1995
By D.W. Owens, S.R. Corsi, and K.F. Rappold
U.S. GEOLOGICAL SURVEY Open-File Report 96-661A
Prepared in cooperation with theWISCONSIN DEPARTMENT OF NATURAL RESOURCES
Madison, Wisconsin 1997

U.S. DEPARTMENT OF THE INTERIOR
BRUCE BABBITT, Secretary
U.S. GEOLOGICAL SURVEY Gordon P. Eaton, Director
For additional information write to:
District Chief U.S. Geological Survey 6417 Normandy Lane Madison, Wl 53719
Copies of this report can be purchased from:
U.S. Geological Survey Branch of Information Services Box 25286 Denver, CO 80225-0286

CONTENTS
Abstract......................................................................................................................................................^ 1Introduction...............................................................................................^ 1Evaluation of nonpoint-source contamination....................................................................................................................... 2
Land-use and best management practices inventory................................................................................................... 3Activities in water year 1995............................................................................................................................. 3Activities planned for water year 1996.............................................................................................................. 4
Selected streamwater-quality data............................................................................................................................... 4Availability of water-quality data...................................................................................................................... 4Summary of loads at rural sites ......................................................................................................................... 7Monitoring activities planned for water year 1996............................................................................................ 8
Quality assurance and quality control.......................................................................................................................... 8Blank samples for inorganic constituents at rural sites ..................................................................................... 8Polycyclic aromatic hydrocarbon sampling at urban sites ................................................................................ 9
Peristaltic pump system........................................................................................................................... 9Waiting period.......................................................................................................................................... 9Filtration.................................................................................................................................................. 12
Summary and conclusions..................................................................................................................................................... 14References cited................................................................................................................................................^ 14Appendix 1. Storm-load data for rural watershed-management evaluation monitoring sites, Wisconsin,
water years 1985-93................................................................................................................................. 18Appendix 2. Storm-load data for urban watershed-management evaluation monitoring sites, Wisconsin,
water years 1991-94................................................................................................................................. 30Appendix 2.1.Uncertainty in urban storm-load data............................................................................................................. 39
FIGURES
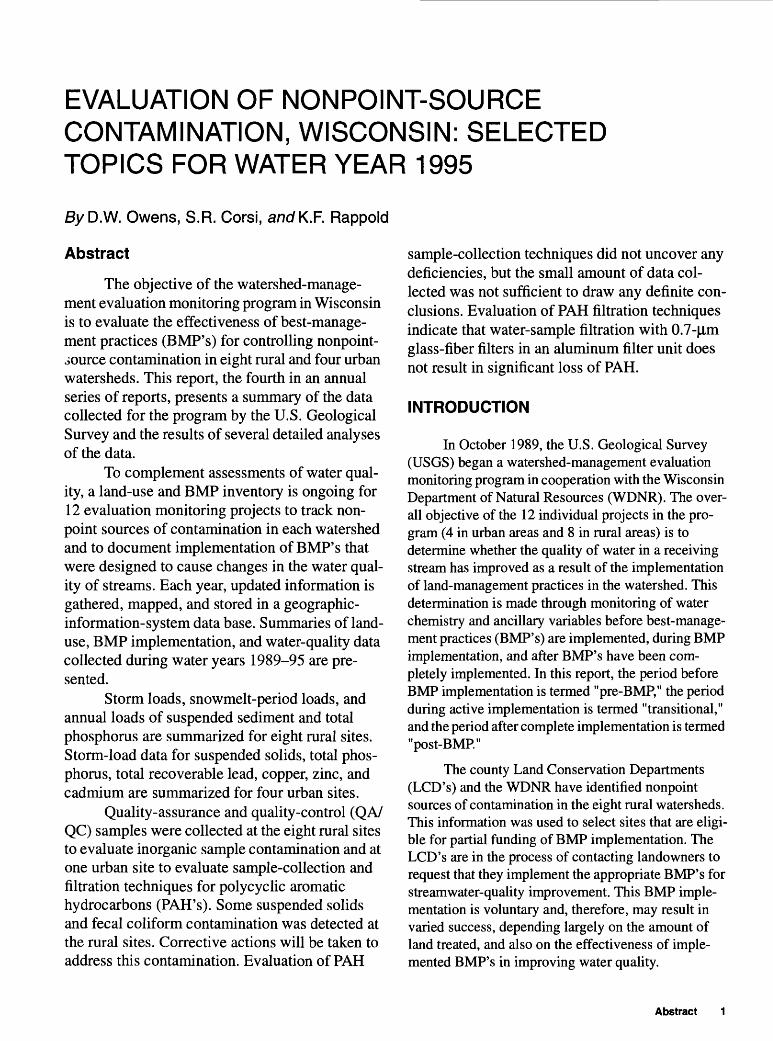
1. Map showing locations of rural and urban sites in the Wisconsin watershed-management evaluationmonitoring program, water year 1995.................................................................................................................... 2
2-5. Graphs showing:2. Number of storms through water year 1995 for which loads were calculated at the Wisconsin evaluation
monitoring sites before implementation of best-management practices (BMP's) and during transitional periods ................................................................................................................................................. 7
3. Comparison of grab samples and peristaltic-pump samples for poly cyclic aromatic hydrocarboncompounds detected in each of three sets of urban stormwater samples, Madison, Wisconsin............................. 13
4. Comparison of average concentrations for capped samples and samples left open for 24 hours forpolycyclic aromatic hydrocarbon compounds detected in urban stormwater samples, Madison, Wisconsin........ 14
5. Comparison of polycyclic aromatic hydrocarbon samples filtered one time and two times...................................... 15
TABLES
1. Characteristics of sites in the Wisconsin evaluation monitoring program................................................................ 32. Summary of eligible, contracted, and implemented rural best-management practices in nonpoint-source
evaluation monitoring watersheds, Wisconsin .................................................................................................. 53. Milestone dates for project selection, watershed assessment, plan approval, signup period, end of
BMP funding, pre-BMP period, transitional period, and post-BMP period for nonpoint-source evaluation monitoring watersheds, Wisconsin.................................................................................................................... 6
4. Summary of annual and snowmelt-period suspended-sediment or suspended-solids loads,total-phosphorus loads, and streamflow at Wisconsin rural evaluation monitoring sites, water years1985-86 and 1990-94........................................................................................................................................ 10
5. Number of splitter-blank and field-blank samples with concentrations greater than the limit ofquantification and number of splitter-blank and field samples collected, Wisconsin evaluationmonitoring program, water years 1994-95........................................................................................................ 12
CONTENTS III

CONVERSION FACTORS AND ABBREVIATED WATER-QUALITY UNITS
Multiply_______________By_____________To Obtain
inch (in.)foot (ft)
acresquare mile (mi2)
million cubic feet (Mft3)pound (Ib)
pounds per square mile (lb/mi2)ton (short)
25.40.30480.40482.5900.02832
453.60.175730.9072
millimetermeterhectaresquare kilometermillion cubic metersgramkilograms per square kilometer (kg/km'megagram (mg)
Abbreviated water-quality units used in this report: Chemical concentrations and water temperature are given in metric units. Chemical concentration is given in milligrams per liter (mg/L) or micrograms per liter (ng/L). Milligrams per liter is a unit expressing the concentration of chemical constituents in solution as weight (milligrams) of solute per unit volume (liter) of water. One thousand micrograms per liter is equivalent to one milligram per liter. For concentrations less than 7,000 mg/L, the numerical value is the same as for concentrations in parts per million. Other units of measurement used in this report are microsiemens per centimeter at 25°Celsius (^S/cm), micrometers (^m), and bacteria colonies per 100 milliliters of water sample (col./lOO mL).
IV CONVERSION FACTORS AND ABBREVIATED WATER-QUALITY UNITS
EVALUATION OF NONPOINT-SOURCE CONTAMINATION, WISCONSIN: SELECTED TOPICS FOR WATER YEAR 1995
By D.W. Owens, S.R. Corsi, anofK.F. Rappold
Abstract
The objective of the watershed-manage ment evaluation monitoring program in Wisconsin is to evaluate the effectiveness of best-manage ment practices (BMP's) for controlling nonpoint- jource contamination in eight rural and four urban watersheds. This report, the fourth in an annual series of reports, presents a summary of the data collected for the program by the U.S. Geological Survey and the results of several detailed analyses of the data.
To complement assessments of water qual ity, a land-use and BMP inventory is ongoing for 12 evaluation monitoring projects to track non- point sources of contamination in each watershed and to document implementation of BMP's that were designed to cause changes in the water qual ity of streams. Each year, updated information is gathered, mapped, and stored in a geographic- information-system data base. Summaries of land- use, BMP implementation, and water-quality data collected during water years 1989-95 are pre sented.
Storm loads, snowmelt-period loads, and annual loads of suspended sediment and total phosphorus are summarized for eight rural sites. Storm-load data for suspended solids, total phos phorus, total recoverable lead, copper, zinc, and cadmium are summarized for four urban sites.
Quality-assurance and quality-control (QA/ QC) samples were collected at the eight rural sites to evaluate inorganic sample contamination and at one urban site to evaluate sample-collection and filtration techniques for polycyclic aromatic hydrocarbons (PAH's). Some suspended solids and fecal coliform contamination was detected at the rural sites. Corrective actions will be taken to address this contamination. Evaluation of PAH
sample-collection techniques did not uncover any deficiencies, but the small amount of data col lected was not sufficient to draw any definite con clusions. Evaluation of PAH filtration techniques indicate that water-sample filtration with 0.7-(im glass-fiber filters in an aluminum filter unit does not result in significant loss of PAH.
INTRODUCTION
In October 1989, the U.S. Geological Survey (USGS) began a watershed-management evaluation monitoring program in cooperation with the Wisconsin Department of Natural Resources (WDNR). The over all objective of the 12 individual projects in the pro gram (4 in urban areas and 8 in rural areas) is to determine whether the quality of water in a receiving stream has improved as a result of the implementation of land-management practices in the watershed. This determination is made through monitoring of water chemistry and ancillary variables before best-manage ment practices (BMP's) are implemented, during BMP implementation, and after BMP's have been com pletely implemented. In this report, the period before BMP implementation is termed "pre-BMP," the period during active implementation is termed "transitional," and the period after complete implementation is termed "post-BMP."
The county Land Conservation Departments (LCD's) and the WDNR have identified nonpoint sources of contamination in the eight rural watersheds. This information was used to select sites that are eligi ble for partial funding of BMP implementation. The LCD's are in the process of contacting landowners to request that they implement the appropriate BMP's for streamwater-quality improvement. This BMP imple mentation is voluntary and, therefore, may result in varied success, depending largely on the amount of land treated, and also on the effectiveness of imple mented BMP's in improving water quality.
Abstract

92°
46° -^
45°
EXPLANATION
T Rural watershed evaluation- monitoring site
V Urban watershed evaluation- monitoring site
0 -fJ
\
^
r^~^
\
i^vr! VI 89°
..................... x T^^LI j >- ̂ 8
1 ......... ,...1 i ^^xI ' - | j Ci : :
i - -5 ii J............L,I 1 ] :; : ; ;
WISC^NSIH 1i " " -]" !""" I........ |
^ 1 ...., \..~
88°
87°
Eagfe Crfeek ^Joosj VaNey Cr« e'K:""7" ~':~T
3 501
100 MILES I
1100 KILOMETERS
! Bow^rCree;k Ii i Vr.i-.
\_._L.......L,..,.JOtter.pNek
Blak Eari Creel..Brew0ry'Cr0ek
43o _
Rattlesnake Creek and Kuenster Creek
D « MOO ,» ,eBase from U.S. Geological Survey National Atlas, 1970
Lincoln Creek and . Menomonee River
Nine Springs Creek tributary storm sewer and Monroe Street detention pond
Figure 1. Locations of rural and urban sites in the Wisconsin watershed-management evaluation monitoring program, water year 1995.
The WDNR and each city have identified non- point sources of contamination for the four urban watersheds. Goals for reduction of nonpoint-source contamination have been set, but specific plans identi fying the types and locations of BMP's needed to achieve these goals have not been defined.
Among the criteria for site selection were likeli hood for extensive BMP implementation, relatively small watershed size (less than 50 mi2), and feasibility of accurate measurement of streamflow in the water shed. An additional stream, a reach of Black Earth Creek, was selected for a detailed analysis of dissolved oxygen. Locations of the sites are shown in figure 1, and a brief summary of site characteristics is given in table 1.
EVALUATION OF NONPOINT-SOURCE CONTAMINATION
This report, the fourth in a series of annual progress reports (Graczyk and others, 1993; Corsi and others, 1994; Walker and others, 1995), is divided into three sections. The following topics are addressed: (1) land-use and best-management-practices inventory, including a discussion of data-collection efforts and the status of BMP implementation, (2) streamwater-qual- ity data, including a discussion of rural annual snow- melt and rainfall loads, and (3) quality assurance and quality control practices, including an analysis of rural blank samples collected to examine for contamination of samples by inorganic constituents and an analysis of sampling and filtration methods for polycyclic aro matic hydrocarbons (PAH's) in urban areas. For sec-
2 EVALUATION OF NONPOINT-SOURCE CONTAMINATION, WISCONSIN: SELECTED TOPICS FOR WATER YEAR 1995

Table 1. Characteristics of sites in the Wisconsin evaluation monitoring program[Data-collection period in water years; mi2, square miles]
Site name
Black Earth Creek atCounty Trunk P
Black Earth Creek atMills Street
Black Earth Creek atSouth Valley Road
Bower Creek
Brewery Creek
Eagle Creek
Garfoot Creek
Joos Valley Creek
Kuenster Creek
Lincoln Creek
Menomonee River
Monroe Street detentionpond inlet
Nine Springs Creektributary storm sewer
Otter Creek
Rattlesnake Creek
U.S. Geological Survey station
number
05406460
05406476
05406497
04085119
05406470
05378185
05406491
05378183
054134435
040869415
04087120
430309089260701
05429268
040857005
05413449
Data collection
period
1985-86;1990-95
1985-86;1990-95
1985-86;1990-95
1991-95
1985-86;1990-95
1990-95
1985-86;1990-95
1990-95
1993-95
1993-95
1991-95
1991-95
1991-95
1991-95
1992-95
Surface-water divide
contributing drainage area
(mi2)
12.8
22.7
37.8
14.8
7.7
14.3
5.39
5.89
9.59
9.56
123
.372
.18
9.5
42.4
Site type
Rural
Rural
Rural
Rural
Rural
Rural
Rural
Rural
Rural
Urban
Urban
Urban
Urban
Rural
Rural
Data collected
Dissolved oxygen andwater temperature
Dissolved oxygen andwater temperature
Dissolved oxygen andwater temperature
Water chemistry 1
Water chemistry2
Water chemistry 1
Water chemistry2 anddissolved oxygen
Water chemistry 1
Water chemistry 1 anddissolved oxygen
Water chemistry 1
Water chemistry 1
Water chemistry 1
Water chemistry 1
Water chemistry 1 anddissolved oxygen
Water chemistry 1 anddissolved oxygen
'Samples analyzed for suspended solids, total phosphorus, and ammonia nitrogen. 2Samples analyzed for suspended sediment, total phosphorus, and ammonia nitrogen.
tions describing ongoing data-collection efforts, data collected during water year 1995 are summarized and, if appropriate, implications for future data-collection efforts are discussed. (A water year is the period begin ning October 1 and ending September 30; the water year is designated by the calendar year in which it ends.) Storm-load data summarized in appendixes 1 and 2 include data collected through water year 1994 for rural sites and water year 1995 for urban sites.
Land-Use and Best-Management- Practices Inventory
The land-use inventory program began in 1992 to provide information on the effects of land-use and
land-treatment changes on water quality. A brief description of the program is given in Corsi and others (1994), and a comprehensive summary of the program is given in Wierl and others (1996). This section sum marizes activities for water year 1995 and planned activities for water year 1996.
Activities in Water Year 1995
The land-use-inventory program has been track ing BMP implementation and changes in land use and land cover with a geographic information system (GIS) since 1992. A detailed description of the program is given in Wierl and others (1996). The GIS data base developed by the USGS in cooperation with the
EVALUATION OF NONPOINT-SOURCE CONTAMINATION

WDNR is managed with ARC/INFO 1 software. GIS data layers were produced from l:24,000-scale topo graphic maps and aerial photographs at an approximate scale of 1:600. These GIS layers include surface water drainage-basin boundaries, hydrography, hydrologic units, elevation, roads, stream and rain gages, BMP's, forests, and field boundaries. The GIS database has been used to (1) track the implementation of BMP's;(2) display annual land cover or changes in land use;(3) depict the areas that are critical nonpoint sources of contaminants; (4) provide inputs for water-quality models; and (5) perform various queries and analyses.
A water-quality model (WINHUSLE2) has been used to estimate the quantity of sediment and phospho rus reaching Otter Creek from each field. Inputs for the model were imported from three GIS layers: field boundaries, elevation, and hydrologic units. The model results will be used to assess the need for specific BMP's within the Otter Creek watershed.
Updates on contracted or implemented BMP's were obtained from the local LCD's and from the WDNR, Water Resources Bureau. This information was entered into the GIS layer for BMP's. Ephemeral gullies were inventoried in spring 1995. The length, vertical depth, average width and the length of time it took for the gully to develop were used to estimate the sediment loading from a particular gully. Field inven tories were conducted in summer and fall 1995 to iden tify the agricultural crops that were grown. This crop information was entered into the GIS layer for field boundaries.
Nonpoint sources of contamination have been identified and quantified for most of the monitored watersheds. These sources include runoff from barn yards and erosion from streambanks, uplands and gul lies. Nonpoint-contaminant-source data were obtained from the priority watershed plans, local LCD's, pollut ant loadings estimated from water-quality models, and completed watershed inventories (for example, gully and streambank erosion inventories).
Eligible, contracted, and installed BMP's for the evaluation monitoring watersheds are summarized in table 2. The GIS layers for BMP implementation are updated twice a year if BMP's are either contracted or
^se of trade names in the report is for identification pur poses only and does not constitute endorsement by the U.S. Geo logical Survey.
2WINHUSLE is an empirical water-quality model that esti mates the sediment yield from each field to the receiving water, and the in-stream sediment deposition rate (Wisconsin Department of Natural Resources, 1994).
implemented. Two of the rural evaluation monitoring watersheds will complete their BMP funding periods for implementing BMP's by the end of 1997 (table 3), four of the rural watersheds will complete their BMP funding periods by the end of 1999, and the remaining two rural watersheds will complete their BMP funding periods by the end of 2000.
Activities Planned for Water Year 1996
The following land-use and BMP monitoring activities are planned for water year 1996:
1. Update all pertinent land-use data in the GIS data base. The data base will provide the information necessary to create GIS maps.
2. Publish a USGS Open-File report thatincludes descriptions of the evaluation moni toring watersheds.
3. Complete an inventory of agricultural crops being grown in each watershed.
4. Complete an inventory of BMP's imple mented in each watershed.
5. Complete an inventory of ephemeral gully erosion in each watershed.
6. Complete water-quality model runs for some of the remaining monitored watersheds.
Selected Streamwater-Quality Data
Streamwater-quality data are summarized in two parts. The first part discusses the availability of water- quality data, including loads for stormflow periods. The second part discusses specific data compiled at rural sites, and includes (1) a graph of the number of storms and estimated constituent loads, (2) annual con stituent loads for the specific period of record at each site, and (3) a breakdown of annual rural loads into snowmelt and stormflow sources of runoff.
Availability of Water-Quality Data
Precipitation, streamflow volume, and storm loads for several water-quality constituents have been computed for all monitored storm periods and summa rized for rural sites (appendix 1) and urban sites (appendix 2). The rural data are summarized through water year 1994. Data collection was suspended in
4 EVALUATION OF NONPOINT-SOURCE CONTAMINATION, WISCONSIN: SELECTED TOPICS FOR WATER YEAR 1995

Tabl
e 2.
Sum
mar
y of
elig
ible
, co
ntra
cted
, an
d im
plem
ente
d ru
ral b
est-
man
agem
ent
prac
tices
in n
onpo
int-s
ourc
e ev
alua
tion
mon
itorin
g w
ater
shed
s, W
isco
nsin
[ft,
feet
; BM
P's,
bes
t-m
anag
emen
t pra
ctic
es; t
able
con
tain
s re
visi
ons
to a
BM
P ta
ble
prev
ious
ly p
ublis
hed
in W
alke
r an
d ot
hers
, 19
95, w
hich
are
the
resu
lt of
cha
nges
in p
ract
ices
elig
ible
, co
ntra
cted
, or i
mpl
emen
ted]
Eva
luat
ion
mon
itori
ng w
ater
shed
Prac
tice
Elig
ible
man
ure
stor
age
Con
trac
ted
man
ure
stor
age
Impl
emen
ted
man
ure
stor
age
Elig
ible
bar
nyar
d-co
ntro
l sys
tem
sC
ontr
acte
d ba
rnya
rd-c
ontr
ol s
yste
ms
Impl
emen
ted
barn
yard
-con
trol
sys
tem
s
Elig
ible
str
eam
bank
pro
tect
ion4
Con
trac
ted
stre
amba
nk p
rote
ctio
n4Im
plem
ente
d st
ream
bank
pro
tect
ion4
Con
trac
ted
fenc
ing
Impl
emen
ted
fenc
ing
Con
trac
ted
stre
am c
ross
ing
Impl
emen
ted
stre
am c
ross
ing
Con
trac
ted
grad
e st
abili
zatio
nIm
plem
ente
d gr
ade
stab
iliza
tion
Elig
ible
nut
rien
t man
agem
ent
Con
trac
ted
nutr
ient
man
agem
ent
Impl
emen
ted
nutr
ient
man
agem
ent
Elig
ible
upl
and
BM
P's5
Con
trac
ted
upla
nd B
MP'
sIm
plem
ente
d up
land
BM
P's
Bre
wer
y C
reek
0 0 0 16 II3 9
5 ba
rns
no l
onge
rha
ve li
vest
ock
22,0
00 ft
22,0
00ft
19,1
00ft
1,20
0ft
Site
no
long
er w
ithliv
esto
ck1 1 2
Site
s no
long
er w
ithliv
esto
ck
2,44
0 ac
res '
903
acre
s77
5 ac
res
5, 1
70 a
cres
11,
143
acre
s1,
143
acre
s
_ .
. _
, E
agle
Cre
ek a
nd
Gar
foot
Cre
ek
,
,»
, Jo
os V
alle
y C
reek
0 0 0 7 6 6
16,8
00 ft
16,8
00 ft
16,7
00 ft
5,47
5 ft
5,47
5 ft 4 4 0 0
592
acre
s15
6 ac
res
156
acre
s1,
520
acre
s122
1 ac
res
221
acre
s
Ani
mal
-was
te m
anag
emen
t7 3 1
162 9 1
Stre
amba
nk p
rote
ctio
n28
,100
ft8,
273
ft32
3ft
25,1
65 f
t3,
127
ft 11 1 8 5
Upl
and
man
agem
ent
990
acre
s55
4 ac
res 0
2,14
0 ac
res1
7 0
Bow
er C
reek
5 5 317
oth
ers
from
pre
vi
ous
farm
pro
gram
s26 10 5
2,32
0 ft 0 0
625f
t62
5ft 1 1 0 0
4,02
0 ac
res
1,08
0 ac
res
387
acre
s4,
480
acre
s99
acr
es77
acr
es
Otte
r C
reek
2 2 2 8 8 7
7,00
0ft
Oft
Oft
9,20
0ft
9,20
0ft 3 3 3 3
1,13
0 ac
res
1,28
2 ac
res
1,1 5
2 ac
res
851
acre
s2
acre
s1
acre
Rat
tlesn
ake
Cre
ek a
nd
Kue
nste
r C
reek
601 2 1
103
1 1 (
not i
nclu
ding
3 p
rac
tices
no
long
er c
ontr
acte
d)6
255,
000
ft1
1,73
0 ft
1,60
5 ft 0 0 2 2 0 0
2,98
0 ac
res1
274
acre
s127
4 ac
res1
17,4
00 a
cres
170
1 ac
res
49 a
cres
*An
estim
ate
deri
ved
from
the
nonp
oint
sou
rce
cont
rol p
lan.
2Doe
s in
clud
e on
e el
igib
le y
ard
that
was
sol
d.3T
otal
incl
udes
a b
arny
ard-
cont
rol
syst
em to
be
inst
alle
d by
a la
ndow
ner w
ithou
t cos
t-sh
are
fund
ing.
^he c
ontr
acts
for
leng
th o
f str
eam
bank
pro
tect
ion
refl
ects
the
tota
l len
gth
of e
ach
prac
tice.
One
ero
ded
site
can
incl
ude
seve
ral p
ract
ices
suc
h as
rip
rap,
sho
relin
e an
d st
ream
bank
sta
biliz
atio
n,
and
shor
elin
e bu
ffer
s. B
oth
bank
s m
ay h
ave
been
ero
ded,
con
trac
ted,
or
impl
emen
ted
with
BM
P's.
Incl
udes
an
indi
vidu
al p
ract
ice
or s
erie
s of
pra
ctic
es, o
ther
than
nut
rien
t man
agem
ent,
that
res
ult i
n a
redu
ced
pollu
tant
sou
rce,
suc
h as
con
tour
farm
ing,
con
tour
str
ip c
ropp
ing,
fie
ld s
trip
cr
oppi
ng, g
rass
ed w
ater
way
s, a
nd r
educ
ed ti
llage
.

EVALUATION
OF
NONPOINT-SOt
3)
0
m O 0
I S Z O z w o I z m m 3 m o o O w n
O 3) m 3) m 3) s Cl
Tabl
e 3.
Mile
ston
e da
tes
for p
roje
ct s
elec
tion,
wat
ersh
ed a
sses
smen
t, pl
an a
ppro
val,
sign
up p
erio
d, e
nd o
f BM
P fu
ndin
g, p
re-B
MP
perio
d, tr
ansi
tiona
l per
iod,
and
pos
t- BM
P pe
riod
for n
onpo
int-s
ourc
e ev
alua
tion
mon
itorin
g w
ater
shed
s, W
isco
nsin
[BM
P, b
est-
man
agem
ent p
ract
ice;
WD
NR
, Wis
cons
in D
epar
tmen
t of N
atur
al R
esou
rces
; LC
D, L
and
Con
serv
atio
n D
epar
tmen
t]
Eva
luat
ion
mon
itori
ng w
ater
shed
s
Mile
ston
e
Proj
ect s
elec
ted
1
Wat
ersh
edas
sess
men
t1
Plan
app
rove
d1
Sign
up p
erio
d2
End
of B
MP
fund
ing2
Pre-
BM
P pe
riod3
Tran
sitio
nal p
erio
d
Post
-BM
P pe
riod
3
Bre
wer
y C
reek
1985
1986
-87
1989
Mar
ch 1
989-
Febr
uary
199
4
Febr
uary
199
7
Prio
r to
Oct
ober
198
9
Nov
embe
r 19
89-
1997
Aft
er 1
997
Gar
foot
Cre
ek
1985
1986
-87
1989
Mar
ch 1
989-
Febr
uary
199
4
Febr
uary
199
7
Prio
r to
Sept
embe
r 19
89
Oct
ober
198
9-19
95
Aft
er 1
995
Eagl
e C
reek
1985
1987
-88
1990
Mar
ch 1
990-
Dec
embe
r 200
0
Dec
embe
r 200
0
Prio
r to
Sept
embe
r 19
93
Oct
ober
199
3-20
00
Aft
er 2
000
Joos
Val
ley
Cre
ek
1985
1987
-88
1990
Mar
ch 1
990-
Dec
embe
r200
0
Dec
embe
r 200
0
Prio
r to
Sept
embe
r 19
92
Oct
ober
199
2-20
00
Aft
er 2
000
Bow
er C
reek
1986
1988
-90
1991
Sept
embe
r 19
91-
Dec
embe
r 19
96
Dec
embe
r 19
99
Prio
r to
Nov
embe
r 19
92
Dec
embe
r 19
92-
1999
Aft
er 1
999
Otte
r Cre
ek
1985
1987
-88
1991
June
, 19
91-
May
199
7
Dec
embe
r 19
99
Prio
r to
Sept
embe
r 19
93
Oct
ober
199
3-19
96
Aft
er 1
996
Rat
tlesn
ake
Cre
ek
1986
1989
-90
1991
Oct
ober
199
1-O
ctob
er 1
997
Oct
ober
199
9
Prio
r to
May
199
3
June
199
3-19
96
Aft
er 1
996
Kue
nste
r C
reek
1986
1989
-90
1991
Oct
ober
199
1 -
Oct
ober
199
7
Oct
ober
199
9
Prio
r to
June
199
4
July
199
4-19
98
Aft
er 1
998
!A11
yea
rs li
sted
cor
resp
ond
with
Pri
ority
Wat
ersh
ed p
lans
.2A
11 y
ears
list
ed w
ere
obta
ined
fro
m th
e W
DN
R a
nd th
e lo
cal L
CD
's.3A
11 y
ears
list
ed w
ere
desi
gnat
ed b
y th
e ev
alua
tion
mon
itori
ng te
am w
ith in
form
atio
n ob
tain
ed f
rom
the
WD
NR
and
the
loca
l LC
D's.
The
pos
t-B
MP
and
tran
sitio
nal p
erio
ds m
ay b
e ch
ange
d, i
f all
the
BM
P's
are
impl
emen
ted
prio
r to
the
date
list
ed.

EXPLANATION
Pre-BMP
£2 Transitional
Brewery Garfoot Eagle Joos Valley Bower Otter
EVALUATION-MONITORING SITE
Rattlesnake Kuenster
Figure 2. Number of storms through water year 1995 for which loads were calculated at the Wisconsin evaluation monitoring sites before implementation of best-management practices (BMP's) and during transitional periods.
1994 for three of the urban sites and in 1995 for the remaining urban site pending approved watershed plans. Accordingly, data in appendix 2 are through the end of the appropriate data-collection period. Daily loads for selected constituents and discrete concentra tion data for the samples used to calculate these loads are published in the USGS annual water-data reports for Wisconsin (Holmstrom and others, 1986-87; Holmstrom and Erickson, 1989; Holmstrom and oth ers, 1990-95). Maximum, minimum, and mean dis- solved-oxygen concentrations and water temperatures also are published in these annual reports. Data for water year 1995 are published in the annual report for 1995. Constituent loads for stormflow periods for water year 1995 are to be published in the 1996 annual progress report on the evaluation monitoring program. Data are available by request from the USGS office in Madison, Wis.
Summary of Loads at Rural Sites
Water-quality monitoring at the eight rural eval uation monitoring sites (fig. 1) continued in water year 1995 with sampling during base-flow and stormflow
periods. Instantaneous water-quality data were used in conjunction with continuous streamflow data to esti mate total constituent loads for stormflow periods. Sus pended-sediment or suspended-solids, total- phosphorus, and ammonia-nitrogen loads were com puted at the eight rural evaluation monitoring sites. For Brewery and Garfoot Creeks, suspended-sediment loads were computed to be consistent with pre-BMP data collected in a previous study; for all other sites, suspended-solids loads were computed. Ammonia- nitrogen loads were not computed for sites on Otter and Bower Creeks. The rural storm-load data will be used to evaluate the effect of BMP's on streamwater quality. Previous research using the rural regression analysis (Walker and Graczyk, 1993; Walker, 1994) has shown theoretically that the minimum detectable change at rural sites becomes distinguishable at roughly 40 total storms; this corresponds to 20 pre-BMP and 20 post- BMP storms for a balanced data collection. The num ber of pre-BMP and post-BMP storms for which loads were calculated at rural evaluation monitoring sites is shown in figure 2. Loads for a sufficient number of storms are probably available for the pre-BMP imple mentation period at five of the sites; at the other three
EVALUATION OF NONPOINT-SOURCE CONTAMINATION

sites, BMP implementation has begun, so collection of additional pre-BMP data is not possible.
Annual loads of suspended sediment or sus pended solids and total phosphorus were determined at each of the eight rural evaluation monitoring sites (fig. 1) for the entire period of data collection. The annual loads are summarized in table 4.
A significant part of the annual rural load may be transported during snowmelt runoff periods which are frequent in Wisconsin during the winter and early spring. A determination of the percentage of annual load contributed by snowmelt-period runoff will indi cate the importance of snowmelt periods for the rural regression analyses. Snowmelt periods were defined as periods when snow was either falling or already on the ground. Climatological data from the closest station collecting snow and snow-on-ground data were used for the snowmelt-period determination.
For each water year, daily mean loads were summed for snowmelt periods. These load data are summarized in table 4.
Monitoring Activities Planned for Water Year 1996
The following water-quality-monitoring activi ties are planned for water year 1996:
1. Continue collection of rural stormflow sam ples for determination of suspended-solids or suspended-sediment, total-phosphorus and ammonia-nitrogen loads. Data collection may be scaled back at some sites if imple mentation of BMP's in the watersheds has not begun. Intensive data collection can begin again once a sufficient number of BMP's have been implemented.
2. Continue dissolved-oxygen monitoring at the four sites (Kuenster, Rattlesnake and Garfoot Creeks and Black Earth Creek at South Valley Road). Analyze data for the coldwater sites where most of the BMP's have been installed. Available data may be sufficient at the end of water year 1996 to determine whether dissolved-oxygen con centrations have changed as a result of the BMP implementation.
Quality Assurance and Quality Control
In this section, two components of quality-assur ance/quality-control (QA/QC) for evaluation monitor ing sites are summarized and evaluated. First, rural field-blank and splitter-blank samples collected in water years 1994-95 are considered; second, some components of the urban sampling protocol for polycy- clic aromatic hydrocarbons (PAH's) are investigated.
Blank Samples for Inorganic Constituents at Rural Sites
One part of the QA/QC plan for rural evaluation monitoring sites includes regular collection of blank samples from the automatic samplers and the sample splitter. Runoff samples are collected by use of an auto matic refrigerated sampler. Plastic sample tubing con nects the stream to a peristaltic pump, which pumps water into one of twenty-four 1-L plastic bottles that are stored in the refrigerator until retrieved by field per sonnel. The samples are then capped and transported to a field office, where they are split by use of a 10-port, plastic, small-volume sample splitter and sent to the Wisconsin State Laboratory of Hygiene (WSLH) for analysis. Field-blank samples are collected by attach ing one end of a short section of tubing onto the stream end of the plastic sample tubing and placing the other end in a bottle of Milli-Q water. Milli-Q water is then pumped through the automatic sampler into a 1-L plas tic bottle in the refrigerator. The bottle is capped and transported to a field office, where its contents are split and sent to the WSLH for analysis. Splitter-blank sam ples are collected by pouring Milli-Q water through the sample splitter and sending the resulting sample to the WSLH for analysis. A more detailed description of blank- sample collection is given in Graczyk and others (1993).
The field- and splitter-blank samples for rural evaluation monitoring sites were analyzed for bio chemical oxygen demand (BOD), total phosphorus (TP), ammonia nitrogen (NH3-N), suspended solids (SS), and fecal coliform bacteria. Four splitter-blank samples were collected and analyzed for BOD, seven for TP, NH3-N, and SS, and eight for fecal coliform. One sample each of BOD, TP, NH3-N, and SS had con centrations slightly above the limit of quantification (LOQ) (table 5). All fecal coliform concentrations were below the LOQ.
8 EVALUATION OF NONPOINT-SOURCE CONTAMINATION, WISCONSIN: SELECTED TOPICS FOR WATER YEAR 1995

A total of 71 field-blank samples were collected during water years 1994 and 1995. Concentrations were above the LOQ in at least 19 samples for all con stituents. For all constituents except NH3-N concentra tions were measurable in more than 50 percent of the samples (table 5).
There appears to be some source of BOD, TP, NH3-N, and SS contamination in the field blanks. Because concentrations of BOD and TP in the field- blank samples are all relatively low compared to those in most runoff samples collected by the automatic sam plers, contamination by these constituents is not a seri ous concern. Concentrations of SS and fecal coliform in field-blank samples were generally low compared to those in most rural runoff samples. In a few field-blank samples, however, SS and fecal coliform concentra tions were greater than those in some runoff samples. In 14 of 67 field-blank samples, suspended solids con centrations were greater than 20 mg/L; and in 12 of 55 fecal coliform samples concentrations were greater than 500 (col.)/100 mL. Both of these concentrations are considered to be low but not uncommon for rural runoff samples. This contamination is a problem that warrants further investigation and appropriate correc tive action.
The source of BOD, TP, NH3-N, and SS contam ination in the field blanks must lie with the automatic- sampling process or the bottle-handling procedure because splitter blanks have not been contaminated. Contamination is most likely due to residue particulate matter and streamwater in the sample tubing. If this is the case, the problem would probably be solved by cleaning the sample tubing with a tubing brush and rinsing the sample tubing periodically (once every 2 weeks would probably be sufficient). This possibility will be investigated during water year 1996.
Polycyclic Aromatic Hydrocarbon Sampling at Urban Sites
Some components of the current sampling and sample-processing methods for PAH's at the urban watershed-management evaluation monitoring sites were investigated in 1995. Runoff samples are col lected by use of refrigerated automatic peristaltic pump samplers. Teflon-lined 3/8-in. sample tubing connects the stream or storm sewer to a peristaltic pump, which pumps water through approximately 3 ft of polyethyl ene tubing into one of four 10-L open wide-mouth glass bottles stored in the refrigerator. Field personnel
visit the site within 24 hours of the end of each runoff period. Samples are then capped and transported in an iced cooler to the USGS office in Madison at a temper ature of approximately 4°C. The samples are split by use of a Teflon-lined churn splitter and filtered by use of a 0.7-)im glass fiber filter. Three components of this procedure were investigated: (1) the peristaltic pump system, (2) the waiting period from when the samples are pumped into the 10-L glass bottles to when they are retrieved and capped by field personnel, and (3) the fil tration system. The components were tested with urban stormwater runoff from a storm sewer that drains the West Towne Mall parking lot in Madison, Wis.
Peristaltic Pump System
To evaluate the peristaltic pump system, three sets of two samples each were collected. Each set of samples contained a grab sample from the stormwater runoff from the storm sewer and a simultaneous sample collected by placing a bottle directly under the outlet from the peristaltic pump system. Concentrations of PAH's from the peristaltic pump sample were greater than those of the grab samples for the first two sets of samples but were slightly less for the third set of sam ples (fig. 3). Eleven of sixteen PAH's were detected in all samples. The five PAH's not detected were acenaph- thene, acenaphtylene, dibenzo[A,H]anthracene, fluo- rene, and naphthalene. In the first two sets of samples differences between the pump samples and the grab samples are more apparent.
Waiting Period
To evaluate the effect of the waiting period on PAH's for the time the samples are pumped into the 10-L glass bottles to when they are retrieved and capped by field personnel, a grab sample was collected directly from the storm sewer. The Teflon-lined churn splitter was used to split this sample into three amber 1-L glass bottles filled completely (ambient samples 1, 2, and 3) and one clear 10-L glass bottle filled half full. The 1-L bottles were capped and shipped for analysis. The 10-L bottle was left uncovered and refrigerated for 24 hours to simulate a runoff event where samples may be left in the automatic sampler for as long as 24 hours before field personnel retrieve them. The sample was then split into three amber 1-L glass bottles (uncovered sample 1, 2, and 3) that were capped and shipped for analysis. Ten of fifteen PAH's were detected in all sam ples. Non-detected target PAH compounds include
EVALUATION OF NONPOINT-SOURCE CONTAMINATION 9

Tabl
e 4.
Sum
mar
y of
ann
ual a
nd s
now
mel
t-pe
riod
susp
ende
d-se
dim
ent
or s
uspe
nded
-sol
ids
load
s, t
otal
-pho
spho
rus
load
s, a
nd s
trea
mflo
w a
t W
isco
nsin
eva
luat
ion
mon
itorin
g si
tes,
wat
er y
ears
198
5-86
and
199
0-94
[--,
not c
ompu
ted;
Ib,
pou
nd; m
i2, s
quar
e m
iles;
Mft
3, m
illio
n cu
bic
feet
]
Susp
ende
d se
dim
ent o
r sus
pend
ed s
olid
s To
tal p
hosp
horu
s
Wat
er y
ear
1985
4986
1990
1991
1992
1993
1994
2Mea
n
1985
4986
1990
1991
1992
1993
1994
2Mea
n
Ann
ual
load
(to
ns)
894
1219 521 45
.3
180
2,64
0
792
845
462
!441 33
7
290
200
1,16
0
238
448
Snow
mel
t Pe
rcen
t A
nnua
l lo
ad (
tons
) sn
owm
elt
load
(Ib)
198
481 46
.
11.
57.
457
445
203
174
1232 40
.
137
Bre
wer
y C
reek 22 16
5
9 9
9 26
5 32 17 56 -
Gar
foot
Cre
ek - 38 '53
3 12 47
90.0
45
410
134
164
35 56 -
Snow
mel
t lo
ad (I
b)Pe
rcen
t sn
owm
elt
- 054
0647
0 (s
urfa
ce-w
ater
div
ide
cont
ribu
ting
area
7.
4,84
0
4,59
0
3,85
0
700
1,96
0
10,7
00
3,42
0
4,25
0
1,86
0!8
96
1,18
020
0
888
2,99
0
1,78
0
1,48
0
38 156 31 28 45 28 52 -
Tot
al s
trea
mfl
ow
Wat
er y
ear
<Mft3
)
.7 m
i2) 86
.0
!75.
0
36.5
18.4
28.4
135
125 71.6
Snow
mel
t pe
riod
(M
ft3)
28.7
'35.
6
14.0 7.93
13.1
40.3
47.7
25.3
Perc
ent
snow
mel
t
33 U? 38 43 46 30 38 -
0540
6491
(su
rfac
e-w
ater
div
ide
cont
ribu
ting
area
5.3
9 m
i2)
3,06
0
^,45
0
2,85
0
2,10
0
2,23
0
7,08
0
1,72
0
3,17
5
894
4,35
047
4
999
983
2,87
0
1,09
0
1,22
0
29 155 17 47 44 40 63 -
166
456
100
103
127
243
155
130
50.7
!77.
6
30.5
35.7
52.6
87.4
68.2
47.5
31 150 30 35 41 36 44 -
Eag
le C
reek
- 05
3781
85 (
surf
ace-
wat
er d
ivid
e co
ntri
butin
g ar
ea 1
4.3
mi2
)
3 199
0
1991
1992
1993
1994
2Mea
n
34,3
40
6,58
0
3,92
0
7,96
0
5,68
7
6,04
0
- 21.
367
543
2,12
0
762
--
.5 0 9 7 37
39,4
60
11,6
00
8,90
0
17,9
00
11,6
00
12,5
00
-
132
1,06
0
1,35
0
4,48
0
1,76
0
~ 1 12 8 39
384.
5
244
287
425
370
331
- 51.1
93.7
103
104 87.9
- 21 33 24 28

Tabl
e 4,
Sum
mar
y of
ann
ual a
nd s
now
mel
t-per
iod
susp
ende
d-se
dim
ent o
r su
spen
ded-
solid
s lo
ads,
tot
al-p
hosp
horu
s lo
ads,
and
str
eam
flow
at
Wis
cons
in e
valu
atio
n m
onito
ring
site
s, w
ater
yea
rs 1
985-
86 a
nd 1
990-9
4 C
ontin
ued
o o n Z o o
o w o c 3D
O m
o
o I z
o
Susp
ende
d se
dim
ent o
r su
spen
ded
solid
s To
tal p
hosp
horu
s
Wat
er y
ear
Ann
ual
load
(to
ns)
Snow
mel
t P
erce
nt
Ann
ual
load
(to
ns)
snow
mel
t lo
ad (
Ib)
Snow
mel
t lo
ad (
Ib)
Per
cent
sn
owm
elt
Tota
l str
eam
flow
Wat
er y
ear
(Mft3
)
Snow
mel
t pe
riod
(M
ft3)
Per
cent
sn
owm
elt
Joos
Val
ley
Cre
ek -
0537
8183
(su
rfac
e-w
ater
div
ide
cont
ribu
ting
area
5.0
9 m
i2)
3 199
0
1991
1992
1993
1994
2Mea
n
1,15
0
1,47
0
1,39
0
2,90
0
2,10
0
1,97
0
- 30.9
71.9
79.1
952
284
- 2 5 3 45 -
Bow
er C
reek
-
1991
1992
1993
1994
Mea
n
718
1,45
0
11,1
00
2,42
0
3,92
0
338
288
785
104
378
47 20 7 4 -
3,08
0
3,16
0
3,88
0
6,44
0
4,99
0
4,62
0
- 67.6
266
409
2,22
0
740
- 2 7 6 44 -
0408
5119
(su
rfac
e-w
ater
div
ide
cont
ribu
ting
area
9480
10,8
00
26,6
00
9,14
3
14,0
00
6,33
0
3,71
0
8,98
0
1,94
0
5,24
0
67 34 34 21 -
28.3
95.6
127
183
162
142
14.8
mi2
) 217
200
584
144
286
- 20.8
44.3
46.4
47.4
39.7
142 88.3
205 49
.8
121
- 22 35 25 29 - 66 44 35 35 -
Otte
r C
reek
- 04
0857
005
(sur
face
-wat
er d
ivid
e co
ntri
butin
g ar
ea 9
.5 m
i2)
1991
1992
1993
1994
Mea
n
308
285
867
216
419
113 99.5
138 58
.7
102
37 35 16 27 -
2,49
0
2,18
0
5,58
0
3,06
0
3,33
0
937
839
1,32
0
1,34
0
1,11
0
38 38 24 44 -
181
202
343
193
230
55.3
69.6
75.3
61.6
65.4
31 34 22 32 -
Rat
tlesn
ake
Cre
ek -
0541
3449
(su
rfac
e-w
ater
div
ide
cont
ribu
ting
area
42.
4 m
i )
1992
1993
1994
Mea
n
5,87
0
35,5
00
8,48
0
16,6
00
5,26
0
7,13
0
6,46
0
6,28
0
90 20 76 -
Kue
nste
r C
reek
-
1993
1994
Mea
n
9,69
0
3,18
0
6,43
0
2,96
0
2,48
0
2,72
0
31 78 -
30,6
00
156,
000
34,8
00
73,7
00
18,4
00
49,9
00
22,1
00
30,1
00
60 32 64 -
675
1,69
0
972
1,11
0
213
427
245
295
32 25 25 -
0541
3443
5 (s
urfa
ce-w
ater
div
ide
cont
ribu
ting
area
9.5
9 m
i2)
38,0
00
9,18
0
23,6
00
12,9
00
6,19
0
9,52
0
34 67 -
385
199
292
93.0
50.6
71.8
24 25 -
Par
tial
yea
r of
dat
a co
llect
ed (
Oct
ober
thro
ugh
June
).2M
ean
does
not
incl
ude
part
ial y
ears
.3P
artia
l yea
r of
dat
a co
llect
ed (
July
thro
ugh
Sept
embe
r).
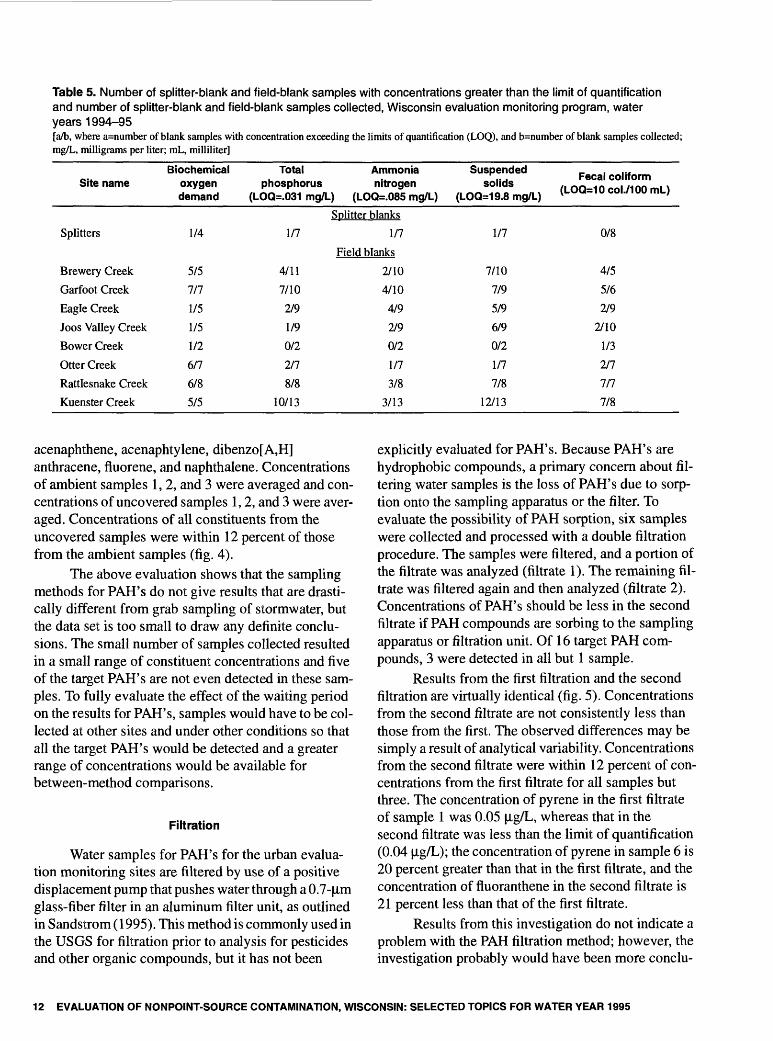
Table 5. Number of splitter-blank and field-blank samples with concentrations greater than the limit of quantification and number of splitter-blank and field-blank samples collected, Wisconsin evaluation monitoring program, water years 1994-95[a/b, where a=number of blank samples with concentration exceeding the limits of quantification (LOQ), and b=number of blank samples collected; mg/L, milligrams per liter; mL, milliliter]
Site nameBiochemical
oxygen demand
Total phosphorus
(LOQ=.031 mg/L)
Ammonia nitrogen
(LOQ=.085 mg/L)
Suspended solids
(LOQ=19.8 mg/L)
Fecal coliform (LOQ=10col./100mL)
Splitter blanksSplitters
Brewery Creek
Garfoot Creek
Eagle Creek
Joos Valley Creek
Bower Creek
Otter Creek
Rattlesnake Creek
Kuenster Creek
1/4
5/5
111
1/5
1/5
1/2
6/7
6/8
5/5
1/7
4/11
7/10
2/9
1/9
0/2
2/7
8/810/13
1/7
Field blanks
2/10
4/10
4/9
2/9
0/2
1/7
3/83/13
1/7
7/10
7/9
5/9
6/9
0/2
1/7
7/812/13
0/8
4/5
5/6
2/9
2/10
1/3
2/7
7/7
7/8
acenaphthene, acenaphtylene, dibenzo[A,H] anthracene, fluorene, and naphthalene. Concentrations of ambient samples 1, 2, and 3 were averaged and con centrations of uncovered samples 1,2, and 3 were aver aged. Concentrations of all constituents from the uncovered samples were within 12 percent of those from the ambient samples (fig. 4).
The above evaluation shows that the sampling methods for PAH's do not give results that are drasti cally different from grab sampling of stormwater, but the data set is too small to draw any definite conclu sions. The small number of samples collected resulted in a small range of constituent concentrations and five of the target PAH's are not even detected in these sam ples. To fully evaluate the effect of the waiting period on the results for PAH's, samples would have to be col lected at other sites and under other conditions so that all the target PAH's would be detected and a greater range of concentrations would be available for between-method comparisons.
Filtration
Water samples for PAH's for the urban evalua tion monitoring sites are filtered by use of a positive displacement pump that pushes water through a 0.7-u,m glass-fiber filter in an aluminum filter unit, as outlined in Sandstrom (1995). This method is commonly used in the USGS for filtration prior to analysis for pesticides and other organic compounds, but it has not been
explicitly evaluated for PAH's. Because PAH's are hydrophobic compounds, a primary concern about fil tering water samples is the loss of PAH's due to sorp- tion onto the sampling apparatus or the filter. To evaluate the possibility of PAH sorption, six samples were collected and processed with a double filtration procedure. The samples were filtered, and a portion of the filtrate was analyzed (filtrate 1). The remaining fil trate was filtered again and then analyzed (filtrate 2). Concentrations of PAH's should be less in the second filtrate if PAH compounds are sorbing to the sampling apparatus or filtration unit. Of 16 target PAH com pounds, 3 were detected in all but 1 sample.
Results from the first filtration and the second filtration are virtually identical (fig. 5). Concentrations from the second filtrate are not consistently less than those from the first. The observed differences may be simply a result of analytical variability. Concentrations from the second filtrate were within 12 percent of con centrations from the first filtrate for all samples but three. The concentration of pyrene in the first filtrate of sample 1 was 0.05 |ig/L, whereas that in the second filtrate was less than the limit of quantification (0.04 |ig/L); the concentration of pyrene in sample 6 is20 percent greater than that in the first filtrate, and the concentration of fluoranthene in the second filtrate is21 percent less than that of the first filtrate.
Results from this investigation do not indicate a problem with the PAH filtration method; however, the investigation probably would have been more conclu-
12 EVALUATION OF NONPOINT-SOURCE CONTAMINATION, WISCONSIN: SELECTED TOPICS FOR WATER YEAR 1995

DC LU
tr LU0. CO
DC Oo cc o
DCH
LU OZO O
Set 2Grab sample
Pump sample
1.4
1.2
1.0
0.8
0.6
0.4
0.2
Set 3 Grab sample
Pump sample
O O N CO
DO Cco
Q)C CD
IO
CDt""
_Q (1)
0) OJ r ,
,_,c ,_,C .CO
N C
S2CO O
N CsgCQO
o cN CD
1C 0)
I-CO o> CMC
,5°-
COMPOUND
Figure 3. Comparison of grab samples and peristaltic-pump samples for polycyclic aromatic hydrocarbon compounds detected in each of three sets of urban stormwater samples, Madison, Wisconsin.
EVALUATION OF NONPOINT-SOURCE CONTAMINATION 13

2.0
1.5
cofEs z<
1.0
00 zO
85U ^ 0.5
o o ^2 a5£
CD C ca
a>c a>
| 6
a> 5]a)N "c
0
CD -^T
N C£ o>® ^ DO 0
.ro. g>
N CD
|£-c ® T30)C V
lo'-3> <^ a)N £> JVj C
m Q. "o*^,1°"
c
COMPOUND
Figure 4. Comparison of average concentrations for capped samples (ambient) and samples left open for 24 hours (open) for polycyclic aromatic hydrocarbon compounds detected in urban stormwater samples, Madison, Wisconsin.
sive with additional data and a greater range of concen trations.
SUMMARY AND CONCLUSIONS
This report is an annual summary of the data col lected for the Wisconsin watershed-management eval uation monitoring program and a presentation of the results from several specific analyses within this pro gram.
A land use and best-management-practice inven tory is ongoing for each evaluation monitoring project to track the nonpoint sources of contamination in each watershed. Information is being gathered from the county Land Conservation Districts (Wisconsin Department of Natural Resources, Water Resources Bureau, and other sources). This information is mapped and stored in a geographic-information-sys tem data base. Each year, the information for each watershed is reviewed and updated.
Data on precipitation, streamflow volume, and storm loads of suspended solids and total phosphorus have been compiled for the eight rural sites through water year 1994 (appendix 1). Data on precipitation, streamflow volume, and storm loads for suspended sol ids, total phosphorus, and total recoverable lead, cop per, zinc, and cadmium have been compiled for the four urban sites through water year 1995 (appendix 2). Annual and snowmelt-peribd loads for suspended sed
iment and total phosphorus were estimated for the eight rural sites.
Quality-assurance and quality-control (QA/QC) samples were collected at rural sites for inorganic con stituents and at urban sites for polycyclic aromatic hydrocarbons (PAH's). Blank quality-control samples were collected at eight of the rural evaluation monitor ing sites. The rural sampling protocol was designed to isolate contamination from the automatic sampler and the sample splitter. Low levels of contamination were found for biochemical oxygen demand, total phospho rus, and ammonia nitrogen. Levels of suspended solids and fecal coliform contamination in the automatic sam pling equipment warrant investigations and corrective action. QA/QC sampling for PAH's at urban sites was inconclusive. QA/QC completed on the PAH filtration indicates that 0.7-|nm glass-fiber filter in an aluminum filter unit can be used for sample filtration.
REFERENCES CITED
Box, G.E.P., Hunter W.G., and Hunter J.S., 1978, Statistics for experimenters: New York, John Wiley and Sons, 653 p.
Corsi, S.R., Walker, J.F., Graczyk, D.J., Greb, S.R., Owens, D.W., and Rappold, K.F., 1994, Evaluation of nonpoint- source contamination Wisconsin-selected streamwater- quality data, land-use and best-management practices inventory, and quality assurance and quality control,
14 EVALUATION OF NONPOINT-SOURCE CONTAMINATION, WISCONSIN: SELECTED TOPICS FOR WATER YEAR 1995

0.10
SAMPLE
Figure 5. Comparison of polycyclic aromatic hydrocarbon samples filtered one time (filtrate 1) and two times (filtrate 2).
REFERENCES CITED 15

water year 1993: U.S. Geological Survey Open-File Report 94-707, 57 p.
Graczyk, D.J., Walker, J.F., Greb, S.R., Corsi, S.R., and Owens, D.W., 1993, Evaluation of nonpoint-source contamination, Wisconsin-selected data for 1992 water year: U.S. Geological Survey Open-File Report 93-630, 48 p.
Holmstrom, B.K., Kammerer, P.A., Jr., and Erickson, R.M., 1986, Water resources data, Wisconsin, water year 1985: U.S. Geological Survey Water-Data Report WI-85-l,414p.
__1987, Water resources data, Wisconsin, water year 1986: U.S. Geological Survey Water-Data Report WI-86-l,402p.
Holmstrom, B.K., and Erickson, R.M., 1989, Waterresources data, Wisconsin, water year 1989: U.S. Geo logical Survey Water-Data Report WI-89-1, 436 p.
Holmstrom, B.K., Kammerer, P.A., Jr., and Erickson, R.M., 1990, Water resources data, Wisconsin, water year 1990: U.S. Geological Survey Water-Data Report WI-90-l,578p.
__1991, Water resources data, Wisconsin, water year 1991: U.S. Geological Survey Water-Data Report WI-91-l,607p.
Holmstrom, B.K., Kammerer, P.A., Jr., and Ellefson, B.R., 1992, Water resources data, Wisconsin, water year 1992: U.S. Geological Survey Water-Data Report WI-92-l,545p.
__1993, Water resources data, Wisconsin, water year 1993: U.S. Geological Survey Water-Data Report WI-93-l,707p.
__1994, Water resources data, Wisconsin, water year 1994: U.S. Geological Survey Water-Data Report WI-94-l,645p.
__1995, Water resources data, Wisconsin, water year 1994: U.S. Geological Survey Water-Data Report WI-95-l,562p.
Sandstrom, M.W, 1995, Filtration of water-sediment sam ples for the determination of organic compounds: U.S. Geological Survey Water-Resources Investigations Report 95-4105, 13 p.
Walker, J.F., 1994, Statistical techniques for assessing water- quality effects of BMPs: Journal of Irrigation and Drainage Engineering, v. 120, no. 2, p. 334-347.
Walker, J.F., Gracyzk, D.J., Corsi, S.R., Owens, D.W, and Wierl, J.A., 1995, Evaluation of nonpoint-source con tamination, Wisconsin Land-use and best-manage ment practices inventory, selected streamwater-quality data, urban-watershed quality assurance and quality control, constituent loads in rural streams, and snow- melt-runoff analysis, water year 1994: U.S. Geological Survey Open-File Report 95-320, 21 p.
Walker, J.F., and Graczyk, D.J., 1993, Preliminary evalua tion of effects of best management practices in Black Earth Creek, Wisconsin, priority watershed: Proceed ings of 1st International IAWPRC Specialized Confer ence on Diffuse Pollution Sources, Prevention Impact and Abatement, Chicago, 111., Sept. 20-24, 1993.
Wierl, J.A., Rappold, K.F., and Amerson, F.U., 1996, Sum mary of land-use inventory for nonpoint-source evalua tion monitoring watersheds in Wisconsin, U.S. Geological Survey Open-File Report 96-123, 23 p.
Wisconsin Department of Natural Resources, 1994, WIN- HUSLE-model documentation and user's manual, ver sion 1.4.4, report WR-294-91 [variously paged].
16 EVALUATION OF NONPOINT-SOURCE CONTAMINATION, WISCONSIN: SELECTED TOPICS FOR WATER YEAR 1995

APPENDIXES 1-2
APPENDIXES 1-2 17

Appendix 1. Storm-load data for rural watershed-management evaluation monitoring sites, Wisconsin, water years 1 1985-93[yr, year; mo, month; d, day; h, hour; in., inches; Mft , million cubic feet; Ib, pounds; s/m, snowmelt; , no data]
Start of storm
Date (yr/mo/d)
Time (24 h)
End of storm
Date (yr/mo/d)
Time (24 h)
Precipitation (in.)
Streamflow volume (Mft3)
Loads
Suspended- solids load
(tons)
Total- phosphorus
load (Ib)
Brewery Creek
84/10/18
84/11/01
84/12/28
85/02/21
85/07/24
85/08/12
85/08/25
85/09/04
85/09/09
85/10/12
85/10/23
85/10/31
85/11/17
86/03/09
86/03/17
86/05/15
86/05/17
86/06/22
89/10/05
90/03/08
90/03/11
90/03/13
90/06/02
90/06/28
91/04/12
91/04/14
91/04/28
91/05/05
91/07/01
91/07/07
91/08/08
91/10/24
91/11/01
91/11/29
92/02/27
92/02/28
92/03/01
1745
0015
0045
0430
1930
2145
0200
2330
0015
0315
1515
1800
2245
2200
1200
1500
0100
0100
0745
0930
0600
1815
1315
2330
1230
0600
2045
0900
1415
1430
0130
2000
0030
1900
1030
0845
1200
84/10/19
84/11/01
84/12/28
85/02/25
85/07/26
85/08/13
85/08/26
85/09/05
85/09/09
85/10/13
85/10/24
85/11/02
85/11/19
86/03/10
86/03/20
86/05/16
86/05/18
86/06/22
89/10/05
90/03/09
90/03/12
90/03/14
90/06/03
90/06/29
91/04/13
91/04/14
91/04/29
91/05/05
91/07/02
91/07/08
91/08/08
91/10/26
91/11/02
91/11/30
92/02/28
92/02/29
92/03/02
1700
2245
2145
0700
2230
1800
1000
2115
2345
0200
1400
1100
0800
2300
0100
0200
0600
2300
1500
0500
0200
0600
1000
1900
1230
2400
1100
2400
1500
1315
0900
0100
1330
1800
0500
0300
0700
2.78
.93
s/m
s/m
6.85
.94
1.70
1.53
1.40
.80
.59
2.77
.63
s/m
s/m
.58
1.09
1.16--
.67
.50
.84
1.54
2.14
1.17
.80
1.24
1.08
1.29
1.11
2.24
3.55
.81
.61
s/m
s/m
s/m
1.5
.48
1.3
9.6
14
.25
.53
.56
1.3
.76
.39
2.4
.85
.67
3.1
.28
.96
.77
.020
1.8
2.5
.89
.59
4.1
.75
.61
.29
.24
.34
.52
.14
2.9
.88
.44
.87
.98
.66
35
7.4
22
120
500
1.2
2.6
2.3
25
3.3
2.3
20
3.5
8.1
60
1.2
8.1
1.1
.040
590
160
48
35
250
8.3
4.1
7.1
3.4
1.7
3.1
.97
120
5.4
2.3
6.7
14
20
140
28
180
1,500
2,000
13--
38
130--
20
190
55--
330
18
78
24
1.1
750
820
250
140
1,100
85
54
47
25
27
56
9.9
740
90
32
130
160
120
18 EVALUATION OF NONPOINT-SOURCE CONTAMINATION, WISCONSIN: SELECTED TOPICS FOR WATER YEAR 1995

Appendix 1. Storm-load data for rural watershed-management evaluation monitoring sites, Wisconsin, water years 11985-93 Continued[yr, year; mo, month; d, day; h, hour; in., inches; Mft , million cubic feet; Ib, pounds; s/m, snowmelt; , no data]
Start of storm
Date (yr/mo/d)
Time (24 h)
End of storm
Date (yr/mo/d)
Time (24 h)
Precipitation (in.)
Streamflow volume (Mft3)
Loads
Suspended- solids load
(tons)
Total- phosphorus
load (Ib)
Brewery Creek Continued
92/07/13
92/08/29
92/09/16
92/09/18
92/10/15
, 92/11/20
93/03/06
93/03/07
93/03/08
93/03/16
93/03/24
93/03/25
93/03/26
93/03/27
93/03/28
93/03/31
93/06/07
93/06/17
93/07/05
93/07/07
93/07/09
93/07/17
93/07/25
93/07/27
93/08/15
93/09/13
94/02/18
94/03/05
94/03/06
94/06/23
94/06/25
94/07/03
94/08/10
94/09/14
1500
0330
1100
0330
1800
0300
1000
1200
1300
0700
1000
1000
1200
1200
1100
0300
1035
1000
0430
1800
0100
1100
0100
2200
0500
0800
1300
1100
0900
1230
2100
2345
1530
0400
92/07/15
92/08/29
92/09/17
92/09/19
92/10/15
92/11/22
93/03/07
93/03/08
93/03/09
93/03/17
93/03/25
93/03/26
93/03/27
93/03/28
93/03/29
93/04/01
93/06/08
93/06/18
93/07/07
93/07/08
93/07/10
93/07/18
93/07/26
93/07/28
93/08/16
93/09/15
94/02/21
94/03/06
94/03/07
94/06/24
94/06/27
94/07/05
94/08/12
94/09/15
0300
1100
1800
1700
2300
0600
0815
0800
0400
0800
0700
0800
0800
0800
0700
0300
1000
1200
0900
0900
0400
0400
0400
1900
2000
1500
1200
0800
0700
2100
0100
2300
0200
0500
1.49
1.21
1.19
.73
.45
2.55
s/m
s/m
s/m
s/m
s/m
s/m
s/m
s/m
s/m
s/m
2.39
.43
4.58
1.03
1.47
.86
1.35
.88
2.48
2.12--
--
--
--
-
--
--
.-
.34
.037
.25
.33
.019
1.4
.60
1.2
.83
1.7
2.1
2.3
2.3
1.2
2.9
2.5
2.5
.93
16
1.3
5.1
.84
2.1
1.4
4.7
2.9
4.9
2.8
1.7
1.2
.66
5.9
1.1
.65
.13
.51
.47
.020
7.5
13
9.3
7.8
73
36
67--
16
210
55
110
18
1,300
130
250
42
83
25.8
88.6
12.1
220
72
30
4.2
2.1
200
2.5
4.1
36
.78
27
18
.28
100
440
490
380
640
330
460
160
98
590
250
470
67
4,000
460
570
87
300
120
470
130
780
510
110
62
16
930
32
36
APPENDIXES 1-2 19

Appendix 1. Storm-load data for rural watershed-management evaluation monitoring sites, Wisconsin, water years 1 1985-93 Continued[yr, year; mo, month; d, day; h, hour; in., inches; Mft , million cubic feet; Ib, pounds; s/m, snowmelt; --, no data]
Start of storm
Date (yr/mo/d)
Time (24 h)
End of storm
Date (yr/mo/d)
Time (24 h)
Precipitation (in.)
Streamflow volume (Mft3)
Loads
Suspended- solids load
(tons)
Total- phosphorus
load (Ib)
Garfoot Creek
84/10/18
84/10/31
84/12/27
85/02/21
85/07/24
85/09/04
85/09/09
85/09/23
85/10/11
85/10/23
85/10/31
85/11/18
86/03/09
86/03/16
86/05/15
86/05/17
89/10/05
90/01/16
90/03/11
90/03/13
90/03/14
90/06/02
90/06/28
90/08/19
91/03/01
91/03/22
91/04/12
91/04/14
91/08/08
91/11/01
91/11/29
92/02/26
92/02/27
92/02/28
92/09/16
92/09/18
92/11/19
1200
2400
2200
0200
1915
2400
0015
0300
2345
1600
1626
0300
1600
1200
1400
0100
0930
1845
0600
0600
1600
1300
2330
1630
0945
2130
1500
0600
0200
0900
2000
1400
1045
1130
1200
0330
2000
84/10/19
84/11/01
84/12/29
85/02/25
85/07/26
85/09/05
85/09/09
85/09/24
85/10/12
85/10/24
85/11/02
85/11/19
86/03/11
86/03/20
86/05/16
86/05/18
89/10/06
90/01/17
90/03/12
90/03/14
90/03/15
90/06/03
90/06/29
90/08/20
91/03/02
91/03/23
91/04/13
91/04/14
91/08/08
91/11/02
91/11/30
92/02/27
92/02/28
92/02/28
92/09/17
92/09/18
92/11/21
2200
1800
0900
0100
0500
1300
2100
0300
2100
0700
1400
0900
0600
0200
0500
0400
0600
2200
0400
1300
1500
0100
2300
1200
2200
0700
1400
2400
1500
0100
1300
0100
0100
2400
0330
1800
2300
2.64
1.13
s/m
s/m
6.56
1.38
1.63
1.20
.85
.70
2.79
.73
s/m
s/m
.72
1.15--
s/m
.48
.76
1.12
1.48
2.45--
1.51
.74
1.74
.99
2.34
1.40
.87
s/m
s/m
s/m
1.34
.89
2.68
3.1
1.1
2.4
6.3
7.5
.49
2.2
.57
1.1
.62
5.3
1.6
1.7
7.7
.53
1.2
.21
1.4
2.9
1.3
2.0
.42
3.0
.81
3.2
.33
2.2
1.9
.30
1.3
.98
.30
.68
.44
.69
.70
3.4
37
16
45
62
65
1.7
17
1.9
14
9.8
34
17
26
59
14
15
.27
13
53
30
31
23
77
4.6
53
4.2
74
58--
15
13--
9.0
1.5
7.4
5.2
43
210
76
140
470
710
22
130--
-
46
370
98
110
610
27
75
6.4
190
330
160
230
100
530
61
370
28
210
200
12
150
76
11
54
21
46
48
420
20 EVALUATION OF NONPOINT-SOURCE CONTAMINATION, WISCONSIN: SELECTED TOPICS FOR WATER YEAR 1995

Appendix 1. Storm-load data for rural watershed-management evaluation monitoring sites, Wisconsin, water years 11985-93 Continued[yr, year; mo, month; d, day; h, hour; in., inches; Mft3, million cubic feet; Ib, pounds; s/m, snowmelt; --, no data]
Start of storm
Date (yr/mo/d)
Time (24 h)
End of storm
Date (yr/mo/d)
Time (24 h)
Precipitation (in.)
Streamflow volume
(Mft3)
Loads
Suspended-; solids load
(tons)
Total- phosphorus
load (Ib)
Garfoot Creek Continued
92/12/15
93/03/24
93/03/25
93/03/26
93/03/27
93/03/28
93/03/31
93/04/07
93/04/15
93/04/19
93/06/07
93/06/17
93/07/05
93/07/08
93/07/10
93/07/25
93/07/27
93/08/15
93/08/23
93/09/13
94/02/19
94/03/05
94/03/06
94/08/10
94/09/14
1600
1300
1030
1300
1240
1000
0400
2300
0100
1300
1045
1800
0500
1300
1800
0300
2200
0500
1600
1000
0100
1200
1100
1200
0500
92/12/16
93/03/25
93/03/26
93/03/27
93/03/28
93/03/29
93/04/01
93/04/08
93/04/16
93/04/20
93/06/08
93/06/18
93/07/07
93/07/10
93/07/11
93/07/25
93/07/28
93/08/16
93/08/24
93/09/15
94/02/21
94/03/06
94/03/07
94/08/11
94/09/14
1200
0830
1000
0500
0400
0300
0400
1700
1200
2300
2000
1200
0200
0400
0500
2400
1500
1300
0700
0500
0700
0500
0500
1500
2000
1.30
s/m
s/m
s/m
s/m
s/m
s/m
.62
1.55
1.69
1.97
1.09
3.98
1.81
.45
1.48
.44
2.35
1.26
2.27--
--
--
--
1.2
2.1
3.4
1.7
1.3
2.7
3.7
1.3
4.2
3.8
2.8
.99
7.7
5.9
1.1
2.5
.92
3.6
1.3
2.7
6.4
1.2
1.2
1.4
.59
7.4
24
41
14
9.1
44
28
13
35
37
31
13
130
110
12
43
5.92
30.8
14.2
18.6
74
9
5.7
12
5.2
400
240
300
130
100
290
210
60
240
180
180
54
730
490
63
220
38
230
65
140
650
89
63
76
22
Eagle Creek
91/04/29
91/05/05
91/05/15
91/05/31
91/07/21
91/08/07
91/10/23
91/11/01
91/11/17
92/03/01
0200
0800
2130
0900
1715
1540
2325
0050
1900
1100
91/04/29
91/05/05
91/05/17
91/05/31
91/07/21
91/08/08
91/10/24
91/11/01
91/11/18
92/03/02
2200
2230
0200
2000
2400
1500
1200
2300
1200
0400
1.81
1.29
.85
.50
1.99
1.88
1.21
2.75
1.15
s/m
5.1
1.7
6.9
1.2
1.6
1.6
.88
7.0
1.9
1.3
2,100
61
3,200
250
220
62
52
620
120
140
3,800
210
4,700
280
430
140
200
1,400
250
220
APPENDIXES 1-2 21
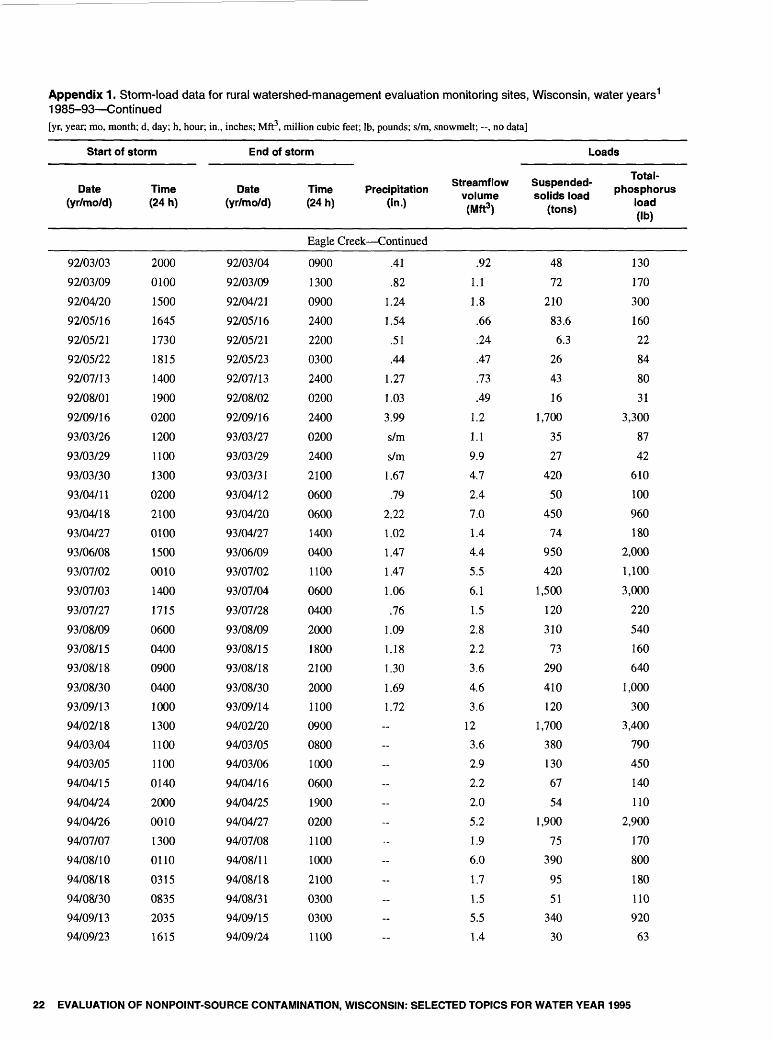
Appendix 1. Storm-load data for rural watershed-management evaluation monitoring sites, Wisconsin, water years 1 1985-93 Continued[yr, year; mo, month; d, day; h, hour; in., inches; Mft3, million cubic feet; Ib, pounds; s/m, snowmelt; --, no data]
Start of storm
Date (yr/mo/d)
Time (24 h)
End of storm
Date (yr/mo/d)
Time (24 h)
Precipitation (in.)
Streamflow volume (Mft3)
Loads
Suspended- solids load
(tons)
Total- phosphorus
load (Ib)
Eagle Creek Continued
92/03/03
92/03/09
92/04/20
92/05/16
92/05/21
92/05/22
92/07/13
92/08/01
92/09/16
93/03/26
93/03/29
93/03/30
93/04/11
93/04/18
93/04/27
93/06/08
93/07/02
93/07/03
93/07/27
93/08/09
93/08/15
93/08/18
93/08/30
93/09/13
94/02/18
94/03/04
94/03/05
94/04/15
94/04/24
94/04/26
94/07/07
94/08/10
94/08/18
94/08/30
94/09/13
94/09/23
2000
0100
1500
1645
1730
1815
1400
1900
0200
1200
1100
1300
0200
2100
0100
1500
0010
1400
1715
0600
0400
0900
0400
1000
1300
1100
1100
0140
2000
0010
1300
0110
0315
0835
2035
1615
92/03/04
92/03/09
92/04/21
92/05/16
92/05/21
92/05/23
92/07/13
92/08/02
92/09/16
93/03/27
93/03/29
93/03/31
93/04/12
93/04/20
93/04/27
93/06/09
93/07/02
93/07/04
93/07/28
93/08/09
93/08/15
93/08/18
93/08/30
93/09/14
94/02/20
94/03/05
94/03/06
94/04/16
94/04/25
94/04/27
94/07/08
94/08/11
94/08/18
94/08/31
94/09/15
94/09/24
0900
1300
0900
2400
2200
0300
2400
0200
2400
0200
2400
2100
0600
0600
1400
0400
1100
0600
0400
2000
1800
2100
2000
1100
0900
0800
1000
0600
1900
0200
1100
1000
2100
0300
0300
1100
.41
.82
1.24
1.54
.51
.44
1.27
1.03
3.99
s/m
s/m
1.67
.79
2.22
1.02
1.47
1.47
1.06
.76
1.09
1.18
1.30
1.69
1.72--
--
--
-
-
--
-
--
--
--
--
.92
1.1
1.8
.66
.24
.47
.73
.49
1.2
1.1
9.9
4.7
2.4
7.0
1.4
4.4
5.5
6.1
1.5
2.8
2.2
3.6
4.6
3.6
12
3.6
2.9
2.2
2.0
5.2
1.9
6.0
1.7
1.5
5.5
1.4
48
72
210
83.6
6.3
26
43
16
1,700
35
27
420
50
450
74
950
420
1,500
120
310
73
290
410
120
1,700
380
130
67
54
1,900
75
390
95
51
340
30
130
170
300
160
22
84
80
31
3,300
87
42
610
100
960
180
2,000
1,100
3,000
220
540
160
640
1,000
300
3,400
790
450
140
110
2,900
170
800
180
110
920
63
22 EVALUATION OF NONPOINT-SOURCE CONTAMINATION, WISCONSIN: SELECTED TOPICS FOR WATER YEAR 1995

Appendix 1. Storm-load data for rural watershed-management evaluation monitoring sites, Wisconsin, water years 1 1985-93 Continued[yr, year; mo, month; d, day; h, hour; in., inches; Mft , million cubic feet; Ib, pounds; s/m, snowmelt; , no data]
Start of storm
Date(yr/mo/d)
Time (24 h)
End of storm
Date (yr/mo/d)
Time (24 h)
Precipitation (in.)
Streamflow volume (Mft3)
Loads
Suspended- solids load
(tons)
Total- phosphorus
load (Ib)
Joos Valley Creek
90/08/17
90/08/26
91/04/29
91/05/05
91/05/15
91/05/31
91/07/21
91/08/07
91/10/23
91/10/31
91/11/17
92/03/01
92/03/03
92/03/08
92/04/20
92/05/16
92/05/21
92/05/22
92/06/17
92/07/02
92/07/13
92/07/22
92/08/01
92/09/16
93/03/24
93/03/26
93/03/30
93/04/11
93/04/16
93/04/18
93/04/27
93/06/08
93/07/01
93/07/03
93/07/27
93/08/09
1850
0545
0200
0730
2000
0850
1710
1500
2250
2200
1800
1000
1400
2400
1300
1500
1700
1800
0400
0500
1300
1000
1800
0100
1100
1300
1100
0100
1200
2200
0100
1500
2400
1400
1700
0600
90/08/18
90/08/26
91/04/29
91/05/05
91/05/17
91/05/31
91/07/22
91/08/08
91/10/24
91/11/01
91/11/18
92/03/02
92/03/04
92/03/09
92/04/21
92/05/16
92/05/21
92/05/23
92/06/17
92/07/02
92/07/14
92/07/23
92/08/02
92/09/16
93/03/25
93/03/27
93/03/31
93/04/12
93/04/17
93/04/20
93/04/28
93/06/08
93/07/02
93/07/03
93/07/27
93/08/09
0200
1500
1600
2000
0200
1900
1100
1100
1300
2200
1400
0400
0800
1100
0700
2200
2400
0300
1800
1500
0200
0300
1300
2200
0500
0200
2000
0200
0100
0300
0200
2310
0940
2100
2300
1400
1.37
1.75
2.11
1.25
1.21
.57
1.24
2.27
.83
2.87
1.21
s/m
.37
.86
1.24
1.62
.74
.49
.57
.72
1.32
1.19
1.24
4.19
s/m
s/m
1.50
.53
.64
2.07
1.07
1.50
1.33
.90
.75
1.17
.96
2.8
1.7
.64
1.8
.40
.68
.63
.34
2.1
.96
.63
.47
.45
.77
.34
.22
.27
.25
.23
.40
.37
.57
5.4
.38
.47
2.1
.87
.60
2.7
1.5
1.8
1.2
2.2
.54
.92
170
750
840
26
390
36
27
11
3.4
110
14
16
1.5
20
56
54
13
12
2.8
4.2
7.1
1.4
24
910
1.4
8.3
86
4.0
4.2
130
22
630
180
880
64
110
420
1,600
1,500
57
850
78
70
34
12
330
62
68
11
49
120
110
35
31
7.7
9.2
21
5.7
73
1,700
14
56
25
15
16
320
63
900
410
1,600
130
220
APPENDIXES 1-2 23

Appendix 1. Storm-load data for rural watershed-management evaluation monitoring sites, Wisconsin, water years 1 1985-93 Continued[yr, year; mo, month; d, day; h, hour; in., inches; Mft3, million cubic feet; Ib, pounds; s/m, snowmelt; --, no data]
Start of storm
Date (yr/mo/d)
Time (24 h)
End of storm
Date (yr/mo/d)
Time (24 h)
Precipitation (in.)
Streamflow volume (Mft3)
Loads
Suspended- solids load
(tons)
Total- phosphorus
load (Ib)
Joos Valley Creek Continued
93/08/15
93/08/18
93/08/30
94/02/18
94/03/04
94/03/05
94/04/15
94/04/24
94/07/07
94/08/10
94/08/18
94/08/13
94/09/13
94/09/23
0300
0900
0300
1200
1000
1100
0110
2110
1122
0425
0325
0740
2035
1550
93/08/15
93/08/18
93/08/30
94/02/20
94/03/05
94/03/06
94/04/16
94/04/26
94/07/08
94/08/11
94/08/18
94/08/30
94/09/14
94/09/23
1500
0900
1300
0800
0500
0800
0300
2100
1000
1900
2300
2100
2300
2300
1.19
1.08
1.78-
--
--
-
--
--
--
--
~
--
.73
.87
1.4
5.7
1.8
1.3
.84
2.8
.77
2.3
.68
.5
2.1
.31
12
53
130
740
160
28
16
670
19
130
22
5.1
150
4.2
330
140
290
1500
350
250
35
1,200
60
300
70
17
420
9.5
Bower Creek
90/10/17
91/03/01
91/03/05
91/03/18
91/04/09
91/04/12
91/06/14
91/10/29
91/11/01
91/11/18
91/11/29
91/12/12
92/03/29
92/03/31
92/04/10
92/04/15
92/04/19
92/04/20
92/07/13
92/09/16
92/09/18
2040
1500
1700
1300
1100
2400
0500
1000
1325
0700
1805
0825
1500
1200
1700
1200
1355
1945
1820
0725
0240
90/10/20
91/03/04
91/03/08
91/03/25
91/04/12
91/04/17
91/06/15
91/10/31
91/11/04
91/11/20
91/12/02
91/12/14
92/03/31
92/04/02
92/04/13
92/04/18
92/04/20
92/04/22
92/07/16
92/09/17
92/09/20
0925
1100
1500
0900
2000
2400
1545
1400
0600
0905
1610
0700
0940
1100
1535
0935
1815
0910
0500
0520
0800
.38
1.05
s/m
s/m
s/m
.71
1.40
1.02
.35
.23
.78
.61
.28
.12
.43
2.07
.19
.36
.71
1.39
1.48
3.6
100
12
160
48
260
1.2
1.00
.91
.90
10
14
3.9
3.9
12
34
3.4
7.2
.48
.95
13
12
100
13
160
48
260
9.7
1.8
.55
.24
64
64
5.9
11
75
710
11
72
.24
2.9
97
280--
520
1,800
460
1,500
70
58
77
32
590
700
120
150
440
2,900
110
430
13
110
950
24 EVALUATION OF NONPOINT-SOURCE CONTAMINATION, WISCONSIN: SELECTED TOPICS FOR WATER YEAR 1995

Appendix 1 . Storm-load data for rural watershed-management evaluation monitoring sites, Wisconsin, water years11985-93 Continued[yr, year; mo, month; d, day; h, hour; in., inches; Mft , million cubic feet; Ib, pounds; s/m, snowmelt; , no data]
Start of storm
Date (yr/mo/d)
Time (24 h)
End of storm
Date (yr/mo/d)
Time (24 h)
Precipitation (in.)
Streamflow volume
(Mft3)
Loads
Suspended- solids load
(tons)
Total- phosphorus
load (Ib)
Bower Creek Continued
92/09/26
92/11/01
92/11/08
92/11/12
92/11/20
92/12/15
92/12/29
93/03/02
93/03/24
93/04/04
93/04/07
93/04/11
93/04/15
93/04/19
93/04/27
93/05/30
93/06/08
93/06/14
93/08/05
93/10/15
93/10/20
93/11/12
93/11/26
94/02/19
94/03/04
94/04/12
94/04/15
94/04/24
94/07/04
1000
1900
2300
1200
0005
0715
0600
1140
0859
1130
1345
1459
0559
0900
1729
1245
0300
0225
2300
1730
2200
2200
0700
0700
1200
1500
0245
2000
0100
92/09/30
92/11/03
92/11/12
92/11/14
92/11/22
92/12/17
92/12/31
93/03/18
93/03/31
93/04/07
93/04/10
93/04/14
93/04/19
93/04/23
93/04/29
93/06/03
93/06/11
93/06/16
93/08/08
93/10/19
93/10/23
93/11/18
93/11/29
94/02/25
94/03/09
94/04/14
94/04/17
94/04/27
94/07/09
0510
2300
0401
1001
0530
2216
2301
1801
1501
1101
0101
0801
0301
0801
1401
0531
1201
0021
1700
0300
2200
0600
0900
0300
2200
1000
0900
0345
2100
1.11
1.27
.34
.34
1.60
1.02
s/m
s/m
s/m
s/m
.76
s/m
1.01
.49
.55
.92
2.51
.96
1.18--
--
-
--
--
--
--
--
--
3.3
8.1
4.1
4.7
38
47
1.6
29
22
9.5
28
7.4
46
32
8.5
4.0
38
6.9
1.6
1.8
2.2
3.2
2.9
78
36
3.3
5.9
45
3.2
2.7
40
3.7
6.3
270
180
.77
30
26
22
290
8.0
420
140
27
2.5
1,100
110
5.1
1.4
1.5
1.2
3.6
46
48
7.3
37
2,200
6.6
120
550
130
170
2,500
1,900
58
1,600
1,100
350
1,700
230
2,400
1,300
340
110
3,600
480~
19
78
68
89
930
770
65
230
6,000
100
Otter Creek
90/09/06
90/09/14
90/11/05
91/02/03
91/03/01
91/06/14
91/10/24
1940
0540
0610
0300
1100
1735
1200
90/09/08
90/09/18
90/11/06
91/02/08
91/03/04
91/06/18
91/10/26
1845
2335
1030
1400
1600
0300
1245
1.53
1.67
.79
s/m
s/m
2.24
1.85
1.5
6.5
1.2
10
5.3
5.2
2.0
7.1
26
1.2
11
27
35
8.3
63
190
20
180-
230
57
APPENDIXES 1-2 25

Appendix 1. Storm-load data for rural watershed-management evaluation monitoring sites, Wisconsin, water years 11985-93 Continued[yr, year; mo, month; d, day; h, hour; in., inches; Mft3 , million cubic feet; Ib, pounds; s/m, snowmelt; --, no data]
Start of storm
Date (yr/mo/d)
Time (24 h)
End of storm
Date (yr/mo/d)
Time (24 h)
Precipitation (in.)
Streamflow volume (Mft3)
Loads
Suspended- solids load
(tons)
Total- phosphorus
load (Ib)
Otter Creek Continued
91/10/26
91/10/29
91/11/01
91/11/14
91/11/18
91/11/29
92/02/27
92/03/01
92/03/05
92/03/09
92/03/24
92/04/10
92/04/16
92/09/14
92/09/16
92/09/18
92/09/26
92/11/01
92/11/12
92/11/19
92/11/25
92/12/15
92/12/29
93/03/24
93/04/03
93/04/08
93/04/11
93/04/15
93/04/19
93/06/07
93/07/05
93/07/09
93/09/13
93/09/20
93/12/24
94/03/20
94/04/24
1245
0225
1200
1535
0140
2015
1200
0900
2100
0335
1200
1800
0500
1230
0950
0440
2110
1600
0800
2300
1900
0520
0744
1050
1400
0035
1100
0335
1505
1230
1700
0300
1045
1435
2100
1200
2200
91/10/27
91/10/30
91/11/03
91/11/17
91/11/20
91/12/02
92/03/01
92/03/03
92/03/08
92/03/10
92/03/28
92/04/13
92/04/18
92/09/15
92/09/17
92/09/19
92/09/28
92/11/03
92/11/13
92/11/22
92/11/27
92/12/17
92/12/30
93/04/01
93/04/06
93/04/09
93/04/13
93/04/17
93/04/21
93/06/09
93/07/07
93/07/10
93/09/16
93/09/22
94/01/04
94/03/25
94/04/27
2300
1910
0005
0155
1810
2235
0900
0900
1100
1930
0700
0500
0540
0600
0640
0735
1700
1600
1901
1701
1901
1301
0731
1201
0900
1833
1001
0713
2152
2045
2100
2200
0700
0900
0500
0800
0800
.46--
.53
.46
.39
1.38
s/m
s/m
.37
.55
s/m
.81
.80
1.01
1.00
1.09
.74
1.55
.39
.84
.35
.97
.30
s/m
s/m
1.10
.45
1.43
1.50
2.39
2.04
1.42
2.34
1.49--
--
_
1.4
2.6
2.2
2.0
2.7
6.7
4.1
4.1
5.8
4.8
6.0
4.1
4.5
.24
.41
.82
.63
2.4
.92
4.2
2.7
7.6
.83
29
5.7
12
6.4
18
20
14
12
8.0
2.3
2.6
18
10
4.1
1.6
11
8.1
3.0
7.6
19
12
14
15
24
8.3
19
25
.27
1.1
3.1
.52
6.5
.62
16
3.0
32
.44
39
4.8
45
5.3
74
67
140
160
120
3.7
12
.0034
9
9.9
23
83
70
24
45
150
110
130
100
98
82
82
110
2.8
13
25
5.2
57
9.3
120
53
220
7.8
450
58
270
69
420
440
510
580
410
37
78
.039
85
70
26 EVALUATION OF NONPOINT-SOURCE CONTAMINATION, WISCONSIN: SELECTED TOPICS FOR WATER YEAR 1995

Appendix 1. Storm-load data for rural watershed-management evaluation monitoring sites, Wisconsin, water years 11985-93 Continued[yr, year; mo, month; d, day; h, hour; in., inches; Mft3 , million cubic feet; Ib, pounds; s/m, snowmelt; , no data]
Start of storm
Date (yr/mo/d)
Time (24 h)
End of storm
Date (yr/mo/d)
Time (24 h)
Precipitation (in.)
Streamflow volume (Mft3)
Loads
Suspended- solids load
(tons)
Total- phosphorus
load (Ib)
Otter Creek Continued
94/05/25
94/08/01
1900
0200
94/05/27
94/08/02
2200
2100
-
2.2
.82
34
.52
130
8.2
Kuenster Creek
92/11/01
92/11/19
92/12/15
93/03/05
93/03/07
93/03/08
93/03/15
93/03/25
93/03/26
93/03/27
93/03/28
93/03/30
93/05/02
93/06/17
93/06/28
93/06/29
93/07/17
93/08/14
93/08/18
94/03/04
94/03/05
94/06/20
94/06/23
94/07/04
94/07/14
94/07/20
1900
1600
0200
1100
1400
1400
2300
1200
1200
1200
1300
1200
1900
1800
1600
2300
1000
1715
1100
1200
1200
0200
0600
0800
0100
0000
92/11/04
92/11/22
92/12/17
93/03/06
93/03/08
93/03/09
93/03/17
93/03/26
93/03/27
93/03/28
93/03/29
93/03/31
93/05/03
93/06/18
93/06/29
93/06/30
93/07/17
93/08/16
93/08/19
94/03/05
94/03/06
94/06/20
94/06/24
94/07/05
94/07/15
94/07/21
0100
0100
0400
0400
0700
0800
0900
0900
0700
0500
0600
1900
1000
2000
0600
2200
1900
0500
1100
0800
1100
1300
2200
1900
0300
0200
1.38
2.73
s/m
s/m
s/m
s/m
s/m
s/m
s/m
s/m
s/m
1.78
1.63
.72-
1.42
1.07
1.00
.88--
--
--
--
--
~
1.0
2.4
1.7
1.7
4.2
3.4
6.5
9.7
7.8
6.6
4.1
14
3.8
3.4
1.4
5.8
2.2
4.4
2.4
6
3
.47
4.9
2.4
2.9
2.1
1.8
19
8.2
85
2.70
83
290
1,100
430
210
91
3,000
340
100
20
470
170
120
36
790
85
6.6
130
95
190
55
36
300
220
440
1,200
560
920
3,600
1,400
1,190
540
6,700
1,400
730
80
1,600
470
455
190
2,000
330
49
490
390
140
230
Rattlesnake Creek
90/01/16
90/03/08
90/03/11
90/05/09
90/05/19
90/06/22
1700
0600
0500
0115
0500
0315
90/01/18
90/03/08
90/03/12
90/05/10
90/05/20
90/06/22
0800
1200
0200
0100
2100
1800
s/m
s/m
s/m--
--
_.
9.4
16
4.1
3.2
5.8
3.3
150
1,300
57
170
83
55
1,600
3,600
480
360
530
180
APPENDIXES 1-2 27
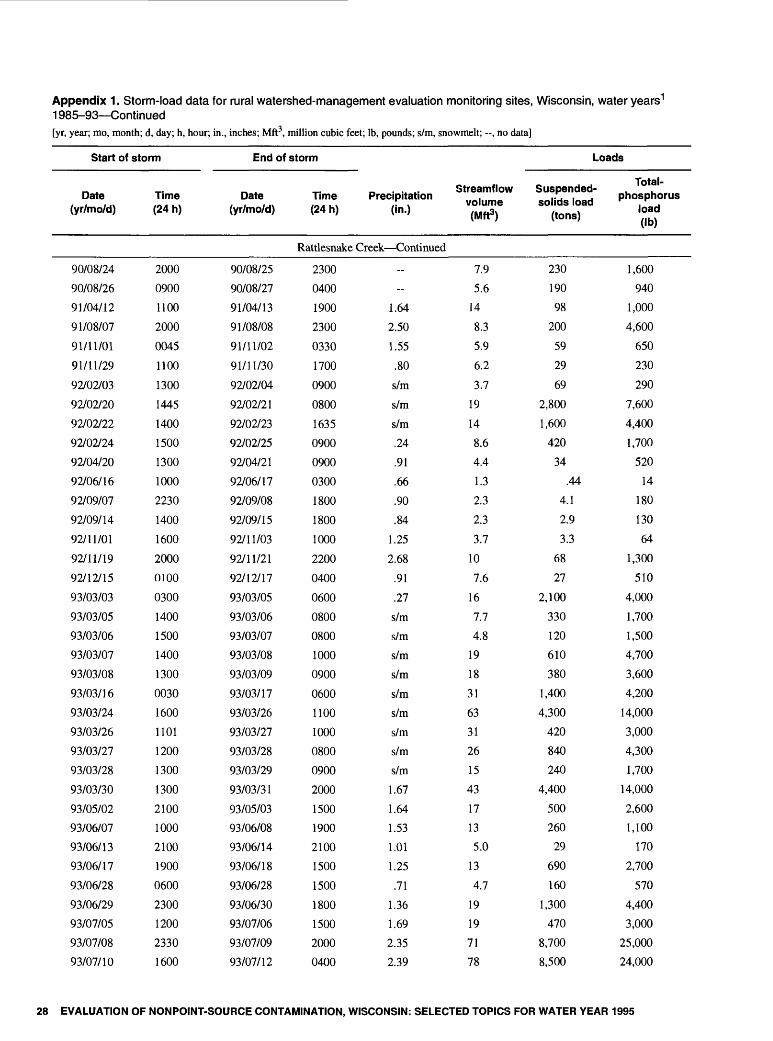
Appendix 1. Storm-load data for rural watershed-management evaluation monitoring sites, Wisconsin, water years 1 1985-93 Continued[yr, year; mo, month; d, day; h, hour; in., inches; Mft , million cubic feet; Ib, pounds; s/m, snowmelt; , no data]
Start of storm
Date (yr/mo/d)
Time (24 h)
End of storm
Date (yr/mo/d)
Time (24 h)
Precipitation (in.)
Streamflow volume (Mft3)
Loads
Suspended- solids load
(tons)
Total- phosphorus
load (Ib)
Rattlesnake Creek Continued
90/08/24
90/08/26
91/04/12
91/08/07
91/11/01
91/11/29
92/02/03
92/02/20
92/02/22
92/02/24
92/04/20
92/06/16
92/09/07
92/09/14
92/11/01
92/11/19
92/12/15
93/03/03
93/03/05
93/03/06
93/03/07
93/03/08
93/03/16
93/03/24
93/03/26
93/03/27
93/03/28
93/03/30
93/05/02
93/06/07
93/06/13
93/06/17
93/06/28
93/06/29
93/07/05
93/07/08
93/07/10
2000
0900
1100
2000
0045
1100
1300
1445
1400
1500
1300
1000
2230
1400
1600
2000
0100
0300
1400
1500
1400
1300
0030
1600
1101
1200
1300
1300
2100
1000
2100
1900
0600
2300
1200
2330
1600
90/08/25
90/08/27
91/04/13
91/08/08
91/11/02
91/11/30
92/02/04
92/02/21
92/02/23
92/02/25
92/04/21
92/06/17
92/09/08
92/09/15
92/11/03
92/11/21
92/12/17
93/03/05
93/03/06
93/03/07
93/03/08
93/03/09
93/03/17
93/03/26
93/03/27
93/03/28
93/03/29
93/03/31
93/05/03
93/06/08
93/06/14
93/06/18
93/06/28
93/06/30
93/07/06
93/07/09
93/07/12
2300
0400
1900
2300
0330
1700
0900
0800
1635
0900
0900
0300
1800
1800
1000
2200
0400
0600
0800
0800
1000
0900
0600
1100
1000
0800
0900
2000
1500
1900
2100
1500
1500
1800
1500
2000
0400
--
1.64
2.50
1.55
.80
s/m
s/m
s/m
.24
.91
.66
.90
.84
1.25
2.68
.91
.27
s/m
s/m
s/m
s/m
s/m
s/m
s/m
s/m
s/m
1.67
1.64
1.53
1.01
1.25
.71
1.36
1.69
2.35
2.39
7.9
5.6
14
8.3
5.9
6.2
3.7
19
14
8.6
4.4
1.3
2.3
2.3
3.7
10
7.6
16
7.7
4.8
19
18
31
63
31
26
15
43
17
13
5.0
13
4.7
19
19
71
78
230
190
98
200
59
29
69
2,800
1,600
420
34
.44
4.1
2.9
3.3
68
27
2,100
330
120
610
380
1,400
4,300
420
840
240
4,400
500
260
29
690
160
1,300
470
8,700
8,500
1,600
940
1,000
4,600
650
230
290
7,600
4,400
1,700
520
14
180
130
64
1,300
510
4,000
1,700
1,500
4,700
3,600
4,200
14,000
3,000
4,300
1,700
14,000
2,600
1,100
170
2,700
570
4,400
3,000
25,000
24,000
28 EVALUATION OF NONPOINT-SOURCE CONTAMINATION, WISCONSIN: SELECTED TOPICS FOR WATER YEAR 1995

Appendix 1. Storm-load data for rural watershed-management evaluation monitoring sites, Wisconsin, water years 11985-93 Continued[yr, year; mo, month; d, day; h, hour; in., inches; Mft3 , million cubic feet; Ib, pounds; s/m, snowmelt; --, no data]
Start of storm
Date (yr/mo/d)
Time (24 h)
End of storm
Date (yr/mo/d)
Time Precipitation (24 h) (in.)
Streamflow volume (Mft3)
Loads
Suspended- solids load
(tons)
Total- phosphorus
load (Ib)
Rattlesnake Creek Continued
93/07/17
93/08/14
93/08/15
93/08/18
94/02/18
94/03/04
94/03/05
94/06/20
94/06/23
94/07/04
94/07/14
94/07/20
0900
1700
0900
1300
1600
1300
1100
0100
0700
0700
0200
0015
93/07/18
93/08/15
93/08/16
93/08/19
94/02/21
94/03/05
94/03/06
94/06/20
94/06/24
94/07/05
94/07/14
94/07/20
0200 0.97
0545 .97
0100 .74
0600 1.00
0800
0900
0900
1900
2300
1800
2000
1700
12
6.5
10
11
160
27
13
2.7
16
7.8
6.4
5.5
480
130
150
220
4200
1900
290
20
520
170
320
140
1,700
590
810
1,200
15000
6300
1600
83
2200
870
280
730
1 Water year is the 12-month period, October 1 through September 30. The water year is designated by the calendar year in which it ends. Thus, the year starting October 1, 1992, and ending September 30,1993, is called "water year 1993."
APPENDIXES 1-2 29
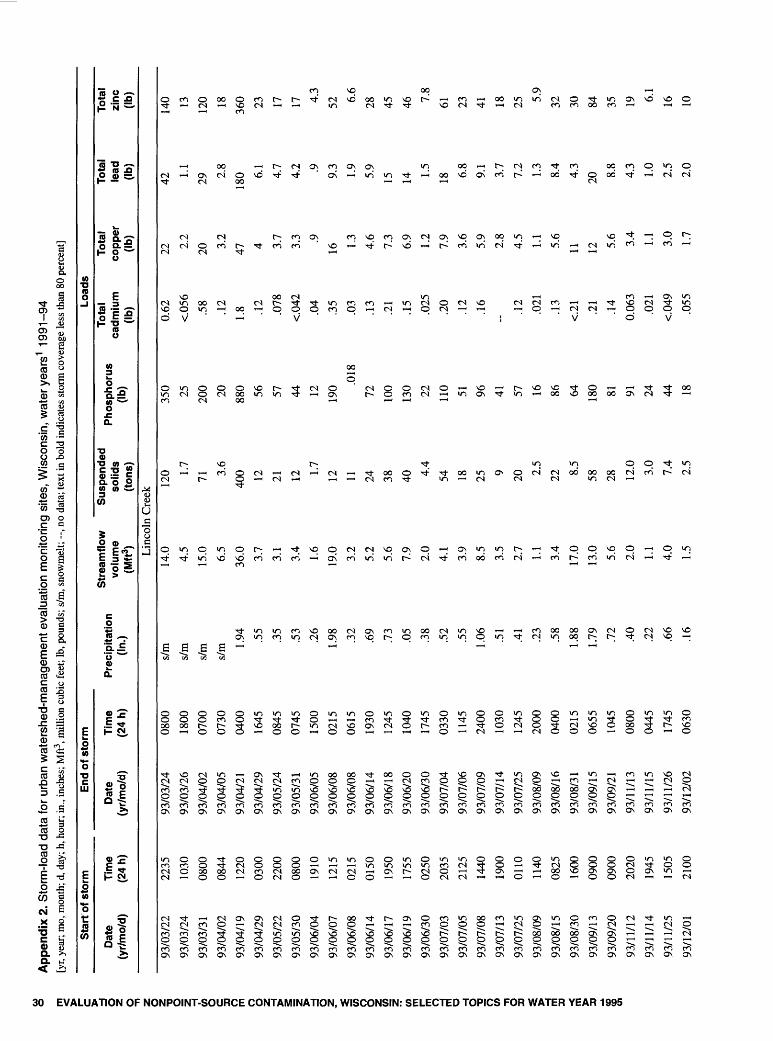
App
endi
x 2.
Sto
rm-lo
ad d
ata
for
urba
n w
ater
shed
-man
agem
ent e
valu
atio
n m
onito
ring
site
s, W
isco
nsin
, w
ater
yea
rs1
1991
-94
EVALUATION
OF
NG Z o o z H
CO O c 3D 0 m O O I 5 Z 5 O Z CO 8 CO z CO m r-
m m O o O CO n O 3D 1 m 3D m 3D _L (O
CO U
I
[yr,
year
; mo,
mon
th; d
, day
; h, h
our;
in.,
inch
es; M
:
Star
t of s
torm
Dat
e (y
r/mo/
d)Ti
me
(24
h)
ft3, m
illio
n cu
bic
feet
; Ib,
pou
nds;
s/m
, sno
wm
elt;
--, n
o da
ta; t
ext i
n bo
ld in
dica
tes
stor
m c
over
age
less
than
80
perc
ent]
End
of s
torm
Dat
e (y
r/mo/
d)Ti
me
(24
h)Pr
ecip
itatio
n (in
.)
Stre
amfl
ow
volu
me
(Mft3
)
Susp
ende
d so
lids
(ton
s)
Phos
phor
us
(Ib)
Loa
dsTo
tal
cadm
ium
(Ib
)
Tota
l co
pper
(Ib
)
Tota
l le
ad
(Ib)
Tota
l zi
nc
(Ib)
Linc
oln
Cre
ek
93/0
3/22
93/0
3/24
93/0
3/31
93/0
4/02
93/0
4/19
93/0
4/29
93/0
5/22
93/0
5/30
93/0
6/04
93/0
6/07
93/0
6/08
93/0
6/14
93/0
6/17
93/0
6/19
93/0
6/30
93/0
7/03
93/0
7/05
93/0
7/08
93/0
7/13
93/0
7/25
93/0
8/09
93/0
8/15
93/0
8/30
93/0
9/13
93/0
9/20
93/1
1/12
93/1
1/14
93/1
1/25
93/1
2/01
2235
1030
0800
0844
1220
0300
2200
0800
1910
1215
0215
0150
1950
1755
0250
2035
2125
1440
1900
0110
1140
0825
1600
0900
0900
2020
1945
1505
2100
93/0
3/24
93/0
3/26
93/0
4/02
93/0
4/05
93/0
4/21
93/0
4/29
93/0
5/24
93/0
5/31
93/0
6/05
93/0
6/08
93/0
6/08
93/0
6/14
93/0
6/18
93/0
6/20
93/0
6/30
93/0
7/04
93/0
7/06
93/0
7/09
93/0
7/14
93/0
7/25
93/0
8/09
93/0
8/16
93/0
8/31
93/0
9/15
93/0
9/21
93/1
1/13
93/1
1/15
93/1
1/26
93/1
2/02
0800
1800
0700
0730
0400
1645
0845
0745
1500
0215
0615
1930
1245
1040
1745
0330
1145
2400
1030
1245
2000
0400
0215
0655
1045
0800
0445
1745
0630
s/m
s/m
s/m
s/m 1.
94 .55
.35
.53
.26
1.98 .32
.69
.73
.05
.38
.52
.55
1.06 .51
.41
.23
.58
1.88
1.79 .7
2
.40
.22
.66
.16
14.0 4.5
15.0 6.5
36.0 3.7
3.1
3.4
1.6
19.0 3.2
5.2
5.6
7.9
2.0
4.1
3.9
8.5
3.5
2.7
1.1
3.4
17.0
13.0 5.6
2.0
1.1 4.0
1.5
120 1.
7
71 3.6
400 12 21 12 1.
712 11 24 38 40 4.
4
54 18 25 9 20 2.5
22 8.5
58 28 12.0 3.0
7.4
2.5
350 25 200 20 880 56 57 44 12 190 .0
18
72 100
130 22 110 51 96 41 57 16 86 64 180 81 91 24 44 18
0.62
<.05
6.5
8
.12
1.8 .1
2
.078
<.04
2
.04
.35
.03
.13
.21
.15
.025
.20
.12
.16
-
.12
.021
.13
<.21 .2
1.1
4
0.06
3
.021
<.04
9
.055
22 2.2
20 3.2
47 4 3.7
3.3 .9
16 1.3
4.6
7.3
6.9
1.2
7.9
3.6
5.9
2.8
4.5 1.1
5.6
11 12 5.6 3.4
1.1 3.0
1.7
42
1.1
29 2.8
180 6.
1
4.7
4.2 .9 9.3 1.9
5.9
15 14 1.5
18 6.8
9.1
3.7
7.2
1.3
8.4
4.3
20 8.8
4.3 1.0
2.5
2.0
140 13 120 18 360 23 17 17 4.
3
52 6.6
28 45 46 7.8
61 23 41 18 25 5.9
32 30 84 35 19 6.1
16 10

App
endi
x 2.
Sto
rm-lo
ad[y
r, ye
ar; m
o, m
onth
; d, d
ay; h
data
for
urba
n w
ater
shed
-man
agem
ent e
valu
atio
n m
onito
ring
site
s, W
isco
nsin
, w
ater
yea
rs1
1991-9
4 C
ontin
ued
hour
; in.
, inc
hes;
Mft
3, m
illio
n cu
bic
feet
; Ib,
pou
nds;
s/m
, sno
wm
elt;
--, n
o da
ta; t
ext i
n bo
ld in
dica
tes
stor
m c
over
age
less
than
80
perc
ent]
Star
t of
stor
m
Dat
e (y
r/m
o/d)
Tim
e (2
4 h)
End
of
stor
m
Dat
e (y
r/m
o/d)
Tim
e (2
4 h)
Prec
ipita
tion
(in.)
Stre
amfl
ow
volu
me
(Mft3
)
Sus
pend
ed
soli
ds
(ton
s)
Pho
spho
rus
(Ib)
Loa
dsT
otal
ca
dmiu
m
(Ib)
Tot
al
copp
er
(Ib)
Tota
l le
ad
(Ib)
Tot
al
zinc
(I
b)
Lin
coln
Cre
ek C
ontin
ued
94/0
3/20
94/0
4/30
94/0
5/11
94/0
6/20
94/0
6/23
94/0
6/25
94/0
6/28
94/0
7/07
94/0
7/14
94/0
7/20
94/0
8/01
94/0
8/03
94/0
8/10
94/0
8/12
94/0
8/19
94/0
8/30
94/0
9/26
94/1
1/05
94/1
1/27
95/0
1/13
1800
1415
0445
0130
1215
2300
0500
1630
0345
0220
0230
1530
1100
2345
1345
1215
1400
1555
0920
2120
94/0
3/21
94/0
5/01
94/0
5/11
94/0
6/20
94/0
6/24
94/0
6/26
94/0
6/28
94/0
7/08
94/0
7/14
94/0
7/20
94/0
8/01
94/0
8/04
94/0
8/11
94/0
8/13
94/0
8/19
94/0
8/30
94/0
9/27
94/1
1/06
94/1
1/28
95/0
1/14
0930
1900
1030
0745
1700
1430
0945
0545
1930
0930
0940
0930
0500
1715
2345
2100
0100
1500
0210
2230
.52
.13
.48
.38
1.40 .46
.12
1.13 .63
.41
.30
1.28 .39
.77
.45
.47
.63
1.07 .84
.70
4.5
2.4
2.8
2.8
8.8
3.0 .6
4
10.0 4.1
2.1
1.9
9.5
1.4
5.8
2.5
2.2
3.7
7.7
4.6
6.7
57 5.1
2.1
55 83 24 11 1.8
110 14 8.
8
14 100 1.
1
42 13 13 41 18 30
150 20 19 180
190
110 35 8
220 46 36 47 190 9.
7
120 37 40 190 80 180
.45
.056
.044
.38
.31
.22
.074
.016
.39
.1 .053
.058
.35
<.01
8
.29
.062
.13
.2 .12
.29
18 2.3
1.6
14 14 8.8
2.6 .5
2
12 3.8
2.7
3.0
14 1.2
8.0
2.8
3.4
9.6
5.1
12
34 2.7
1.5
21 19 8.3
3.7 .8
27 5.1
3.5
3.7
27 0.61
13 5.1
4.3
14 6.8
16
99 12 7.7
68 71 40 14 3.5
85 21 23 19 83 3.4
44 17 18 58 31 76
Men
omon
ee R
iver
91/0
6/14
91/0
6/22
>
91/0
7/01
S
91/0
7/07
1
91/0
7/12
gj
91/0
7/18
J
91/0
7/21
91/0
7/29
1500
0300
1600
1615
0730
1720
0520
0500
91/0
6/18
91/0
6/22
91/0
7/03
91/0
7/08
91/0
7/13
91/0
7/18
91/0
7/22
91/0
7/29
1900
2250
0320
0700
1150
2120
1810
1355
1.49
-- --
.56
76 6.3
35
12
33 2.1
26 3.0
240 13 240 74
240 9.
4
100 1.
7
630 62 530
190
630 45 310 14
-- -- -- -- ~
-- - -- -- ~
- -- -- --
-- -- -- --

M
App
endi
x 2.
Sto
rm-lo
ad d
ata
for
urba
n w
ater
shed
-man
agem
ent e
valu
atio
n m
onito
ring
site
s, W
isco
nsin
, w
ater
yea
rs1
1991-9
4 C
ontin
ued
EVALUATION
OF
N O Z o O Z H 00 O C 33
O m 0 O 2 s Z 3 O "^ CO o o GO z (0 m 0 m
o o o g 33 m 33 m CO CO Ul
[yr,
year
; mo,
moi
nth;
d, d
ay; h
, 1
Sta
rt o
f st
orm
Dat
e (y
r/m
o/d)
Tim
e (2
4 h)
lour
; in.
, inc
hes;
M:r
r, m
illio
n cu
lbic
fee
t; Ib
, pou
nds;
: s/m
, sno
wm
elt;
--, n
c> da
ta; t
ext i
n bo
ld in
dica
tes
stor
m c
ove
End
of
stor
m
Dat
e (y
r/m
o/d)
Tim
e (2
4 h)
Prec
ipita
tion
(in.)
Stre
amfl
ow
volu
me
(Mft3
)
Susp
ende
d so
lids
(ton
s)
Phos
phor
us
(Ib)
rage
less
than
80
perc
ent]
Loa
dsTo
tal
cadm
ium
(I
b)
Tota
l co
pper
(I
b)
Tota
l le
ad
(Ib)
Tota
l zi
nc
(Ib)
Men
omon
ee R
iver
C
ontin
ued
91/0
8/08
91/0
9/09
91/0
9/11
91/0
9/14
91/1
0/04
91/1
0/13
91/1
0/28
92/0
3/16
92/0
3/23
92/0
4/15
92/0
5/11
92/0
6/14
92/0
6/17
92/0
7/08
92/0
7/12
92/0
8/12
92/0
8/25
92/0
9/09
92/0
9/14
92/0
9/16
92/1
1/01
92/1
1/19
92/1
2/15
93/0
3/01
93/0
3/05
93/0
3/16
93/0
3/22
93/0
3/25
93/0
3/27
0550
1830
2325
0100
0100
2130
1615
1800
1130
0720
2115
0200
1030
0900
1130
0800
2200
0700
1320
1355
0600
1745
0700
1100
1225
0300
1000
0905
1550
91/0
8/10
91/0
9/10
91/0
9/13
91/0
9/17
91/1
0/09
91/1
0/15
91/1
1/05
92/0
3/20
92/0
4/01
92/0
4/23
92/0
5/14
92/0
6/14
92/0
6/19
92/0
7/10
92/0
7/16
92/0
8/13
92/0
8/29
92/0
9/11
92/0
9/16
92/0
9/20
92/1
1/05
92/1
1/25
92/1
2/17
93/0
3/04
93/0
3/07
93/0
3/17
93/0
3/25
93/0
3/27
93/0
3/29
2115
0535
1215
0020
0545
0700
1730
0330
2200
0800
0730
2100
0100
1400
0900
2100
1900
1100
1355
1500
2100
1520
0330
1225
1400
0500
0700
1550
1240
1.61
-- 1.29 .5
6
2.60
..
.62
s/m
s/m
s/m -.
.74
_ 2.10 .8
9
.71
.88
.56
... 2.59
1.05 .93
s/m
s/m
s/m
s/m
s/m
s/m
63 9.8
37 48 110 8.
0
160 65 170
190 20 4.
6
28 21 84 13 46 27 23 76 150
160 78 33 34 25 150
100 82
210 57 130
110
290 1.
7
210 66 32 400 16 12
270
140
440 38 150
140
140
210
440
170
170 33 46 44 640 66 51
560
210
390
330
1,40
0 20
1,40
0
310
320
1,20
0
100 80 810
540
1,30
0
130
680
570
470
610
2,30
0
1,00
0
720
210
310
250
2,20
0
880
510
--
.45
.43
1.2
<.05
7
<2.1 <.88
<3.7 3 <.18
<.04
7
1.6 .9
1
<2.2
- - --
.. -- .. -- -- -- -
-- 24 19 81 7.1
74 31 <58
<40 9.
1
3.1
43 29 71 11 39 33 22 33 110 60 50 24 17 22 130 44 21
-- 47 27 92 2.5
84 35 43
<120 9.
1
2.8
86 44 110 11 51 62 52 61 100
<60 62 17 13 19 170
<19 15
«
140
110
450 8.
8
360
140
450
<470 30 12 25
0
160
410 46 190
180
150
200
480
300
250 98 73 97 740
150
110

App
endi
x 2.
Sto
rm-lo
ad[y
r, ye
ar; m
o, m
onth
; d, d
ay; h
,data
for
urba
n w
ater
shed
hour
; in.
, inc
hes;
Mft
3, m
illio
n
-man
agem
ent
eval
uatio
n m
onito
ring
site
s, W
isco
nsin
, w
ater
yea
rs1
1991-9
4 C
ontin
ued
cubi
c fe
et; I
b, p
ound
s; s
/m,
snow
mel
t; --
, no
data
; tex
t in
bold
indi
cate
s st
orm
cov
erag
e le
ss th
an 8
0 pe
rcen
t]
Sta
rt o
f st
orm
Dat
e (y
r/m
o/d)
Tim
e (2
4 h)
End
of
stor
m
Dat
e (y
r/m
o/d)
Tim
e (2
4 h)
Prec
ipita
tion
(in.)
Stre
amfl
ow
volu
me
(Mft3
)
Sus
pend
ed
soli
ds
(ton
s)
Pho
spho
rus
(Ib)
Loa
dsT
otal
ca
dmiu
m
(Ib)
Tot
al
copp
er
(Ib)
Tot
al
lead
(I
b)
Tot
al
zinc
(I
b)
Men
omon
ee R
iver
C
ontin
ued
93/0
3/29
93/0
3/30
93/0
4/14
93/0
4/19
93/0
4/29
93/0
5/22
93/0
5/30
93/0
6/04
93/0
6/07
93/0
6/19
93/0
6/30
93/0
7/05
93/0
7/08
93/0
8/30
93/0
9/13
93/1
1/12
1240
0830
1500
1300
0345
2150
0945
1900
1200
1805
0250
2115
1500
0300
1000
2020
93/0
3/31
93/0
4/01
93/0
4/19
93/0
4/24
93/0
5/01
93/0
5/24
93/0
6/01
93/0
6/07
93/0
6/12
93/0
6/22
93/0
7/01
93/0
7/07
93/0
7/13
93/0
9/03
93/0
9/18
93/1
1/14
0650
0330
0000
0300
0700
1600
1900
1145
1700
0200
0700
1245
1930
0900
0525
0200
s/m
s/m
s/m 4.
13 .58
.26
.44
.62
1.87
1.82 .51
.41
2.36
1.86
1.28 .4
4
73 120
400
590 54 22 32 25 310
120 15 36 240
120 93 12
46 400
980
2,40
0 48 35 54 26
1,20
0
420 36 130
1,00
0
200
250 34
410
1,50
0
3,30
0
7,00
0
310
170
260
180
6,20
0
1,50
0
170
430
4,00
0
830
770
250
-- -- -- -- -- -- -- -- - - - - -- <1.3 1.2 .2
4
18 90
<170 32
0 23 10 17 9
<180 67 9.
4
24 160 42 49 9.
0
<14
110
260
620 23 12 17 12
<310 94 11 41 25
0 69 71 9.8
100
430
810
1,60
0 93 32 70 39 960
380 48 140
980
260
1,00
0 53
Mon
roe
Stre
et d
eten
tion
pond
92/0
3/16
92/0
3/22
92/0
3/28
92/0
4/08
92/0
4/15
92/0
5/11
>
92/0
6/17
3
92/0
7/02
1
92/0
7/02
%
92/0
7/08
J
92/1
2/30
93/0
3/03
1755
1300
2200
2000
0500
1645
1158
0809
1356
0800
0645
1224
92/0
3/17
92/0
3/23
92/0
3/29
92/0
4/09
92/0
4/15
92/0
5/11
92/0
6/17
92/0
7/02
92/0
7/02
92/0
7/08
92/1
2/31
93/0
3/04
0300
1000
1500
0900
0850
1900
1600
1100
1900
1200
0400
0730
.31
s/m
.26
.32
.43
.21
.56
.23
.86
1.11
s/m s/m
.03
.017
.022
.055
.042
.018
.088
.019
.14
.18
.065
.036
.77
.1 .065
2.2
1.8 .6
5
5.1 .1
9
6.7
8.1 .1
5
.16
1.8 .3
1
.41
4.2
3.6
2.9
11 .9
9
11 9.8
1.7 .5
4
.004
1
.001
1
.000
55
.004
8
.005
.001
8
.008
8
.000
93
.009
6
.012
-
.089
.022
.025
.17
.16
<.00
34
.24
.03
.25
.33
--
.2 .04
.038
.38
.42
.15
.77
.08
.96
1.0
--
.7 .15
.15
1.2
1.1 .5
0
2.5 .2
8
2.1
2.6 .4
1
.27

App
endi
x 2.
Sto
rm-lo
ad d
ata
for
urba
n w
ater
shed
-man
agem
ent e
valu
atio
n m
onito
ring
site
s, W
isco
nsin
, w
ater
yea
rs1
1991-9
4 C
ontin
ued
+3
EVALUATION
OF
N ONPOINT-SOURCE
C O Z S Z o "Sg CO I CO Z CO m r- m m
O o O
CO 2 3D m 3D m 3D s U1
[yr,
year
; mo,
moi
ith; d
, day
; h, 1
Sta
rt o
f sto
rm
Dat
e (y
r/m
o/d)
Tim
e (2
4 h)
lour
; in.
, inc
hes;
Mlit
, m
illio
n cu
bn; r
eet;
Ib, p
ound
s; s
/m, s
now
mel
t; -,
no
daita
; tex
t in
bold
mol
icat
es s
torm
cov
i
End
of s
torm
Dat
e (y
r/m
o/d)
Tim
e (2
4 h)
Prec
ipita
tion
(in.)
Stre
amflo
w
Susp
ende
d vo
lum
e so
lids
(Mft3
) (to
ns)
Pho
spho
rus
(Ib)
erag
e le
ss th
an 8
0
Loa
dsT
otal
ca
dmiu
m
(Ib)
perc
ent]
Tot
al
copp
er
(Ib)
Tot
al
lead
(I
b)
Tot
al
zinc
(I
b)
Mon
roe
Stre
et d
eten
tion
pond
C
ontin
ued
93/0
3/05
93/0
3/06
93/0
3/07
93/0
3/08
93/0
3/22
93/0
4/14
93/0
4/14
93/0
5/01
93/0
5/22
93/0
5/23
93/0
5/30
93/0
6/02
93/0
6/07
93/0
6/24
93/0
6/30
93/0
7/05
93/0
7/09
93/0
7/25
93/0
8/15
93/0
9/13
93/1
0/20
93/1
1/12
94/0
3/20
94/0
4/12
94/0
4/25
94/0
4/30
94/0
5/07
94/0
5/14
94/0
5/23
1327
1100
1304
1333
2339
1034
2310
2112
1922
1344
0408
1226
1058
1949
0022
0524
0113
0249
0527
0920
1845
1934
2356
0918
0600
1049
0520
1403
1823
93/0
3/05
93/0
3/07
93/0
3/08
93/0
3/08
93/0
3/24
93/0
4/14
93/0
4/16
93/0
5/02
93/0
5/23
93/0
5/24
93/0
5/30
93/0
6/03
93/0
6/08
93/0
6/25
93/0
6/30
93/0
7/05
93/0
7/09
93/0
7/25
93/0
8/15
93/0
9/14
93/1
0/20
93/1
1/12
94/0
3/21
94/0
4/12
94/0
4/26
94/0
4/30
94/0
5/07
94/0
5/15
94/0
5/23
2330
0430
0300
2200
0030
2115
2130
1300
0015
1245
1700
1200
0000
1000
0400
2345
0900
0930
1415
1100
2130
2200
0630
1445
0730
2315
1100
0445
2200
s/m
s/m
s/m
s/m
s/m
s/m 2.
33 .62
.20
.35
.90
.46
2.63 .8
7
.63
3.61
1.71
1.59
2.15
2.84 .1
8-- _ --
s/m
.24
.24
.27
.016
.041
.038
.021
.22
.011
.41
.061
.014
.048
.097
.037
.38
.1 .073
.065
.3 .26
.31
.30
.008
4
.034
.036
.074
.054
.063
.032
.029
.042
.038
.14
.076
.024
.9
.044
3.4 .2
7
.082
.44
.51
.065
9.0
1.5 .4
5
13. 6.4
4.2
2.4
3.3 .0
2
.12
.61
1.1 .9
3
.09
.11
.24
.61
.61
2.1
2.6
1.4
3.9 .2
2
7.1
1.8 .6
3
1.5
2.9 .7
6
19 4.2
1.7
23 9.3
8.5
8.2
7.3
2.0
4.5
2.0
4.1
5.1 .9
4
.79
1.6
5.3
~
.013
_. -- -- -- -- _ - -
.006
6
.005
8
.006
5
.000
21
.001
1
.003
8
.005
5
.004
<.00
078
.000
59
.000
9
.002
1
~
.26
.. -- -- -- -- _ --
.16
.077
.24
.009
4
.034
.088
.17
.12
.031
.024
.034
.075
--
.77
-- -- -- -- _
.69
.46
.53
.007
3
.047
.22
.31
.24
.051
.039
.058
.10
.069
.20
.16
.097
1.8 .0
75
2.2 .3
5
.11
.36
.66
.18
4.0 .7
5
.50
5.7
2.8
1.8
1.4
2.1 .0
68
.30
.68
1.2 .78
.20
.16
.27
.65

App
endi
x 2.
Sto
rm-lo
ad[y
r, ye
ar; m
o, m
onth
; d, d
ay; h
data
for
urba
n w
ater
shed
-man
agem
ent e
valu
atio
n m
onito
ring
site
s, W
isco
nsin
, w
ater
yea
rs1
1991-9
4 C
ontin
ued
, hou
r; in
., in
ches
; Mft
3, m
illio
n cu
bic
feet
; Ib,
pou
nds;
s/m
, sn
owm
elt;
--, n
o da
ta; t
ext i
n bo
ld in
dica
tes
stor
m c
over
age
less
than
80
perc
ent]
Star
t of
stor
m
Dat
e (y
r/m
o/d)
Tim
e (2
4 h)
End
of
stor
m
Dat
e (y
r/m
o/d)
Tim
e (2
4 h)
Prec
ipita
tion
(in.)
Stre
amfl
ow
Sus
pend
ed
volu
me
soli
ds
(Mft3
) (t
ons)
Pho
spho
rus
(Ib)
Loa
dsT
otal
ca
dmiu
m
(Ib)
Tota
l co
pper
(I
b)
Tot
al
lead
(I
b)
Tota
l zi
nc
(Ib)
Mon
roe
Stre
et d
eten
tion
pond
C
ontin
ued
94/0
6/11
94/0
6/13
94/0
6/18
94/0
6/23
94/0
7/03
94/0
7/07
94/0
7/17
94/0
7/20
94/0
8/03
94/0
8/18
94/0
9/14
94/1
1/05
94/1
1/13
94/1
1/20
94/1
2/05
1514
0131
1737
0825
2323
1434
0446
0047
1338
0515
0522
1621
1809
2211
0135
94/0
6/11
94/0
6/13
94/0
6/19
94/0
6/24
94/0
7/04
94/0
7/08
94/0
7/17
94/0
7/20
94/0
8/03
94/0
8/18
94/0
9/14
94/1
1/06
94/1
1/14
94/1
1/21
94/1
2/05
1630
0545
0300
0600
2330
0730
0800
0900
2345
1315
1330
1145
0800
1545
1445
.21
.28
.67
1.69 .75
.48
.18
.46
1.46 .55
.44
.60
.22
.47
.07
.044
.038
.14
.30
.13
.085
.04
.072
.21
.11
.11
.11
.032
.062
.005
2.5 .1
3
2.5
2.5
2.3
2.8
1.2 .3
8
3.9
2.6 .9
7
.81
.25
.40
.012
6.0
1.1
6.8
7.3
7.3
5.3
1.7
2.0
13.0 6.7
3.5
13.0 2.2
2.0 .1
2
<.00
054
.000
72
.005
3
.007
5
.007
5
.004
8
.002
.001
8
.012
.004
9
.002
8
.002
9
.000
9
.001
.000
066
.014
.029
.17
.19
.18
.11
.06
.05
.29
.13
.083
.10
.036
.043
.005
4
.014
.031
.38
.43
.66
.46
.12
.11
.91
.46
.19
.31
.058
.066
.005
1.2 .16
1.5
1.7
1.5
1.1 .4
5
1.3
2.8
1.2 .9 .9
4
.30
.35
.022
Nin
e Sp
ring
s st
orm
sew
er
90/1
1/21
90/1
1/27
90/1
1/27
90/1
2/12
91/0
2/04
91/0
3/01
91/0
3/17
>
91/0
3/22
J5
91/0
3/26
1
91/0
3/26
SJ
91/0
4/08
£
91/0
4/12
91/0
4/13
0225
0515
1531
1209
1334
0939
1406
1837
0309
2320
1326
0933
1840
90/1
1/21
90/1
1/27
90/1
1/27
90/1
2/12
91/0
2/04
91/0
3/02
91/0
3/18
91/0
3/23
91/0
3/26
91/0
3/27
91/0
4/09
91/0
4/13
91/0
4/14
0417
0710
1755
1512
1622
0918
0334
0330
0738
1539
2344
0019
1249
.24
.28
.14
s/m
s/m 1.
56 .35
.52
.14
.94
1.22
1.27 .8
9
.003
2
.012
.002
7
.000
28
.001
3
.12
.045
.12
.016
.19
.21
.36
.2
.011
.21
.014
.001
1
.01
.57
.095
3.3 .0
43
2.0 .5
1
1.1 .3
1
.054
.45
.06
.005
9
.047
3.5 .7 7.5 .1
9
5.2
2.3
4.3 .0
87
-- -- -- -- - -- -- -- -
-- -- -- - - -- -- - -- ~
-- -- -- - -- -- -- -- --
-- -- -- -- -- -- -- -- --

o>
App
endi
x 2.
Sto
rm-lo
adm
[y
r, ye
ar; m
o, m
onth
; d, d
ay; h
data
for
urba
n w
ater
shed
-man
agem
ent e
valu
atio
n m
onito
ring
site
s, W
isco
nsin
, w
ater
yea
rs1
1991-9
4 C
ontin
ued
, hou
r, in
., in
ches
; Mft
3, m
illio
n cu
bic
feet
; Ib,
pou
nds;
s/m
, sno
wm
elt;
--, n
o da
ta; t
ext i
n bo
ld in
dica
tes
stor
m c
over
age
less
than
80
perc
ent]
^
Star
t of s
torm
c
H
Dat
e g
(y
r/mo/
d)
0
Tl g
<^ 1/0
5/05
0
91/0
5/17
5 H
91/0
5/18
g
91/0
5/21
o
91/0
5/25
m o
91/0
6/10
5
91/0
6/12
S
91/0
6/13
>
91/0
7/01
g
91/0
7/21
~g
91/0
8/07
o
91/0
8/16
g
91/0
9/03
i?
91/0
9/09
P
91/0
9/11
o
91/0
9/14
S
91/0
9/15
0
91/0
9/17
<j>
91/0
9/24
0
91/1
0/03
3
91/1
0/04
H
91/1
0/13
m 5
91/1
0/26
>
91/1
0/28
3) £
91/1
0/31
(D 01
91/1
1/14
91/1
1/17
91/1
2/12
92/0
1/08
Tim
e (2
4 h)
End
of s
torm
Dat
e (y
r/mo/
d)Ti
me
(24
h)
_ .
.. ..
Stre
amfl
ow
Prec
ipita
tion
. ..
. vo
lum
e(m
>)
(Mft3
)
Susp
ende
d so
lids
(ton
s)
Phos
phor
us
(Ib)
Loa
dsTo
tal
cadm
ium
(Ib
)
Tota
l co
pper
(Ib
)
Tota
l le
ad
(Ib)
Tota
l zi
nc
(Ib)
Nin
e Sp
rings
sto
rm s
ewer
C
ontin
ued
0717
1908
1051
1608
1529
1541
0253
2257
1702
0503
0621
2233
0947
2303
1853
0551
2340
2017
1214
2241
0923
1935
0902
1549
1335
1252
1653
0235
2131
91/0
5/05
91/0
5/17
91/0
5/18
91/0
5/21
91/0
5/25
91/0
6/10
91/0
6/12
91/0
6/14
91/0
7/01
91/0
7/21
91/0
8/07
91/0
8/17
91/0
9/03
91/0
9/10
91/0
9/12
91/0
9/15
91/0
9/16
91/0
9/18
91/0
9/24
91/1
0/04
91/1
0/05
91/1
0/13
91/1
0/26
91/1
0/29
91/1
1/01
91/1
1/15
91/1
1/18
91/1
2/12
92/0
1/09
1454
2011
1533
1739
1614
1822
0549
0159
1821
1259
0744
0056
1125
0041
0807
0921
0314
0424
1557
0044
1016
2202
1535
1449
1532
0648
0515
1719
0224
.73
.71
.15
..
.34
.40
.28
.17
2.16
--
.15
.10
.45
1.05
1.69 .25
.46
.15
.14
.92
.16
.52
.53
1.04 .66
.63
.58
.20
.098
.004
2.1
3
.026
.002
4.0
44
.059
.039
.018
.86
.010
.017
.013
.025
.25
.35
.037
.077
.014
.013
.19
.014
.10
.11
.27
.11
.11 .10
.034
.15
.016
.48
.25
.005
9.3
9
.29
.16
.19
8.6 .1
2
.059
.11
.033
.30
1.4 .0
23
.055
.051
.081
.47
.022
.088
.16
.50
.27
.15
.42
.23
.92
.2 1.9 .6
9
.043
1.5
1.0 .64
.53
18.0 .4
5.3
9
.53
.43
3.0
1.1 .2
1.4
8
.28
.36
3.0 .4 .7
8.9
5
.56
1.6 .9
3
2.0 .8
2
--
.000
32
.003
3
.002
.000
18.0
031
.003
.001
5.0
021
.048
.. --
.002
9-.0
022
.011
-.000
46.0
014
.001
.000
39.0
059
.000
17
.002
.003
4
.004
8
.007
.003
6
.007
.003
2
--
.014
.15
.043
.004
6.0
94
.063
.037
.062
1.2
.. --
.034
.045
.14
.012
.024
.02
.014
.21
.016
.25
.068
.13
.21
.086
.22
.084
--
.005
8.1
2
.053
.002
8.1
0
.082
.047
.053
1.9
-- .. --
.019
.078
.21
.009
3.0
24.0
21
.011
.18
.009
5
.072
.075
.19
.19
.16
.28
.13
-
.12
.91
.58
.04
1.1 .59
.47
.49
14 -
.48
.60
1.3 .1
1.4
5.2
3
.16
1.4 .12
<.06
5.8
2
1.4
1.3 .7
9
1.3 .6
1

App
endi
x 2.
Sto
rm-lo
ad[y
r, ye
ar; m
o, m
onth
; d, d
ay; h
data
for
urba
n w
ater
shed
-man
agem
ent e
valu
atio
n m
onito
ring
site
s, W
isco
nsin
, w
ater
yea
rs1
19
91
-94
Co
ntin
ue
d, h
our;
in.,
inch
es; M
ft3,
mill
ion
cubi
c fe
et; I
b, p
ound
s; s
/m, s
now
mel
t; -,
no
data
; tex
t in
bold
indi
cate
s st
orm
cov
erag
e le
ss th
an 8
0 pe
rcen
t]
Star
t of
stor
m
Dat
e (y
r/m
o/d)
Tim
e (2
4 h)
End
of
stor
m
Dat
e (y
r/m
o/d)
Tim
e (2
4 h)
_ .
.4 ..
Stre
amfl
ow
Prec
ipita
tion
. ,~
.
volu
me
(in<)
(M
ft3)
Sus
pend
ed
soli
ds
(ton
s)
Pho
spho
rus
(Ib)
Loa
dsTo
tal
cadm
ium
(I
b)
Tota
l co
pper
(I
b)
Tota
l le
ad
(Ib)
Tot
al
zinc
(I
b)
Nin
e Sp
ring
s st
orm
sew
er C
ontin
ued
92/0
3/09
92/0
3/28
92/0
4/08
92/0
4/15
92/0
4/15
92/0
4/16
92/0
4/18
92/0
4/23
92/0
5/11
92/0
6/17
92/0
6/24
92/0
7/02
92/0
7/08
92/0
7/13
92/0
7/16
92/0
8/29
92/0
9/06
92/0
9/09
92/0
9/16
92/0
9/17
92/0
9/18
92/1
0/15
92/1
1/01
>
92/1
1/12
S
92/1
1/19
1
92/1
1/22
SJ
92/1
2/15
£
92/1
2/29
92/1
2/30
0147
2217
1945
0456
2046
0621
2317
1216
1644
1200
0644
0810
0758
0709
0221
0400
0213
0531
1221
0419
0332
1756
2225
0600
1515
1412
0259
0126
0454
92/0
3/09
92/0
3/29
92/0
4/09
92/0
4/15
92/0
4/15
92/0
4/16
92/0
4/19
92/0
4/23
92/0
5/11
92/0
6/17
92/0
6/24
92/0
7/02
92/0
7/08
92/0
7/14
92/0
7/16
92/0
8/29
92/0
9/06
92/0
9/09
92/0
9/16
92/0
9/17
92/0
9/18
92/1
0/16
92/1
1/02
92/1
1/12
92/1
1/21
92/1
1/22
92/1
2/16
92/1
2/29
92/1
2/30
1533
0456
0208
0737
2233
1139
0525
1730
1815
1409
0758
1722
1210
0001
0449
0939
0838
0955
1717
0937
0817
0130
0513
1401
0711
2315
0319
0914
1233
.26
.28
.31
.40
.13
.23
.60
.24
.16
.36
-- --
.97
1.26 .16
.98
.64
.48
.94
.62
.44
.47
.16
.20
2.45 .5
3
1.28 .3
6
.22
.046
.023
.032
.046
.02
.038
.11
.031
.017
.043
.009
7
.084
.19
.28
.017
.20
.10
.076
.22
.17
.084
.084
.034
.027
.51
.12
.25
.06
.033
.62
.049
.079
.46
.25
.11
1.4 .11
.22
.70
.11
.39
2.2 .5
7
.016
.49
.17
.20
.37
.63
.19
.16
.019
.13
1.6 .1
7
.97
.09
.074
1.5 .2
3
.34
1.1 .5
7
.50
3.2 .4
3
.88
1.7 .3 1.4
4.4
2.5 .1
8
2.2
1.1 .8
6
6.6
3.0
1.2
1.0 .21
.56
6.9
1.0
3.9 .7
8
.74
.008
.000
87
.001
.004
6
.002
7
.001
7
.009
5
.001
6
.003
2
.004
5
.000
85
.004
7
.012
.005
2
.000
22-- -- -- -- -- - -- -- --
.15
.02
.036
.12
.044
.036
.20
.039
.076
.13
.028
.11
.36
.17
-015
.099
.045
.053
.18
.22
.063
.042
.015
.04
.34
.062
.50
.075
.045
.23
.032
.044
.17
.086
.05
.41
.047
.07
.21
.04
.13
.51
.21
.014
.16
.07
.067
.33
.21
.063
.057
.008
4
.06
.49
.07
.48
.06
.045
1.2 .2
0
.32
1.1 .5
2
.41
2.0 .3
7
.84
1.1 .2
6
1.3
2.4
1.4 .12
1.2 .77
.67
1.7
1.0 .49
.63
.18
.53
5.0 .6
7
3.1 .6
7
.35

«A
ppen
dix
2. S
torm
-load
[yr,
year
; mo,
mon
th;
d, d
ay;
h.
data
for
urba
n w
ater
shed
-man
agem
ent e
valu
atio
n m
onito
ring
site
s, W
isco
nsin
, w
ater
yea
rs1
19
91
-94
Co
ntin
ue
dho
ur; i
n., i
nche
s; M
ft3,
mill
ion
cubi
c fe
et; I
b, p
ound
s; s
/m, s
now
mel
t; --
, no
data
; tex
t in
bold
indi
cate
s st
orm
cov
erag
e le
ss th
an 8
0 pe
rcen
t]
r- c d o z o n z o z U 0 z H CO 0 C 3D
O m 0 O I s z d 0 ^ CO o o CO z CO m r- m m O u 0
CO TJ o 3D 1 Fl 3D m 3D <o <o UI
Star
t of s
torm
Dat
e (y
r/mo/
d)Ti
me
(24
h)
End
of s
torm
Dat
e (y
r/mo/
d)Ti
me
(24
h)
_ .
... ..
Stre
amfl
ow
Prec
ipita
tion
. £
vo
lum
e(in
') (M
ft3)
Susp
ende
d so
lids
(ton
s)
Phos
phor
us
(Ib)
Loa
dsTo
tal
Tota
l ca
dmiu
m
copp
er
(Ib)
(Ib)
Tota
l le
ad
(Ib)
Tota
l zi
nc
(Ib)
Nin
e Sp
rings
sto
rm s
ewer
C
ontin
ued
93/0
1/23
93/0
3/02
93/0
3/03
93/0
3/05
93/0
3/06
93/0
3/07
93/0
3/08
93/0
3/16
93/0
3/22
93/0
3/22
93/0
3/31
93/0
4/19
93/0
5/01
93/0
5/30
93/0
6/02
93/0
6/07
93/0
6/24
93/0
6/29
93/1
0/20
1122
0805
1105
1219
1126
1157
1122
0034
0948
2254
0237
1035
1913
0315
1049
1007
1908
2352
1744
93/0
1/23
93/0
3/02
93/0
3/03
93/0
3/05
93/0
3/06
93/0
3/07
93/0
3/08
93/0
3/16
93/0
3/22
93/0
3/25
93/0
3/31
93/0
4/20
93/0
5/02
93/0
5/30
93/0
6/03
93/0
6/07
93/0
6/25
93/0
6/30
93/1
0/21
2313
2004
2358
1948
2001
2215
1843
1900
1628
0313
2236
1558
0716
2243
2051
2111
0458
0723
0046
s/m
s/m
s/m s/m
s/m
s/m
s/m
s/m
s/m
s/m 1.
55
1.50 .75
.96
.40
1.71 .8
9.6
5
.17
1 Wat
er y
ear
is th
e 12
-mon
th p
erio
d, O
ctob
er 1
thr
ough
Sep
tem
ber
30.
Sept
embe
r 30
,
.031
.018
.036
"
.018
.03
.026
.016
.065
.016
.30
.38
.33
.13
.17
.079
.55
.14
.12
.02
.04
.086
.12
.039
.047
.02
.024
.23
.14
1.1 2.9 1.1 .4
8.2
5.1
6
5.0 .4
5.2
4
.033
.40
.53
.88
.52
.89
.90
.49
1.5 .5 5.1
8.0
3.5
2.3
1.6 .7
9
20 1.5
1.1 .66
The
wat
er y
ear i
s de
sign
ated
by
the
cale
ndar
yea
r in
whi
ch it
end
s.
.054
.054
.07
.022
.028
.023
.013
.11 .059
.43
.76
.25
.13
.11 .064
.66
.09
.061
.02
Thu
s, th
e ye
ar s
tart
ing
Oct
ober
1,
.025
.049
.05
.014
.013
.006
6.0
081
.089
.075
.64
.90
.38
.18
.095
.074
.97
.081
.038
.011
1992
, and
end
ing
.29
.35
.41
.14
.15
.11
.078
.65
.38
3.7
5.7
2.5
1.3
1.2 .8
4
5.5 .8
9
.76
.27
1993
, is
calle
d "w
ater
yea
r 19
93."
Appendix 2.1 Uncertainty in Urban Storm-Load Data
For each storm load listed in appendix 2, there is an associated uncertainty. Errors in measurement of dis charge, sampling technique, sample processing and sample analysis all contribute to uncertainty in the final load. The following discussion addresses these errors and describes how their probable magnitude was used to estimate error in the final load.
The load is calculated as the product of event mean concentration and stormflow volume, so error in any particular load will include error from stormflow volume and error from event mean concentration. These errors are defined as follows:
and
= 5 St
where r\c is the error term for concentration, C is the estimated concentration, Ct is the true concentration, TJS is the error term for stormflow volume, S is the estimated stormflow volume, and St is the true stormflow volume. It follows that the error of the load is defined as
CS
For the purpose of this study, and because r|c and % have a lower limit of zero, r|c and TI^ are assumed to be distributed lognormally, hence, r\i would also be lognormal. In general, the errors presented above have two components: a systematic component, termed bias, and a random component, termed precision. There was insuf ficient data collected to determine the bias of r^; hence the errors were assumed to be unbiased. The precision was estimated as the variance of r|L, which is determined by adding the variances of r|c and % in log space.
The variance of % must be estimated separately for each site. The 95-percent confidence interval has been estimated by USGS personnel for error in discharge records (Holmstrom and others, 1993-95), and therefore for stormflow volume. For the lognormal distribution, the log-space standard deviation of the error in stormflow vol ume can be estimated by solving the following for (3^:
795 = exp (1.96(3^)-exp (-1.96(3^)
where (3^ is the log-space standard deviation of r|s , and I95 is the 95-percent confidence interval for the storm- flow error.
The variance of r|c must be estimated separately for each analyte. In determining the variance of r|c , sample- processing duplicates, field blank samples, laboratory blanks, and laboratory duplicates were considered. Data were insufficient to consider how well point samples collected during this study represent actual concentrations from the entire profile of the stream or storm sewer.
The variance of the error in concentration for each pair of sample-processing duplicates (Box and others, 1978) is
2(Cu -C2j.) 2
APPENDIXES 1-2 39
where V[r|p£,J is the variance of the error in the ith pair of duplicates, C^ and C2j are the concentrations of the ith pair of duplicates. The estimate of variance in concentration error from sample processing duplicates, V[r|p£>], is the average of the variance of all pairs of duplicates (Box and others, 1978) or
where n is the number of duplicate pairs.
The variance for the constituents in field blank samples was calculated directly from constituent concentra tions in the field blanks. Variance of laboratory blanks were obtained directly from the Wisconsin State Laboratory of Hygiene (WSLH). The laboratory duplicate tolerance, obtained from the WSLH, was considered to be a 99- percent confidence interval. As with stormflow volume, the log-space standard deviation of the error in laboratory duplicates TJ LD can be estimated by solving the following for
/99 = exp (2.58(3^) - exp (-2.58(3^) ,
where P^LE) ls tne log-space standard deviation of TJLD and 199 is the 99 percent confidence interval for the labora tory duplicate tolerance.
Because sample-processing duplicates include all sample-processing and laboratory procedures, variance in sample-processing duplicates should include variance inherent in field blanks, laboratory duplicates, and labora tory blanks; therefore, variance in sample processing duplicates should be greater than or equal to variance from field blanks, laboratory duplicates, and laboratory blanks. This was true for suspended solids, total phosphorus, cadmium, copper, and lead; however variance in laboratory duplicates was greater than variance from sample pro cessing duplicates for zinc. Consequently, variance in sample-processing duplicates was used to estimate variance in error of concentration for all analytes except zinc, for which variance in laboratory duplicates was used. Final real space standard deviations are shown in table 1 .
Table 1 . Standard deviation of error for constituents used to estimate storm-load data from urban watershed-management evaluation monitoring sites, Wisconsin, water years 1991-95 [standard deviation (s.d.) in percent of true concentration]
Constituent
Suspended solids
Total phosphorus
Total cadmium
s.d.
12
6.8
17
Constituent
Total copper
Total lead
Total zinc
s.d.
7.1
7.8
3.9
The variance of the load of each analyte, V[r|iJ, was determined by transforming V[r|c] and V[t|s] to space and summing the two. V[r|c] and V[TJS] are transformed to log space using the following equation:
r* . 0
where p is the variance in log-space, a is the variance in real space, and |Li is the mean in real space. (U, was cal culated by trial and error assuming the mean in log space to be 0 (unbiased errors) and using the equation:
4(2 2\L = a +\L
40 EVALUATION OF NONPOINT-SOURCE CONTAMINATION, WISCONSIN: SELECTED TOPICS FOR WATER YEAR 1995

The upper and lower limits of the 95-percent confidence interval in log space are 1.96(3 and -1.96(3, expressed as a fraction of the true load. To transform back to real space and determine the 95-percent confidence limits of the estimated loads, the following equations were used:
L+95 = exp( 1.96(3^)-!
and
L_95 = exp (-1.96(3^)-!
where (3^ is the log space standard deviation of r|L, and L+95 and L_95 are the upper and lower limits of the 95- percent confidence intervals of the estimated loads in appendix 2. The values of L_95 and L+95 , expressed as a per centage of the estimated load for each analyte at each urban site, are given in table 2.
Table 2. Ninety-five percent confidence limits for storm-load data from urban watershed-management evaluation monitoring sites, Wisconsin, water years 1991-95[values in percent of estimated load]
Constituent
Suspended solids
Total phosphorus
Total cadmium
Total copper
Total lead
Total zinc
Lincoln Creek
Lower-24
-18
-19
-31
-19
-16
Upper
31
22
23
44
24
19
Menomonee River
Lower-22
-15
-16
-30
-17
-12
Upper
28
18
19
42
20
14
Monroe Street detention pond
Lower-26
-21
-22
-32
-22
-19
Upper
35
27
28
47
28
24
Nine Springs tributary storm sewer
Lower-22
-15
-16
-30
-17
-12
Upper
28
18
19
42
20
14
APPENDIXES 1-2 41


EVALUATION OF NO
NPO
INT-SO
URCE CO
NTA
MIN
ATIO
N, W
ISCON
SIN:
FOR W
ATER YEAR 1995
Open-File R
eport 96-661A